Article

Implementation of a Motor Diagnosis System for Rotor Failure Using Genetic Algorithm and Fuzzy Classification

Department of Electrical Engineering, National Taiwan University of Science and Technology 43, Sec. 4, Keelung Rd., Taipei 106, Taiwan
*
Author to whom correspondence should be addressed.
Appl. Sci. 2017, 7(1), 31; https://doi.org/10.3390/app7010031
Submission received: 26 September 2016 / Revised: 15 December 2016 / Accepted: 21 December 2016 / Published: 27 December 2016

Abstract

:
In this paper, the diagnosis of induction motor rotor failure with fuzzy theory and genetic algorithm is presented. The proposed method can evaluate the status of an operating motor. According to the measurement of electrical data, this research establishes the relationship of rotor failures with spectrum features. Through the learning of genetic algorithm, membership parameters can be adjusted to optimal positions. The simulation that combines fuzzy theory and a genetic algorithm has preferable diagnostic results for the rotor failures. The designed processes will be applied as a reference for building the diagnostic methods of other motor failures.

1. Introduction

In response to the demand for increased production capacity in high-tech industries, machinery and equipment are often required to be in continuous operation, putting more focus on their reliability and stability. However, Thomson et al. [1] points out that equipment aging to a state of complete damage is a continuous process of change, and the losses are hard to predict if the machine fails and stops producing. Motor failures can be divided into electrical failure and mechanical failure; electrical failure consists of stator winding, non-uniform air gap, and broken bar failure, while mechanical failure consists of eccentricity, unbalance, and loss. Moreover, failures by components are classified as stator, rotor, bearing, or centering device-related.
As the motor has many types of failures, diagnosis has become a popular issue. In recent years, much domestic and foreign literature has been published on failure diagnosis strategies, the aims of which are to increase motor life, reduce accidents, and save on maintenance costs. Jiang et al. [2] uses the characteristic frequency spectrum captured from wavelet transformation as the training data for the artificial neural network in order to identify bearing failures. In addition, Zidani et al. [3] infers the possibility of detecting stator failure through a fuzzy system set by way of expert experience. A further example is shown in Reference [4], using genetic algorithm to improve the Elman neural network’s convergence speed in gearbox fault detection.
It can be deduced from such literature that motor failure diagnosis technology is progressing, especially in the areas of artificial neural network, fuzzy theory, and wavelet transform, which are the most widely used [2,3,4,5,6,7,8,9,10]. The failures can be effectively diagnosed by relying on better network weights in the artificial neural network, in addition to the requirement for huge historical data. Furthermore, if the diagnosis of the failure types increases, the network distribution will be more complex, which will reduce the efficiency of diagnosis. Moreover, if the fuzzy rules and membership functions are only formulated by expert experience, the inference result will be unpersuasive.
Above all, this paper proposes an effective rotor failure diagnosis method (Figure 1), which contains two core components: (1) use of electrical detection to collect motor current data and capture characteristics of normal and abnormal motors by fast Fourier transform, so as to construct the diagnosis database; and (2) putting the training samples into a genetic algorithm to search for the best membership functions, so as to promote the benefits of failure diagnosis.

2. Problem Description

In order to meet the needs of all kinds of motor diagnosis, the tester must have the corresponding historical data of normal and abnormal motors in order to have a training sample. However, in the training process for the genetic algorithm, the identification of optimal membership functions is evaluated based on fuzzy inference results. Above all, the fitness function is formulated as follows:
F i t n e s s = { 0 , i f   f n o r m a l   o r   f a b n o r m a l < 0 f n o r m a l + f a b n o r m a l , o t h e r w i s e where f n o r m a l = min { 0.5 z i ,   i = 1 ,   2 ,   ,   n } f a b n o r m a l = min { z i 0.5 ,   i = n + 1 ,   n + 2 ,   ,   N }
where n is the number of training samples of normal motors, N is the number of total training samples, z i is the inference result of failure training sample i, f n o r m a l is the worst inference result of normal motors, and f a b n o r m a l is the worst inference result of abnormal motors.
The purpose of this function (1) is to build a diagnosed model by learning the features of the database thoroughly. Therefore, the failure probability of a healthy motor needs to be lower than 50 percent for better motor operation. Conversely, the failure probability of a motor with failure needs to be higher than 50 percent.

3. Technology Used for Diagnosis

Of the four classifications of motor failure by component, this research focuses on the diagnosis of rotor failure. The reasons for the broken rotor bar can be attributed to overcurrent, and it can be judged through the characteristic frequency for electrical method, as shown in Equation (2).
f b = f s × ( 1 ± 2 s )
where s is the slip, f s is the power of the main frequency, and f b is the characteristic frequency of the broken bar.
The energy of the characteristic frequency of a healthy motor is less than that of a broken bar motor. Therefore, this section will introduce fast Fourier transform, fuzzy theory, and the genetic algorithm.

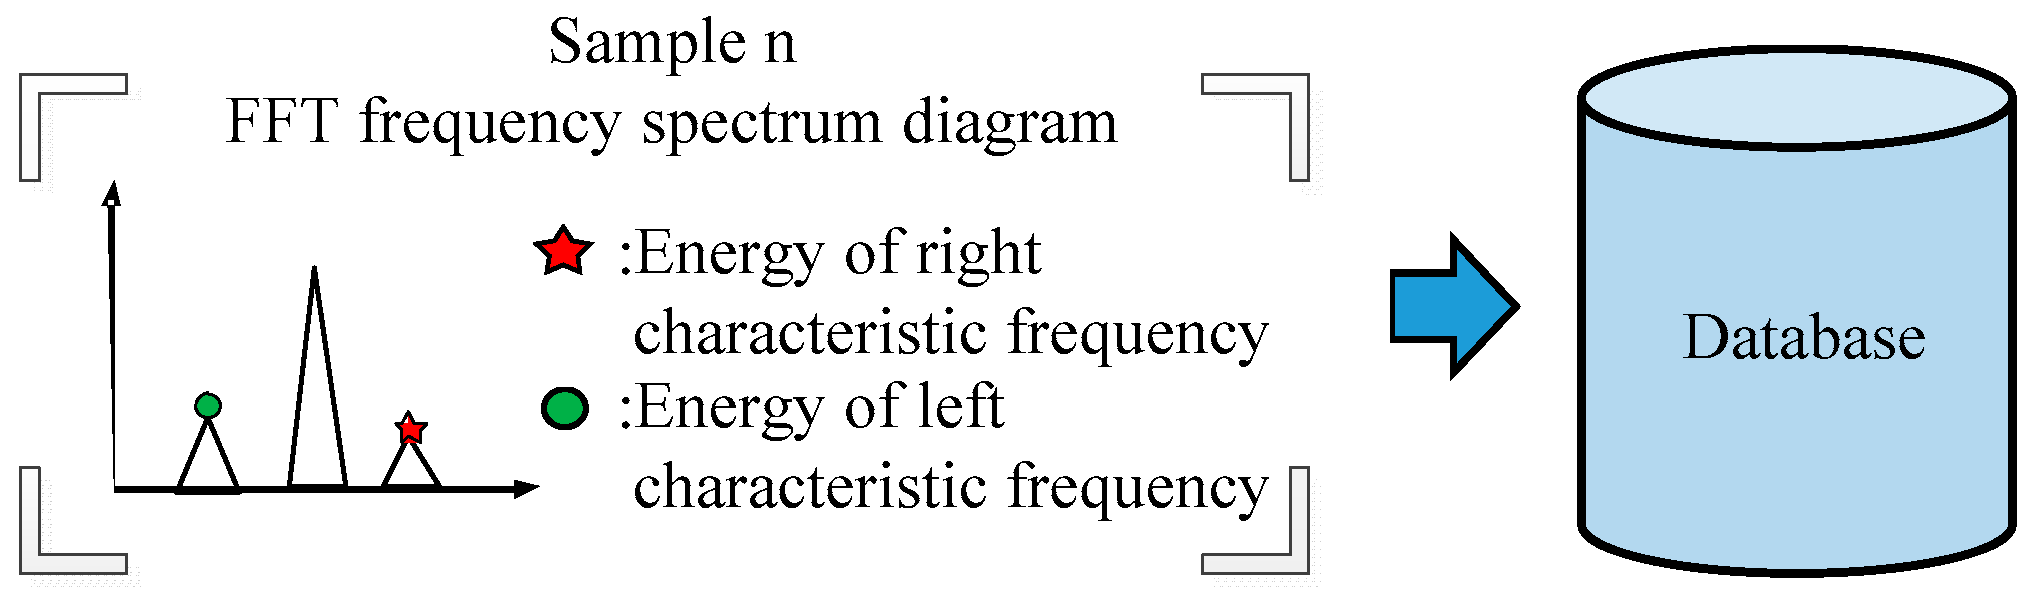
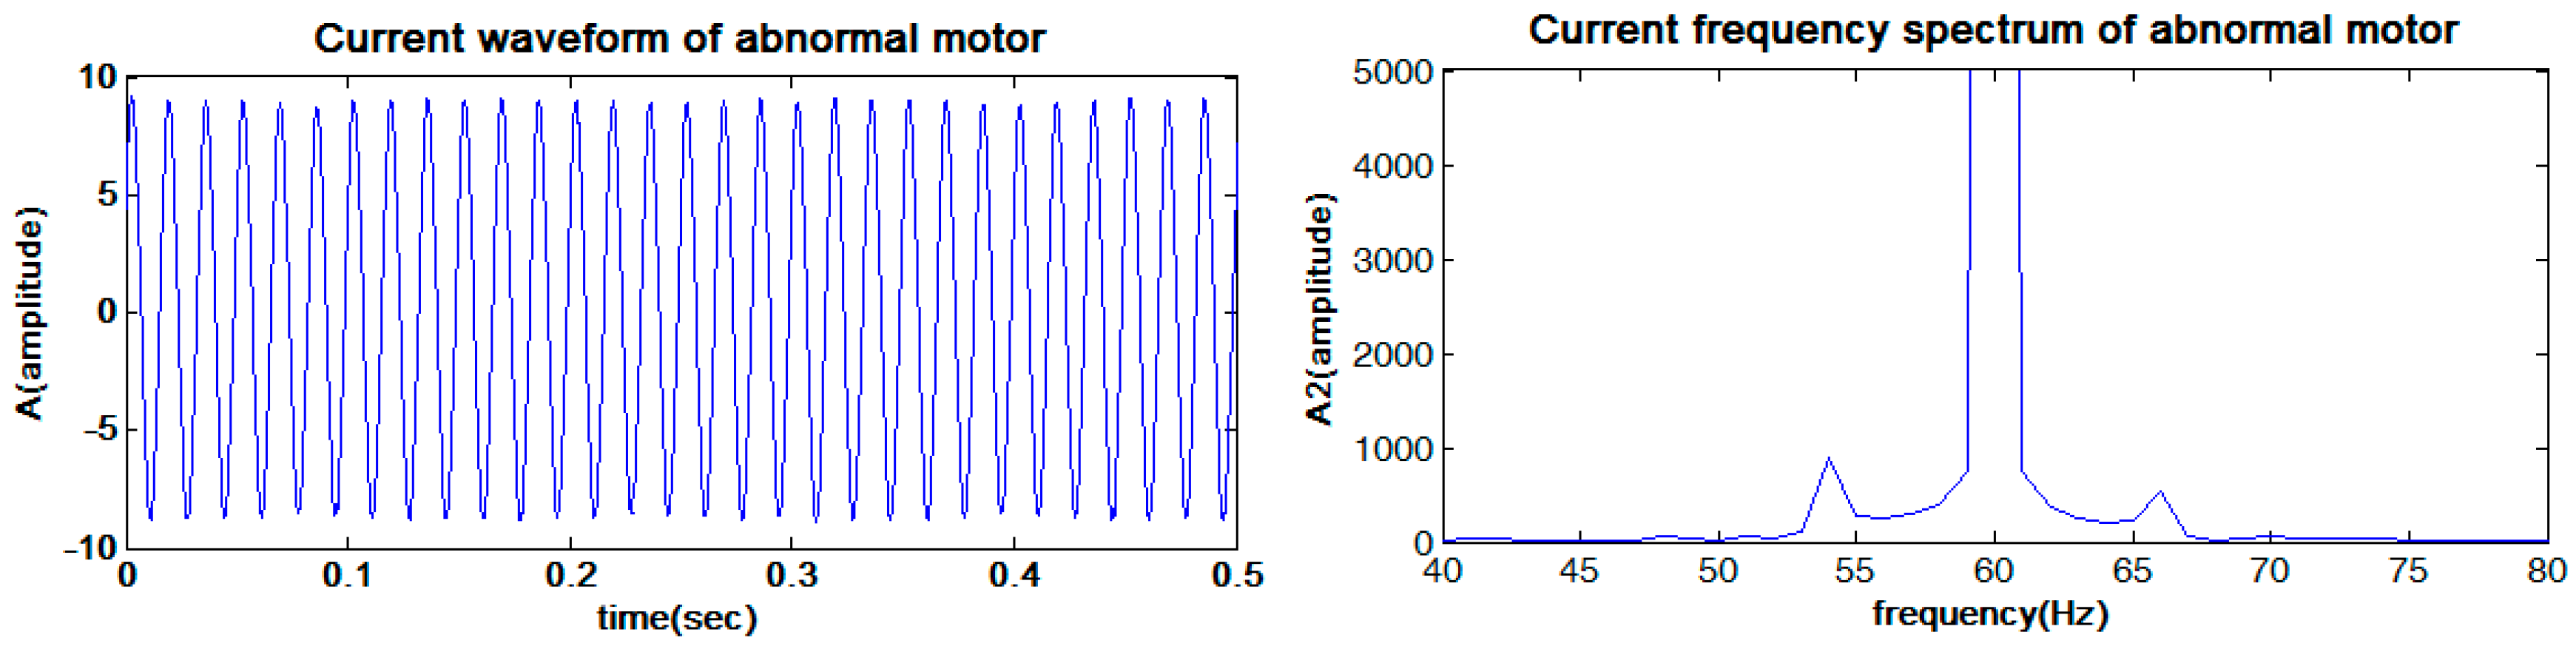
3.1. Fast Fourier Transform
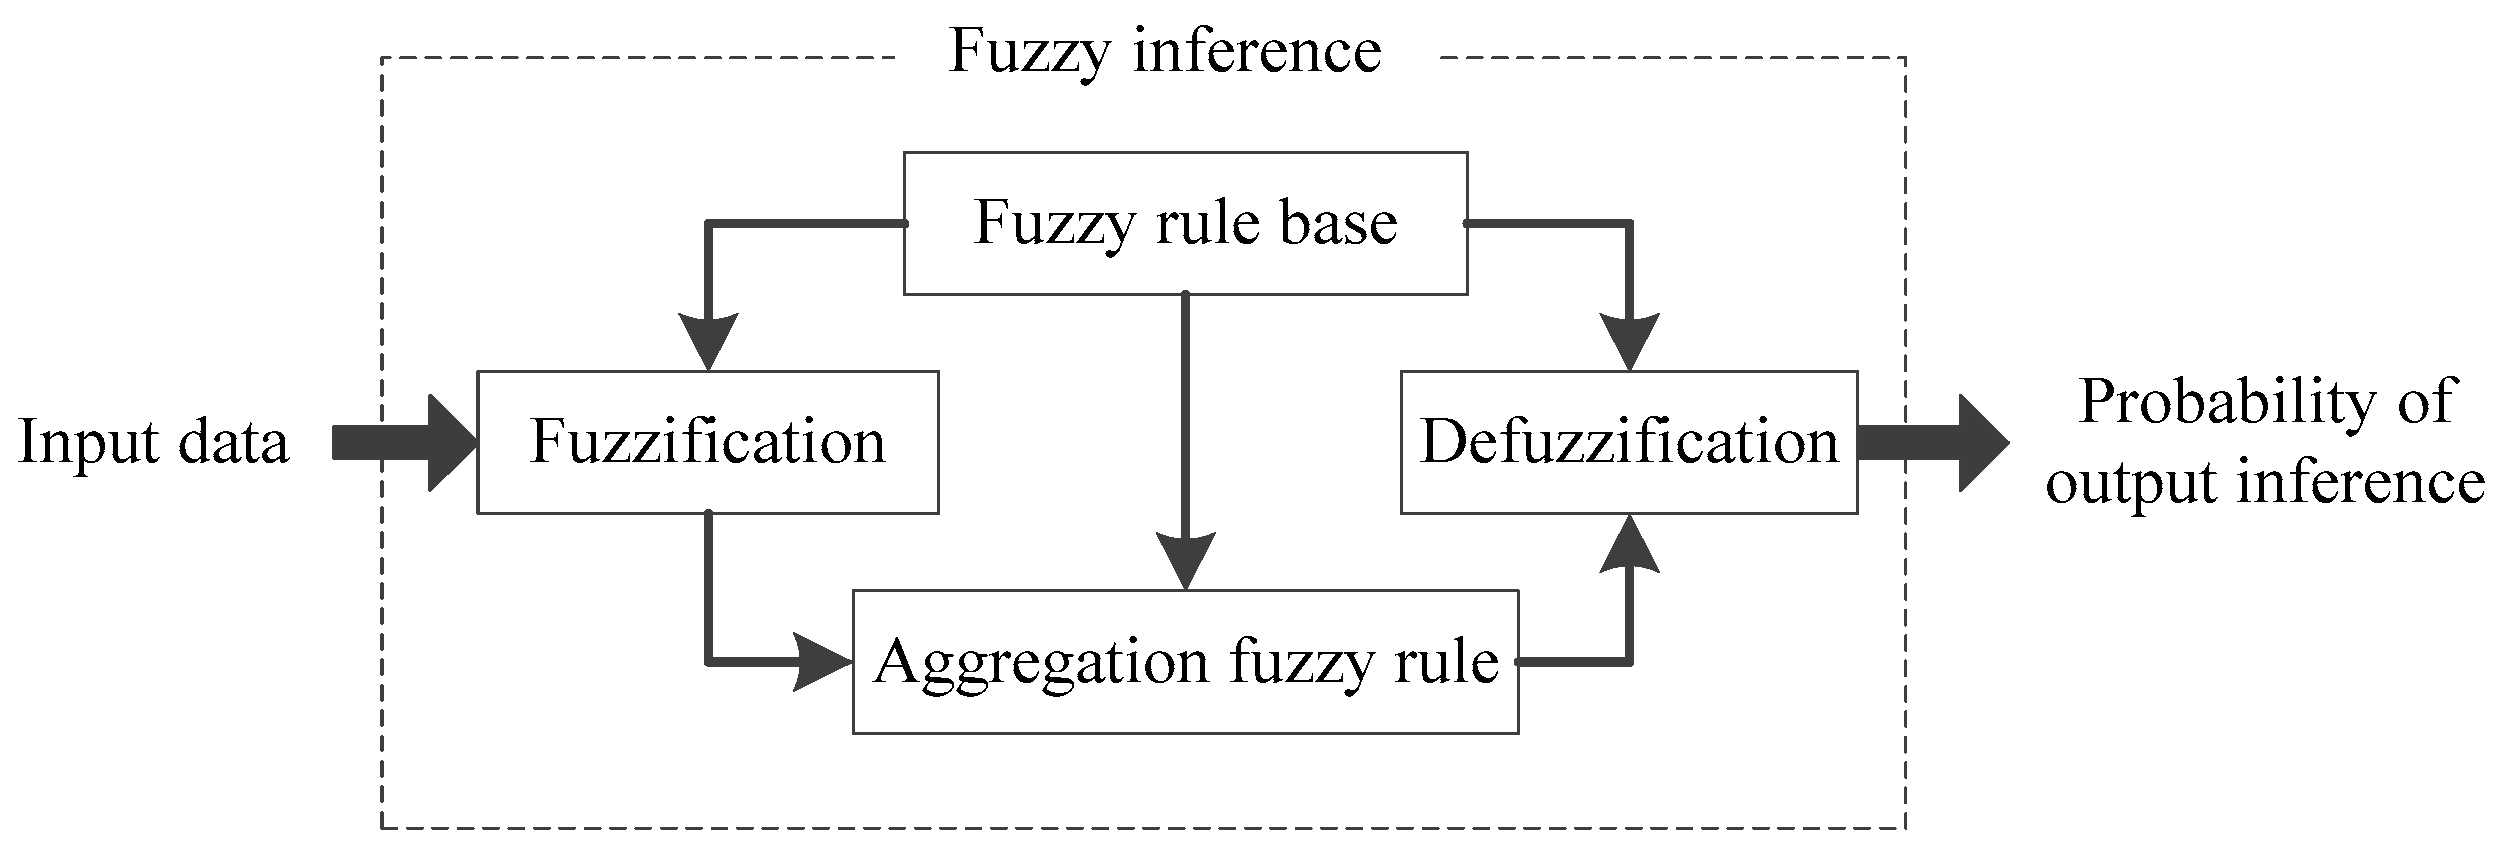
Consider a set of N points signals that change with time that can be defined as x ( n ) . Discrete Fourier Transform corresponding to x ( n ) is shown in Equation (3), and the inverse Discrete Fourier Transform is as shown in Equation (4).
X ( k ) = n = 0 N 1 x ( n ) e j 2 π N n k ,   0 k N 1
x ( n ) = 1 N k = 0 N 1 X ( k ) e j 2 π N n k ,   0 n N 1
where n or k is the sample serial number, N is the total sample numbers.
According to Equations (3) and (4), the concept of Fourier transform is to fit the original signal through multiple sets of waves, so as to obtain the frequency components. This paper will document fast Fourier transform on the motor’s current and record the value of energy on characteristic frequency of broken rotor bar, so as to establish training samples.

3.2. Fuzzy Theory

Fuzzy theory emphasizes human logic in thinking and uncertainty reasoning through a mathematical model. The structure and the functions, as shown in Figure 2, are blur, fuzzy rule, fuzzy inference, and solution to blur, respectively. When inputting data to the system, fuzzy theory is used to translate data to fuzzy message. Human experiences are then aggregated with fuzzy inference, and, finally, the output is the probability format. Hence, this paper will show the design of a fuzzy system according to the motor failure diagnosis through optimization using the genetic algorithm.

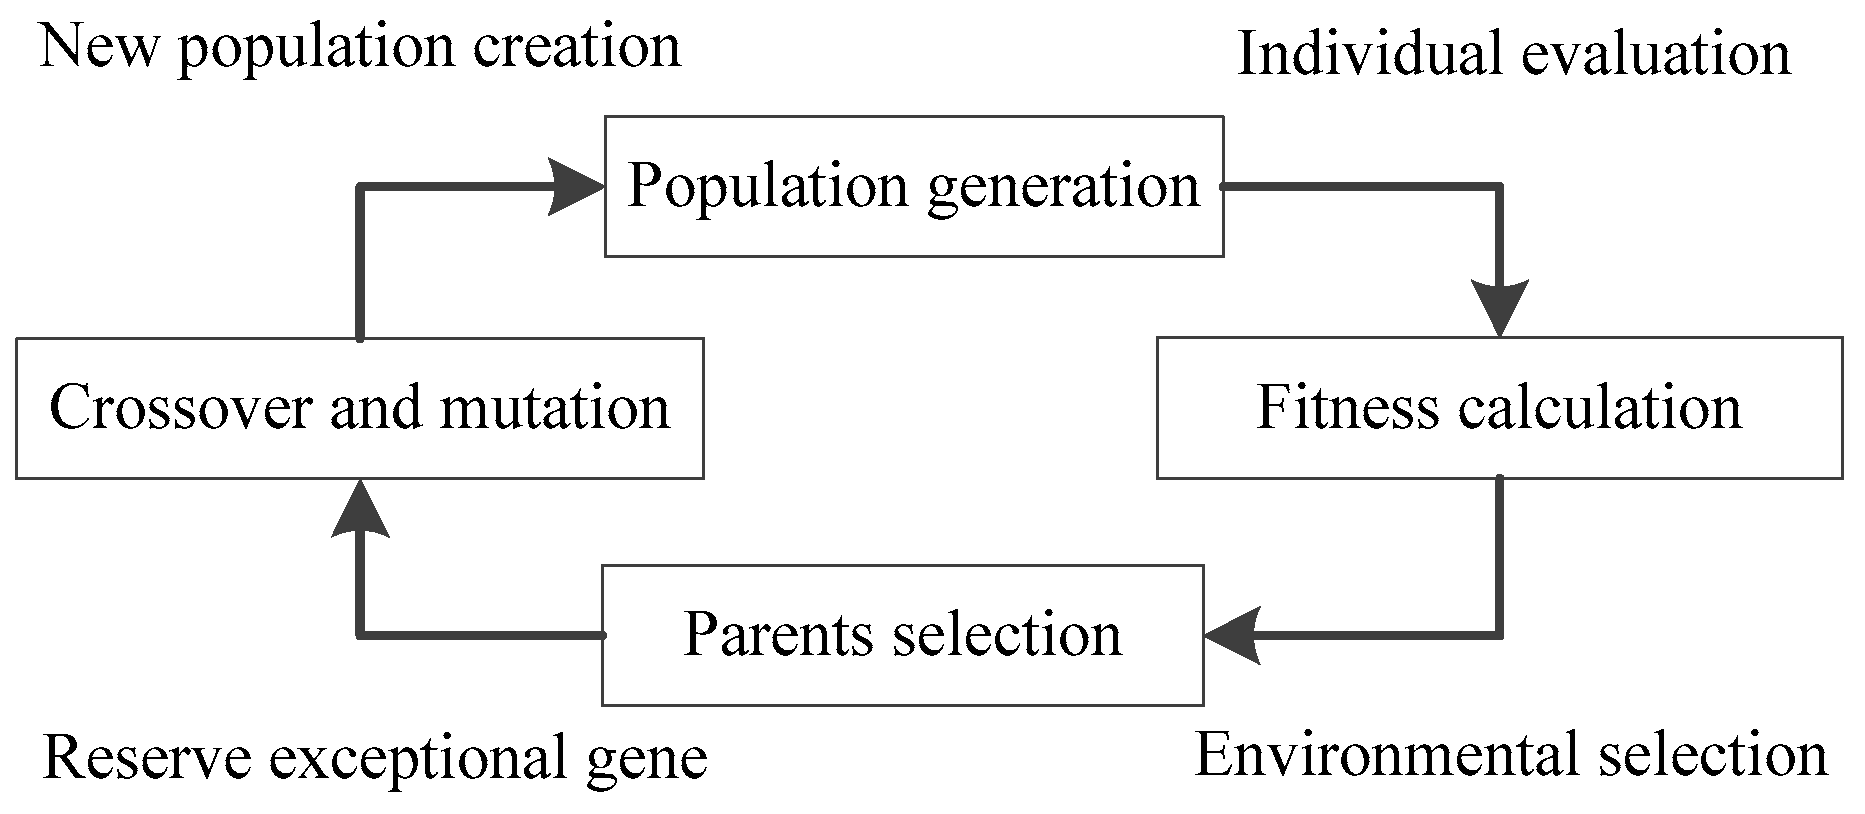
3.3. Genetic Algorithm

The genetic algorithm is a kind of optimal search mechanism to simulate natural reproduction, and its concept is to keep the most competitive species through environmental selection and conserve the best genes for the next generation. Its basic structure as shown in Figure 3. When the genetic algorithm is used to solve optimization, fitness function must be designed according to the applied problem, so as to effectively search for the best solution in the whole area.
This paper shall then show the design of the corresponding evolution process according to the objective, so as to establish the best membership function.

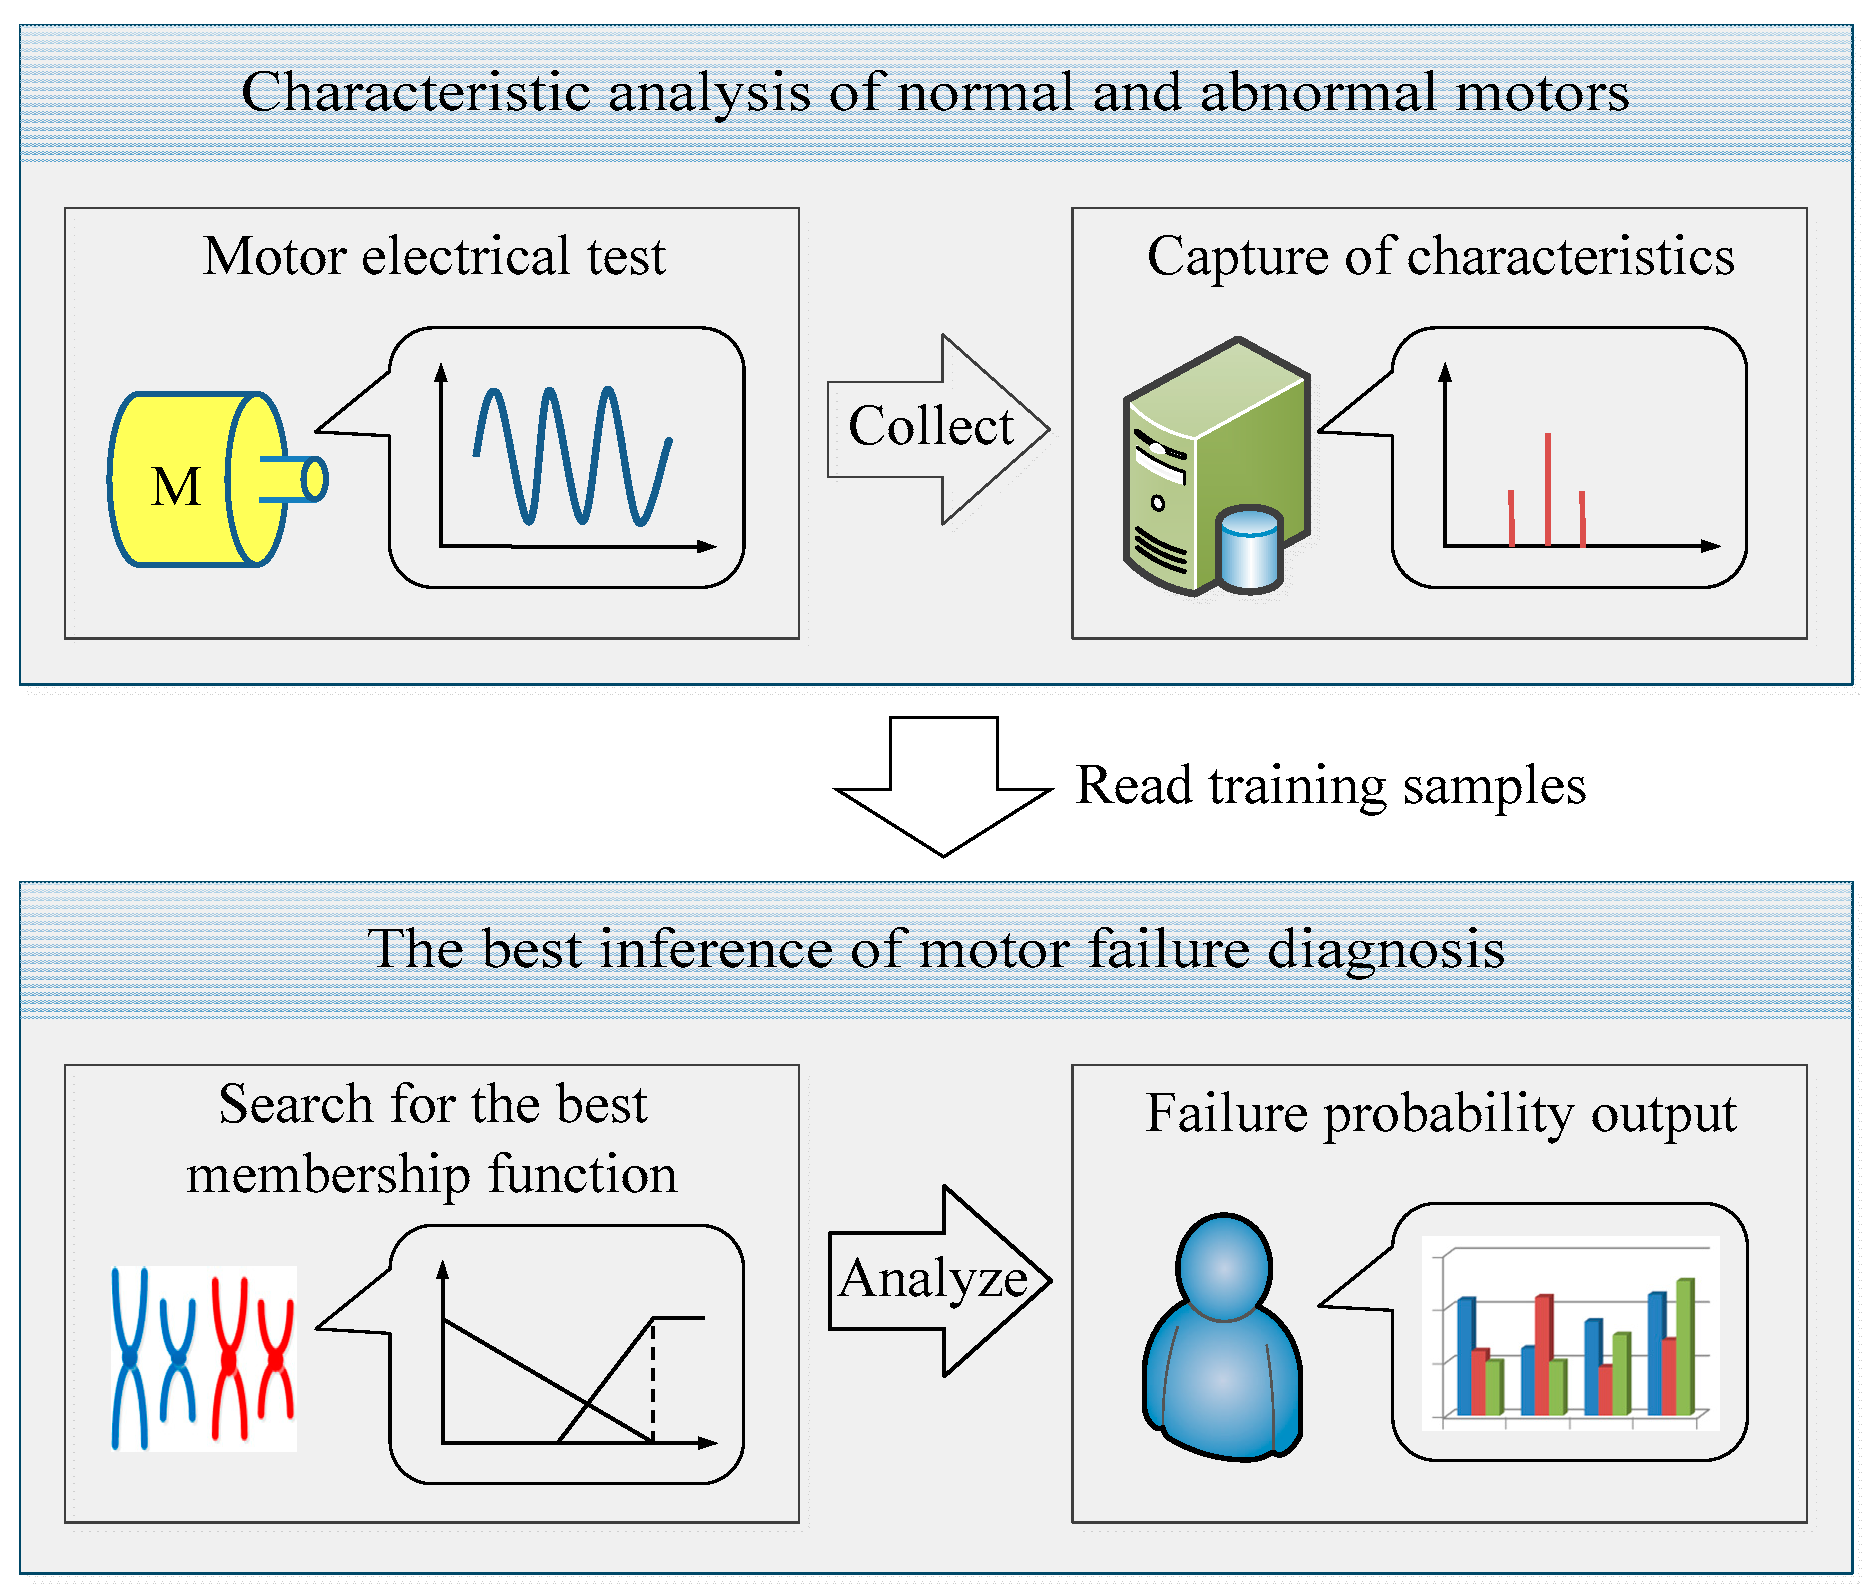
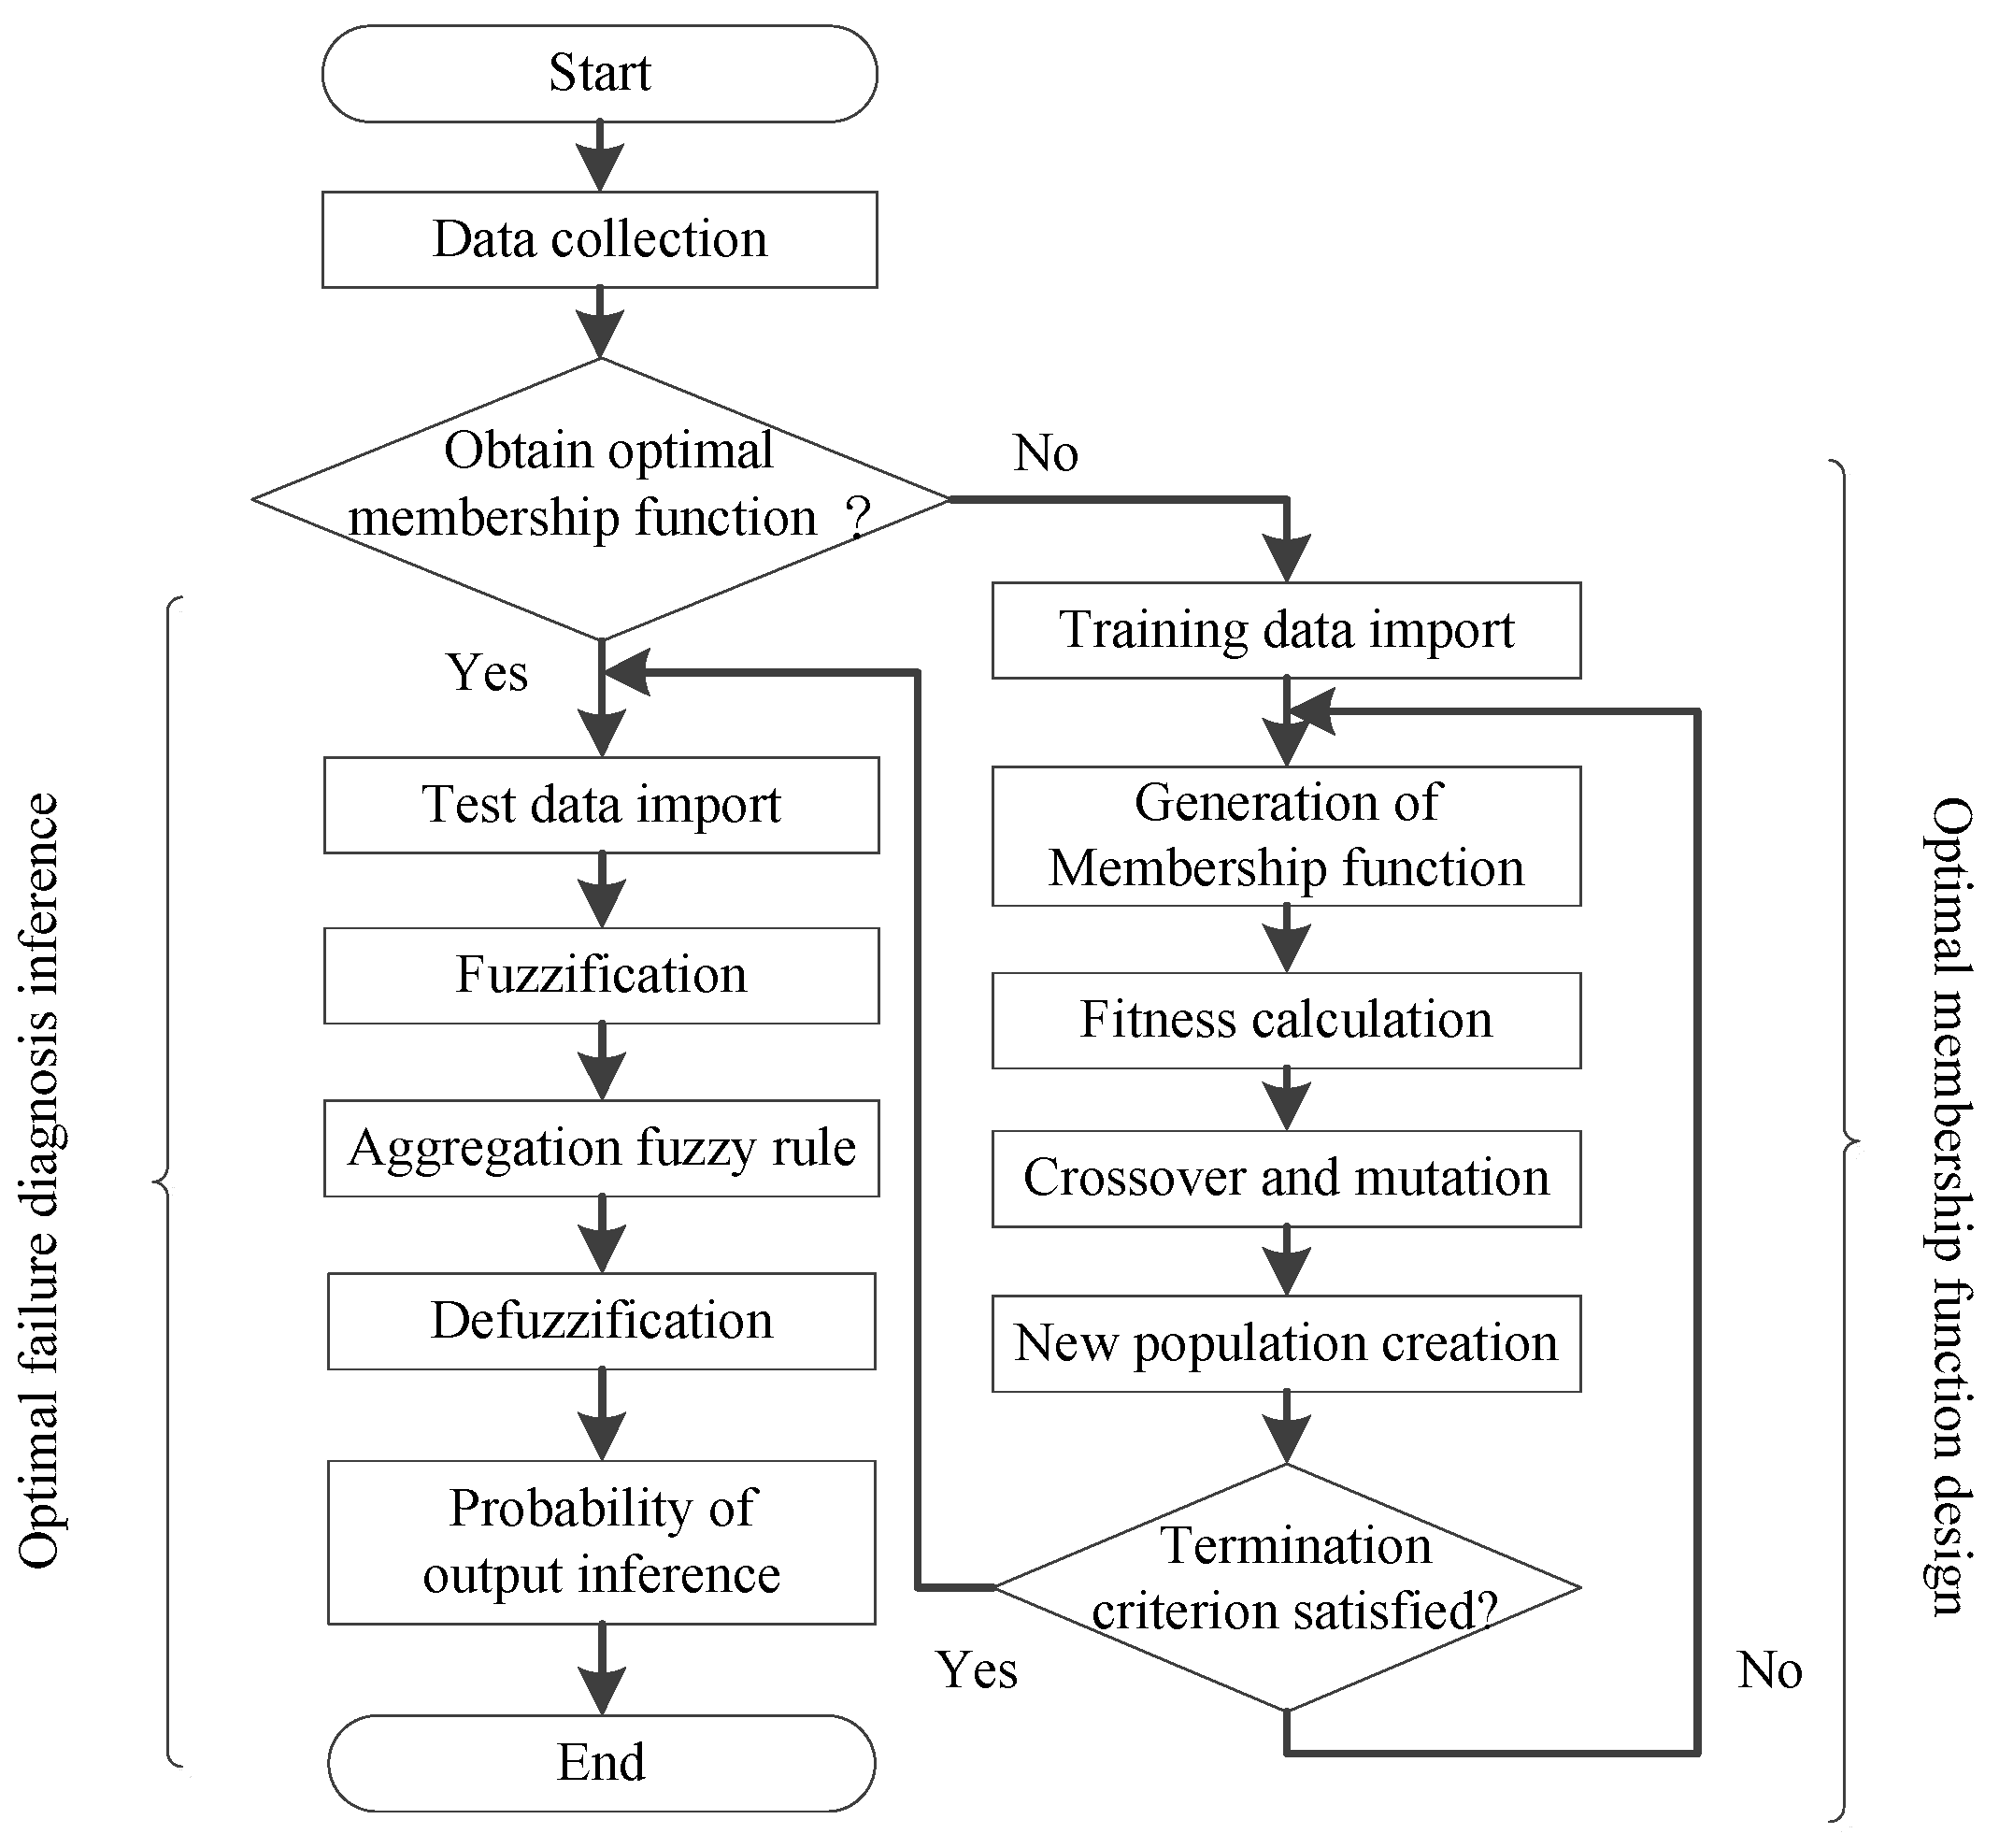
4. Optimal Design of Membership Function

The design of the optimal membership function proposed in this research is implemented through the combination of fuzzy theory and the genetic algorithm. The process is as shown in Figure 4. First, genetic algorithm is used to learn the energy characteristics of the training samples and search the optimal membership function. Then the test samples are used to verify the optimal efficiency. This section will use a TE-204 motor as an example to introduce the design process of the rotor failure diagnosis, and it can be divided into: (1) data collection; (2) generation of membership function; (3) fitness evaluation; (4) crossover and mutation; and (5) termination conditions.

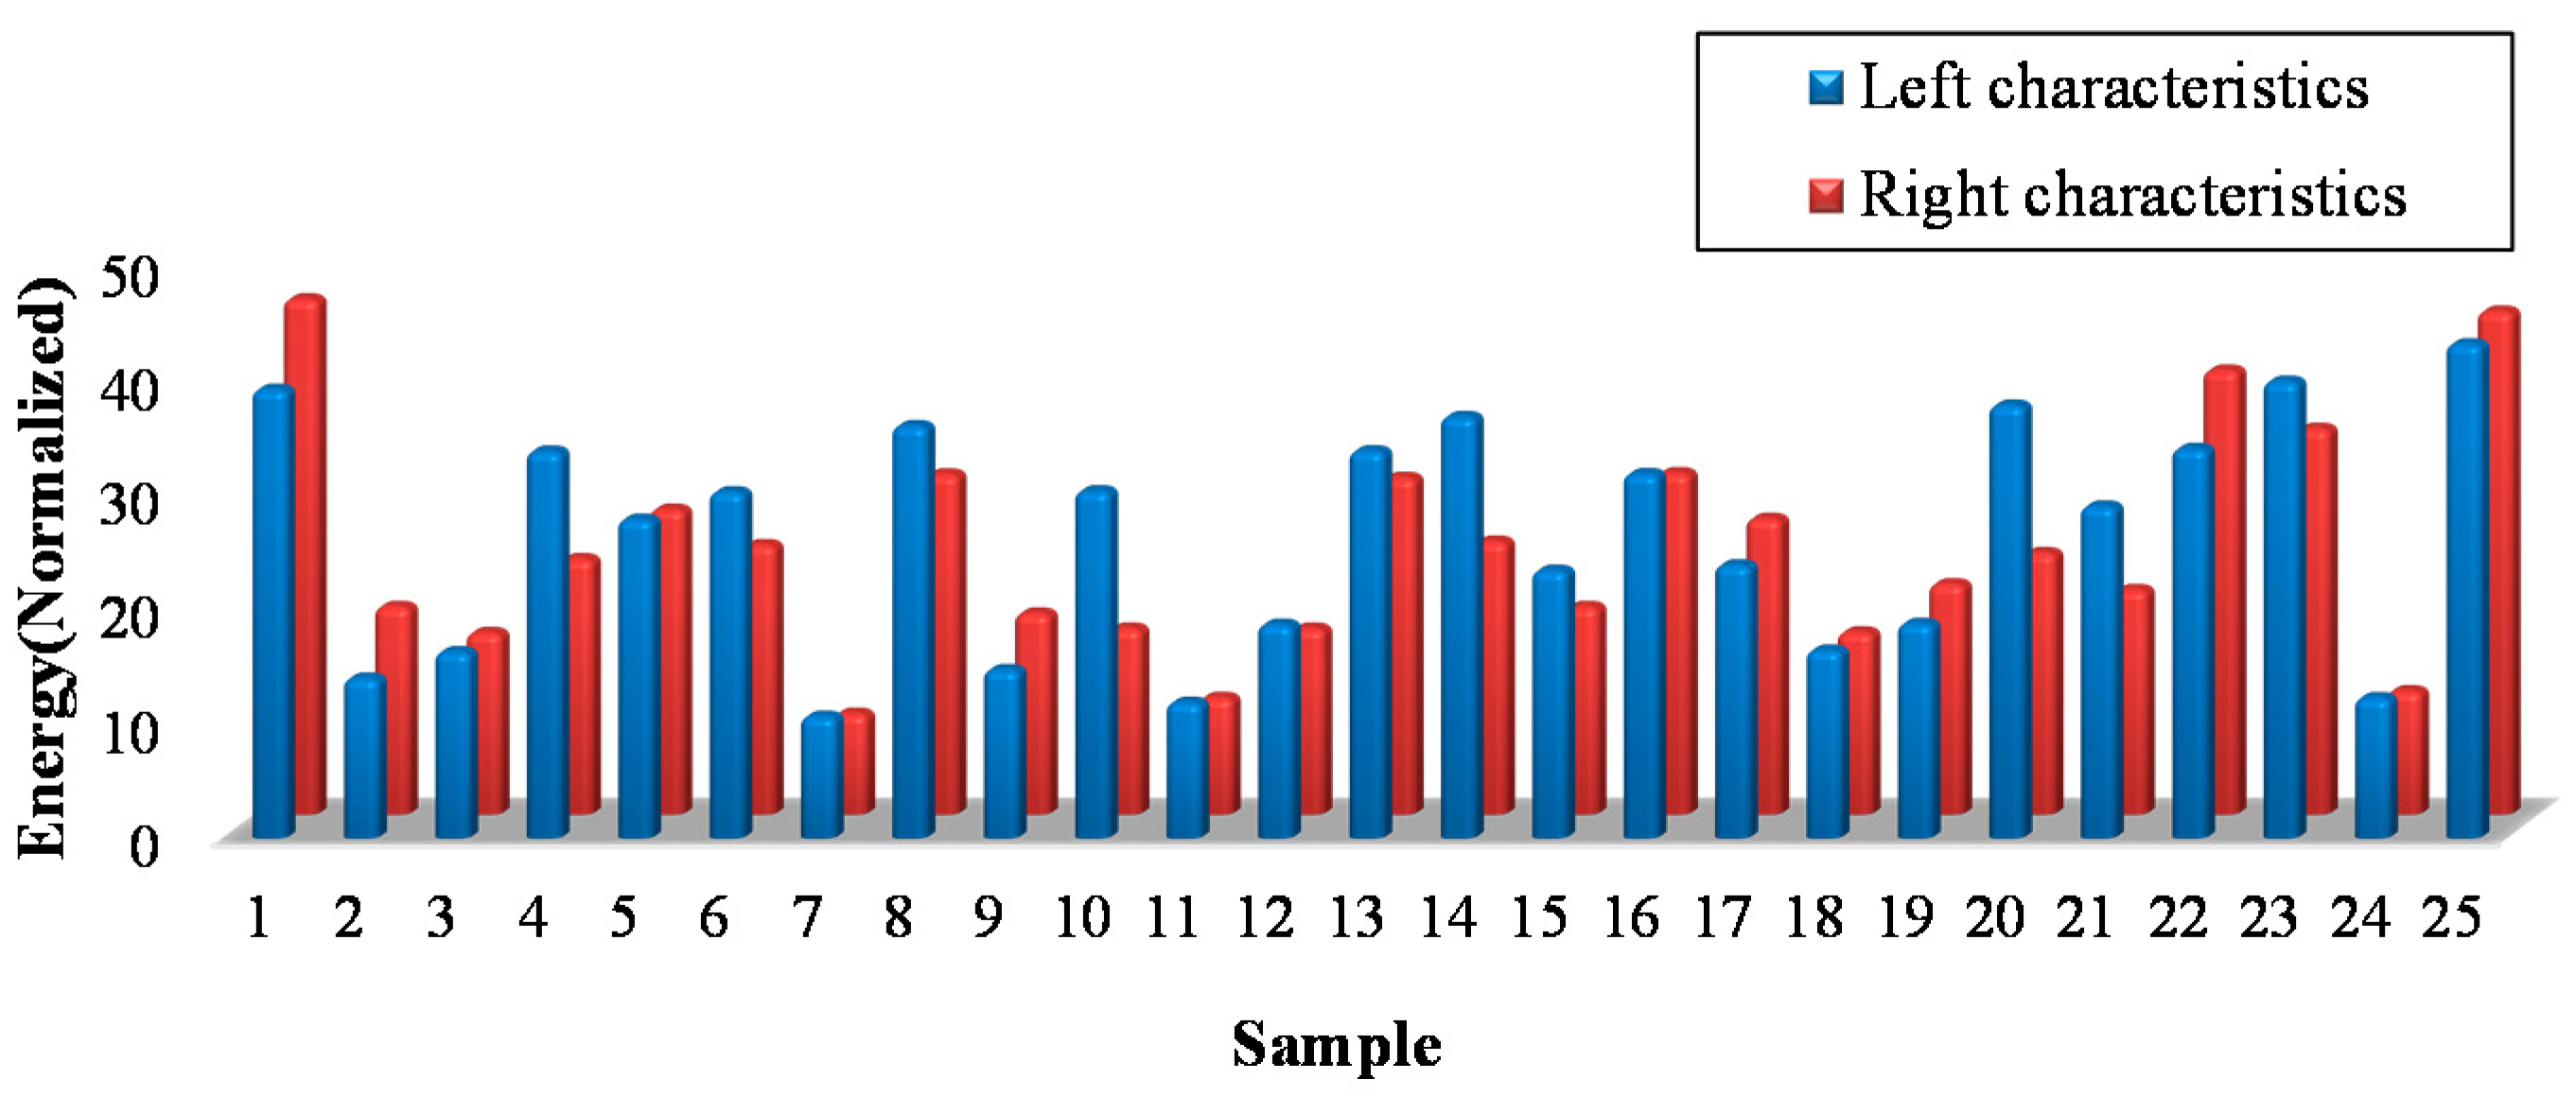
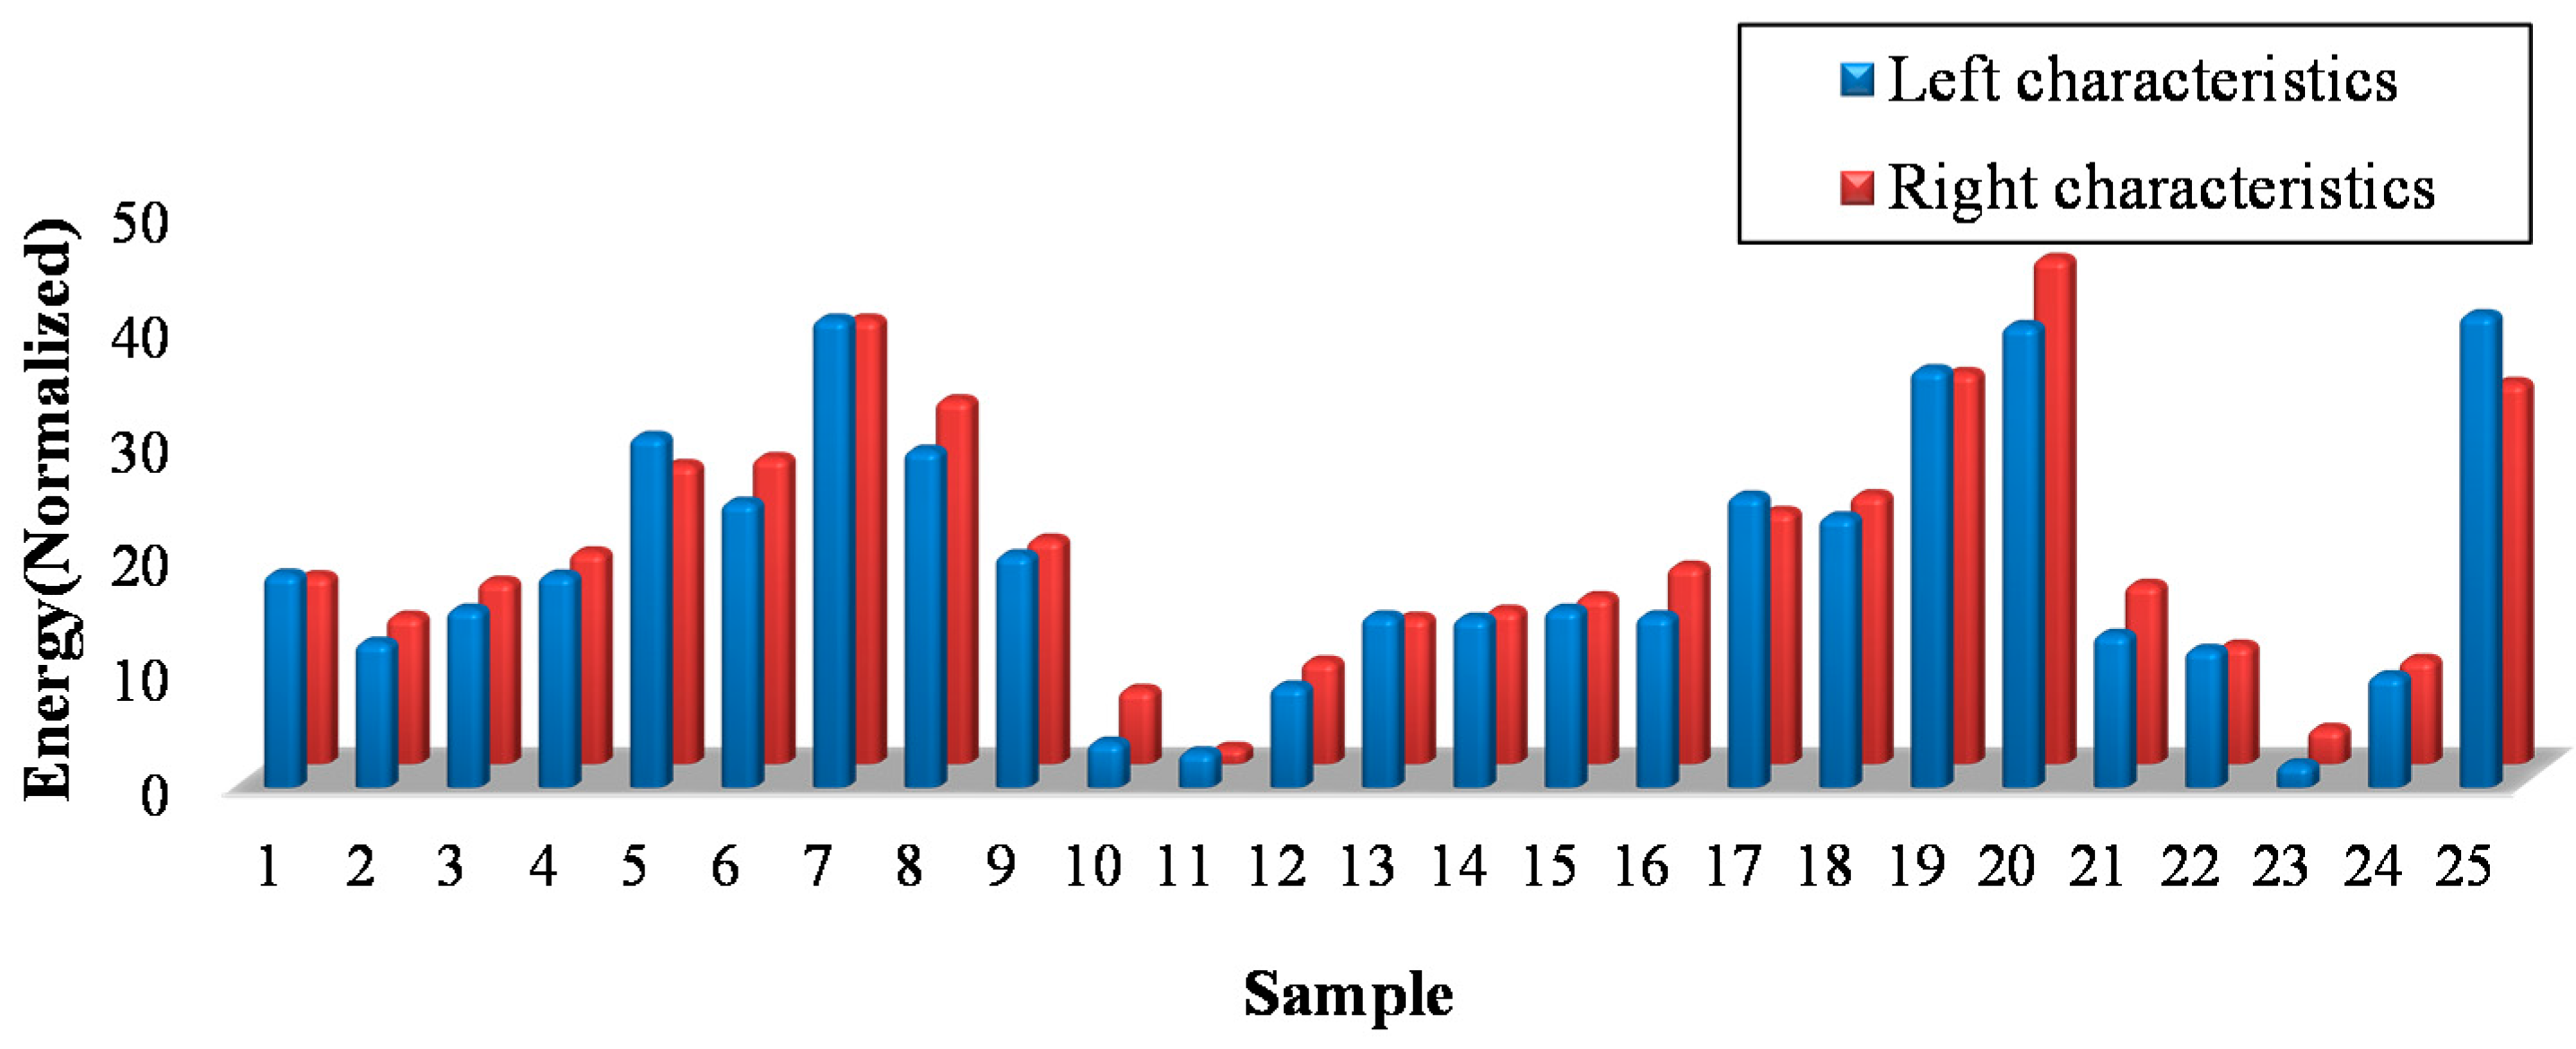
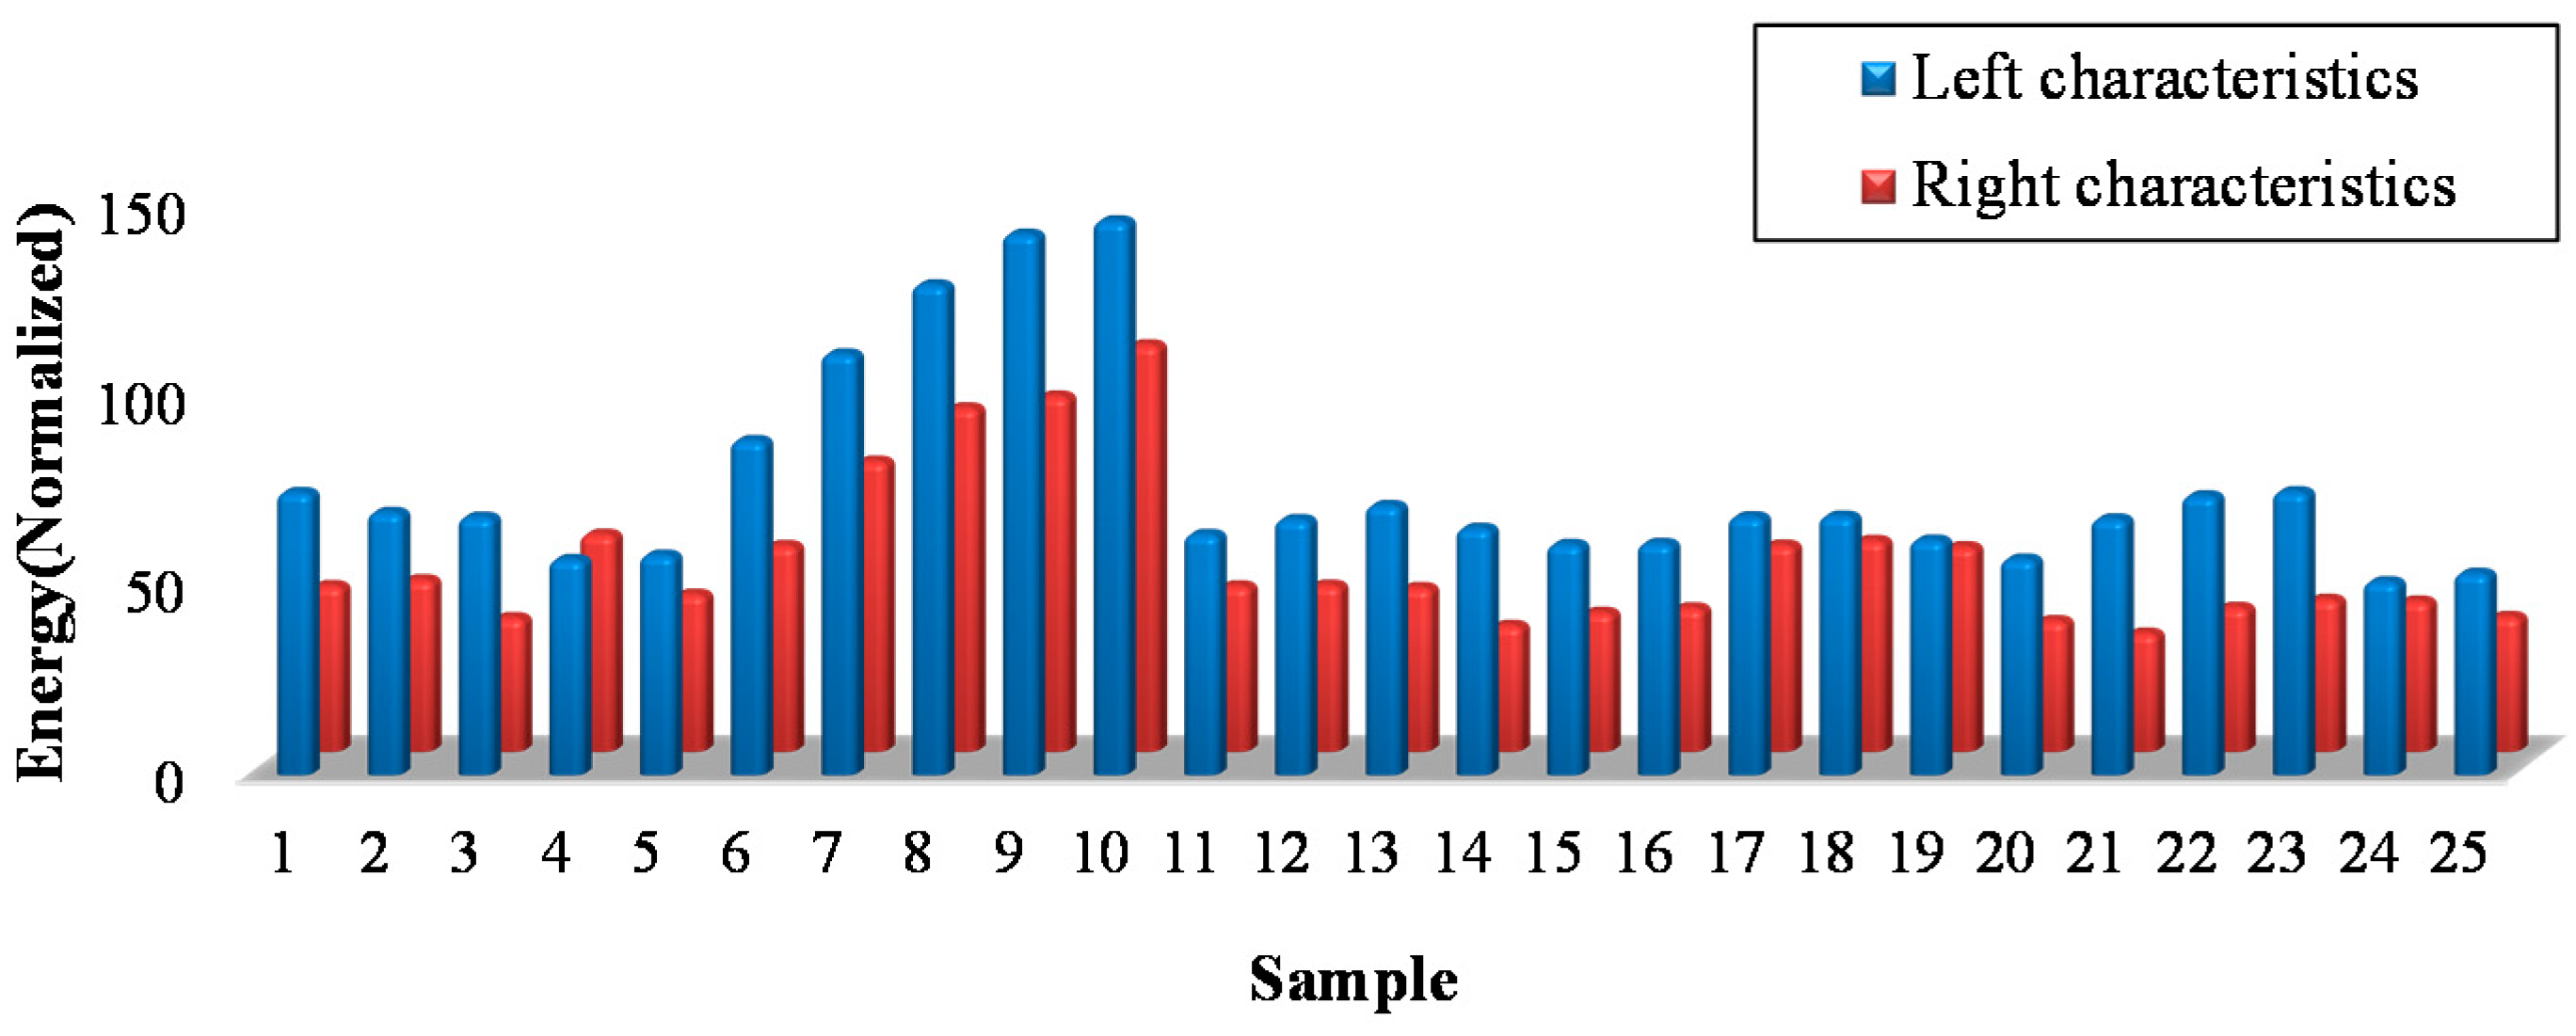
4.1. Data Collection

Motor rotor failure can be observed by analyzing the stator current with fast Fourier transform. The purpose of data collection is to record the broken bar’s energy from characteristic frequency (+2s and −2s). The concept is as shown in Figure 5. In this case, training samples and test samples both have 50 records, each of which contain 25 normal and 25 rotor failure samples.

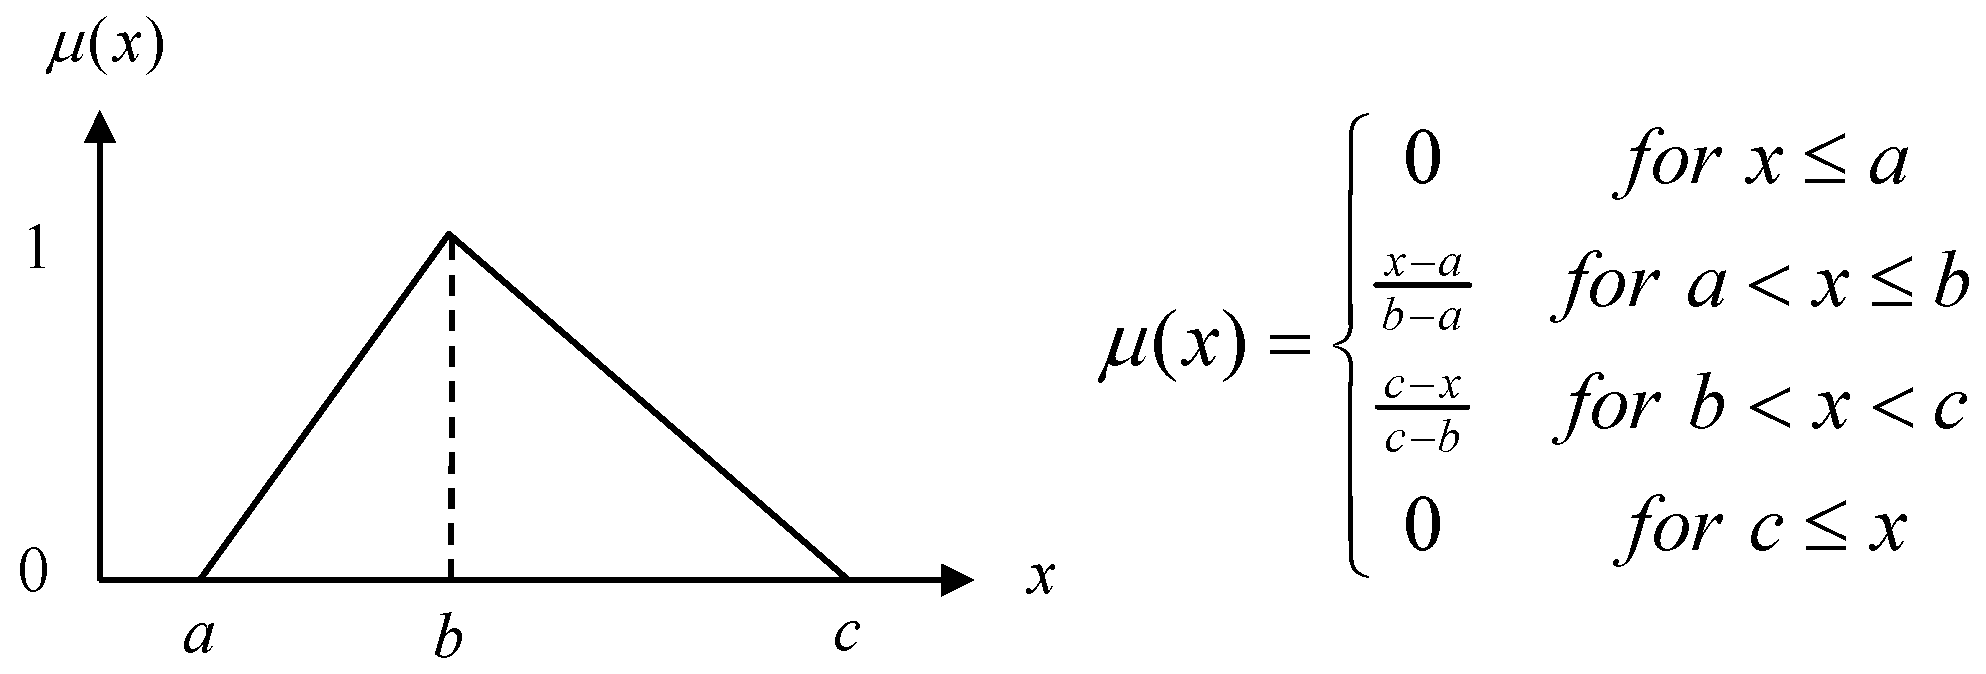
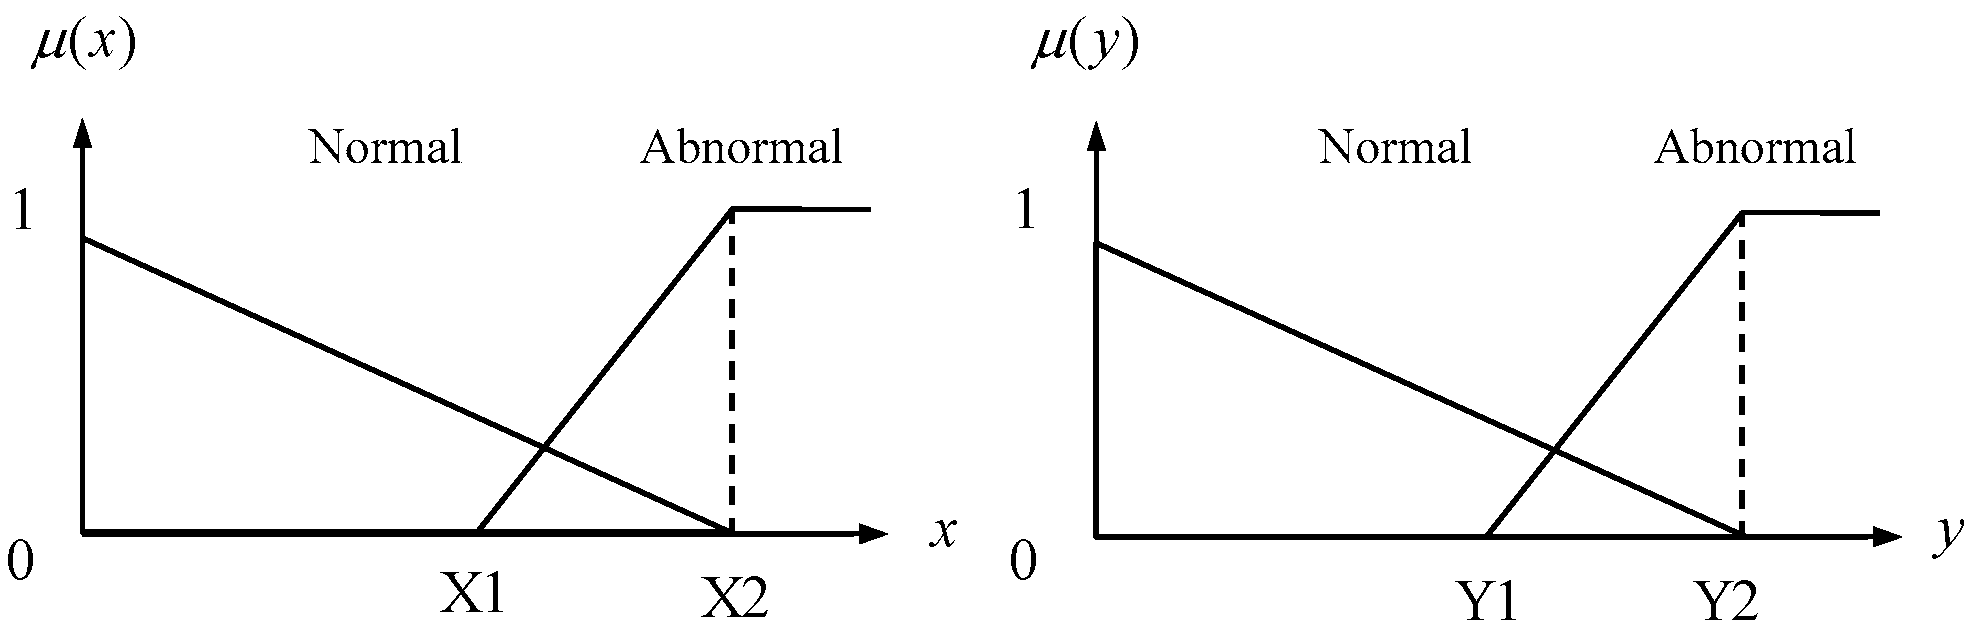
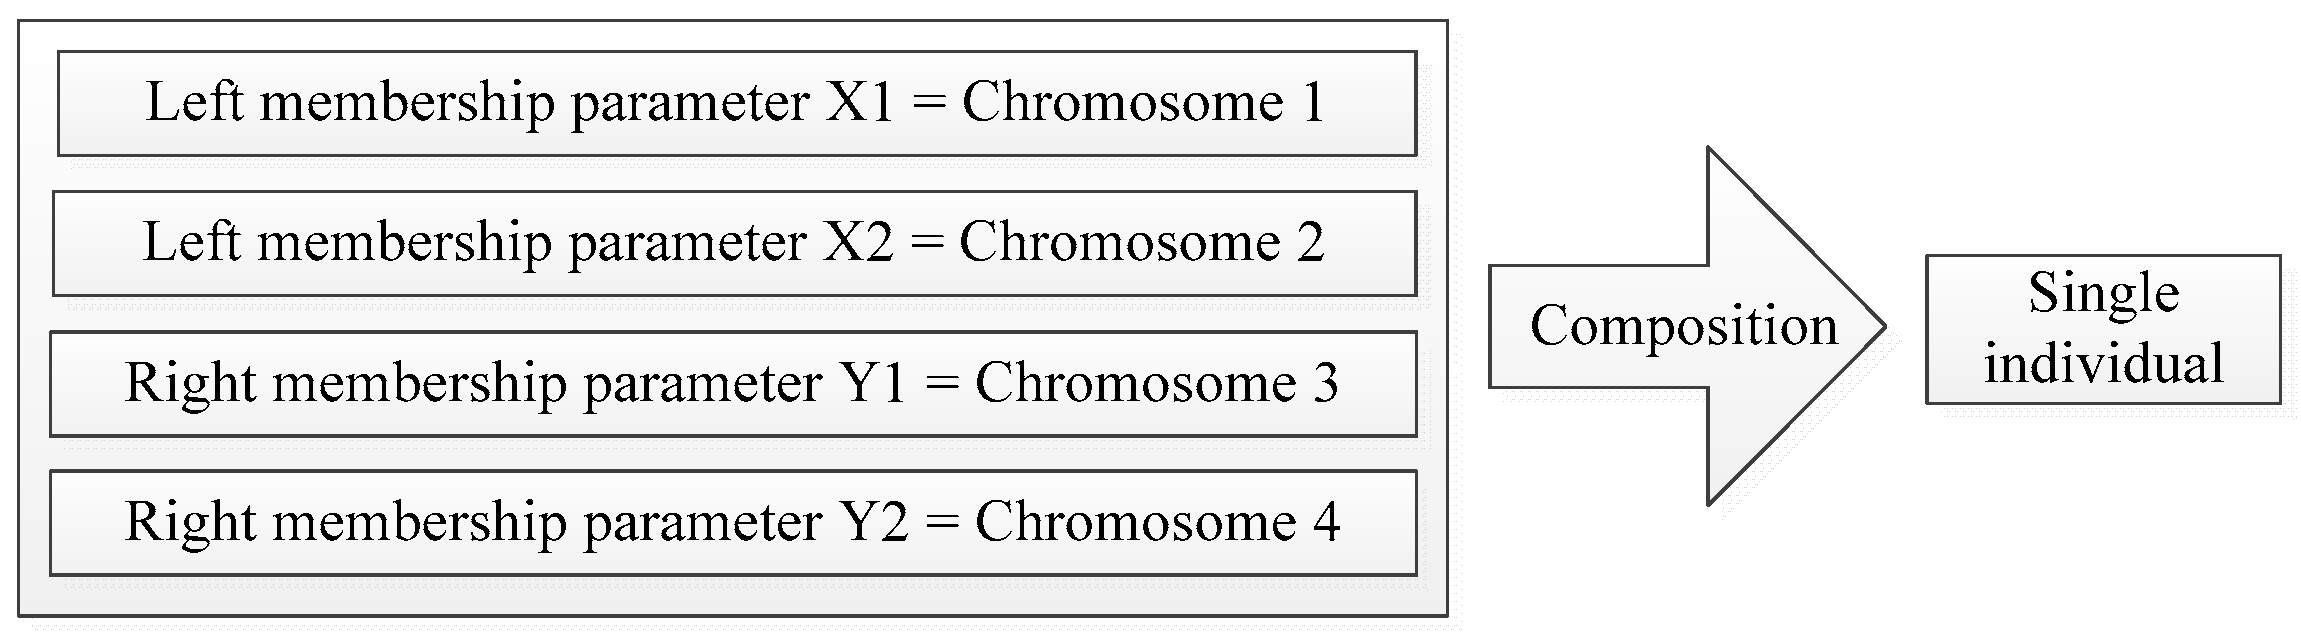
4.2. Generation of Membership Function

The fuzzy set is based on triangular membership functions of a normal set and an abnormal set. The input membership function has μ ( x ) left-side characteristic frequency energy, and μ ( y ) right-side characteristic frequency energy, both of which contain two variables, as shown in Figure 6 and Figure 7.
The purpose of this step is to randomly generate individuals of genetic algorithm. The single individual has four chromosomes, with each chromosome owning only one gene, and a single gene can be considered as being composed of energy at characteristic frequency, which is expressed in decimal, as shown in Figure 8.

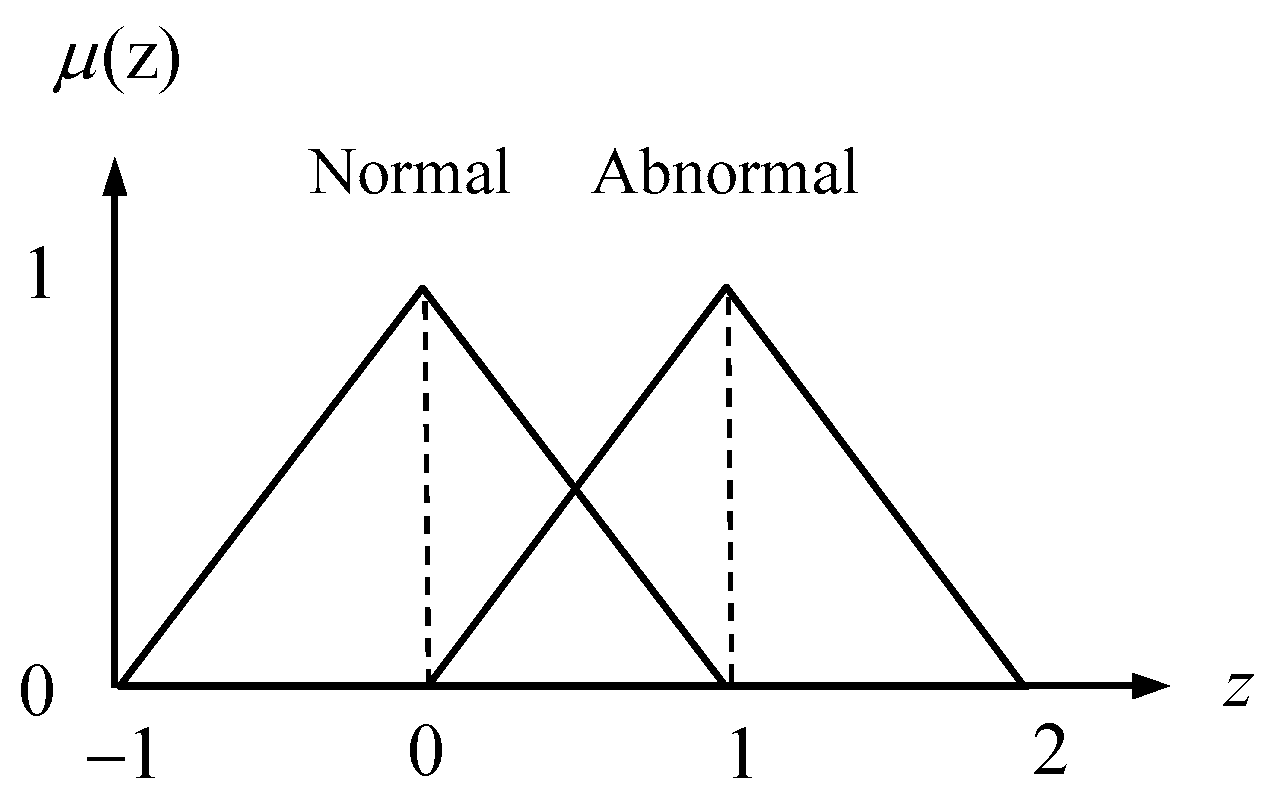
4.3. Fitness Evaluation

When the detector has training samples and randomly generated membership function, it can obtain the corresponding failure probability by fuzzy theory. However, if the membership function is designed improperly, misdiagnosis can be caused. In order to avoid this problem, the fitness function must be set properly for genetic algorithm to search the global optimal solution. The fitness evaluation for this research refers to the fuzzy inference results, with the fuzzy rules formulated as follows:
(1)
If the left characteristic frequency energy is “Normal”, then the state of the rotor is “Normal”.
(2)
If the left characteristic frequency energy is “Abnormal”, then the state of the rotor is “Abnormal”.
(3)
If the right characteristic frequency energy is “Normal”, then the state of the rotor is “Normal”.
(4)
If the right characteristic frequency energy is “Abnormal”, then the state of the rotor is “Abnormal”.
The output membership function is shown in Figure 9. Aggregation is formed by multiple fuzzy rules and the center of gravity method is used to solve defuzzification, as shown in Equation (5), and the rotor failure probability can be obtained.
z * = i = 1 L μ ( z i ) z i i = 1 L μ ( z i )
The fitness function is formulated as follows:
F i t n e s s = { 0 , i f   f n o r m a l   o r   f a b n o r m a l < 0 f n o r m a l + f a b n o r m a l , o t h e r w i s e where f n o r m a l = min { 0.5 z i ,   i = 1 ,   2 ,   ,   25 } f a b n o r m a l = min { z i 0.5 ,   i = 26 ,   27 ,   ,   50 }
where z i is the inference result of training sample i, f n o r m a l is the worst inference result of normal motors, and f a b n o r m a l is the worst inference result of abnormal motors.

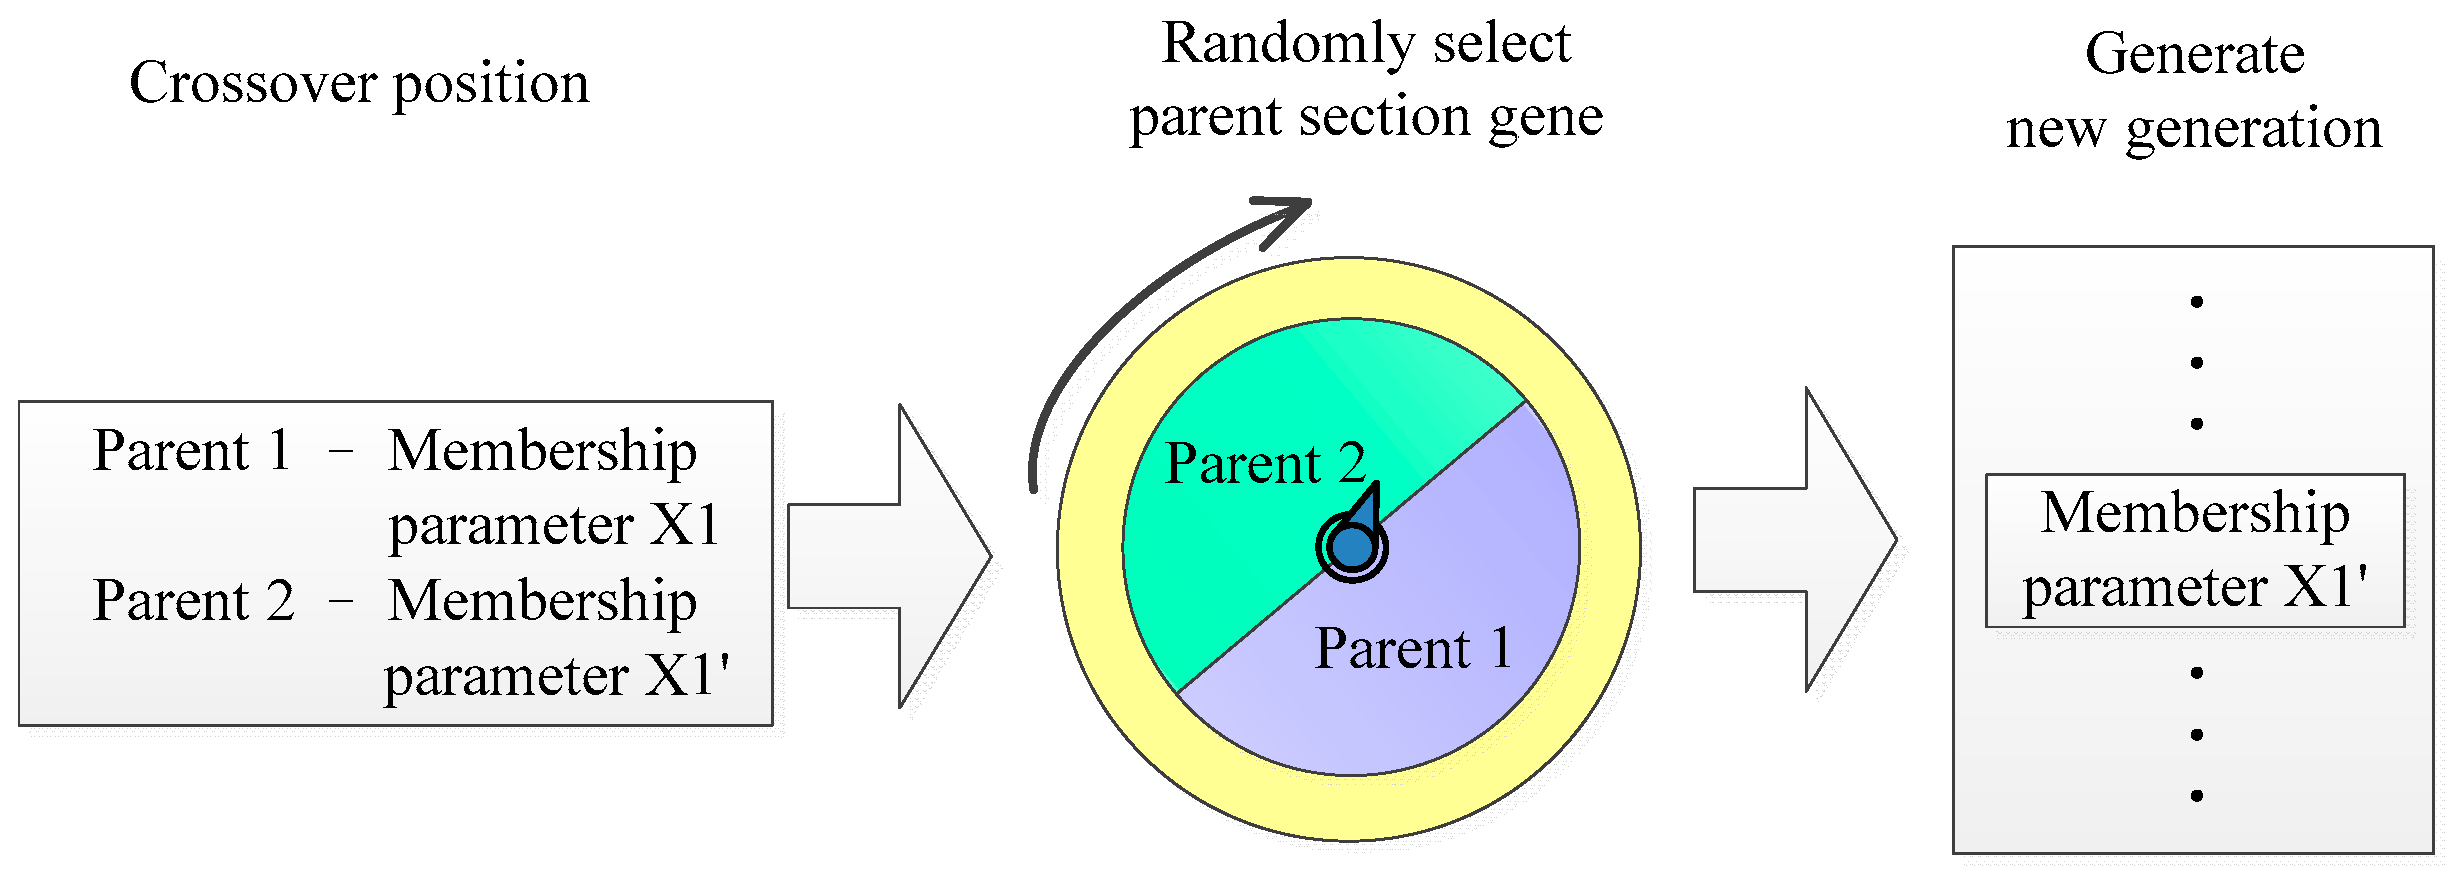
4.4. Crossover and Mutation

The research uses roulette wheel and elite strategy as the selection mechanisms and the methods are as follows: substitute individual parameters into fitness function, give corresponding probability for selection according to the obtained fitness, allow the selected individuals to participate in subsequent evolution, and conserve the elites to the next generation in order to avoid missing the original excellent gene.
As shown in Figure 10, the parents, selected using roulette wheel, are mated in pairs, while the membership parameters of left-side characteristic frequency and right-side characteristic frequency will have crossover positions. In addition, appropriate mutation rates can change the structure of their offspring so as to improve the population diversity. The mutation mechanism used for this research is that it randomly selects mutation points from four input variables and regenerates membership parameters.

4.5. Termination and Conditions

Repeatedly follow the steps outlined above until it achieves the iterations of the terminal condition.

5. Test Case

This research captures characteristic frequency energy using fast Fourier transform, then collects electrical data before and after the motor failure in order to search for the optimal membership function using genetic algorithm. Finally, the test samples will be used to verify the optimal benefit. This section applies the method mentioned above, as well as the Monte Carlo method, to search for membership functions, and later discuss the differences in the diagnosis result.

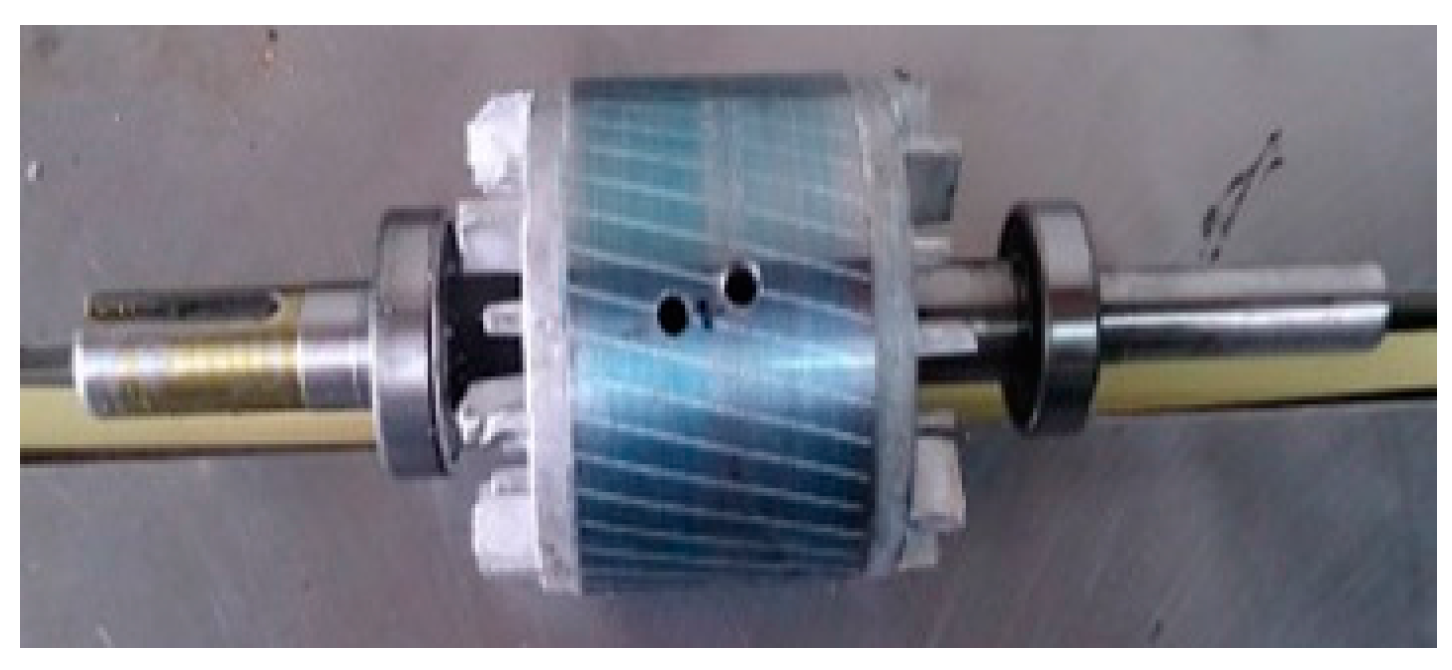
5.1. Experiment Model

This research uses a TE-204 three-phase squirrel-cage induction motor as the test model. The specification is as shown in Table 1. The diagnosis needs a normal motor and a failure motor for comparison. Thus, two holes were drilled on the rotor for it to have one broken bar, as shown in Figure 11. The drilling diameter is 7 mm and the depth is 30 mm.

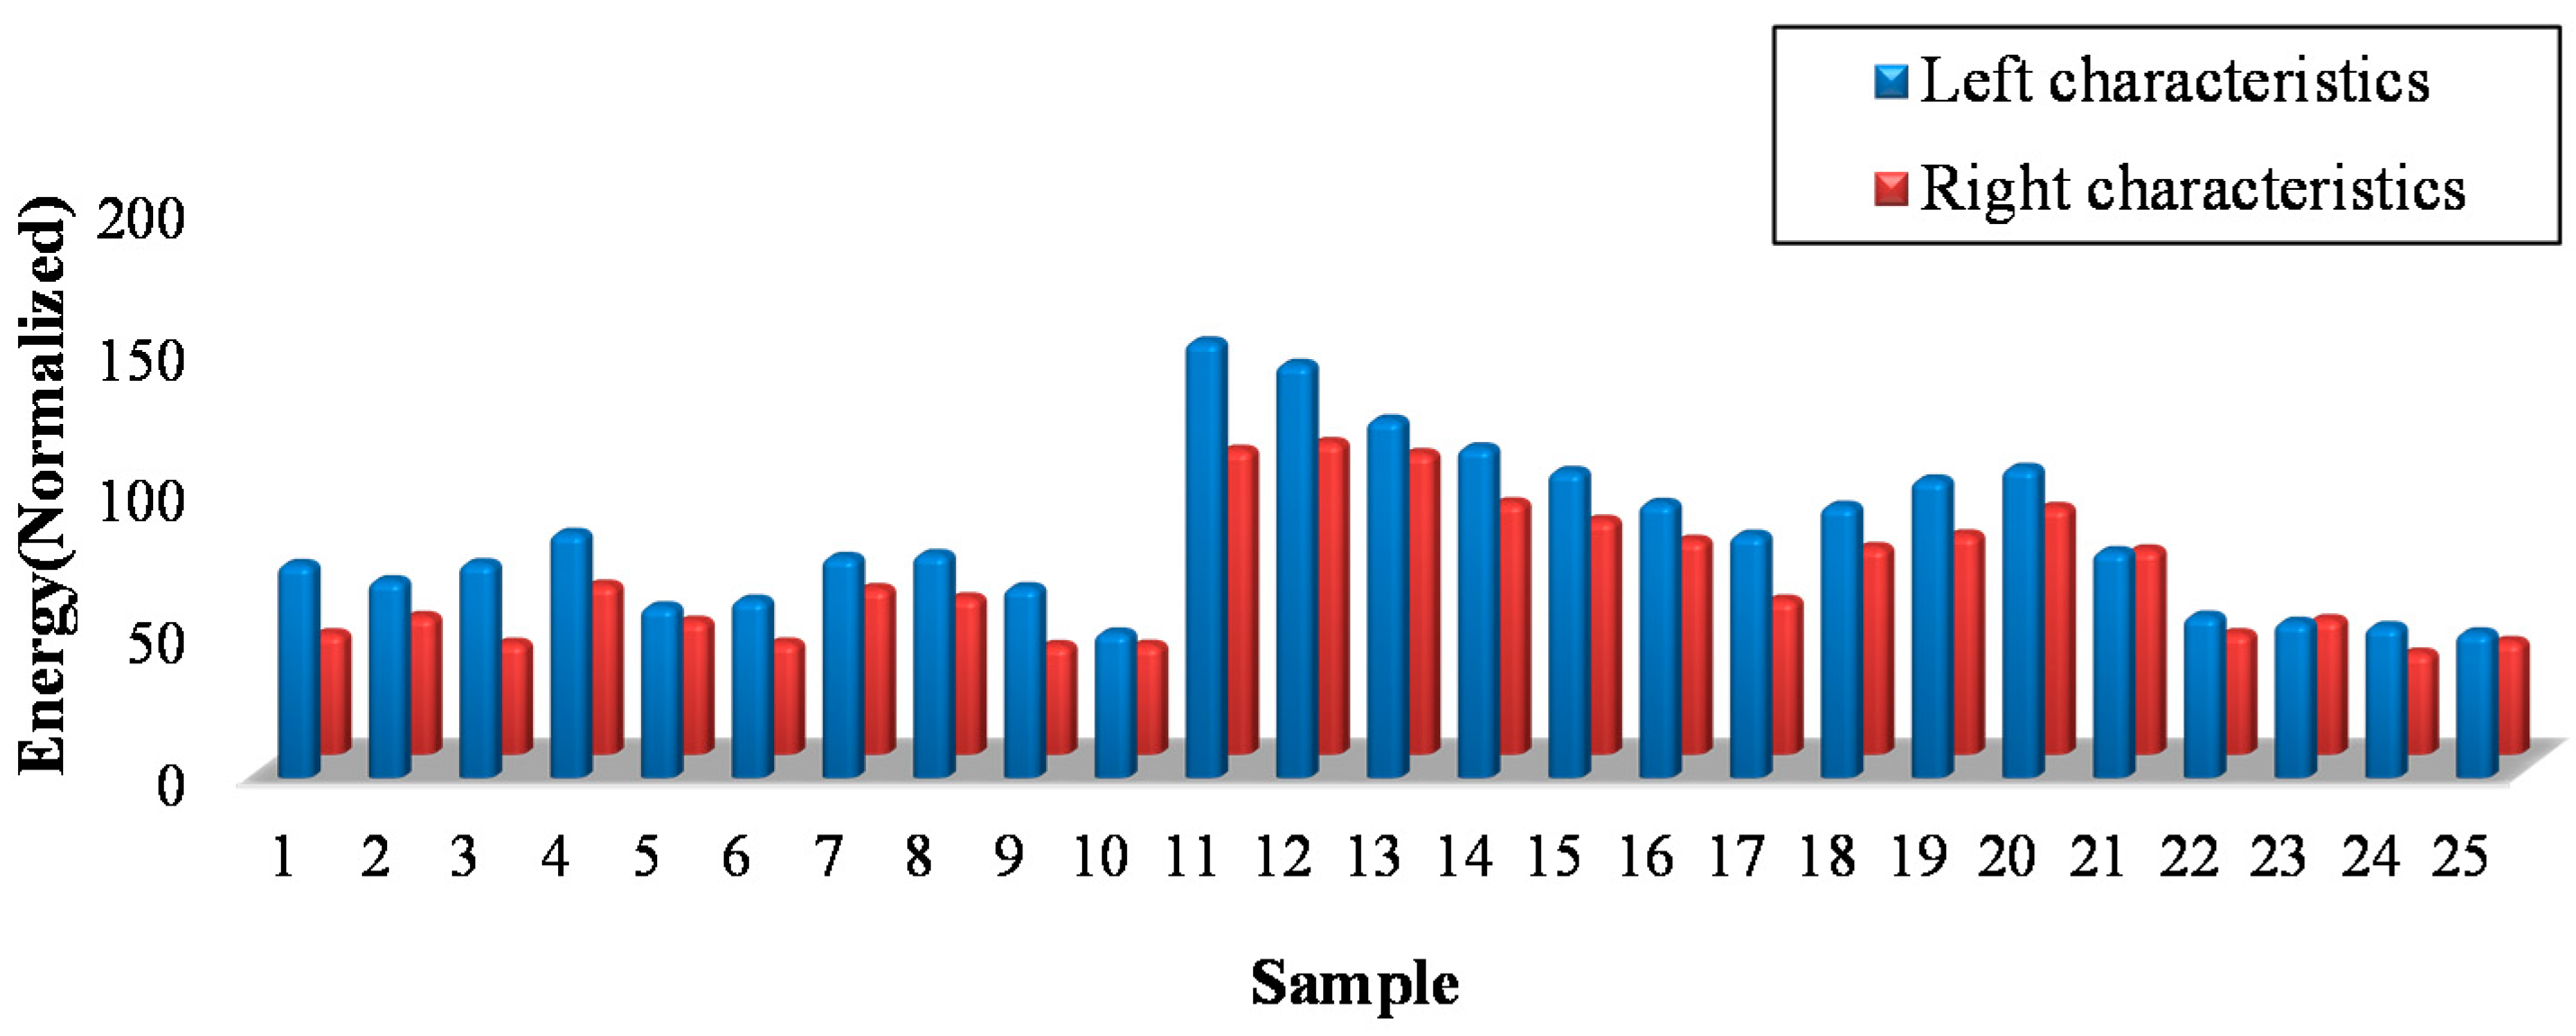
5.2. Establishment of Database

Using the motor’s corresponding motor load specification, the line currents of the normal motor and the abnormal motor were measured respectively at full load. The duration of each sample is a 1-s record, taken every 90 min with 10 kHz sample rates. The steps above were repeated until the number of training samples and test samples both have 50 recordings in the database, and each of which has 25 normal motor samples and 25 rotor failure samples. Figure 12 shows an example of the current analysis using fast Fourier transform. The amplitude of the current waveform is 9. The left-side and right-side characteristic energy are 752.4 and 426.2 for 54Hz and 66Hz respectively.

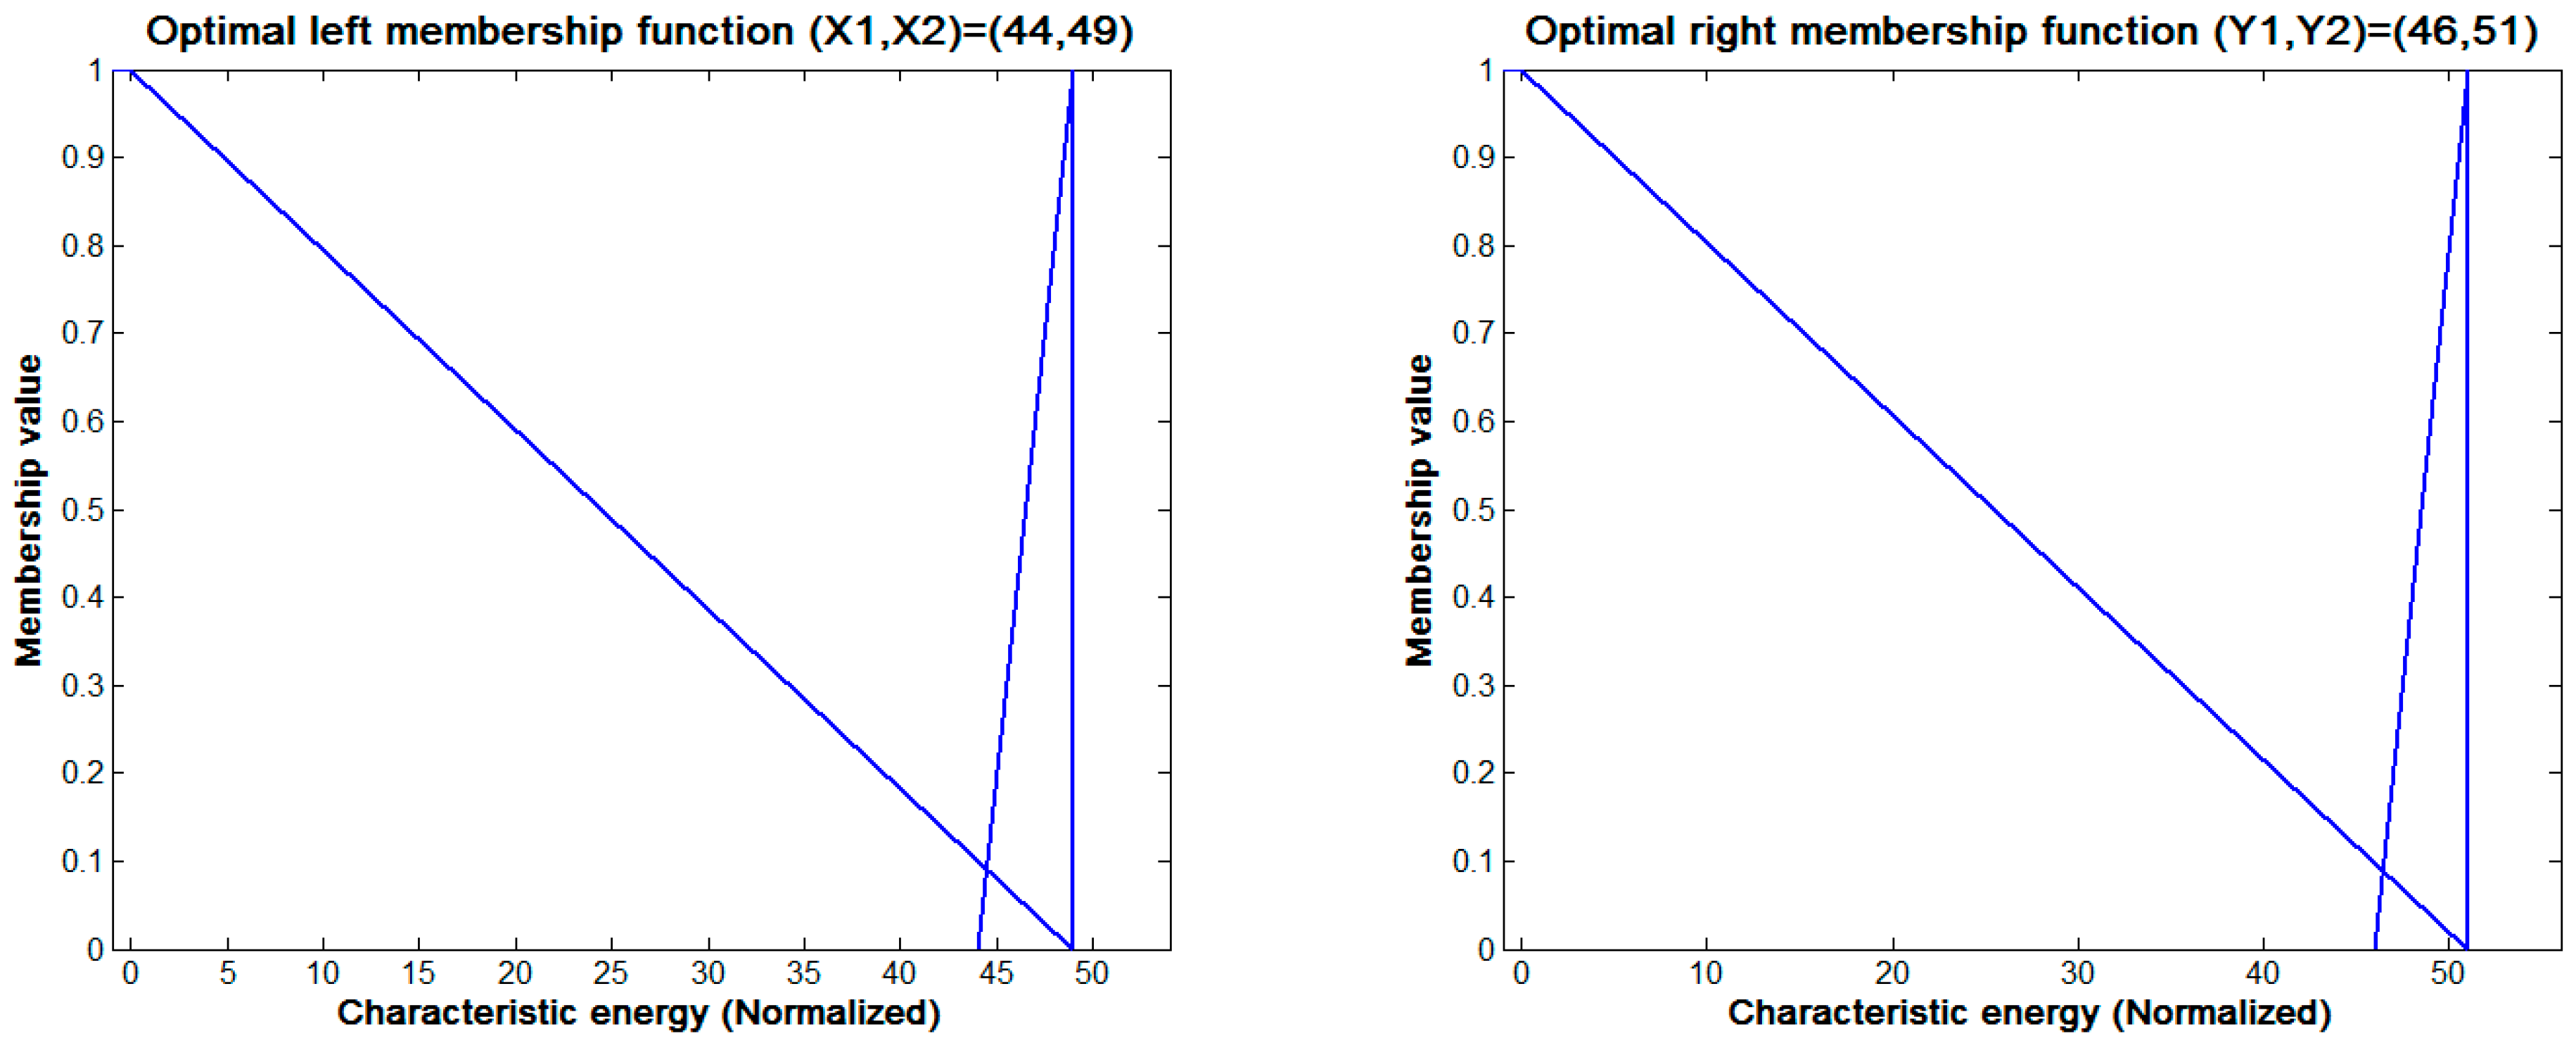
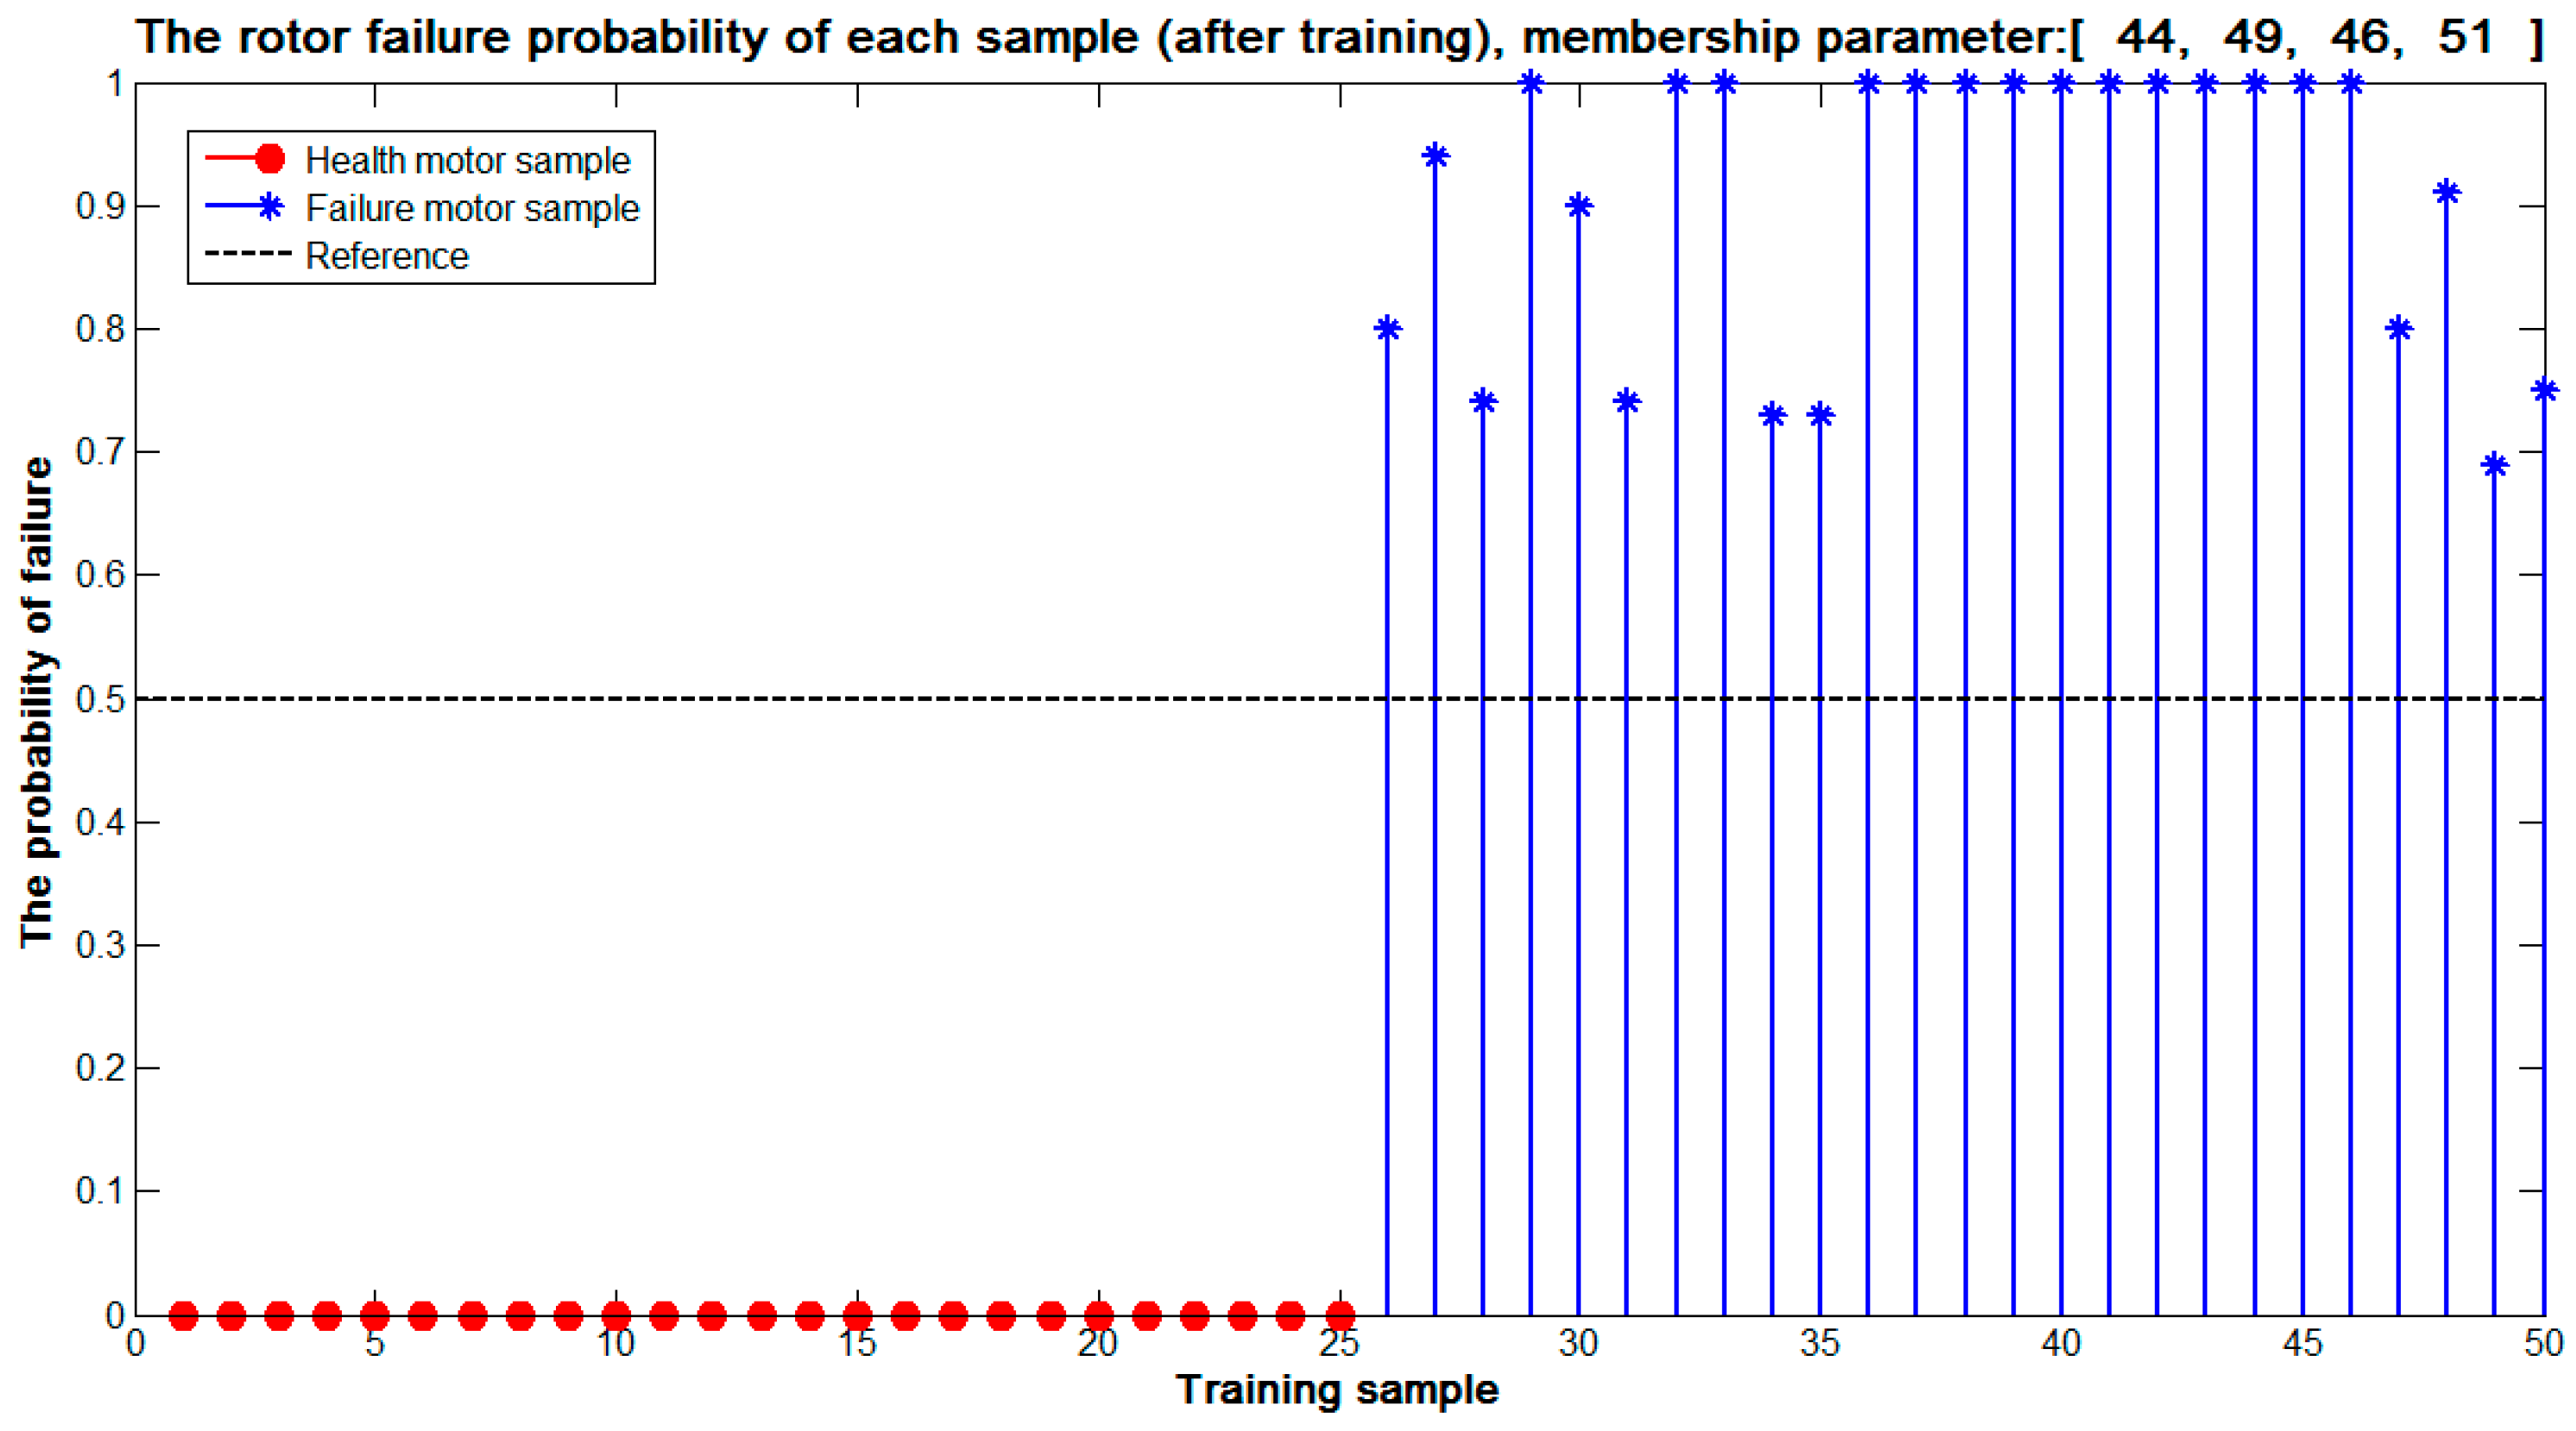
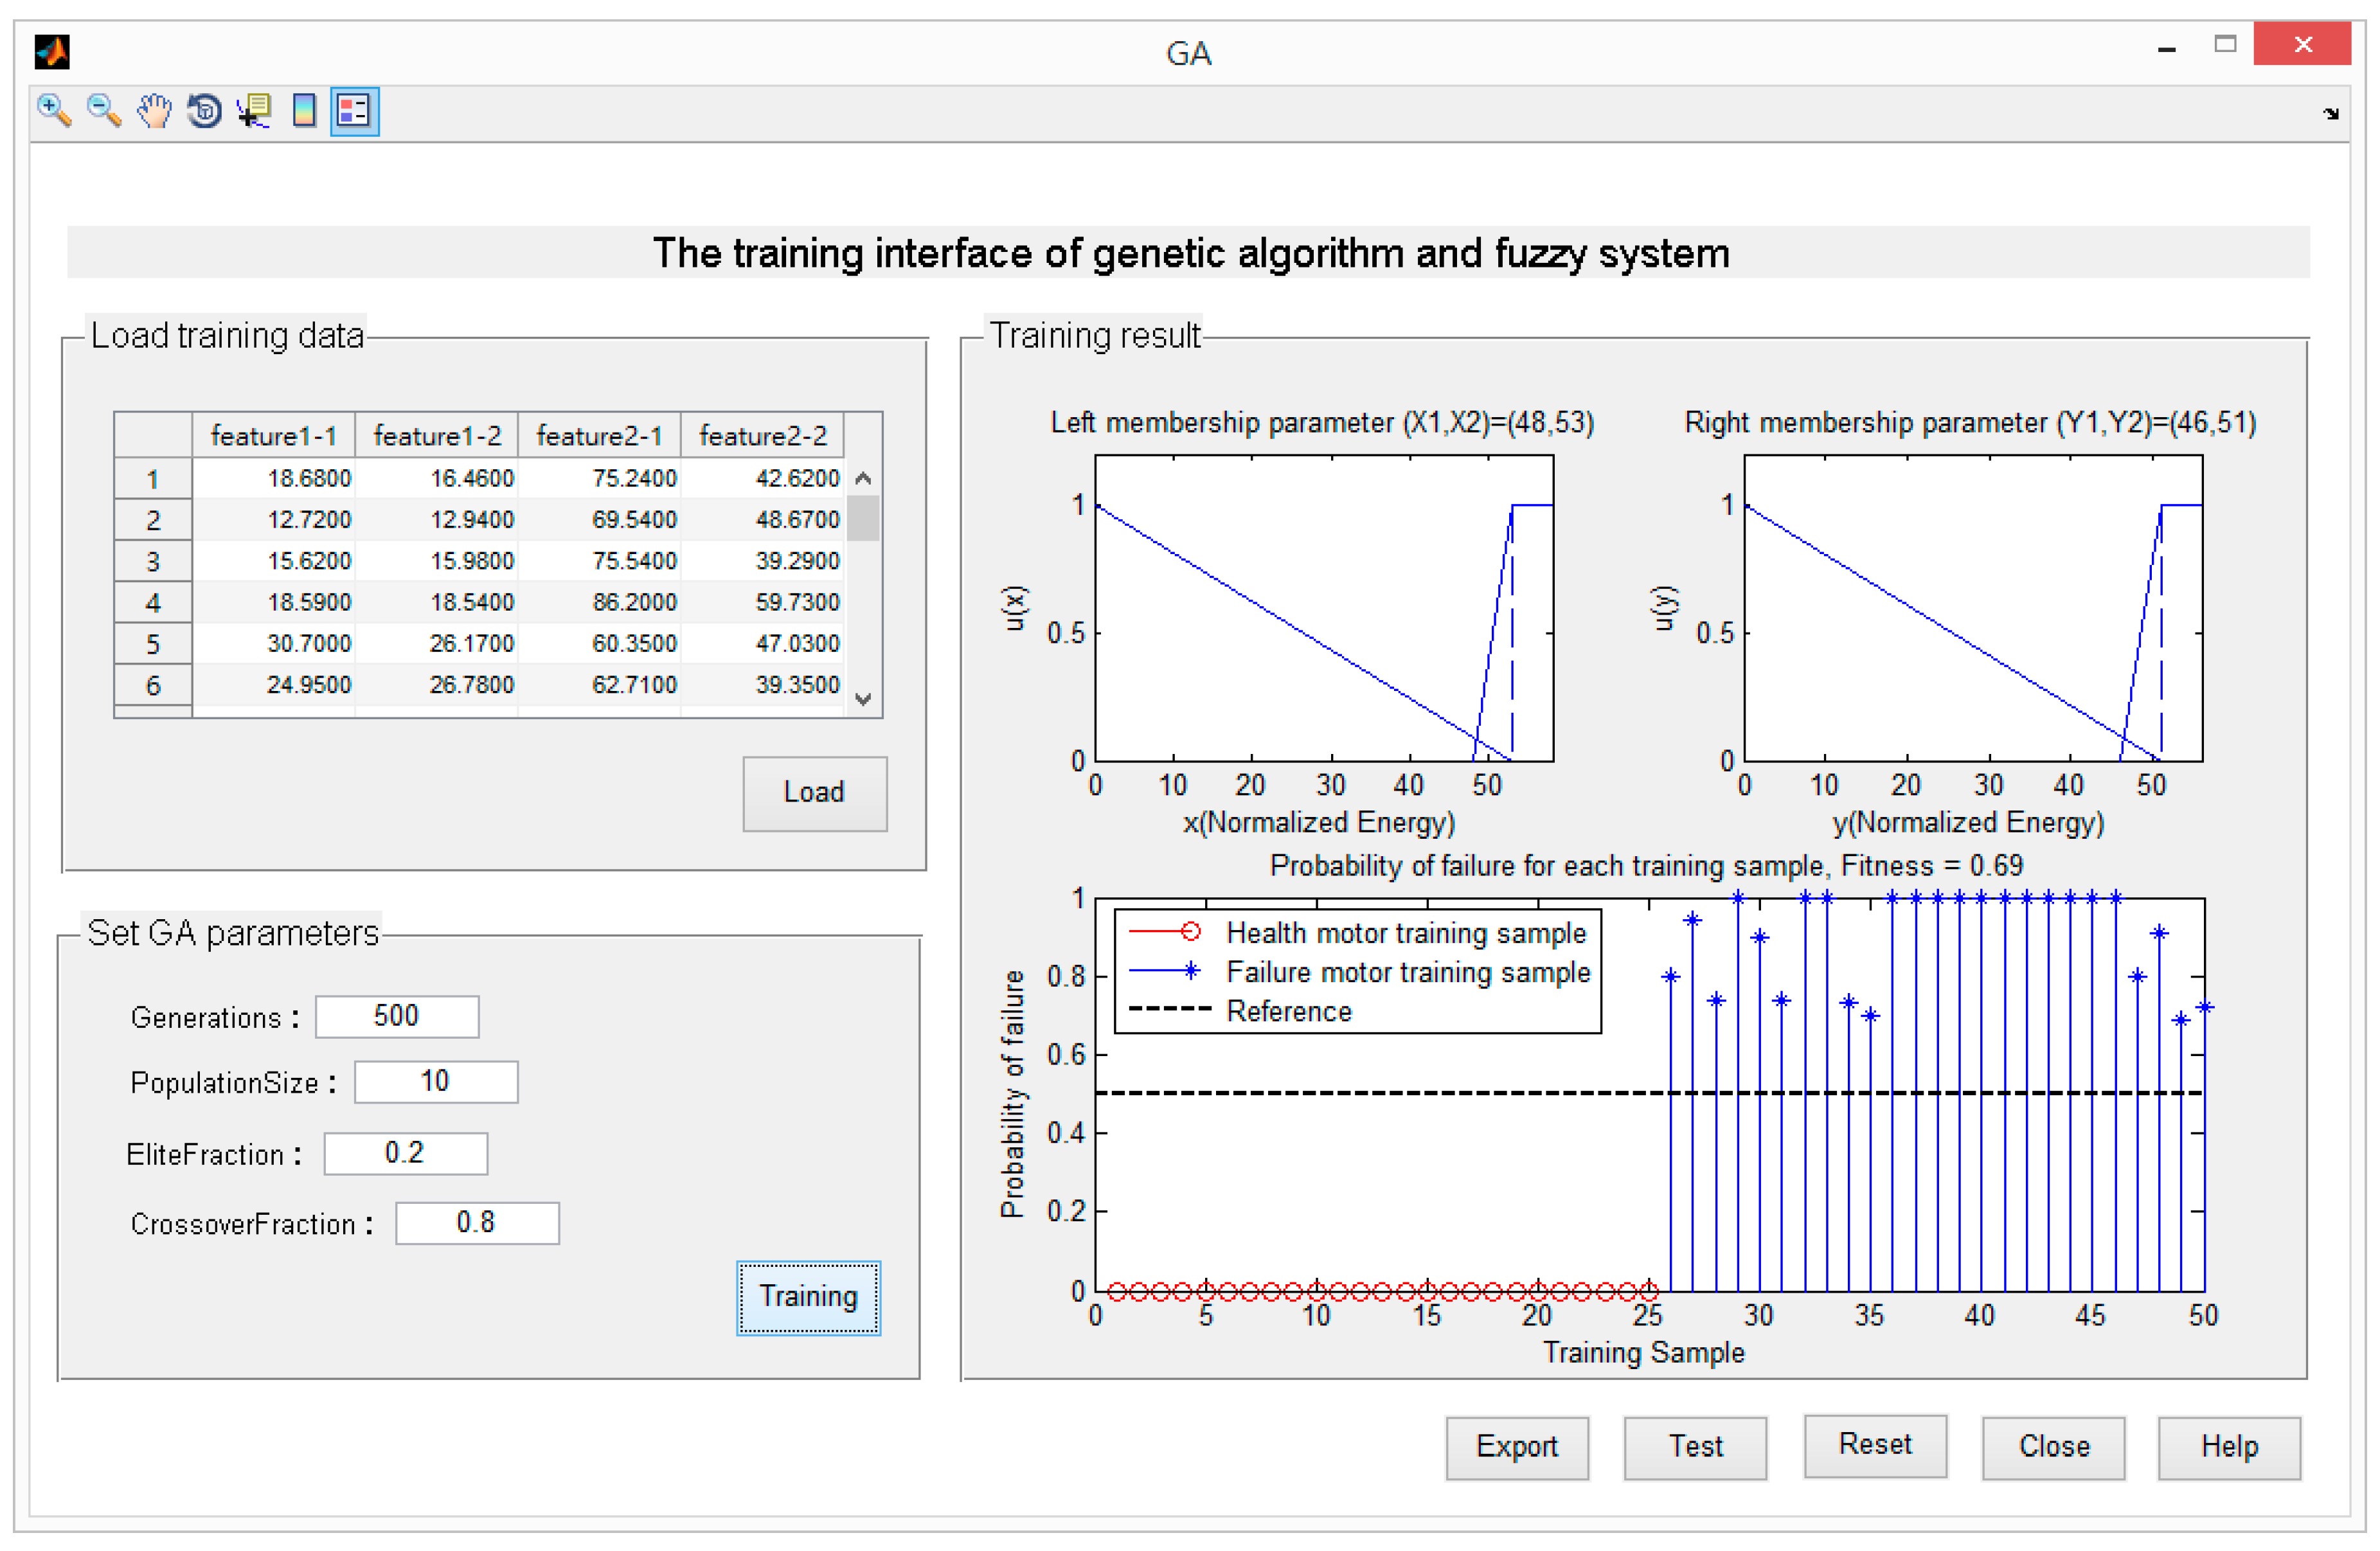
5.3. Optimization of Membership Function

This section uses selected training samples to search for the best membership function with the genetic algorithm. The data distribution of the observed training samples, in Figure 13 and Figure 14, shows that the frequency response of the left and right feature points in a normal motor is much smaller than that of an abnormal motor. Furthermore, the energy of the left-side frequency of an abnormal motor is higher than that of the right side. Above all, the scope of the input membership parameters is already estimated and the results will be the reference for generating genetic individuals.
The genetic algorithm proposed in this research is programmed to do 500 optimization searches in training samples. The optimal result of the membership function is shown in Figure 15, where the left and right membership parameters X1, X2, Y1, and Y2 are 44, 49, 46, and 51, respectively. The reason for the left and right membership functions looking so similar is that the overlap between energy ranges of the healthy motor and failure motor in both left and right characteristic frequencies are close in range; the left energy of the healthy motor and failure motor are between the ranges of 100–460 and 440–1300, respectively, and the right energy of the healthy and failure motor are between the ranges of 100–455 and 420–1000, respectively. However, the result of membership function is based on a high diagnostic rate of the training samples, as shown in Figure 16. The results verify that the optimization design for membership function proposed in this paper has fully grasped the electrical differences between normal motor and abnormal motor, so the optimization results are applied to subsequent testing.

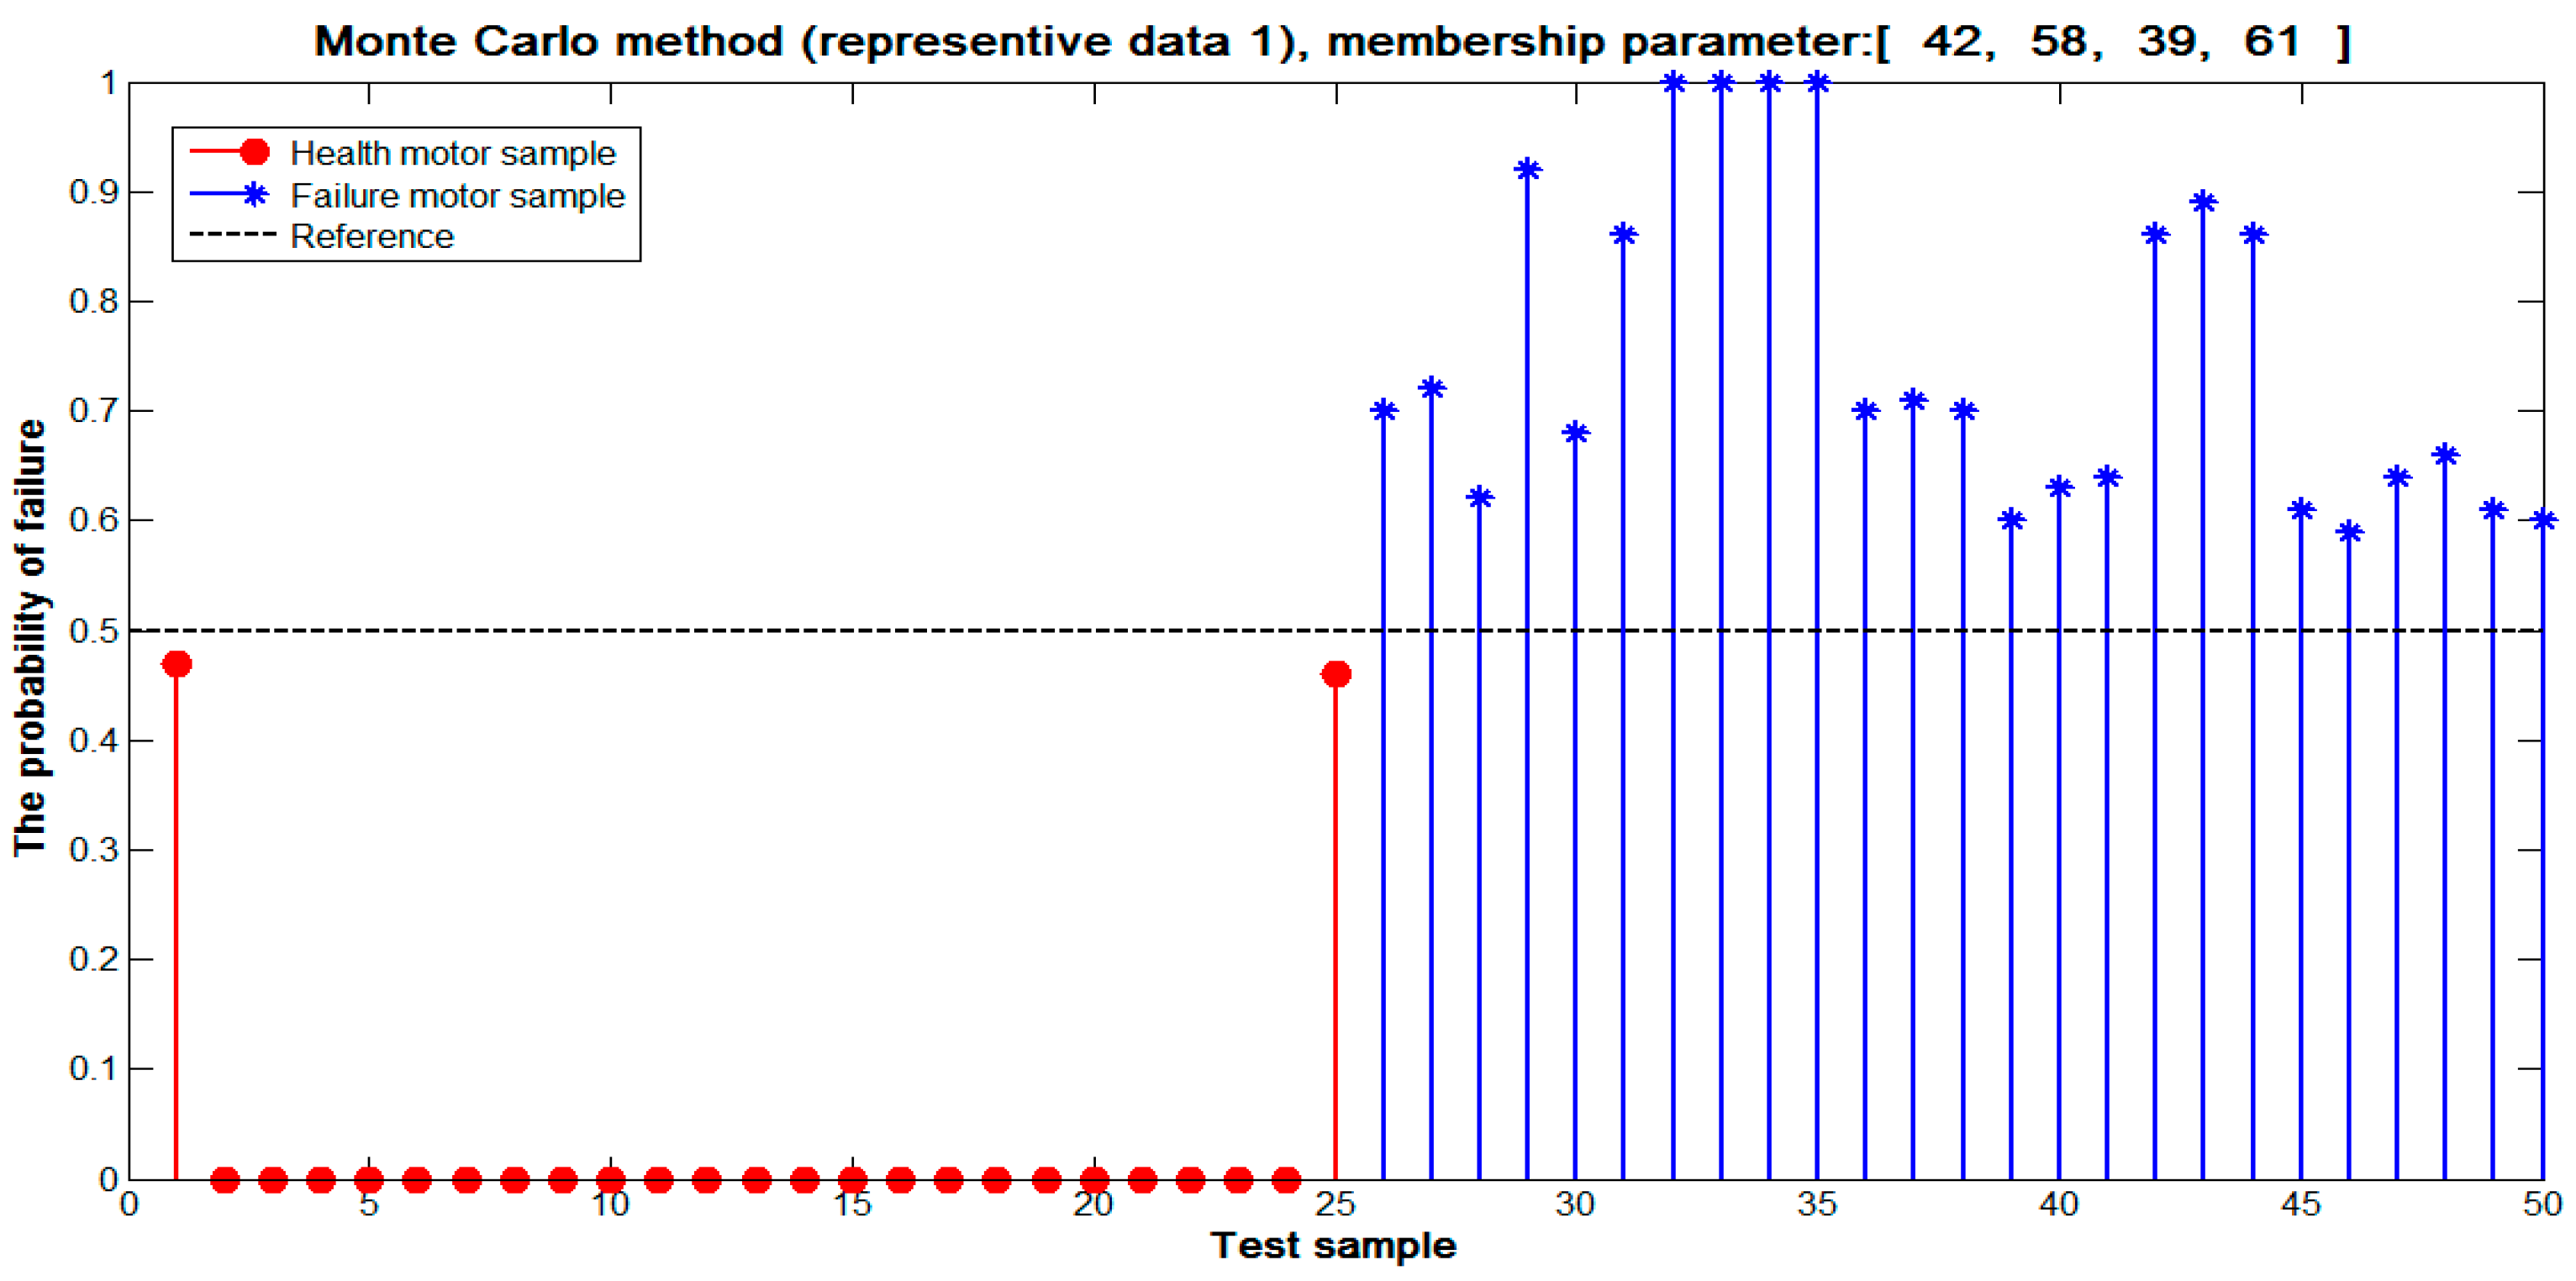
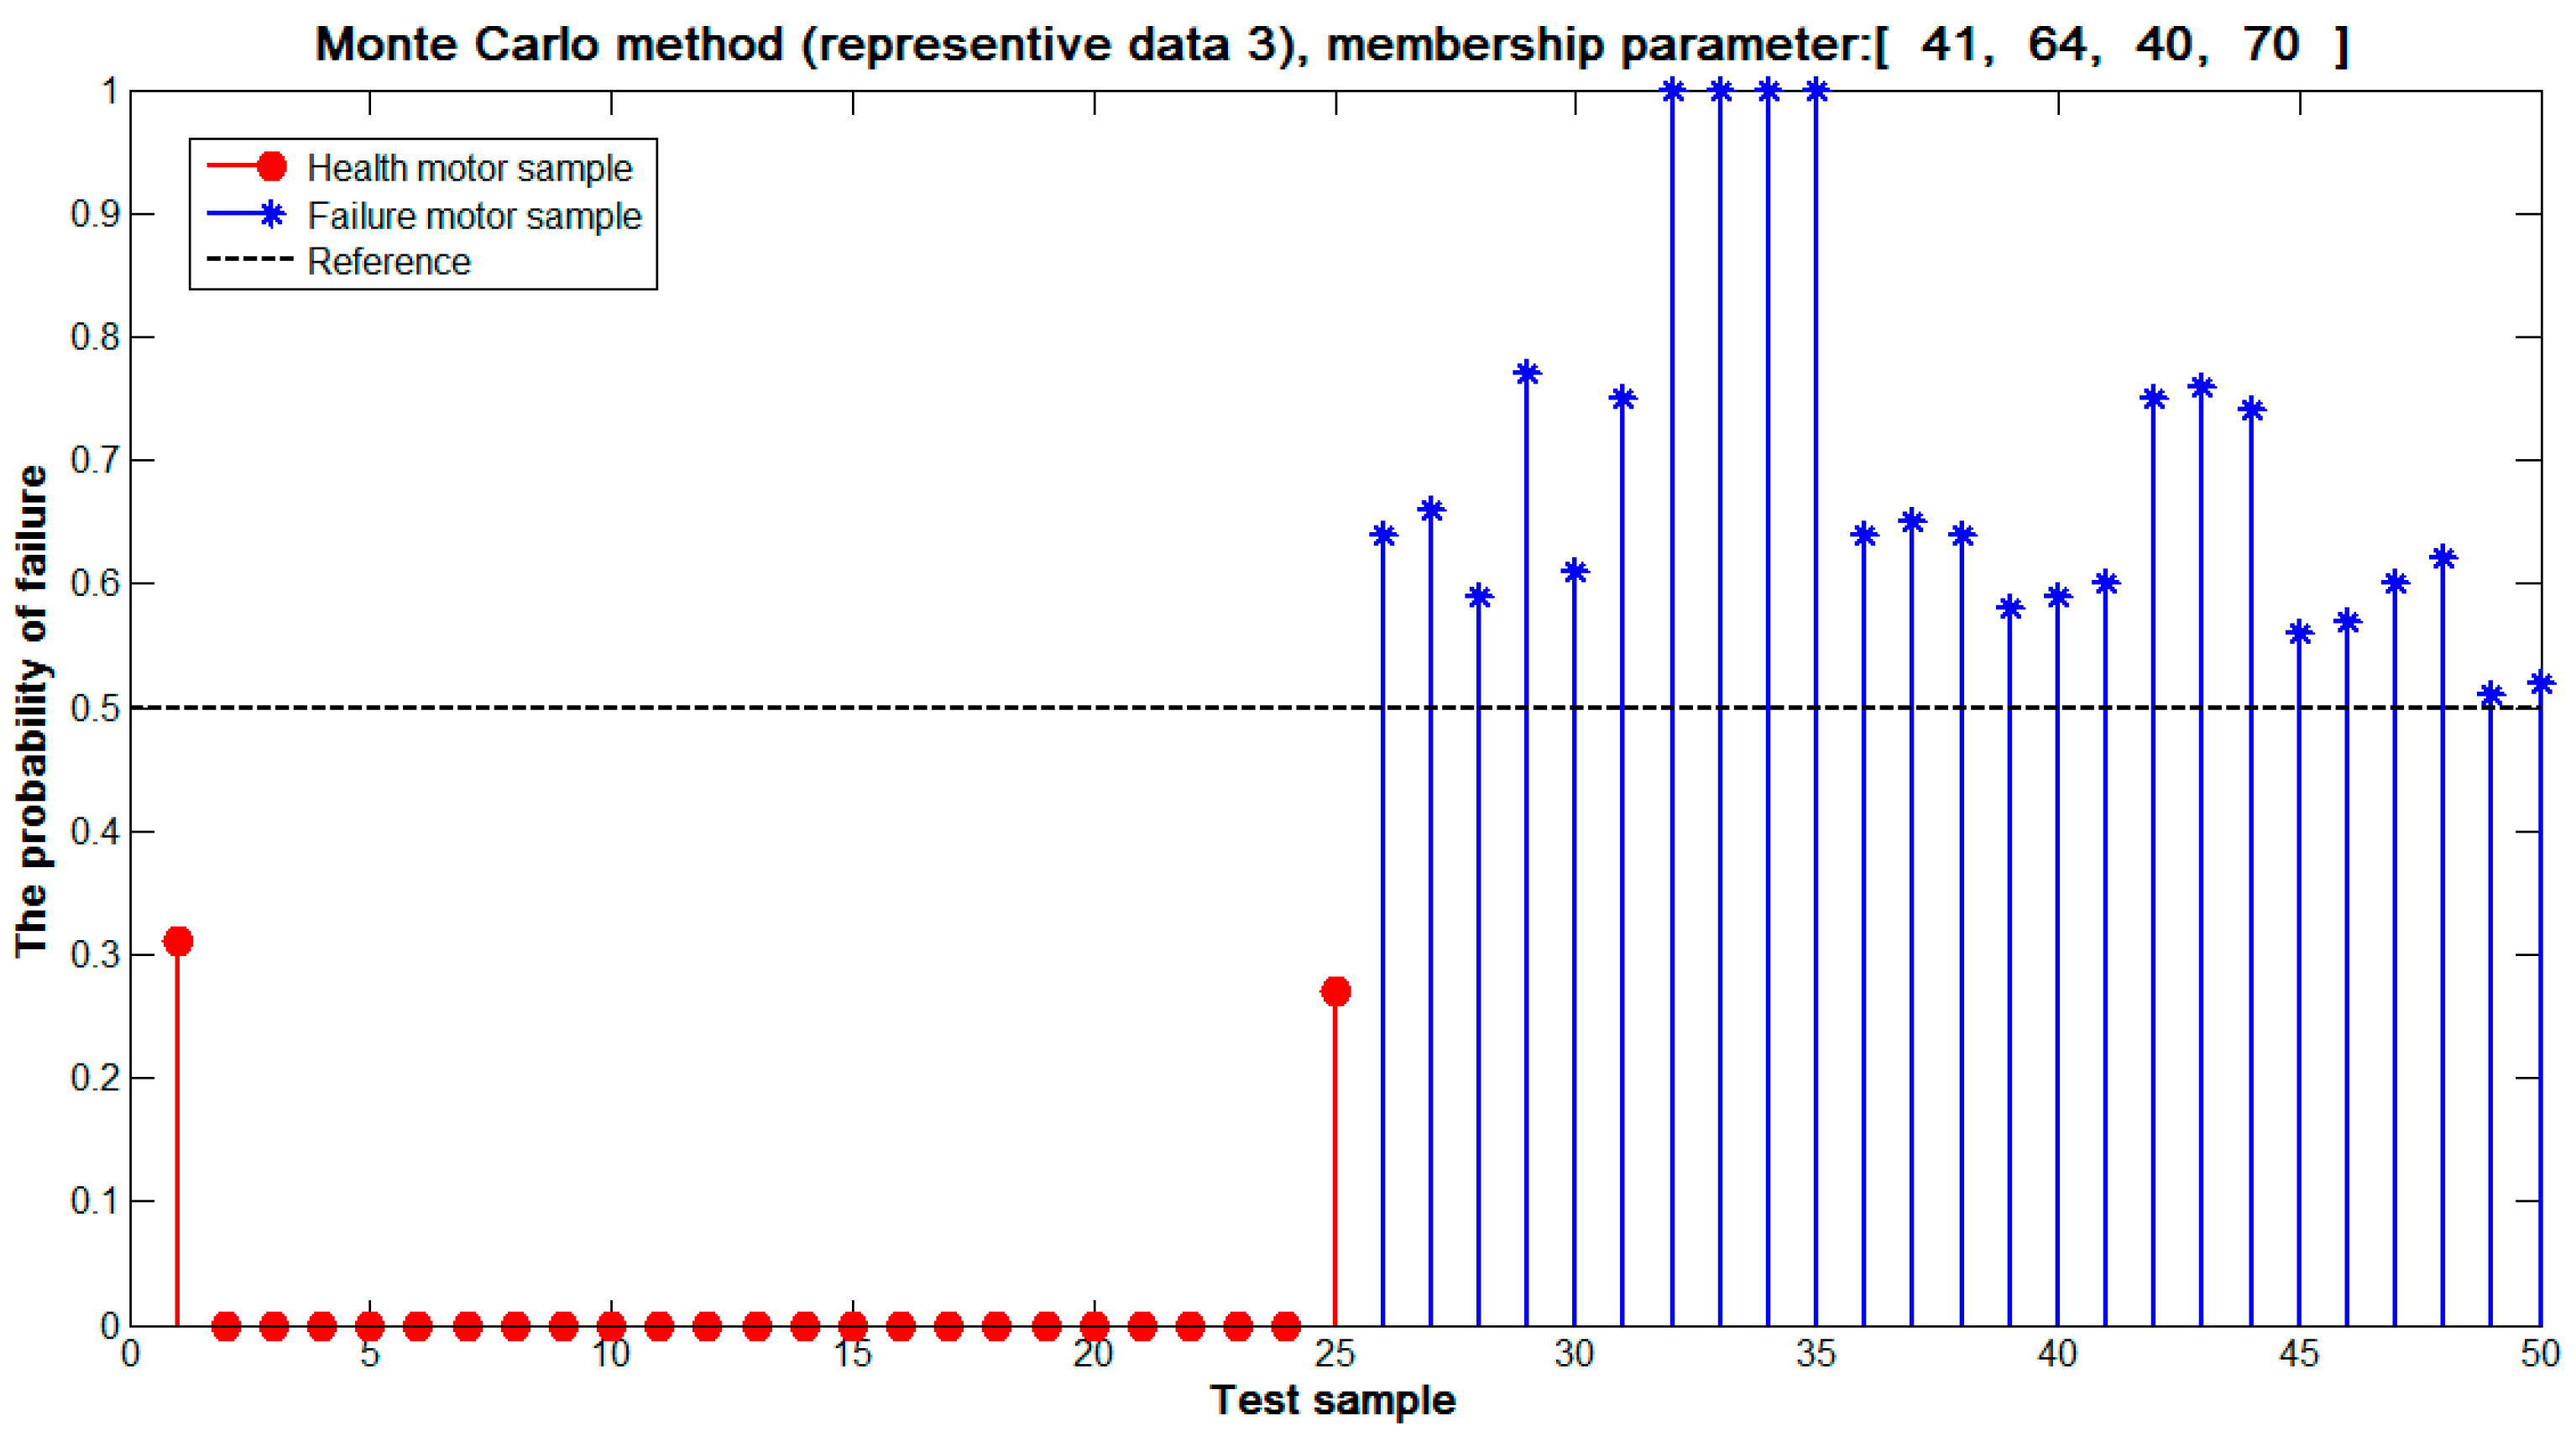
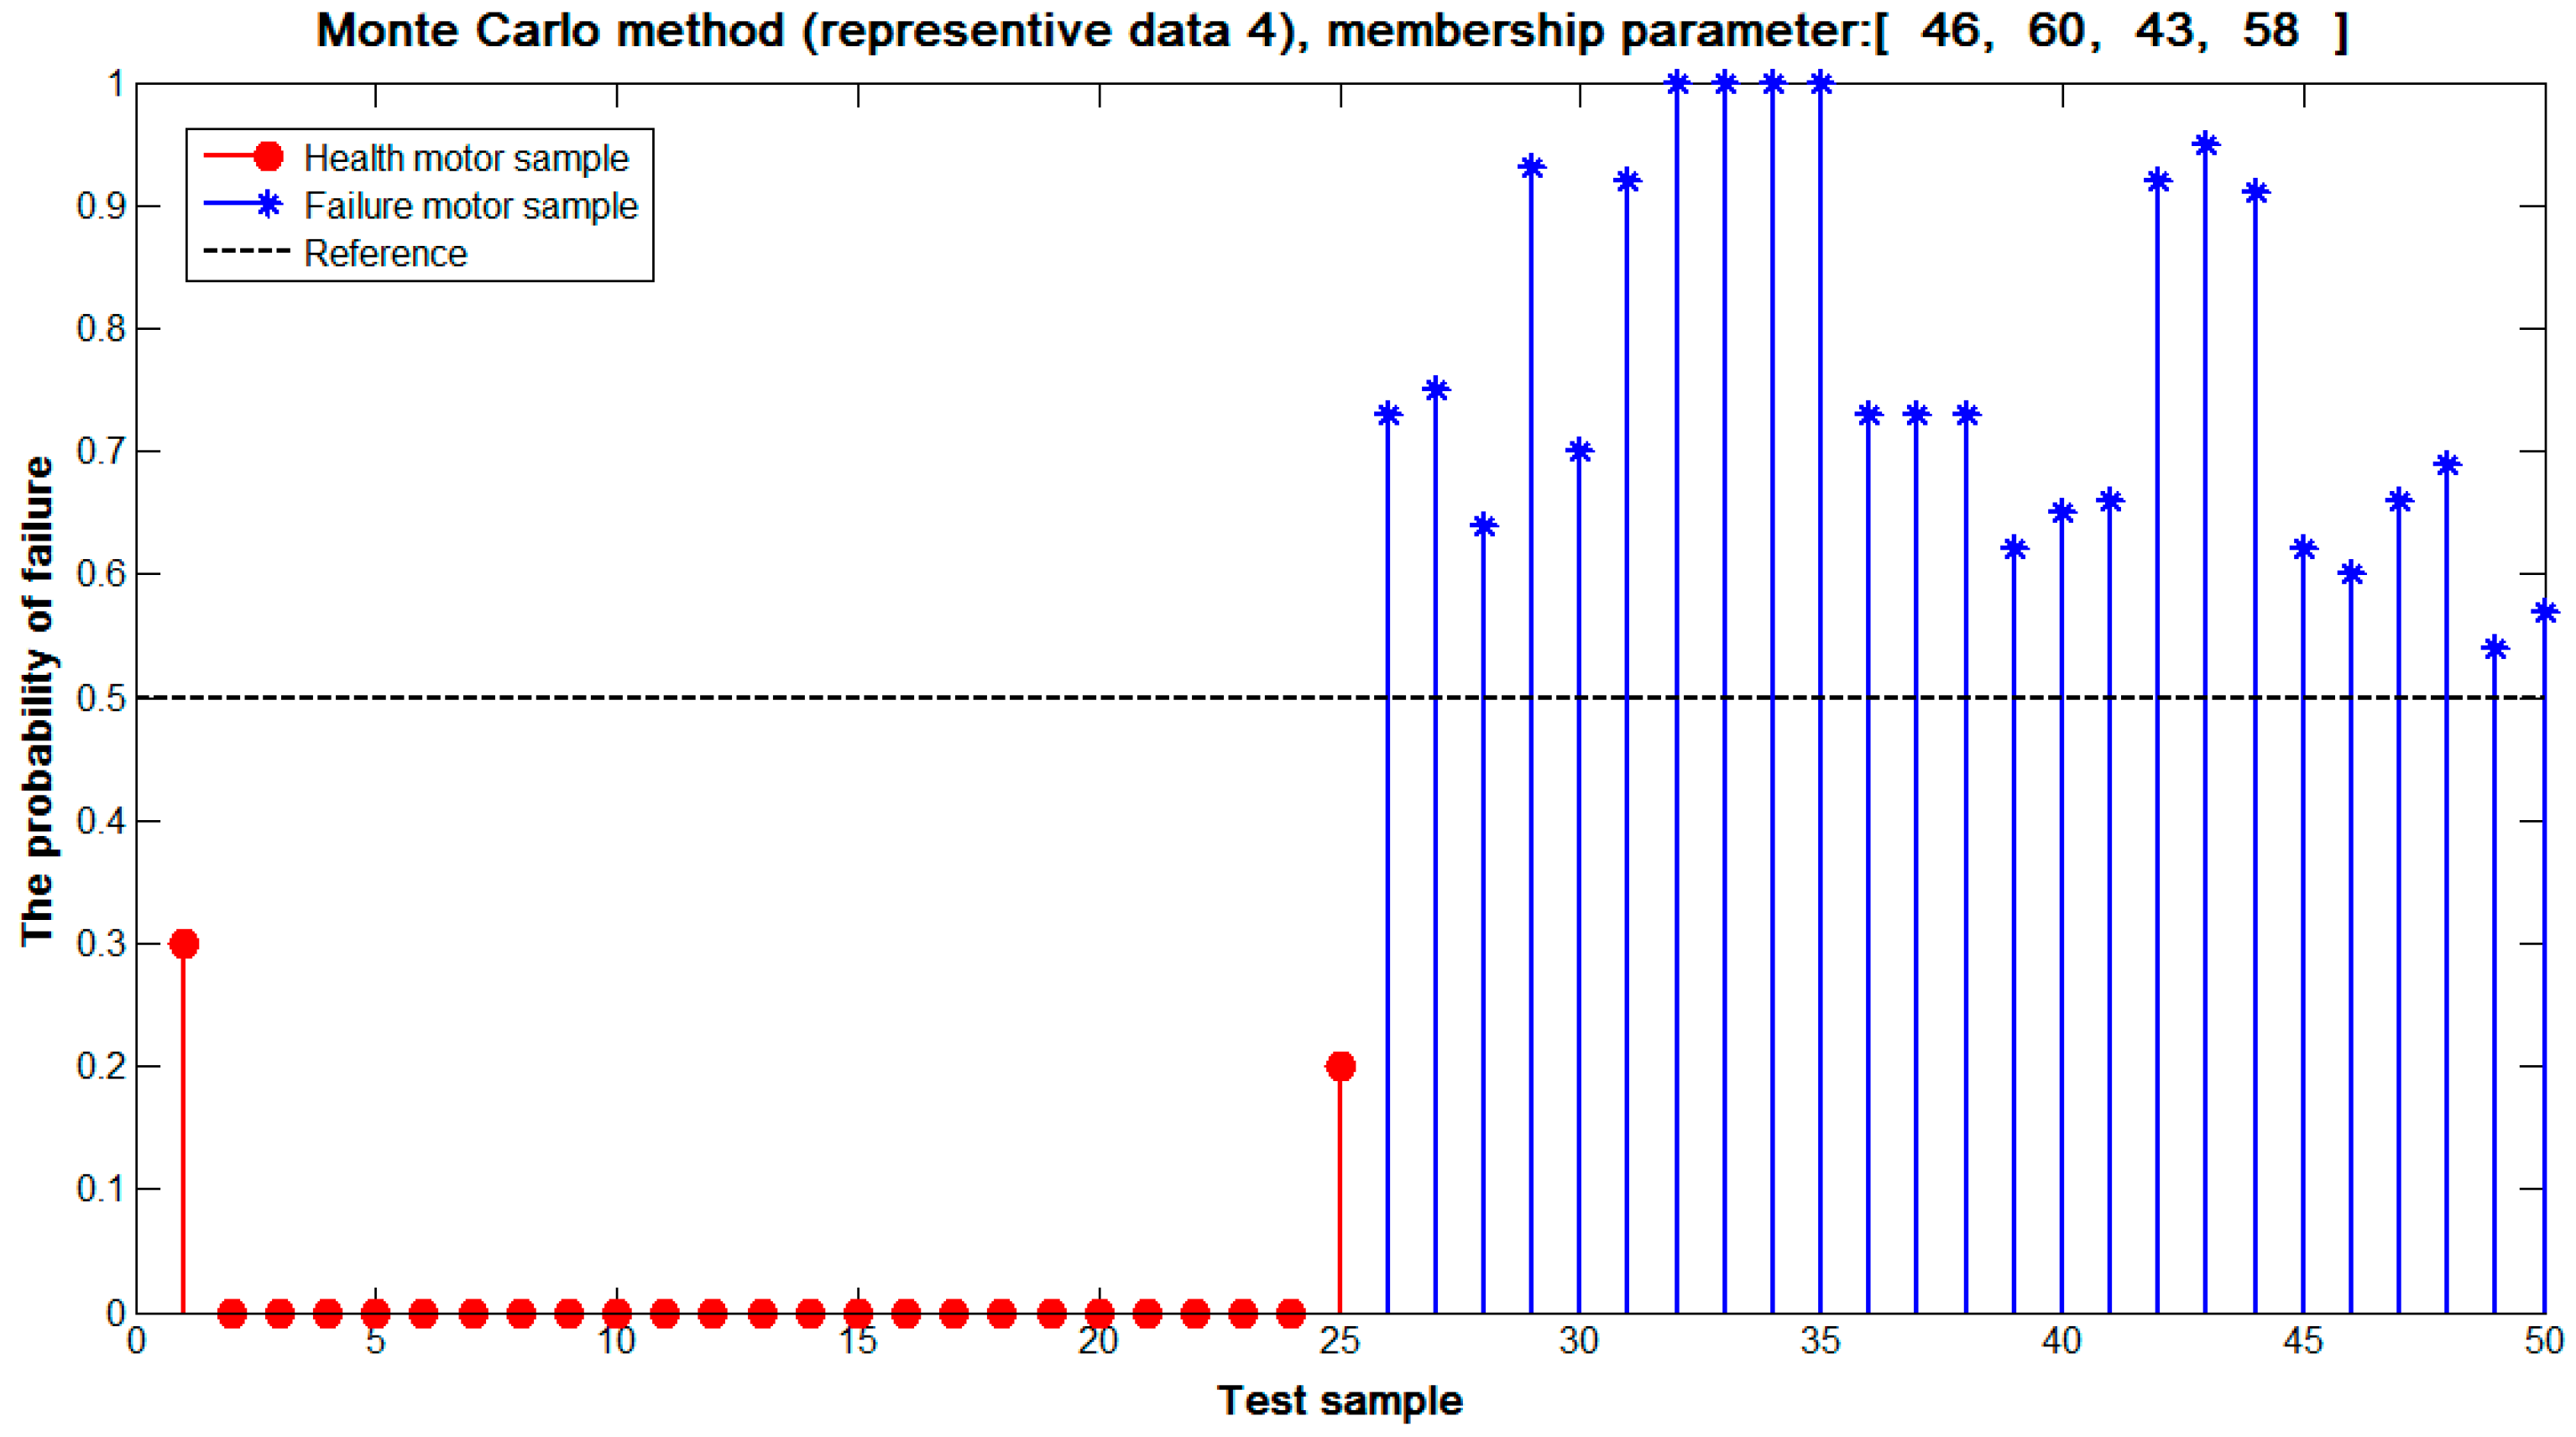
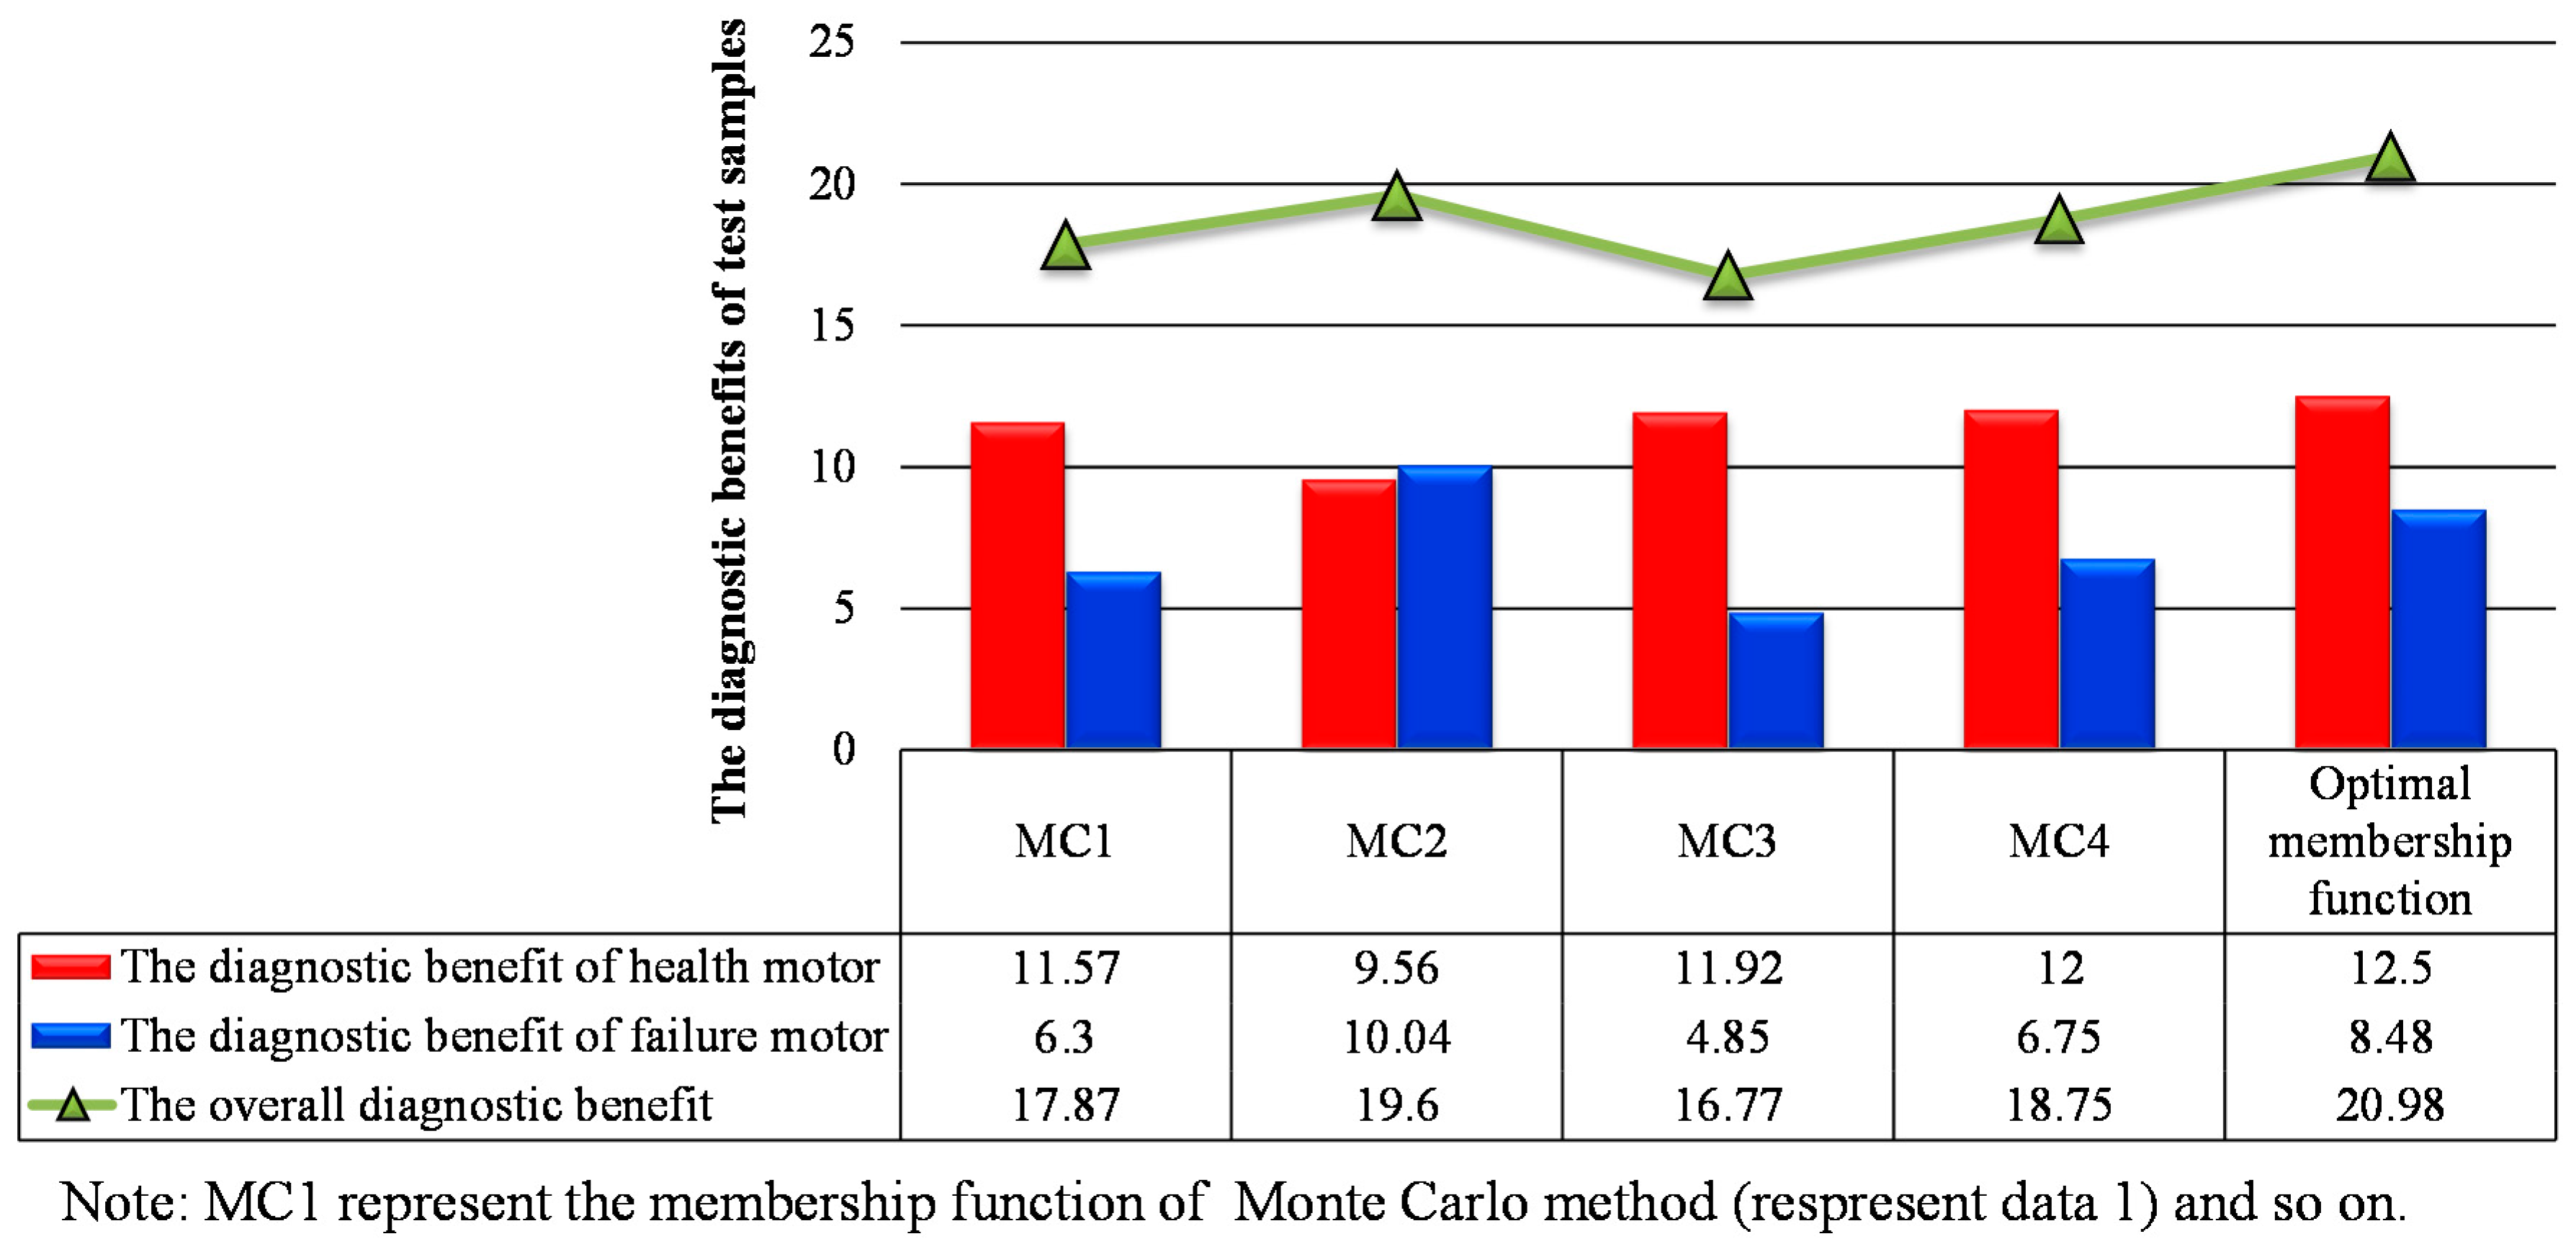
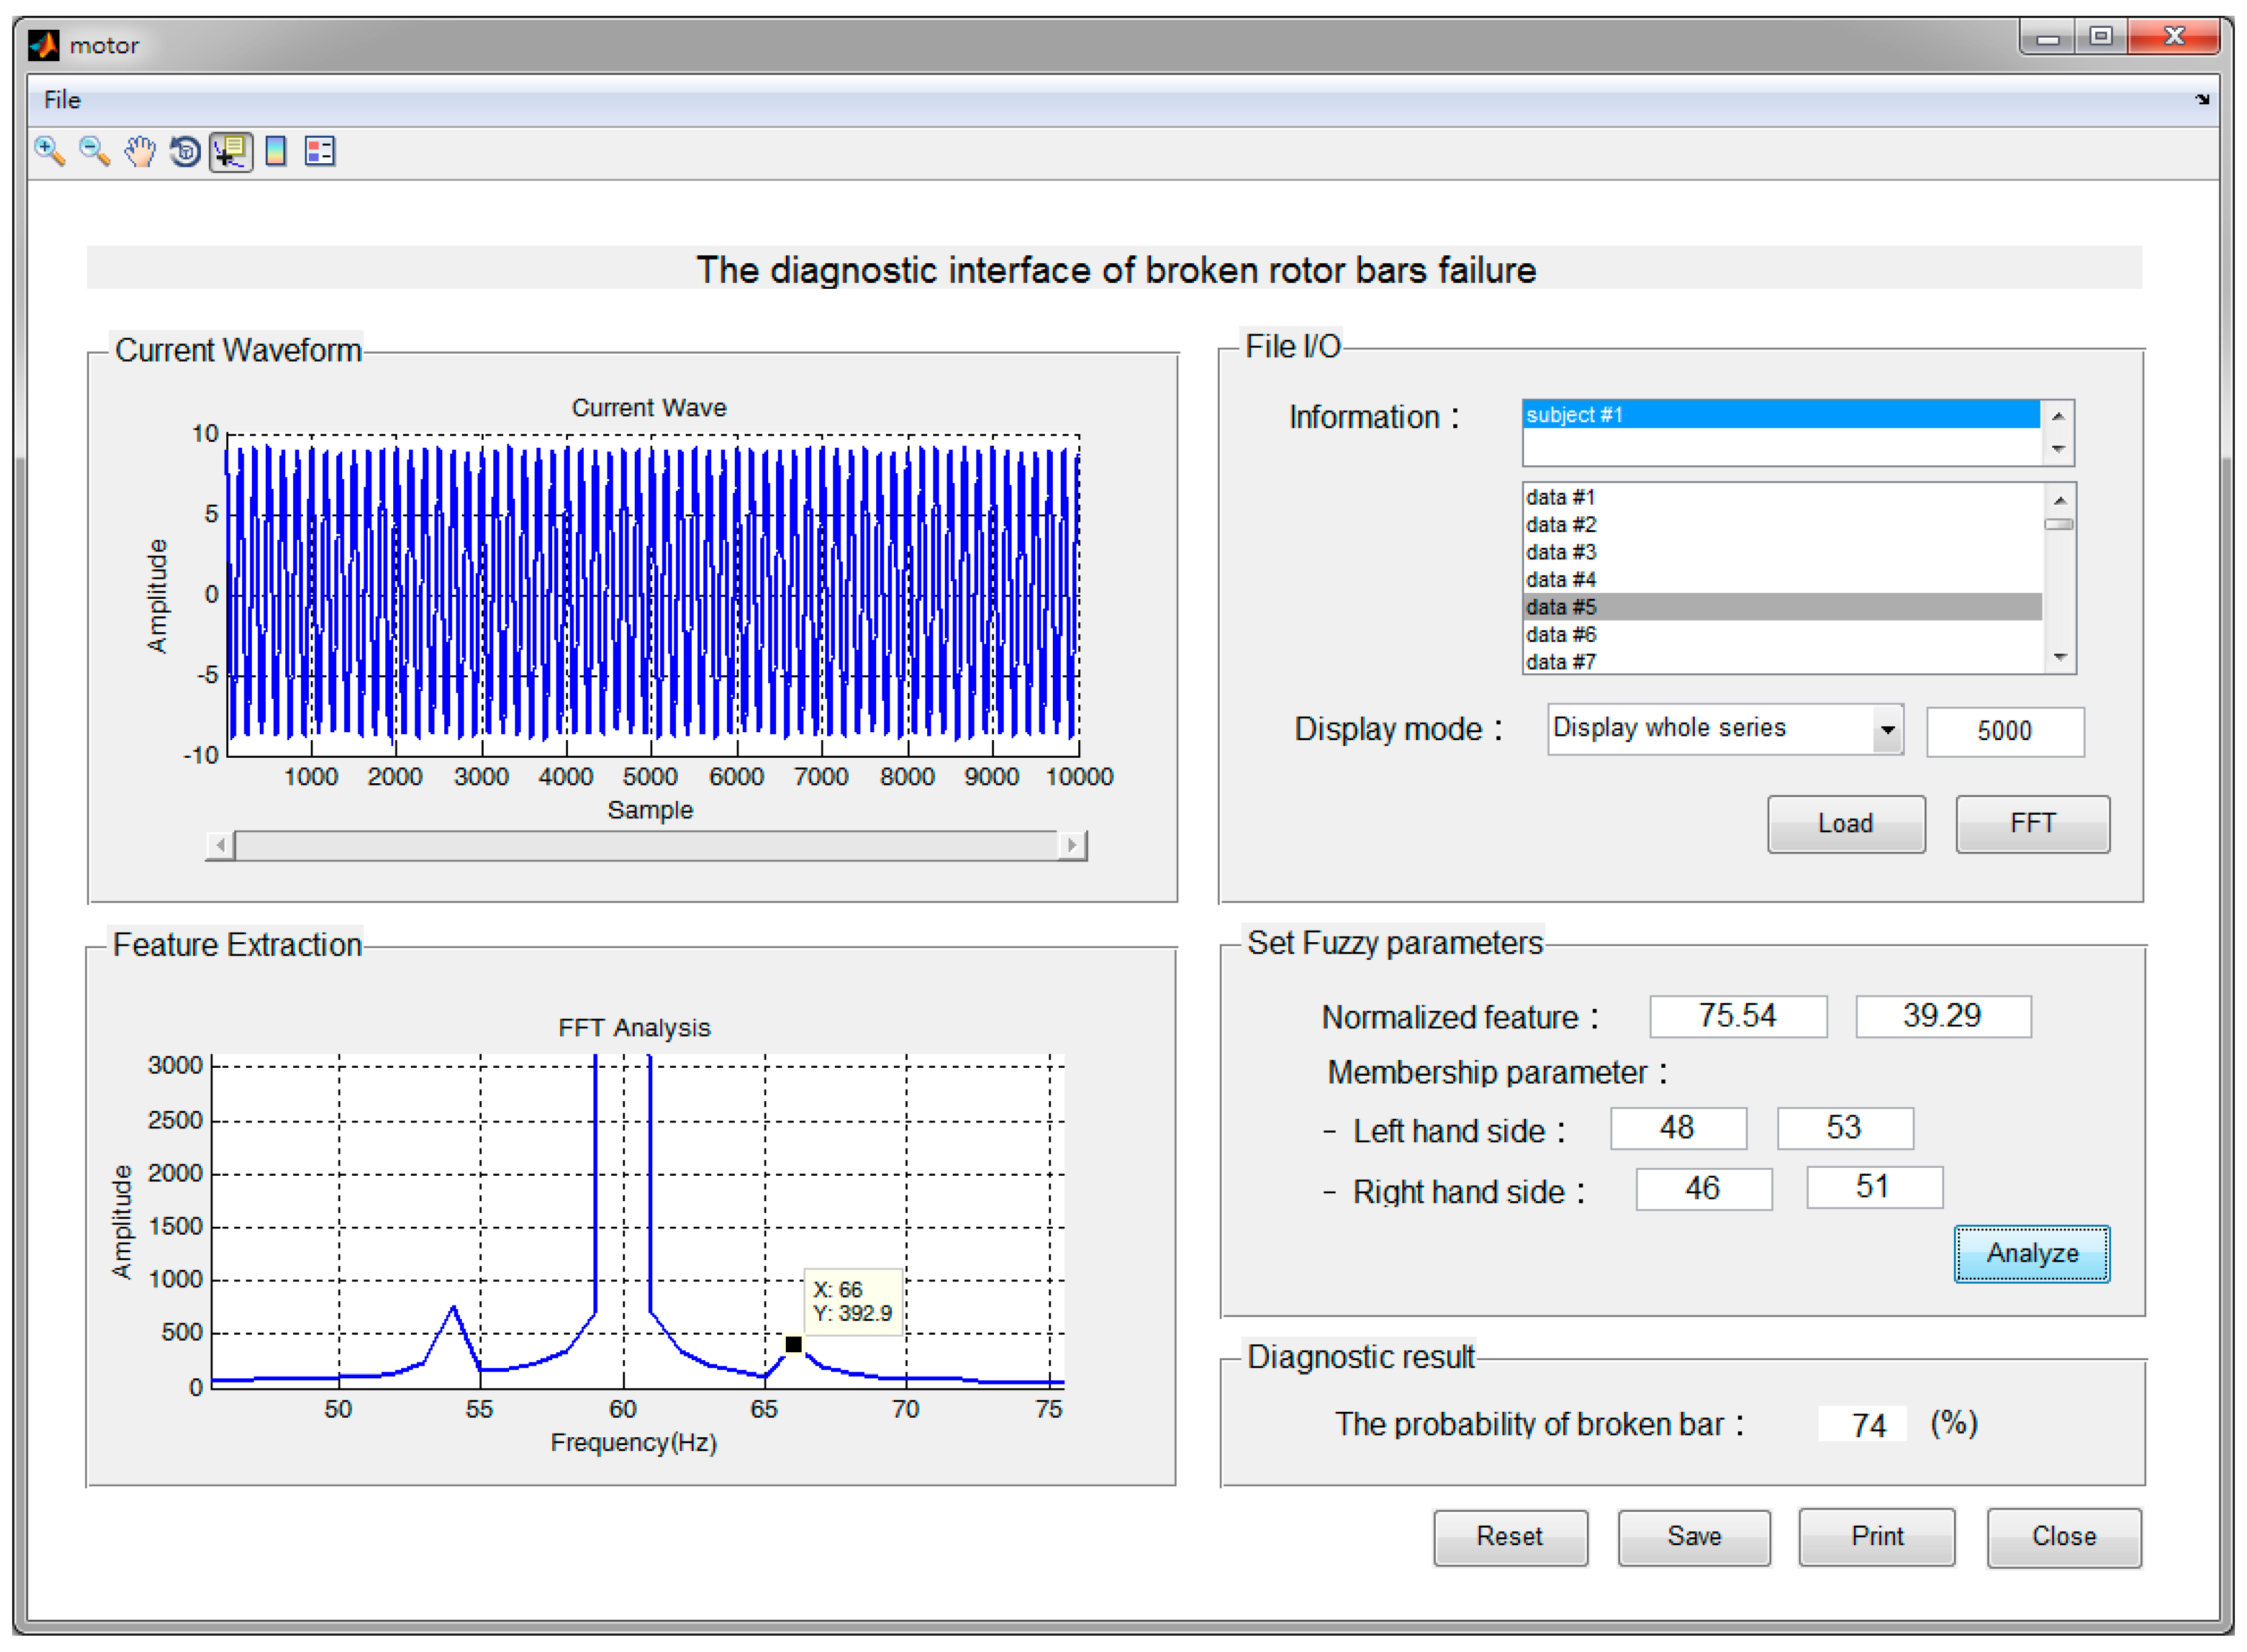
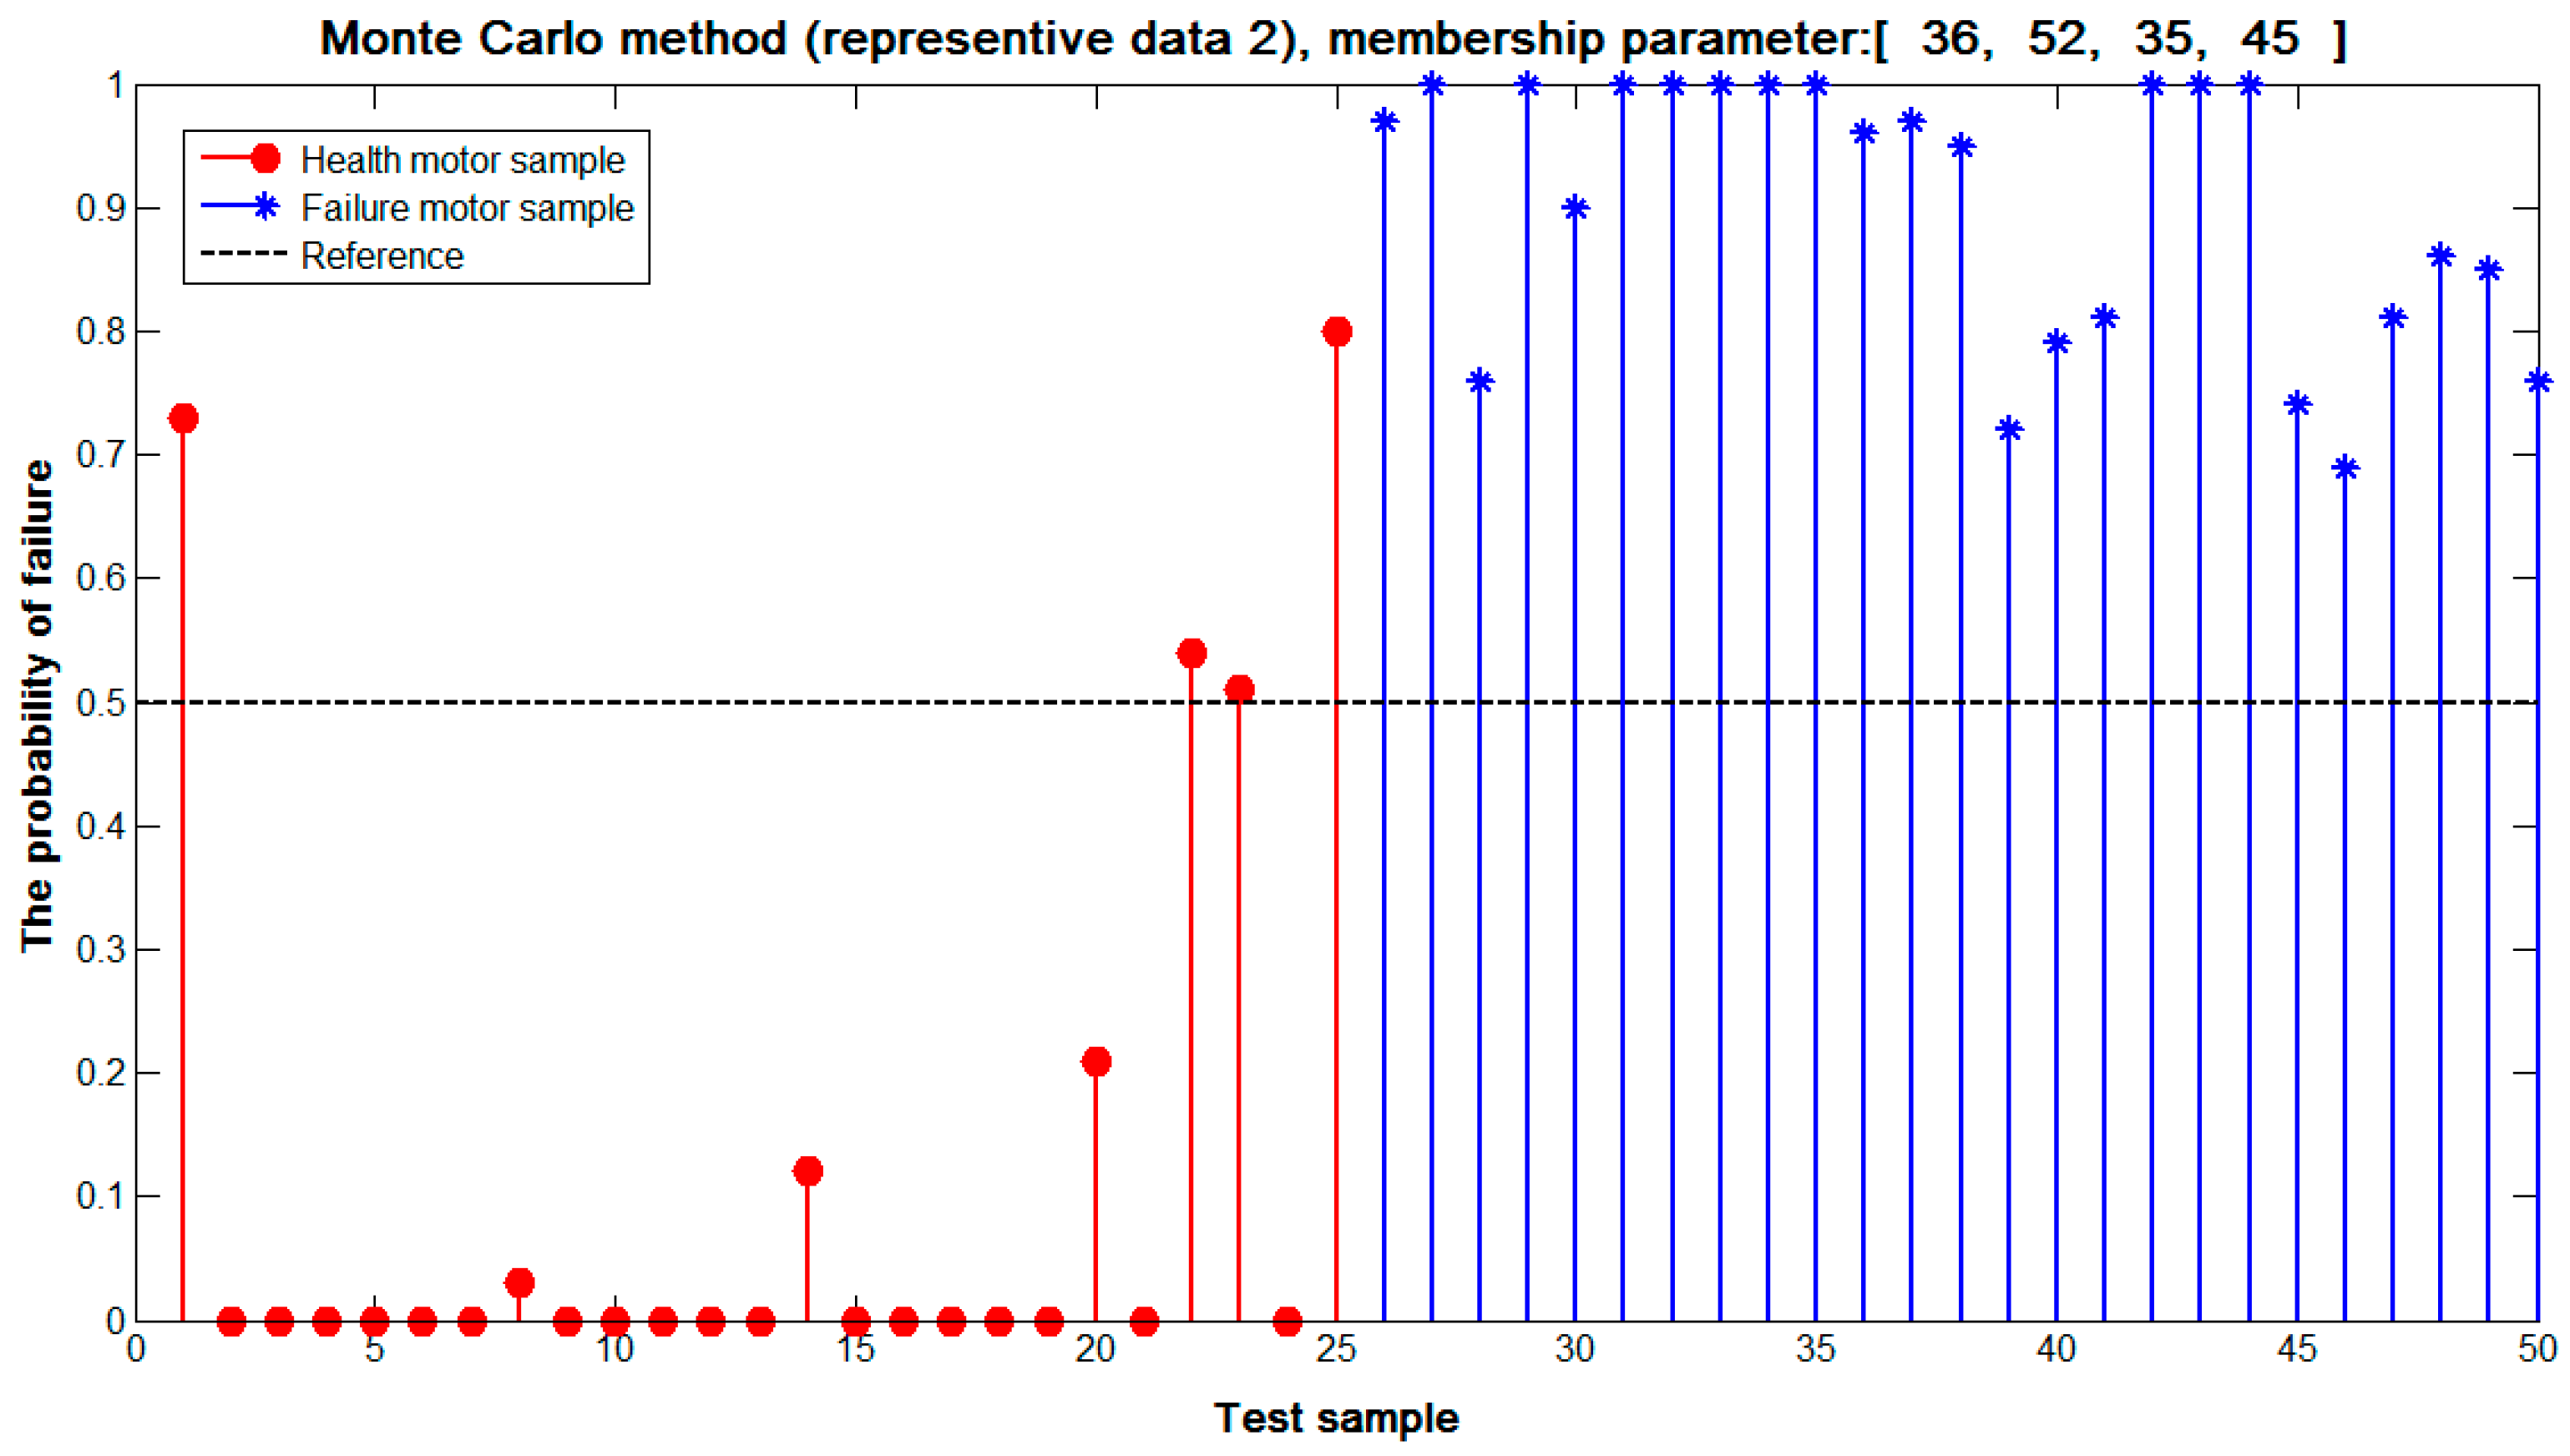
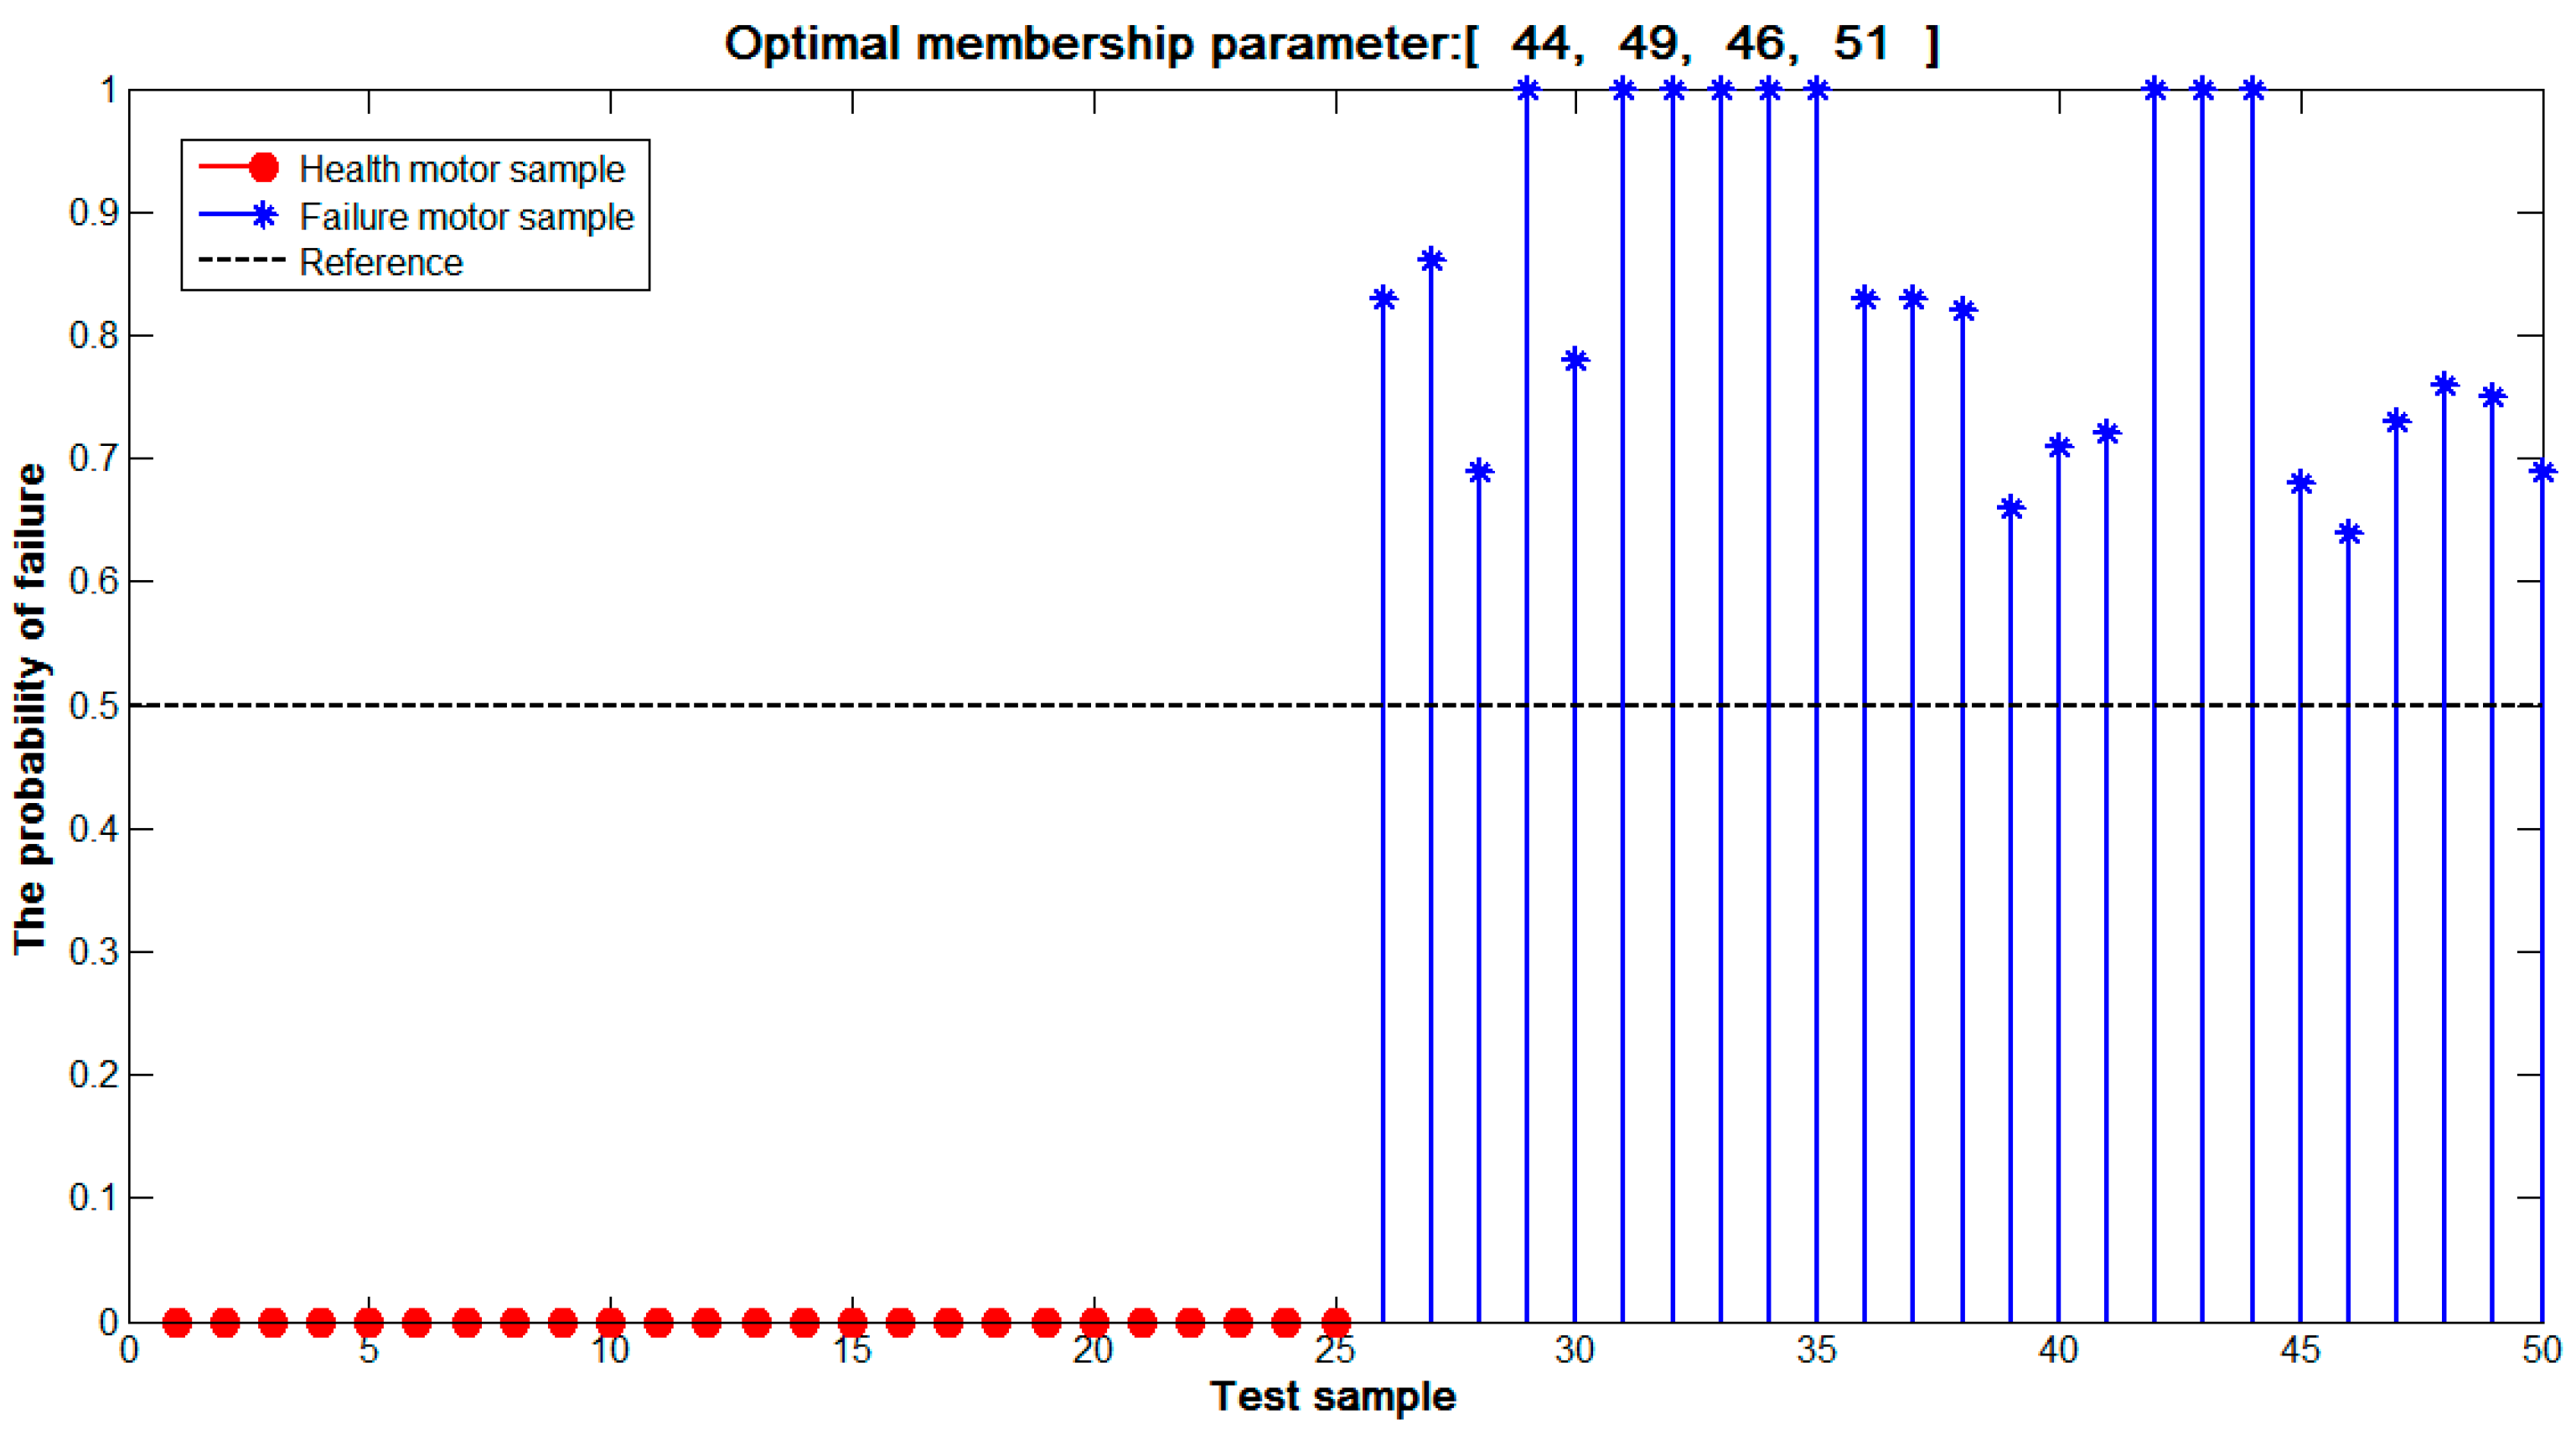
5.4. Rotor Failure Diagnosis Test

This section divides the test situation into two components: first, the detector randomly selects membership function with the Monte Carlo method in the situation of the unknown optimal membership function; second, the detector uses optimal membership function results proposed in the previous section. Afterwards, the results of two methods are respectively used to diagnose failures with the same samples in order to verify the benefit of optimal membership function in this research. The test samples are shown in Figure 17 and Figure 18.
In the first situation, the detector can estimate the scope of the membership parameters through the features of collected data, so as to narrow the searching space of the Monte Carlo method. Figure 19, Figure 20, Figure 21 and Figure 22 have the most benefit of the 100 groups of randomly produced membership functions. In the second situation, the results of the failure diagnosis detector are displayed with optimal membership function in Figure 23.
The different membership functions may cause the different benefit of diagnostic results, as is shown in Figure 24. The value represents the fitness of such a method for the fuzzy inference of test samples. It is learned from the comparison, from Figure 24, that the overall detection efficiency of 19.6 in membership function 2 with the Monte Carlo method is closest to 20.98 of the optimized membership function. The reason for choosing this membership function is the stringency of the diagnostic model, resulting in having a normal motor that can easily be inferred as a failure motor, even though this motor is still in the early stage of failure. The above situation can also be interpreted from the perspective of the maintenance cost; the inference result of membership function with the Monte Carlo method will waste more human resources on investigation. However, in the proposed method, the inference results can already accurately grasp the actual state of a motor because the diagnosed results are the best match with the testing samples, which properly determines the chance to repair motor failure.
Although the detector has divided a possible range of membership parameters, the best membership function is still not found with the Monte Carlo method. On the contrary, the method proposed in this research can effectively obtain the best failure diagnostic inference and the design process of this method may be used as reference for another type of motor failure diagnosis.
Moreover, cross-validation procedures is used to verify the converged stability of the genetic algorithm. First, the training samples are randomly selected from the total sample (S-set), and the remaining are assigned as the testing samples, as shown in Equation (7). Second, the first procedure is repeated for ten times. Finally, genetic algorithm is used to find the optimal membership function through learning each training set and let its corresponding testing set evaluate the diagnostic model.
{ S } = { S i , t r a i n i n g } + { S i , t e s t i n g } ,    i = 1 ,   2 ,   ,   10
where S is the overall of the data set, i is the times of resampling, S i , t r a i n i n g is the training sets of i times resampling, S i , t e s t i n g is the testing sets of i times resampling, for example, S can be resampled as { S } = { S 1 , t r a i n i n g } + { S 1 , t e s t i n g } or { S } = { S 2 , t r a i n i n g } + { S 2 , t e s t i n g } and so on.
Table 2 is the result of cross-validation. The genetic algorithm learns from different training sets. The range of the optimal fitness value is from 0.66 to 0.74, this implies that the proposed genetic algorithm can flexibly learn the characteristics from different training sets. In addition, the overall benefit can also point out the performance of the proposed algorithm.
In order to improve the usage efficiency of optimal diagnosis method, this research shows the design of a suitable graphical interface, as is shown in Figure 25 and Figure 26: the genetic algorithm and fuzzy system as the main training interface; and the rotor bar failure diagnosis as the sub-interface. Furthermore, the user can only implement operation by following the procedures provided above to accurately estimate the rotor failure probability.

6. Conclusions

This study proposes an effective rotor failure diagnostic methodology for the evaluation of motor operating status. It is found from the inference results of the training samples that the optimal design for membership function has fully justified the electrical differences between normal motors and abnormal motors, and that the obtained membership function can also effectively diagnose tested samples. Therefore, the method presented in this paper can be an effective way of obtaining rotor failure detection under operation, and also provide the design flow of such methodology that may be used as a basis for the establishment of any subsequent kinds of failure diagnosis for motors.

Acknowledgments

This work was supported in part by the Ministry of Science and Technology of the Republic of China under Grant No. MOST105-2221-E-011-082-MY3 is gratefully acknowledged.

Author Contributions

Cheng-Chien Kuo and Hong-Chan Chang conceived and designed the experiments; Chien-Hsun Liu performed the experiments and wrote the paper; Kuan-Jung Lin performed the verification and analyzed the data.

Conflicts of Interest

The authors declare no conflict of interest.

References

  1. Thomson, W.T.; Fenger, M. Current signature analysis to detect induction motor failures. IEEE Ind. Appl. Mag. 2001, 7, 26–34. [Google Scholar] [CrossRef]
  2. Jiang, L.; Fu, X.; Cui, J.; Li, Z. Rolling elemt bearing failure diagnosis using recursive wavelet and SOM neural network. In Proceedings of the Chinese Control and Decision Conference, Guiyang, China, 25–27 May 2013; pp. 4691–4696.
  3. Zidani, F.; Benbouzid, M.E.H.; Diallo, D.; Nait-Said, M.S. Induction motor stator failures diagnosis by a current Concordia pattern-based fuzzy decision system. IEEE Trans. Energy Convers. 2003, 18, 469–475. [Google Scholar] [CrossRef]
  4. Gao, X.Z.; Ovaska, S.J. Genetic Algorithm Training of Elman Neural Network in Motor Fault Detection. Neural Comput. Appl. 2002, 11, 37–44. [Google Scholar] [CrossRef]
  5. Goode, P.V.; Chow, M.Y. Using a neural/fuzzy system to extract heuristic knowledge of incipient failures in induction motors: Part II-Application. IEEE Trans. Ind. Electron. 1995, 42, 139–146. [Google Scholar] [CrossRef]
  6. Ghate, V.N.; Dudul, S.V. Cascade neural-network-based failure classifier for three-phase induction motor. IEEE Trans. Ind. Electron. 2011, 58, 1555–1563. [Google Scholar] [CrossRef]
  7. Gongora, W.S.; Silva, H.V.D.; Goedtel, A.; Godoy, W.F.; da Silva, S.A.O. Neural Approach for Bearing Failure Detection in three phase induction motors. In Proceedings of the 2013 9th IEEE International Symposium on Diagnostics for Electric Machines, Power Electronics and Drives (SDEMPED), Valencia, Spain, 27–30 August 2013; pp. 566–572.
  8. Rauber, T.W.; de Assis Boldt, F. Heterogeneous feature models and feature selection applied to bearing failure diagnosis. IEEE Trans. Ind. Electron. 2015, 62, 637–646. [Google Scholar] [CrossRef]
  9. Antonino-Daviu, J.; Riera-Guasp, M.; Roger-Folch, J.; Martinez-Jimenez, F.; Peris, A. Application and optimization of the discrete wavelet transform for the detection of broken rotor bars in induction machines. Appl. Comput. Harmon. Anal. 2006, 21, 268–279. [Google Scholar] [CrossRef]
  10. Hernandez, J.; Antonino-Daviu, J.; Martinez-Jimenez, F.; Peris, A. Comparison of different wavelet families for broken bar detection in induction motors. In Proceedings of the 2015 IEEE International Conference on Industrial Technology (ICIT), Seville, Spain, 17–19 March 2015; pp. 3220–3225.
Figure 1. System architecture of this research.
Applsci 07 00031 g001
Figure 2. The concept of fuzzy theory.
Applsci 07 00031 g002
Figure 3. The concept of the genetic algorithm.
Applsci 07 00031 g003
Figure 4. The flow diagram of optimal membership function design and optimal failure diagnosis inference.
Applsci 07 00031 g004
Figure 5. The conceptual diagram for data collection.
Applsci 07 00031 g005
Figure 6. Triangular Membership Function.
Applsci 07 00031 g006
Figure 7. The input membership function.
Applsci 07 00031 g007
Figure 8. The composition for the single individual.
Applsci 07 00031 g008
Figure 9. The output membership function.
Applsci 07 00031 g009
Figure 10. Crossover diagram based on roulette wheel selection.
Applsci 07 00031 g010
Figure 11. Broken rotor bar model.
Applsci 07 00031 g011
Figure 12. Current information of abnormal motor.
Applsci 07 00031 g012
Figure 13. Normal motor training samples.
Applsci 07 00031 g013
Figure 14. Abnormal motor training samples.
Applsci 07 00031 g014
Figure 15. Optimal membership function.
Applsci 07 00031 g015
Figure 16. Failure diagnosis result of optimal membership function.
Applsci 07 00031 g016
Figure 17. Normal motor test sample.
Applsci 07 00031 g017
Figure 18. Abnormal motor test sample.
Applsci 07 00031 g018
Figure 19. Diagnosis result of membership function with Monte Carlo method (representative data 1).
Applsci 07 00031 g019
Figure 20. Diagnosis result of membership function with Monte Carlo method (representative data 2).
Applsci 07 00031 g020
Figure 21. Diagnosis result of membership function with Monte Carlo method (representative data 3).
Applsci 07 00031 g021
Figure 22. Diagnosis result of membership function with Monte Carlo method (representative data 4).
Applsci 07 00031 g022
Figure 23. Diagnosis result of optimal membership function.
Applsci 07 00031 g023
Figure 24. The benefits of different membership functions for motor failure diagnosis.
Applsci 07 00031 g024
Figure 25. Training interface of genetic algorithm and fuzzy system.
Applsci 07 00031 g025
Figure 26. Broken rotor bar diagnosis interface.
Applsci 07 00031 g026
Table 1. TE-204 Motor specification table.
Name of SpecificationData of SpecificationName of SpecificationData of Specification
Number of Poles4 PolesNumber of Stator Slot36
Number of Phase3 PhaseNumber of Rotor Slot44
Rated Line Voltage220 VShaft diameter25 mm
Rated Current6.1 AOuter diameter of Stator96 mm
Rated Speed1715 rpmInner diameter of Stator62 mm
Rated Output2 HPRotor FormSingle Squirrel-cage Type
Frequency60 HzShape of Rotor SlotHalf-open Slot
Table 2. The result of cross-validation (each data set are optimized in ten times).
Resamplingi = 1i = 2i = 3i = 4i = 5i = 6i = 7i = 8i = 9i = 10
Record
(the avg. of 10 times)
Optimal fitness value0.710.690.660.730.710.680.720.720.740.74
The benefit of health motor12.3011.9410.8912.5711.5112.2711.8712.5811.9212.5
The benefit of failure motor8.527.828.348.698.867.056.928.697.888.48
The overall benefit20.8219.7619.2321.2620.3719.3218.7921.2719.8020.98

