Article

Autofluorescence Imaging and Spectroscopy of Human Lung Cancer

1
Department of Optical Science and Engineering, Shanghai Engineering Research Center of Ultra-Precision Optical Manufacturing, Key Laboratory of Micro and Nano Photonic Structures (Ministry of Education), Green Photoelectron Platform, Fudan University, 220 Handan Road, Shanghai 200433, China
2
Department of Respiratory Diseases, Huashan North Hospital, 108 Luxiang Road, Baoshan District, Shanghai 201907, China
3
Department of Pathology, Huashan Hospital, Fudan University, 12 Wulumuqi Middle Road, Shanghai 200040, China
4
School of Arts and Sciences, MCPHS University, Boston, MA 02115, USA
5
Department of Respiratory Diseases, Huashan Hospital, Fudan University, 12 Wulumuqi Middle Road, Shanghai 200040, China
*
Authors to whom correspondence should be addressed.
These authors contributed equally to this work.
Appl. Sci. 2017, 7(1), 32; https://doi.org/10.3390/app7010032
Submission received: 16 November 2016 / Revised: 23 December 2016 / Accepted: 23 December 2016 / Published: 28 December 2016
(This article belongs to the Special Issue Dimensional Micro and Nanometrology)

Abstract

:
Lung cancer is one of the most common cancers, with high mortality rate worldwide. Autofluorescence imaging and spectroscopy is a non-invasive, label-free, real-time technique for cancer detection. In this study, lung tissue sections excised from patients were detected by laser scan confocal microscopy and spectroscopy. The autofluorescence images demonstrated the cellular morphology and tissue structure, as well as the pathology of stained images. Based on the spectra study, it was found that the majority of the patients showed discriminating fluorescence in tumor tissues from normal tissues. Therefore, autofluorescence imaging and spectroscopy may be a potential method for aiding the diagnosis of lung cancer.

1. Introduction

Lung cancer is one of the most frequently diagnosed cancers and the leading cause of cancer deaths around the world [1,2]. The five-year survival rate of lung cancer patients is approximately 18% [2]. Eighty-five percent of lung cancer patients were non-small cell lung cancer (NSCLC), whose five-year survival rate is about 21% [3]. The common types of NSCLC are adenocarcinomas and squamous cell carcinomas with five-year survival rates of 42.8% and 43.4% [4]. Small cell lung cancer (SCLC) represents 12%–13% of lung cancers, with five-year survival rate of 6% [5]. As a rare form of cancer, five-year survival of mesothelioma was 13.4% in women and 4.5% in men [6]. Early detection and visualization of lung cancer is crucial to improve the accurate diagnosis and treatment performance. Currently, the haematoxylin and eosin (HE)-stained histopathology is applied as the gold standard to assess and diagnose disease by pathologists, but is time-consuming, usually taking up to one week [7]. During tumor resection, intraoperative frozen section examination can aid the surgeon to distinguish tumor and normal tissues, which still requires the staining process and takes about 20–30 min [8,9].
In recent years, autofluorescence of cancer was investigated based on the knowledge that some endogenous fluorophores in the tissues change when normal tissue turns malignant [10,11,12]. Autofluorescence imaging and spectroscopy is a non-invasive, label-free, real-time technique for cancer detection. Autofluorescence emitting from tissues has many intrinsic fluorophores, such as reduced nicotinamide adenine dinucleotide (NADH), flavin adenine dinucleotide (FAD), and porphyrins [13,14]. NADH and FAD are metabolic coenzymes in oxidative phosphorylation, and NADH has a free or protein-bound state [15,16]. Porphyrins are organic compounds and are often used as a tumor-specific marker [17]. Tumor cells exhibit a different metabolic state or microenvironment from normal cells, which associates with changes of these intrinsic fluorophores fluorescence intensity. Thus the difference between normal and cancerous tissues can be investigated based on their autofluorescence spectra. However, this approach is limited by that autofluorescence spectrum features exhibit less specific differences and the origin of the contrasts mechanisms are not clearly identified [18,19].
There have been some reports using spectroscopy with a combination of endoscopic equipment [20,21,22,23,24,25]. Bard et al. used white-light reflectance spectroscopy during bronchoscopy examination to differentiate normal bronchus mucosa from malignant lesions [15,20]. Fawzy et al. differentiated bronchial cancerous lesions with fluorescence spectroscopy, and reached a sensitivity and specificity of 71% and 74% [21]. Most of bronchoscopes measured the decrease of autofluorescence intensity within the green spectral region for early cancerous lesions as compared to healthy tissues under blue-violet light (around 405 nm) excitation [22,24]. According to Gabrecht et al. [23,24], the additional detection of backscattered red light significantly improved the autofluorescence image quality. This phenomenon could be due to the increased vasculature around cancerous lesions, and partially due to changes in the fluorescent properties of the tissues. Previous studies have also been performed on blood samples [26], urine samples [27], animal models [28], cell lines [29], and human cervical tissue sections [30,31] based on the fluorescence spectroscopy. Direct studies on the optical properties of lung tissues may be particularly useful for intraoperative margin assessment during tumor resection [32].
In the present study, we assessed the possibilities for introducing fluorescence imaging and spectroscopy of lung tissue samples as a potential tool to differentiate tumor from normal tissues. The optical measurement technique is more efficient than the HE stained histopathology, and may ultimately be used to aid the diagnosis of lung cancer.

2. Materials and Methods

2.1. Lung Tissue Sample Preparation

All involved patients were diagnosed as NSCLC by Department of Respiratory Diseases, Huashan hospital and Huashan North Hospital. The 10 patients in this study include nine adenocarcinoma and one squamous carcinoma. The ratio of man/woman was 6/4, whose average age was 59.7 ± 9.1 years old. In the study, all involved patients with tumor size over 2 cm. According to the clinical practice guidelines [33], the lobectomy or greater resection was applied, thus, the tumor free margin was at least 5 cm away from the tumor during resection. Tissue samples embedded in paraffin were obtained after the pulmonary surgeries with the standard procedures [34] by pathologists from the Department of Pathology on a protocol approved by their institutional review board. Two sections of 3 μm thick were cut off from a portion of the tissue for each patient, in excess of what was needed for histopathological diagnosis. One section was cut from the center of tumor, and the other was obtained at 5 cm away from the tumor margin and treated as normal lung tissues. Then tissue sections were placed on glass slides and imaged by a laser scanning confocal microscope and measured by an optical fiber spectrometer.
The other two sections from tumor and normal part were stained by haematoxylin and eosin (H E) using standard protocols for optical imaging. For three-dimensional (3D) fluorescence confocal imaging, samples of about 30 μm thick were obtained following similar procedures.

2.2. Autofluorescence Imaging and Spectral Measurement

Autofluorescence images of lung tissue samples were acquired by a laser scanning confocal microscope (LSCM, Olympus, FV300/IX 71, Tokyo, Japan) equipped with a 405 nm CW laser (BDL-405-SMC, Becker and Hickl, Berlin, Germany) and an oil-dipping objective (40×, NA = 1.2). The autofluorescence of tissue samples were recorded simultaneously in two channels with a 505–550 nm bandpass and a 590 nm long-pass filter, respectively.
On the basis of the obtained autofluorescence micrographs, the spectra measurements were performed at multiple locations using the clip-scan mode of the microscope. All spectra were recorded with an average power of 0.5 mW at the focal plane. The autofluorescence at the selected area output from the right port of the microscope was focused into an optical fiber spectrometer (Ocean Optics, USB2000+, Dunedin, FA, USA) with a 420 nm long-pass filter. At least seven different areas were measured for each tissue sample.
The 3D fluorescence images were obtained for 30 μm thick samples by using the z-scan mode of the confocal microscope with a 20× objective.

3. Results

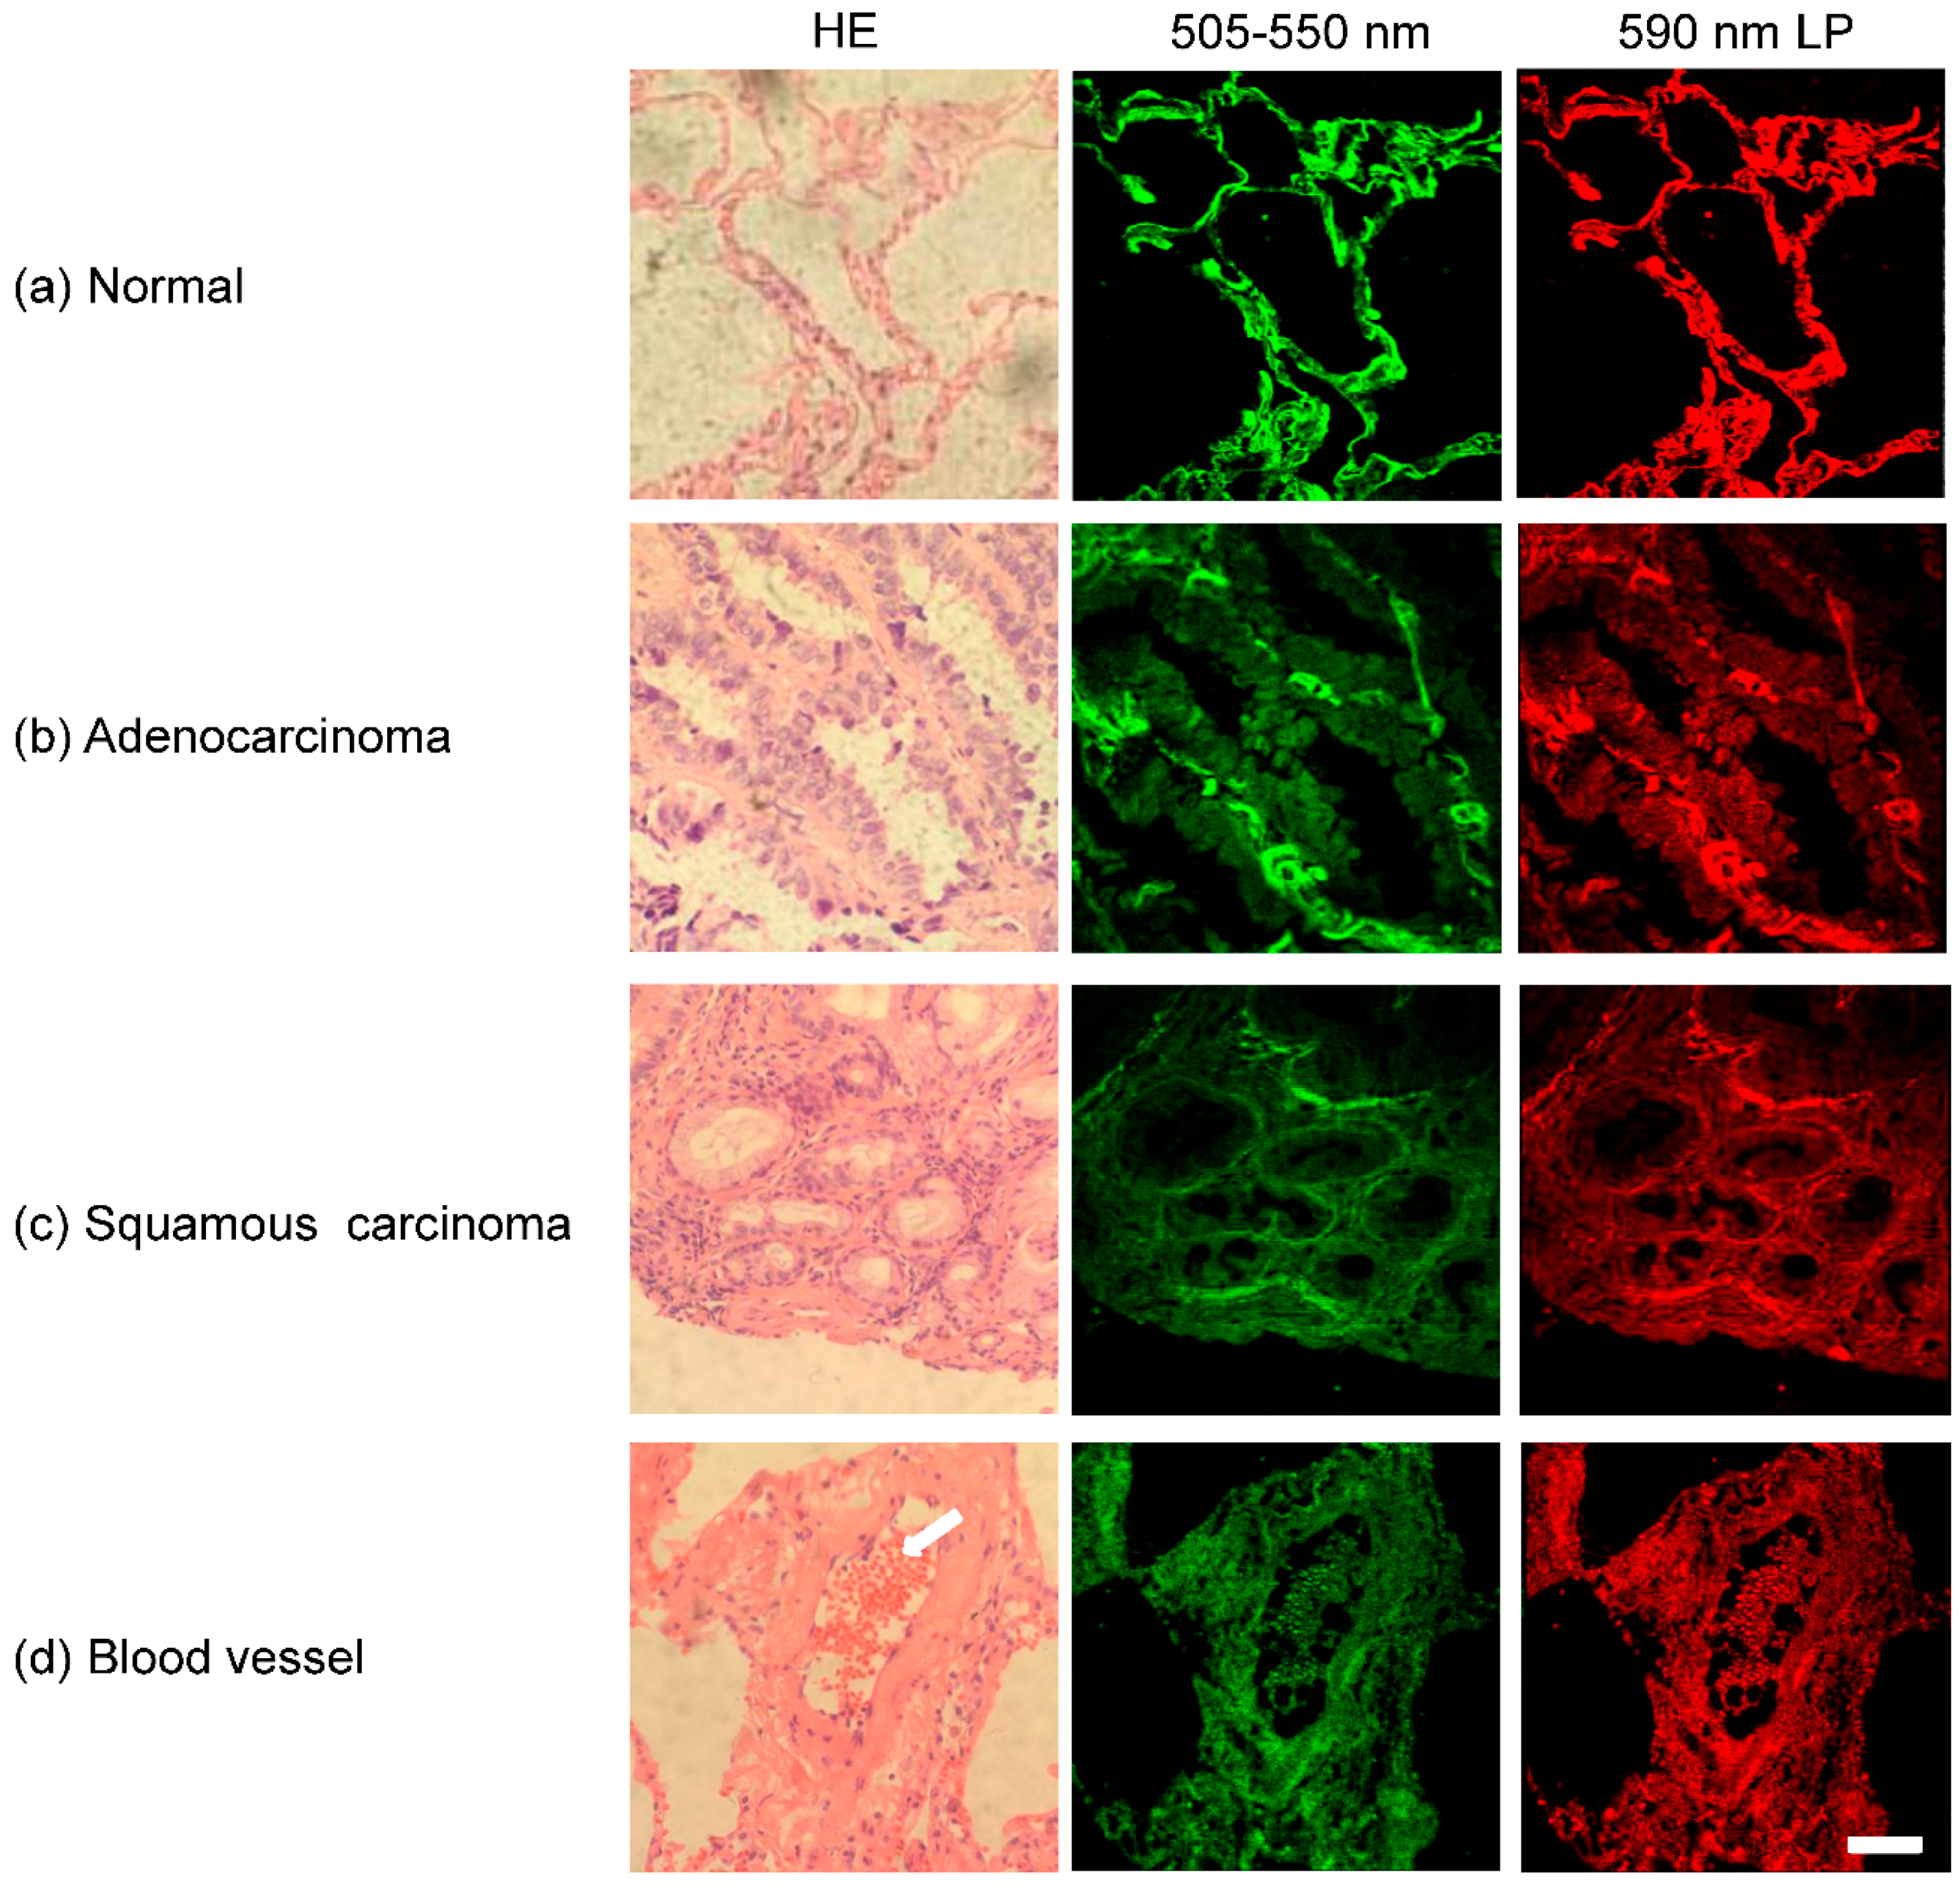
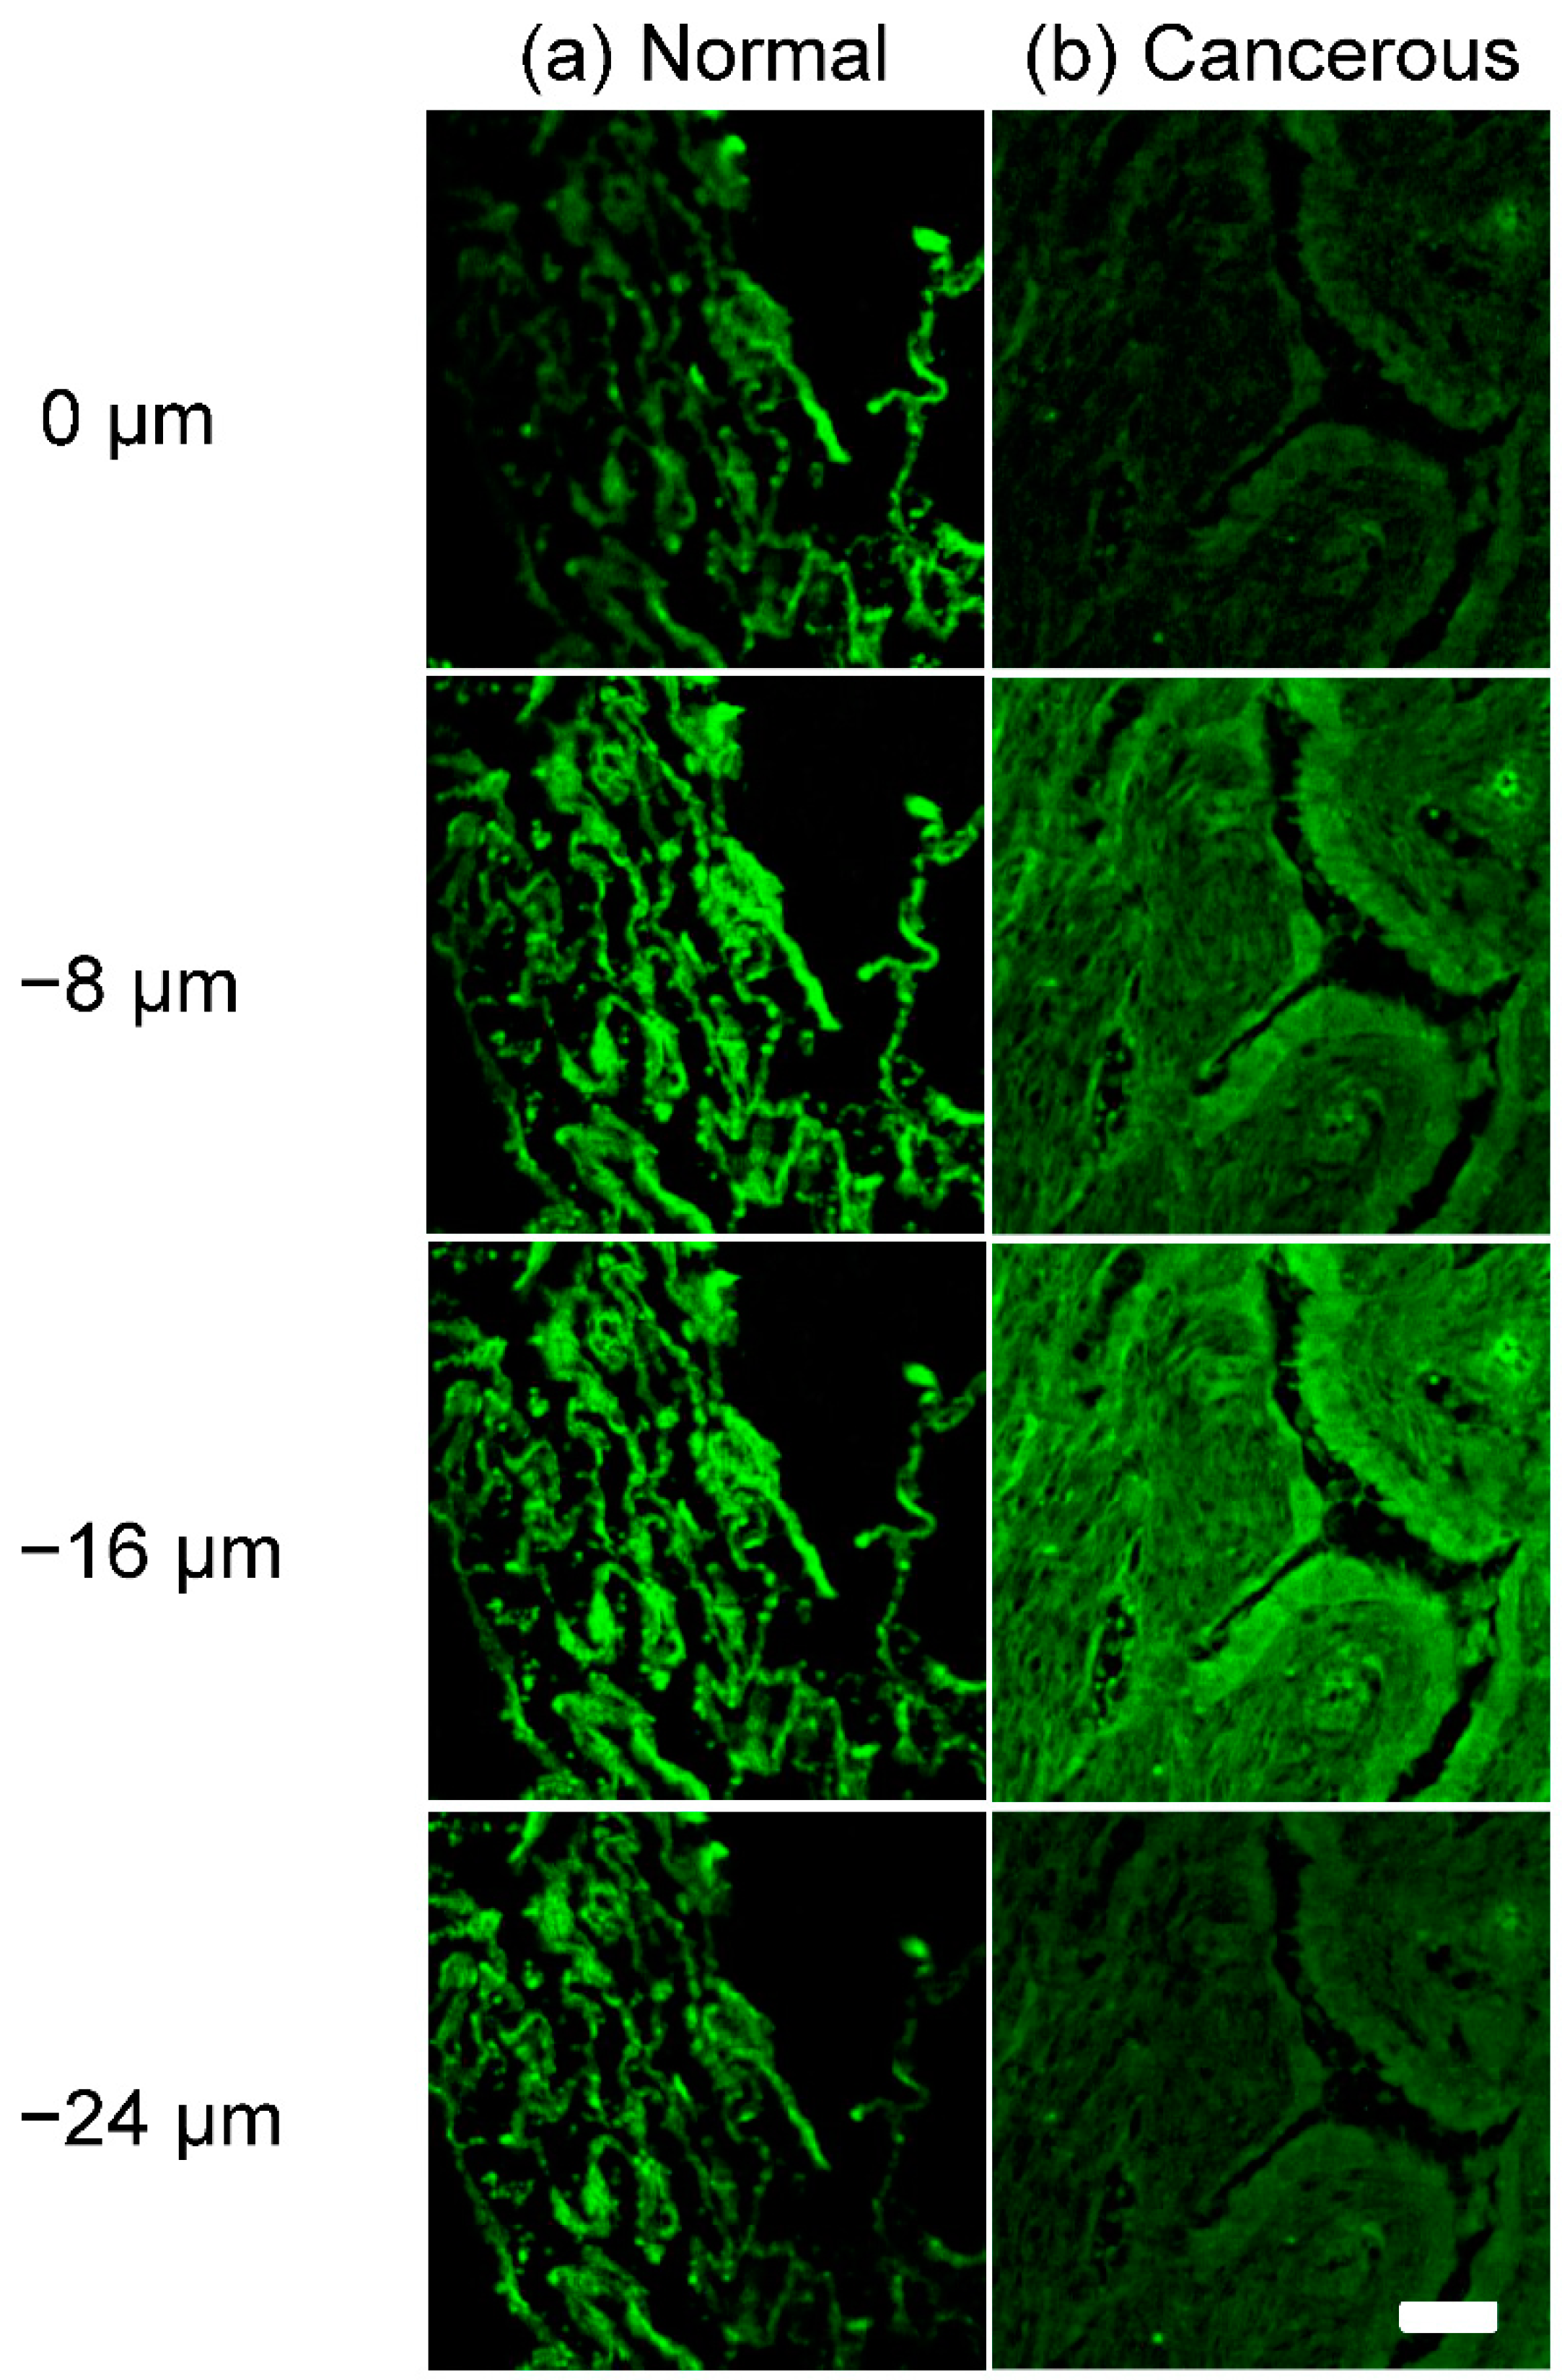
3.1. Autofluorescence Images of Lung Tissues

Figure 1 demonstrated four HE images on stained lung tissue samples (left column) and autofluorescence images of the corresponding unstained samples (middle and right columns). Figure 1a showed several alveolar structures in normal tissues. Figure 1b,c presented representative adenocarcinoma and squamous carcinoma tissues. It is well known that NADH and FAD emit fluorescence of 450–560 nm and porphyrins emit fluorescence of over 590 nm [35]. Thus the middle column in Figure 1 showed the autofluorescence of NADH and FAD in lung tissue samples, and the right column showed the fluorescence images of porphyrins. It can be seen that the autofluorescence images demonstrated the cellular morphology and tissue structure, as well as the HE staining images. In Figure 1d, a blood vessel wall with erythrocytes (marked by a white arrow) can be seen in lung tissue. Considering the vascular wall and erythrocytes can influence the autofluorescence spectra, the areas with blood vessels or erythrocytes should be avoided during the further spectra study.
To study the fluorescence imaging capability on thick tissues, the 3D images of two samples were acquired and shown in Figure 2a,b; normal tissue and cancerous tissue. The cellular morphology features were clearly different between normal and cancerous tissue from the surface of the tissue (0 μm) down to the deep position (−24 μm).

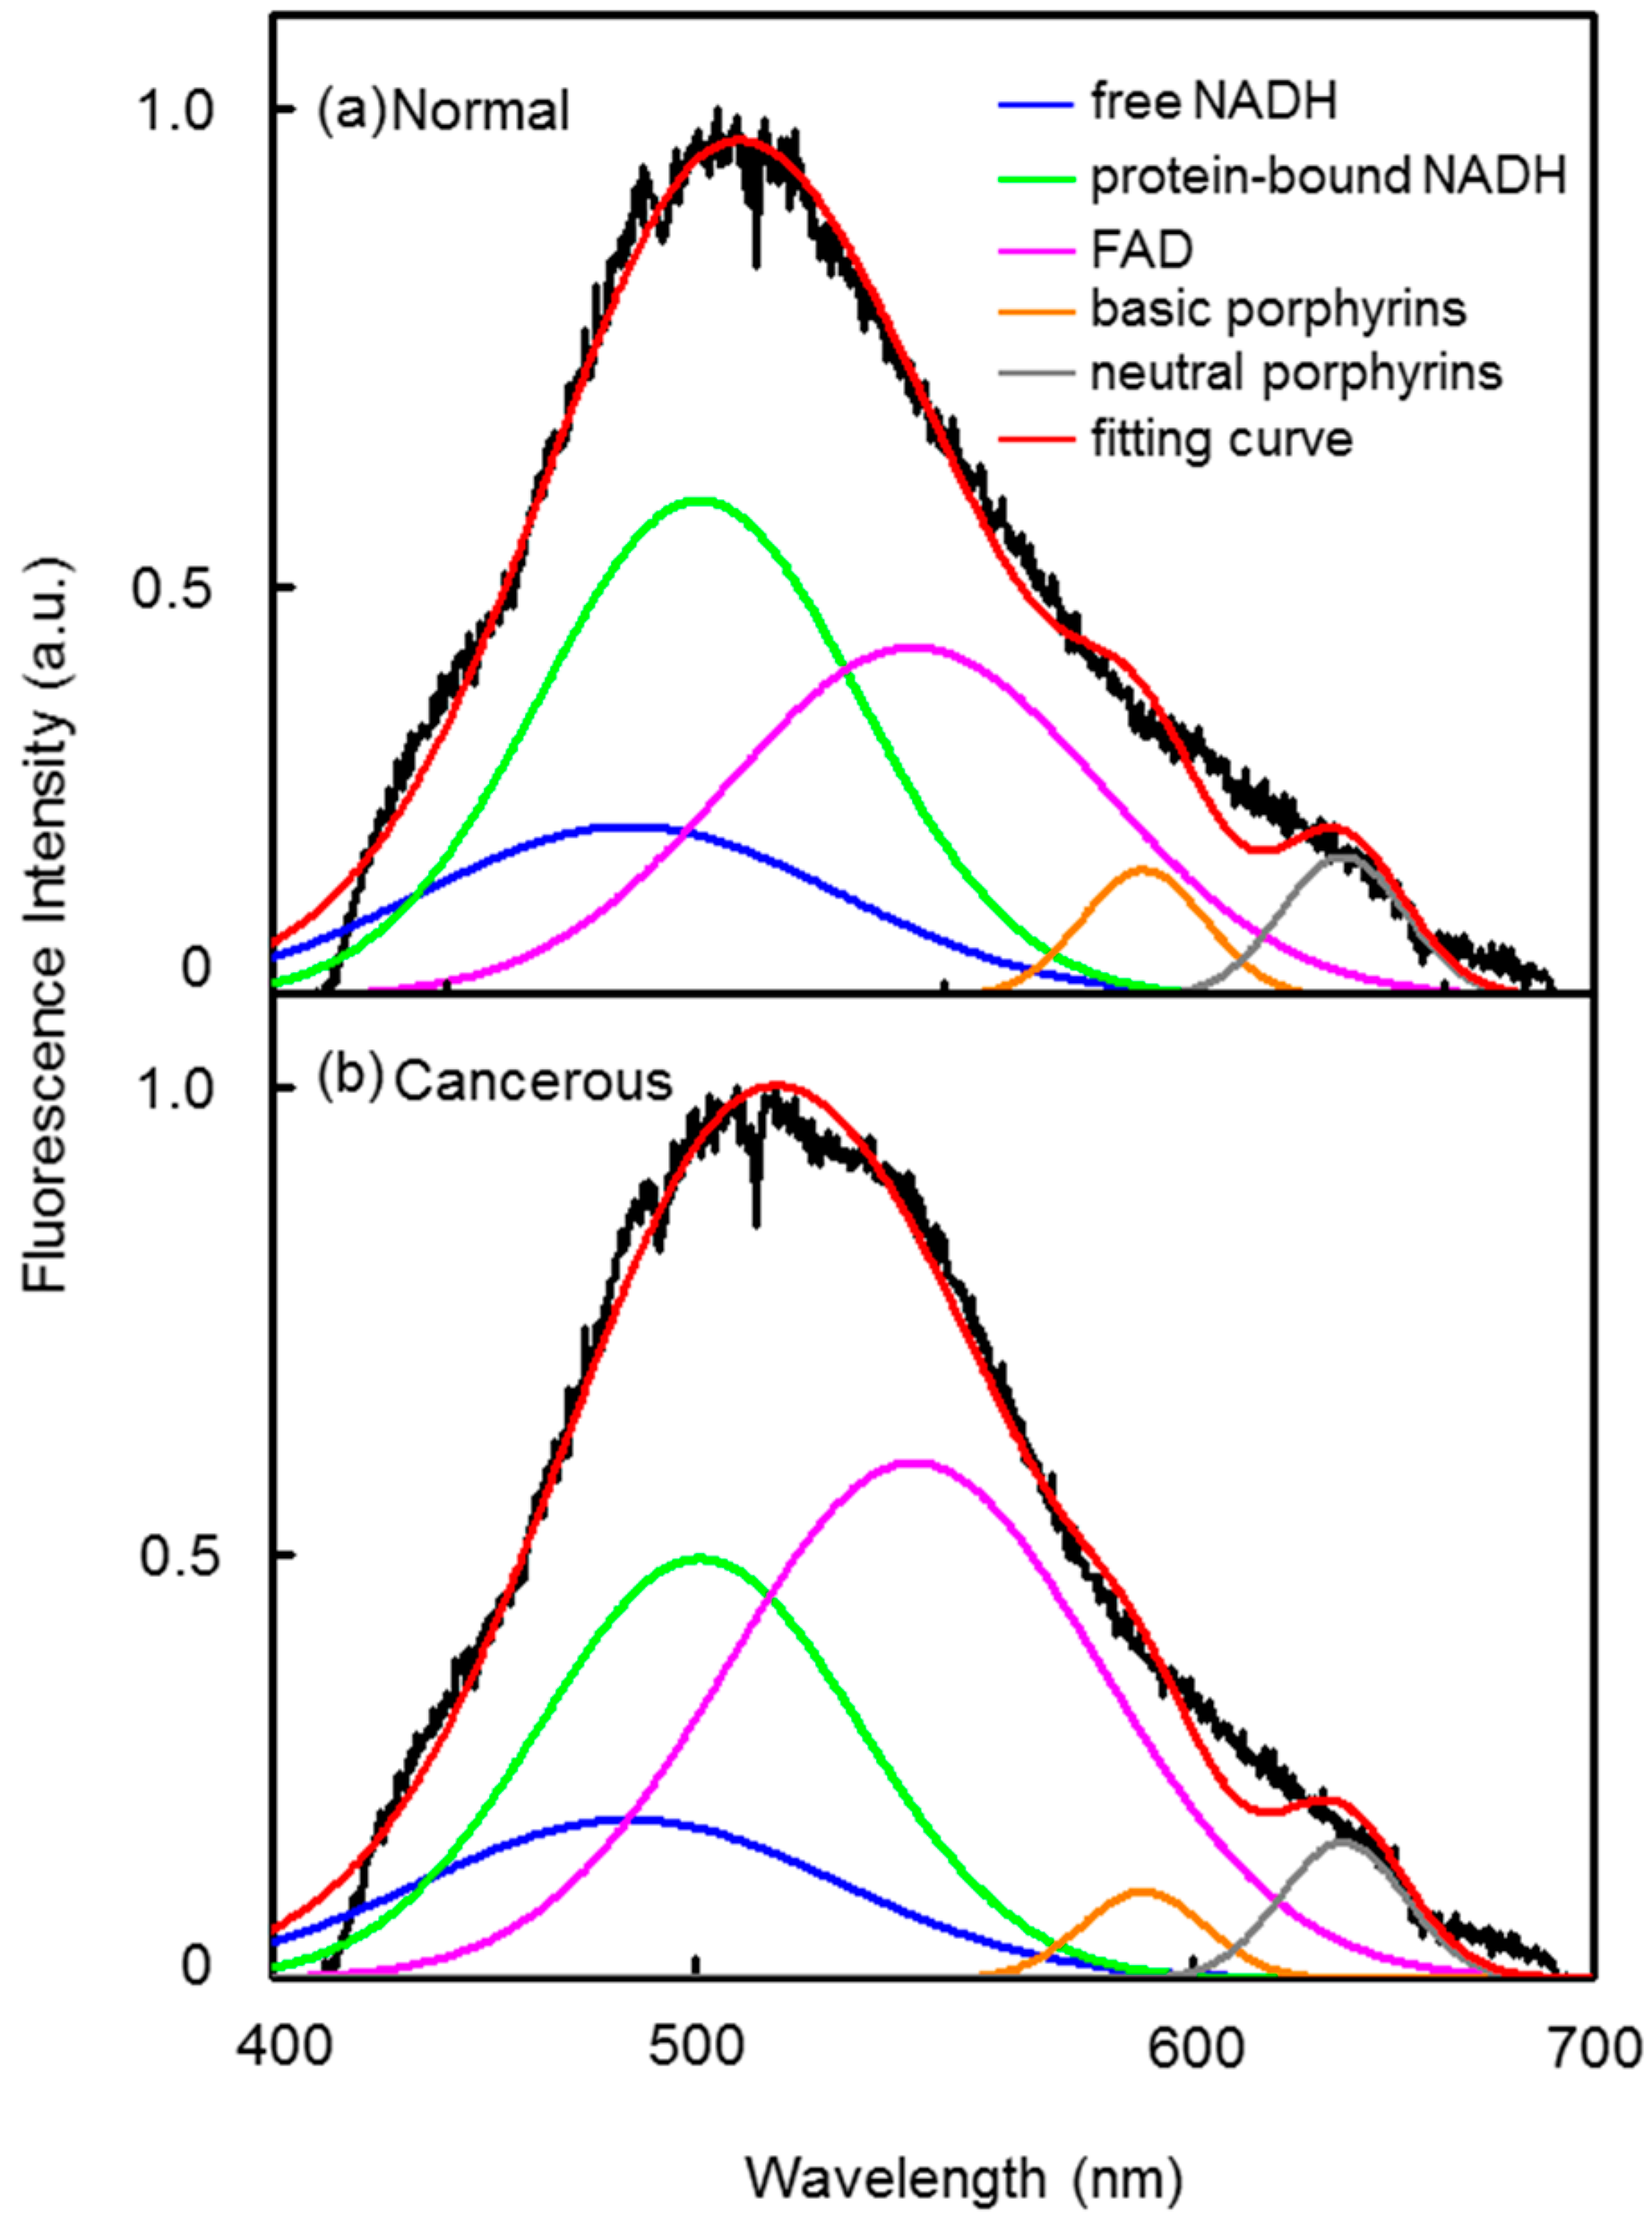
3.2. Autofluorescence Spectra of Lung Tissue Samples

On the basis of the obtained fluorescence images, the areas of interest were measured by the spectrometer with a 420 nm long-pass filter. The spectra were normalized to 100% at the peak maximum and then calculated with curve-fitting. The wide spectra were contributed by several endogenous fluorophores, such as free NADH, protein-bound NADH, free FAD, basic form, and neutral form of porphyrins [36], tryptophan, collagen, and elastin. The fluorescence of protein-bound FAD is very weak [37] and not considered in this study. According to the reported emission spectra of the endogenous fluorophores listed in Table 1, it can be found that tryptophan, collagen, and elastin need to be excited by ultraviolet light [38]. With the excitation light of 405 nm in the present study, five fluorophores should be considered including free NADH, protein-bound NADH, free FAD, basic form, and neutral form of porphyrins. The normalized spectra of lung tissue samples were fitted with five peaks, as shown in Figure 2. Each peak was of a Gaussian function and representing the emission of a pure fluorophore. The goodness of fit was evaluated through an adjusted R-square, and all were more than 0.98 in our study.
Typically, compared with the normal tissues, the fluorescence intensity of free FAD in cancerous tissues increased, while the free and protein-bound NADH contributed less for the spectra. The optical oxidation reduction (redox) ratio is a measurement of cellular metabolism, which is defined as the ratio between NADH and FAD [41,42]. In this study, the optical redox was calculated as the ratio of NADH (free and protein-bound) to free FAD, INADH/IFAD. In this case (Figure 3, which is Patient 1 in Figure 4), INADH/IFAD were calculated as 1.76 and 1.04 for normal and cancerous tissues, respectively. We also found that the fluorescence of porphyrins changed in cancerous tissues. The intensity ratio of neutral form of porphyrins (with peak at 630 nm) to the basic form (with peak at 590 nm), I630 nm/I590 nm, were calculated as 1.10 and 1.59 for normal and cancerous tissues, respectively. The change of fluorescence intensity ratios between normal and cancerous tissues may indicate changes of cellular metabolism and cancer development.

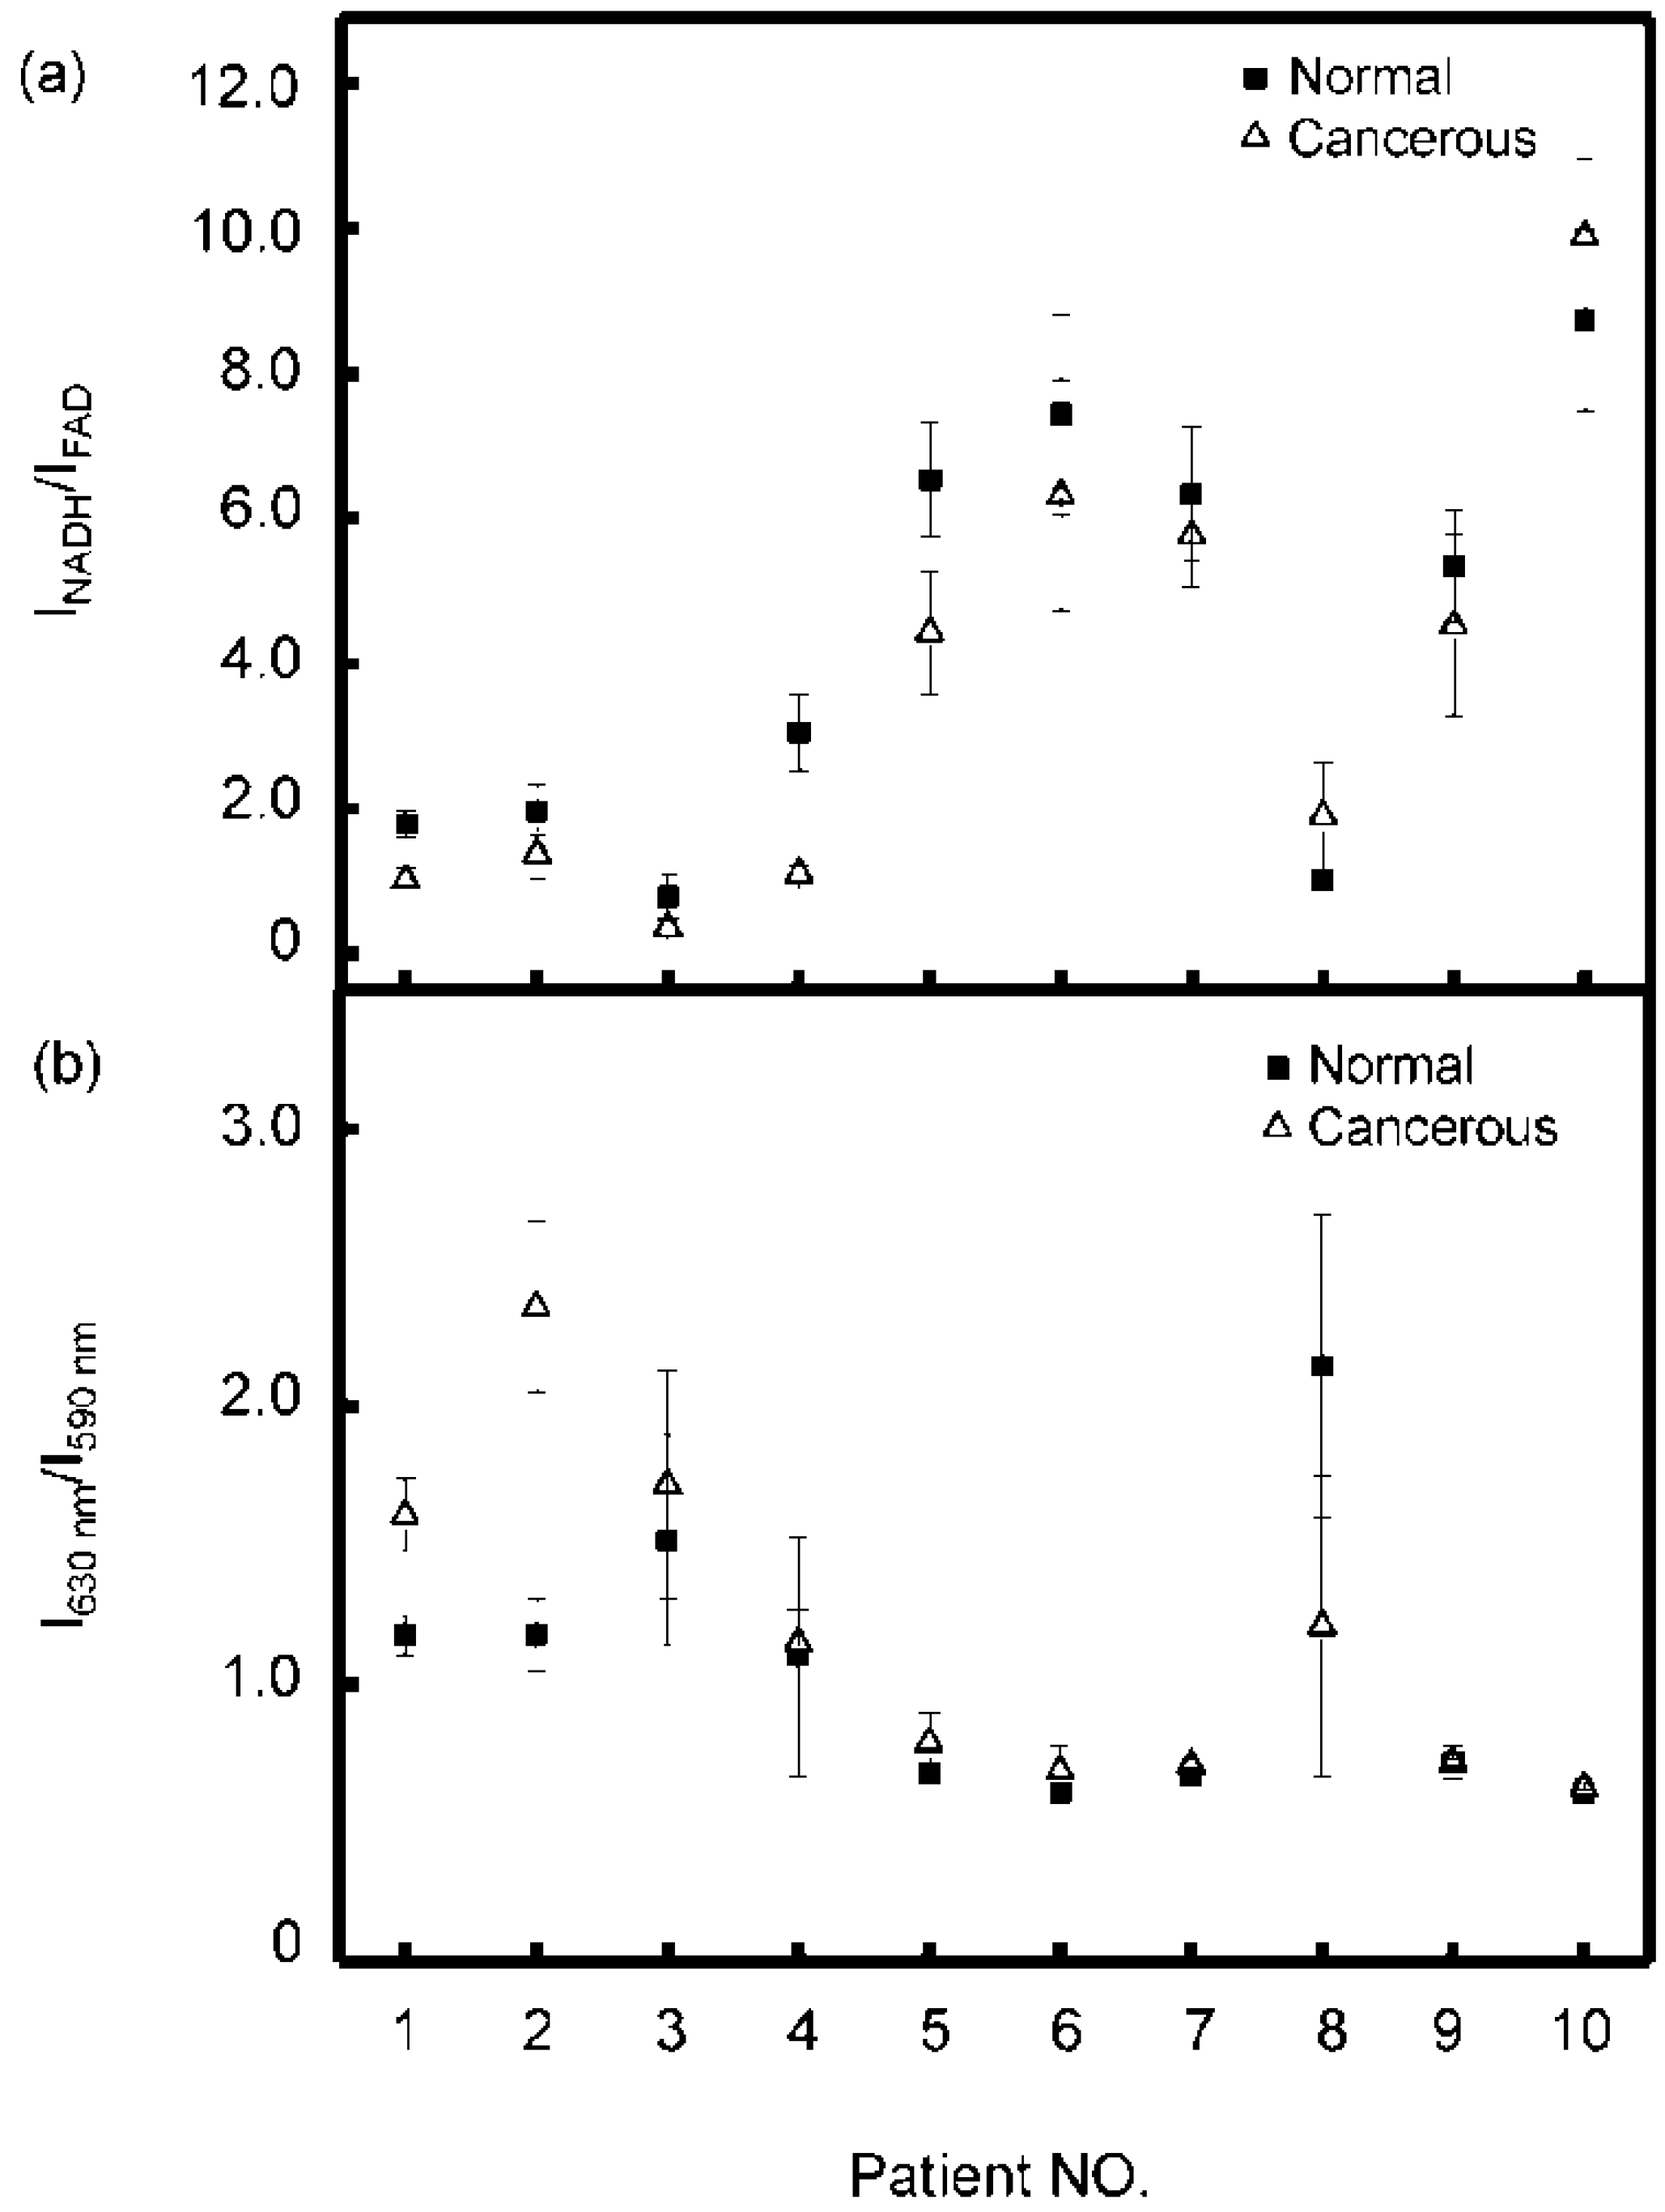
3.3. Statistical Analysis

For every patient, at least 7–10 different areas of each section were measured and the spectra were analyzed following the above-mentioned fitting procedure. Then the averaged ratios of INADH/IFAD and I630 nm/I590 nm for every tissue sample were obtained and the results were shown in Figure 4. It can be seen that the majority of the patients (80.0%) have lower INADH/IFAD values and higher I630 nm/I590 nm values in cancerous tissues than in normal tissues. For most patients (patients 1–7, 9), the differences of INADH/IFAD between normal and cancerous samples from each patient were ranging from 0.42 to 2.11, with the average value of 1.04 ± 0.64, and the differences of I630 nm/I590 nm between normal and cancerous tissue samples from each patient (patients 1–7, 10, in Figure 4) were ranging from −0.02 to −2.0, with the average value of −0.26 ± 0.39. It can be seen that the heterogeneity between different patients is remarkable. Patient 8, in Figure 4, had a different result, which showed higher INADH/IFAD values and lower I630 nm/I590 nm values in the cancerous tissue, while Patient 10 had a higher INADH/IFAD value in cancerous tissue and the average I630 nm/I590 nm value of Patient 9 in normal tissue was equal to the cancerous one.
We examined the pathological data of neutrophil:lymphocyte ratio (NLR) for all the patients before any treatment. There were four patients (patients 5–8 in Figure 4) having high NLR values of 5.22, 5.24, 5.37, and 7.10. The remaining patients were of lower NLR values (≤3) with the average value of 2.54 ± 0.74. This result will be discussed further in the next section.

4. Discussion

Generally, the coenzymes NADH and FAD are dominant in the autofluorescence signals in cells and tissues. When lung cancer develops, the redox equilibria in tissues changes with different metabolic conditions [43], which can be monitored through the autofluorescence spectra. In this study, we found the majority of patients presented lower INADH/IFAD values in tumor tissues, which means a lower concentration of NADH and a higher concentration of FAD were in cancerous tissues compared with normal lung tissues. Our results agreed with some recent reports that the amount of FAD in tissues increased in the neoplasia, such as colonic cancer [44], cervical cancer [45], and human papillomavirus immortalized epithelial cells [46]. It implied the cellular metabolism changed due to the rapid tumor cell division. The alteration of NADH and FAD in cancerous tissues can serve as markers of metabolic activity and the cellular microenvironment [47].
Particular attention was given to the endogenous porphyrin derivatives for the detection of cancer in recent decades. Moesta et al. observed enhanced fluorescence of protoporphyrin (PpIX) and uroporphyrin III in colon tumor tissues and involved lymph node tissues [17]. Masilamani et al. observed enhanced fluorescence bands (one around 590 nm and another around 630 nm) in blood samples for several different types of cancers, such as gastric cancer, breast cancer, and Hodgkin’s lymphoma [40]. Kalaivani et al. found elevated porphyrin fluorescence in the blood components of cervical cancer patients [36]. It indicates that porphyrins accumulate more in tumor parts. The knowledge about the mechanisms of precursor 5-ALA lead to PpIX accumulation was demonstrated in many tumor diseases [48,49,50]. Our results showed that for the majority of the patients (80.0%), I630 nm/I590 nm of each individual patient’s tumor sample was higher than that of normal sample. This further supported that the tumor metabolic alterations cause the accumulation of products of porphyrins.
Masilamani et al. found that the ratio of I630 nm/I585 nm in blood or urine samples was about one for normal controls and 2–3 for advanced cervical cancer patients [51]. Similar findings were also reported in blood samples of gastric cancer and breast cancer patients [40]. However, for lung tissue samples in our study, the porphyrins were present in fairly low amounts (Figure 3). It should be noted that I630 nm/I590 nm between normal and cancerous tissue samples showed considerable overlap among the patients as shown in Figure 4. Similar results can also be found for INADH/IFAD values. This inter-patient variation was disadvantageous to analyze the averaged spectra data of patients. Therefore, the signature of spectra for lung tissues may be applicable for the assessment of per individual patient, instead of comparing one patient data with average values.
Several studies reported that high NLR value is always associated with inflammation, poor survival and a higher risk of distant metastasis [52,53]. The patients could be separated into two groups according to their NLR values. One group (numbers 1–4, 9–10) was of low NLR values (≤3) and the other group (numbers 5–8) of high NLR values (>5). The low NLR group presented similar results of spectra with small fluctuation, while the high NLR group showed fairly large heterogeneity for each patient. Especially, the spectra of patient 8 with a high NLR value had different results both in INADH/IFAD and I630 nm/I590 nm values than the remaining patients. Some studies showed that smoking can activate increased numbers of neutrophils, which associated with the destruction of alveolar structures and extracellular matrix [54]. However, in our study, patients with high NLR values (>5) did not have the habit of cigarette smoking. Further study is needed to reveal the potential connection between the blood test result and the cellular energetic metabolism.
There were several reports on the autofluorescence in vivo using the endoscopic equipment [22,23,24]. Typically, the autofluorescence spectrum features exhibited little difference in the previous studies, and they differentiated malignant lesions from healthy tissues by the autofluorescence intensity change [22,24]. Although this present study is on tissue sections without ongoing blood flow, the spectrum features of sections were similar with the previous reports using the bronchoscope [22,24]. As the excitation power density for section samples could be much higher than that of endoscopy, this study enabled the elaborate analysis on the autofluorescence spectrum features.

5. Conclusions

Autofluorescence imaging and spectroscopy can provide not only the cellular images, but also the characteristic spectra of normal and cancerous lung tissues. It has the advantage of high speed and non-invasion. It was found that the majority of the patients have lower INADH/IFAD values and higher I630 nm/I590 nm values in cancerous tissues than in normal tissues. Thus, autofluorescence imaging and spectroscopy may be a potential method for aiding the diagnosis of lung cancer. Furthermore, it may be developed with a fiber-optics probe and ultimately serve as a complementary pathology examination.

Supplementary Materials

The following are available online www.mdpi.com/2076-3417/7/1/32/s1. Video S1: autofluorescence 3D images of normal lung tissue; Video S2: autofluorescence 3D images of cancerous lung tissue.

Acknowledgments

This work is supported by National Natural Science Foundation of China (11574056, 61575046, 31500599, 61505032), Science and Technology Commission of Shanghai Municipality (Shanghai Rising-Star Program, 16QA1400400) and Shanghai Municipal Commission of Health and Family Planning (201540269).

Author Contributions

L.M. and G.W. conceived and designed the experiments; M.W. performed the spectroscopy experiments; F.L. and F.T. prepared the tissue samples and performed the clinical analysis; J.M., Y.F., L.C. and G.W. analyzed the data; Y.J., X.W. and L.Y. contributed the measurement setups; M.W. and L.M. wrote the paper.

Conflicts of Interest

The authors disclose no conflicts of interest.

References

  1. Torre, L.A.; Bray, F.; Siegel, R.L.; Ferlay, J.; Lortet-Tieulent, J.; Jemal, A. Global cancer statistics, 2012. CA Cancer J. Clin. 2015, 65, 87–108. [Google Scholar] [CrossRef] [PubMed]
  2. Siegel, R.L.; Miller, K.D.; Jemal, A. Cancer statistics, 2015. CA Cancer J. Clin. 2015, 65, 5–29. [Google Scholar] [CrossRef] [PubMed]
  3. Gray, P.J.; Mak, R.H.; Yeap, B.Y.; Cryer, S.K.; Pinnell, N.E.; Christianson, L.W.; Sher, D.J.; Arvold, N.D.; Baldini, E.H.; Chen, A.B.; et al. Aggressive therapy for patients with non-small cell lung carcinoma and synchronous brain-only oligometastatic disease is associated with long-term survival. Lung Cancer 2014, 85, 239–244. [Google Scholar] [CrossRef] [PubMed]
  4. Mordant, P.; Grand, B.; Cazes, A.; Foucault, C.; Dujon, A.; Barthes, F.L.; Riquet, M. Adenosquamous carcinoma of the lung: Surgical management, pathologic characteristics, and prognostic implications. Ann. Thorac. Surg. 2013, 95, 1189–1195. [Google Scholar] [CrossRef] [PubMed]
  5. Gaponova, A.; Nikonova, A.; Deneka, A.; Egleston, B.; Litwin, S.; Duncan, J.; Duncan, K.; Borghaei, H.; Mehra, R.; Proia, D. Preclinical testing demonstrates strong activity of STA-12–8666, an HSP90 inhibitor-SN-38 conjugate, in small cell lung cancer (SCLC). Cancer Res. 2015, 75, 1731. [Google Scholar] [CrossRef]
  6. Taioli, E.; Wolf, A.S.; Camacho-Rivera, M.; Flores, R.M. Women with malignant pleural mesothelioma have a threefold better survival rate than men. Ann. Thorac. Surg. 2014, 98, 1020–1024. [Google Scholar] [CrossRef] [PubMed]
  7. Yang, J.; Caprioli, R.M. Matrix sublimation/recrystallization for imaging proteins by mass spectrometry at high spatial resolution. Anal. Chem. 2011, 83, 5728–5734. [Google Scholar] [CrossRef] [PubMed]
  8. Nguyen, F.T.; Zysk, A.M.; Chaney, E.J.; Kotynek, J.G.; Oliphant, U.J.; Bellafiore, F.J.; Rowland, K.M.; Johnson, P.A.; Boppart, S.A. Intraoperative evaluation of breast tumor margins with optical coherence tomography. Cancer Res. 2009, 69, 8790–8796. [Google Scholar] [CrossRef] [PubMed]
  9. Maygarden, S.J.; Detterbeck, F.C.; Funkhouser, W.K. Bronchial margins in lung cancer resection specimens: Utility of frozen section and gross evaluation. Mod. Pathol. 2004, 17, 1080–1086. [Google Scholar] [CrossRef] [PubMed]
  10. Khosroshahi, M.E.; Rahmani, M. Detection and evaluation of normal and malignant cells using laser-induced fluorescence spectroscopy. J. Fluoresc. 2012, 22, 281–288. [Google Scholar] [CrossRef] [PubMed]
  11. Alchab, L.; Dupuis, G.; Balleyguier, C.; Mathieu, M.C.; Fontaine-Aupart, M.P.; Farcy, R. Towards an optical biopsy for the diagnosis of breast cancer in vivo by endogenous fluorescence spectroscopy. J. Biophotonics 2010, 3, 373–384. [Google Scholar] [CrossRef] [PubMed]
  12. De Veld, D.; Witjes, M.; Sterenborg, H.; Roodenburg, J. The status of in vivo autofluorescence spectroscopy and imaging for oral oncology. Oral Oncol. 2005, 41, 117–131. [Google Scholar] [CrossRef] [PubMed]
  13. Langhout, G.C.; Spliethoff, J.W.; Schmitz, S.J.; Aalbers, A.; van Velthuysen, M.L.; Hendriks, B.H.; Ruers, T.J.; Kuhlmann, K.F. Differentiation of healthy and malignant tissue in colon cancer patients using optical spectroscopy: A tool for image-guided surgery. Laser Surg. Med. 2015, 47, 559–565. [Google Scholar] [CrossRef] [PubMed]
  14. Walsh, J.D.; Hyman, J.M.; Borzhemskaya, L.; Bowen, A.; McKellar, C.; Ullery, M.; Mathias, E.; Ronsick, C.; Link, J.; Wilson, M. Rapid intrinsic fluorescence method for direct identification of pathogens in blood cultures. mBio 2013, 4, e00865-13. [Google Scholar] [CrossRef] [PubMed]
  15. Palero, J.A.; Bader, A.N.; de Bruijn, H.S.; Sterenborg, H.J.; Gerritsen, H.C. In vivo monitoring of protein-bound and free nadh during ischemia by nonlinear spectral imaging microscopy. Biomed. Opt. Express 2011, 2, 1030–1039. [Google Scholar] [CrossRef] [PubMed]
  16. Lakowicz, J.R.; Szmacinski, H.; Nowaczyk, K.; Johnson, M.L. Fluorescence lifetime imaging of free and protein-bound nadh. Proc. Natl. Acad. Sci. USA 1992, 89, 1271–1275. [Google Scholar] [CrossRef] [PubMed]
  17. Moesta, K.T.; Ebert, B.; Handke, T.; Nolte, D.; Nowak, C.; Haensch, W.E.; Pandey, R.K.; Dougherty, T.J.; Rinneberg, H.; Schlag, P.M. Protoporphyrin IX occurs naturally in colorectal cancers and their metastases. Cancer Res. 2001, 61, 991–999. [Google Scholar] [PubMed]
  18. Hung, J.; Lam, S.; Leriche, J.C.; Palcic, B. Autofluorescence of normal and malignant bronchial tissue. Laser Surg. Med. 1991, 11, 99–105. [Google Scholar] [CrossRef]
  19. Huang, Z.; McWilliams, A.; Lui, H.; McLean, D.I.; Lam, S.; Zeng, H. Near-infrared raman spectroscopy for optical diagnosis of lung cancer. Int. J. Cancer 2003, 107, 1047–1052. [Google Scholar] [CrossRef] [PubMed]
  20. Bard, M.P.; Amelink, A.; Hegt, V.N.; Graveland, W.J.; Sterenborg, H.J.; Hoogsteden, H.C.; Aerts, J.G. Measurement of hypoxia-related parameters in bronchial mucosa by use of optical spectroscopy. Am. J. Respir. Crit. Care 2005, 171, 1178–1184. [Google Scholar] [CrossRef] [PubMed]
  21. Fawzy, Y.; Zeng, H. Intrinsic fluorescence spectroscopy for endoscopic detection and localization of the endobronchial cancerous lesions. J. Biomed. Opt. 2008, 13, 064022–064028. [Google Scholar] [CrossRef] [PubMed]
  22. Van den Bergh, H. Early detection of lung cancer and the role of endoscopic fluorescence imaging. Med. Laser Appl. 2003, 18, 20–26. [Google Scholar] [CrossRef]
  23. Gabrecht, T.; Radu, A.; Zellweger, M.; Lovisa, B.; Goujon, D.; Grosjean, P.; van den Bergh, H.; Monnier, P.; Wagnières, G. Autofluorescence bronchoscopy: Clinical experience with an optimized system in head and neck cancer patients. Med. Laser Appl. 2007, 22, 185–192. [Google Scholar] [CrossRef]
  24. Gabrecht, T.; Glanzmann, T.; Freitag, L.; Weber, B.-C.; van den Bergh, H.; Wagnieres, G. Optimized autofluorescence bronchoscopy using additional backscattered red light. J. Biomed. Opt. 2007, 12, 064016–064019. [Google Scholar] [CrossRef] [PubMed]
  25. McWilliams, A.; Mayo, J.; MacDonald, S.; leRiche, J.C.; Palcic, B.; Szabo, E.; Lam, S. Lung cancer screening: A different paradigm. Am. J. Resp. Crit. Care 2003, 168, 1167–1173. [Google Scholar] [CrossRef] [PubMed]
  26. Madhuri, S.; Vengadesan, N.; Aruna, P.; Koteeswaran, D.; Venkatesan, P.; Ganesan, S. Native fluorescence spectroscopy of blood plasma in the characterization of oral malignancy. Photochem. Photobiol. 2003, 78, 197–204. [Google Scholar] [CrossRef]
  27. Masilamani, V.; Vijmasi, T.; Al Salhi, M.; Govindaraj, K.; Vijaya-Raghavan, A.P.; Antonisamy, B. Cancer detection by native fluorescence of urine. J. Biomed. Opt. 2010, 15, 057003–057009. [Google Scholar] [CrossRef] [PubMed]
  28. Hariri, L.P.; Tumlinson, A.R.; Besselsen, D.G.; Utzinger, U.; Gerner, E.W.; Barton, J.K. Endoscopic optical coherence tomography and laser-induced fluorescence spectroscopy in a murine colon cancer model. Laser Surg. Med. 2006, 38, 305–313. [Google Scholar] [CrossRef] [PubMed]
  29. Palmer, G.M.; Keely, P.J.; Breslin, T.M.; Ramanujam, N. Autofluorescence spectroscopy of normal and malignant human breast cell lines. Photochem. Photobiol. 2003, 78, 462–469. [Google Scholar] [CrossRef]
  30. Drezek, R.; Brookner, C.; Pavlova, I.; Boiko, I.; Malpica, A.; Lotan, R.; Follen, M.; Richards-Kortum, R. Autofluorescence microscopy of fresh cervical-tissue sections reveals alterations in tissue biochemistry with dysplasia. Photochem. Photobiol. 2001, 73, 636–641. [Google Scholar] [CrossRef]
  31. Pavlova, I.; Sokolov, K.; Drezek, R.; Malpica, A.; Follen, M.; Richards-Kortum, R. Microanatomical and biochemical origins of normal and precancerous cervical autofluorescence using laser-scanning fluorescence confocal microscopy. Photochem. Photobiol. 2003, 77, 550–555. [Google Scholar] [CrossRef]
  32. Evers, D.; Hendriks, B.; Lucassen, G.; Ruers, T. Optical spectroscopy: Current advances and future applications in cancer diagnostics and therapy. Future Oncol. 2012, 8, 307–320. [Google Scholar] [CrossRef] [PubMed]
  33. Scott, W.J.; Howington, J.; Feigenberg, S.; Movsas, B.; Pisters, K. Treatment of non-small cell lung cancer stage I and stage II: Accp evidence-based clinical practice guidelines. Chest 2007, 132 (Suppl. 3), 234S–242S. [Google Scholar] [CrossRef] [PubMed]
  34. Proietti, A.; Alì, G.; Pelliccioni, S.; Lupi, C.; Sensi, E.; Boldrini, L.; Servadio, A.; Chella, A.; Ribechini, A.; Cappuzzo, F. Anaplastic lymphoma kinase gene rearrangements in cytological samples of non–small cell lung cancer: Comparison with histological assessment. Cancer Cytopathol. 2014, 122, 445–453. [Google Scholar] [CrossRef] [PubMed]
  35. Berezin, M.Y.; Achilefu, S. Fluorescence lifetime measurements and biological imaging. Chem. Rev. 2010, 110, 2641–2684. [Google Scholar] [CrossRef] [PubMed]
  36. Kalaivani, R.; Masilamani, V.; Alsalhi, M.S.; Devanesan, S.; Ramamurthy, P.; Palled, S.R.; Ganesh, K.M. Cervical cancer detection by time-resolved spectra of blood components. J. Biomed. Opt. 2014, 19, 321–326. [Google Scholar] [CrossRef] [PubMed]
  37. Koziol, B.; Markowicz, M.; Kruk, J.; Plytycz, B. Riboflavin as a source of autofluorescence in eisenia fetida coelomocytes. Photochem. Photobiol. 2006, 82, 570–573. [Google Scholar] [CrossRef] [PubMed]
  38. Pu, Y.; Tang, G.; Wang, W.; Savage, H.; Schantz, S.; Alfano, R. Native fluorescence spectroscopic evaluation of chemotherapeutic effects on malignant cells using nonnegative matrix factorization analysis. Technol. Cancer Res. Treat. 2011, 10, 113–120. [Google Scholar] [CrossRef] [PubMed]
  39. Jing, Y.; Song, C.; Ma, J.; Mi, L. Diagnosis of cervical cancer by auto-fluorescence spectrum. In Proceedings of the International Conference Innovative Optical Health Science, Shanghai, China, 10–12 October 2016.
  40. Masilamani, V.; Al-Zhrani, K.; Al-Salhi, M.; Al-Diab, A.; Al-Ageily, M. Cancer diagnosis by autofluorescence of blood components. J. Lumin. 2004, 109, 143–154. [Google Scholar]
  41. Zhuo, S.; Yan, J.; Chen, G.; Chen, J.; Liu, Y.; Lu, J.; Zhu, X.; Jiang, X.; Xie, S. Label-free monitoring of colonic cancer progression using multiphoton microscopy. Biomed. Opt. Express 2011, 2, 615–619. [Google Scholar] [CrossRef] [PubMed]
  42. Ostrander, J.H.; McMahon, C.M.; Lem, S.; Millon, S.R.; Brown, J.Q.; Seewaldt, V.L.; Ramanujam, N. Optical redox ratio differentiates breast cancer cell lines based on estrogen receptor status. Cancer Res. 2010, 70, 4759–4766. [Google Scholar] [CrossRef] [PubMed]
  43. Spliethoff, J.W.; Evers, D.J.; Klomp, H.M.; Sandick, J.W.V.; Wouters, M.W.; Nachabe, R.; Lucassen, G.W.; Hendriks, B.H.W.; Wesseling, J.; Ruers, T.J.M. Improved identification of peripheral lung tumors by using diffuse reflectance and fluorescence spectroscopy. Lung Cancer 2013, 80, 165–171. [Google Scholar] [CrossRef] [PubMed]
  44. DaCosta, R.; Andersson, H.; Cirocco, M.; Marcon, N.; Wilson, B. Autofluorescence characterisation of isolated whole crypts and primary cultured human epithelial cells from normal, hyperplastic, and adenomatous colonic mucosa. J. Clin. Pathol. 2005, 58, 766–774. [Google Scholar] [CrossRef] [PubMed]
  45. Wang, Y.; Song, C.; Wang, M.; Xie, Y. Rapid, label-free, and highly sensitive detection of cervical cancer with fluorescence lifetime imaging microscopy. IEEE J. Sel. Top. Quantum Electron. 2015, 22, 6801307. [Google Scholar] [CrossRef]
  46. Mujat, C.; Greiner, C.; Baldwin, A.; Levitt, J.M.; Tian, F.; Stucenski, L.A.; Hunter, M.; Kim, Y.L.; Backman, V.; Feld, M. Endogenous optical biomarkers of normal and human papillomavirus immortalized epithelial cells. Int. J. Cancer 2008, 122, 363–371. [Google Scholar] [CrossRef] [PubMed]
  47. Richards-Kortum, R.; Sevick-Muraca, E. Quantitative optical spectroscopy for tissue diagnosis. Annu. Rev. Phys. Chem. 1996, 47, 555–606. [Google Scholar] [CrossRef] [PubMed]
  48. Takahashi, K.; Ikeda, N.; Nonoguchi, N.; Kajimoto, Y.; Miyatake, S.-I.; Hagiya, Y.; Ogura, S.-I.; Nakagawa, H.; Ishikawa, T.; Kuroiwa, T. Enhanced expression of coproporphyrinogen oxidase in malignant brain tumors: CPOX expression and 5-ALA–induced fluorescence. Neuro Oncol. 2011, 13, 1234–1243. [Google Scholar] [CrossRef] [PubMed]
  49. Yang, S.-J.; Shieh, M.-J.; Lin, F.-H.; Lou, P.-J.; Peng, C.-L.; Wei, M.-F.; Yao, C.-J.; Lai, P.-S.; Young, T.-H. Colorectal cancer cell detection by 5-aminolaevulinic acid-loaded chitosan nano-particles. Cancer Lett. 2009, 273, 210–220. [Google Scholar] [CrossRef] [PubMed]
  50. Kalaivani, R.; Masilamani, V.; Sivaji, K.; Elangovan, M.; Selvaraj, V.; Balamurugan, S.; Al-Salhi, M. Fluorescence spectra of blood components for breast cancer diagnosis. Photomed. Laser Surg. 2008, 26, 251–256. [Google Scholar] [CrossRef] [PubMed]
  51. Masilamani, V.; AlSalhi, M.S.; Vijmasi, T.; Govindarajan, K.; Rai, R.R.; Atif, M.; Prasad, S.; Aldwayyan, A.S. Fluorescence spectra of blood and urine for cervical cancer detection. J. Biomed. Opt. 2012, 17, 0980011–0980016. [Google Scholar] [CrossRef] [PubMed]
  52. Forget, P.; Machiels, J.-P.; Coulie, P.G.; Berliere, M.; Poncelet, A.J.; Tombal, B.; Stainier, A.; Legrand, C.; Canon, J.-L.; Kremer, Y. Neutrophil: Lymphocyte ratio and intraoperative use of ketorolac or diclofenac are prognostic factors in different cohorts of patients undergoing breast, lung, and kidney cancer surgery. Ann. Surg. Oncol. 2013, 20, 650–660. [Google Scholar] [CrossRef] [PubMed]
  53. Cedres, S.; Torrejon, D.; Martinez, A.; Martinez, P.; Navarro, A.; Zamora, E.; Mulet-Margalef, N.; Felip, E. Neutrophil to lymphocyte ratio (NLR) as an indicator of poor prognosis in stage IV non-small cell lung cancer. Clin. Transl. Oncol. 2012, 14, 864–869. [Google Scholar] [CrossRef] [PubMed]
  54. Domagala-Kulawik, J. Effects of cigarette smoke on the lung and systemic immunity. J. Physiol. Pharmacol. 2008, 59, 19–34. [Google Scholar] [PubMed]
Figure 1. HE and autofluorescence images of lung tissue samples: (a) normal tissue; (b) adenocarcinoma; (c) squamous carcinoma; and (d) blood vessel in lung tissue. Scale bar is 50 μm.
Applsci 07 00032 g001
Figure 2. Autofluorescence 3D images of (a) normal (Video S1) and (b) cancerous (Video S2) lung tissues at different depths. Scale bar is 50 μm.
Applsci 07 00032 g002
Figure 3. Two example spectra curves of (a) normal and (b) cancerous lung tissue samples.
Applsci 07 00032 g003
Figure 4. Scatterplot of the average ratio of (a) INADH/IFAD and (b) I630 nm/I590 nm for the normal (solid square) tissues and cancerous tissues (hollow triangle) from the ten lung cancer patients.
Applsci 07 00032 g004
Table 1. The fitting parameters are reported as excitation wavelength, emission peak, and full width at half maximum (FWHM) of different fluorophores [38,39,40].
FluorophoresExcitation (nm)Emission Peak (nm)FWHM (nm)
Free NADH [39]40548784
Protein-bound NADH [39]40550164
Free FAD [39]40554475
Basic form of porphyrins [40]40559025
Neutral form of porphyrins [40]40563025
Tryptophan [38]28734265
Collagen [38]33938040
Elastin [38]35141070

