Article

Strength Correlation and Prediction of Engineered Cementitious Composites with Microwave Properties

School of Civil Engineering, Qingdao University of Technology, Qingdao 266033, China
*
Author to whom correspondence should be addressed.
Appl. Sci. 2017, 7(1), 35; https://doi.org/10.3390/app7010035
Submission received: 10 November 2016 / Revised: 7 December 2016 / Accepted: 14 December 2016 / Published: 27 December 2016
(This article belongs to the Special Issue Structural Health Monitoring (SHM) of Civil Structures)

Abstract

:
This paper presents the results of microwave and mechanical measurements of engineered cementitious composites (ECCs) using a nondestructive microwave near-field detecting technique. The objective of this research is to investigate the correlations between effective conductance and compressive strength of ECCs at various curing ages under the influence of different initial water contents. Parallel measurements and regression analysis on compressive strength and microwave conductance were undertaken. It is shown that the strength evolution of ECCs can be accurately modeled and predicted by using microwave conductance at the early ages using bi-exponential functions. Compressive strength grows as a function of decreasing effective conductance, whereas the regression coefficients of the correlation models have a linear variation with water-to-binder ratios. These findings have highlighted the effectiveness of the microwave technique in detecting the variation of liquid phase morphology and pore structure.

1. Introduction

Determining the compressive strengths at different curing ages of ordinary concrete in situ is of primary importance for ensuring safety in construction. The compressive strength estimated on the 28th day has been widely used as a vital indication of the strength development of cementitious materials in industry [1]. Over the past few decades, nondestructive detecting and monitoring techniques have become popular in structure health monitoring (SHM) and evaluations as they offer many advantages over the conventional destructive techniques. As the microstructures of cement-based materials (CBMs), like pores and hydration compounds, govern their macroscale mechanical behavior, great efforts and various techniques have been employed to study and evaluate the process and the mechanism of microstructure during hydration in order to establish the strength prediction. Conventional thermal-based monitoring of heat generation leading to temperature increases during the hydration process was used in bridge and dam construction [2], whereas the compressive strength of CBMs in relation to the reflection loss of ultrasonic waves was investigated in [3]. An ultrasound technique was used to evaluate the compressive strength of CBM with added mineral admixtures, where compressive strength and ultrasonic pulse velocity were measured and correlated for days 3, 7, 28 and 120 of the curing period [4]. The relationship between pulse velocity and compressive strength was, hence, found to fall within the trend of exponential functions. A novel technique that made use of a fuzzy logic system to correlate the early-age CBM strength with harmonic amplitudes using smart aggregate was presented in [5]. Crack detection, hydration monitoring and energy harvesting using similar embedded piezoelectric transducers were reported in [6,7,8]. Recently, good correlation between acoustic emission energy at low frequency (25–100 kHz) and plastic strain energy of reinforced concrete specimens was established in [9,10]. An active acoustic method at a lower frequency of around 6 kHz was also employed [11] to monitor setting and hardening in concrete at early ages, wherein the P-wave velocity and attenuation coefficient were used to characterize the development of calcium silicate hydrate (C-S-H) gel inside the concrete and, hence, predict strength growth during early ages. However, the aforementioned detecting techniques require in situ embedded sensors to be set up and or non-real time signal post-processing. For example, they need wired sensor pair matches, sensor locations and alignments, and so on. All of these require prior precise arrangement and calibration, and therefore will be high-cost and time-consuming, as they were applied to large-scale CBM’s monitoring.
Conversely, simple, direct detection of intrinsic electrical properties, e.g., direct current (dc) resistivity, of CBM during hydration was proposed [12,13]. The four-probe (Wenner method) resistivity measurement used a simple setup, where no embedded sensors and alignment were required. However, the simple method suffers from accuracy problems due to the contact resistance between electrodes and CBM specimens being tested, as well as due to the possible shrinkage gap. To combat such problems, Li et al. introduced a non-contact measurement approach to monitor the hydration process of early-age concrete through electrical resistivity using alternative current (ac) transformer method [14]. It was found that non-contact resistivity measurement was appropriate for precise monitoring of CBM at very early-age period since the technique was sensitive to the ionic concentrations and mobility in the liquid or pore solution [15]. However, the transformer-based method has its limitations in terms of operating frequency because the accuracy of measured resistivity is a function of frequency [16]. The actual measured value is the complex impedance rather than the pure resistance, and thus could not truly reflect the hydration process, especially at higher frequency beyond 30 kHz. This is attributed to the high magnetization reactance and high core loss of the transformer at high frequencies.
In this paper, the authors propose a microwave near-field detecting approach to monitor the development of microstructure of CBM via the change of effective conductance during early-age hydration, where the degree of hydration relates to concrete’s temperature response [17]. Moreover, the changes in the conductivity of hardening CBM are known to be the outcomes of microstructure development in the hydrating CBM. The CBM can be considered as a homogenous dielectric slab with an effective complex permittivity (εc = ε’ − jε”). Dispersion in CBM is mainly due to the presence of liquid phase, which is actually a water solution of salts and chemical compounds sourcing from the cement components. According to the extended Debye model of dielectric materials, the imaginary part takes account of the energy losses due to the dielectric relaxation and the effective electrical conductivity (σeff) of CBM, and is given by [18]
ε e f f ( ω ) = σ e f f ( ω ) ω = σ d c ω + ω τ Δ ε 1 + ω 2 τ 2 ,
where σdc is the dc conductivity, and Δε = εdcε is the difference between values of the real part of the complex relative permittivity at very low and very high frequency, respectively, and τ is the relaxation time in second (s) whereas ω is the angular frequency in s−1.
From (1), it is known that the four-probe direct resistivity measurement method may only account for part of bulk conductivity, namely, the dc conductivity of CBM during hydration. Moreover, the losses due to dielectric relaxation and dipole polarization are not to be included in the transformer non-contact measurement method because a low frequency (10 kHz) was used [14,15]. Nondestructive microwave near-field detecting techniques have remarkable applications, such as estimating compressive strength [19] and cure-state monitoring of CBM [20,
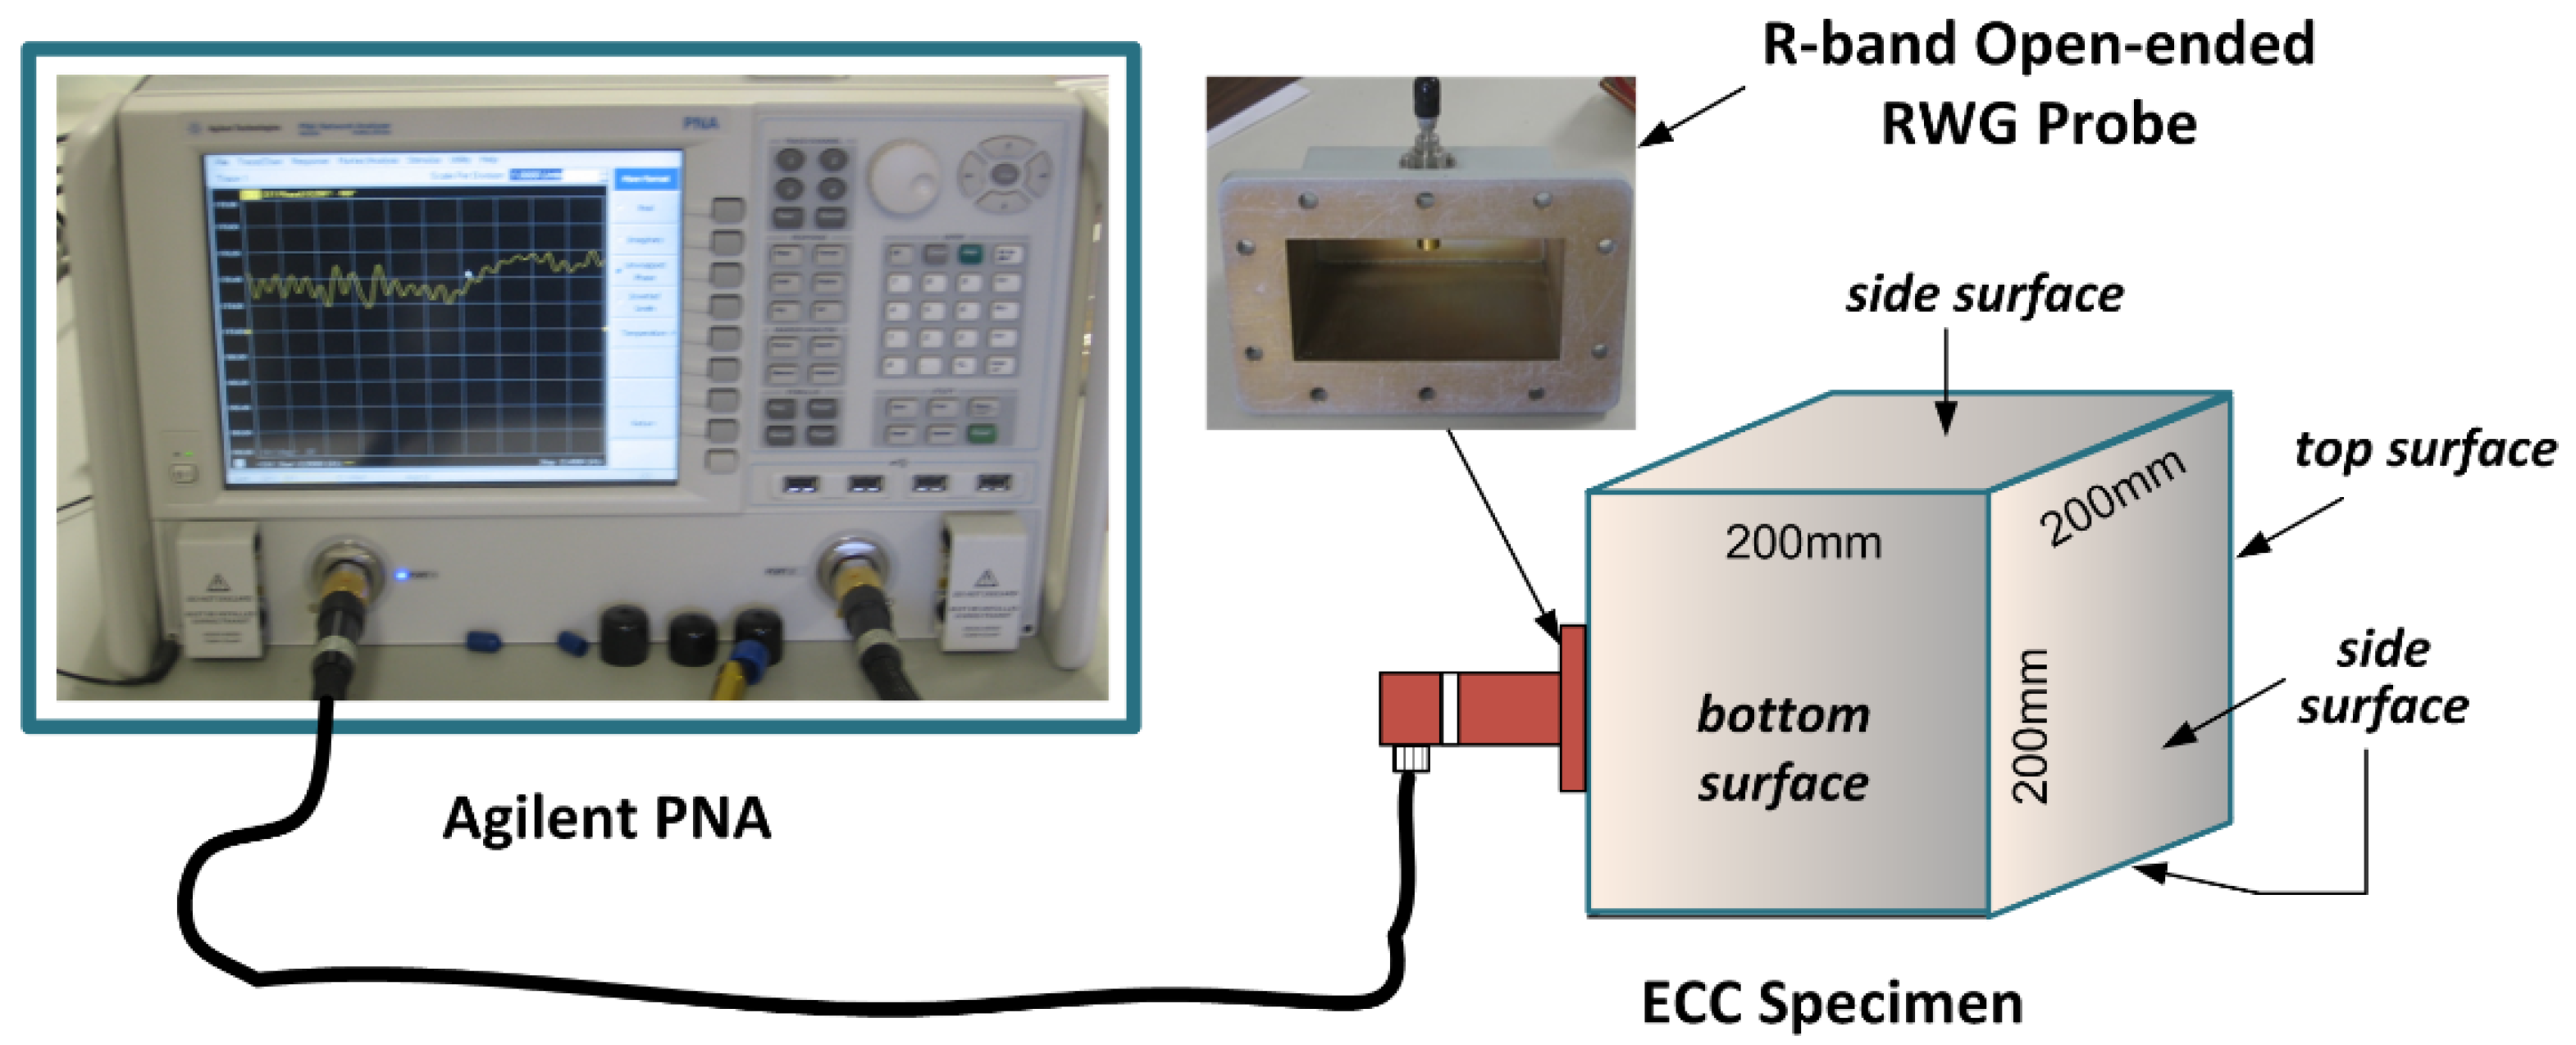
21]. The chosen microwave frequency allows electromagnetic (EM) energy to penetrate deeper into the specimen [21,22], and hence a near-field technique at a microwave frequency of 2 GHz was used in this study. The goal was to measure the bulk effective conductance that accounted for all types of loss in order to monitor the development of microstructure of CBMs under the influence of various water-to-cement ratios [21,23].
The objectives and applications of the aforementioned studies were to make compressive strength of CBM predictable and improve monitoring efficiency at early ages of the materials. However, these studies were largely focused on the traditional materials like concrete, mortar, and or cement paste, with less attention on the new type of cement composites. With the advent of ultra-ductile fiber-reinforced composites like engineered cementitious composite (ECC) [24,25], substantial developments in commercialization and research of ECC technologies have materialized both in the academic and industrial communities [26,27,28]. ECC uses moderate amount of polyvinyl alcohol (PVA) fiber in volume fraction of 2%, but offers tensile ductility several hundred times higher than the conventional CBMs [25]. The present study developed two correlation models between compressive strength and effective electrical conductance measured at early ages. The goal was to monitor the strength evolution by means of early-age conductance and hence to predict the final compressive strength under influence of initial water-to-binder (w/b) ratios. It is known that compressive and flexural strengths of ECC are sensitive to initial water content at all ages. However, PVA fibers are hydrophilic material so they absorb water and provide a strong interfacial bond with the cementitious matrix and thereby have a favorable effect on strength development. Furthermore, commercially available PVA fiber, in general, has unknown water absorption characteristics. Therefore, one of the objectives in this study was to differentiate the effect of tight water contents inside PVA-ECC matrixes using effective electrical conductance.

2. Methodologies

The nondestructive microwave near-field technique and the conventional (destructive) mechanical compressive strength test were both employed in this study. The electrical conductance at a microwave frequency used in this study is the normalized conductance (dimensionless) known as the effective conductance, and it accounted for electromagnetic energy loss in cementitious material [18,21]. Initial water content used during mixing plays a crucial role in the hydration reactions of cement binder system. Water acts as conductive media and then, after the dielectric loss at microwave frequencies, it combines the conductive loss effects associated with the acceleration of free ions in the interstitial pore. Furthermore, the effective conductance is partly attributed to the dipolar loss effects associated with molecular rotation of water, and the interstitial build-up of charges within the capillary pores. Therefore, in this study the authors measured electrical conductance via the near-field technique, in which decrease in conductance directly reflects reductions of water content during hydration of ECC specimens.
The average values of measured microwave data from each measurement were curve-fitted and modelled by means of bi-exponential regression functions. In order to evaluate the strength prediction and strength evolution monitoring using microwave properties, the correlations between compressive strength and microwave conductance were established via the method of curve mapping. Figure 1 shows the block diagram of the parallel processes undertaken in this study. The mix of PVA-ECC materials and the casting of different shapes of specimens were performed on the same day, defined as Day-0. In consecutive experimental and computational processes, electromagnetic near-field and mechanical measurements were simultaneously performed for the same PVA-ECC materials with different initial water-to-binder (w/b) ratios. The daily decay of conductance at early ages (first 8 days) as well as the growing compressive strength of ECC specimens for 28 days were modelled using exponential regression functions. These two physical properties via respective early-age (conductance) and mature-age (strength) models were then correlated, and the ultimate goal was to predict the compressive strength by means of effective microwave conductance.

2.1. PVA-ECC Specimen Mix Design

The ECC mixes integrate general purpose cement (Type-GP cement conforms to AS3972-1997), fine silica sand (supplied by Sibelco Australia), ASTM class-F fly ash, polyvinyl alcohol (PVA) fibers, water, and admixture. The silica sand has a maximum size and a mean grain size of 250 μm and 122 μm, respectively. The PVA fibers are the essential admixture that allows the ECCs to exhibit excellent ductility and strain hardening behavior. A standard PVA fiber at a volume fraction of 2% was used in this study. This fiber fraction has been proven to offer an interfacial bond and was tailored to satisfy the strain-hardening criteria [24]. The mechanical and physical properties of the PVA fibers are listed in Table 1. Throughout the study, the standard mix design of PVA-ECC (ECC-M45) with a water-to-binder (w/b) ratio of 0.255 as initiated by Li et al. [24,25] was used as the reference ECC mix, which is designated as PE2. The binder system was defined as the total amount of raw cementitious materials, such as cement and fly-ash. The ingredients and mix proportions of ECC mixes are given in Table 2, where a sand-to-binder ratio (s/b) of 0.364 is used for all mixes. The use of fine sand, fiber volume fraction, ratios of s/b and w/b was optimized to satisfy the multiple cracking criteria [25]. The chemical compositions of the raw materials, Portland cement (PC), fine sand (FS), and Class-F fly ash (FA-F), were analyzed by using the scanning electron microscope (SEM) of JEOL JSM6510LV. The corresponding chemical compositions are shown in Table 3. From the analysis one can see that the ECC mixtures have a higher amount and finer particle size of chemical constituent of silica (SiO2) than common concrete mixes.
In order to investigate the effect of slight variations in w/b ratio, reference PVA-ECC materials with decreases (w/b = 0.20) and increased (w/b = 0.30) initial water content were included in the experimental program. The corresponding ECC materials are denoted as PE1 and PE3, respectively, as displayed in Table 2. Except the use of high range water reducer (HRWR) admixture, all other proportions with respect to cement remained constant for all ECC specimens. Owing to the water demand from PVA fibers, which affected the rheological properties to a different degree from batch to batch, appropriate amounts of HRWR admixture were empirically added into the mixes. Moreover, with the aim of improving fiber distribution and, hence, obtaining better mechanical properties of ECC, a new mixing sequence [29] was used in this study. In order to obtain good plastic viscosity for the ECC mixture, a 40 L Hobart planar mixer was used throughout the experiment program.

2.2. Microwave Near-Field Detecting Technique

2.2.1. Preparation of ECC Specimens for Microwave Measurement

For the purpose of obtaining conformity measurement, three ECC (PE1, PE2 and PE3) cubes with 200 mm sides were cast and prepared for daily measurement. The purpose of choosing a relatively large cube size was to make an approximate infinite half space as seen by the open-ended rectangular waveguide (RWG) probe at R-band frequencies. After casting, the cubic specimens were moved inside a laboratory for natural air curing for about 24 h and then demolded. The laboratory has an automatic climate control to maintain a temperature of 24 ± 2 °C and a humidity of 50% ± 5%.

2.2.2. Microwave Measurement Setup

The schematic of the measurement setup is illustrated in Figure 2; an Agilent N5225A performance network analyzer (PNA) capable of generating continuous wave signals from 100 MHz to 50 GHz was used. The monitoring of electrical properties of ECC specimens was undertaken by using an R-band RWG probe (WR-430) that has an aperture size of 4.30 inches (109.22 mm) × 2.15 inches (54.61 mm). The RWG probe was connected to a single port of PNA that supplied a constant output power of −5 dBm via a flexible microwave cable. At the beginning of daily measurement, a calibration was the crucial procedure in order to achieve accurate measurement results. When calibrating the system with RWG probe, the impedance of a ‘matched load’ was used as the impedance reference. The load impedance was matched to the waveguide characteristic impedance across the frequency bandwidth of R-band. Normalized impedance was then attained by setting OFFSET Z0 to 1 ohm for each standard and setting system Z0 (SET Z0) of the PNA to 1 ohm [30].

2.2.3. Measurement Techniques

In measurement, the authors used the near-field reflection wave approach [20,21]. The complex reflection coefficient (Г) was obtained and computed from the PNA using signal reflected from the ECC specimen under test. The PNA was capable of direct displaying a normalized admittance (unit-less) from the built-in inverse Smith chart with approximate loaded waveguide probe admittance (YL). The measured normalized admittance (yL) has a complex form as
y L ( ω ) = Z o Z L ( ω ) = Y L ( ω ) Y o = g ( ω ) + j b ( ω )
where Yo = 1/Zo is the waveguide characteristics admittance in unit of Siemens; g(ω) and b(ω) are, respectively, the normalized conductance and normalized susceptance at frequency ω, and j is an imaginary number with a value of the square root of −1.
In this study, a direct measurement of normalized admittance (both the real and imaginary parts) in a single step was used. The reflection coefficient with respect to the RWG aperture and the normalized admittance have the following relationship:
Γ ( ω ) = Y o Y L ( ω ) Y o + Y L ( ω ) = 1 y L ( ω ) 1 + y L ( ω )
Effective electrical conductance was directly related to the dielectric properties of CBMs with high water/moisture content at early ages, and thus more suitable for measurement of early-age CBMs during hydration [21]. Daily near-field measurement was undertaken for PE2 and PE3 specimens from Day-1 to Day-8, whereas measurement of PE1 commenced on Day-2 due to its late casting and hydration. For each specimen, 10 measurements were performed on non-overlapping locations of each side surface excluding the top and bottom surface, to avoid high surface roughness. Therefore, a total of 40 readings of normalized electrical admittance for each specimen were recorded in such a way that the side-surfaces were rotated in turn for measurement. The average and standard deviation values of these 40 measurements would be used to represent the daily variations of microwave properties for each specimen. In order to obtain measurement results under consistent environmental conditions, surface temperature and humidity of specimens were monitored during the measurement.

2.3. Mechanical Destructive Compression Test

2.3.1. Preparation of ECC Specimens for Compression Test

Compressive strength of cementitious materials is the main parameter utilized in civil structural design processes, such as construction scheduling and formwork stripping, that call for this property, particularly at their early ages. Following the regression modelling of compressive strength evolution, the goal of this study is to establish correlations between electrical conductance at 2 GHz and compressive strength of ECC matrixes having different initial water contents. To realize this, a number of cylindrical specimens for each specimen were cast for compression tests on Day-3, Day-7, Day-14 and Day-28, respectively. Namely, three cylinders had a standard dimension of 100 mm in diameter and 200 mm in height for compression test on the prescribed ages. Prior to the destructive test, all specimens were capped with sulphur mortar in accordance with AS 1012.9 [31] in order to ensure the cylinders had uniform bearing surfaces with minimum gaps for the contact surfaces of the compression machine.

2.3.2. Compressive Strength Measurement

The compression tests were performed in accordance with ASTM C39 [32] for the cylindrical specimens using a displacement control method. The axial concentric load was steadily applied to the specimen using an INSTRON testing machine with 10 MN hydraulic load capacity. The compressive load was transmitted through a steel bearing block that had a disc shape. The applied load with a rate of 1 mm/min was applied until incidence of specimen failures, as shown in Figure 3. The average value of the maximum compressive stress in MPa would be used for each specimen on each testing day.

3. Experimental Measurements and Results

3.1. Electrical Conductance Measurement from Early-Age ECCs

As mentioned before, the ECC specimens (PE1, PE2 and PE3) had small differences in their initial water content, and moreover, the PVA fibers had unknown water absorption in each batch of mix. All of these factors would lead to a challenge in distinguishing ECC specimens using conventional resistivity measurement methods. The nondestructive microwave near-field technique is a powerful way to detect such small differences at lower microwave frequency regimes, as illustrated in Figure 4. It should be mentioned that the measurement of the PE1 specimen commenced on Day-2 whereas the measurements of the other two started on Day-1. This was owing to the difficulty of modus dismounting as the PE1 mix had the minimum water content per unit volume but needed a high amount of HRWR in order to maintain the target workability. Figure 4a shows the detected normalized conductance of all specimens having their values crossover (transition) [21] (see also Figure 7) on Day-3, whereas Figure 4b shows the effective conductance in proportion with the water contents of PE1, PE2 and PE3 in order, across the R-band. It is observed that the electrical conductance decreases daily according to a way of exponential decay although the values are hardly to be observed in frequency domain of Figure 4. To verify this observations on the daily decay values of conductance in frequency domain, the measured effective conductance was further expressed in temporal domain as shown in Figure 5. The relative small values of electrical susceptance were not investigated in this study.

3.2. Mechanical Compression Test Results

Like other cementitious materials, the overall picture of ECC quality is predominantly reflected by the compressive strength. It is known that the strength evolution process, hardening with time, depends on the chemical reaction of binder (cement plus fly-ash) with free water and hence the development of a microstructure inside the composites. Three cylindrical specimens were prepared for ECC with different w/b ratios for testing of compressive strength on Day-3, Day-7, Day-14 and Day-28, respectively, using the conventional compression test method. Figure 6 shows the average values with corresponding standard deviations of compressive strength of ECC specimens. It is observed, merely from the measurement data, that the strength growing rate of PE2 is comparatively higher than other counterparts. Nevertheless, the 28-day strength values show the ECC specimens have reasonable final strength gain at a mature age. Namely, PE1 specimens having the lowest w/b result in the highest 28-day strength whereas the PE2 and PE3 specimens have their lower strengths.

4. Mathematical Modelling of Experimental Results

4.1. Microwave Conductance Modelled by Bi-Exponential Regressions

The authors modelled the temporal responses of effective conductance shown in Figure 5, using a bi-exponential regression function, as given by
g 2 ( t ) = A 1   e x p ( t b ) + A 2   e x p ( t c ) ,   1 t 8
where g2(t) is the regression function intended to model the reduction of conductance at 2 GHz as shown in Figure 7, and t represents the time variable. A1, A2, b, and c are the regression coefficients.
The bi-exponential function consists of two terms characterizing the decay in conductance with age. The first term is an approximate ramp function that imitates the steady slow decay in the later response, namely, conductance decreases linearly from Day-4 to Day-8, whereas the second term is a first-order exponential decay function that imitates the rapid decay of conductance in the first 3 days. It is observed that the bi-exponential functions have excellent goodness of fits, as verified by the values of R2, than the single time-constant exponential functions used in [20,21]. All the fitting coefficients of (4) and goodness of fits are summarized in Table 4.
To understand the physical meanings of the modelling functions, especially, the conductance variations and their decaying rates against the strength development at early ages as well as the effect of water-to-binder ratio (w/b), the step responses of the second term of regression functions were examined, as shown in Figure 8a. It is observed that the acquired time constants of the normalized curves (second terms) are distinguishable and varied as a function of w/b. We hence conclude that the responses are reasonable against the initial water contents of the ECC mixes, and the time constant (c) can be used to monitor the changes of moisture inside each specimen. As shown in Figure 8a, the decay time constant (ci) indicates the time/age for the bulk electrical conductance of an ECC material decreasing in value to exp(−1) or 36.8% from a step decrease. The regression coefficients A1 and c varies linearly with increasing w/b, as shown in Figure 8b. The coefficient A1 is the initial value of the first term of the bi-exponential regression, which can be considered the extrapolation point of the slow declining ramp function.

4.2. Compressive Strength Modelled by using Bi-Exponential Regressions

Exponential regression methods are known to be well-suited for the fitting of growing/decaying data with time [13,20,21]. In particular, the mean compressive strength of cement concrete at times other than 28 days can be estimated, as long as the type of cement is known [33]. In this study, the measured results of compressive strength of ECCs, which grow with age for 28 days, were modelled by using the bi-exponential regression as given in (5).
f c ( t ) = S 1   e x p ( t d ) + S 2   e x p ( t e ) ,   0 t 28  
where S1 and S2 are the initial values of the two exponential terms, respectively, and d and e are the regression coefficients. Table 5 summarizes all regression coefficients and the goodness of fit values, whereas the regression curves are plotted against age as shown in Figure 9.
For a better understanding the strength modelling using the bi-exponential regressions, the fitting curves (fcs21, fcs22, fcs23) of (5) were resolved into two terms as shown in Figure 10a for comparison. We examined the fact that the first terms are the approximate ramp functions with small slopes, whereas the second terms are the exponential growth functions in which the strength curve has different growing rates due to different initial water contents. Through further analysis of the unit-step responses of the second terms of (5) as shown in Figure 10b by using the criterion of exp(−1), the values of time constants e1, e2, and e3 are verified as the same as that given in Table 5. However, the magnitudes of the time constants are in the reverse order of the initial water contents, i.e., e1 > e2 > e3. Figure 11a shows the variation of time constants versus the w/b; this linear curve indicates the strength evolution is inversely proportion to the initial water content. Namely, the higher the w/b ratio of ECC specimen features, the faster the rate of strength evolution; however, it has a lower final strength. This statement can be further verified using (5) by putting t = 28 days to obtain the compressive strengths for PE1, PE2 and PE3 specimens, respectively, and compared with the measured data, as shown in Figure 11b. Moreover, the 28-day strength of bi-exponential functions exhibits a linear decay relation with w/b, which corroborates the results for the normal cementitious materials, e.g., [20,21]. This decline relation is highly expected in this study of PVA-ECC specimens despite the unknown factor of water absorption from the PVA fibers.

4.3. Correlations between Compressive Strength and Conductance

In this section, the correlations between compressive strength and electrical conductance are established via data mapping of (4) and (5). As the first step, effective conductance at 2 GHz is calculated using (4) and compressive strength is obtained using (5), both through the bi-exponential functions for the first 8 days. The compressive strength of all ECC specimens is developing while electrical conductance decays with time as shown in Figure 12a. All (three) strength-conductance curves (S-C curves for short) have similar trends in accordance with hydration process—reducing the free water whilst C-S-H gels are developed inside specimens. It is observed that the S-C curves of PE1 and PE2 have alike behaviors in the conductance range of 3.1 to 3.5, whereas the S-C curves of PE2 and PE3 have close behaviors in the conductance range of 3.6 to 5. Meanwhile, the S-C curves show that when conductance equals 3.54 both the PE1 and PE3 specimens yield a strength value of 24 MPa while PE2 exhibits a higher strength of about 28 MPa. This observation agrees with the strength values of ECC specimens on Day-3 as shown in Figure 6 and Figure 9. As the second step, all ECC mixes with similar initial w/b ratios in the range of 0.20–0.30 are considered as a global set of S-C data from Day-1 to Day-8. A generic regression model is established by fitting all S-C data using a single function in bi-exponential form, as given by
f c s 2 ( g 2 ) = 3236   e x p ( 1.53 · g 2 ) + 19.97   e x p ( 0.14 · g 2 )
The bi-exponential regression function (6) fitted with data as shown in Figure 12b, where the goodness of fit is R2 = 0.8829 and RMSE = 3.138. Electrical conduction at high frequency such as 2 GHz occurs due to dielectric relaxation, dipolar loss, and ion transport through pore solution and is strappingly related to moisture content, porosity and ion concentration inside the CBMs. The reduction of effective conductance reflects the growth of C-S-H gels and thus the strength gains. Therefore, one can use this generic function to monitor the strength evolution of ECC specimens as long as the w/b ratio has fallen into the range of 0.20–0.30.
As the final step for forming correlations between compressive strength and effective conductance, the effect of different w/b ratios on compressive strength is further considered. The authors developed a more accurate regression function (7), by taking the w/b ratio as a dependent variable, as given by
f c s 2 ( g 2 , w b ) = K g 2 ( w / b ) m
where K and m are the regression coefficients of (7).
Figure 13 shows the performance of the proposed regression functions as a function of effective conductance at 2 GHz (g2). Function proposed for the PE1 (w/b = 0.20) mix is shown in Figure 13a whereas functions fitting individual data sets of PE2 (w/b = 0.255) and PE3 (w/b = 0.30) are shown in Figure 13b. Table 6 summarizes the fitting coefficients and goodness of fit for (7). The rational model of (7) gives more meaning yet a simpler form than the bi-exponential model of (6), both the coefficients K and m are varying linearly with increasing w/b, which can be used as indications for distinguishing water contents of ECC specimens.

5. Conclusions

This paper presents the compressive strength prediction and correlations of engineered cementitious composites (ECCs) by means of early-age microwave conductance using a nondestructive microwave detecting technique. The measurements of effective conductance and compressive strength were undertaken in parallel for the same type of ECC specimens with different water-to-binder ratios. Near-field measurement was conducted daily in the first eight days whereas the compression test was performed in accordance with the standard ASTM-C39 till 28 days of age. Innovative models for the correlations of compressive strength against effective conductance were developed and analyzed. The following conclusions can be drawn within the scope of this study:
  • The decay of conductance at 2 GHz is modelled by using the bi-exponential regression function (4), where the time-constant of the rapid decay term increases as a function of increasing w/b.
  • The growth of compressive strength of ECC specimens till 28 days is found to be best fitted by using bi-exponential function (5). The time constant of the rapid growing term decreases as a function of increasing w/b.
  • ECC specimens have the general trend—strength develops as a function of decreasing effective conductance. This produced the ability of the microwave technique in monitoring the variation of the liquid phase morphology and pore structure.
  • When considering the ECC specimens with similar w/b ratios in the range of 0.20–0.30, a generic model is developed in a bi-exponential form for all ECC specimens as a whole, as given in (6).
  • An accurate correlation model for strength–conductance is developed by including w/b as the dependent variable. The rational correlation model effectively emulates the nonlinear evolution of compressive strength with decreasing conductance. Moreover, the two coefficients K and m increase as a linear function of increasing w/b. This makes in situ nondestructive strength predicting and monitoring feasible for concrete infrastructure.

Acknowledgments

The authors would like to express sincere gratitude to Sergiy Kharkivskiy for his kind assistance on the project and valuable comments on the revised manuscript. The research is supported by the National Natural Science Foundation of China (Project No. 51678322 and 51650110509), and the Taishan Scholar Priority Discipline Talent Group program funded by the Shan Dong Province.

Author Contributions

Kwok L. Chung and Chunwei Zhang conceived and designed the ECC experimental works; Kwok L. Chung performed the experiments whereas Jianlin Luo and Lei Yuan analyzed the data; Chunwei Zhang and Chengping Qu contributed manpower/materials/analysis facilities.

Conflicts of Interest

The authors declare no conflict of interest.

References

  1. Li, Z.J. Advanced Concrete Technology; John Wiley & Sons: Hoboken, NJ, USA, 2011. [Google Scholar]
  2. Roller, J.J.; Russell, H.G.; Bruce, R.N.; Hassett, B. Effect of curing temperatures on high strength concrete bridge girders. PCI J. 2003, 48, 72–79. [Google Scholar] [CrossRef]
  3. Sun, Z.; Voigt, T.; Shah, S.P. Temperature effects on strength evaluation of cement-based materials with ultrasonic wave reflection technique. ACI Mater. J. 2005, 102, 272–278. [Google Scholar]
  4. Demirboga, R.; Turkmen, I.; Karakoc, M.B. Relationship between ultrasonic velocity and compressive strength for high-volume mineral-admixtured concrete. Cem. Concr. Res. 2004, 34, 2329–2336. [Google Scholar] [CrossRef]
  5. Gu, H.; Song, G.B.; Dhonde, H.; Mo, Y.L.; Yan, S. Concrete early-age strength monitoring using embedded piezoelectric transducers. Smart Mater. Struct. 2006, 15, 1837–1845. [Google Scholar] [CrossRef]
  6. Kong, Q.; Feng, Q.; Song, G. Water presence detection in a concrete crack using smart aggregates. Int. J. Smart Nano Mater. 2015, 6, 149–161. [Google Scholar] [CrossRef]
  7. Qin, L.; Li, Z. Monitoring of cement hydration using embedded piezoelectric transducers. Smart Mater. Struct. 2008, 17, 055005. [Google Scholar] [CrossRef]
  8. Wang, N.; Shi, Z.; Xiang, H.; Song, G. Modeling on energy harvesting from a railway system using piezoelectric transducers. Smart Mater. Struct. 2015, 24, 105017. [Google Scholar] [CrossRef]
  9. Benavent-Climent, A.; Gallego, A.; Vico, J.M. An acoustic emission energy index for damage evaluation of reinforced concrete slabs under seismic loads. Struct. Health Monit. 2011, 11, 69–81. [Google Scholar] [CrossRef]
  10. Sagasta, F.; Benavent-Climent, A.; Roldan, A.; Gallego, A. Correlation of plastic strain energy and acoustic emission energy in reinforced concrete structures. Appl. Sci. 2016, 6, 84–98. [Google Scholar] [CrossRef]
  11. Zhang, J.; Fan, T.; Ma, H.; Li, Z. Monitoring setting and hardening of concrete by active acoustic method: effects of water-to-cement ratio and pozzolanic materials. Constr. Build. Mater. 2015, 88, 118–125. [Google Scholar] [CrossRef]
  12. McCarter, W.J.; Chrisp, T.M.; Starrs, G.; Blewett, J. Characterization and monitoring of cement-based systems using intrinsic electrical property measurements. Cem. Concr. Res. 2003, 33, 197–206. [Google Scholar] [CrossRef]
  13. Ferreira, R.M.; Jalali, S. NDT measurements for the prediction of 28-day compressive strength. NDT&E Intern. 2010, 43, 55–61. [Google Scholar]
  14. Xiao, L.; Li, Z. Early-age hydration of fresh concrete monitored by non-contact electrical resistivity measurement. Cem. Concr. Res. 2008, 38, 312–319. [Google Scholar] [CrossRef]
  15. Wei, X.; Xiao, L.; Li, Z. Prediction of standard compressive strength of cement by the electrical resistivity measurement. Constr. Build. Mater. 2012, 31, 341–346. [Google Scholar] [CrossRef]
  16. Lu, Y.; Zhang, J.; Li, Z. Study on hydration process of early-age concrete using embedded active acoustic and non-contact complex resistivity methods. Constr. Build. Mater. 2013, 46, 183–192. [Google Scholar] [CrossRef]
  17. Martinelli, E.; Koenders, E.A.B.; Caggiano, A. A numerical recipe for modelling hydration and heat flow in hardening concrete. Cem. Concr. Compos. 2013, 40, 48–58. [Google Scholar] [CrossRef]
  18. Bourdi, T.; Rhazi, J.E.; Boone, F.; Ballivy, G. Modelling dielectric-constant values of concrete: An aid to shielding effectiveness prediction and ground-penetrating radar wave technique interpretation. J. Phys. D Appl. Phys. 2012, 45, 405401. [Google Scholar] [CrossRef]
  19. Buyukozturk, O. Electromagnetic properties of concrete and their significance in nondestructive testing. J. Transp. Res. Board 1997, 1574, 10–17. [Google Scholar] [CrossRef]
  20. Zoughi, R.; Gray, S.D.; Nowak, P.S. Microwave nondestructive estimation of cement paste compressive strength. ACI Mater. J. 1995, 92, 64–70. [Google Scholar]
  21. Bois, K.J.; Benally, A.D.; Nowak, P.S.; Zoughi, R. Cure-state monitoring and w/c ratio determination of fresh Portland cement-based materials using near field microwave techniques. IEEE Trans. Instrum. Meas. 1999, 47, 628–637. [Google Scholar] [CrossRef]
  22. Chung, K.L.; Kharkovsky, S. Monitoring of microwave properties of early-age concrete and mortar specimens. IEEE Trans Instrum. Meas. 2015, 64, 1196–1203. [Google Scholar] [CrossRef]
  23. Rizzo, P.; Nasrollahi, A.; Deng, W.; Vandenbossche, J.M. Detecting the presence of high water-to-cement ratio in concrete surfaces using highly nonlinear solitary waves. Appl. Sci. 2016, 6, 104–119. [Google Scholar] [CrossRef]
  24. Li, V.C.; Wu, C.; Wang, S.; Saito, T. Interface tailoring for strain-hardening PVA-ECC. ACI Mater. J. 2002, 99, 463–472. [Google Scholar]
  25. Li, V.C. Tailoring ECC for special attributes: A Review. J. Concr. Struct. Mater. 2012, 6, 135–144. [Google Scholar] [CrossRef]
  26. Lim, Y.M.; Li, V.C. Durable repair of aged infrastructures using trapping mechanism of engineered cementitious composites. Cem. Concr. Compos. 1997, 19, 373–385. [Google Scholar] [CrossRef]
  27. Sobolev, K.; Tabatabai, H.; Zhao, J.; Flores-Vivian, I.; Muzenski, S.; Oliva, M.G.; Rose, J. Superhydrophobic Engineered Cementitious Composites for Highway Bridge Applications: Technology Transfer and Implementation. CFIRE 06-03. National Center for Freight & Infrastructure Research & Education, University of Wisconsin-Madison, 2013. Available online: www.wistrans.org/cfire/ documents/FR_CFIRE0603.pdf (accessed on 18 December 2016).
  28. Li, X.; Li, M.; Song, G. Energy-dissipating and self-repairing SMA-ECC composites material system. Smart Mater. Struct. 2015, 24, 025024. [Google Scholar] [CrossRef]
  29. Zhou, J.; Qian, S.; Ye, G.; Copuroglu, O.; Breugel, K.; Li, V.C. Improved fiber distribution and mechanical properities of engineered cementitious composites by adjusting the mixing sequence. Cem. Concr. Compos. 2012, 34, 342–348. [Google Scholar] [CrossRef]
  30. Agilent Technologies. Specifying Calibration Standards and Kits for Agilent Vector Network Analyzers; Application Note 1287-11; Agilent Technologies, Inc.: Santa Clara, CA, USA, 2010. [Google Scholar]
  31. Standards Australia. AS-1012.9. Methods of Testing Concrete—Determination of the Compressive Strength of Concrete Specimens; Standards Australia: Sydney, Australia, 2014. [Google Scholar]
  32. ASTM International. ASTM-C39/C39M-15a. Standard Test Method for Compressive Strength of Cylindrical Concrete Specimens; ASTM International: West Conshohocken, PA, USA, 2015. [Google Scholar]
  33. EN1992–1-1. Eurocode 2: Design of Concrete Structures. Part 1–1: General Rules and Rules for Buildings. 2004. Available online: https://law.resource.org/pub/eu/eurocode/en.1992.1.1.2004.pdf (accessed on 18 December 2016).
Figure 1. A block diagram illustrating the parallel experimental processes.
Applsci 07 00035 g001
Figure 2. Schematic of microwave measurement setup.
Applsci 07 00035 g002
Figure 3. Destructive compression applied on an ECC specimen on Day-3.
Applsci 07 00035 g003
Figure 4. Measured normalized conductance versus frequency: (a) on Day-3; (b) on Day-4.
Applsci 07 00035 g004
Figure 5. Measured temporal response of electrical conductance at 2 GHz.
Applsci 07 00035 g005
Figure 6. Measured compressive strength results of three types of ECC specimens with age.
Applsci 07 00035 g006
Figure 7. Non-linear regressions of electrical conductance at 2 GHz using bi-exponential functions.
Applsci 07 00035 g007
Figure 8. (a) Comparison of time constants for step responses; (b) Regression coefficients A1 and c (time constant) versus w/b.
Applsci 07 00035 g008
Figure 9. Compressive strength modelled by using bi-exponential regression.
Applsci 07 00035 g009
Figure 10. (a) Decomposition of bi-exponential regression for all specimens; (b) step response of second term of (5) that shows the differences in time constant.
Applsci 07 00035 g010
Figure 11. (a) Regression coefficient (time constant), e versus w/b; (b) comparison of the 28-day strengths: measurement, regression values using (5).
Applsci 07 00035 g011
Figure 12. (a) Computed correlations between compressive strength and conductance directly using regression functions (4) and (5); (b) proposed regression function (6) for fitting of all S-C data.
Applsci 07 00035 g012
Figure 13. (a) S-C correlation for PE1 (w/b = 0.20) specimen; (b) S-C correlations for PE2 (w/b = 0.255) and PE3 (w/b = 0.30) specimens.
Applsci 07 00035 g013
Table 1. Mechanical and physical properties of polyvinyl alcohol (PVA) fiber.
FiberDiameter (µm)Length (mm)Tensile Strength (MPa)Flexural Strength (GPa)Specific GravityShapeColor
PVA3881600401.3straightwhite
Table 2. Mix normalized proportions by weight of PVA-ECC specimens.
SpecimenCementFly AshSandWaterw/bs/bHRWRPVA (% Vol)
PE111.20.80.4400.2000.3640.0282
PE2(ECC-M45)11.20.80.5600.2550.3640.0222
PE311.20.80.6600.3000.3640.0122
Table 3. Chemical composition by weight of Portland cement (PC), fine sand (FS) and fly ash (FA-F).
ConstituentPCFSFA-F
CaO58.1--
SiO224.795.676.3
Al2O36.41.920.2
SO33.50.3-
MgO2.4--
FeO2.20.30.4
TiO2-0.90.9
K2O0.5-0.4
LOI2.21.01.8
Total100100100
Table 4. Regression coefficients and goodness of fits for Equation (4).
2 GHzw/bA1bA2cR2
PE1 (g2,1)0.2003.53560.9625.440.63580.9999
PE2 (g2,2)0.2553.60171.434.9130.80030.9997
PE3 (g2,3)0.3003.64972.324.7940.87080.9993
Table 5. Regression coefficients and goodness of fit for Equation (5).
ECCw/bS1S2deR2
PE1 (fc1)0.20041.9−41.82143.9473.9600.9998
PE2 (fc2)0.25545.1−44.94534.7593.3470.9980
PE3 (fc3)0.30030.68−30.6372.7272.8200.9996
Table 6. Regression coefficients and qualities for Equation (7).
ECCw/bKmR2
PE1 (fc1)0.2002.2741.1960.9814
PE2 (fc2)0.2552.7101.2850.9953
PE3 (fc3)0.3003.0081.3360.9979

