
Numerical Simulation and Experimental Validation for the Thermal Analysis of a Compact LED Recessed Downlight with Heat Sink Design


Abstract
:1. Introduction
2. Problem Formulation
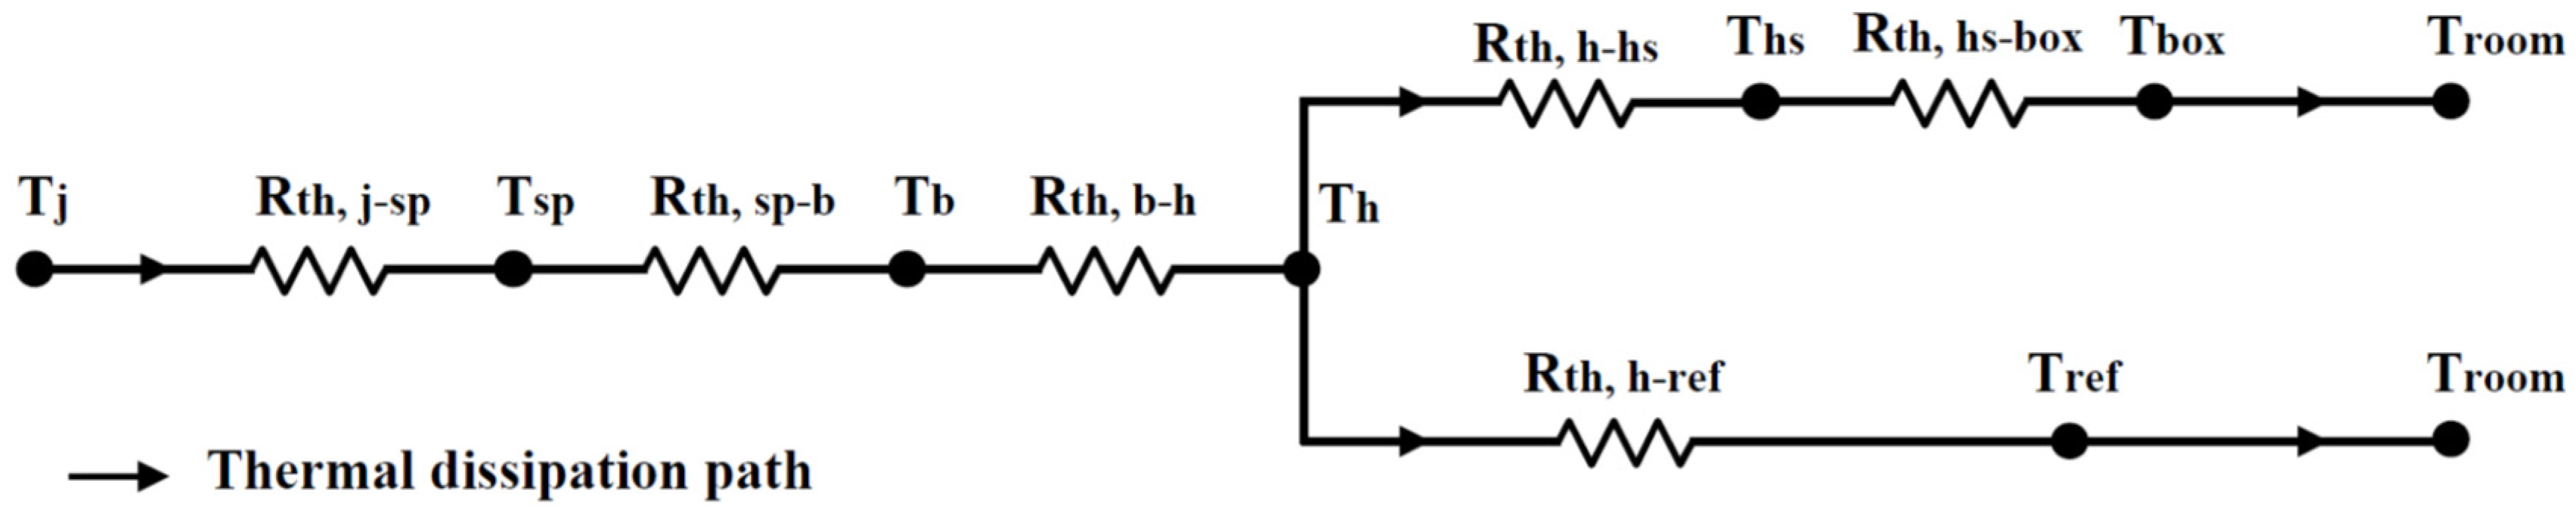
2.1. Theoretical Background
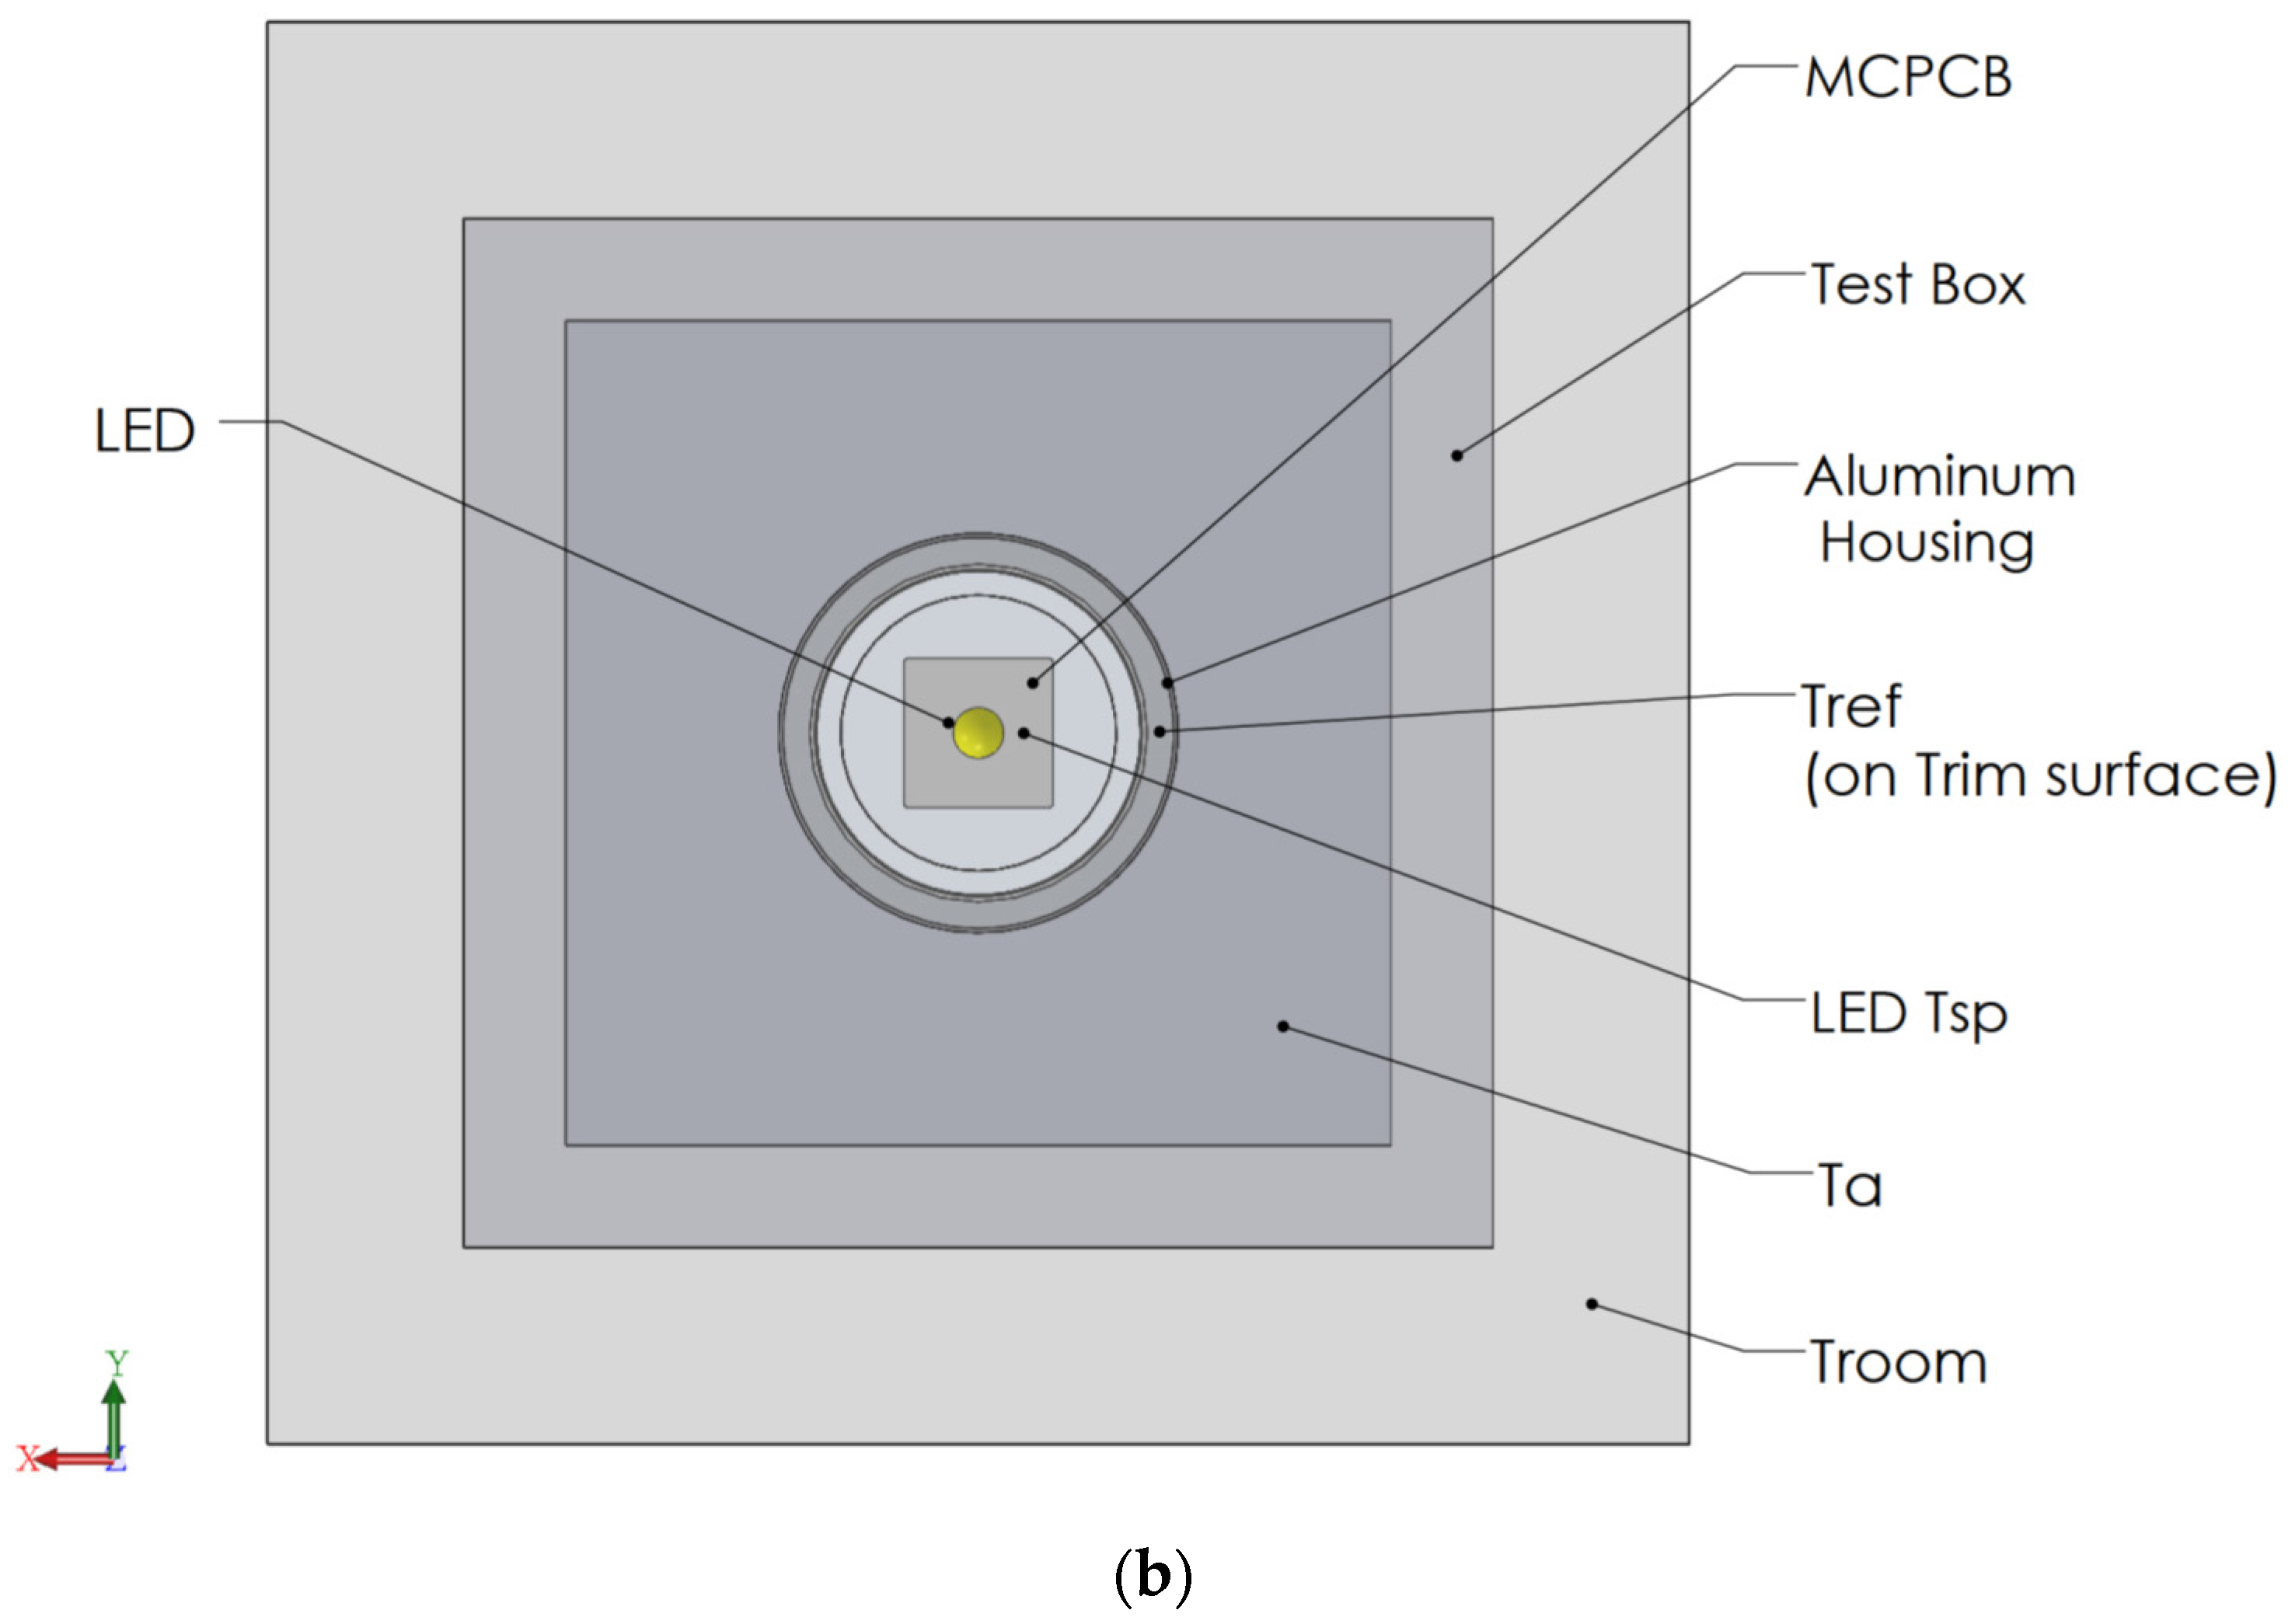
2.2. Numerical Simulation Modeling
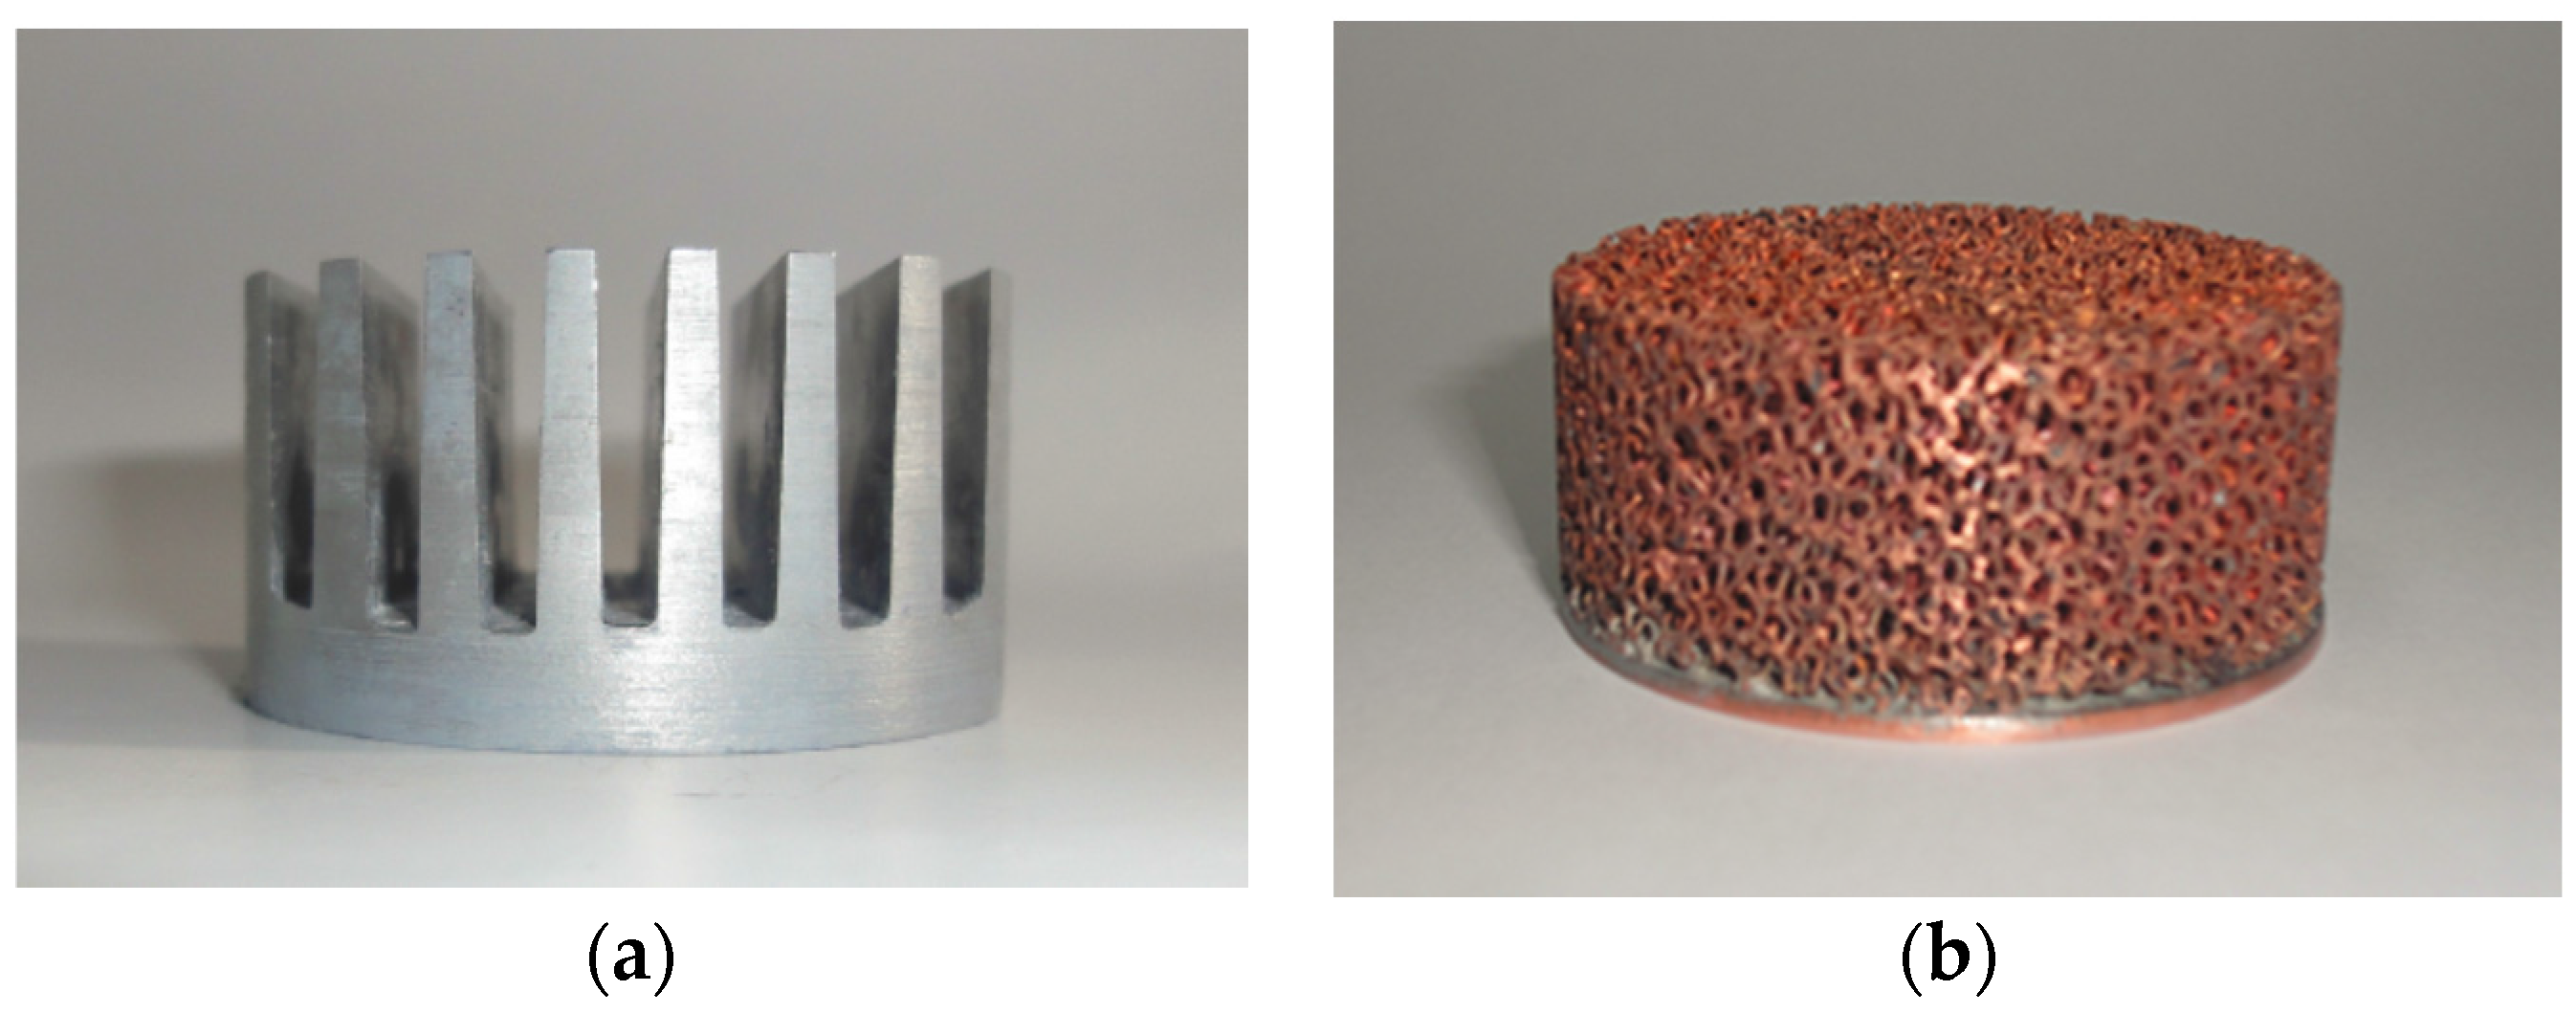
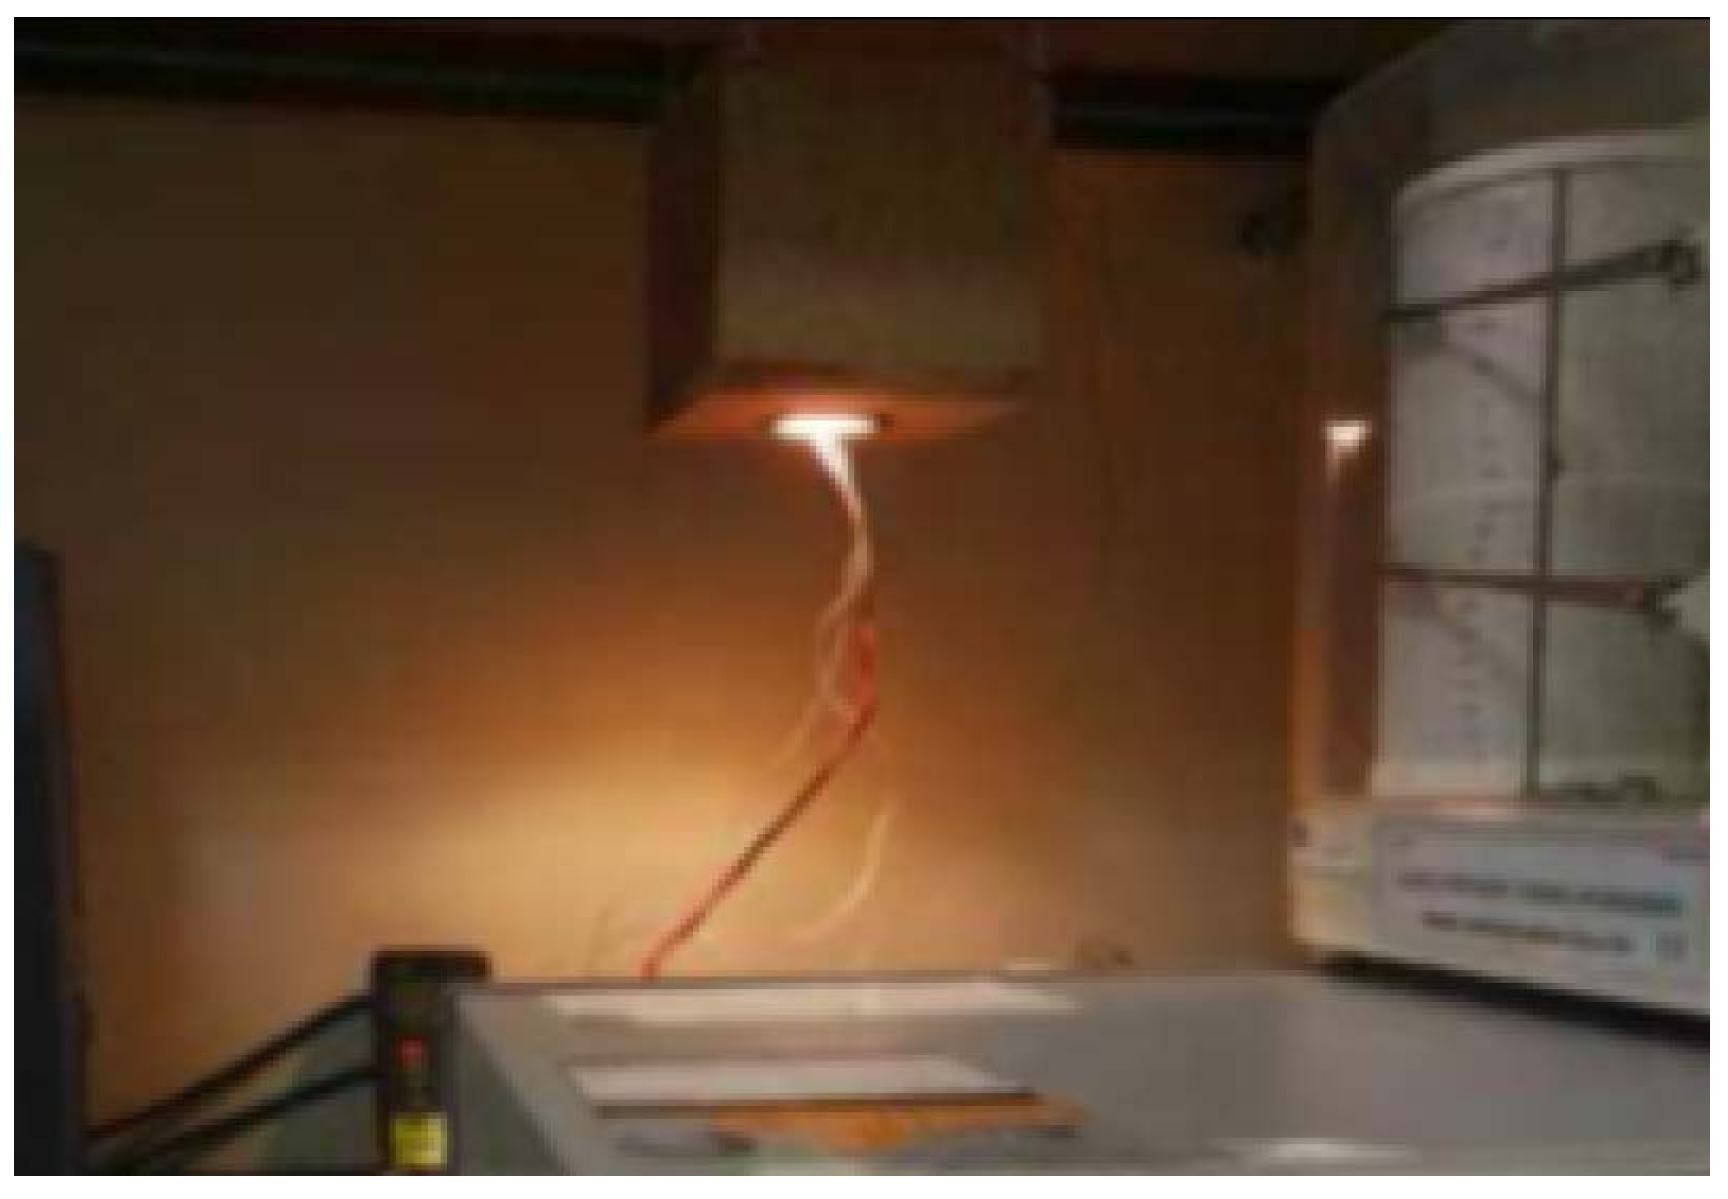
2.3. Experimental Fabrication
3. Results and Discussion
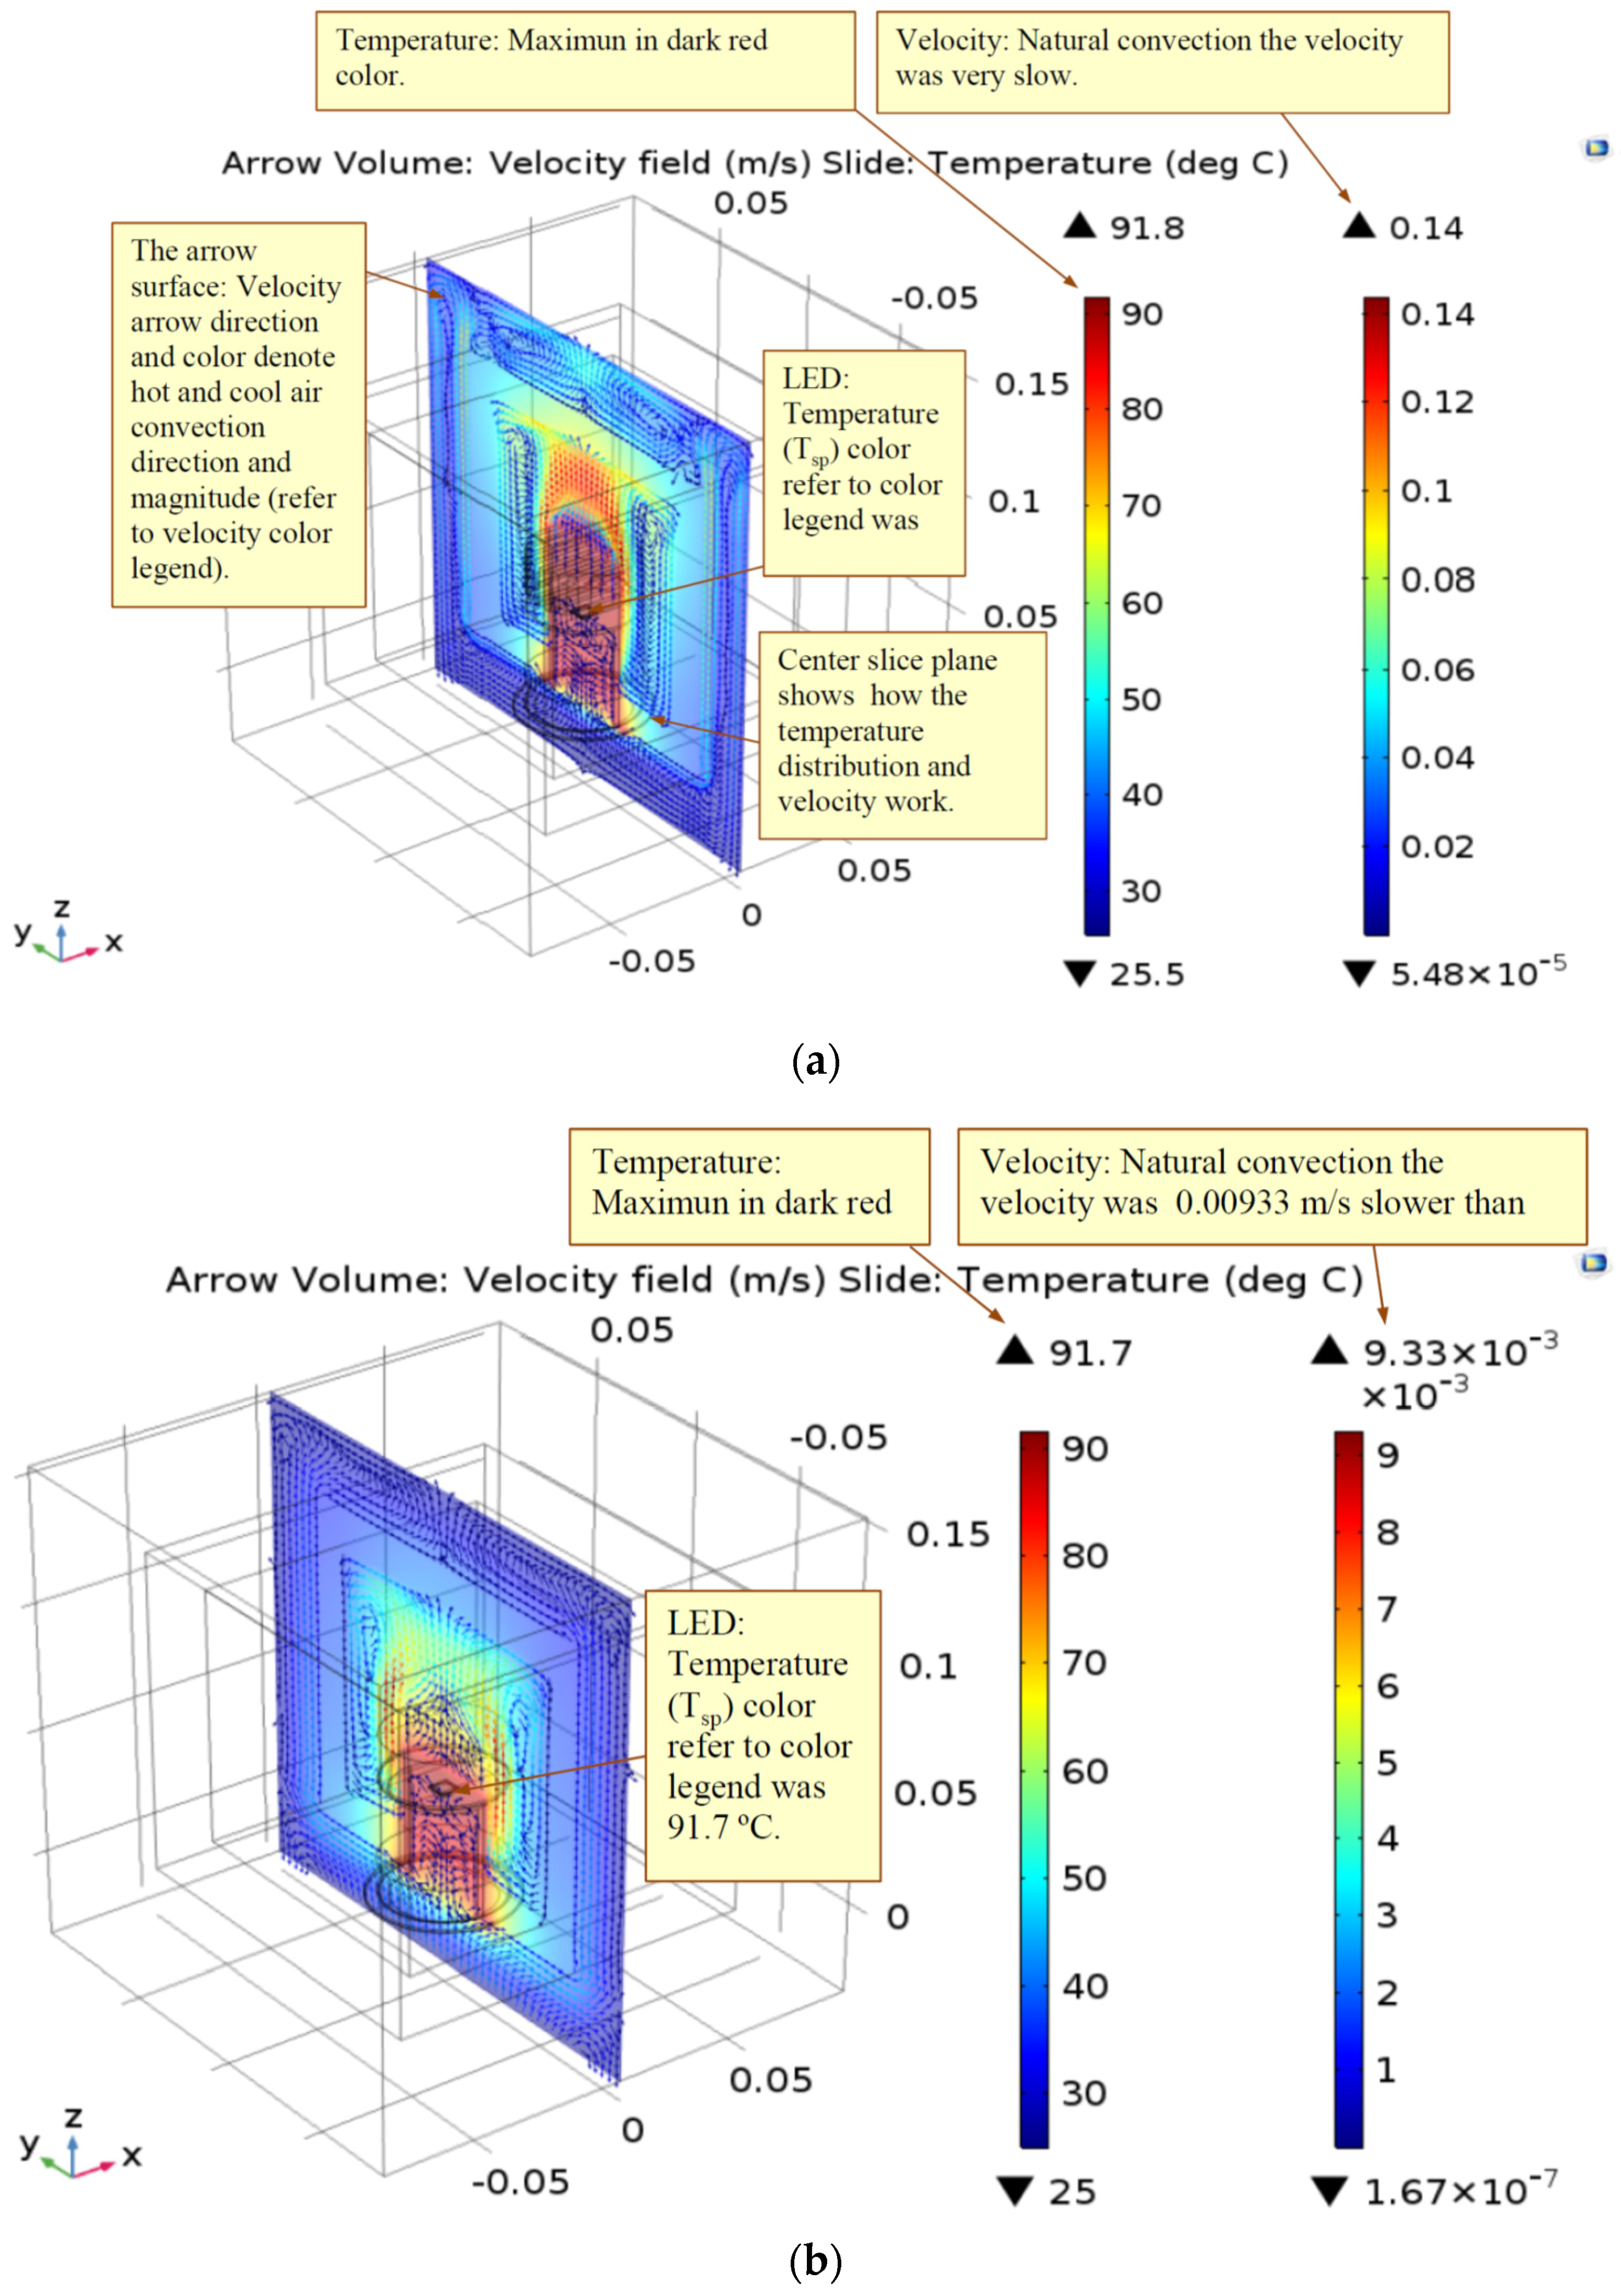
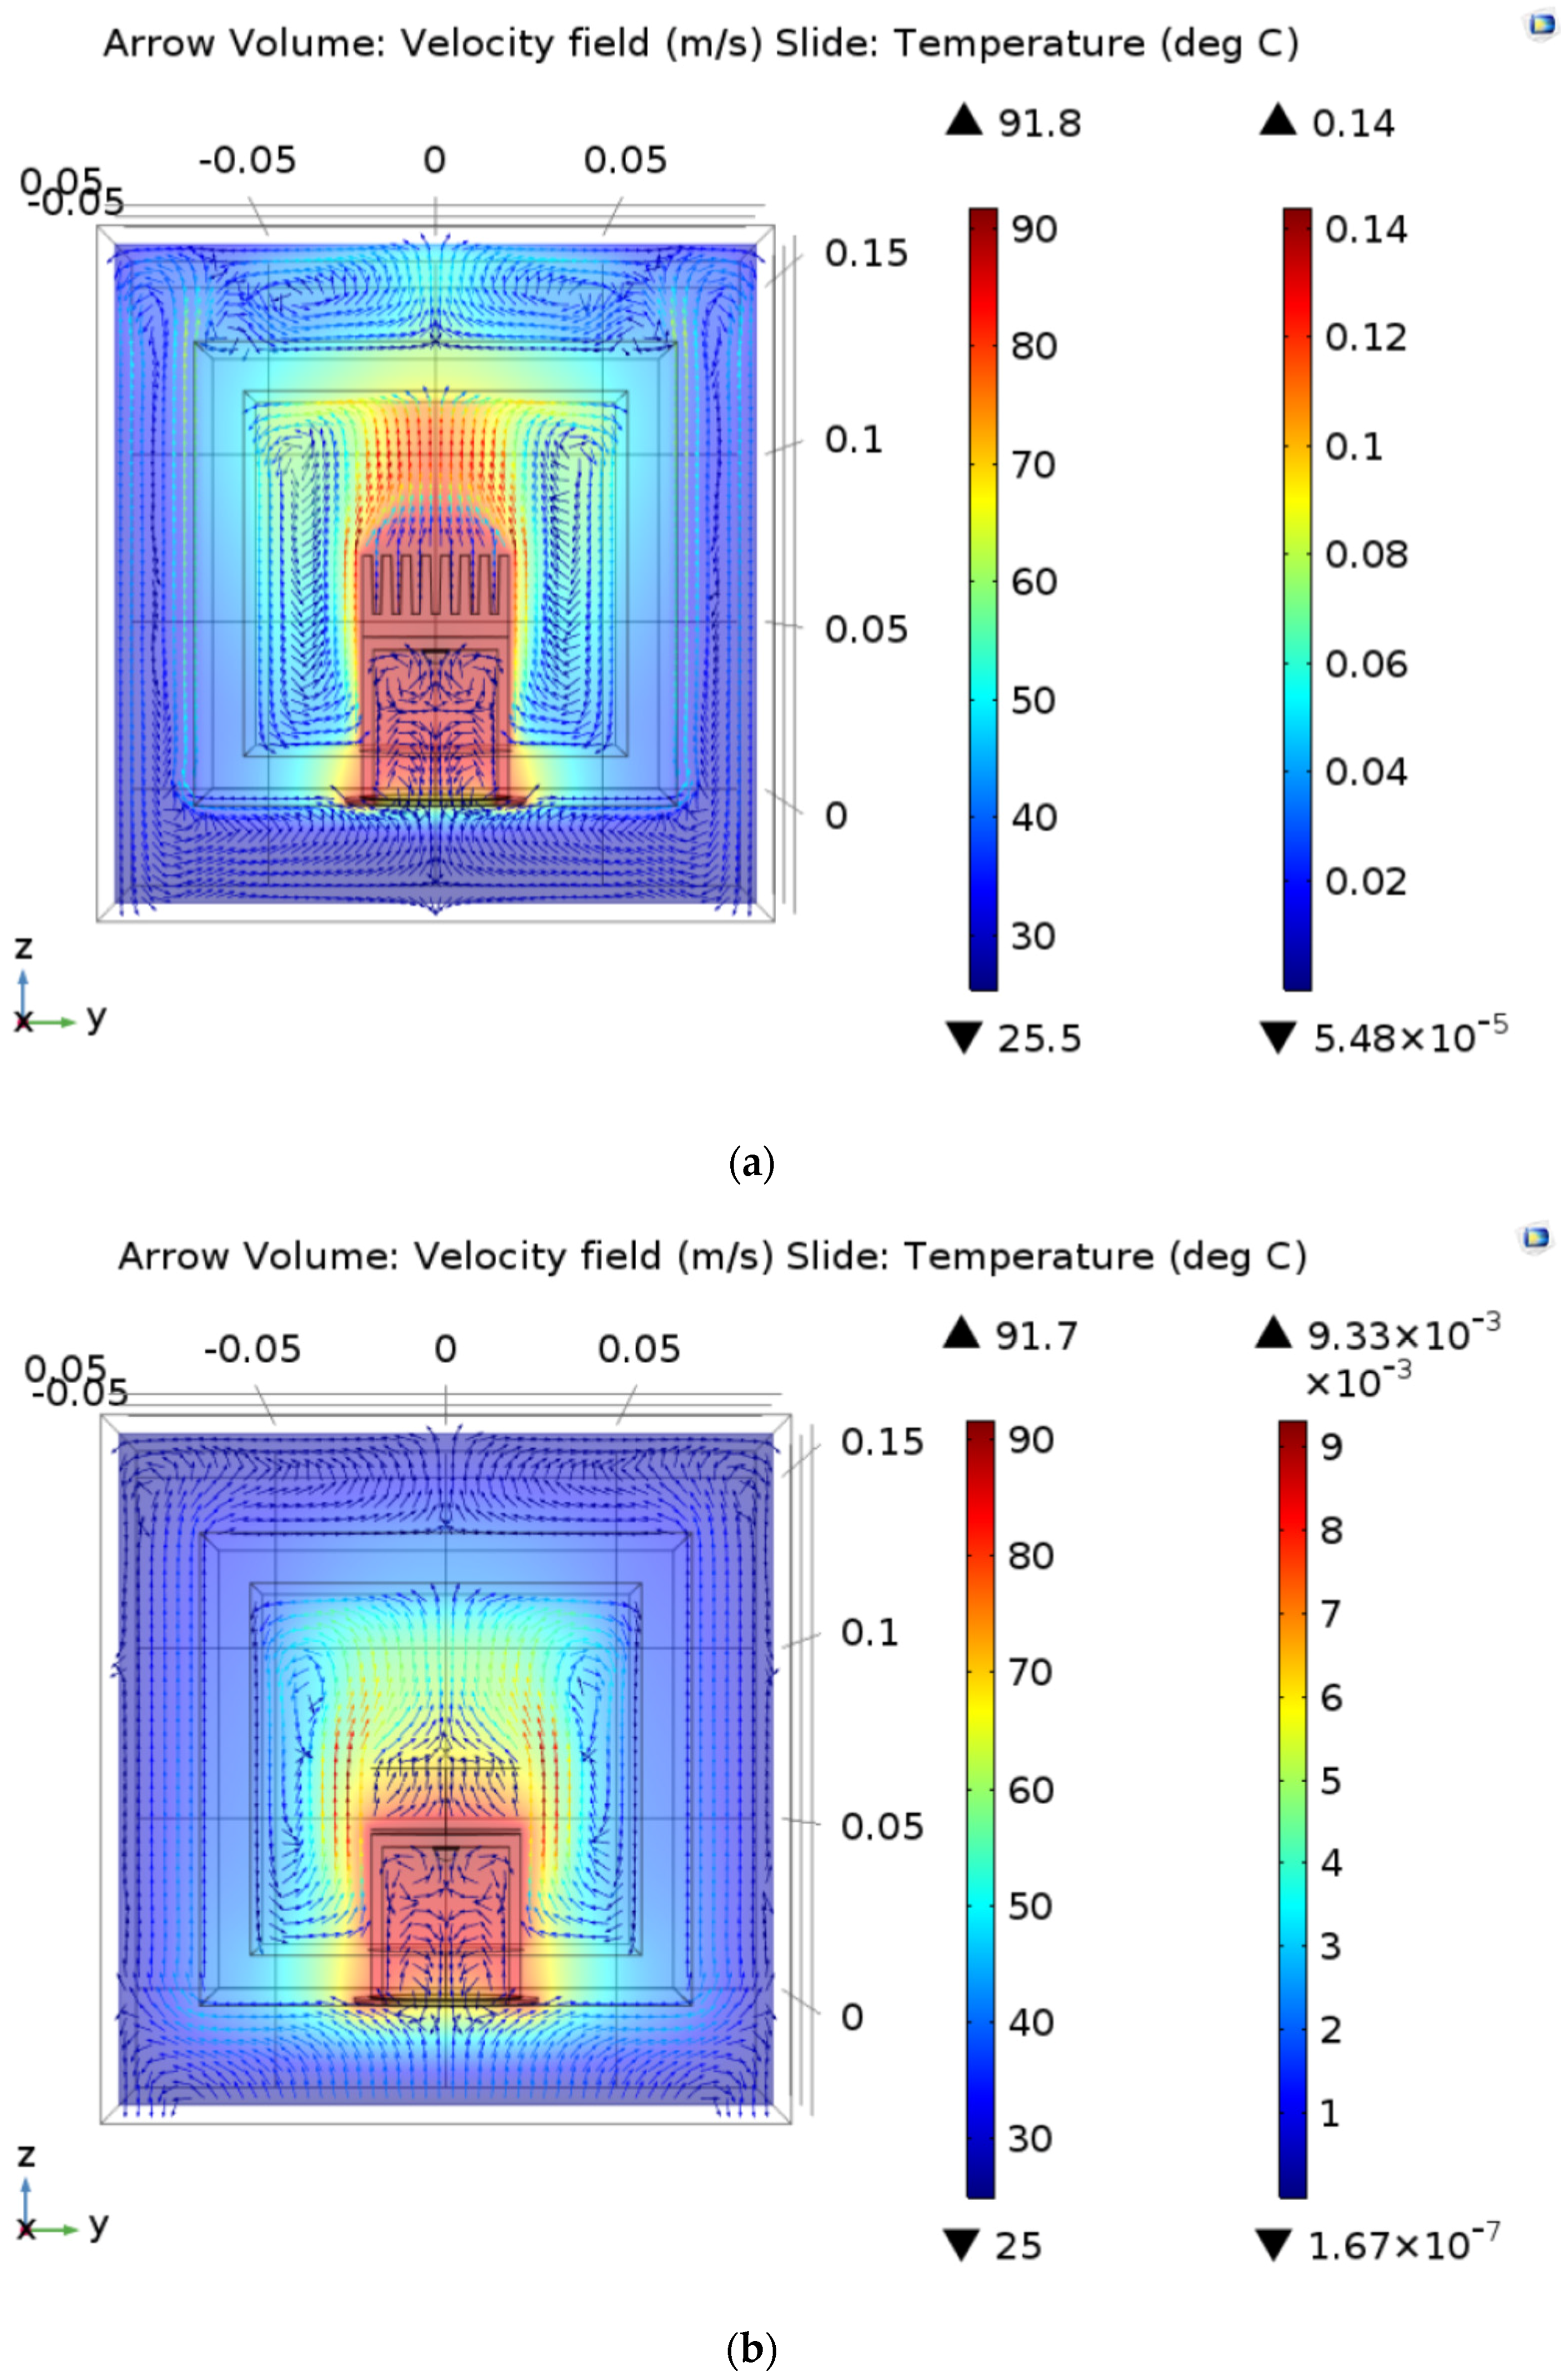
3.1. Numerical Simulations Results
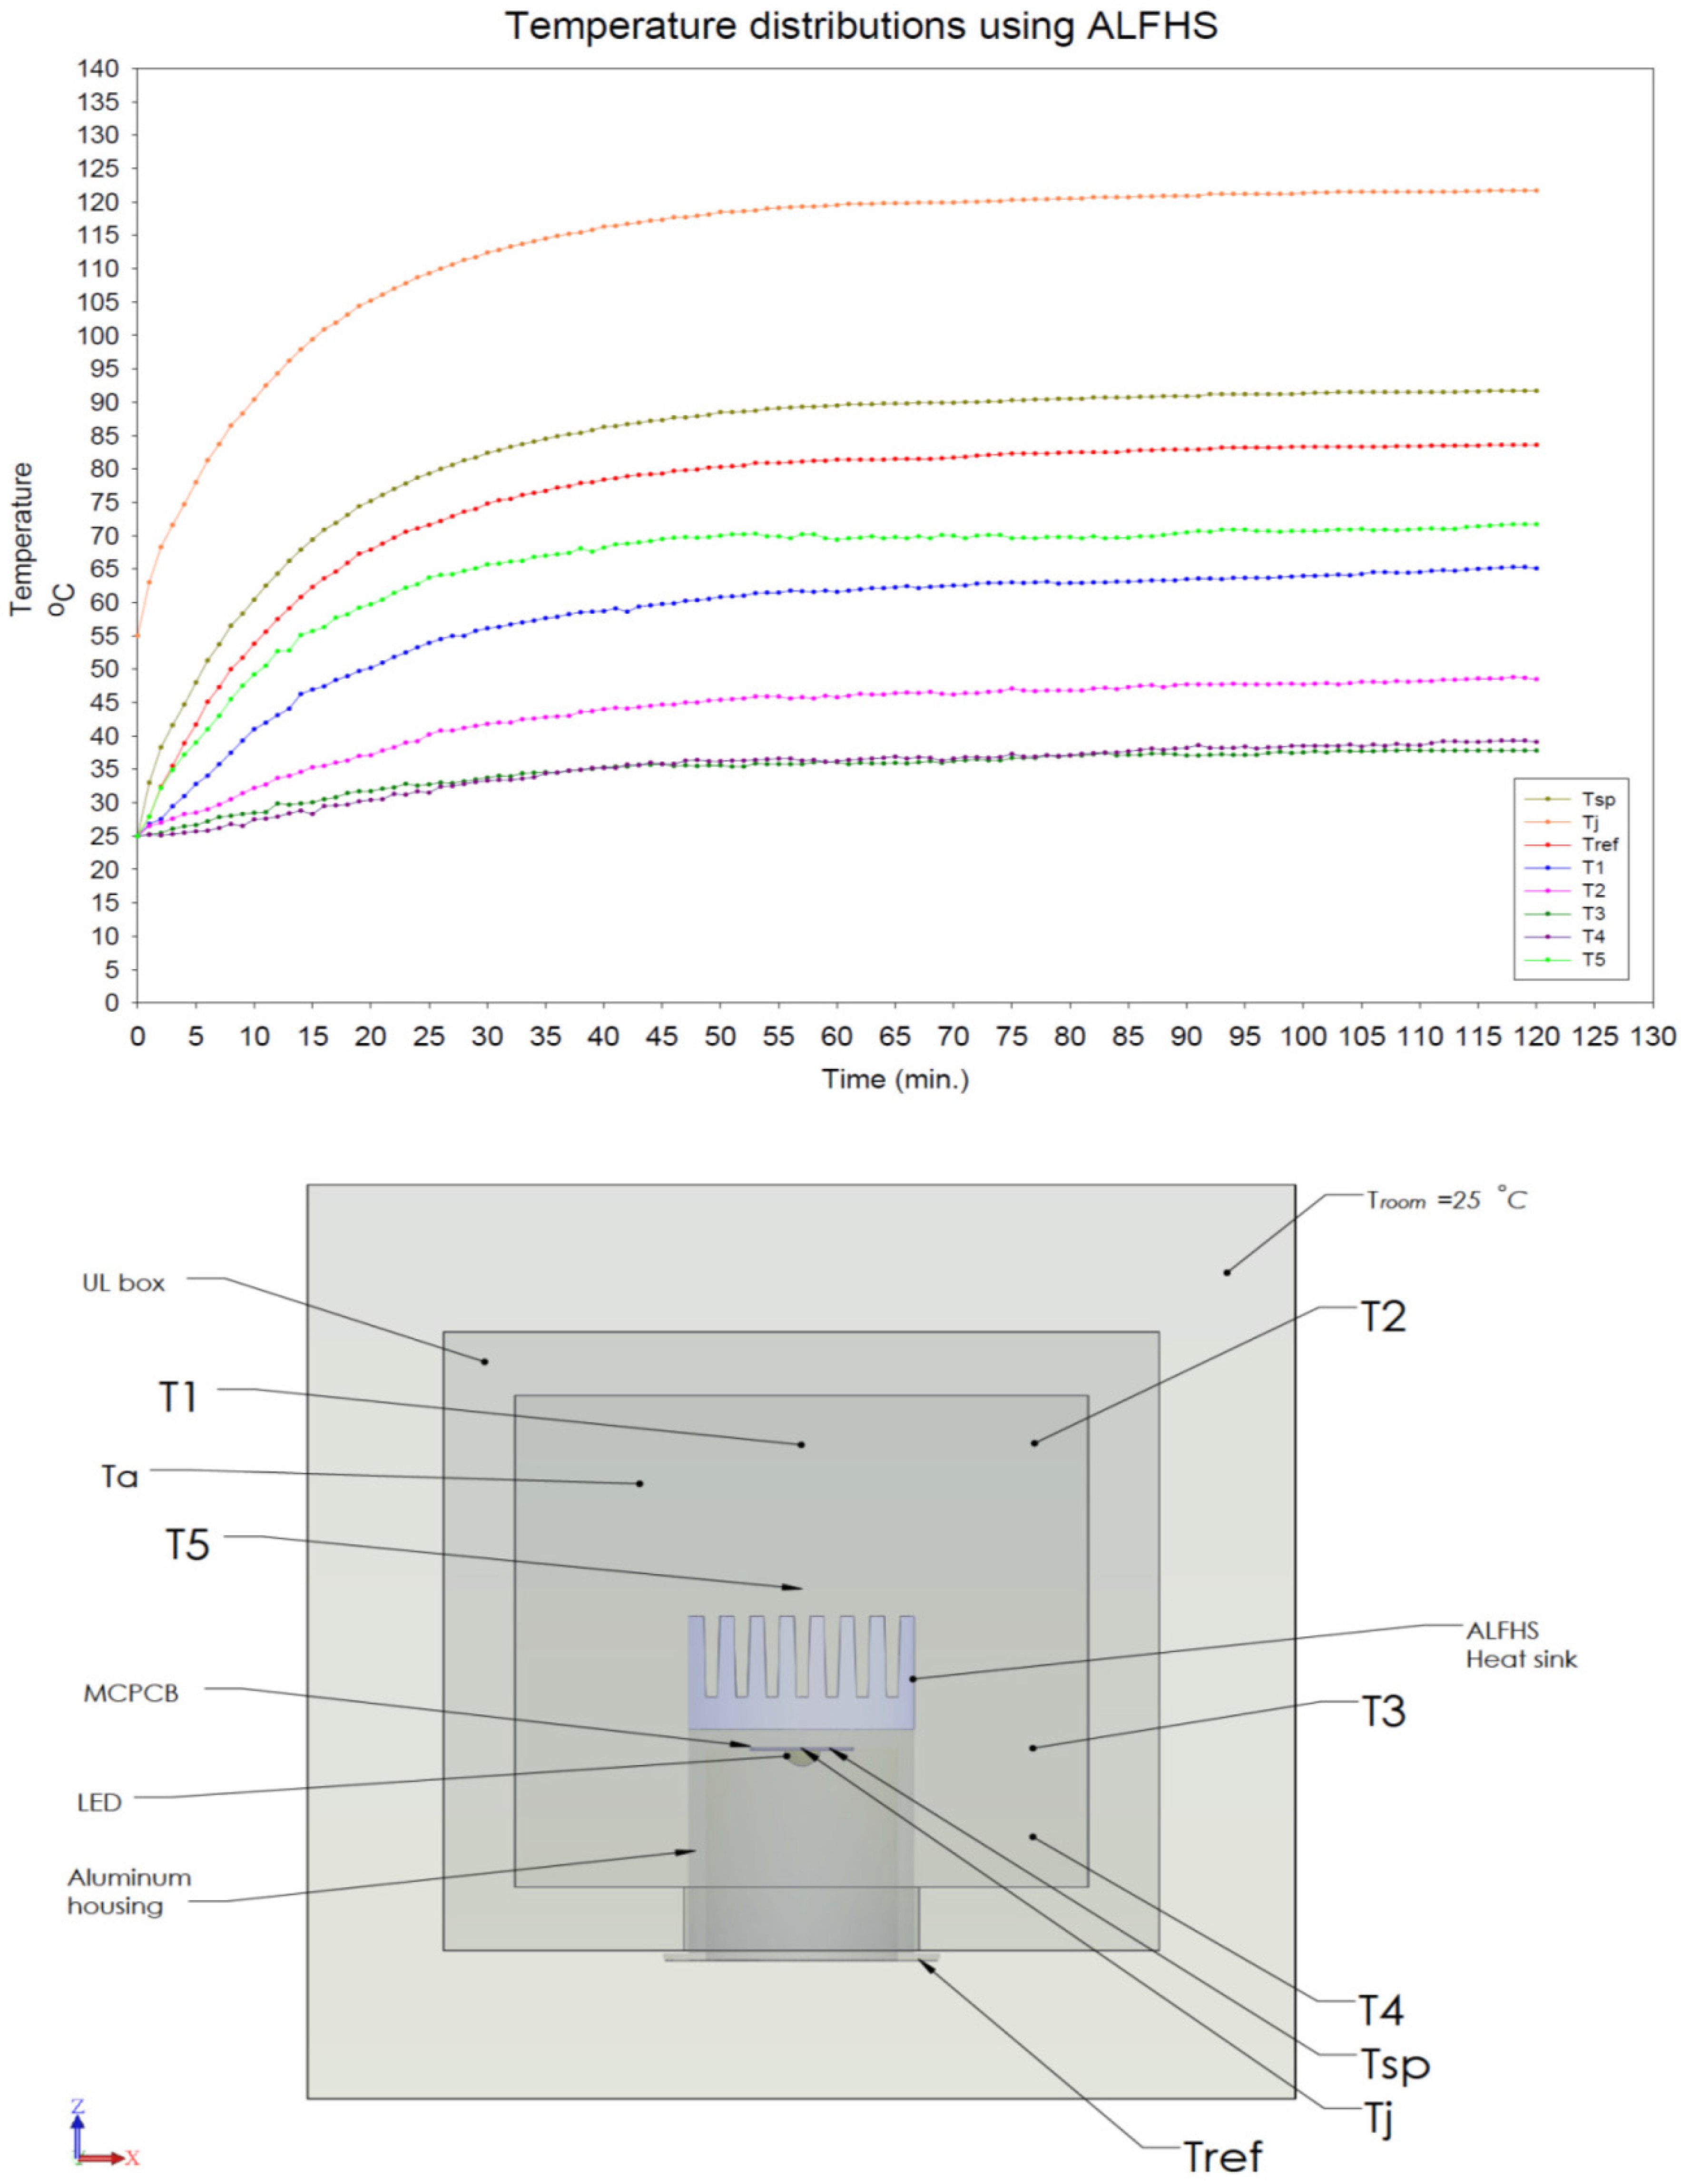
3.2. Experimental Results
4. Conclusions
Acknowledgments
Author Contributions
Conflicts of Interest
Nomenclature
| T | Temperature |
| Tj | Junction temperature |
| Tsp | Solder point temperature |
| Tb | MCPCB temperature |
| MCPCB | Metal core printed circuit board |
| Th | Aluminum housing temperature |
| Ths | Heat sink temperature |
| Tbox | Test box temperature |
| Tref | Reference point temperature |
| Troom | Room atmosphere temperature (25 °C) |
| Rth | Thermal resistance |
| Rth, j-sp | Thermal resistance between junction and solder point |
| Rth, sp-b | Thermal resistance between solder point and MCPCB |
| Rth, b-h | Thermal resistance between MCPCB and aluminum housing |
| Rth, h-hs | Thermal resistance between aluminum housing and heat sink |
| Rth, hs-box | Thermal resistance between heat sink and test box |
| Rth, h-ref | Thermal resistance between aluminum housing and reference point |
| Rth, sp-ref | Thermal resistance between solder point and reference point |
| A.F. | Acceleration Factor is the test time multiplier derived from the Arrhenius equation. |
| Ea | Acceleration energy in electron-volts (eV), thermal activation energy 0.5–0.7eV for assembly defects |
| kb | Boltzmann’s constant (kb = 8.617 × 10⁻⁵ eV/K) |
| K | Temperature Kelvin |
| Tuse | Temperature in normal use, in degrees Kelvin (K = °C + 273) |
| Ttest | Temperature in testing, in degrees Kelvin |
| e | Natural logarithms (2.71828) |
| μ | Dynamic viscosity of air |
| u | The velocity vector |
| ρ | Density of air |
| I | The identity matrix |
| p | The pressure |
| k | The thermal conductivity |
| Cp | The specific heat capacity |
| F | The volume force (body force) in any point of the fluid |
| εp | The porosity of the porous material |
| κ | The permeability tensor of the porous media |
| Qbr | A mass source or mass sink, accounts for mass deposit and mass creation within the domains |
| β | The volumetric thermal expansion coefficient of the fluid. |
| T0 | The room atmosphere temperature at 25 °C |
| Ptotal | Total power (W) input to LED (If × Vf, If is LED forward current, Vf is forward Voltage) |
| Superscript | |
| T | The transpose matrix |
References
- Yang, K.; Chung, C.; Tu, C.; Wong, C.; Yang, T.; Lee, M. Thermal spreading resistance characteristics of a high power light emitting diode module. Appl. Ther. Eng. 2014, 70, 361–368. [Google Scholar] [CrossRef]
- Tzeng, S.; Jeng, T.; Wang, Y. The cooling Design of a High-Speed Rotating Axis with Ribbed Turbulators. IJETI 2013, 3, 38–48. [Google Scholar]
- Sapia, C.; Sozio, G. CFD Transient Model of the Buoyancy Heat Transfer for a Heat Sink: Effects of Geometry Rotation, Thermal Investigations of ICs and Systems (THERMINIC). In Proceedings of the 2012 IEEE 18th International Workshop, Budapest, Hungary, 25–27 September 2012.
- Chein, R.; Chen, J. Numerical study of the inlet/outlet arrangement effect on microchannel heat sink performance. Int. J. Ther. Sci. 2009, 48, 1627–1638. [Google Scholar] [CrossRef]
- Chen, H.; Wang, C. Analytical analysis and experimental verification of trapezoidal fin for assessment of heat sink performance and material saving. Appl. Ther. Eng. 2016, 98, 203–212. [Google Scholar] [CrossRef]
- Kushwaha, A.S.; Kirar, R. Comparative study of rectangular, trapezoidal and parabolic shaped finned heat sink. IOSR J. Mech. Civ. Eng. 2013, 5, 1–7. [Google Scholar] [CrossRef]
- De Schampheleire, S.; de Jaeger, P.; Reynders, R.; de Kerpel, K.; Ameel, B.; T’Joen, C.; Huisseune, H.; Lecompte, S.; de Paepe, M. Experimental study of buoyancy-driven flow in open-cell aluminium foam heat sinks. Appl. Ther. Eng. 2013, 59, 30–40. [Google Scholar] [CrossRef]
- Yao, Y.; Wu, H.; Liu, Z. A new prediction model for the effective thermal conductivity of high porosity open-cell metal foams. Int. J. Ther. Sci. 2015, 97, 56–67. [Google Scholar] [CrossRef]
- Chein, R.; Yang, H.; Tsai, T.; Lu, C. Experimental study of heat sink performance using copper foams fabricated by electroforming. Microsyst. Technol. 2010, 16, 1157–1164. [Google Scholar] [CrossRef]
- Billiet, M.; de Schampheleire, S.; Huisseune, H.; de Paepe, M. Influence of Orientation and Radiative Heat Transfer on Aluminum Foams in Buoyancy-Induced Convection. Materials 2015, 8, 6792–6805. [Google Scholar] [CrossRef] [Green Version]
- Haack, D.P.; Butcher, K.; Kim, T.; Lu, T.J. Novel Lightweight Metal Foam Heat Exchangers. In Proceedings of the 2001 ASME International Mechanical Engineering Congress and Exposition, New York, NY, USA, 11–16 November 2001; pp. 141–147.
- Hamadouche, A.; Nebbali, R.; Benahmed, H.; Kouidri, A.; Bousri, A. Experimental investigation of convective heat transfer in an open-cell aluminum foams. Exp. Ther. Fluid Sci. 2016, 71, 86–94. [Google Scholar] [CrossRef]
- Elayiaraja, P.; Harish, S.; Wilson, L.; Bensely, A.; Lal, D.M. Experimental investigation on pressure drop and heat transfer characteristics of copper metal foam heat sink. Exp. Heat Transf. 2010, 23, 185–195. [Google Scholar] [CrossRef]
- Dreeben, T.D.; Betts, D. Simulation and Measurement of Heat Flow in Recessed LED Fixtures Mounted in a UL Box. In Proceedings of the 2014 IEEE Intersociety Conference on Thermal and Thermomechanical Phenomena in Electronic Systems (ITherm), Orlando, FL, USA, 27–30 May 2014.
- Ahn, B.; Park, J.; Yoo, S.; Kim, J.; Jeong, H.; Leigh, S.; Jang, C. Synergetic Effect between Lighting Efficiency Enhancement and Building Energy Reduction Using Alternative Thermal Operating System of Indoor LED Lighting. Energies 2015, 8, 8736–8748. [Google Scholar] [CrossRef]
- Kudsieh, N.; Khizar, M.; Raja, M.Y.A. Thermal modeling of specialty heat-sinks for low-cost COP packaging of high-power LEDs. In Proceedings of the 2012 IEEE 9th International Conference on High Capacity Optical Networks and Enabling Technologies (HONET), Istanbul, Turkey, 12–14 December 2012.
- Qian, C.; Fan, X.J.; Fan, J.J.; Yuan, C.A.; Zhang, G.Q. An accelerated test method of luminous flux depreciation for LED luminaires and lamps. Reliab. Eng. Syst. Saf. 2016, 147, 84–92. [Google Scholar] [CrossRef]
- COMSOL Multiphysics 5.2a, CFD Module, software licensed by COMSOL Inc.; Pitotech: Changhua City, Taiwan, 2016.
- Chen, Y.; Wang, Z.; Tsai, G. Two-way Fluid-Structure Interaction Simulation of a Micro Horizontal Axis Wind Turbine. IJETI 2015, 5, 33–44. [Google Scholar]
- Maaspuro, M.; Tuominen, A. Thermal analysis of LED spot lighting device operating in external natural or forced heat convection. Microelectr. Reliab. 2013, 53, 428–434. [Google Scholar] [CrossRef]
- Kuo, C.H.; Chiou, L.C.; Chen, C.C. Wake flow pattern modified by small control cylinders at low Reynolds number. J. Fluids Struct. 2007, 23, 938–956. [Google Scholar] [CrossRef]
- Li, J.; Yang, Q.; Niu, P.; Jin, L.; Meng, B.; Li, Y.; Xiao, Z.; Zhang, X. Analysis of Thermal Field on Integrated LED Light Source Based on COMSOL Multi-physics Finite Element Simulation. Phys. Procedia 2011, 22, 150–156. [Google Scholar] [CrossRef]
- Rezaiguia, I.; Kadja, M.; Mebrouk, R.; Belghar, N. Numerical computation of natural convection in an isosceles triangular cavity with a partially active base and filled with a Cu–water nanofluid. Heat Mass Transf. 2013, 49, 1319–1331. [Google Scholar] [CrossRef]
- Lee, J.B.; Kim, H.J.; Kim, D. Experimental Study of Natural Convection Cooling of Vertical Cylinders with Inclined Plate Fins. Energies 2016, 9, 391. [Google Scholar] [CrossRef]
- Shen, Q.; Sun, D.; Xu, Y.; Jin, T.; Zhao, X.; Zhang, N.; Wu, K.; Huang, Z. Natural convection heat transfer along vertical cylinder heat sinks with longitudinal fins. Int. J. Ther. Sci. 2016, 100, 457–464. [Google Scholar] [CrossRef]
- Ye, H.; Gielen, A.W.J.; vanZeijl, H.W.; Werkhoven, R.J.; Zhang, G.Q. Numerical modeling of thermal performance: Natural convection and radiation of solid state lighting. In Proceedings of the IEEE 12th International Conference on Thermal, Mechanical and Multi-Physics Simulation and Experiments in Microelectronics and Microsystems (EuroSimE), Linz, Austria, 18–20 April 2011.
- Huang, Y.; Chen, X. Investigation of a Ball Screw Feed Drive System Based on Dynamic Modeling for Motion Control. AITI 2017, 2, 29–33. [Google Scholar]
- Cai, M.; Yang, D.; Tian, K.; Chen, W.; Chen, X.; Zhang, P.; Fan, X.; Zhang, G. A hybrid prediction method on luminous flux maintenance of high power LED lamps. Appl. Ther. Eng. 2016, 95, 482–490. [Google Scholar] [CrossRef]
- ENERGY STAR® Program Requirements Product Specification for Luminaires (Light Fixtures). Available online: https://www.energystar.gov/sites/default/files/asset/document/Luminaires%20V2%200%20Final.pdf (accessed on 27 September 2016).
- Koh, S.; Yuan, C.; Sun, B.; Li, B.; Fan, X.; Zhang, G.Q. Product Level Accelerated Lifetime Test for Indoor LED Luminaires. In Proceedings of the 14th International Conference on Thermal, Mechanical and Multi-Physics Simulation and Experiments in Microelectronics and Microsystems, EuroSimE 2013, Wroclaw, Poland, 18–20 April 2011.


| Case | Heat sink | Height (mm) | Before | After | ||||
|---|---|---|---|---|---|---|---|---|
| Tsp (°C) | Temperature Difference (°C) | Tsp (°C) | Temperature Difference (°C) | |||||
| 1 | ALFHS | 17 | 87.0 | Higher | 0.4 | 100.1 | Higher | 8.4 |
| CUFHS | 17 | 86.6 | 91.7 | |||||
| 2 | ALFHS | 20 | 85.0 | 94.5 | Higher | 2.8 | ||
| CUFHS | 17 | 86.6 | Higher | 1.6 | 91.7 | |||
| 3 | ALFHS | 23 | 83.4 | 91.7 | Same | 0.0 | ||
| CUFHS | 17 | 86.6 | Higher | 3.2 | 91.7 | |||
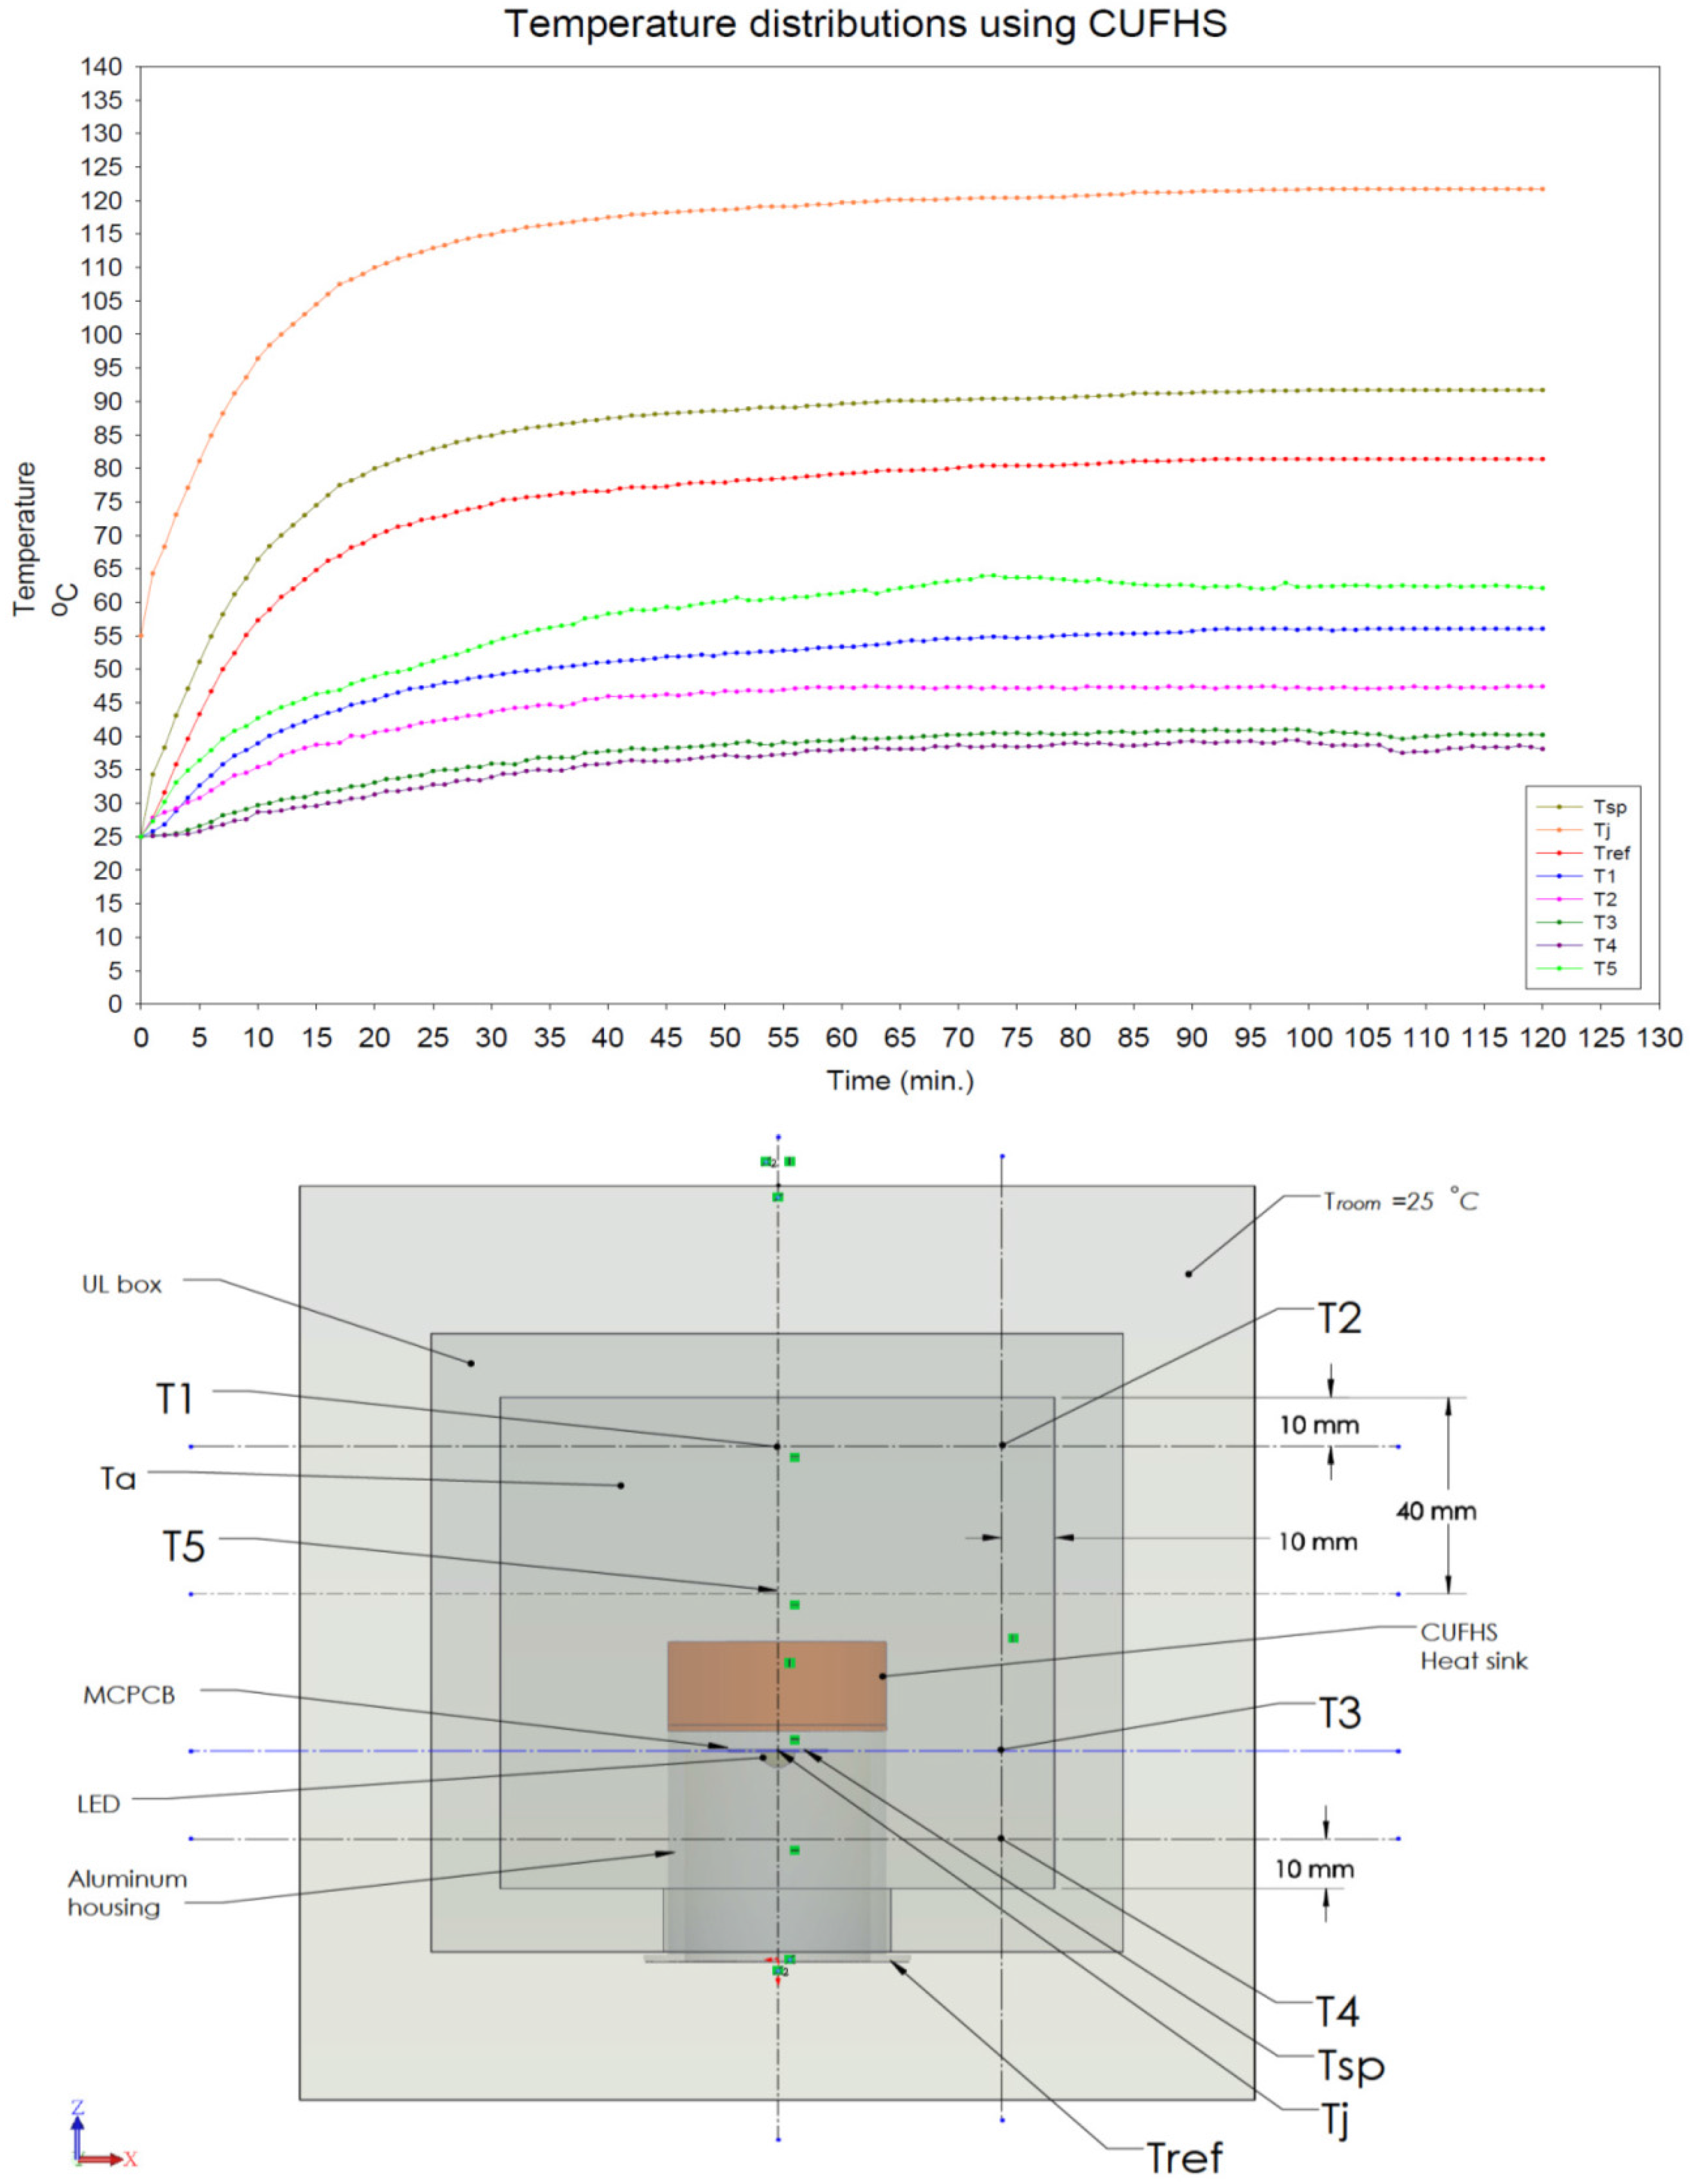
| Time (min.) | TSP | Tj | Tref | T1 | T2 | T3 | T4 | T5 |
|---|---|---|---|---|---|---|---|---|
| 120 | 91.7 | 121.7 | 83.6 | 65.1 | 48.5 | 37.8 | 39.1 | 71.7 |
| Time (min) | Tsp | Tj | Tref | T1 | T2 | T3 | T4 | T5 |
|---|---|---|---|---|---|---|---|---|
| 120 | 91.7 | 121.7 | 81.4 | 56.1 | 47.4 | 40.2 | 38.1 | 62.1 |
© 2016 by the authors; licensee MDPI, Basel, Switzerland. This article is an open access article distributed under the terms and conditions of the Creative Commons Attribution (CC-BY) license (http://creativecommons.org/licenses/by/4.0/).
Share and Cite
Hsu, H.-C.; Huang, Y.-C. Numerical Simulation and Experimental Validation for the Thermal Analysis of a Compact LED Recessed Downlight with Heat Sink Design. Appl. Sci. 2017, 7, 4. https://doi.org/10.3390/app7010004
Hsu H-C, Huang Y-C. Numerical Simulation and Experimental Validation for the Thermal Analysis of a Compact LED Recessed Downlight with Heat Sink Design. Applied Sciences. 2017; 7(1):4. https://doi.org/10.3390/app7010004
Chicago/Turabian StyleHsu, Huan-Chu, and Yi-Cheng Huang. 2017. "Numerical Simulation and Experimental Validation for the Thermal Analysis of a Compact LED Recessed Downlight with Heat Sink Design" Applied Sciences 7, no. 1: 4. https://doi.org/10.3390/app7010004