
Groundwater Mixing Process Identification in Deep Mines Based on Hydrogeochemical Property Analysis


Abstract
:1. Introduction
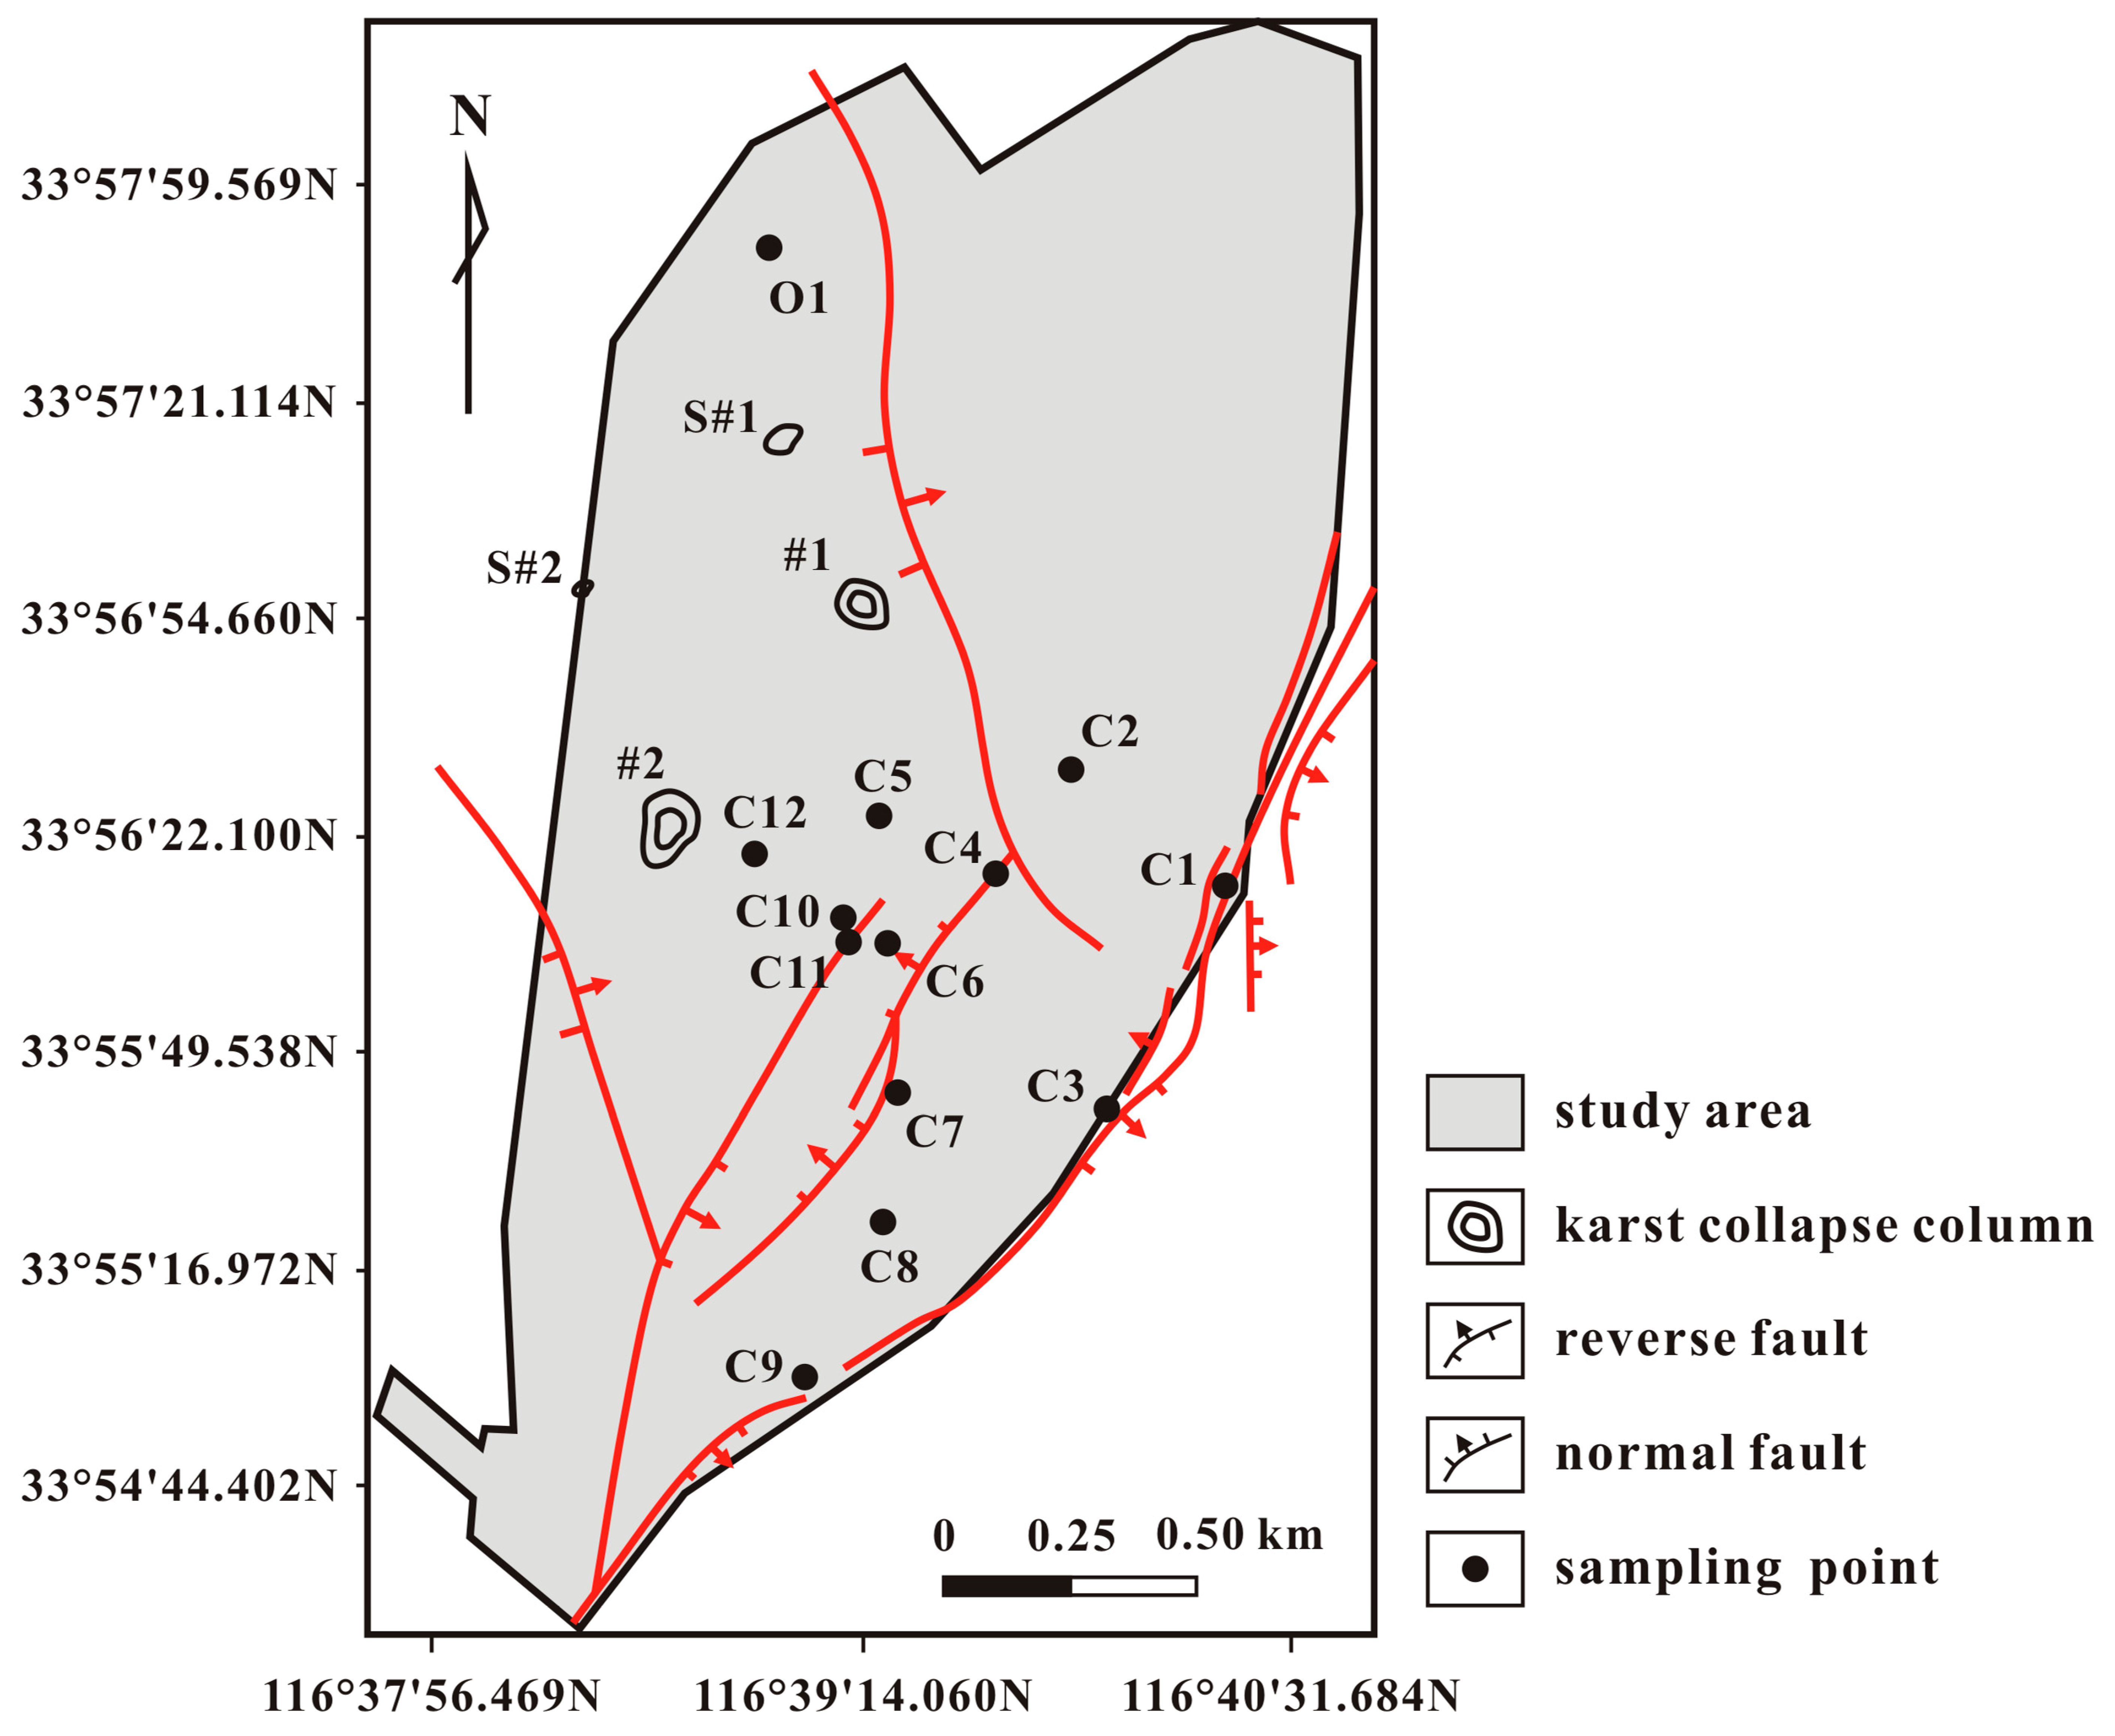
2. Study Area
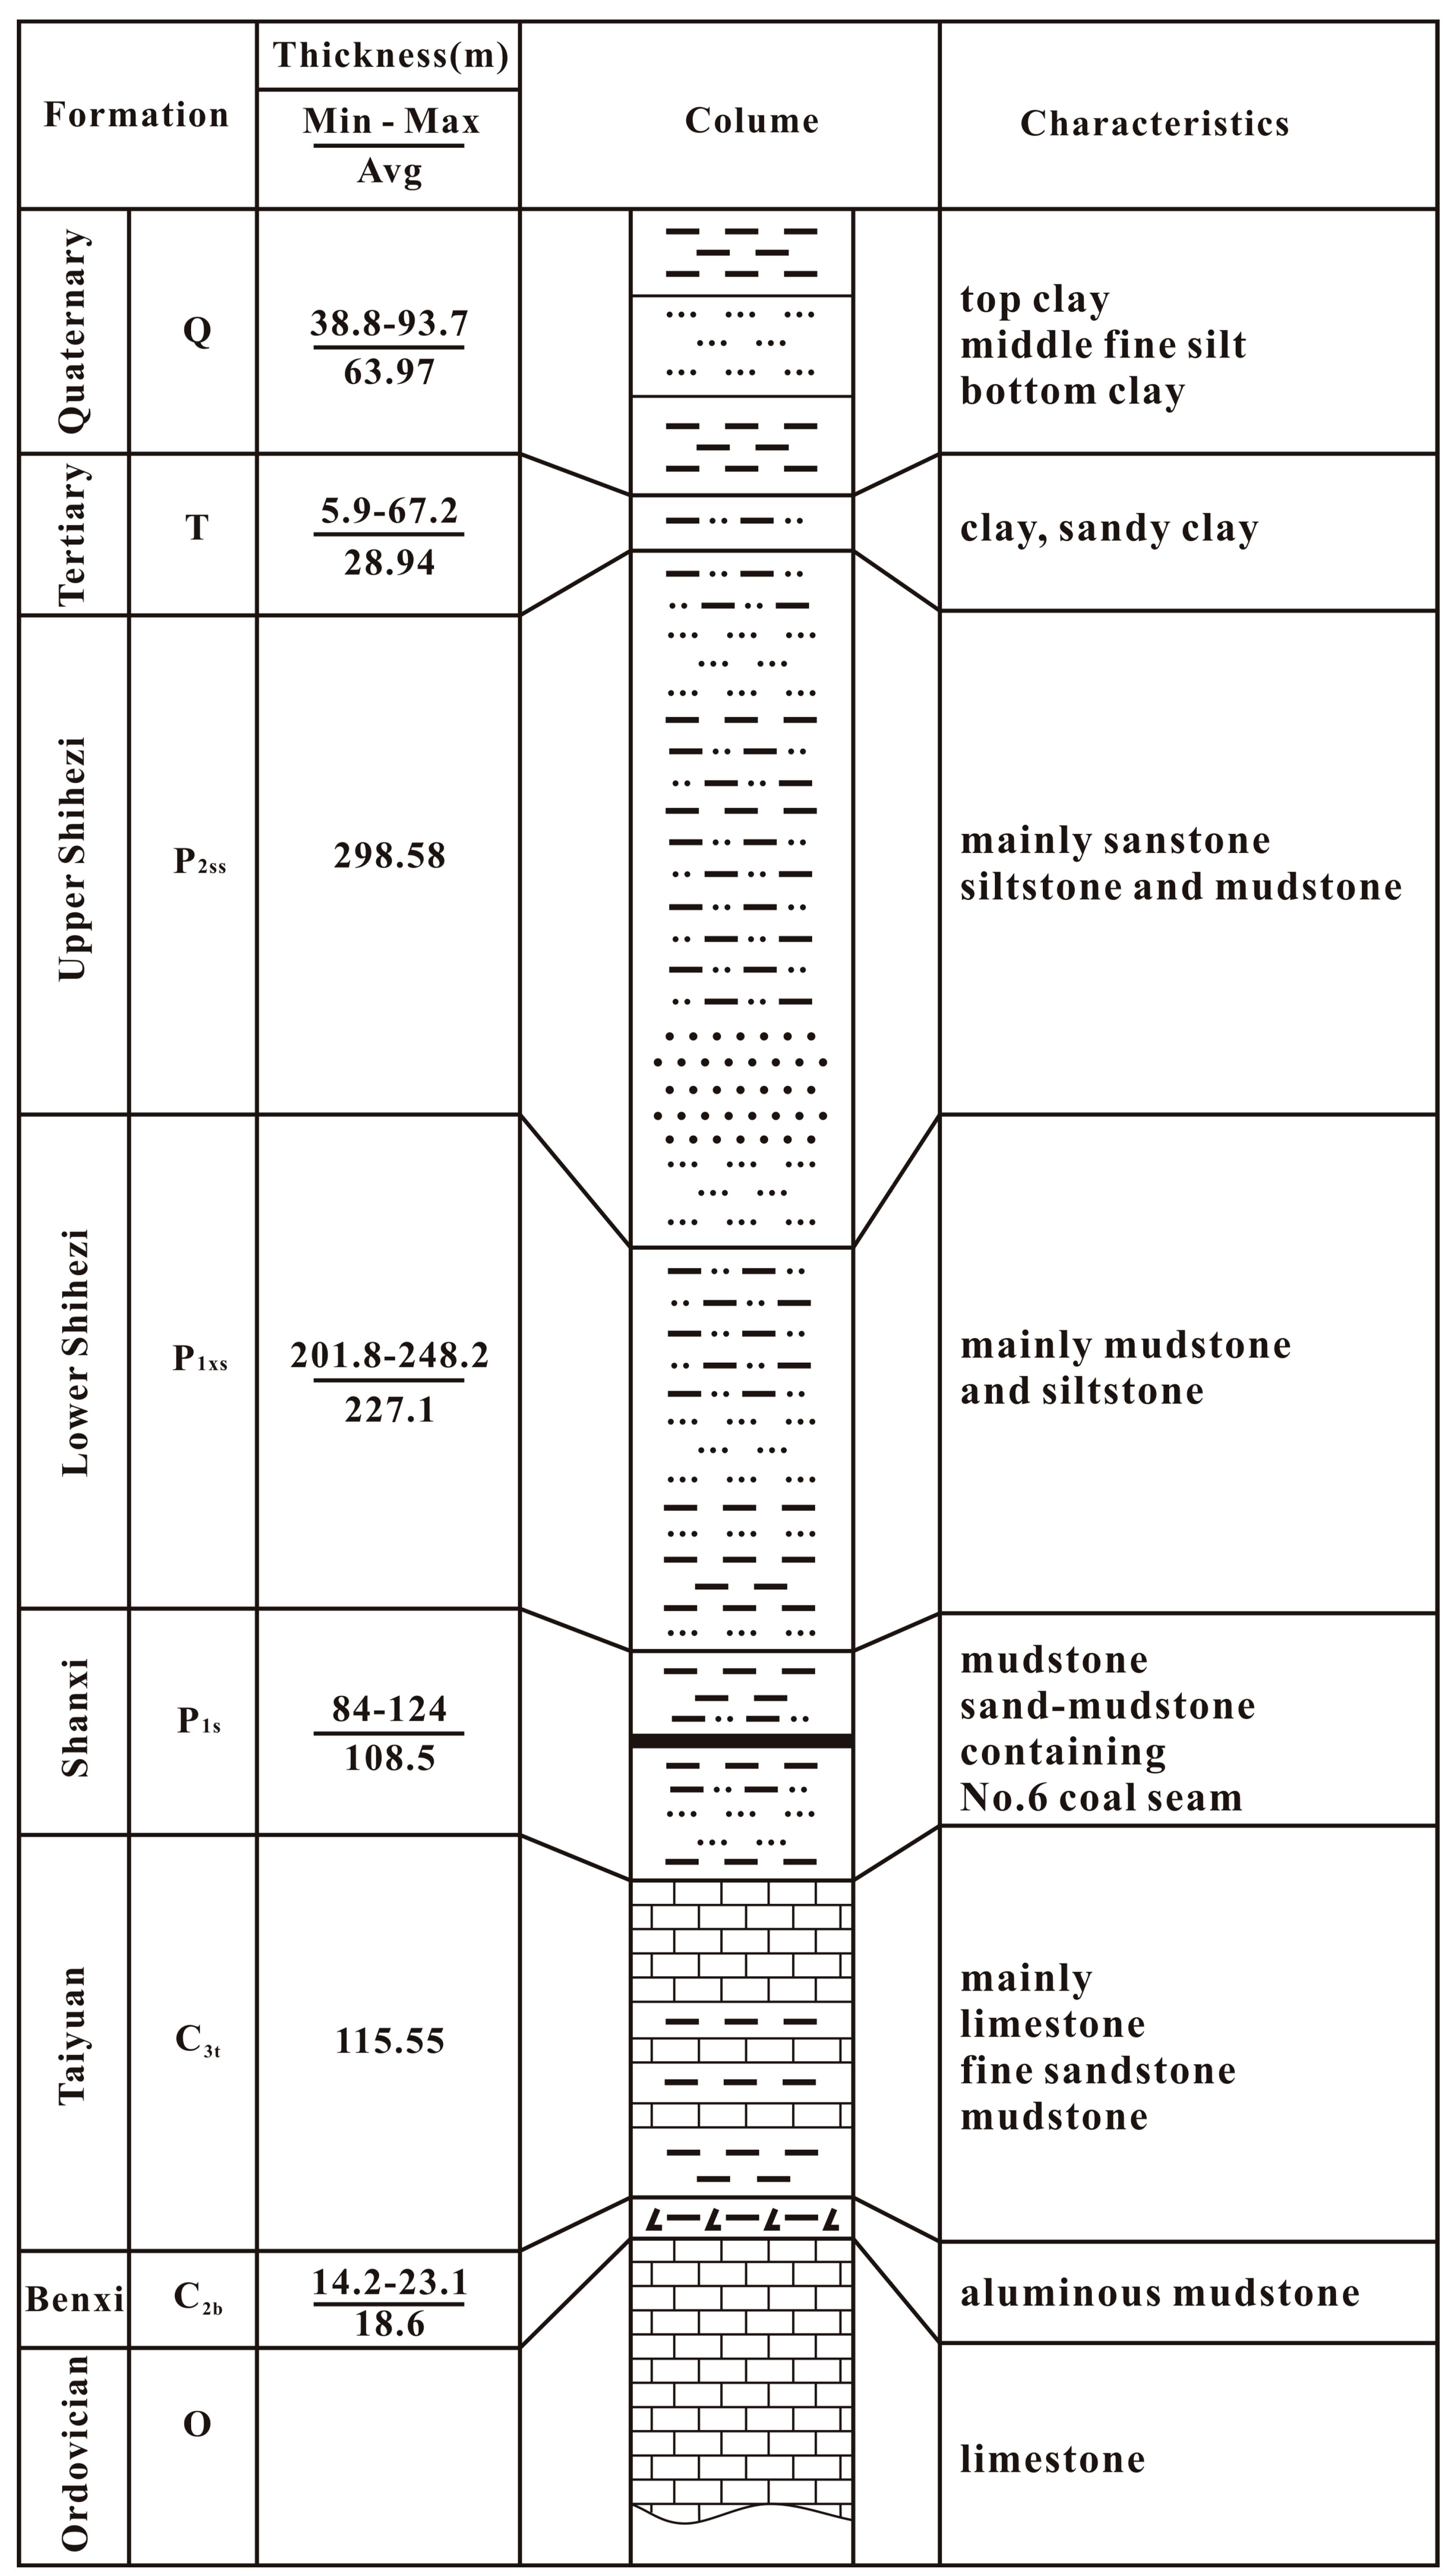
2.1. Geological Background
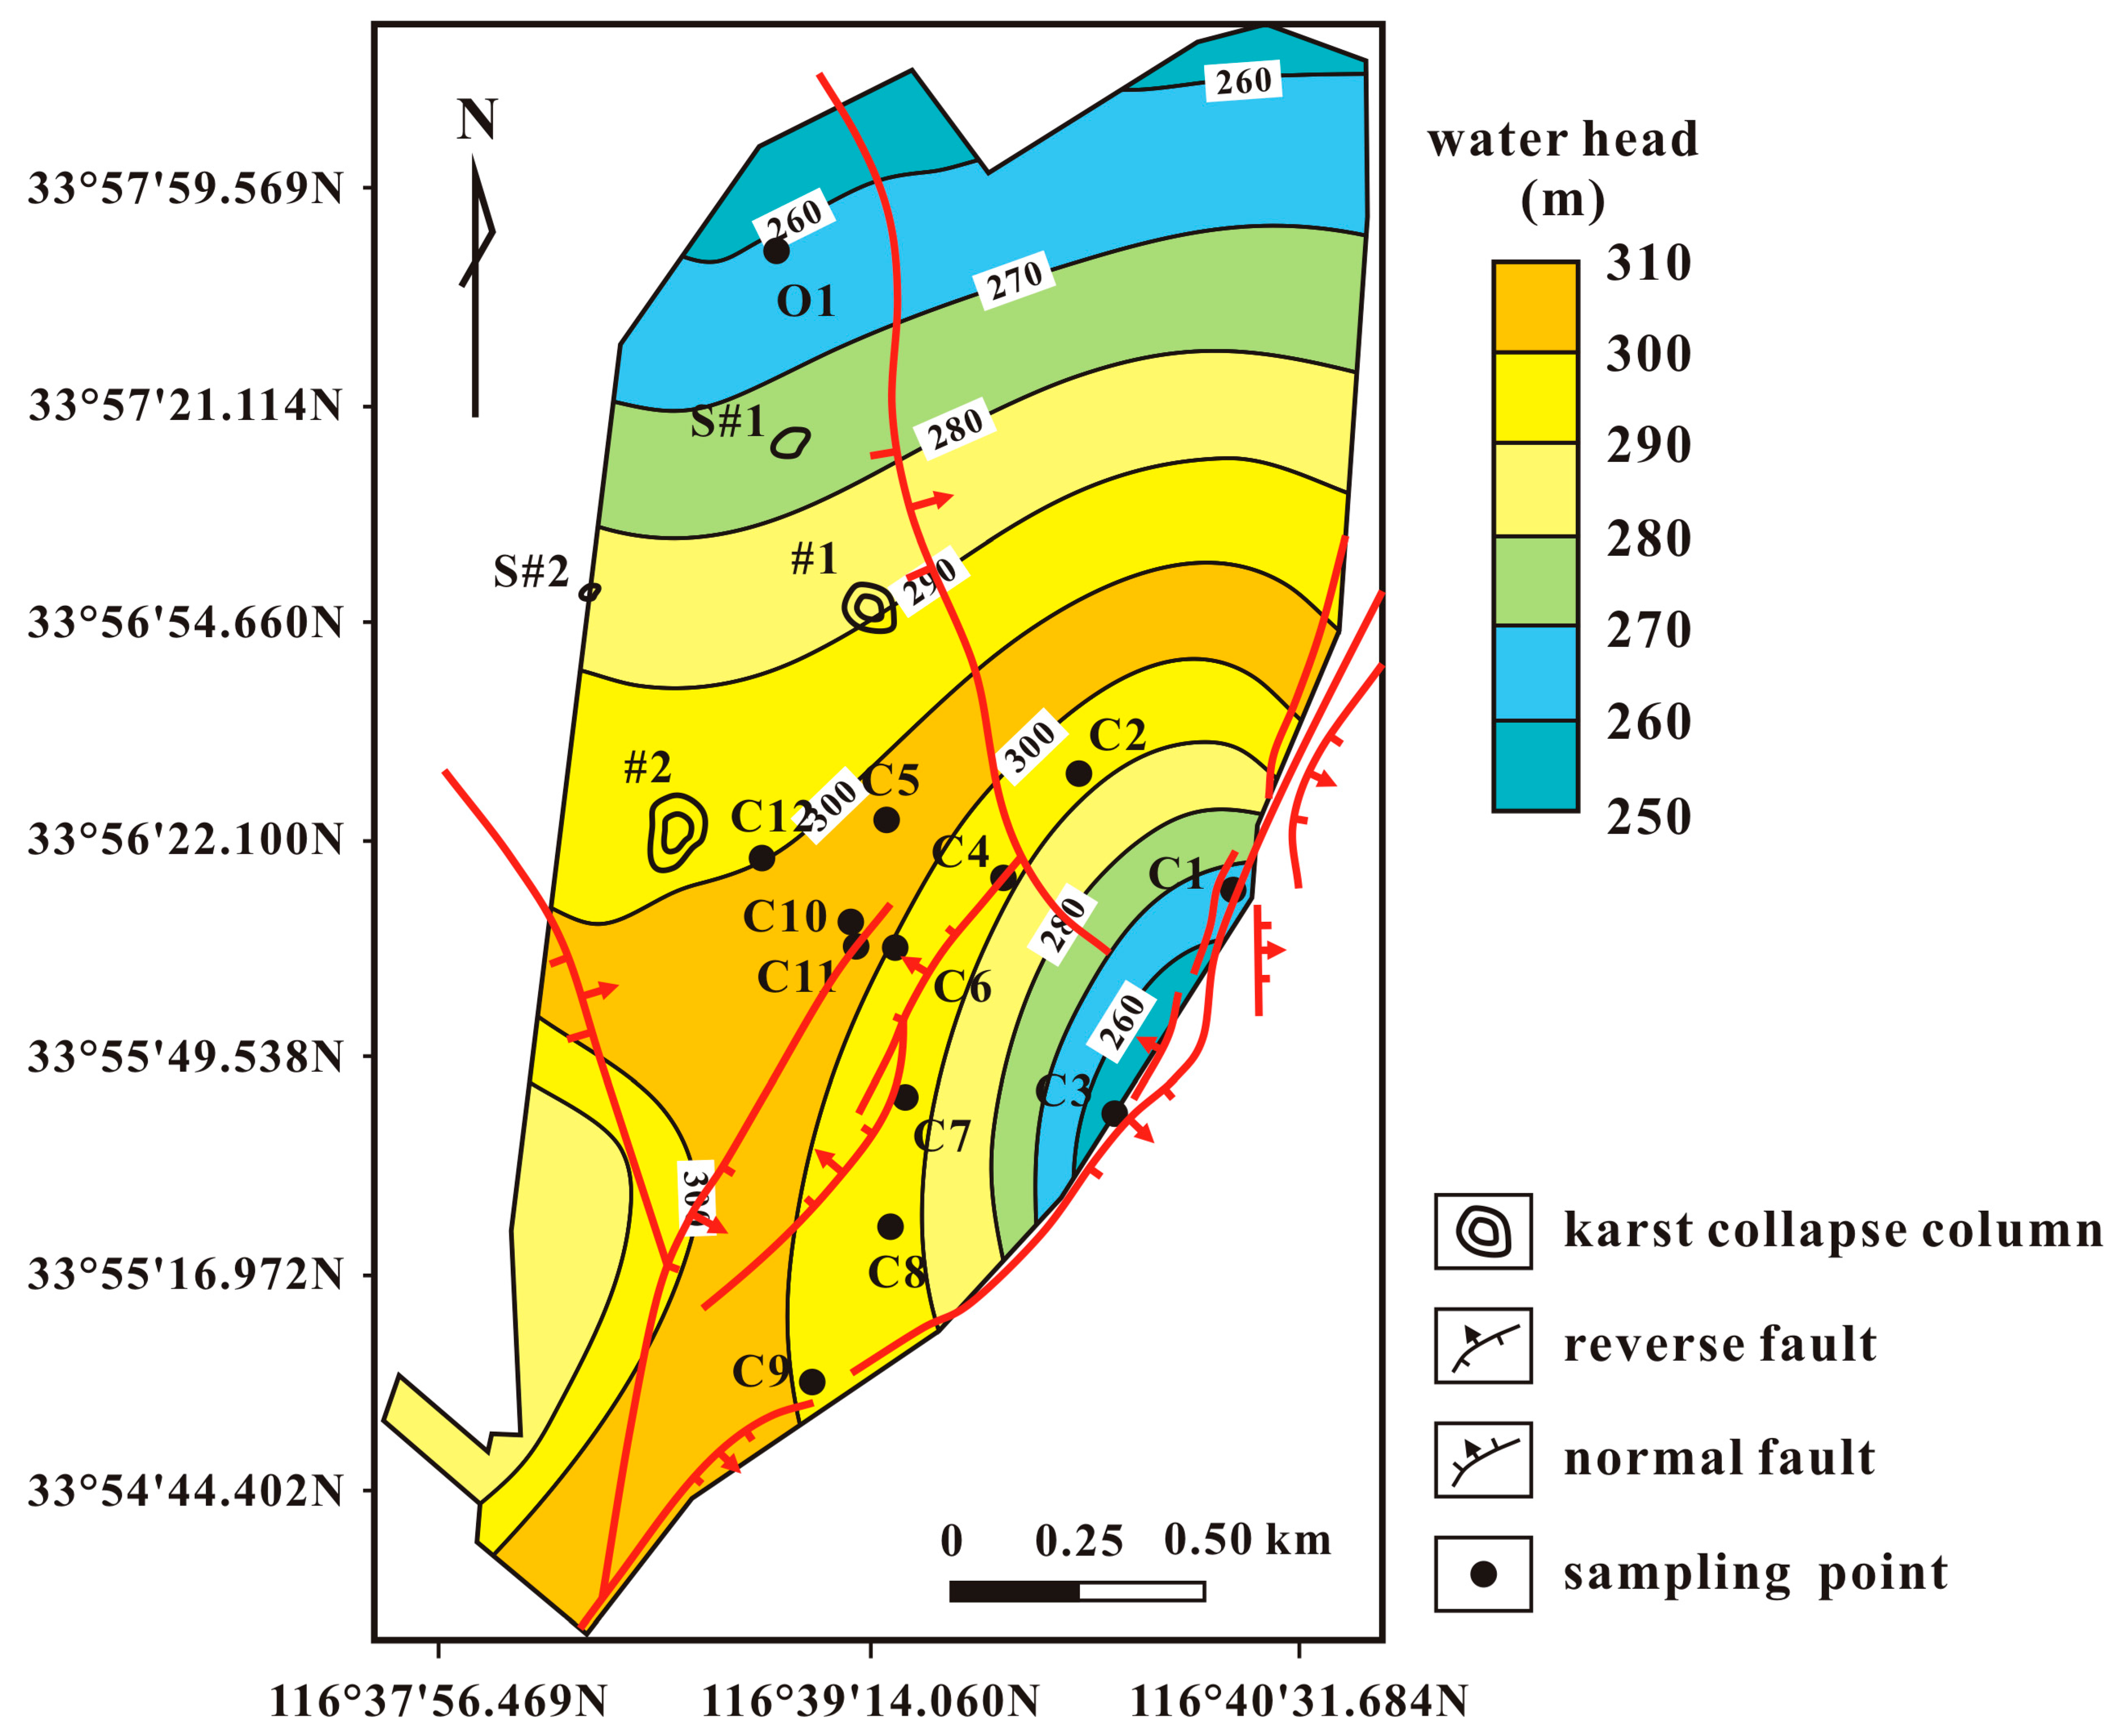
2.2. Hydrogeological Setting
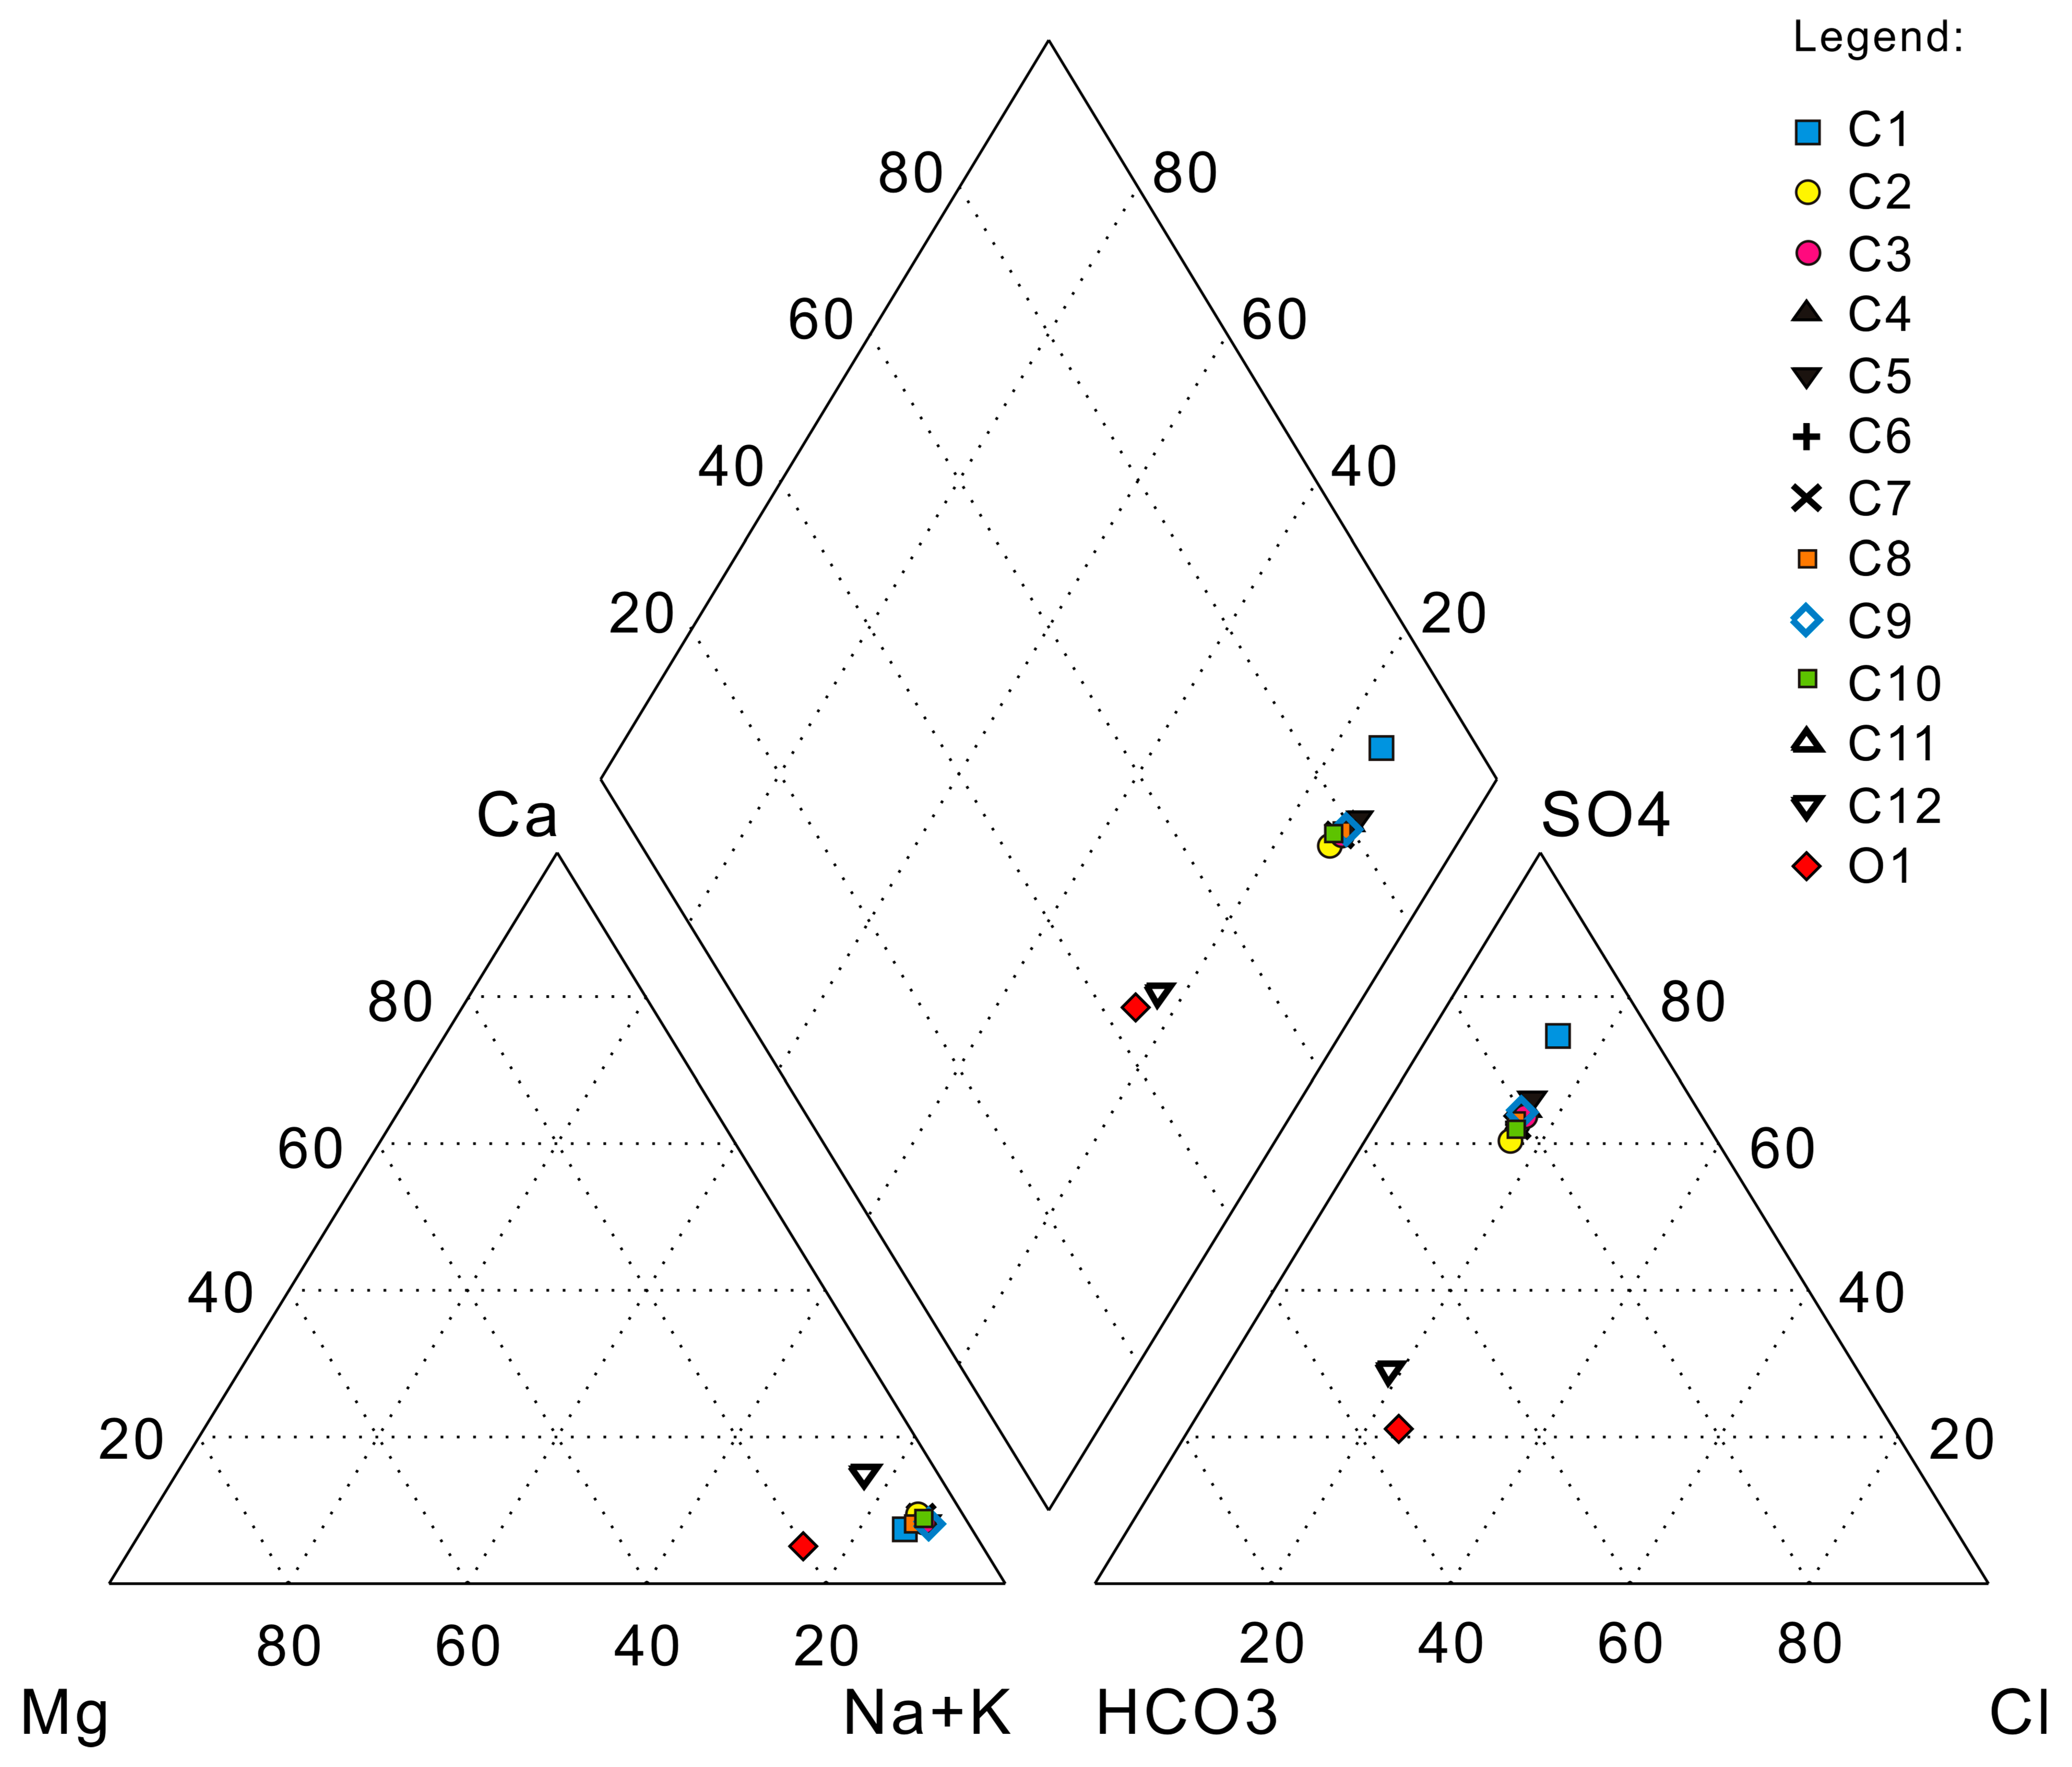
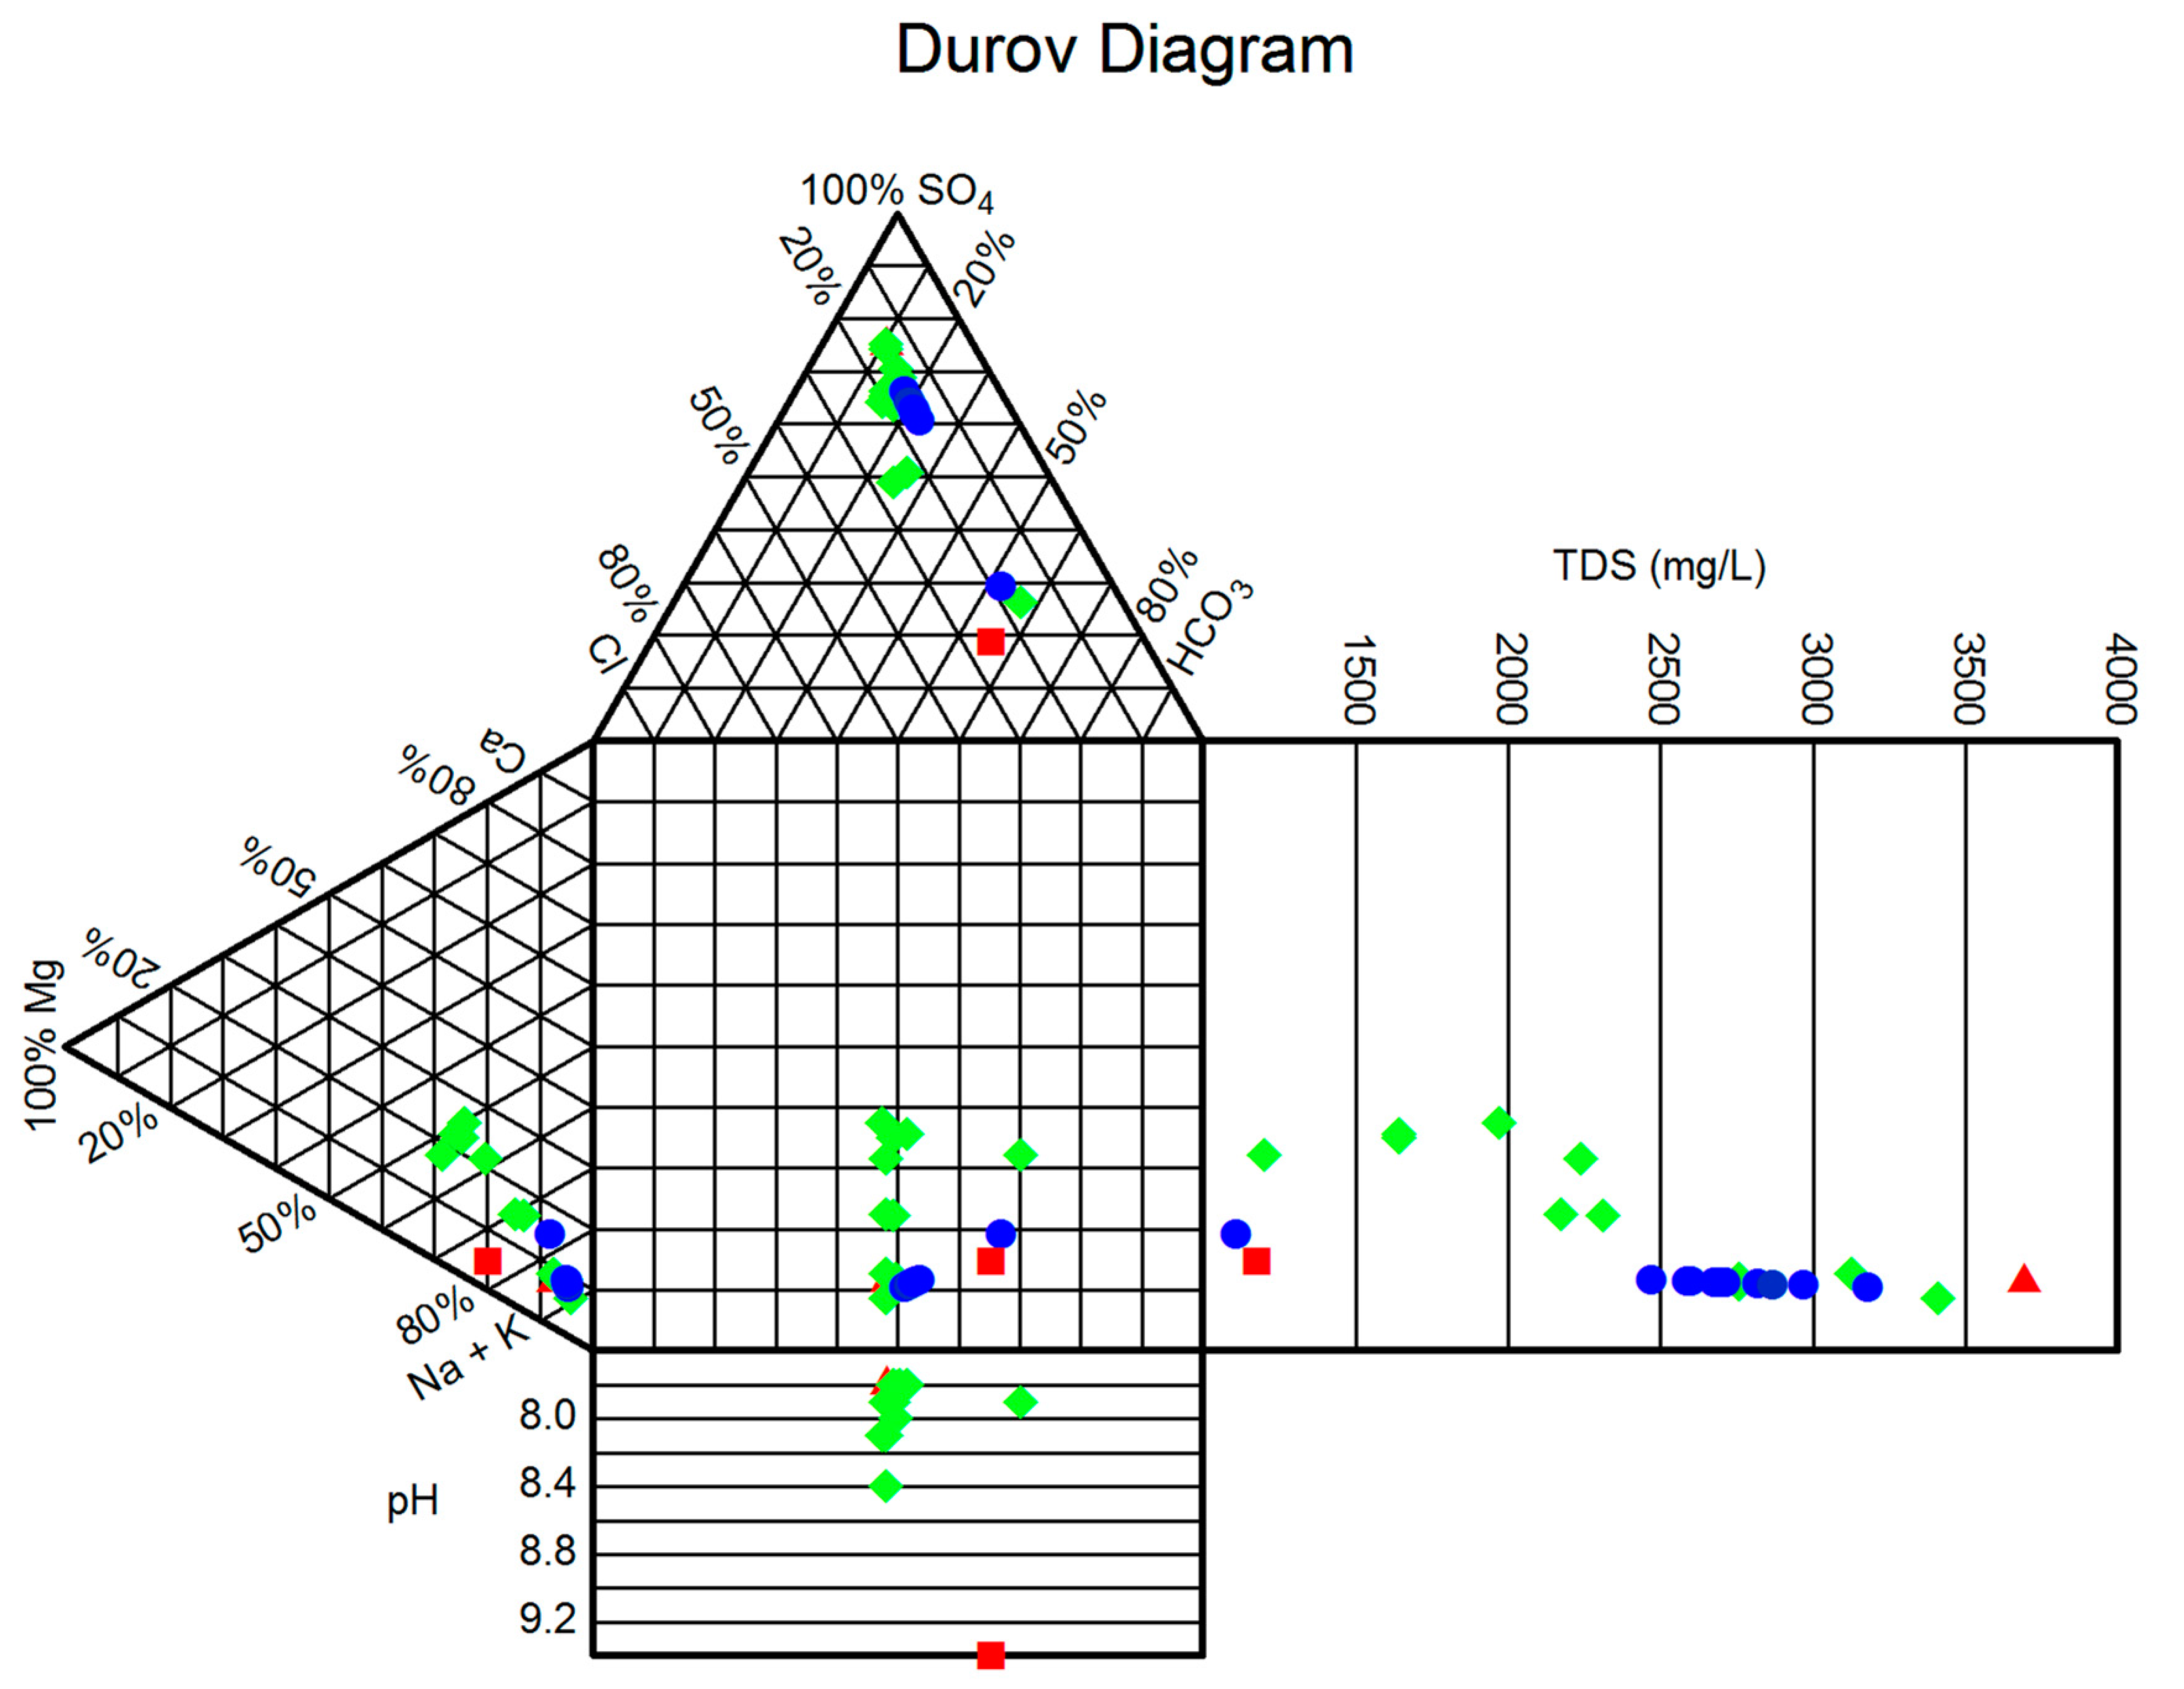
2.3. Hydrogeochemical Setting
3. Methodologies
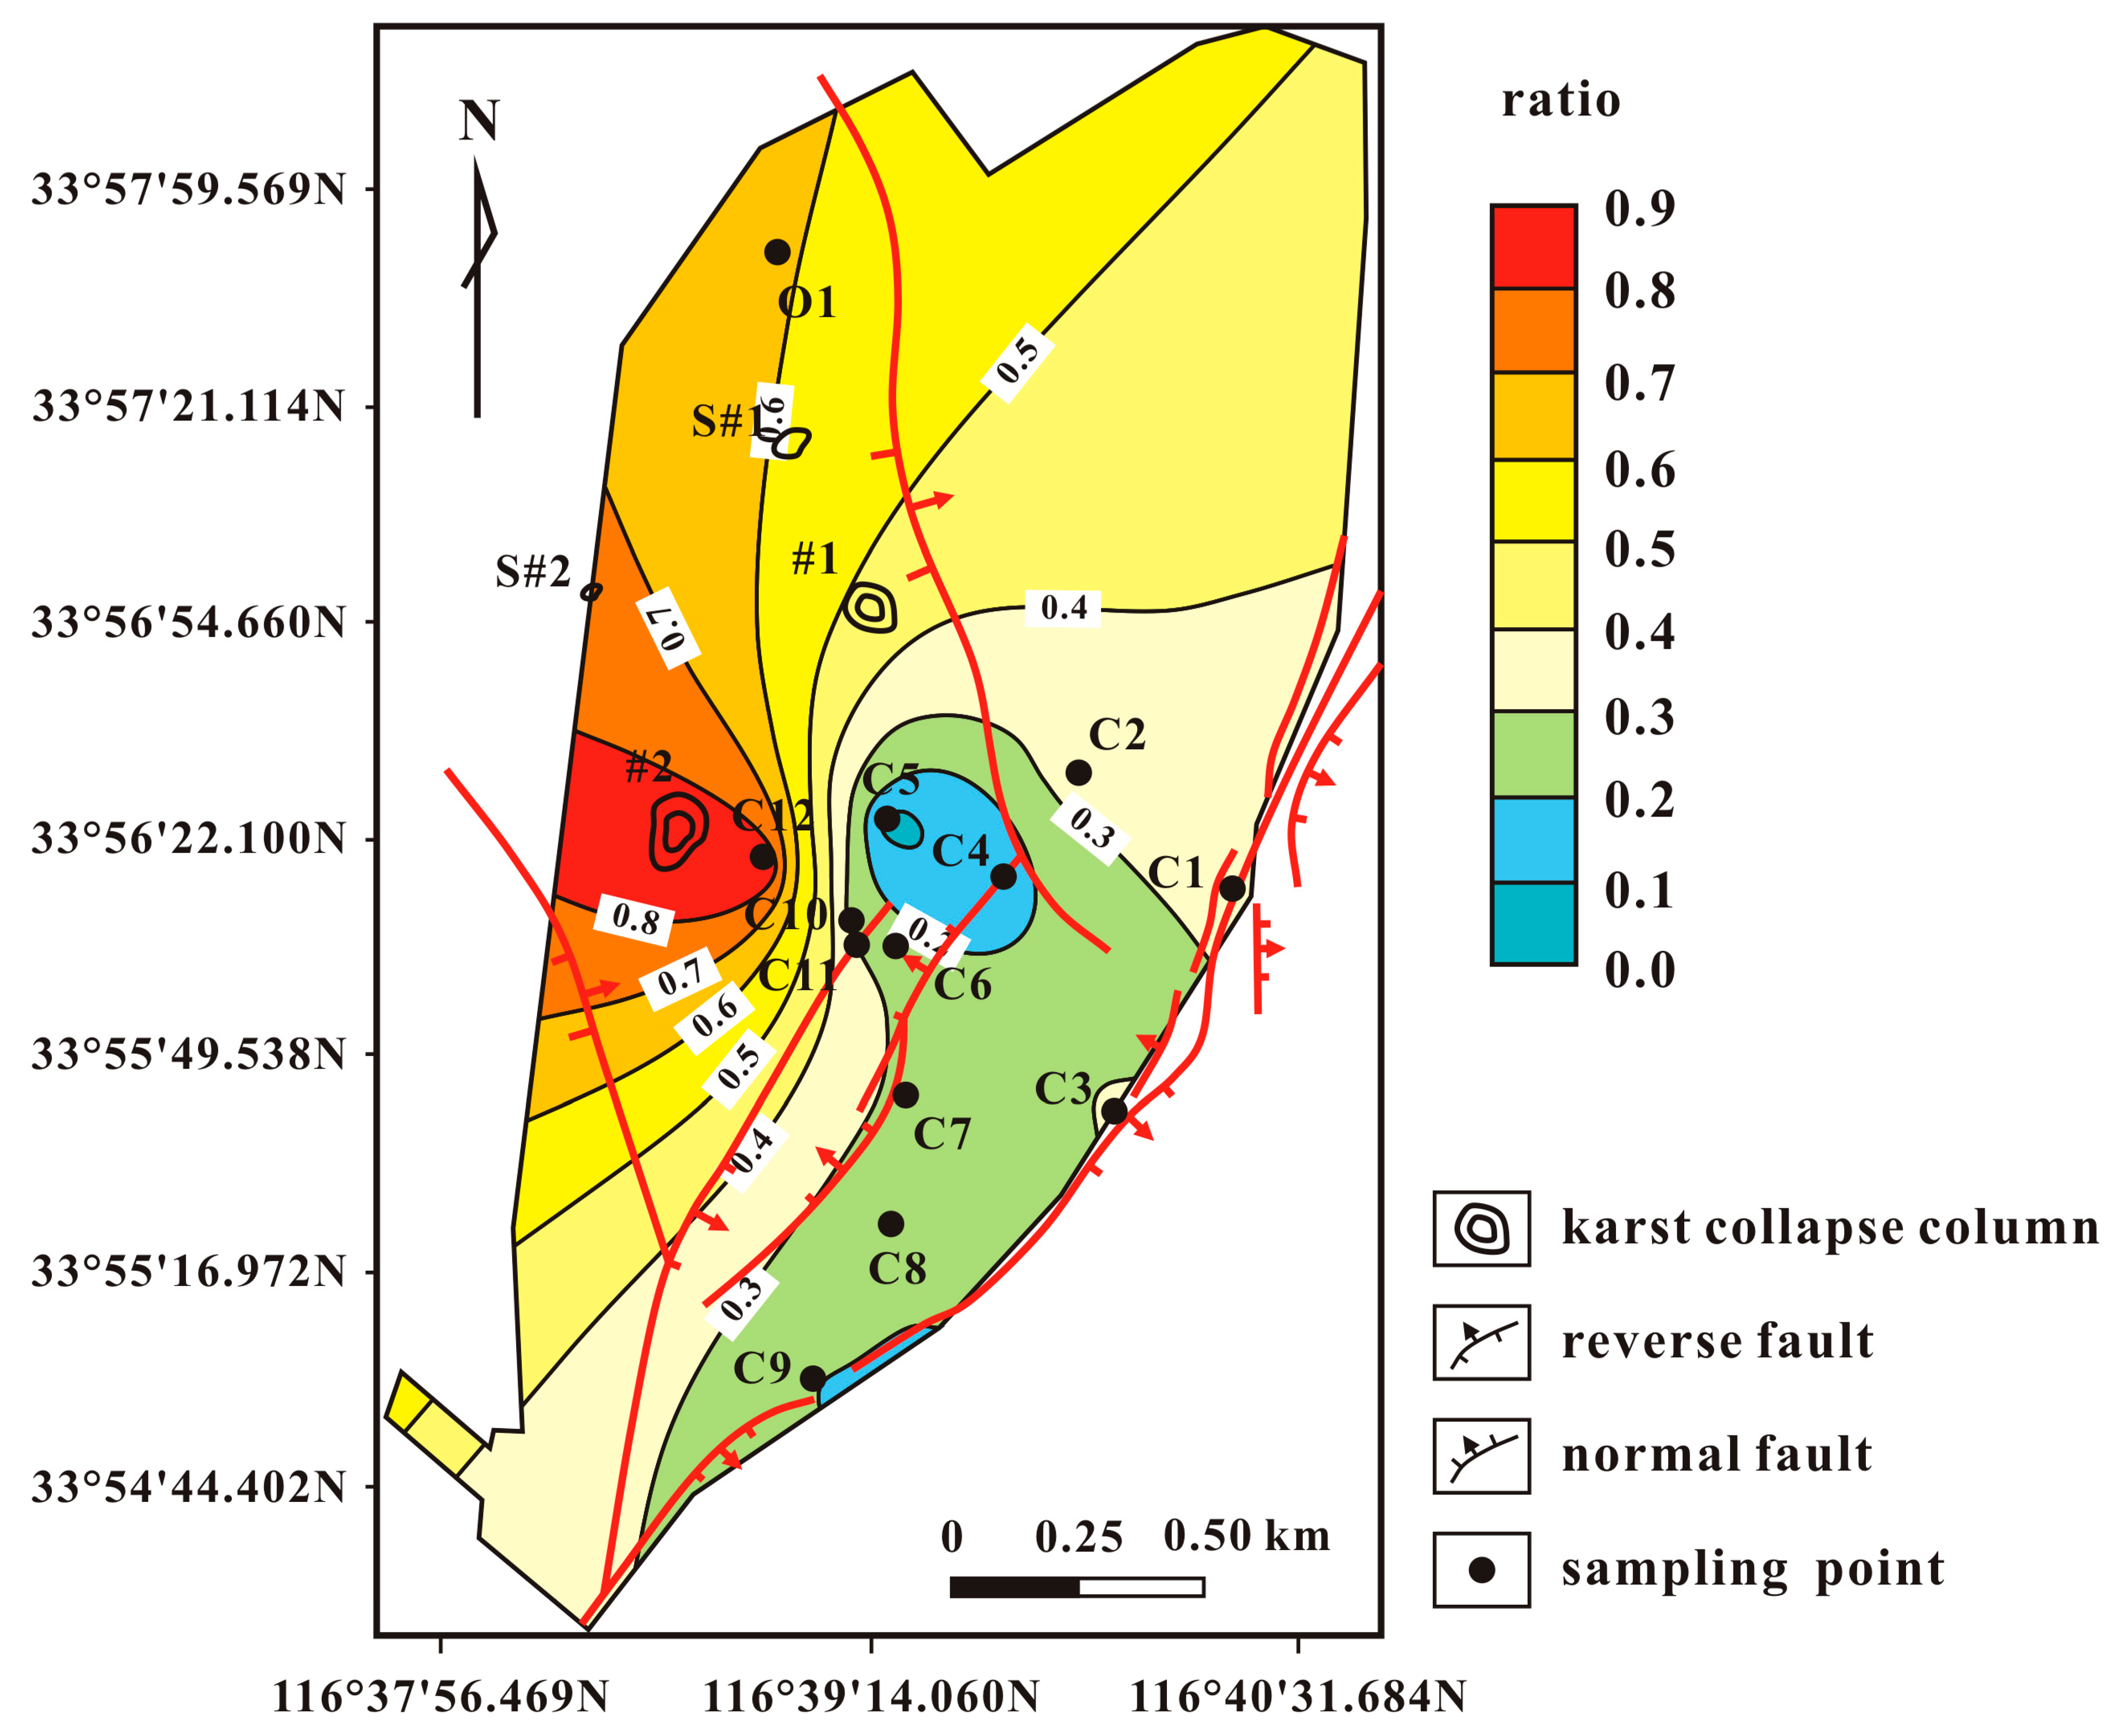
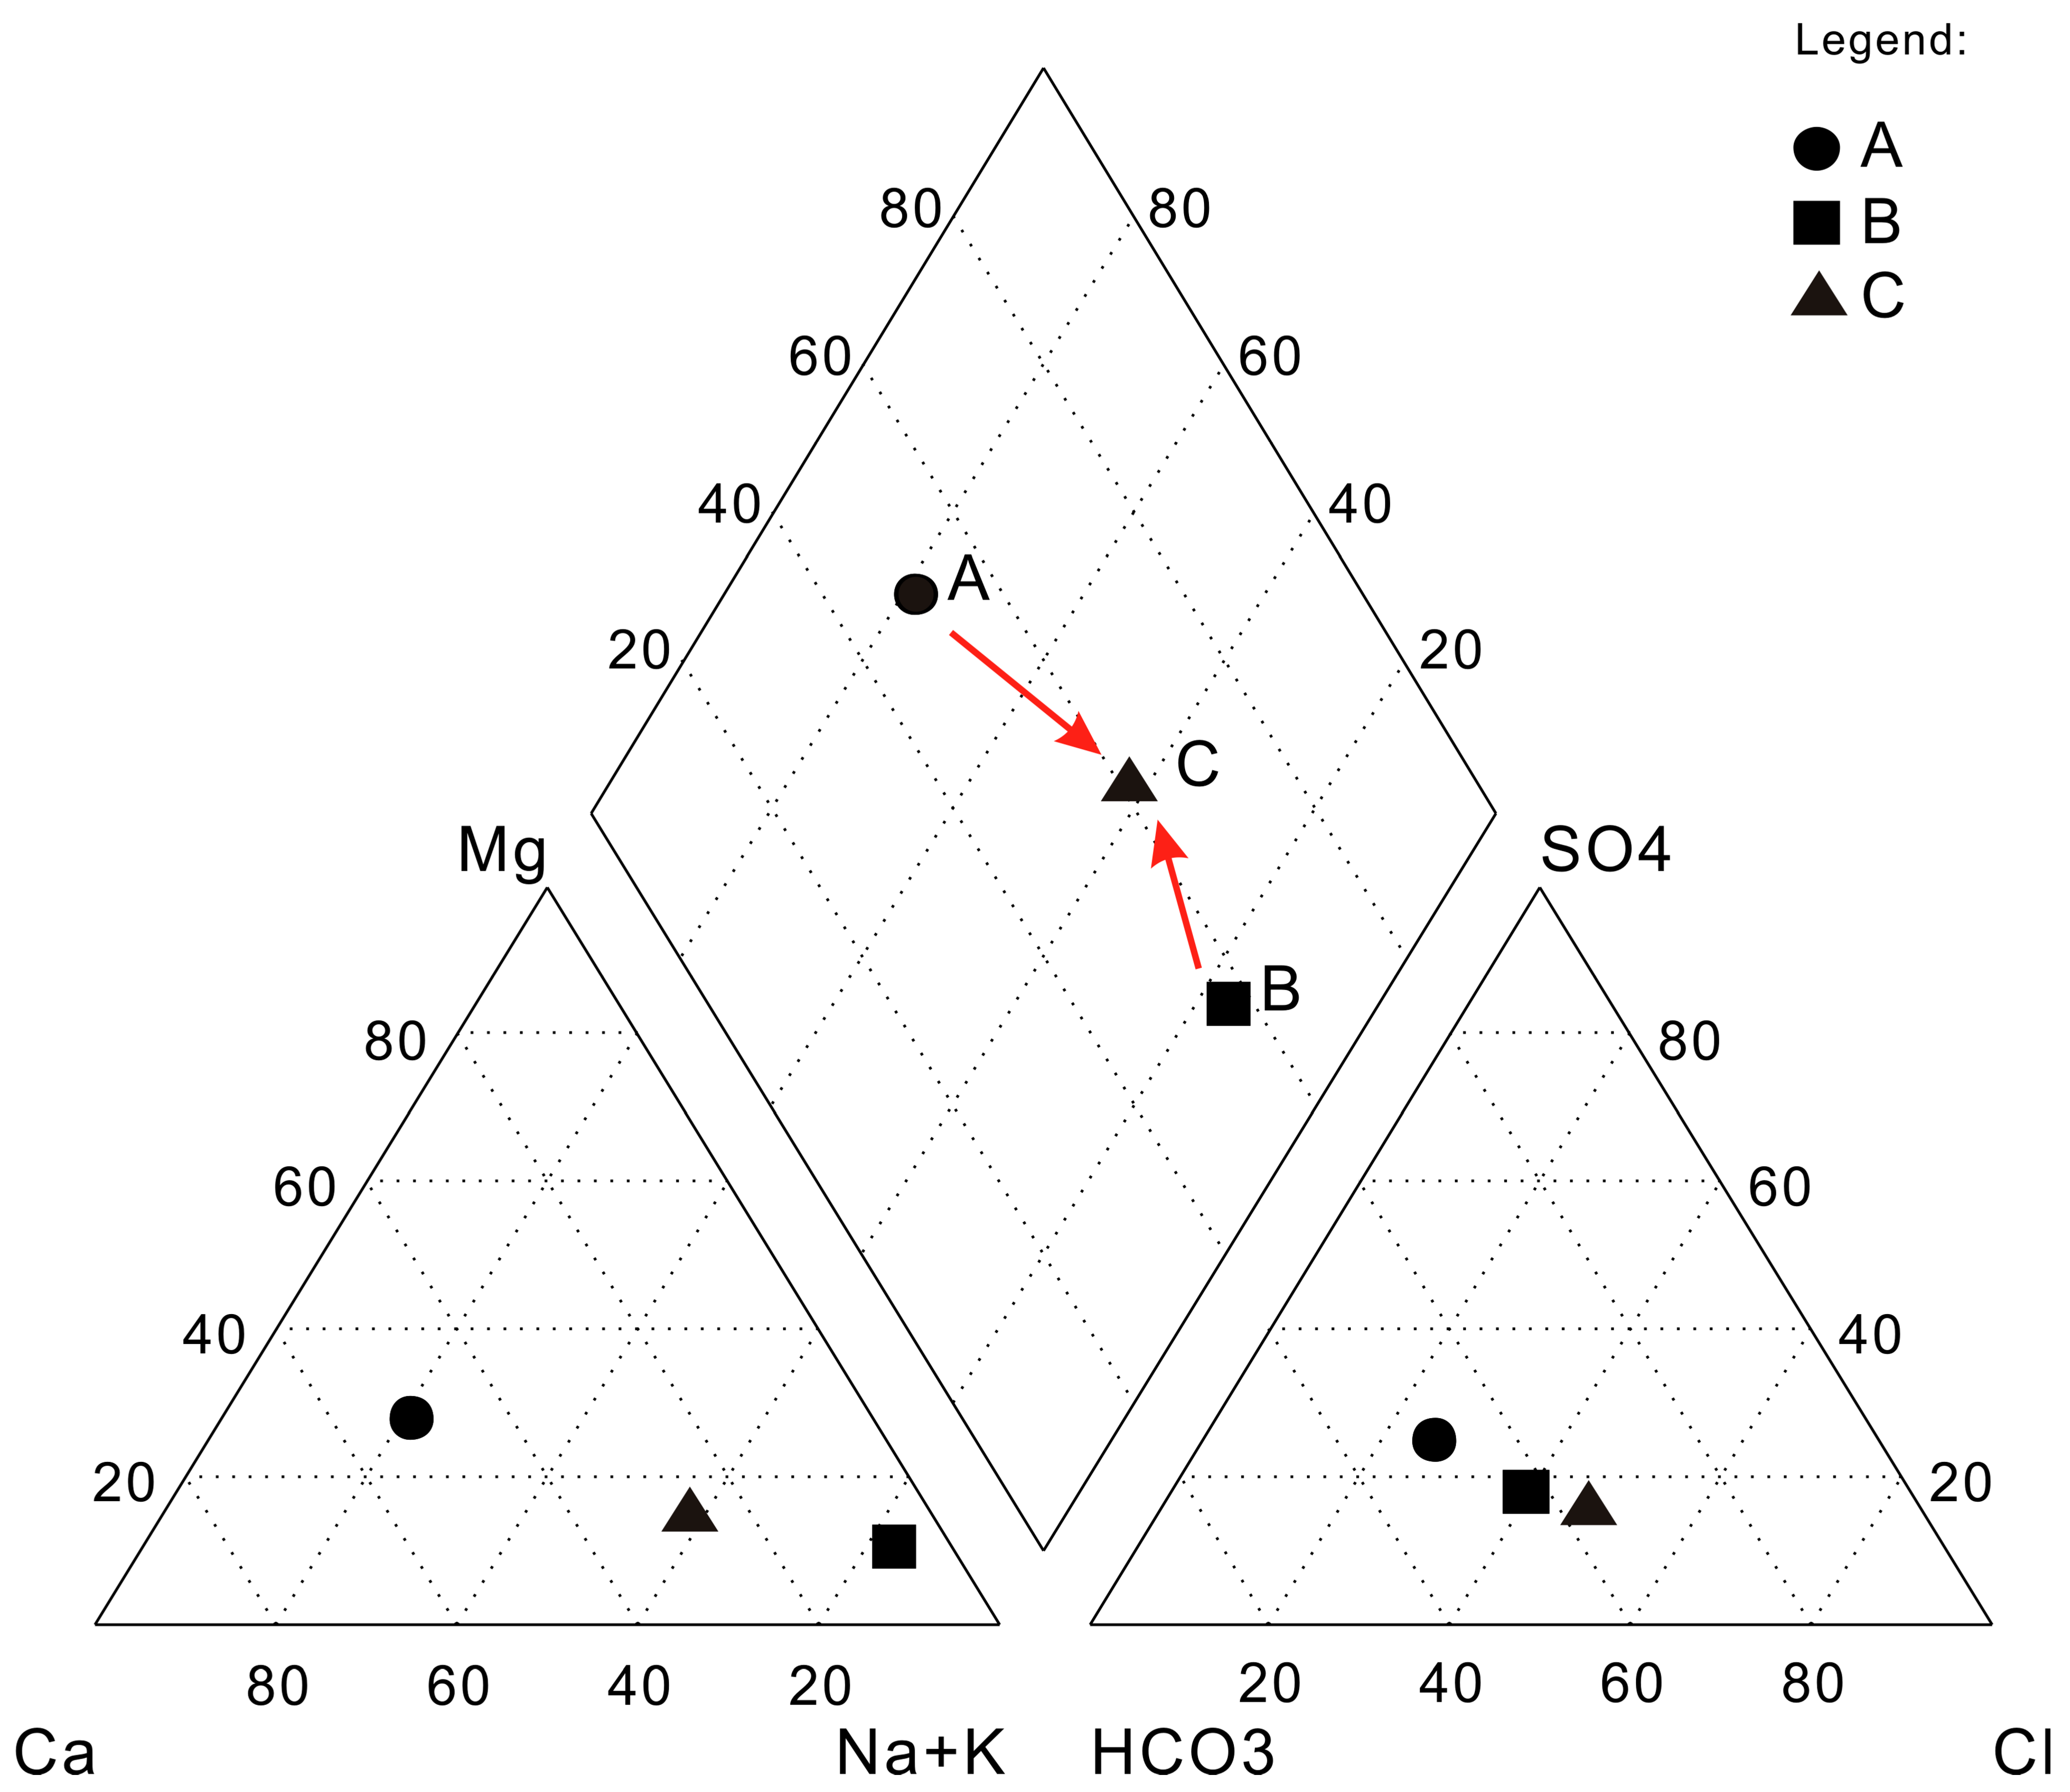
3.1. Calculation of the Mixing Ratio of the Mixing Groundwater
3.2. Simulation of the Evolution of Mixing Groundwater
4. Results and Discussion
5. Conclusions
Acknowledgments
Author Contributions
Conflicts of Interest
References
- Liang, Y. Experimental Simulation for the Flow Character and Quantity of Quicksand Based on Granular Flow Theory. Master’s Thesis, China University of Mining and Technology, Xuzhou, China, 2012. [Google Scholar]
- Li, G.Y.; Zhou, W.F. Impact of karst water on coal mining in North China. Environ. Geol. 2006, 49, 449–457. [Google Scholar] [CrossRef]
- Wu, Q.; Wang, M.; Wu, X. Investigations of groundwater bursting into coal mine seam floors from fault zones. Int. J. Rock Mech. Min. 2004, 41, 557–571. [Google Scholar] [CrossRef]
- Zhang, J.C.; Peng, S.P. Water inrush and environmental impact of shallow seam mining. Environ. Geol. 2005, 48, 1068–1076. [Google Scholar] [CrossRef]
- Zhang, J.C.; Shen, B.H. Coal mining under aquifers in China: A case study. Int. J. Rock Mech. Min. 2004, 41, 629–639. [Google Scholar] [CrossRef]
- Wu, Q.; Wang, M. Characterization of water bursting and discharge into underground mines with multilayered groundwater flow systems in the North China coal basin. Hydrogeol. J. 2006, 14, 882–893. [Google Scholar] [CrossRef]
- Zhu, W.C.; Wei, C.H. Numerical simulation on mining-induced water inrushes related to geologic structures using a damage-based hydromechanical model. Environ. Earth Sci. 2011, 62, 43–54. [Google Scholar] [CrossRef]
- Bi, Y.J.; Wu, Y.L.; Li, N. Brief analysis of prevent measure of the karst collapse column’s water inrush. In Proceedings of the International Conference on Mine Hazards Prevention and Control, Qingdao, China, 17 October 2007; pp. 628–632.
- Zuo, J.P.; Peng, S.P.; Li, Y.J.; Chen, Z.H.; Xie, H.P. Investigation of karst collapse based on 3-D seismic technique and DDA method at Xieqiao coal mine, China. Int. J. Coal Geol. 2009, 78, 276–287. [Google Scholar] [CrossRef]
- Yao, B.H.; Wei, J.P.; Wang, D.K.; Ma, D.; Chen, Z.Q. Numerical study on seepage property of karst collapse columns under particle migration. Cmes-Comp. Model. Eng. 2013, 91, 81–100. [Google Scholar]
- Chidambaram, S.; Anandhan, P.; Prasanna, M.V.; Srinivasamoorthy, K.; Vasanthavigar, M. Major ion chemistry and identification of hydrogeochemical processes controlling groundwater in and around Neyveli Lignite Mines, Tamil Nadu, South India. Arab. J. Geosci. 2013, 6, 3451–3467. [Google Scholar] [CrossRef]
- Gomo, M.; Masemola, E. Groundwater hydrogeochemical characteristics in rehabilitated coalmine spoils. J. Afr. Earth Sci. 2016, 116, 114–126. [Google Scholar] [CrossRef]
- Guo, H.M.; Wang, Y.X. Hydrogeochemical processes in shallow quaternary aquifers from the northern part of the Datong Basin, China. Appl. Geochem. 2004, 19, 19–27. [Google Scholar] [CrossRef]
- Venkatramanan, S.; Chung, S.Y.; Rajesh, R. Comprehensive studies of hydrogeochemical processes and quality status of groundwater with tools of cluster, grouping analysis, and fuzzy set method using GIS platform: A case study of Dalcheon in Ulsan City, Korea. Environ. Sci. Pollut. R. 2015, 22, 11209–11223. [Google Scholar] [CrossRef] [PubMed]
- Ardejani, F.D.; Karami, G.H.; Assadi, A.B.; Dehghan, R.A. Hydrogeochemical investigations of the Shour River and groundwater affected by acid mine drainage in Sarcheshmeh porphyry copper mine. In Proceedings of the 10th International-Mine-Water-Association Congress on Mine Water and the Environment, Karlovy Vary, Czech Republic, 2–5 June 2008; pp. 235–238.
- Carro, B.; Borrego, J.; Lopez-Gonzalez, N.; Grande, J.A.; Gomez, T.; de la Torre, M.L.; Valente, T. Impact of acid mine drainage on the hydrogeochemical characteristics of the Tinto-Odiel Estuary (SW Spain). J. Iber Geol. 2011, 37, 87–96. [Google Scholar]
- Ceron, J.C.; Grande, J.A.; de la Torre, M.L.; Borrego, J.; Santisteban, M.; Valente, T. Hydrochemical characterization of an acid mine drainage-affected reservoir: The Sancho Reservoir, Huelva, southwest Spain. Hydrolog. Sci. J. 2014, 59, 1213–1224. [Google Scholar] [CrossRef]
- Ceron, J.C.; Grande, J.A.; de la Torre, M.L.; Santisteban, M.; Valente, T. Impact of AMD processes on the water dams of the iberian Pyrite Belt: Overall hydrochemical characterization (Huelva, SW Spain). Water Air Soil Poll. 2013, 224, 1–11. [Google Scholar] [CrossRef]
- Equeenuddin, S.M.; Tripathy, S.; Sahoo, P.K.; Panigrahi, M.K. Hydrogeochemical characteristics of acid mine drainage and water pollution at Makum Coalfield, India. J. Geochem Explor. 2010, 105, 75–82. [Google Scholar] [CrossRef]
- Grande, J.A.; Carro, B.; Borrego, J.; de la Torre, M.L.; Valente, T.; Santisteban, M. Hydrogeochemical variables regionalization—Applying cluster analysis for a seasonal evolution model from an estuarine system affected by AMD. Mar. Pollut. Bull. 2013, 69, 150–156. [Google Scholar] [CrossRef] [PubMed]
- Bhattacharya, P.; Sracek, O.; Eldvall, B.; Asklund, R.; Barmen, G.; Jacks, G.; Koku, J.; Gustafsson, J.E.; Singh, N.; Balfors, B.B. Hydrogeochemical study on the contamination of water resources in a part of Tarkwa mining area, Western Ghana. J. Afr. Earth Sci. 2012, 66–67, 72–84. [Google Scholar] [CrossRef]
- Cidu, R. Mobility of aqueous contaminants at abandoned mining sites: Insights from case studies in Sardinia with implications for remediation. Environ. Earth Sci. 2011, 64, 503–512. [Google Scholar] [CrossRef]
- Steefel, C.I. New directions in hydrogeochemical transport modeling: Incorporating multiple kinetic and equilibrium reaction pathways. In Proceedings of the XIII th International Conference on Computational Methods in Water Resources, University of Calgary, Calgary, AB, Canada, 25–29 June 2000; pp. 331–338.
- Eary, L.E.; Runnells, D.D.; Esposito, K.J. Geochemical controls on ground water composition at the cripple creek mining district, cripple creek, Colorado. Appl. Geochem. 2003, 18, 1–24. [Google Scholar] [CrossRef]
- Kruse, N.A.; Younger, P.L. Development of thermodynamically-based models for simulation of hydrogeochemical processes coupled to channel flow processes in abandoned underground mines. Appl. Geochem. 2009, 24, 1301–1311. [Google Scholar] [CrossRef]
- Rusdinar, Y.; Edraki, M.; Baumgartl, T.; Mulligan, D.; Miller, S. Long term performance of hydrogeochemical riverine mine tailings deposition at Freeport Indonesia. Mine Water Environ. 2013, 32, 56–70. [Google Scholar] [CrossRef]
- Yann, R.A.; Julio, M.A. Hydrogeochemical trends of the Valenciana tailings, Mexico. In Proceedings of the 14th International Symposium on Water–Rock Interaction (WRI), Avignon, France, 9–14 June 2013; pp. 717–720.
- Gomo, M.; Vermeulen, D. Hydrogeochemical characteristics of a flooded underground coal mine groundwater system. J. Afr. Earth Sci. 2014, 92, 68–75. [Google Scholar] [CrossRef]
- Han, Y.; Wang, G.C.; Cravotta, C.A.; Hu, W.Y.; Bian, Y.Y.; Zhang, Z.W.; Liu, Y.Y. Hydrogeochemical evolution of Ordovician limestone groundwater in Yanzhou, North China. Hydrol. Process. 2013, 27, 2247–2257. [Google Scholar] [CrossRef]
- Karmegam, U.; Chidambaram, S.; Prasanna, M.V.; Sasidhar, P.; Manikandan, S.; Johnsonbabu, G.; Dheivanayaki, V.; Paramaguru, P.; Manivannan, R.; Srinivasamoorthy, K.; et al. A study on the mixing proportion in groundwater samples by using piper diagram and PHREEQC model. Chin. J. Geochem. 2011, 30, 490–495. [Google Scholar] [CrossRef]
- Henriques, V.; Malekian, R. Mine safety system using wireless sensor network. IEEE Access 2016, 4, 3511–3521. [Google Scholar] [CrossRef]
- Su, B.; Malekian, R.; Yu, J.; Feng, X.; Liu, Z. Electrical anisotropic response of water conducted fractured zone in the mining goaf. IEEE Access 2016, 4, 6216–6224. [Google Scholar] [CrossRef]
- Gong, T.; Huang, H.; Chen, P.; Malekian, R.; Chen, T. Secure two-party distance computation protocol based on privacy homomorphism and scalar product in wireless sensor networks. Tsinghua Sci. Technol. 2016, 21, 385–396. [Google Scholar]
- Piper, A.M. A graphic procedure in the geochemical interpretation of water—analysis. Trans. Am. Geophys. Union 1944, 25, 914–928. [Google Scholar] [CrossRef]
- Rao, N.S. MHPT. BAS: A computer program for modified Hill–Piper diagram for classification of ground water. Comput. Geosci. 1998, 24, 991–1008. [Google Scholar] [CrossRef]
- Zhang, X.; Shao, J.; An, W.; Yang, T.; Malekian, R. An improved time-frequency representation based on nonlinear mode decomposition and adaptive optimal kernel. Elektron. Ir Elektrotech. 2016, 22, 52–57. [Google Scholar]
- Jin, X.; Shao, J.; Zhang, X.; An, W.; Malekian, R. Modeling of nonlinear system based on deep learning framework. Nonlinear Dyn. 2016, 84, 1327–1340. [Google Scholar] [CrossRef]
- Cloete, N.A.; Malekian, R.; Nair, L. Design of smart sensors for real-time water quality monitoring. IEEE Access 2016, 4, 3975–3990. [Google Scholar] [CrossRef]
- Li, X.; Wang, S.; Malekian, R.; Hao, S.; Li, Z. Numerical simulation of rock breakage modes under confining pressures in the rock cutting process: An experimental investigation. IEEE Access 2016, 4, 5710–5720. [Google Scholar] [CrossRef]
- Wang, J.; Cai, M.; Malekian, R.; Zhang, Y.; Li, Z. Experimental evaluation of lubrication characteristics of a new type oil-film bearing oil using multi-sensor system. Appl. Sci. 2017, 7, 28. [Google Scholar] [CrossRef]


| Reaction Term | Dissolution Reaction Equation |
|---|---|
| CO2 (g) | CO2 + H2O ⇌ H+ + HCO3− |
| Gypsum | CaSO4·2H2O ⇌ Ca2+ + SO42− + 2H2O |
| Anhydrite | CaSO4 ⇌ Ca2+ + SO42− |
| Halite | NaCl ⇌ Na+ + Cl− |
| Calcite | CaCO3 ⇌ Ca2+ + CO32− |
| Dolomite | CaMg(CO3)2 ⇌ Ca2+ + Mg2+ + 2CO32− |
| Cation Exchange | 2NaX + Ca2+ ⇌ 2Na+ + CaX2 |
| Sample | Cation (mg/L) | Anion (mg/L) | Alkalinity (mg/L) | pH | TDS (mg/L) | Hardness (°H) | ||||
|---|---|---|---|---|---|---|---|---|---|---|
| K+ + Na+ | Ca2+ | Mg2+ | HCO3− | SO42− | Cl− | |||||
| C1 | 1030.31 | 80.18 | 48.06 | 346.34 | 1903.19 | 268.16 | 5.676 | 7.8 | 3693 | 22.30 |
| C2 | 284.99 | 108.96 | 75.67 | 384.11 | 585.56 | 197.46 | 6.269 | 7.8 | 1647 | 32.69 |
| C3 | 493.17 | 92.56 | 54.06 | 281.79 | 944.62 | 206.11 | 4.618 | 8.4 | 2178 | 25.42 |
| C4 | 872.30 | 80.36 | 41.28 | 302.29 | 1586.33 | 234.80 | 5.780 | 8.1 | 3129 | 15.42 |
| C5 | 1003.74 | 63.63 | 24.62 | 313.82 | 1759.74 | 250.86 | 5.140 | 8.1 | 3412 | 14.58 |
| C6 | 805.12 | 70.78 | 33.34 | 357.39 | 1368.65 | 215.51 | 6.321 | 8.0 | 2761 | 17.59 |
| C7 | 784.16 | 64.85 | 25.51 | 381.00 | 1300.39 | 213.06 | 6.244 | 7.8 | 2761 | 15.24 |
| C8 | 291.92 | 109.72 | 72.53 | 367.70 | 566.64 | 223.73 | 6.030 | 7.8 | 1646 | 32.08 |
| C9 | 551.33 | 105.73 | 52.66 | 362.09 | 1022.58 | 227.21 | 5.934 | 7.9 | 2317 | 26.94 |
| C10 | 430.88 | 137.05 | 78.97 | 295.33 | 1018.3 | 214.27 | 4.840 | 7.9 | 2242 | 37.39 |
| C11 | 330.19 | 144.53 | 83.50 | 268.24 | 877.53 | 207.07 | 4.396 | 8.1 | 1974 | 39.48 |
| C12 | 202.68 | 58.90 | 57.07 | 573.03 | 206.16 | 97.97 | 9.391 | 7.9 | 1206 | 21.40 |
| O1 | 193.3 | 10.63 | 27.01 | 314.81 | 83.19 | 82.37 | 353.81 | 9.4 | 1180 | 137.8 |
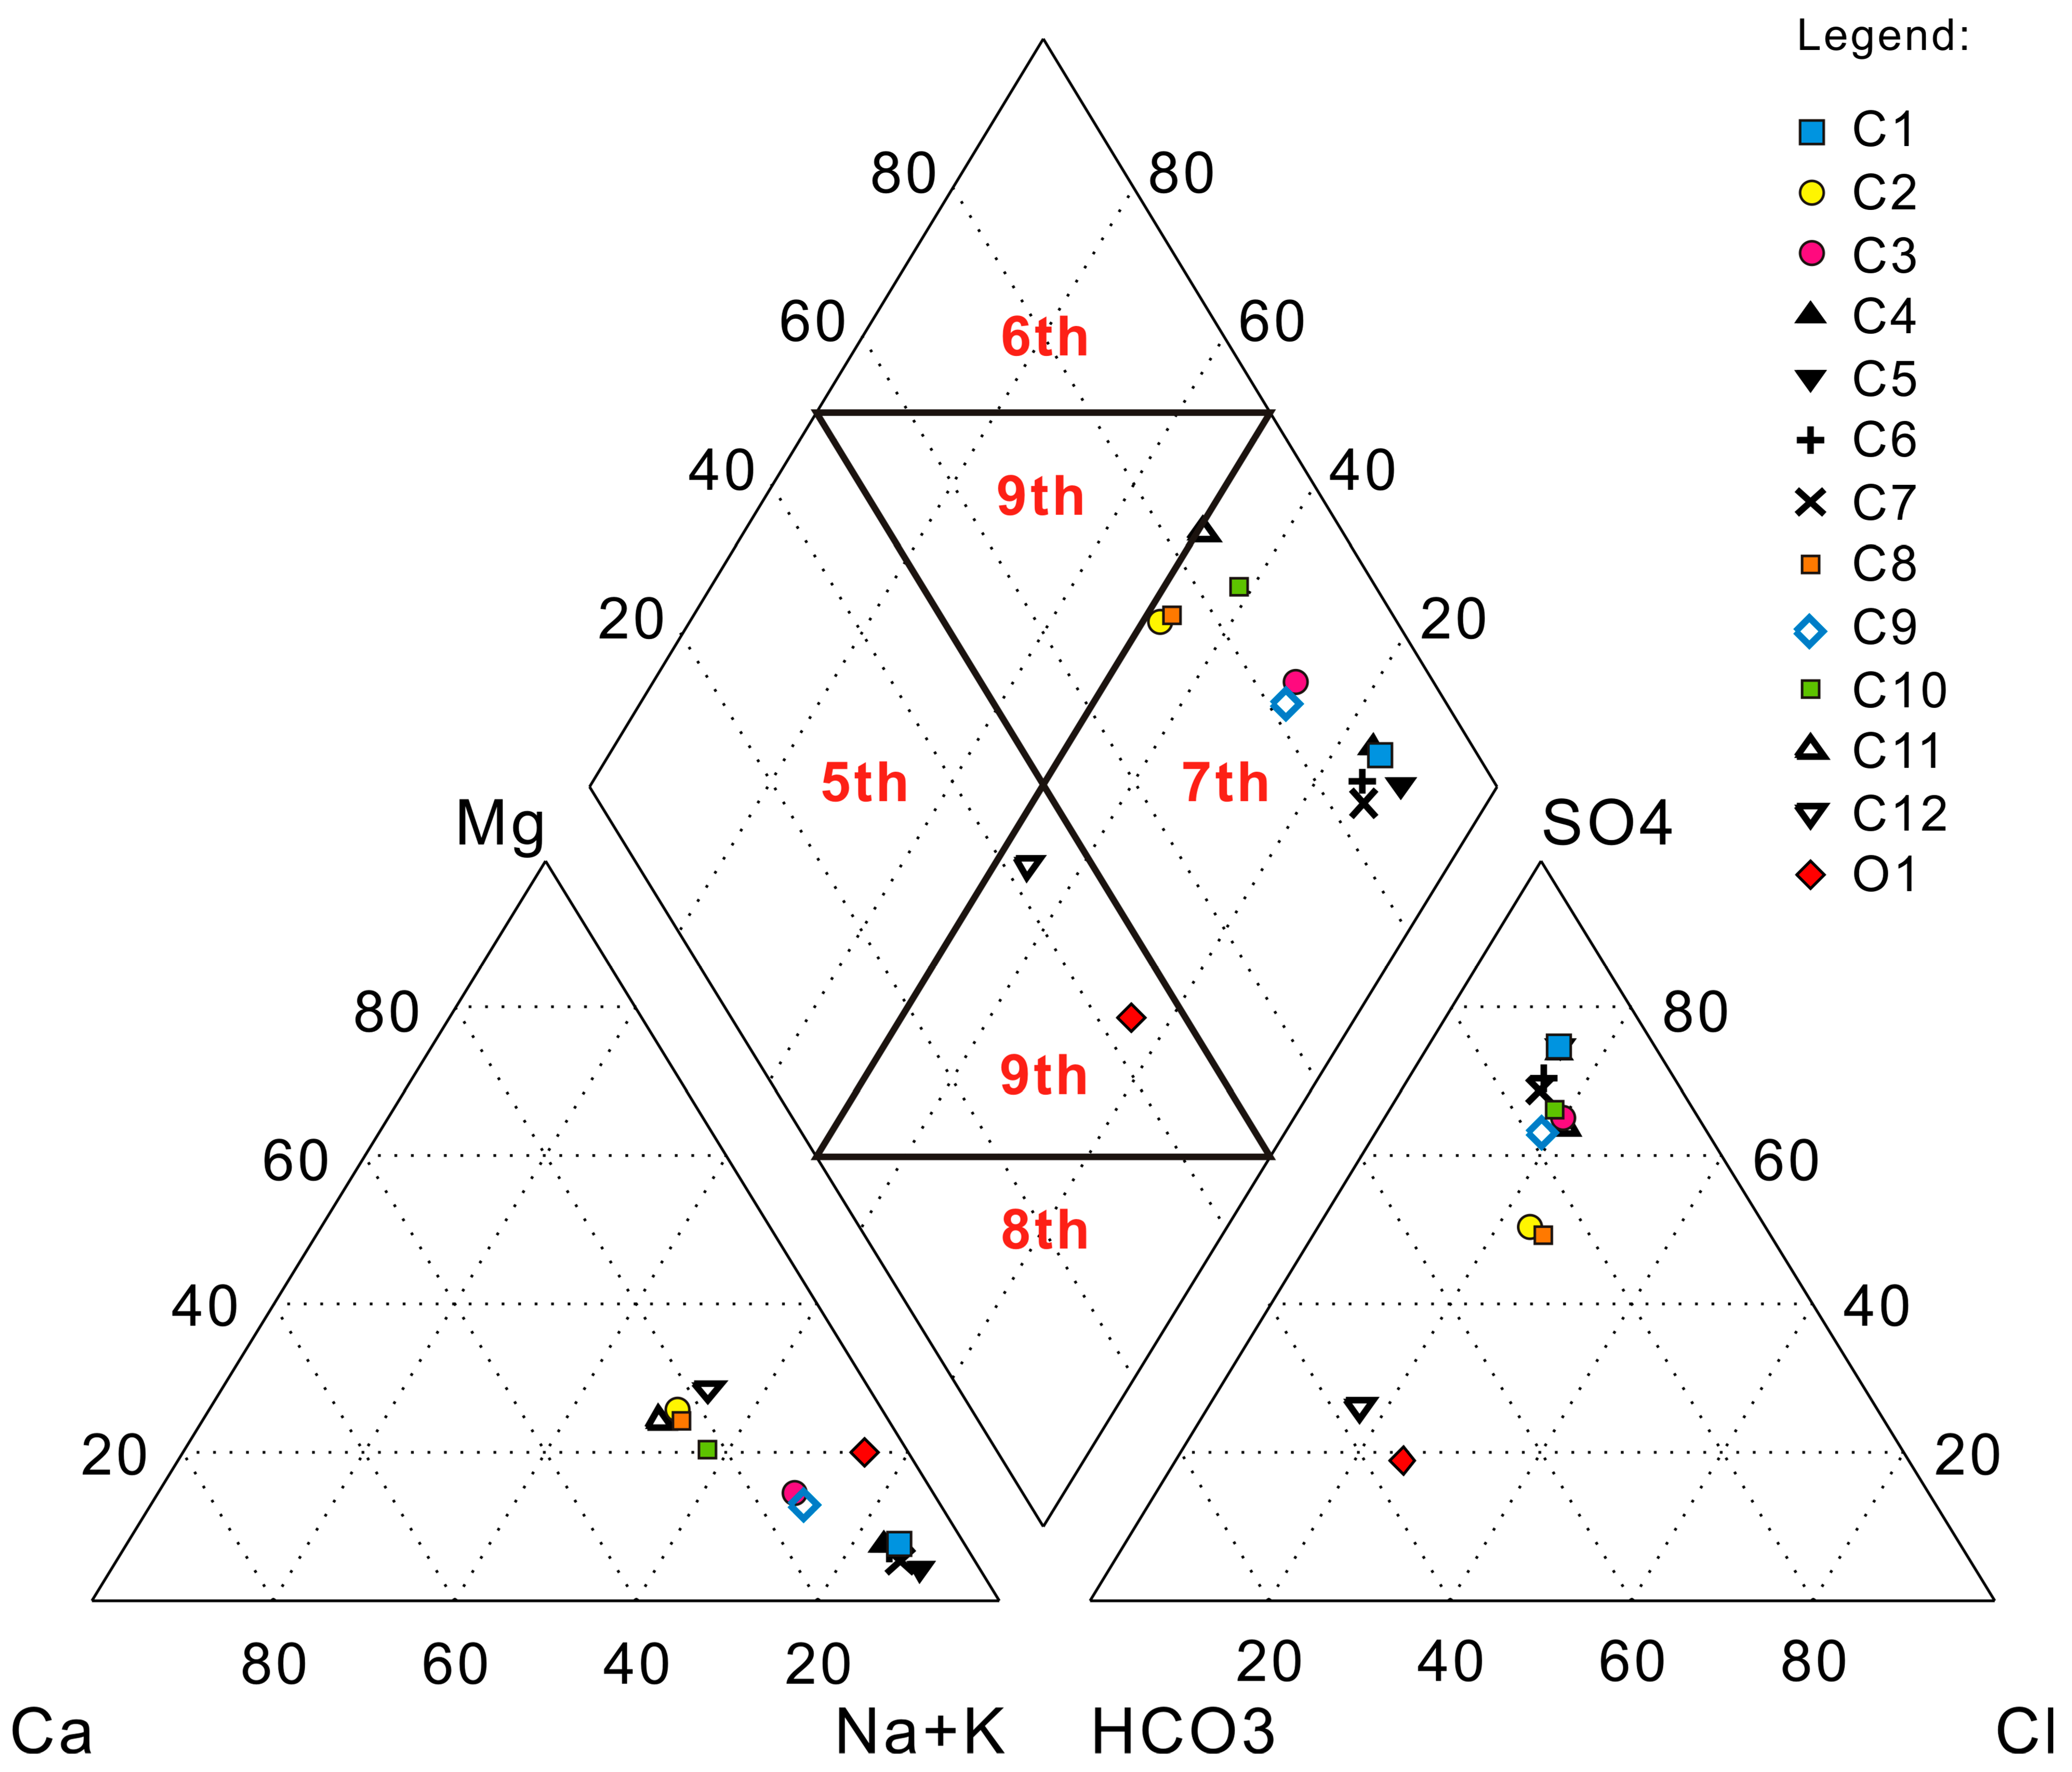
| Sample | Cation (mEq/kg) | Anion (mEq/kg) | Hydrochemical Types | ||||
|---|---|---|---|---|---|---|---|
| K+ + Na+ | Ca2+ | Mg2+ | HCO3− | SO42− | Cl− | ||
| C1 | 44.80 | 4.00 | 3.95 | 5.68 | 39.60 | 7.56 | SO4-K + Na |
| C2 | 12.40 | 5.44 | 6.23 | 6.30 | 12.20 | 5.57 | SO4·HCO3-K + Na·Mg |
| C3 | 21.50 | 4.62 | 4.45 | 4.62 | 19.70 | 5.81 | SO4-K + Na |
| C4 | 37.90 | 4.01 | 3.40 | 4.95 | 33.00 | 6.62 | SO4-K + Na |
| C5 | 43.70 | 3.18 | 2.03 | 5.14 | 36.60 | 7.08 | SO4-K + Na |
| C6 | 35.00 | 3.53 | 2.74 | 5.86 | 28.50 | 6.08 | HCO3·SO4-K + Na |
| C7 | 34.10 | 3.24 | 2.10 | 6.24 | 27.10 | 6.01 | SO4-K + Na |
| C8 | 12.70 | 5.48 | 5.97 | 6.03 | 11.80 | 6.31 | SO4·Cl·HCO3-K + Na·Mg |
| C9 | 24.00 | 5.28 | 4.33 | 5.93 | 21.30 | 6.41 | SO4-K + Na |
| C10 | 18.70 | 6.84 | 6.50 | 4.84 | 21.20 | 6.04 | SO4-K + Na |
| C11 | 14.40 | 7.21 | 6.87 | 4.40 | 18.30 | 5.84 | SO4-K + Na·Ca |
| C12 | 8.82 | 2.94 | 4.70 | 9.39 | 4.29 | 2.76 | HCO3·SO4-K + Na·Mg |
| O1 | 8.41 | 0.53 | 2.22 | 5.16 | 1.73 | 2.32 | HCO3-K + Na |
| Sample | Piper Diagram | PHREEQC Model | ||
|---|---|---|---|---|
| (O) | (C) | (O) | (C) | |
| C1 | 0.000 | 1.000 | 0.000 | 1.000 |
| C2 | 0.750 | 0.250 | 0.361 | 0.639 |
| C3 | 0.582 | 0.418 | 0.313 | 0.687 |
| C4 | 0.065 | 0.935 | 0.156 | 0.844 |
| C5 | 0.331 | 0.669 | 0.069 | 0.931 |
| C6 | 0.266 | 0.734 | 0.262 | 0.738 |
| C7 | 0.433 | 0.567 | 0.276 | 0.724 |
| C8 | 0.741 | 0.259 | 0.217 | 0.783 |
| C9 | 0.586 | 0.414 | 0.198 | 0.802 |
| C10 | 0.702 | 0.298 | 0.269 | 0.731 |
| C11 | 0.731 | 0.269 | 0.308 | 0.692 |
| C12 | 0.900 | 0.100 | 0.905 | 0.095 |
| O1 | 1.000 | 0.000 | 1.000 | 0.000 |
© 2016 by the authors; licensee MDPI, Basel, Switzerland. This article is an open access article distributed under the terms and conditions of the Creative Commons Attribution (CC-BY) license (http://creativecommons.org/licenses/by/4.0/).
Share and Cite
Liu, B.; Malekian, R.; Xu, J. Groundwater Mixing Process Identification in Deep Mines Based on Hydrogeochemical Property Analysis. Appl. Sci. 2017, 7, 42. https://doi.org/10.3390/app7010042
Liu B, Malekian R, Xu J. Groundwater Mixing Process Identification in Deep Mines Based on Hydrogeochemical Property Analysis. Applied Sciences. 2017; 7(1):42. https://doi.org/10.3390/app7010042
Chicago/Turabian StyleLiu, Bo, Reza Malekian, and Jinpeng Xu. 2017. "Groundwater Mixing Process Identification in Deep Mines Based on Hydrogeochemical Property Analysis" Applied Sciences 7, no. 1: 42. https://doi.org/10.3390/app7010042