Article

Optimal Control to Increase Energy Production of Wind Farm Considering Wake Effect and Lifetime Estimation

1
Department of Energy Technology, Aalborg University, Aalborg 9220, Denmark
2
Sino-Danish Centre for Education and Research, Aarhus 8000, Denmark
*
Authors to whom correspondence should be addressed.
Appl. Sci. 2017, 7(1), 65; https://doi.org/10.3390/app7010065
Submission received: 1 November 2016 / Revised: 22 December 2016 / Accepted: 4 January 2017 / Published: 11 January 2017
(This article belongs to the Special Issue Advancing Grid-Connected Renewable Generation Systems)

Abstract

:
In a wind farm, the upstream wind turbine may cause power loss to the downstream wind turbines due to the wake effect. Meanwhile, the energy production is determined by the power generation and the lifetime of the wind turbine. In this paper, an optimal active power control method is proposed to maximize the energy production of wind farms by considering the wake effect and the lifetime of wind turbine. It starts with the analysis of the pitch angle curve and active power curve seen from the Maximum Power Point Tracking (MPPT) of individual wind turbines. Taking the wake effect into account, the pitch angle curve and active power curve are optimized with the aim of Maximum Power Generation (MPG) of the wind farm. Afterwards, considering the lifetime of wind turbines, a comparison is offered between the MPPT method and the MPG method for energy production using a simplified two-turbine wind farm as an example. Due to the small range of the effective wake area, it is found that the energy production is almost the same. Finally, the pitch angle curve and active power curve are optimized according to the Maximum Energy Production (MEP) of a wind farm. Upon considering and contrasting the MPPT method and the MEP method, it can be seen that the energy production of wind farms can be increased even in the case of there not being an effective wake area.

1. Introduction

In recent years, wind power capacity is fast growing and there are increasing trends towards developing large scale offshore wind farms [1]. Due to the expensive installation and maintenance of offshore wind farms, the reliability issue has become more important [2,3]. According to a field survey of wind turbine systems, the electrical parts have the highest failure rate (23%) compared to other parts like the plant control system (18%), sensors (10%), hydraulic system (9%), and yaw system (8%) [4]. It can be inferred that the lifetime of the power converter is the shortest and determines the lifetime of wind turbine systems. Meanwhile, the reliability issue in power electronics has been moved from a solely statistical approach to a more physics based approach, which involves not only considerations of the statistics but also the root causes behind the failures [5,6,7,8,9,10]. Considerable numbers of reliability tests have been already carried out by leading power semiconductor manufacturers. In [11,12], the power cycles to failure, which represent the lifetime expectation of a power device, are provided from a thermal stress point of view, and the most important factors affecting the lifetime are summarized in [13] (e.g., mean junction temperature, junction temperature fluctuation, the ON-state time duration of a periodical current, etc.). In a typical Doubly-Fed Induction Generator (DFIG) based wind turbine system, the back-to-back power converter consists of a Rotor-Side Converter (RSC) and a Grid-Side Converter (GSC). Focusing on the steady-state thermal cycles, the detailed method to estimate the lifetime expectation of both the GSC and the RSC are analyzed and presented in [2]. It can be seen that the lifetime expectancy of the RSC is significantly less than the GSC, which determines the lifetime of the overall DFIG power converter.
In a wind farm, the wind turbine causes energy loss to a column of its downstream air flow, which is also known as the wake effect. The energy loss due to the wake effect in onshore wind farms accounts for about 5%–10% of the entire energy production [14], while the percentage reaches up to approximately 15% in offshore wind farms, because of its higher installation density compared to onshore wind farms [15,16,17]. Many wake models have been developed to estimate the energy loss [18,19]. Based on the wake models, the downstream energy loss depends on the thrust coefficient of upstream wind turbines, which is a function of the pitch angle and the tip speed ratio. According to the aerodynamic model of wind turbines, the produced active power depends on the power coefficient, which is related to the pitch angle and to the tip speed ratio. With the wake model and the aerodynamic model, the optimal pitch angle and the tip speed ratio for each wind turbine are selected to maximize the total active power of the wind farm [17,20]. With this approach, the downstream wind speed is calculated by the wake model with the ambient wind speed, which is also known as the freestream wind speed which is obtained from the mast outside the wind farm with no speed deficit due to the wake effect. In [21,22], the online model free method is proposed, by which each wind turbine receives the control settings estimated based on the information received from its neighboring turbines. This method maximizes the total active power of the wind farm without the estimation of downstream wind speed deficit by a wake model. As mentioned in [17], the model-free approach would require steady state ideal wind conditions during long periods of time in order to be performed in actual wind farms.
The widely implemented active power control method for DFIG wind turbines is the Maximum Power Point Tracking (MPPT) by which each individual wind turbine generates the maximum active power at specific wind speeds. With this method implemented, the wind turbine operates at the pitch angle of 0° and a fixed tip speed ratio to get the maximum power coefficient. The tip speed ratio is controlled by the power converter. When the active power reaches the rated value, the pitch controller is activated to limit the active power to within the rated value. In [23,24], the hybrid pitch controller was designed to improve the power quality and transient stability of the wind turbine. In the case that the wind turbine operates at the rated power, the pitch angle is controlled by the conventional Proportional Integral (PI) controller. In the case that the active power generation is lower than the rated power, the pitch angle is controlled by a Fuzzy Logic Controller (FLC). In this paper, it is assumed that the pitch angle is controlled based on the conventional PI controller for the wind speeds from the cut-in wind speed to the cut-out wind speed.
For older wind turbines with low power capacity, the yaw control is normally used for the active power regulation (e.g., to suppress the excessive output power at high wind speed) [25]. Due to its limited dynamic response, the power capture is insensitive to the yaw angle, and the yaw system imposes an additional mechanical stress on the turbine, so the yaw control is not used for active power control in modern wind turbines with large capacity [26]. In this paper, the DFIG wind turbine with high power capacity keeps the yaw angle at 0° which means that the turbine blade faces the wind perpendicularly. As a result, it can be seen that the active power is only controlled by the pitch angle and tip speed ratio.
The previous articles [17,20,21,22] aim to maximize the total active power of the wind farm, by which the annual energy production of the wind farm can be maximized. However, the energy production of the wind farm over its lifespan is determined by not only the annual energy production of the wind farm, but also the lifetime of each wind turbine. In this paper, with the aim of maximizing the total energy production of the wind farm across its lifespan, the optimized pitch angle curve and active power curve are generated for each wind turbine. Firstly, the active power, lifetime, and downstream wind speed of each wind turbine are calculated at all the possible pitch angle and tip speed ratios of each wind turbine by exhausted method. Then, the maximum energy production of the wind farm across its lifespan is obtained and the optimal pitch angle and tip seed ratio of each wind turbine is obtained. With the optimized pitch angle and tip speed ratio, the look-up table of the pitch angle curve and active power curve implemented in the wind turbine controller are generated.
The remaining part of this paper is organized as follows: the MPPT method, the Katic wake model, and the lifetime estimation of the wind turbine are addressed and described in Section 2. The method to Maximize Power Generation (MPG) of the wind farm is presented in Section 3. The energy production of the wind farm is compared between the MPPT method and the MPG method in Section 4 by considering their corresponding lifespan. Afterwards, the method to Maximize Energy Production (MEP) of the wind farm is proposed and illustrated in Section 5. Finally, concluding remarks are drawn in Section 6.

2. Wake Effect and Lifetime Estimation in DFIG Wind Farm

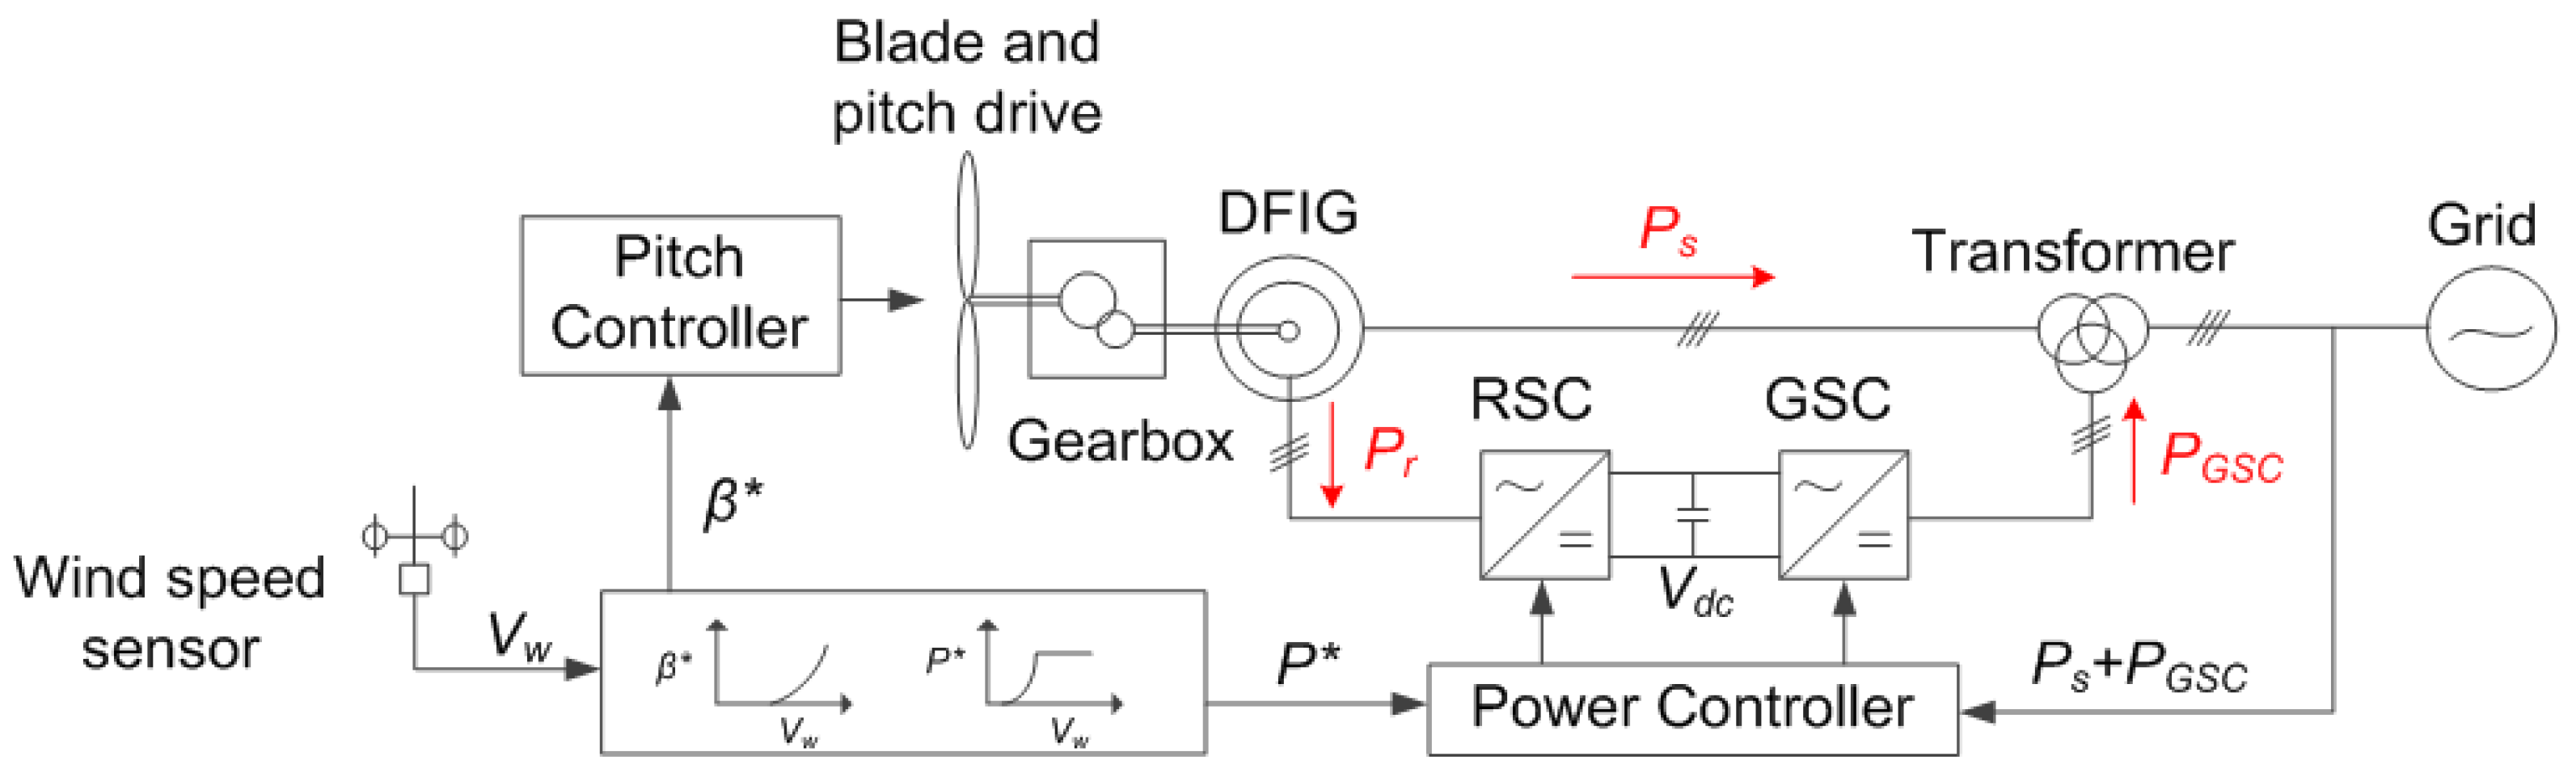
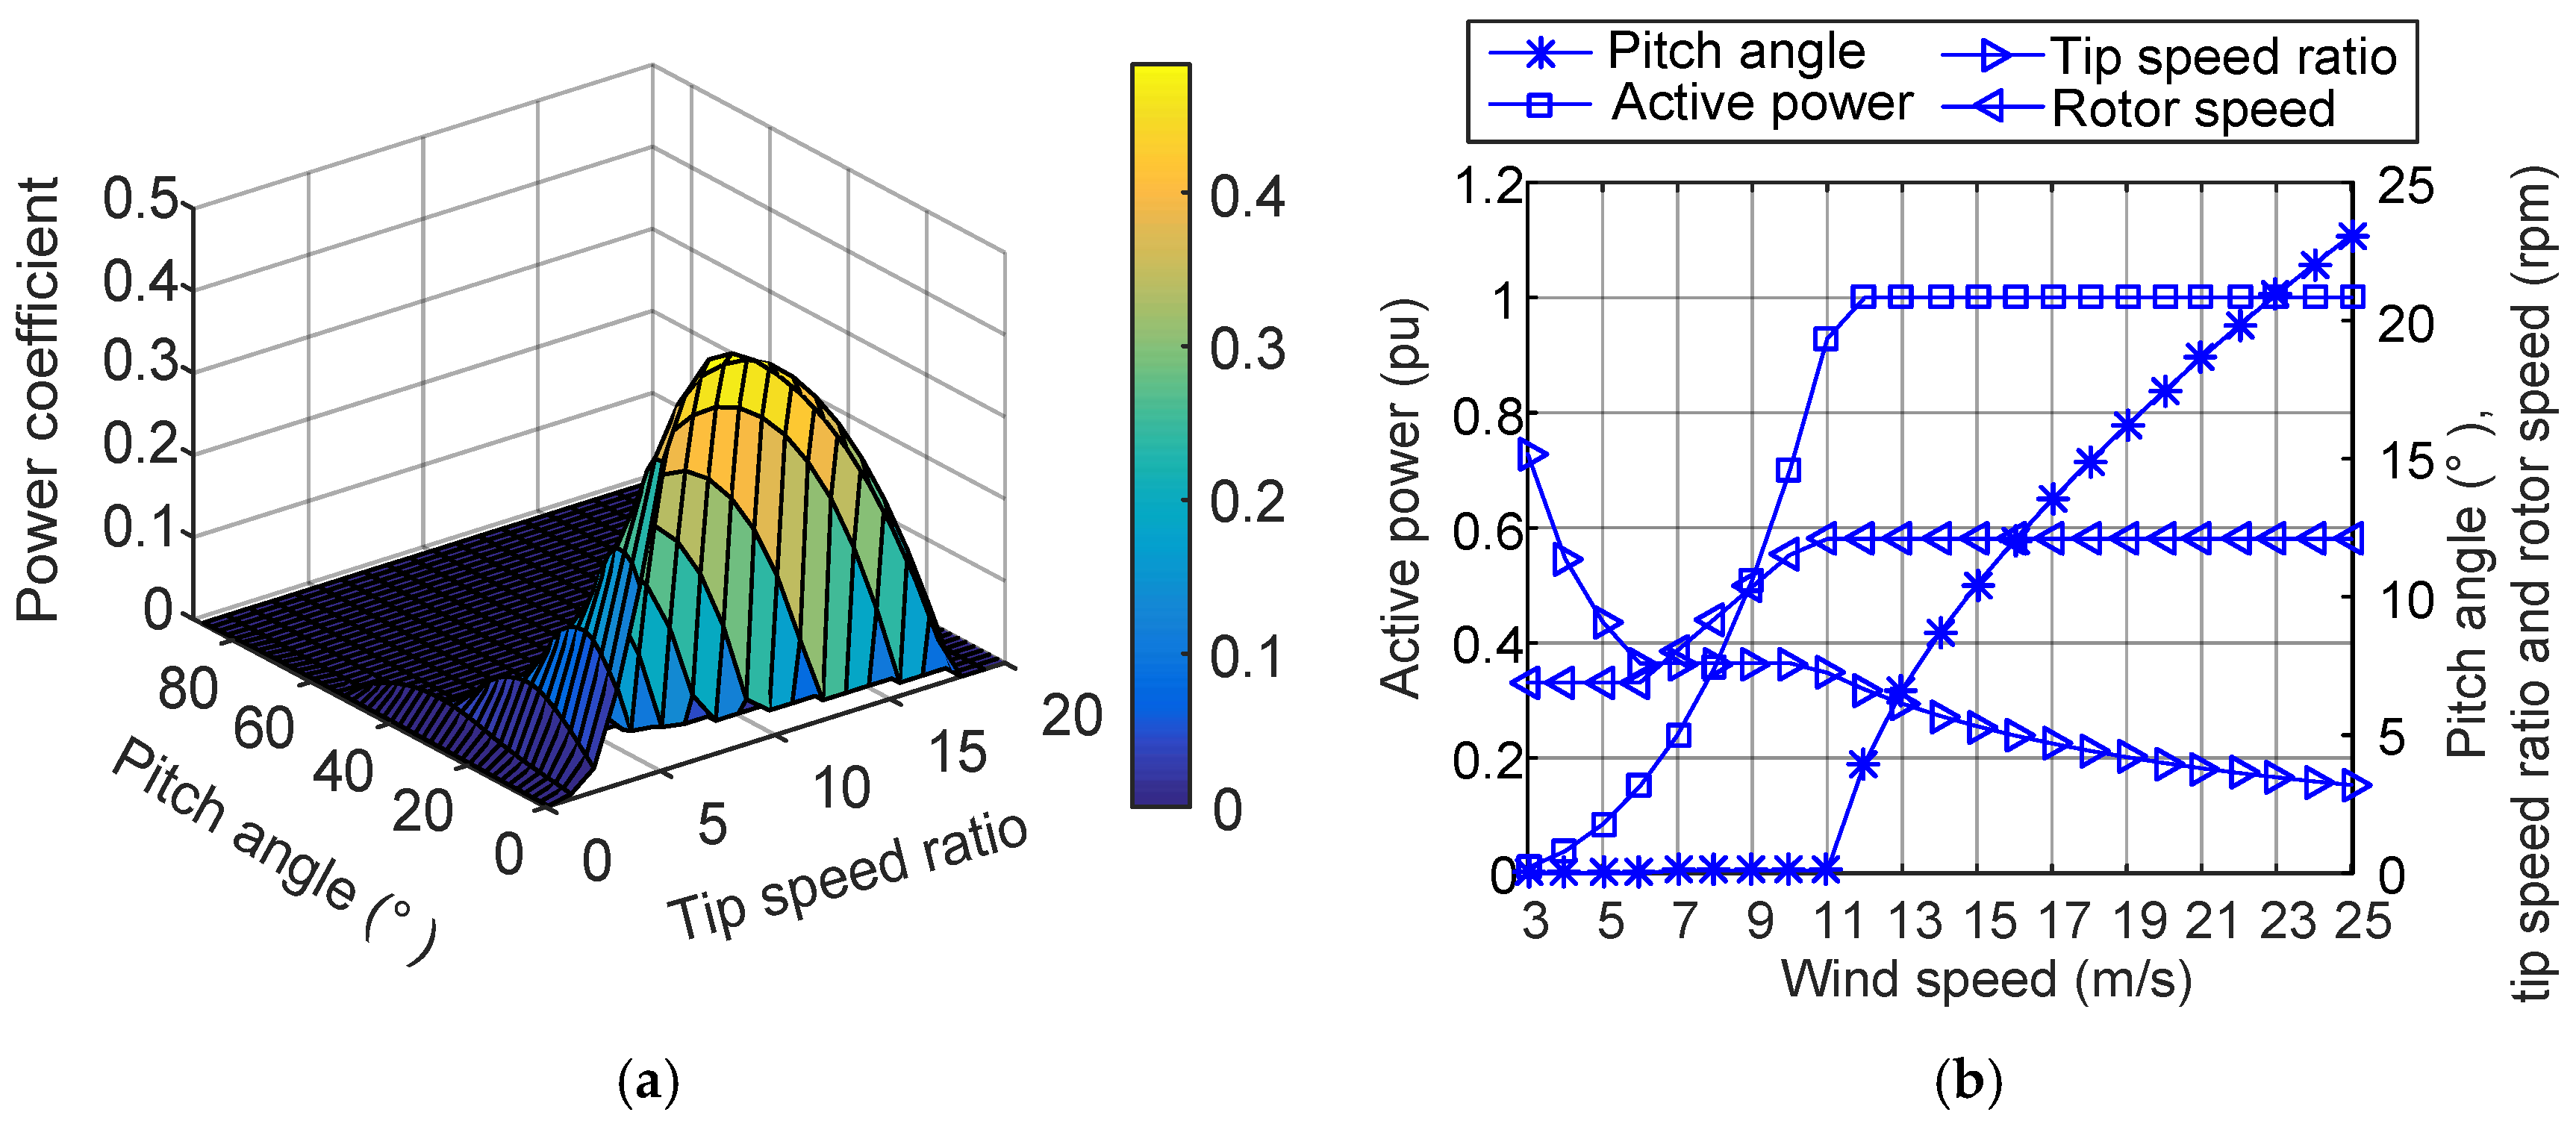
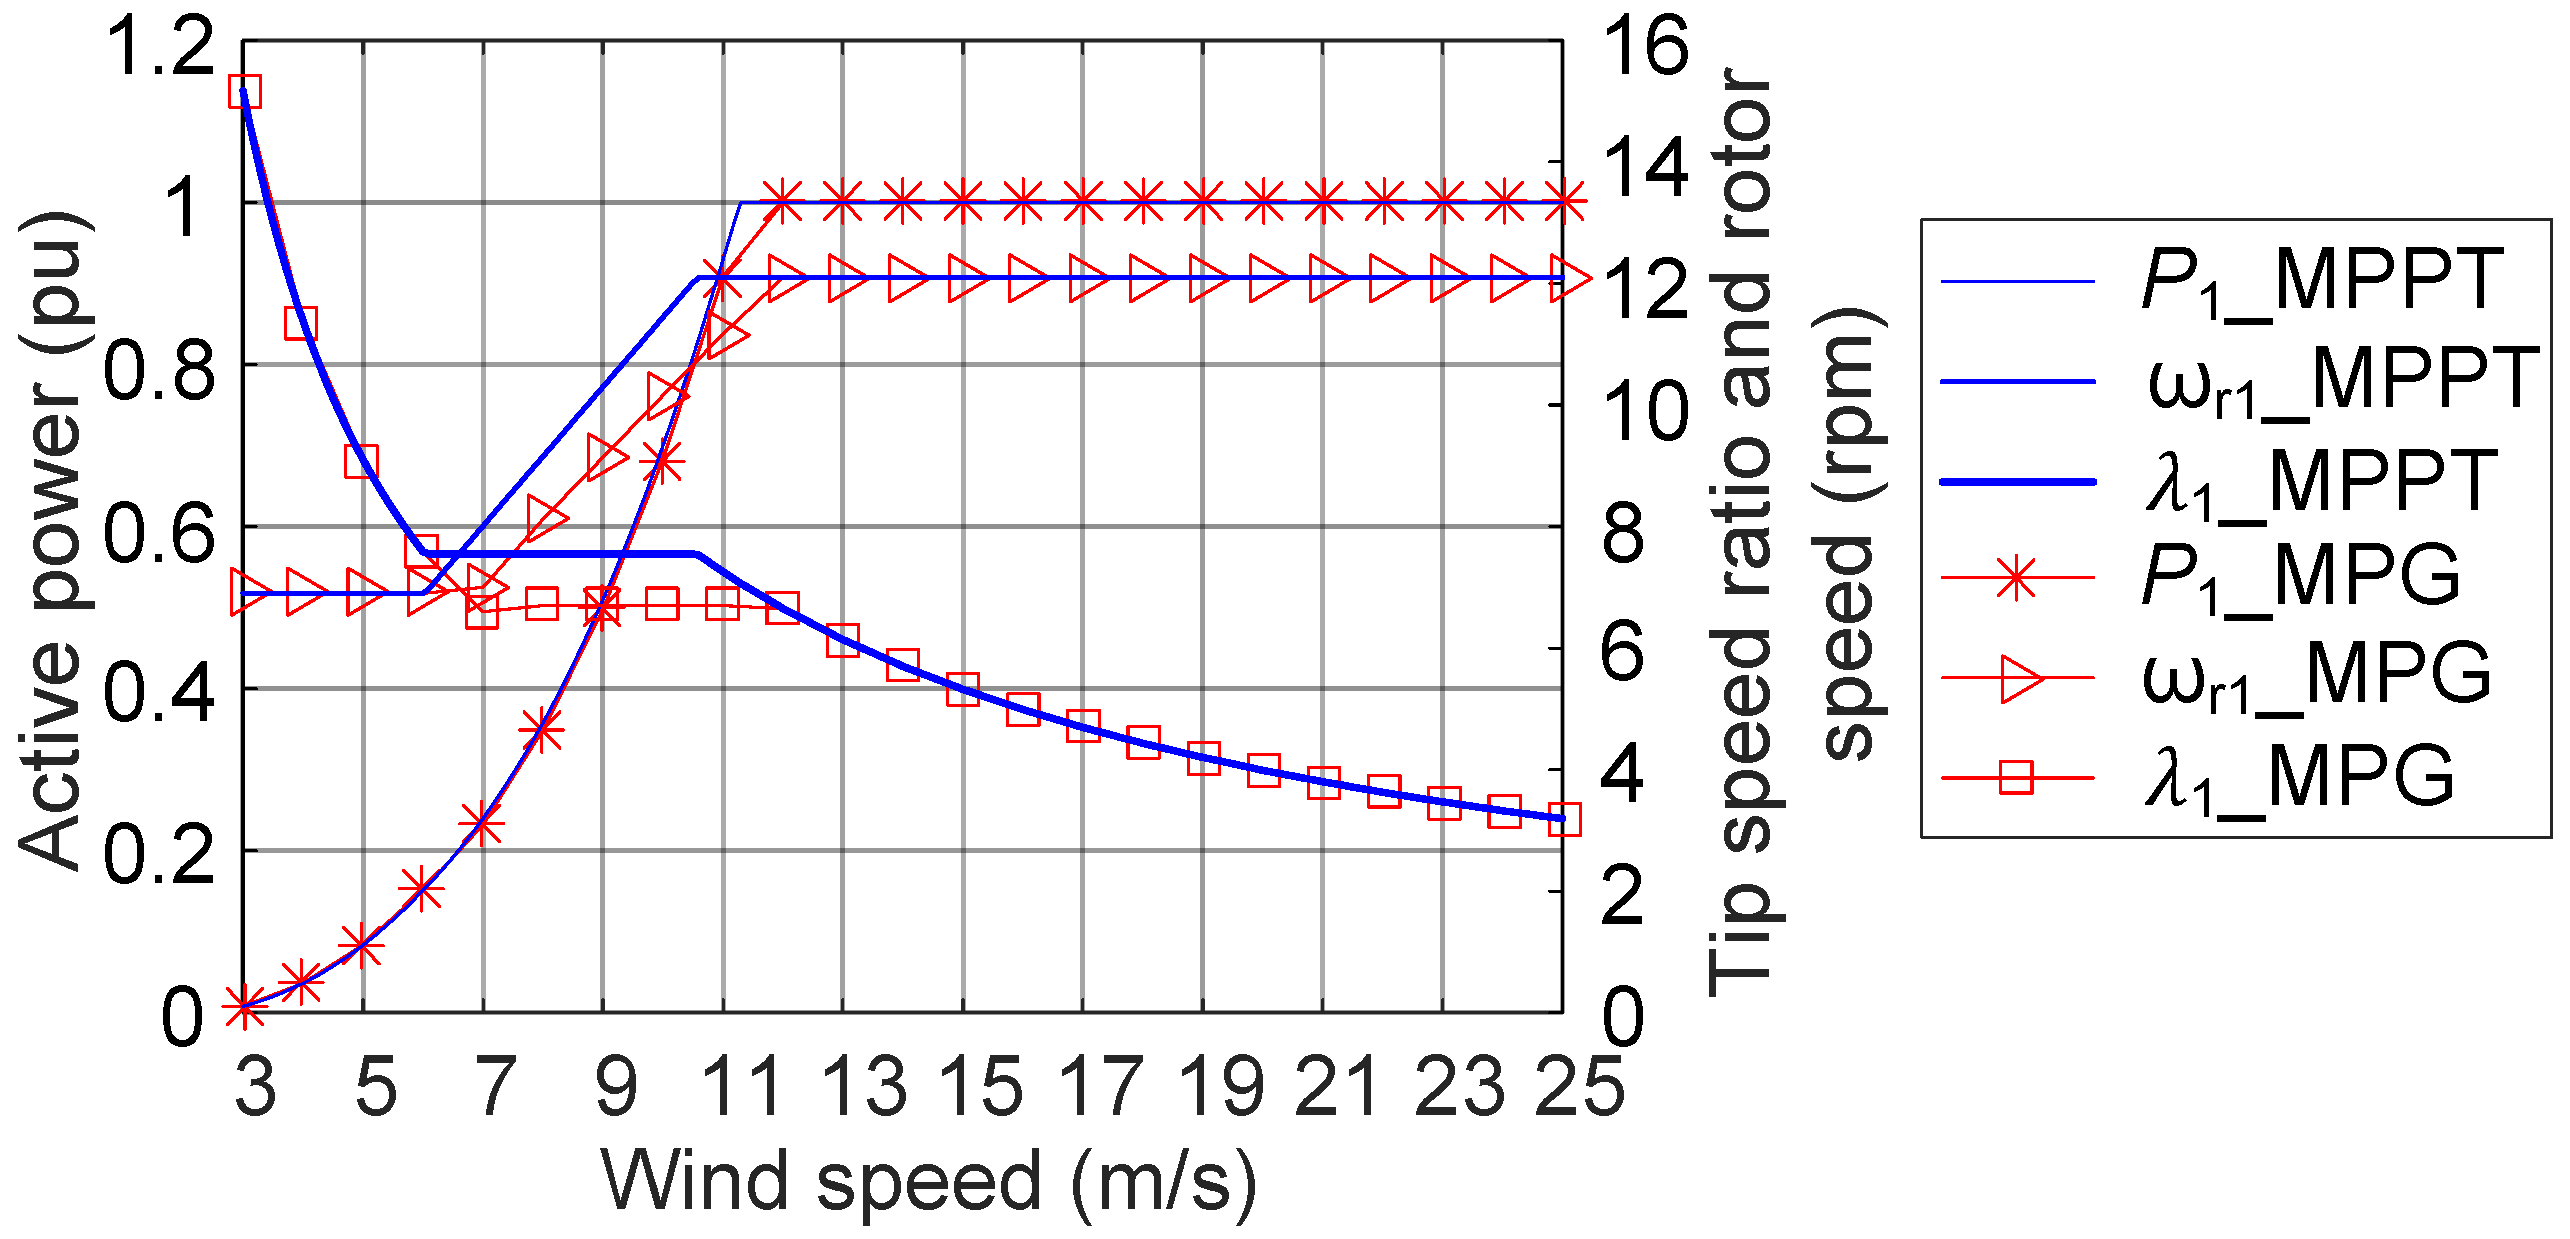
2.1. DFIG Wind Turbine and MPPT Method

As shown in Figure 1, the DFIG wind turbine has two degrees of freedom for active power control which are the pitch angle and the tip speed ratio; the wind turbine delivers the active power from the stator side of the generator, and delivers or absorbs active power from the rotor side of the generator depending on whether the slip is negative or positive. According to the aerodynamic model, the mechanical power Pm extracted by the turbine can be calculated by [27]:
P m = 1 2 ρ π R 2 C p ( β , λ ) v 3
where ρ is the air density, R is the radius of the turbine blade, v is the wind speed, and Cp is the power coefficient, which is related to the pitch angle β and the tip speed ratio λ. The tip speed ratio, defined as the ratio of the blade tip speed over the speed of the incoming wind, is given by:
λ = ω r R v
where ωr is the rotor speed.
In the case of a specific wind speed, the mechanical power is controlled by the pitch angle and the tip speed ratio. By the MPPT method, the wind turbine operates at the maximum mechanical power. According to (1), the maximum mechanical power is obtained at the maximum power coefficient, which is a function of the pitch angle and tip speed ratio. The power coefficient of the NREL 5 MW wind turbine in terms of the pitch angle and tip speed ratio is shown in Figure 2a [28]. It can be observed that the maximum power coefficient is obtained at the pitch angle of 0° and the tip speed ratio of 7.55. Consequently, the MPPT method controls the wind turbine operating at the pitch angle of 0° and tip speed ratio of 7.55 to maximize the mechanical power extraction at a specific wind speed.
The parameters of the NREL 5 MW DFIG wind turbine are shown in Table 1 [28]. As shown in Figure 2b, the active power curve of the NREL 5 MW wind turbine with the implemented MPPT method is presented with the relationship between the active power curve and the wind speed. It is noted that the tip speed ratio is kept at 7.55 except for the case that the rotor speed is limited at 6.9 rpm and 12.1 rpm.

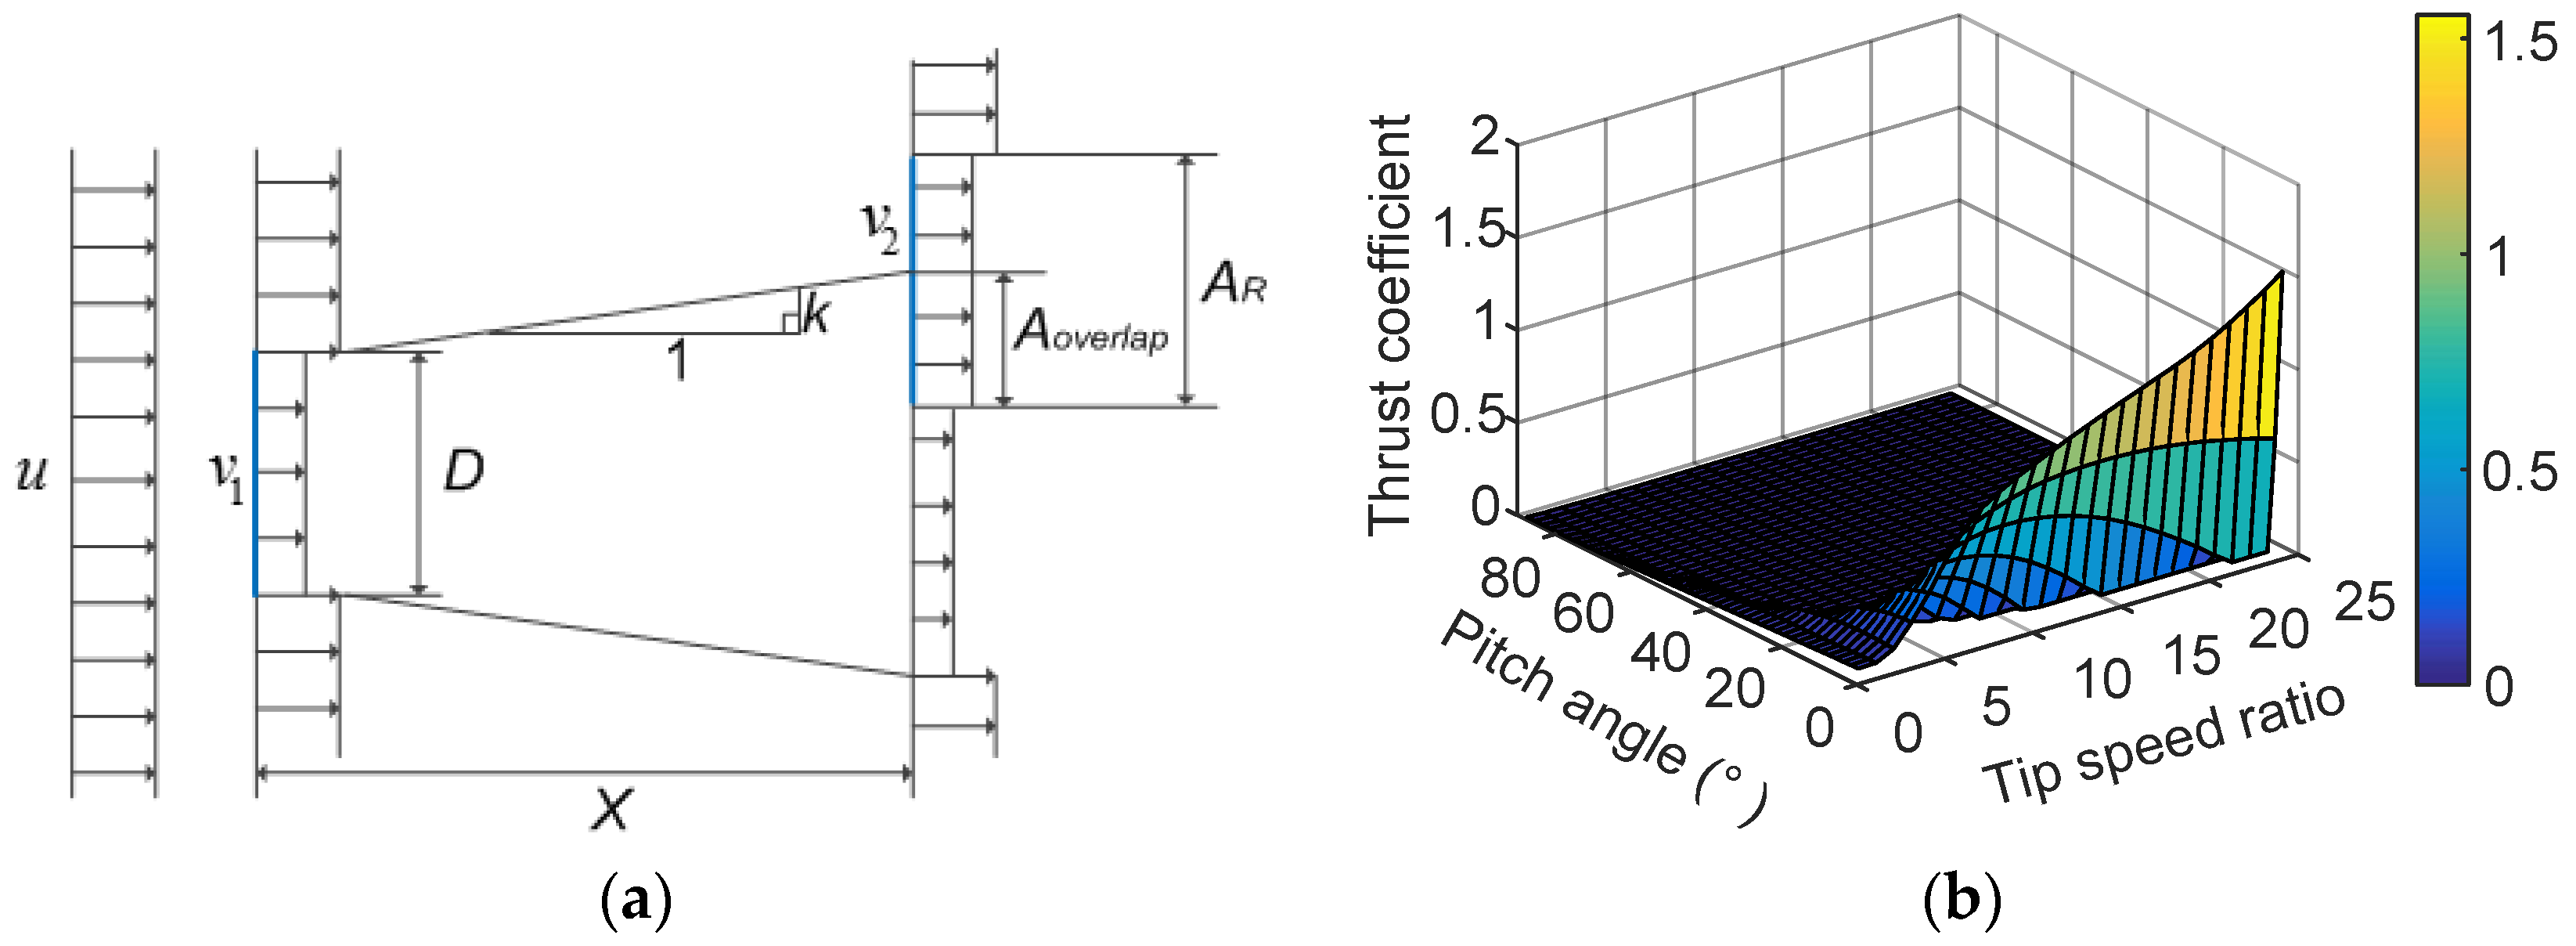
2.2. Katic Wake Model

In wind farms, the wind turbine causes a wind speed deficit to its downstream area due to the wake effect. Many wake models have been developed to estimate the downstream wind speed deficit [17,18]. The Katic wake model [29], which extends the previous work of Jensen [30], is one of the most widely used wake models. In this paper, the Katic wake model is adopted to estimate the wind speed for the downstream wind turbines.
In Figure 3a, the Katic wake model, also known as a ‘top hat’ profile, represents the energy content of a downstream wind turbine with a constant wind speed. The wind speed deficit 1 − v2/u of the downstream wind turbine is given by [29]:
1 v 2 u = ( 1 1 C t ( β , λ ) ) ( D D + 2 k X ) 2 A o v e r l a p A R
where X is the distance between the two wind turbines, u is the ambient wind speed, v2 is the wind speed of the downstream wind turbine, D is the blade diameter, AR is the blade sweep area, Aoverlap is the overlap area between the blade sweep area and the wake area, Ct is the thrust coefficient, which depends on the pitch angle and the tip speed ratio, and the decay constant k is 0.075 for onshore wind farms and 0.04–0.05 for offshore wind farms, as recommended by the Wind Atlas Analysis and Application Program-WAsP help facility [31]. The thrust coefficient for the NREL 5 MW wind turbine in terms of the pitch angle and the tip speed ratio is shown in Figure 3b [28]. It can be observed that the thrust coefficient can be reduced by changing the pitch angle and tip speed ratio compared with the MPPT method, where the wind turbine operates at the pitch angle of 0° and the tip speed ratio of 7.55. According to (3), the reduction of the thrust coefficient of an upstream wind turbine leads to the increase of the wind speed at the position of downstream wind turbine.

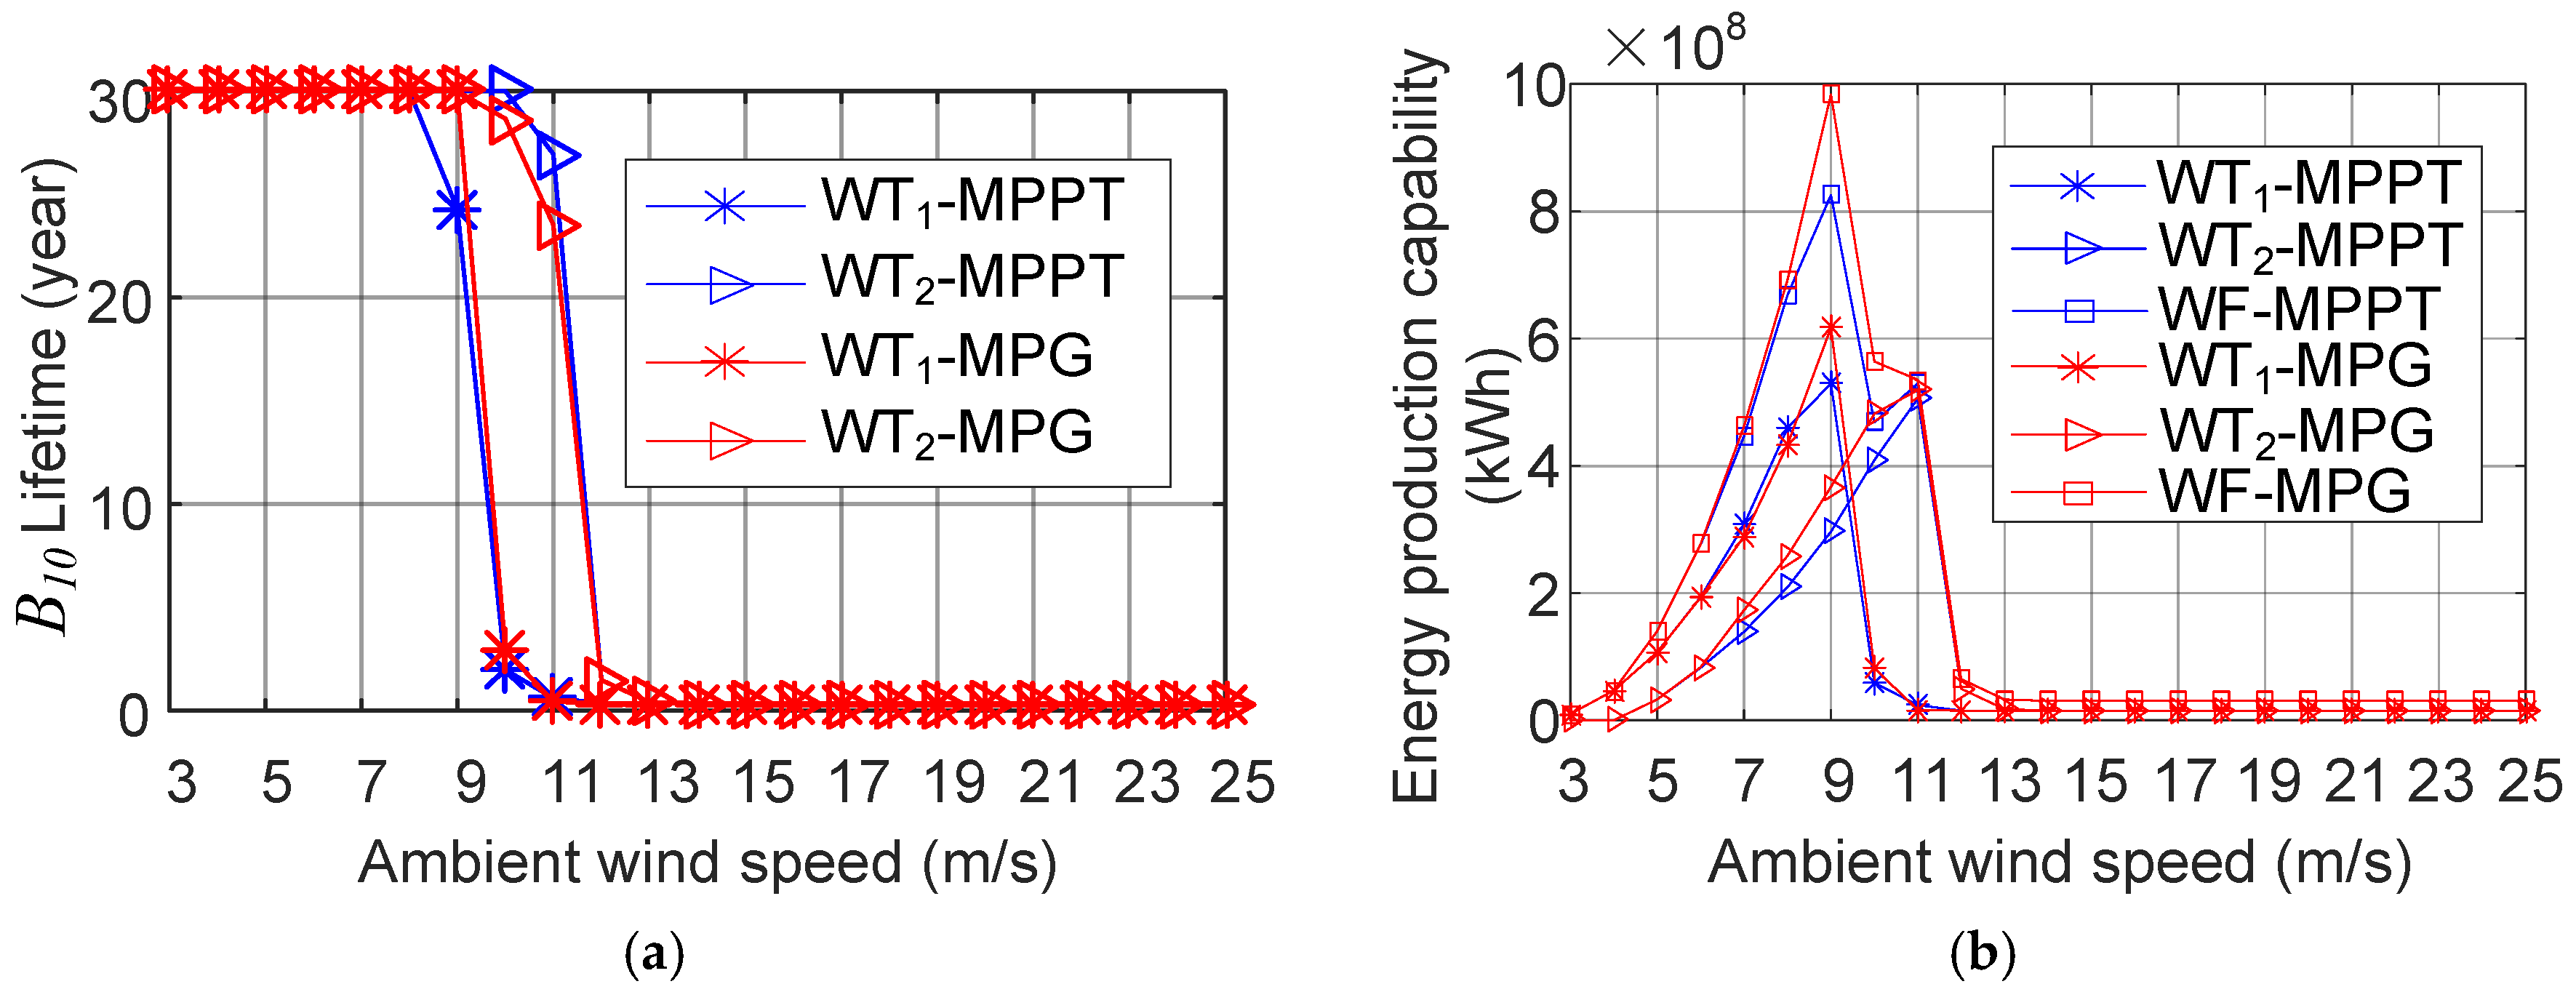
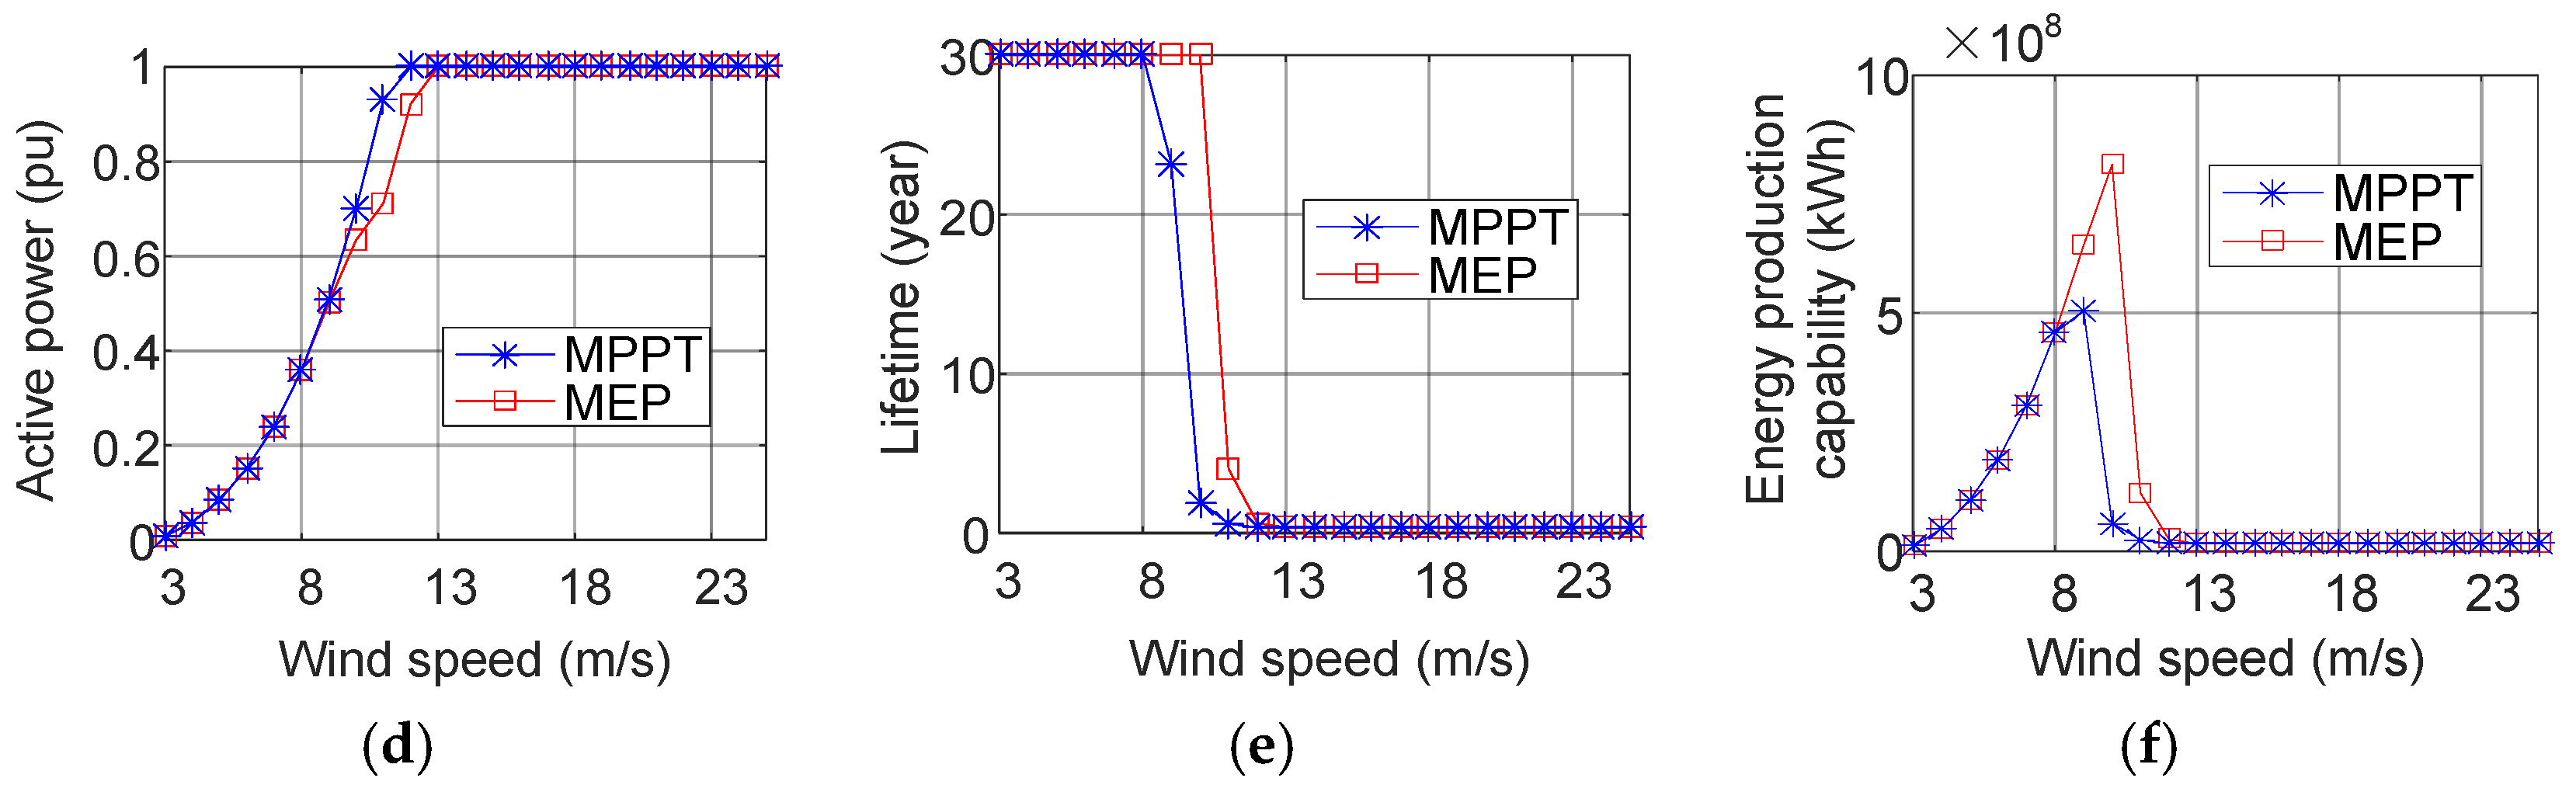
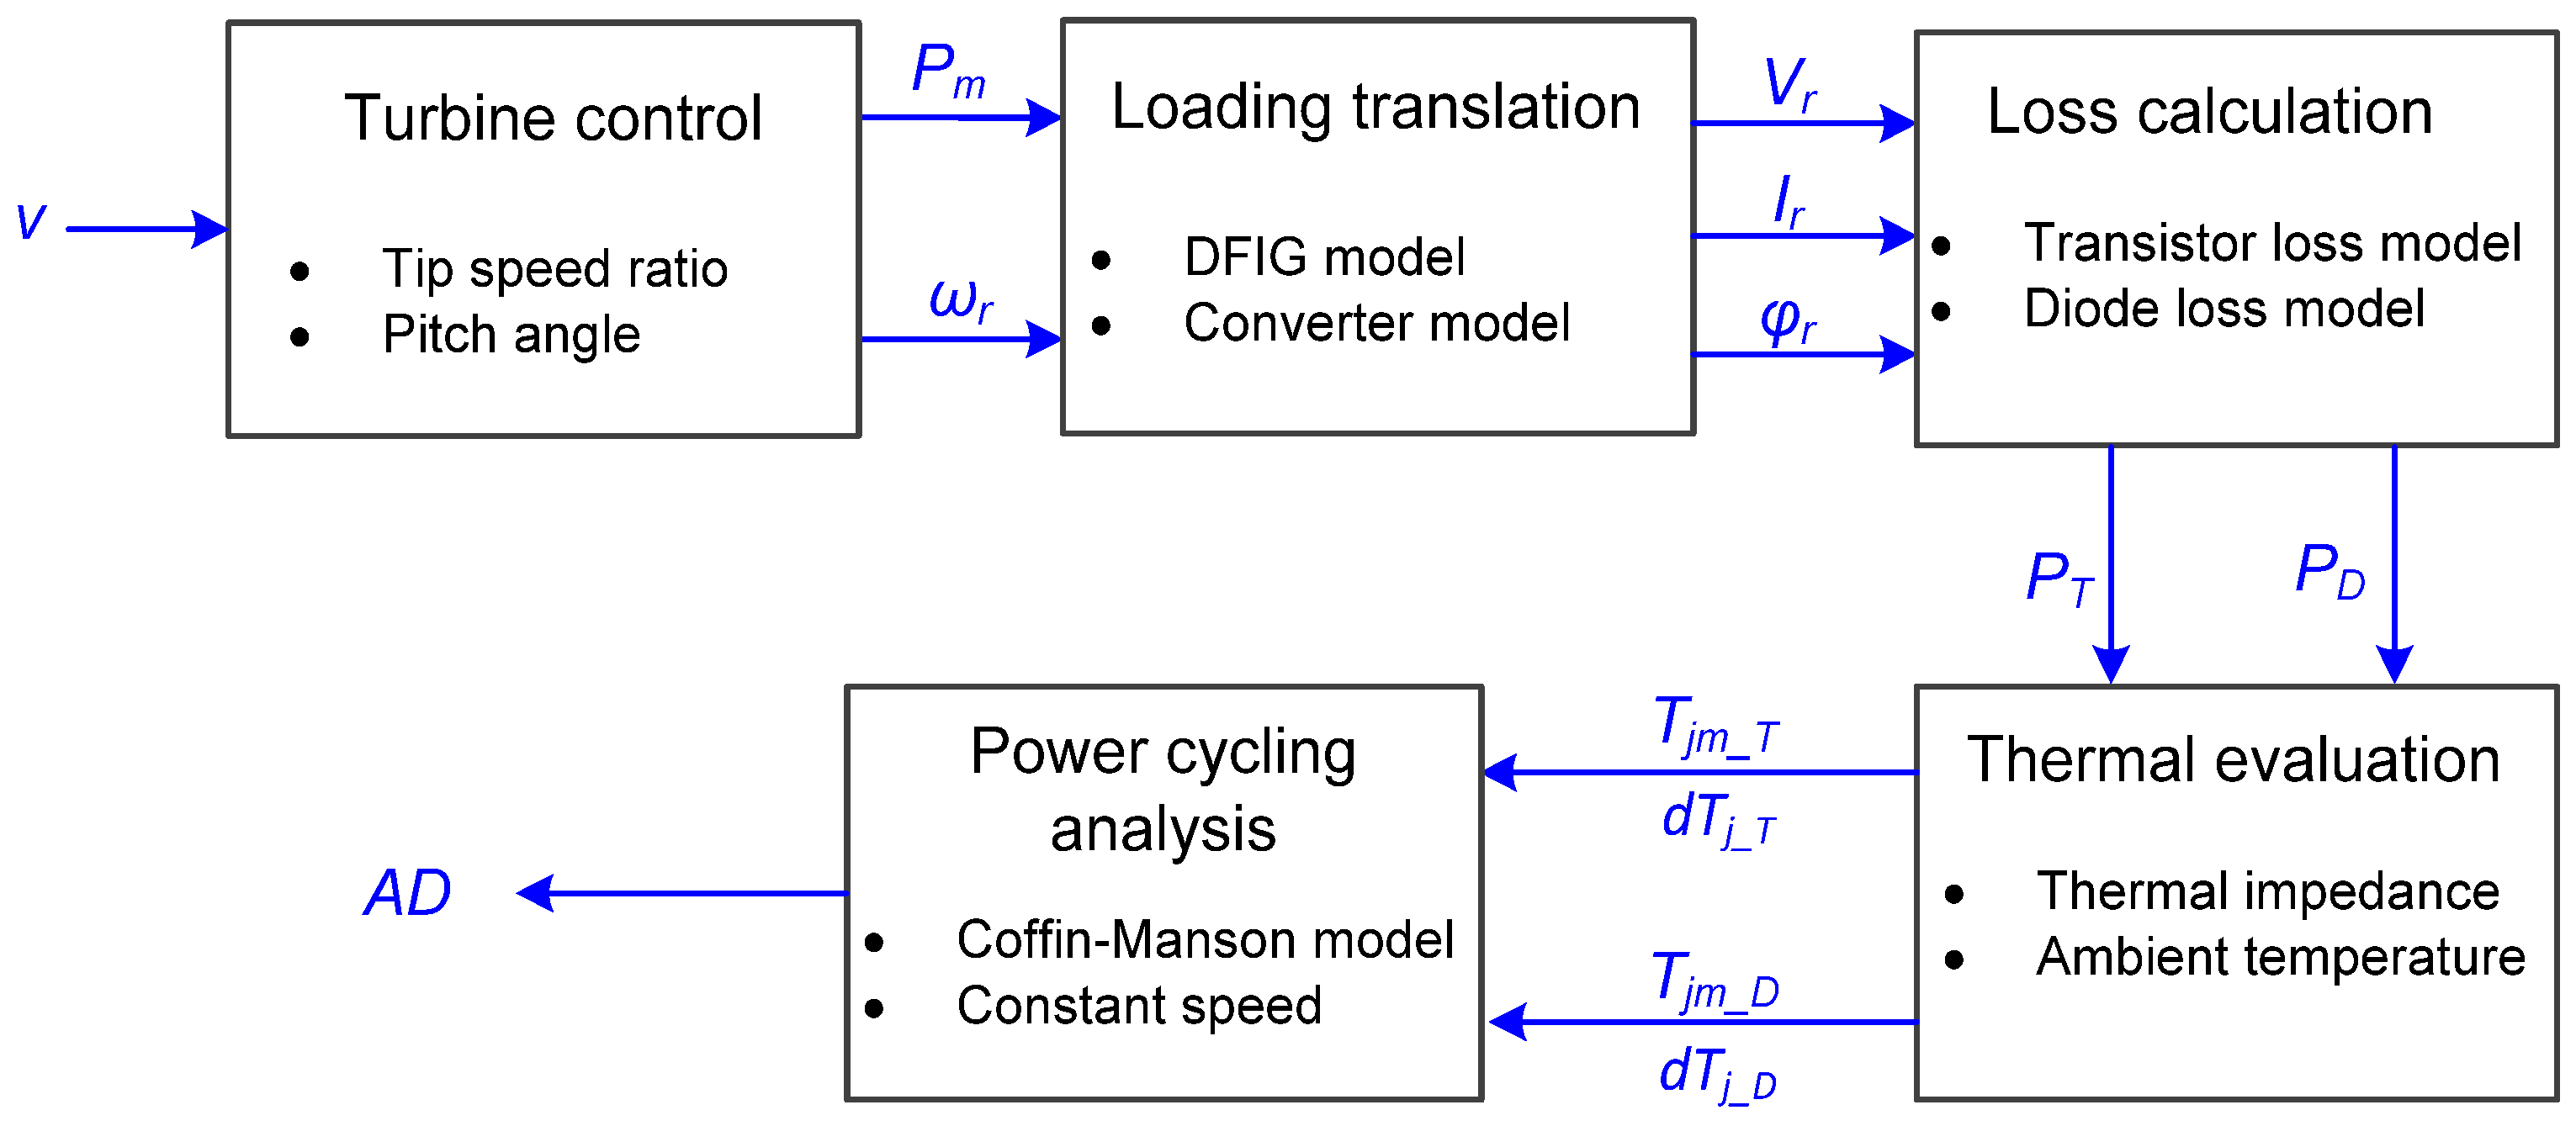
2.3. Lifetime Estimation of the Power Converter

As aforementioned, the lifetime of the power converter determines the lifetime of wind turbine system. A flow chart to estimate the lifetime of the power converter in a DFIG wind turbine system is as shown in Figure 4 [32].
At a constant wind speed v, the wind turbine mechanical power Pm and rotor speed ωr are determined by the pitch angle and tip speed ratio according to (1) and (2). In the case of the RSC the current stress Ir and voltage stress Vr of the power converter can be calculated by the DFIG model and power converter model with information regarding the generator speed and the active power [32,33]. Then, the power loss dissipation of each IGBT PT and diode PD, both of which consist of the conduction losses and the switching losses, can be calculated with the loss model of the power electronics components [34]. Afterwards, the thermal profile of the power semiconductors can be calculated in terms of the mean junction temperature Tjm and the junction temperature fluctuation dTj, by the thermal model of the power module [34]. They are closely related to the thermal resistance and thermal capacitance of the power module as well as its applied cooling solution. Afterwards, the B10 lifetime data, which is the number of cycles during which 10% of the total number of modules fails [11], can be obtained from the manufacturer at constant thermal stress, and it can be further extended to the mean junction temperature and the junction temperature fluctuation at certain levels by using the Coffin-Manson model [34,35]. Finally, the annual damage AD, which is defined as the annual cycles over the cycle-to-failure, can be calculated. If the mission profile is annually repeated, the B10 lifetime expectancy of the power converter-reciprocal of the annual damage can be estimated. Above all, it is evident that the lifetime of the power converter is determined by the pitch angle and tip speed ratio.
The constant wind speed and active power across the entire year are assumed, and no downtime exists during the operational year. In the case of a real wind profile, the wind speed distribution can be considered by using Miner’s rule [36], where the various thermal stresses have the same effect on the wear-out degradation. As a result, the actual annual damage can be calculated considering the weighting factor of the individual wind speed. Meanwhile, due to the wake effect, the wind direction in the wind farm affects the wind speed and active power distribution for each wind turbine. With the wake model and the implemented active power control method, the wind direction distribution factor can also be taken into account.

3. Comparison of Power Generation of Wind Farm between MPPT and MPG

According to (1) and (3), both the active power and the downstream wind speed of the wind turbine depend on its pitch angle and the tip speed ratio. Compared with the MPPT method, the change of pitch angle and tip speed ratio reduces the active power of this turbine. However, the downstream wind speed can be increased, which results in the increase of available active power of the downstream wind turbines. Consequently, the total active power of the wind farm may be increased by the selection of the optimal pitch angle and tip speed ratio for each wind turbine in the wind farm.
In this section, the optimized pitch angle and tip speed ratio of the upstream wind turbine are selected to maximize the total active power generation of the wind farm. Then, with the calculated pitch angle and tip speed ratio, the pitch angle curve and active power curve have been optimized and implemented in the wind turbine controller. The approach is illustrated by a case study, which is carried out in the wind farm with two turbines as shown in Figure 5. The distance between the two wind turbines is 6.5 blade diameters. The NREL 5 MW DFIG wind turbines are applied.

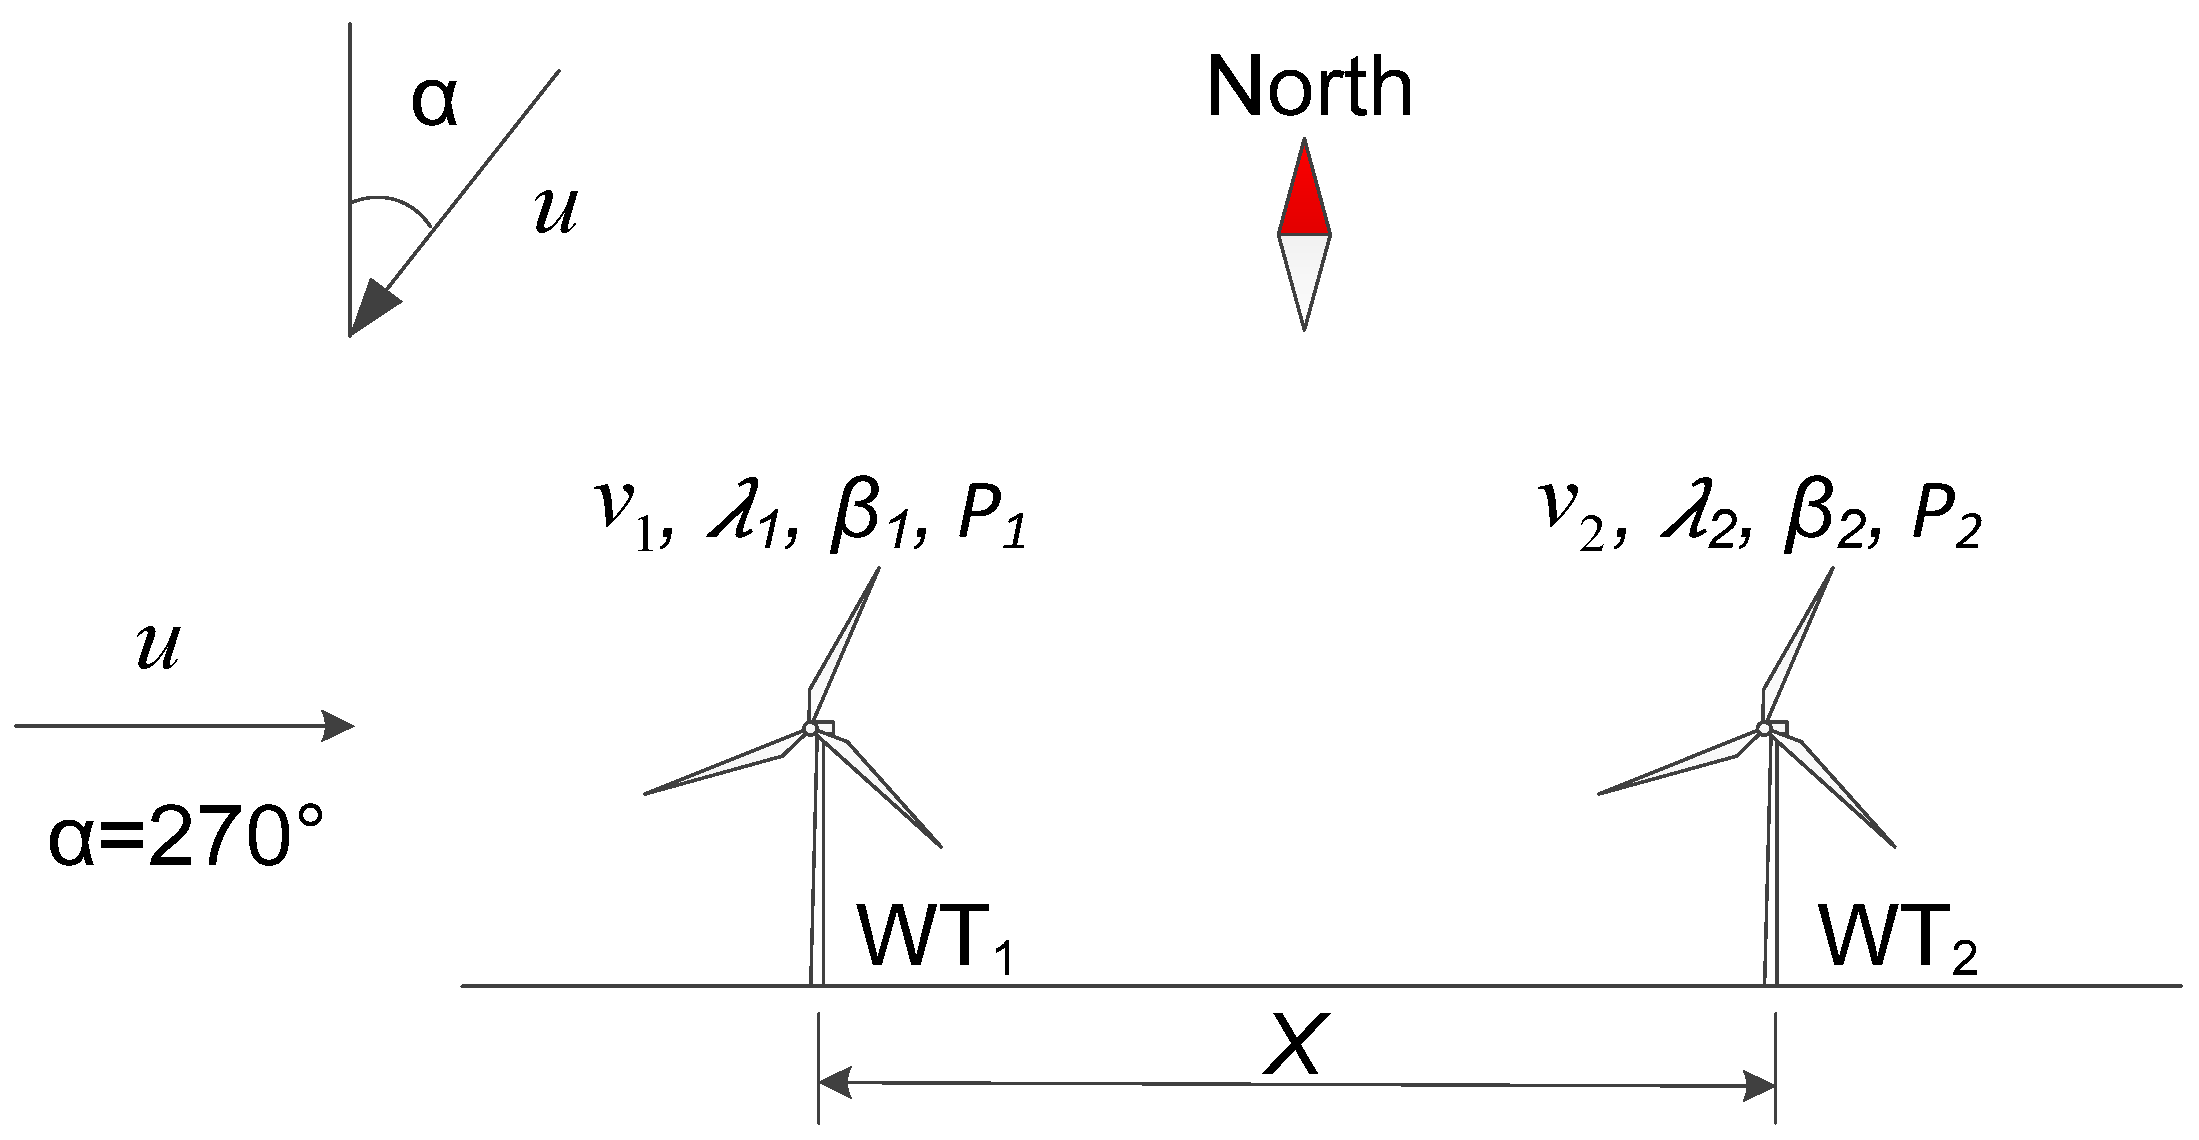
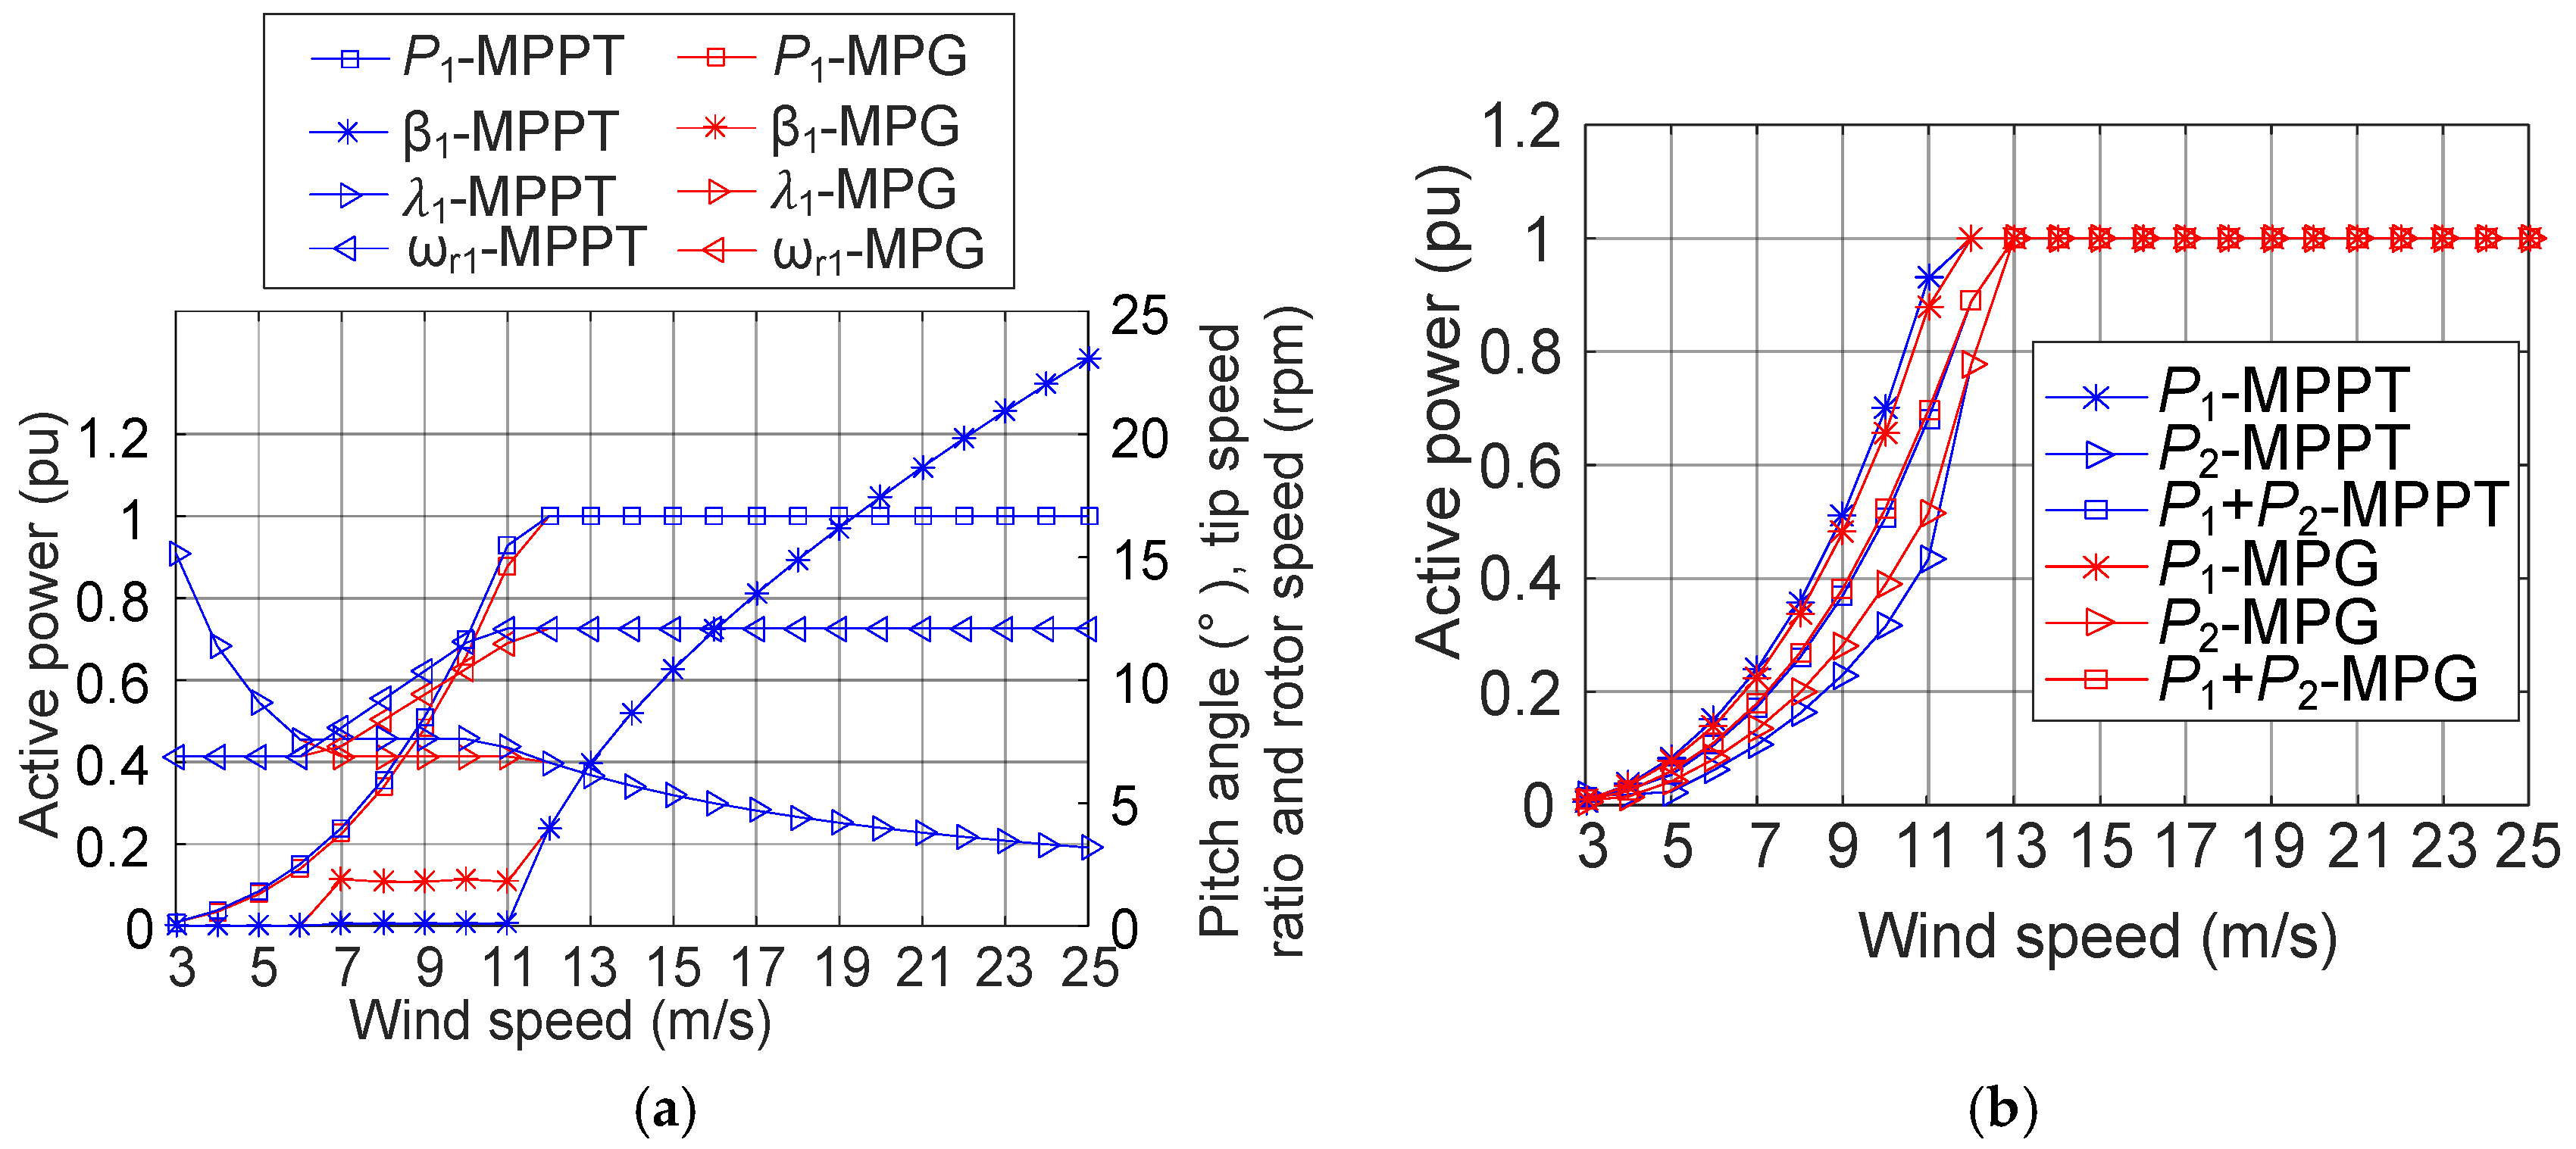
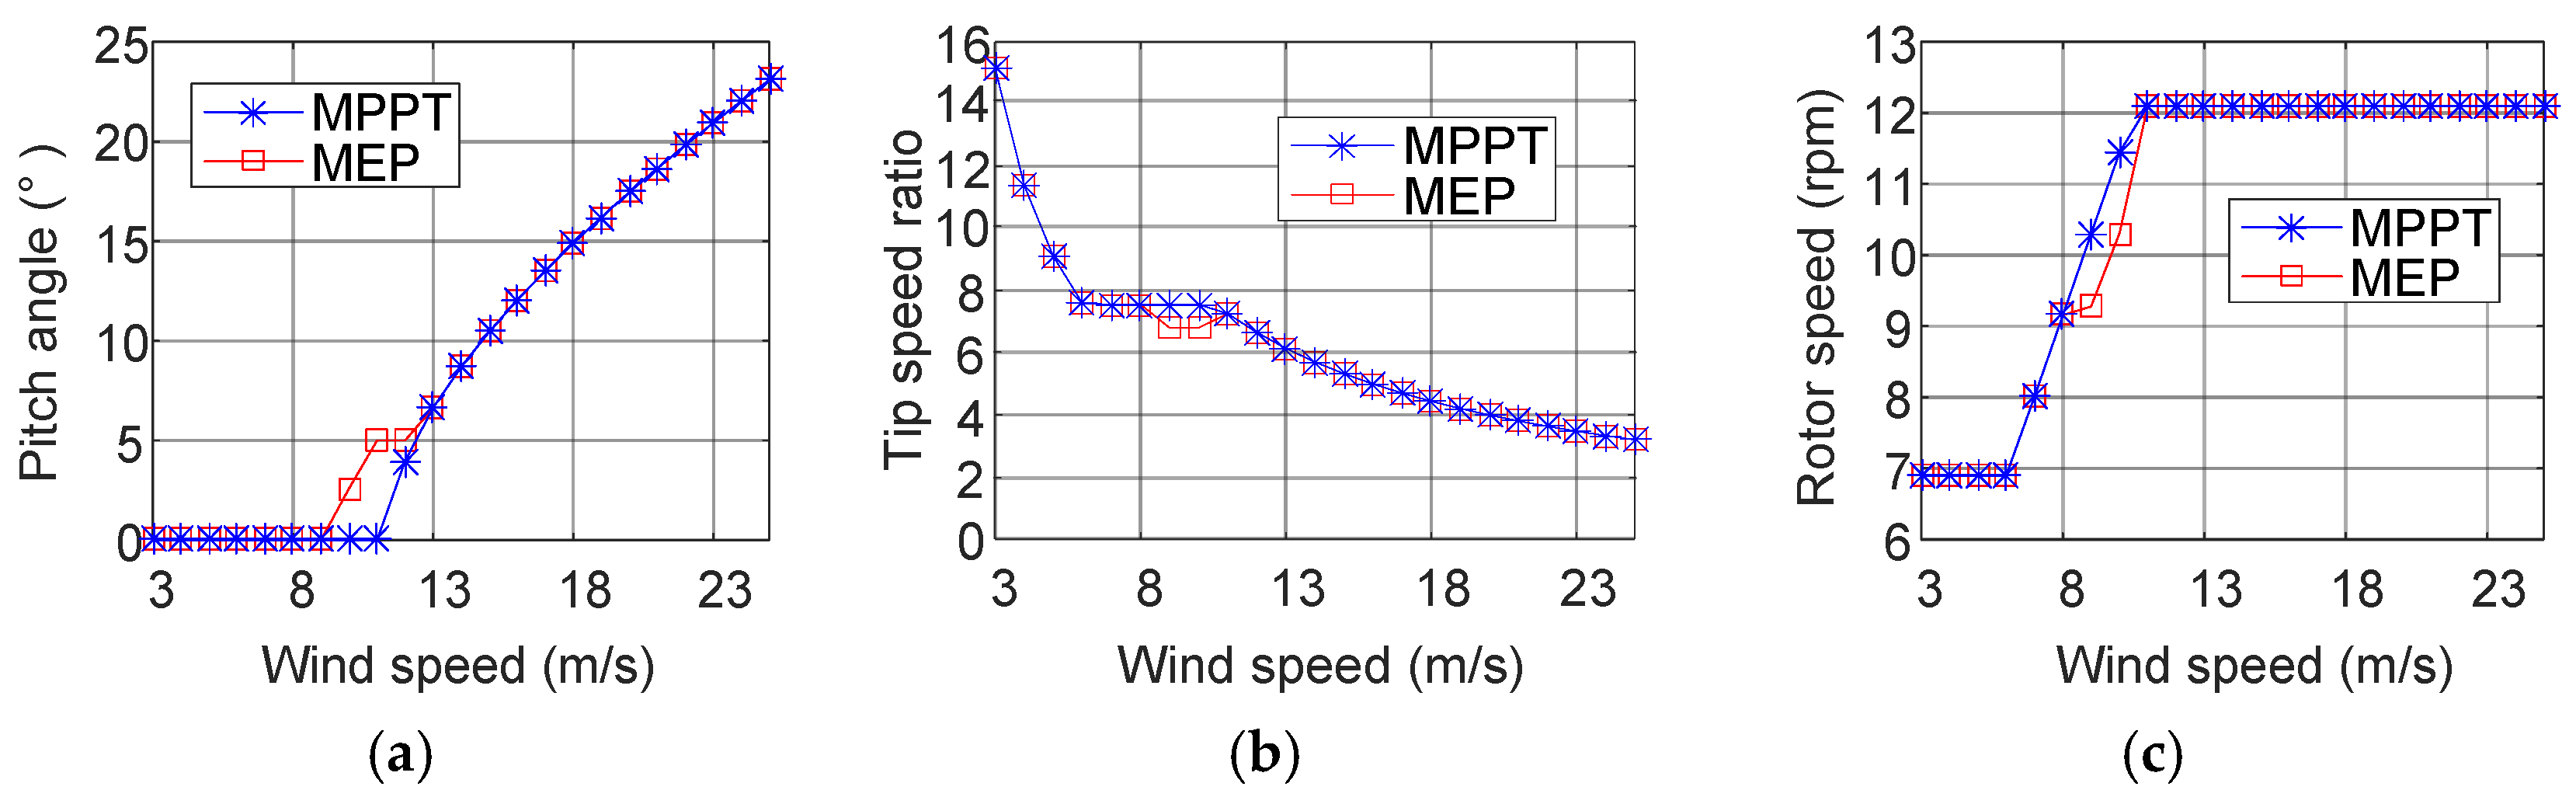
3.1. Optimal Tip Speed Ratio Selection at 270° Wind Direction

As shown in Figure 2, in the case of the wind direction α at 270°, no energy loss is induced by the WT2, as there is no wind turbine along with this wind direction. Therefore, to maximize the total active power of the wind farm, the pitch angle and tip speed ratio for WT1 can be optimized, while WT2 is controlled according to the MPPT method. It starts with the optimization of the tip speed ratio of WT1, where the pitch angle of WT1 is assumed to be the same with the MPPT method.
At the ambient wind speed of 9 m/s, the active power of WT1, the wind speed of WT2, the active power of WT2, and the total active power of the wind farm are shown in Figure 6 at the various tip speed ratio of WT1. The active power of WT1 and WT2 are calculated by (1), where the wind speed of WT1 is equal to the ambient wind speed, and the wind speed of WT2 is calculated by (3). In Figure 6d, it can be observed that the maximum total active power of the wind farm is obtained with the tip speed ratio of 6.5. Thus, the optimal tip speed ratio of WT1 can be selected at 6.5.
Compared with the MPPT method, where the wind turbine operates at the tip speed ratio of 7.55, in the case that the wind turbine operates at the tip speed ratio of 6.5, the active power of WT1 is reduced (as shown in Figure 6a) due to the reduction of the power coefficient of WT1; however, the wind speed of WT2 is increased (as shown in Figure 6b) due to the reduction of the thrust coefficient of WT1, and as a consequence the active power of WT2 is increased (as shown in Figure 6c). In total, the active power of the wind farm is increased from 0.37 pu to 0.38 pu.
Similarly, the optimal tip speed ratio for WT1 can be selected from the cut-in wind speed to the cut-out wind speed by the exhausted search method. This method first calculates the total active power of the wind farm at each possible tip speed ratio of WT1. Then, the maximum total active power of the wind farm can be selected and the corresponding optimal tip speed of WT1 can be obtained. The optimized tip speed ratio, the turbine speed, and active power of WT1 are shown in Figure 7 in the cases that the MPG and the MPPT are adopted, respectively. It can be seen that the tip speed ratio of the MPG is relatively smaller than the MPPT in the range that the wind speed is below the rated value.
One of the active power control schemes for the DFIG wind turbine is shown in Figure 1. The pitch angle is regulated by the pitch controller, and the tip speed ratio is controlled by the power controller by changing the active power reference. In Figure 1, the pitch angle reference and the active power reference are obtained from the pitch angle curve and the active power curve according to the wind speed. With the optimized pitch angle and tip speed ratio, the pitch angle curve and active power curve in terms of the wind speed are optimized, as shown in Figure 7. And the optimized pitch angle curve and active power curve can be implemented as look-up table by the pitch angle controller and the power controller.

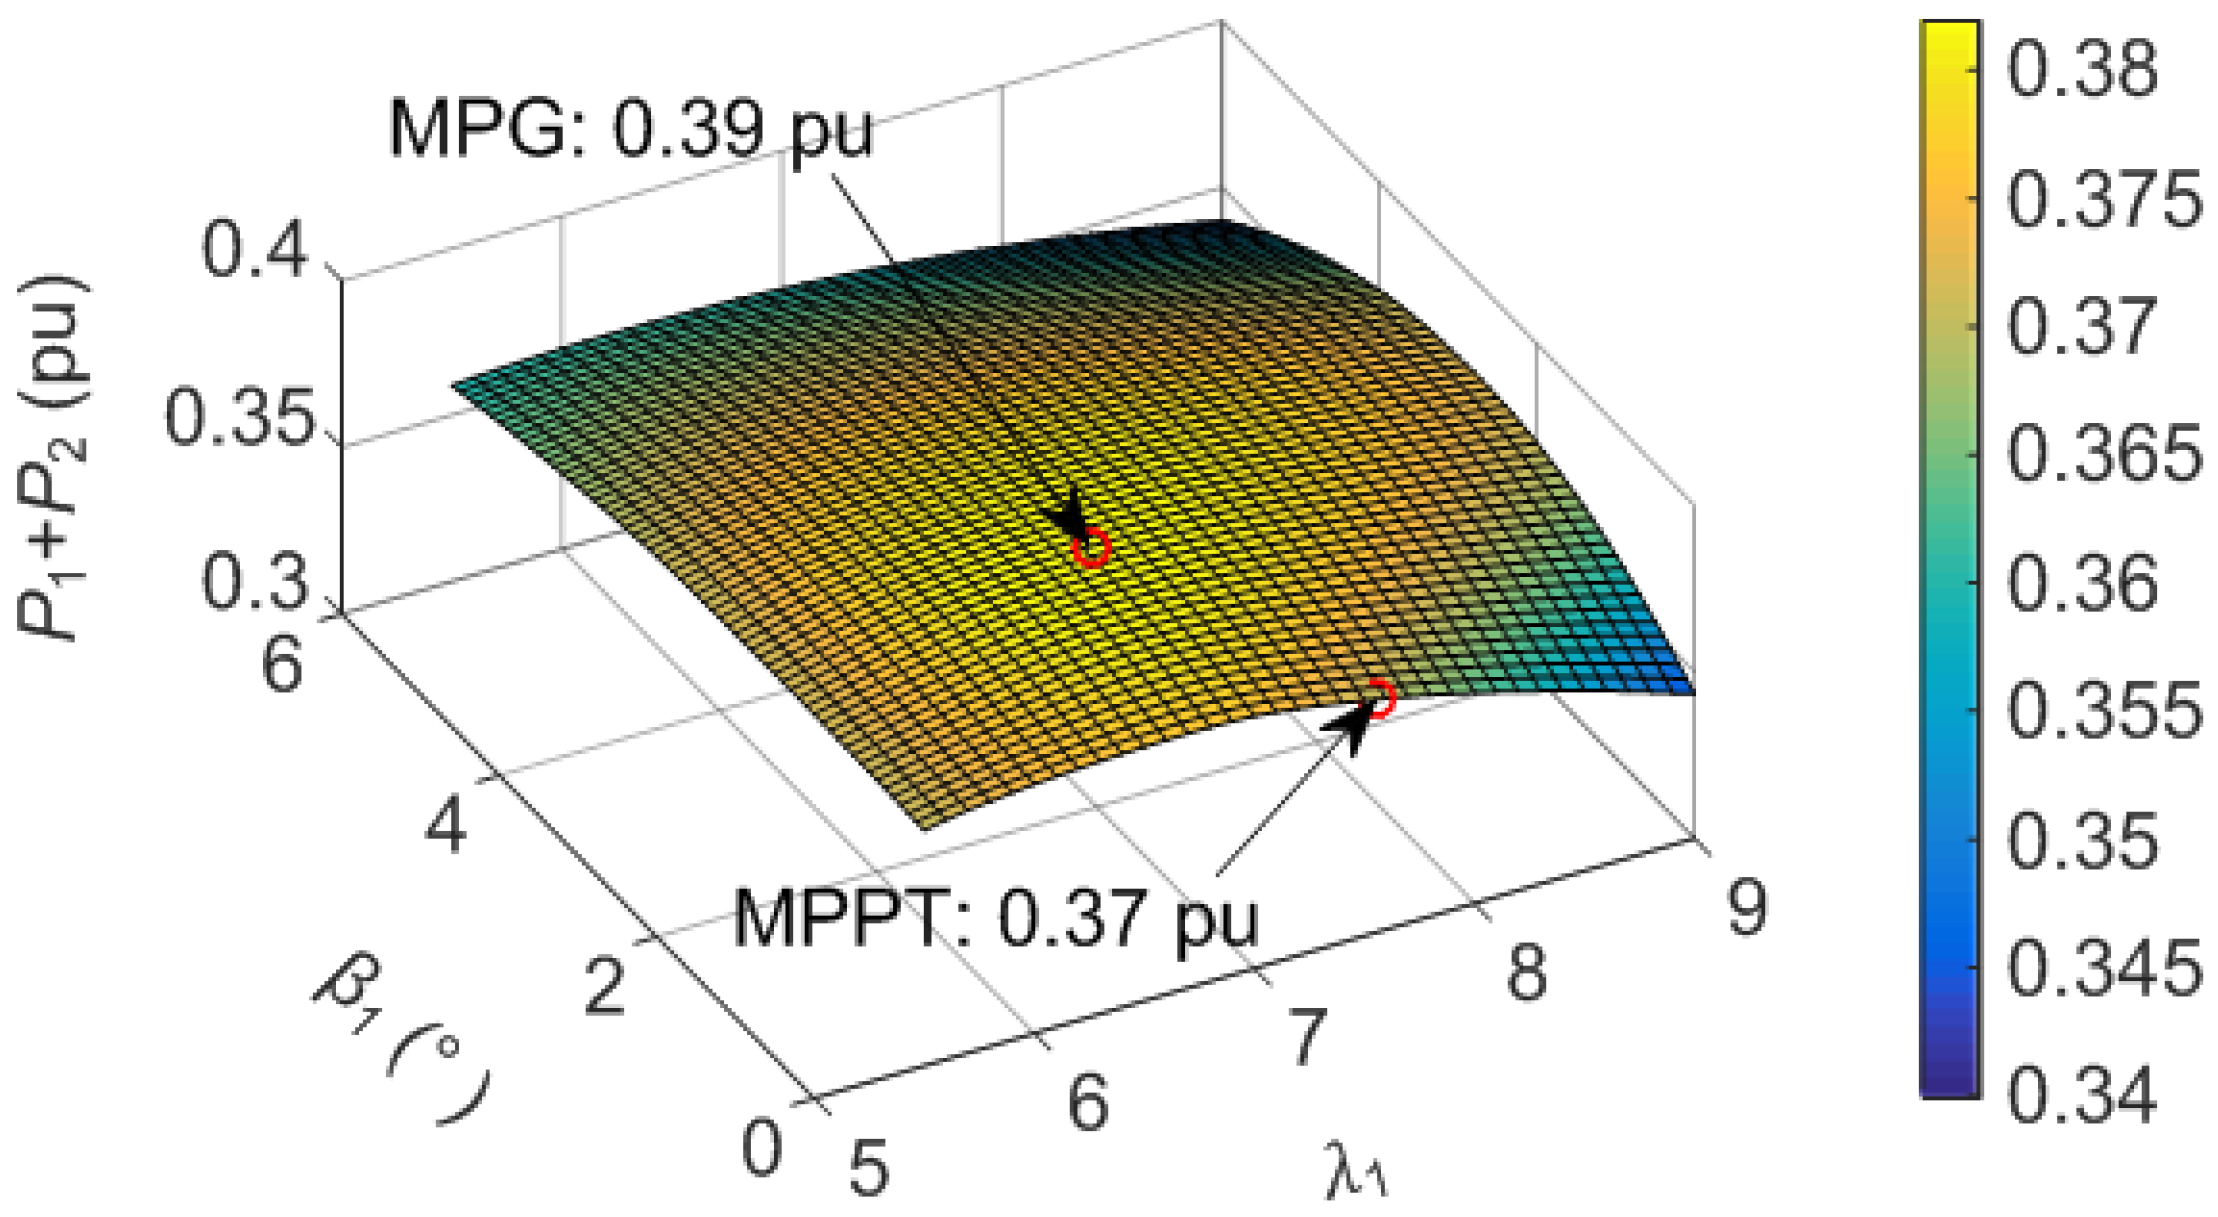
3.2. Optimal Pitch Angle and Tip Speed Ratio Selection at 270° Wind Direction

Similar to the tip speed ratio, as the pitch angle of WT1 may change its power production and its downstream wind speed, the optimized pitch angle can be obtained as well in the case of the wind direction at 270° and ambient wind speed at 9 m/s. The total active power of WT1 and WT2 is shown in Figure 8 in terms of the tip speed ratio and the pitch angle of WT1. It can be observed that the total active power is 0.37 pu by using the MPPT method with the pitch angle of 0° and the tip speed ratio of 7.55. However, the total active power increases to 0.39 pu if the WT1 operates at the pitch angle of 1.8° and the tip speed ratio of 6.9.
Compared with the MPPT method, the optimized pitch angle, tip speed ratio, the rotor speed, and active power of WT1 are shown in Figure 9a. Meanwhile, the active power of WT1, the active power of WT2, and the total active power of the wind farm by using the MPPT and the MPG control are compared in Figure 9b. If the MPG control strategy is applied, it is evident that the active power of WT1 is reduced, while the active power of WT2 is increased. In respect to the total active power of the wind farm, it slightly increases by using the MPG control.

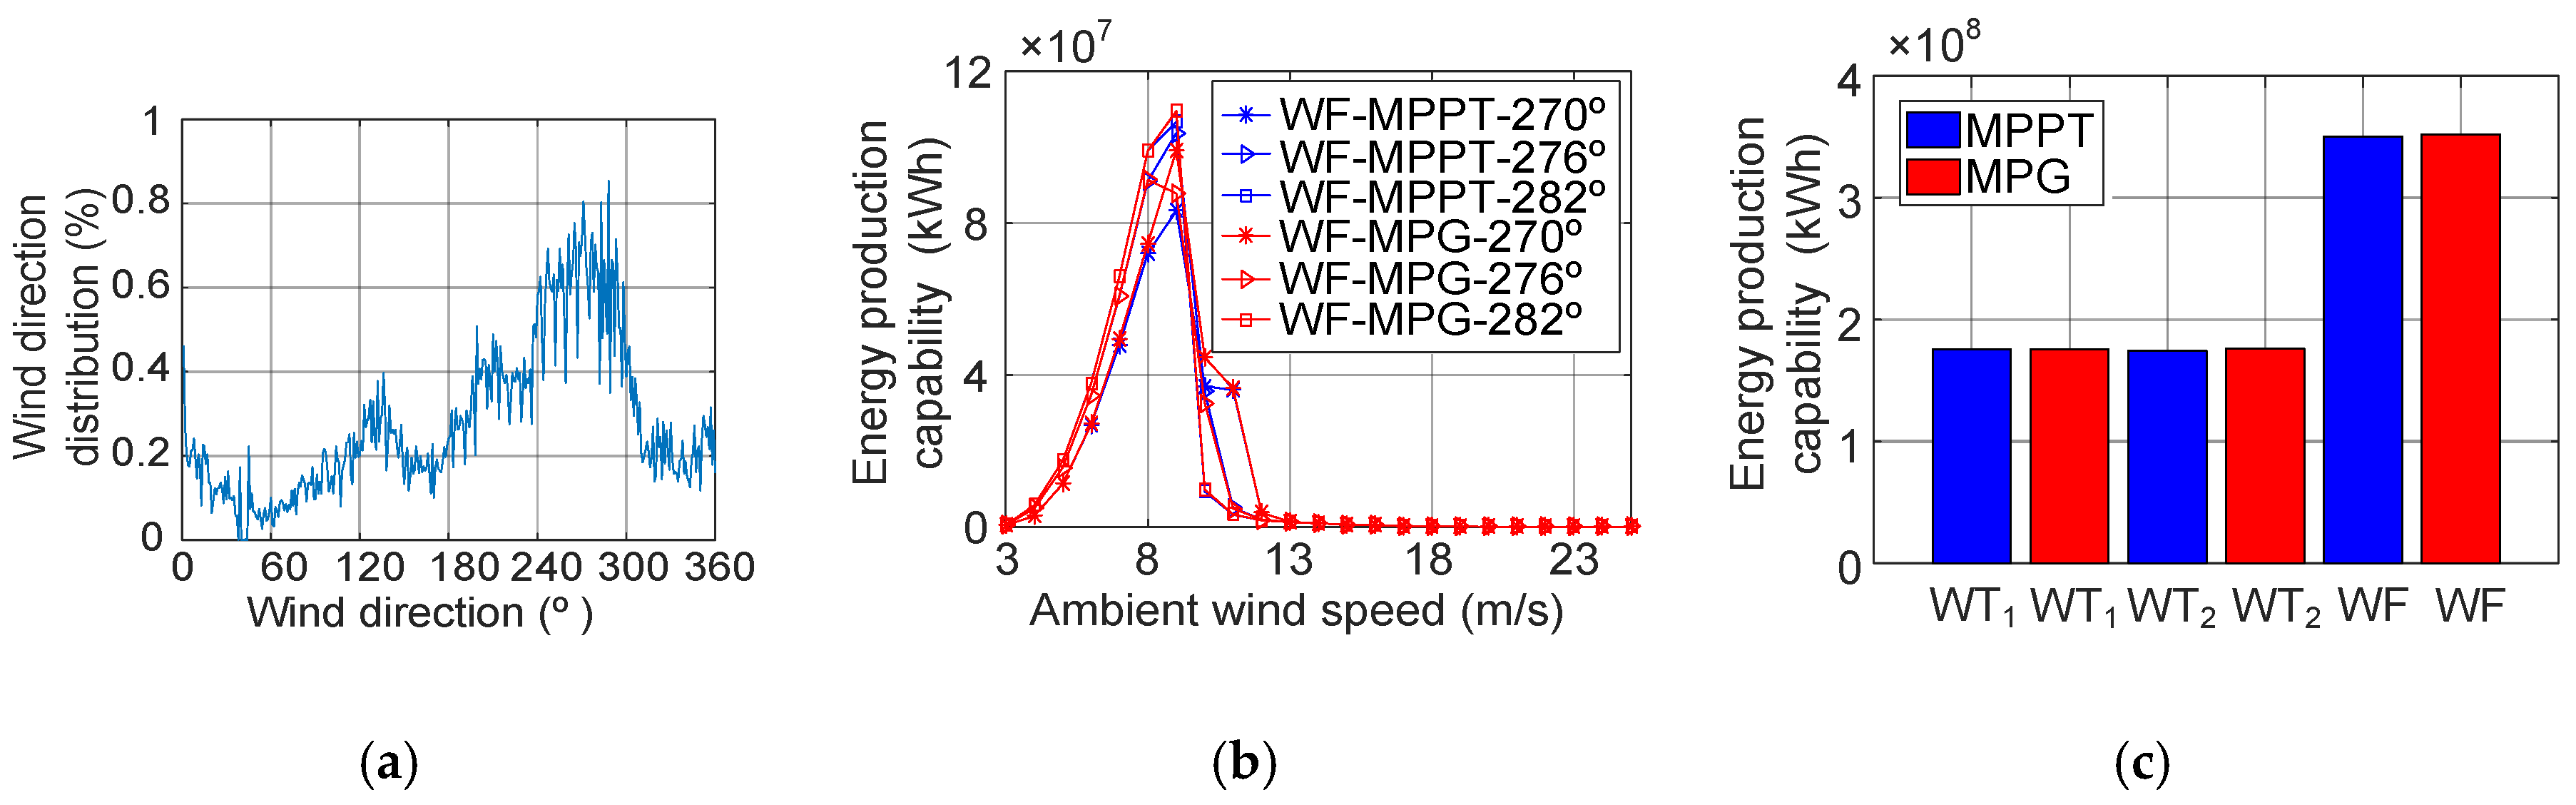
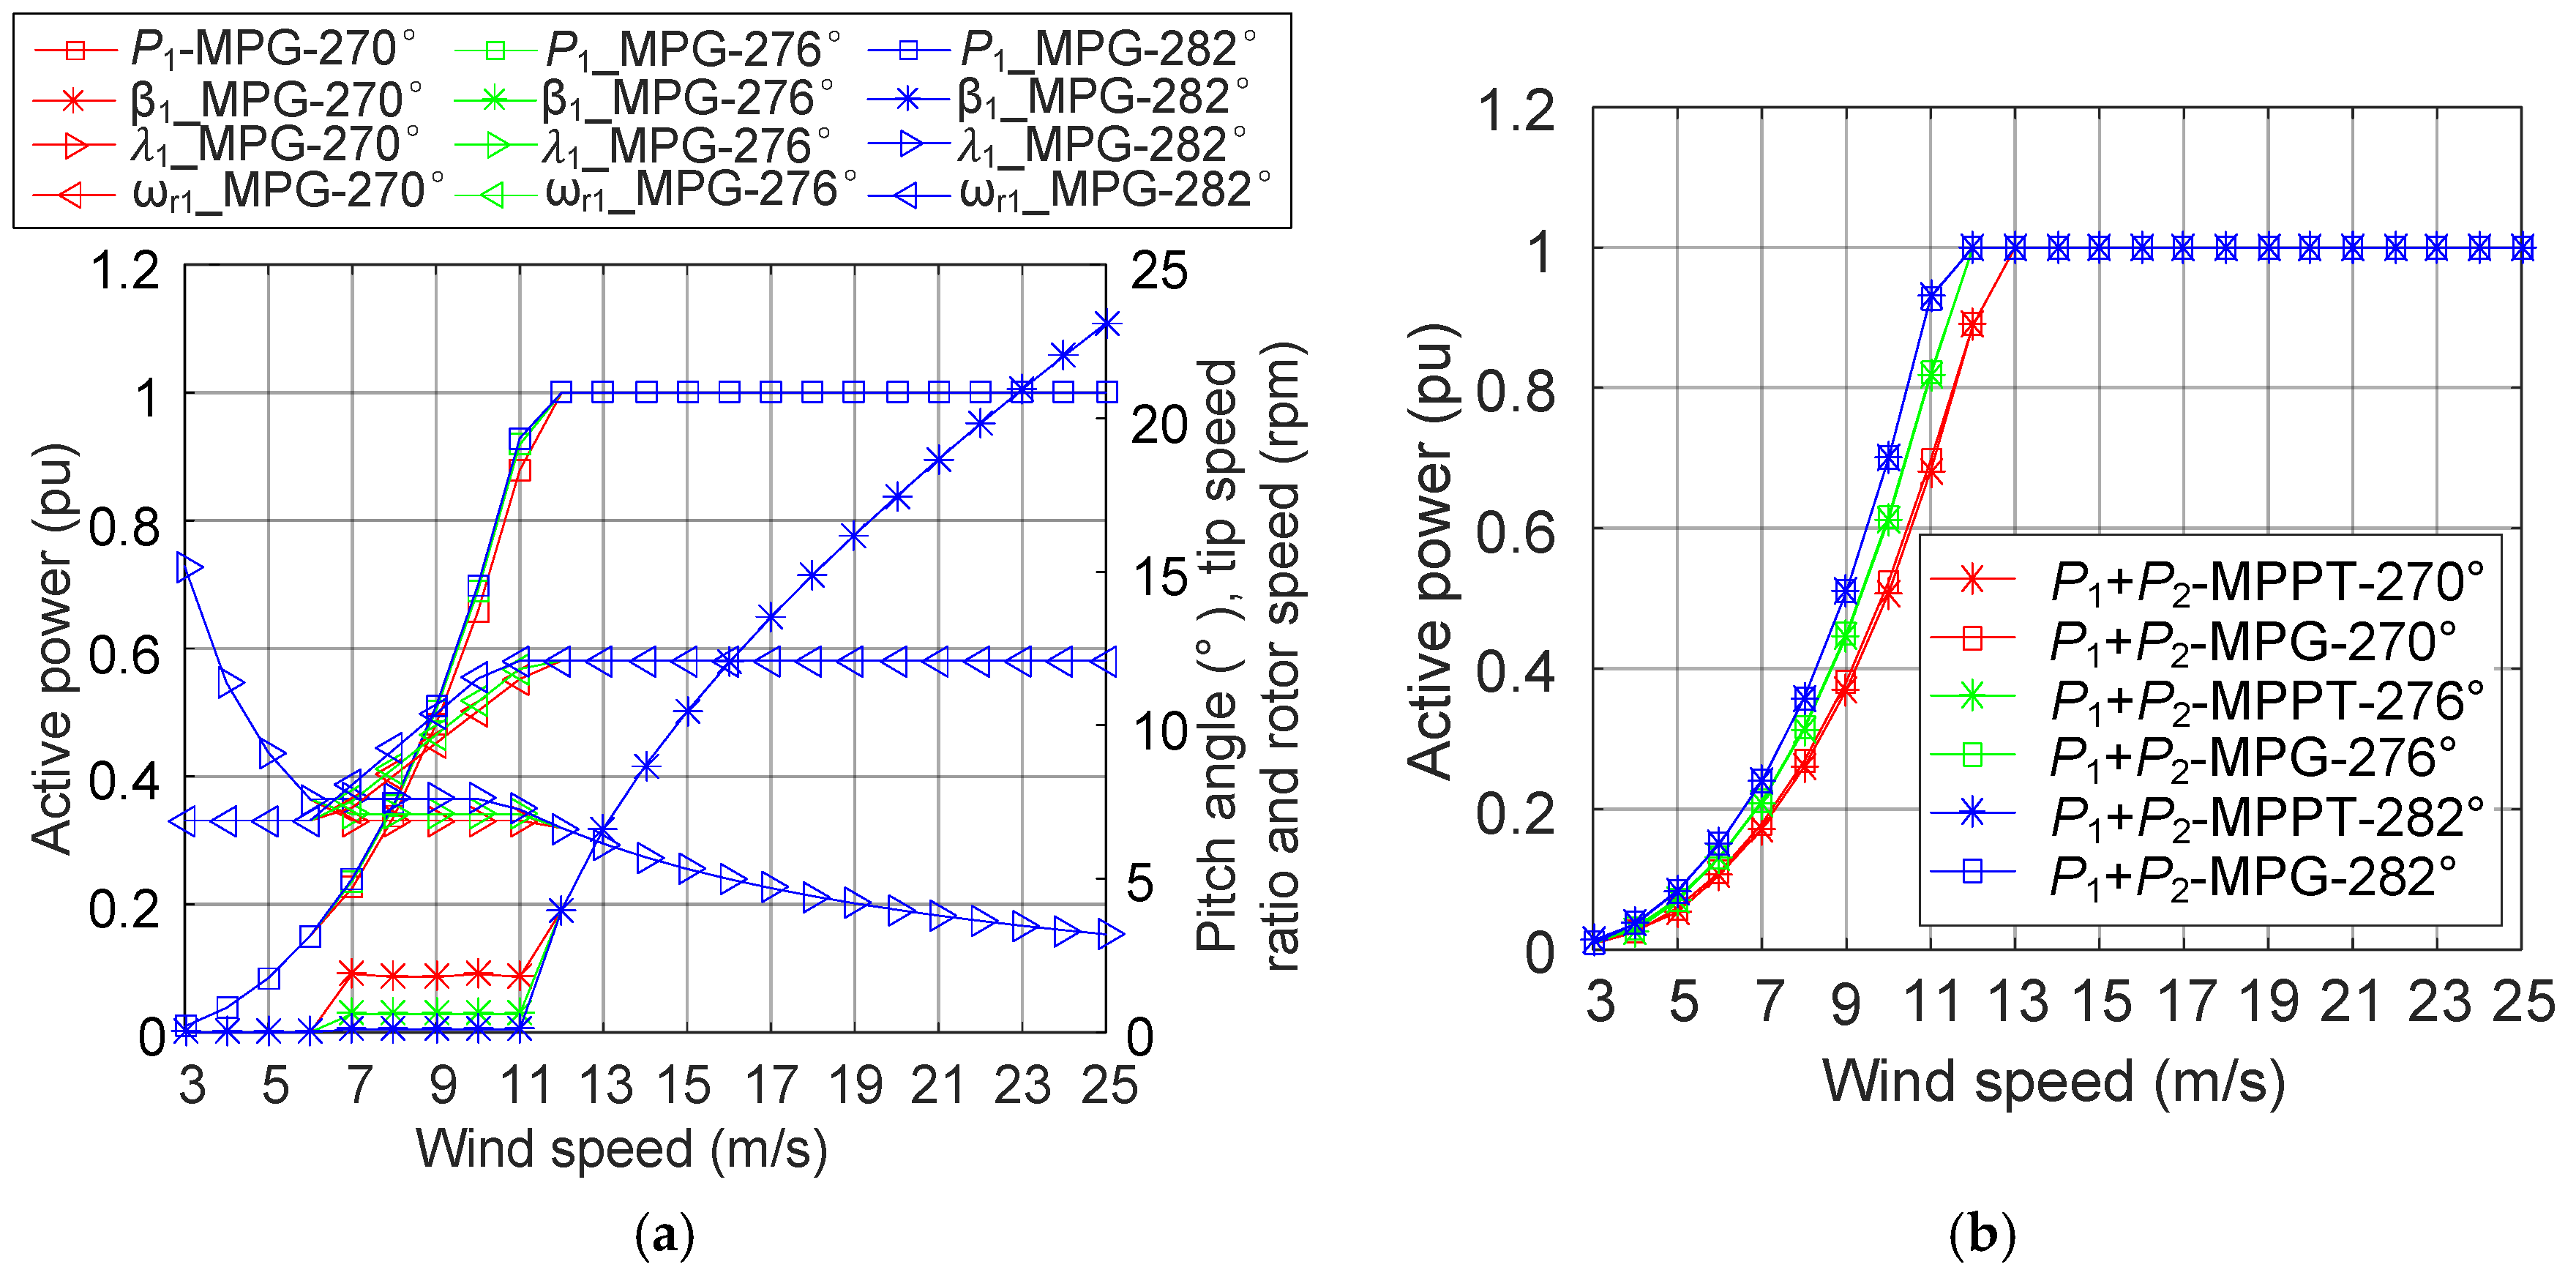
3.3. Optimal Pitch Angle and Tip Speed Ratio Selection at Various Wind Directions

Based on the layout of the wind farm (as shown in Figure 5), the wake effect appears within the four symmetrical areas with the wind direction of 258°–270°, 270°–282°, 78°–90°, and 90°–102°. The wind direction of 270° and 90° suffer the most severe wake effect due to the highest overlap area, while in the wind direction range between 282°–78° and 102°–258°, no wake effect can be expected because no turbine is located in the wake area of the wind farm. In situations where the wind directions result in there not being any wake effect on the wind farm, the WT1 and WT2 both can be controlled by using the MPPT method.
In the cases of the wind directions at 270°, 276°, and 282°, the pitch angle and tip speed ratio of WT1 can be optimized by using the MPG control, and its corresponding rotor speed and active power are shown in Figure 10a. It is noted that the optimized pitch angle and tip speed ratio of WT1 is the same with the MPPT method at the wind direction of 282°, as there is no energy loss caused by WT1 at this wind direction. Meanwhile, the optimized total active power values of the wind farm at the wind directions of 270°, 276°, and 282° are shown in Figure 10b.

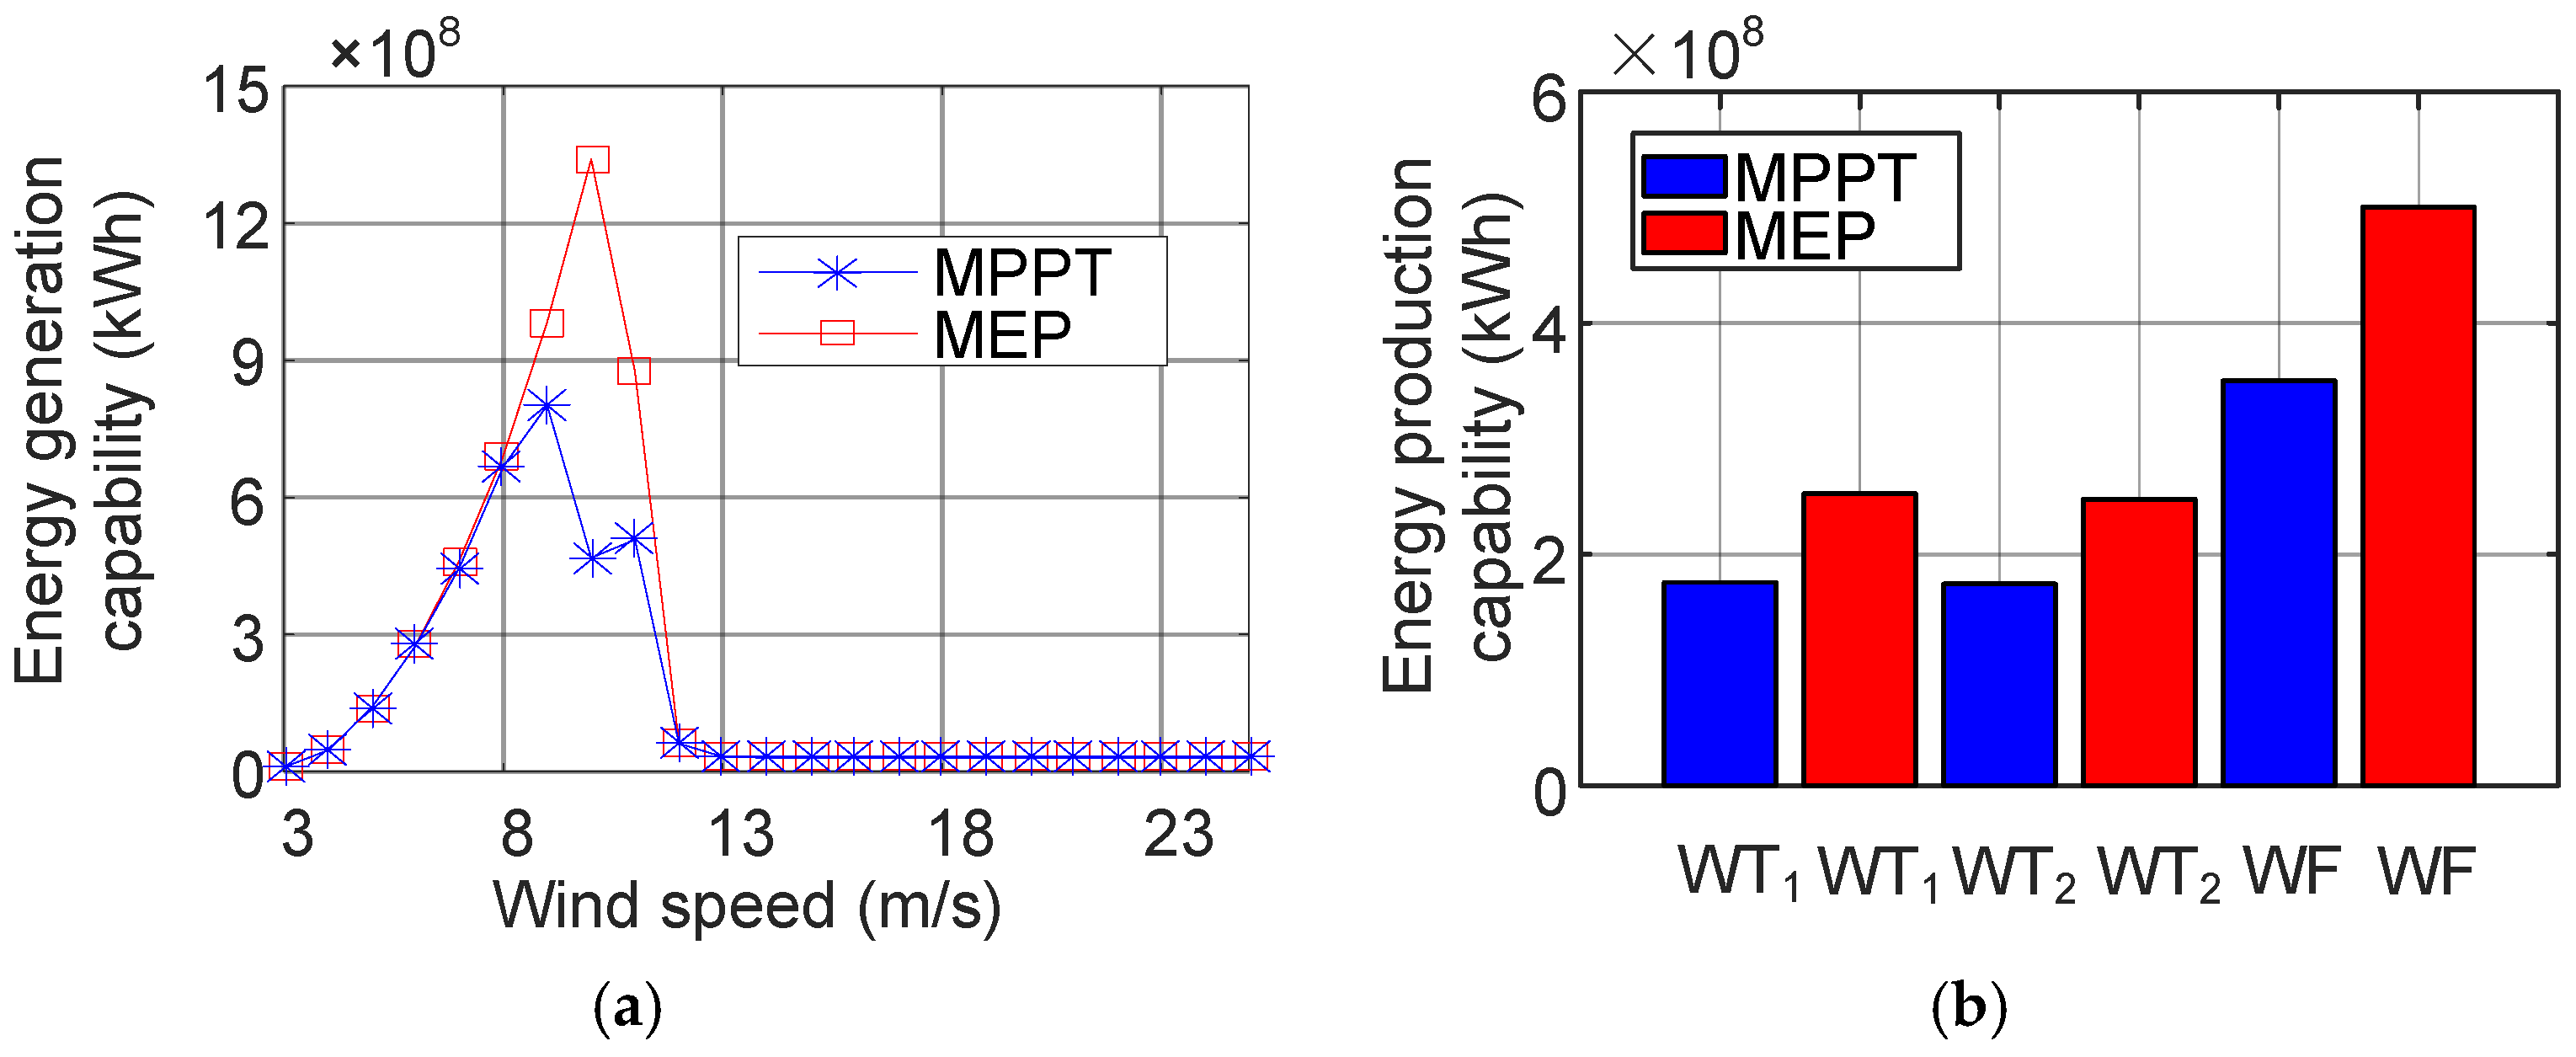
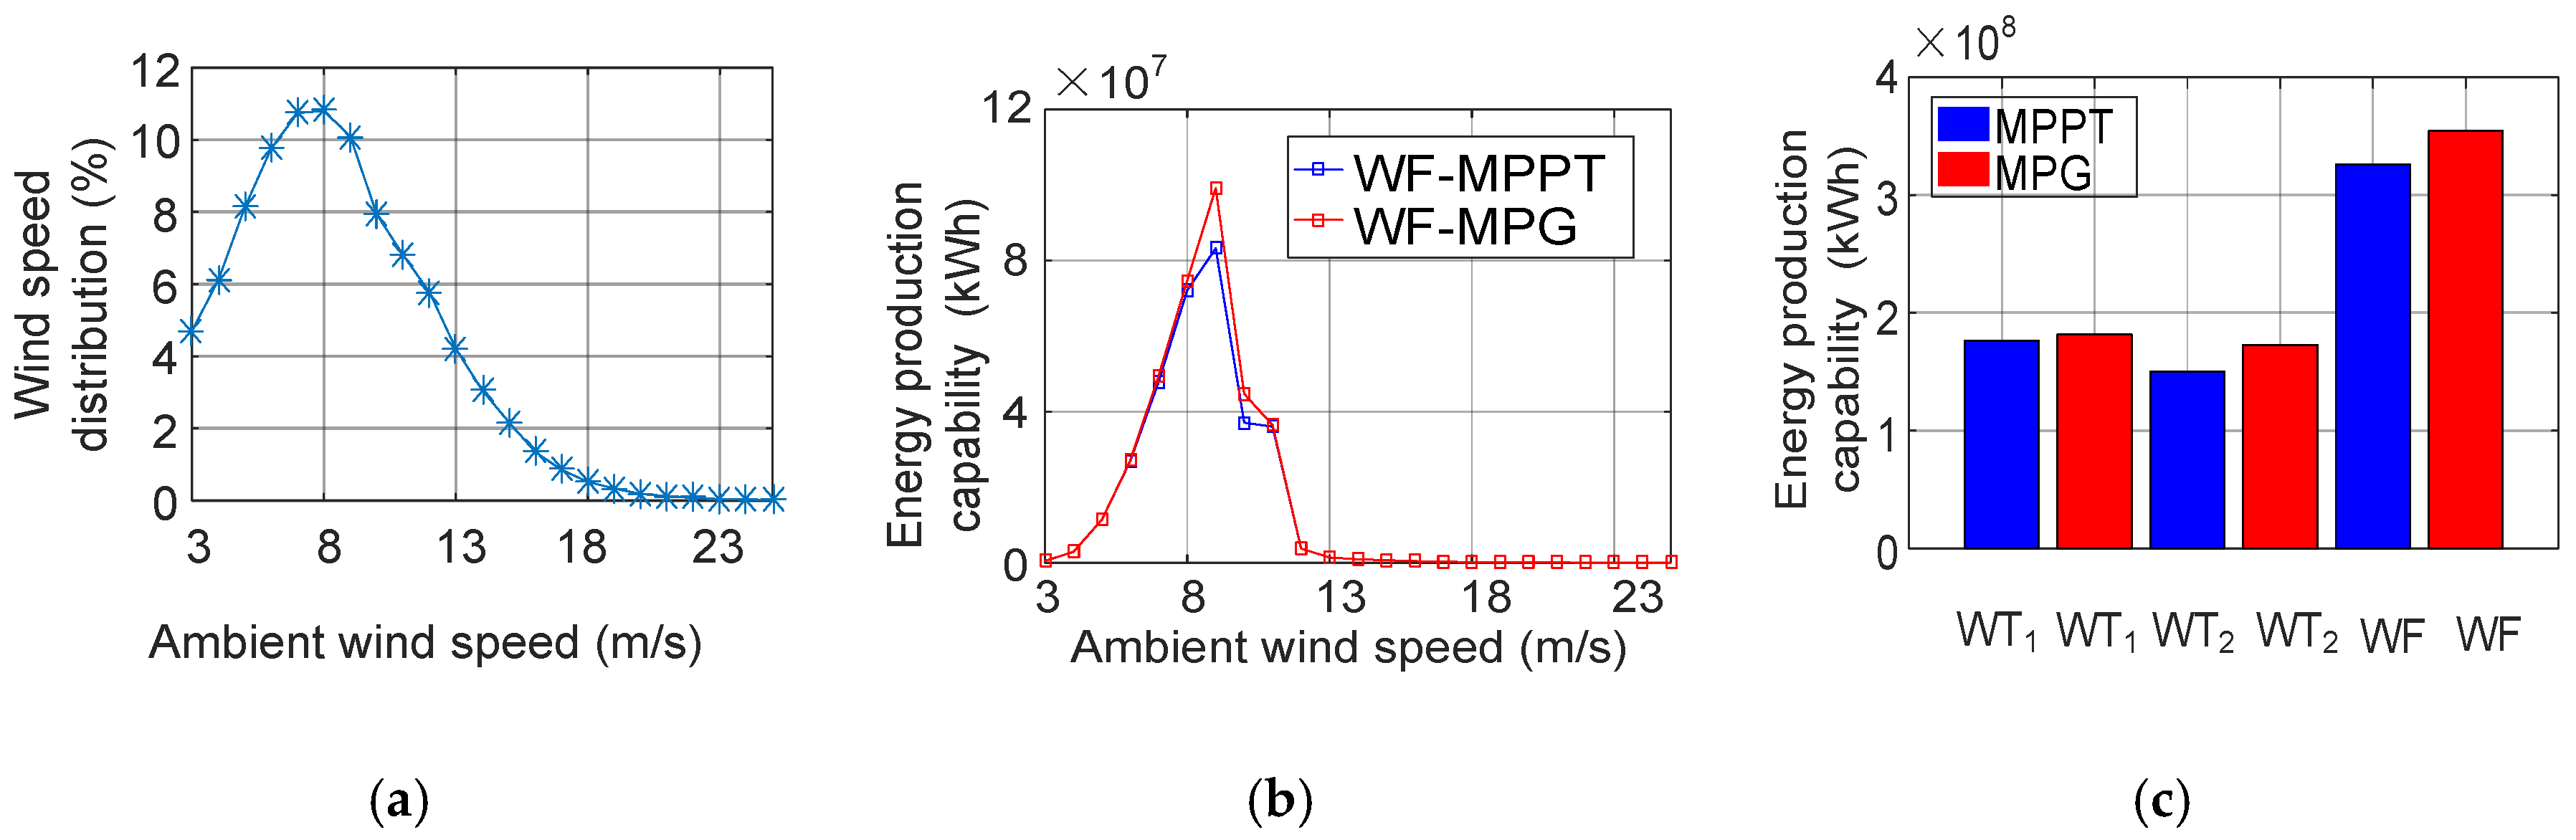
4. Energy Production of Wind Farm According to MPPT and MPG

The energy production of the wind farm relates to the active power generation and the operation time. As discussed in Section 2.3, the lifetime of the wind turbine is determined by the pitch angle and tip speed ratio, which also determine the active power generation of the wind turbine. In this section, with the estimated B10 lifetime of the wind turbine, the energy production of the wind farm across its lifespan is compared between the MPPT method and the MPG method.
As illustrated in Section 2.3, the lifetime of the power converter can be estimated with the active power and the rotor speed of the wind turbine. In the case of a constant wind direction at 270° and a constant ambient wind speed over the whole year, with the active power curve shown in Figure 9a, the B10 lifetimes of WT1 and WT2 are calculated and they are shown in Figure 11a at constant ambient wind speeds ranging from 3 m/s to 25 m/s. It is noted that regardless of the control schemes, the lifetime of the downstream turbine is higher than the upstream turbine in the ambient wind speed range from 9 m/s to 12 m/s due to the reduced active power generation of the downstream turbine. Meanwhile, it is assumed that the maximum lifetime of the wind turbine is limited to 30 years. Together with the active power shown in Figure 9a, the energy production of WT1, WT2, and their sum are calculated and shown in Figure 11b. Compared with the MPPT method, the MPG method cannot guarantee the increase of the energy production of the whole wind farm at all constant ambient wind speeds. For instance, the energy production of the wind farm is decreased at the constant ambient wind speed of 11 m/s over the whole year.
Assuming that the wind direction is constant at 270° in the whole year, with the field wind speed distribution shown in Figure 12a and the energy production of the wind farm with constant ambient wind speed in the whole year shown in Figure 11b, the energy production of the wind farm at each ambient wind speed considering the ambient wind speed distribution is obtained and shown in Figure 12b. By summing the energy productions of the wind farm at each ambient wind speeds from 3 m/s to 25 m/s as they are shown in Figure 12b, the total energy production of the wind farm all ambient wind speeds is compared between the MPPT method and the MPG method in Figure 12c.
With the same method to generate the energy production of the wind farm at 270° wind direction as shown in Figure 12b, and by assuming the same speed distribution at each wind direction as shown in Figure 12a, the energy productions of the wind farm at 276° and 282° wind directions are presented in Figure 13b. Together with the wind direction distribution as shown in Figure 13a and the energy production of the wind farm at each wind directions as shown in Figure 13b, the total energy production of the wind farm at all the wind directions from 0° to 360° and at all the ambient wind speeds from 3 m/s to 25 m/s is compared between the MPPT method and the MPG method as shown in Figure 13c. It can be observed that the total energy production of the wind farm is almost the same between the two active power control methods, as the MPG method just optimizes the pitch angle and tip speed ratio at the wind directions from 269° to 281° and from 79° to 101°, while the wind turbine is controlled by the MPPT method at other wind directions and other wind speeds.

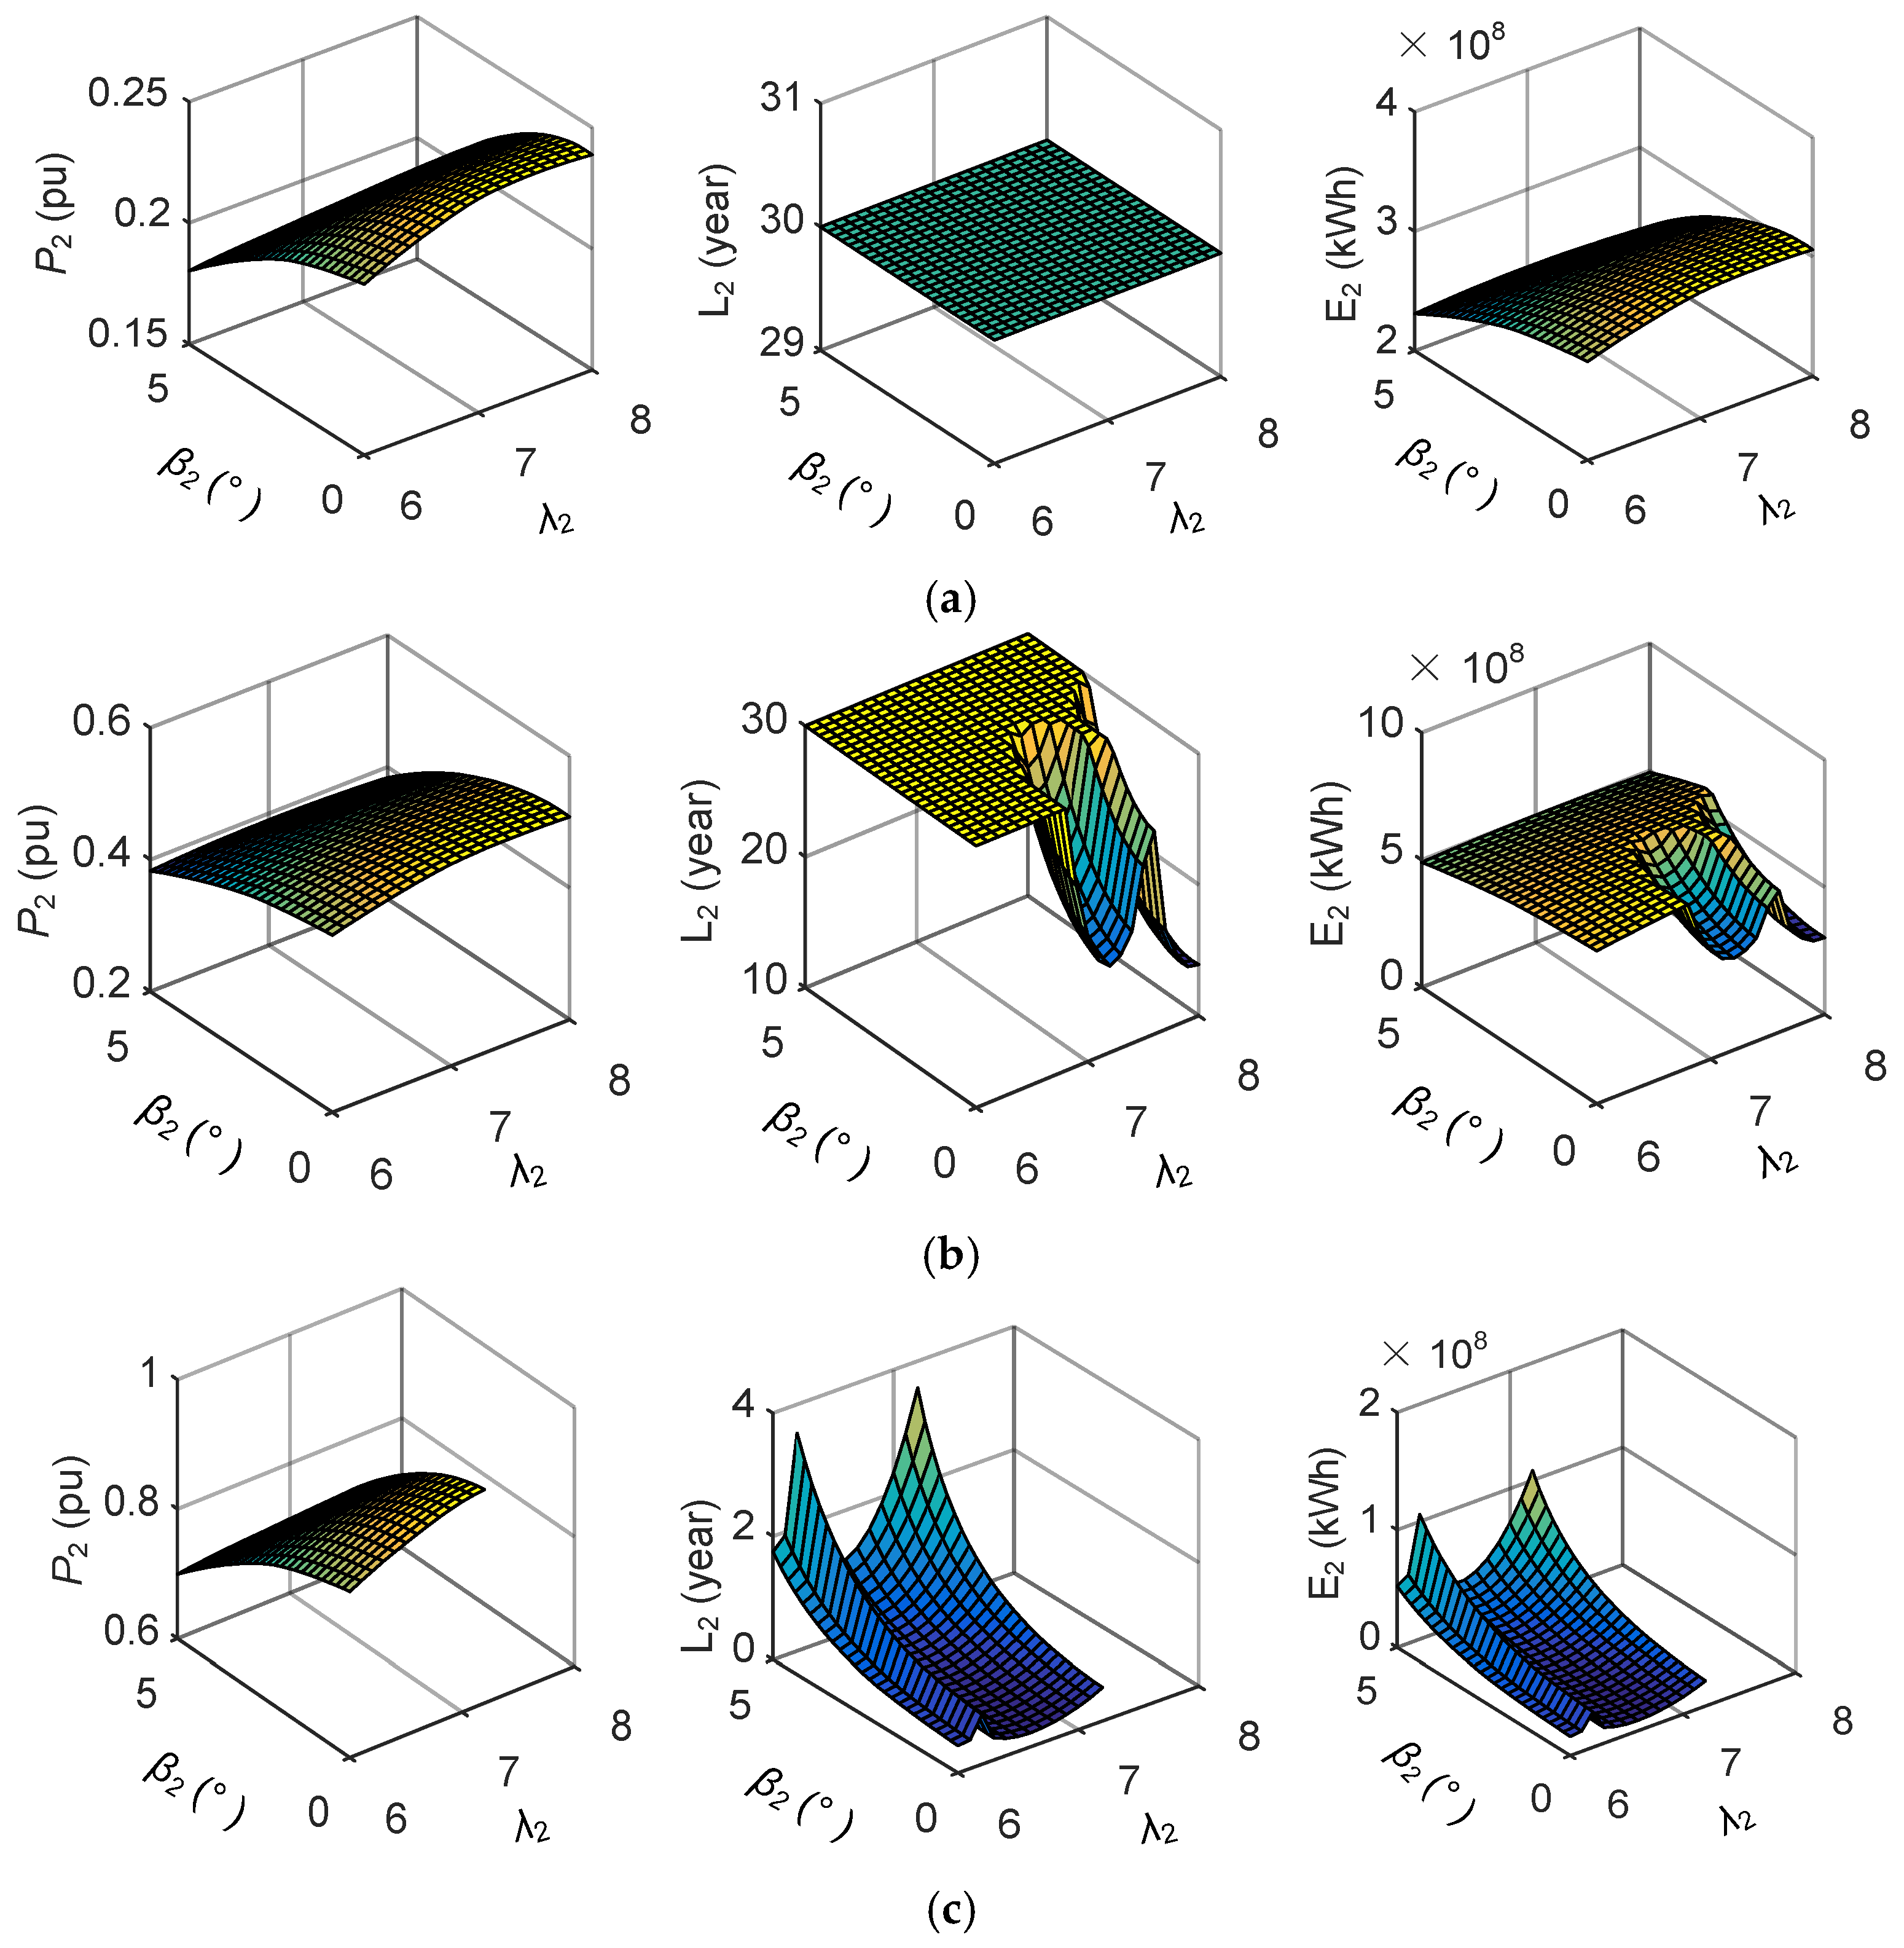
5. Maximize Energy Production of Wind Farm

As presented in Section 4, the energy production relates to the active power and the operation time. Besides the active power generation, the lifetime of the wind turbine is also determined by the pitch angle and tip speed ratio. In this section, taking into account the lifetime of the wind turbine, the optimal pitch angle and tip speed ratio of each wind turbine are selected to maximize the total energy production of the wind farm across its lifespan. Case studies are again carried out in the simple wind farm example as shown in Figure 5.

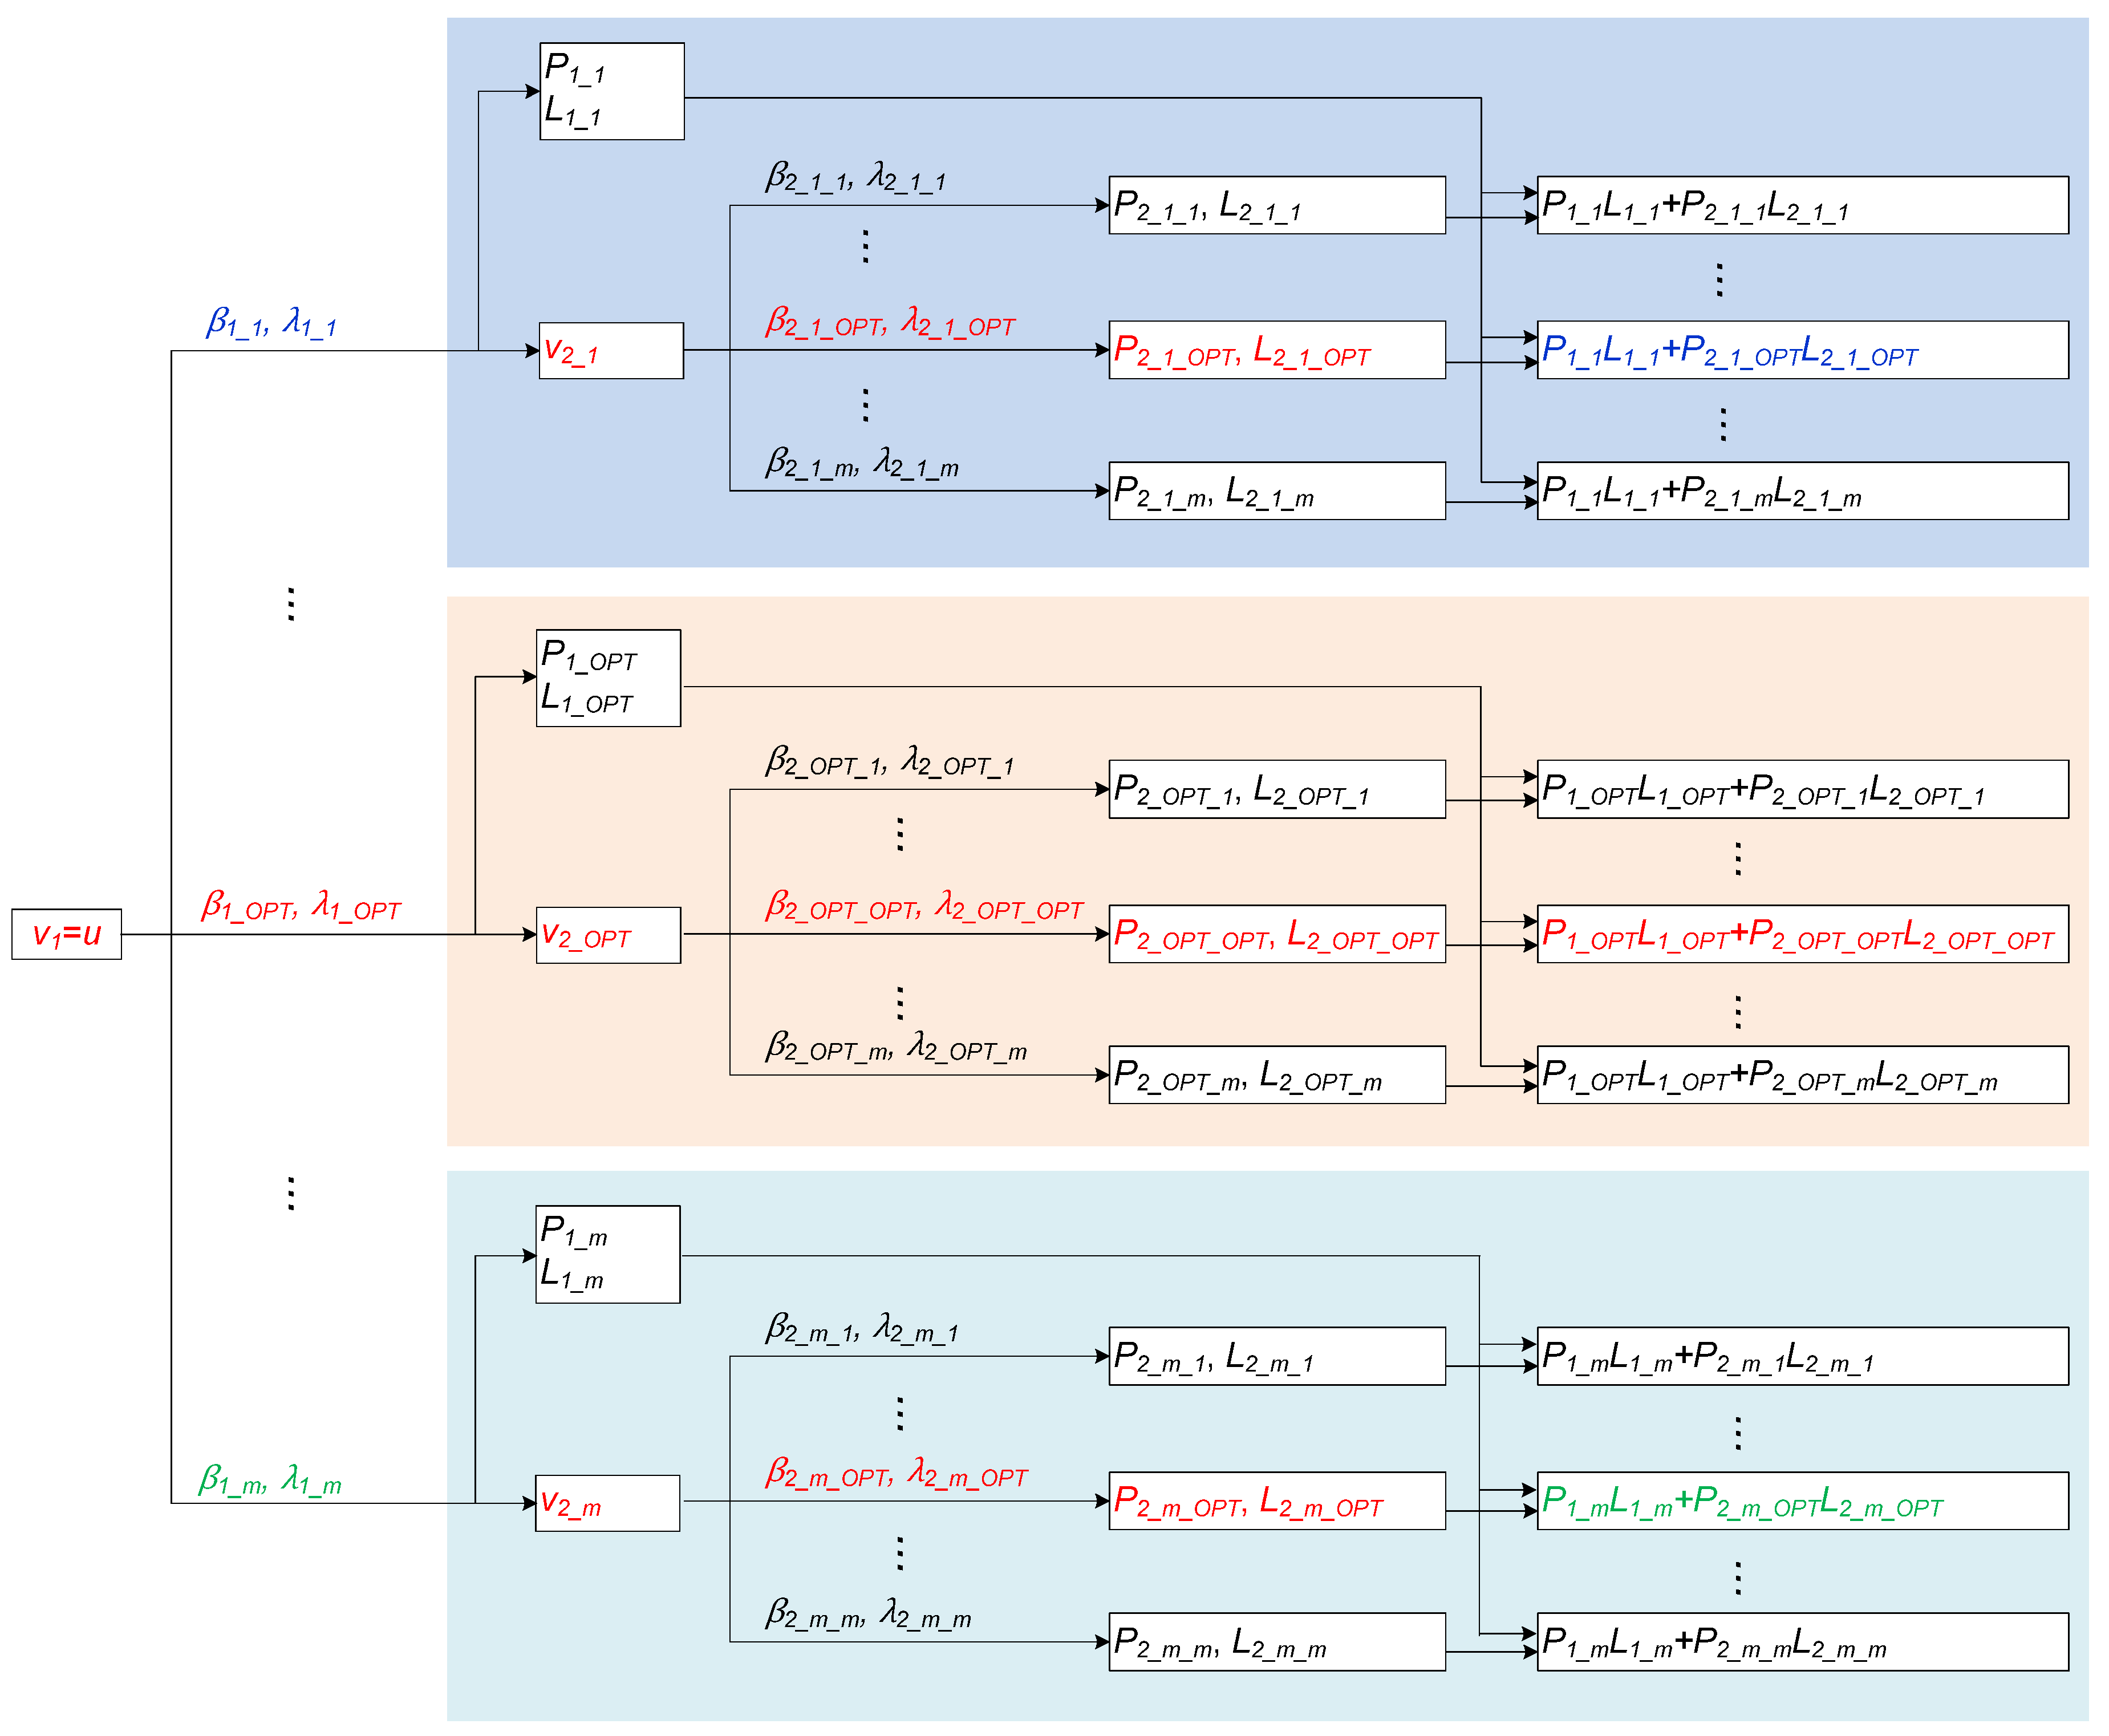
5.1. Optimization Method

To maximize the energy production of the wind farm across its lifespan, the objective function can be expressed by:
M a x ( P 1 ( v 1 , β 1 , λ 1 ) L 1 ( v 1 , β 1 , λ 1 ) + P 2 ( v 2 , β 2 , λ 2 ) L 2 ( v 2 , β 2 , λ 2 ) )
where P and L are the active power and lifetime of each turbine, respectively, with both relating to the wind speed v, pitch angle β, and tip speed ratio λ. Subscripts 1 and 2 denote the parameters of WT1 and WT2, respectively.
In the case of constant wind direction and constant ambient wind speed, the process to obtain the optimal pitch angle and tip speed ratio of WT1 and WT2 is shown in Figure 14. Overall, the optimal pitch angle and tip speed ratio of WT1 can be selected by comparing the maximum total energy production of the wind farm at each set of pitch angle and tip speed ratio of WT1. At each set of pitch angle and tip speed ratio of WT1, due to the fixed active power and the lifetime of WT1, as well as the wind speed of WT2, the maximum energy production of the wind farm and the maximum energy production of WT2 are obtained at the same pitch angle and tip speed ratio of WT2. Thus, the optimal pitch angle and tip speed ratio of WT2 can be selected first by maximizing the energy production of WT2 at each wind speed of WT2. Then, the optimal pitch angle and tip speed ratio of WT1 can be selected with the optimized pitch angle and tip speed ratio of WT2. Consequently, the optimal pitch angle and tip speed ratio of each wind turbine can be selected separately from the downstream wind turbine to the upstream wind turbine.
For example, at the first set of pitch angle and tip speed ratio of WT1 which are β1_1 and λ1_1, as the P1_1, L1_1, and v2_1 are fixed values, the maximum P1L1 + P2L2 is obtained at the maximum P2L2. The maximum P2L2 can be obtained by selecting the optimal pitch angle and tip speed ratio of WT2 at v2_1, which are β2_1_OPT and λ2_1_OPT. If the optimal pitch angle and tip speed ratio of WT2 to maximize the energy production of WT2 is selected previously at each wind speed of WT2, the maximum energy production of the wind farm at each set of pitch angle and tip speed ratio of WT1 can be obtained. By comparing the maximum energy production of the wind farm at each set of pitch angle and tip speed ratio of WT1, the optimal pitch angle and tip speed ratio of WT1 can be obtained.

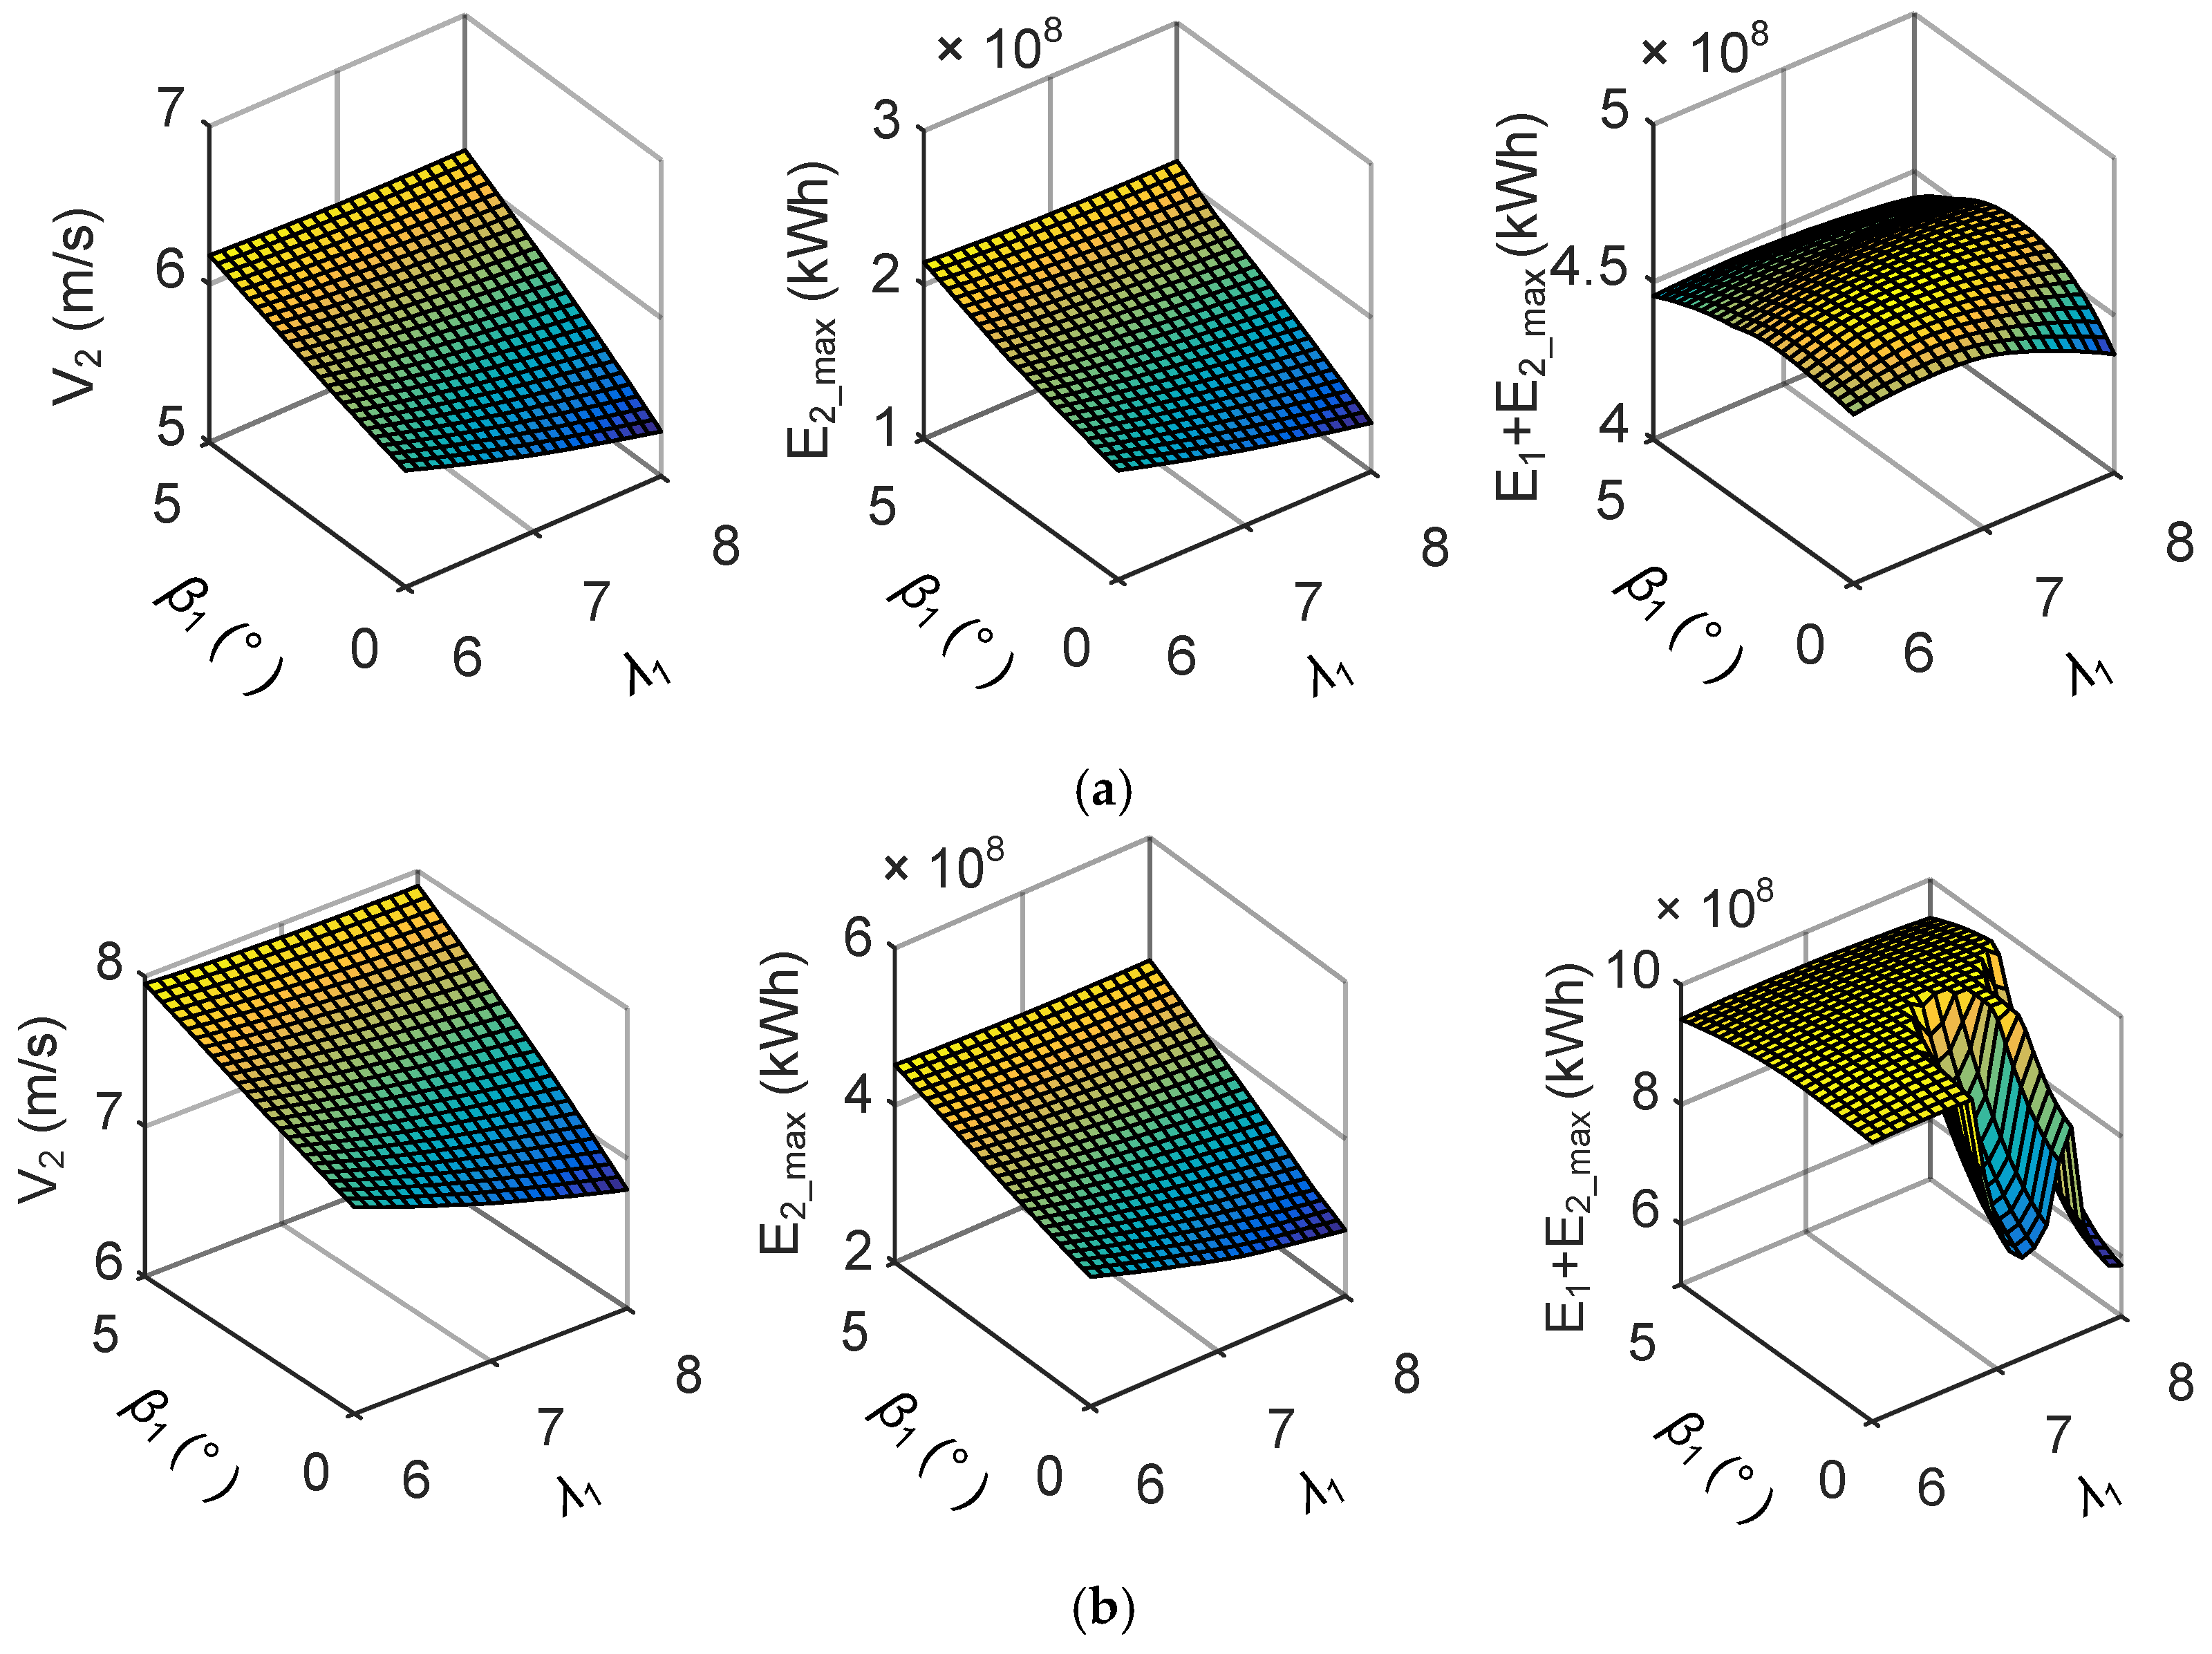
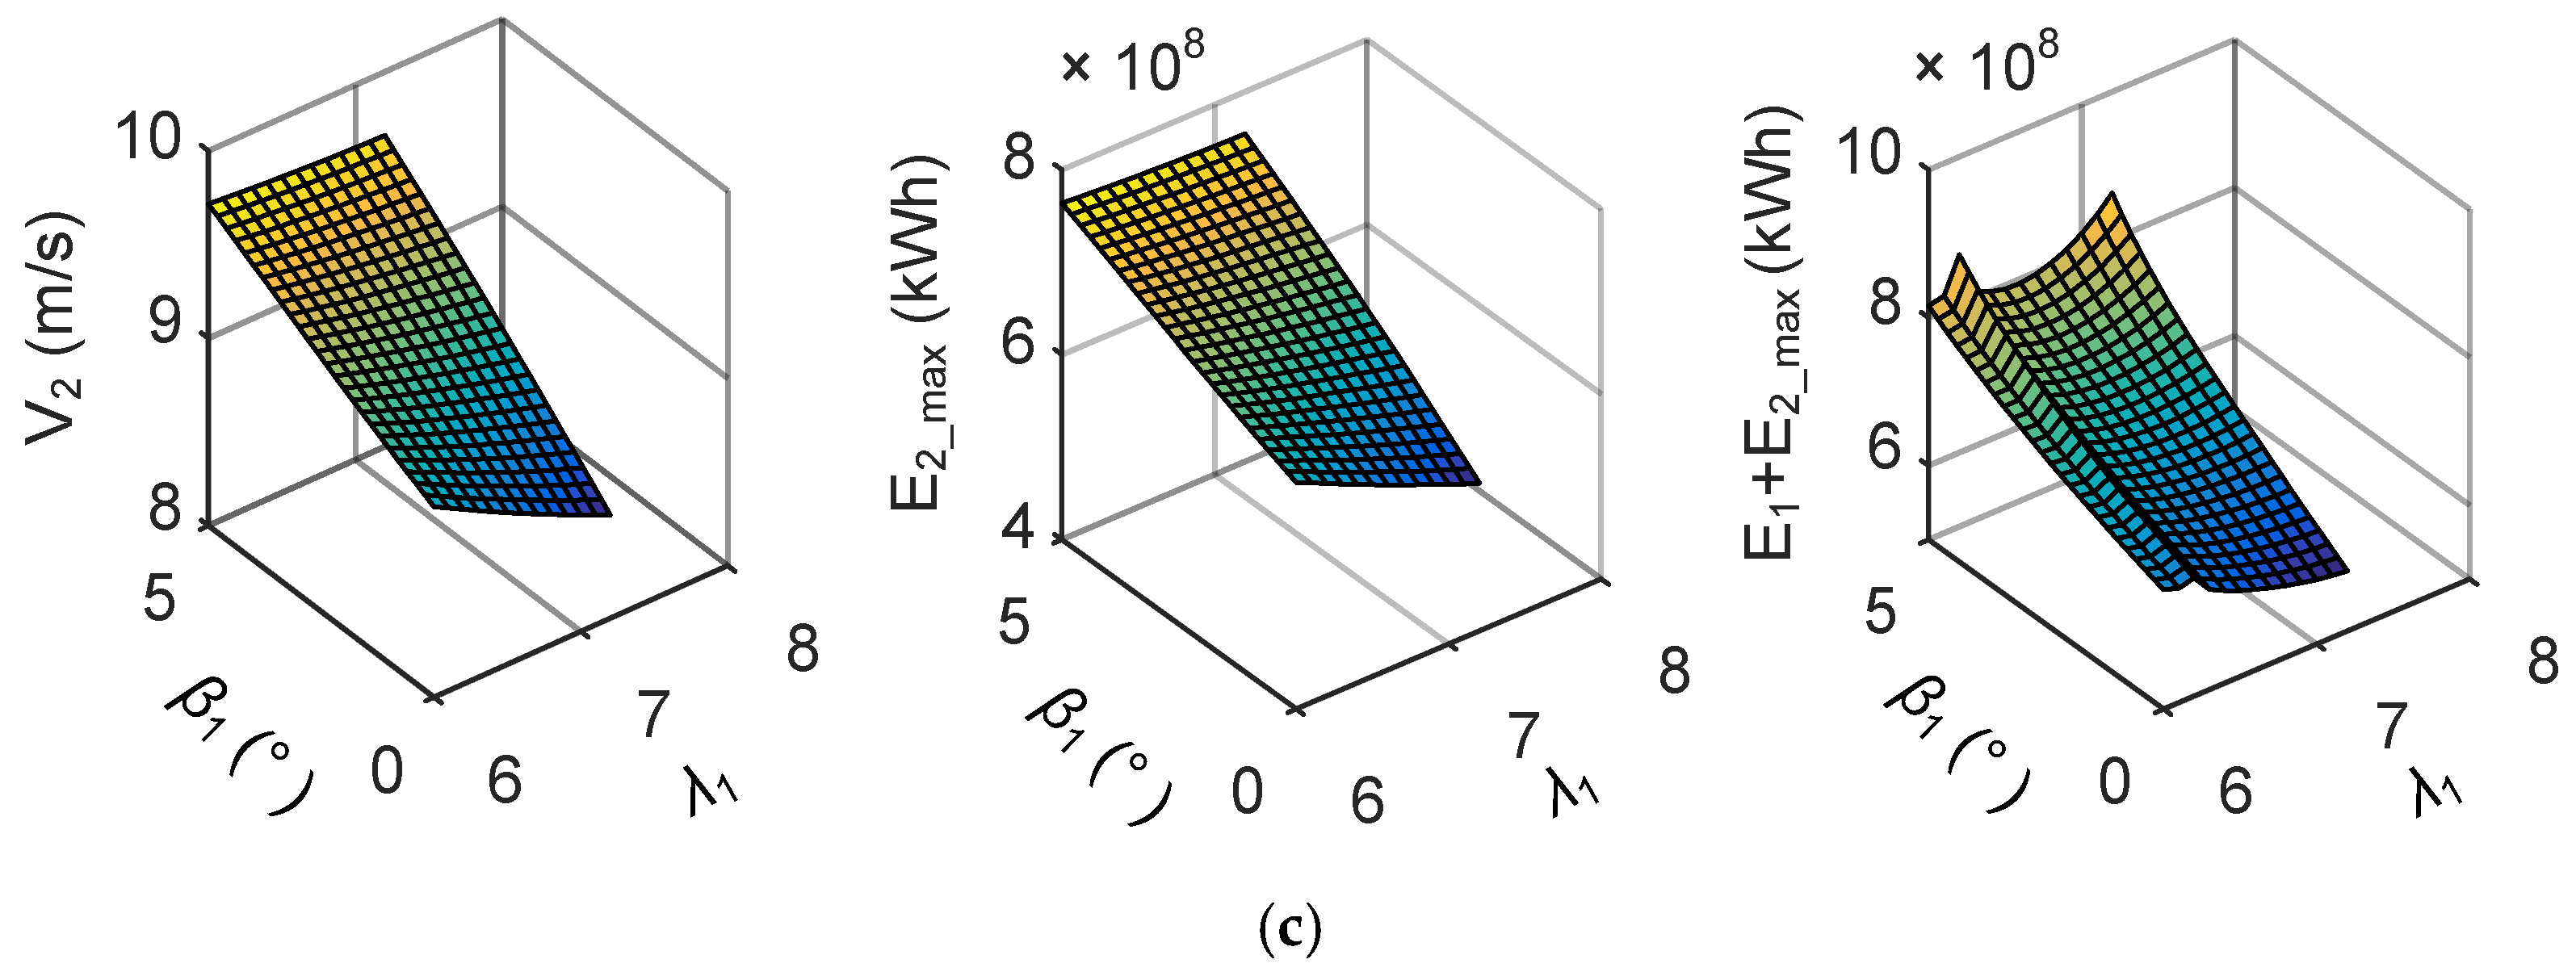
5.2. Optimization for WT2

In this subsection, the constant wind direction at 270° and constant wind speed across the whole year are assumed and the optimal pitch angle and tip speed ratio of WT2 are selected from the cut-in wind speed to the cut-out wind speed. As mentioned before, the rotor speed limit of a minimum 6.9 rpm and a maximum 12.1 rpm, the rated power limit of 5 MW, and the maximum lifetime limit of 30 years are taken into account. As shown in Figure 14, the optimal pitch angle and tip speed ratio of each wind turbine can be selected separately from the downstream wind turbine to the upstream wind turbine. In this case, WT2 can be treated as an isolated single wind turbine without any interaction with other wind turbines.
For a single wind turbine, the active power, lifetime, and energy production in terms of pitch angle and tip speed ratio at the wind speed of 7 m/s, 9 m/s, and 11 m/s are shown in Figure 15a–c, respectively. In Figure 15a,b, the maximum lifetime is limited by 30 years. In Figure 15c, the tip speed ratio is limited by 7.2, because the maximum rotor speed of 12.1 rpm. It can be observed from Figure 15 that, at the wind speed of 7 m/s, the maximum energy production is obtained at the same pitch angle and tip speed ratio with the maximum active power, because the lifetime at each set of pitch angles and tip speed ratios are all limited to 30 years. At the wind speed of 11 m/s, the maximum energy production is obtained at the same pitch angle and tip speed ratio with the maximum lifetime due to the higher difference of lifetime compared to the active power.
Similarly, the pitch angle and tip speed ratio can be obtained from the cut-in to the cut-out wind speed at the maximum energy production of WT2. As a result, the optimized pitch angle and tip speed ratio, the corresponding rotor speed, the active power, the lifetime, and the energy production of WT2 are shown in Figure 16. Compared with the MPPT method, it can be seen that the energy production of the wind turbine can be increased a lot from the wind speed of 9 m/s to 11 m/s.

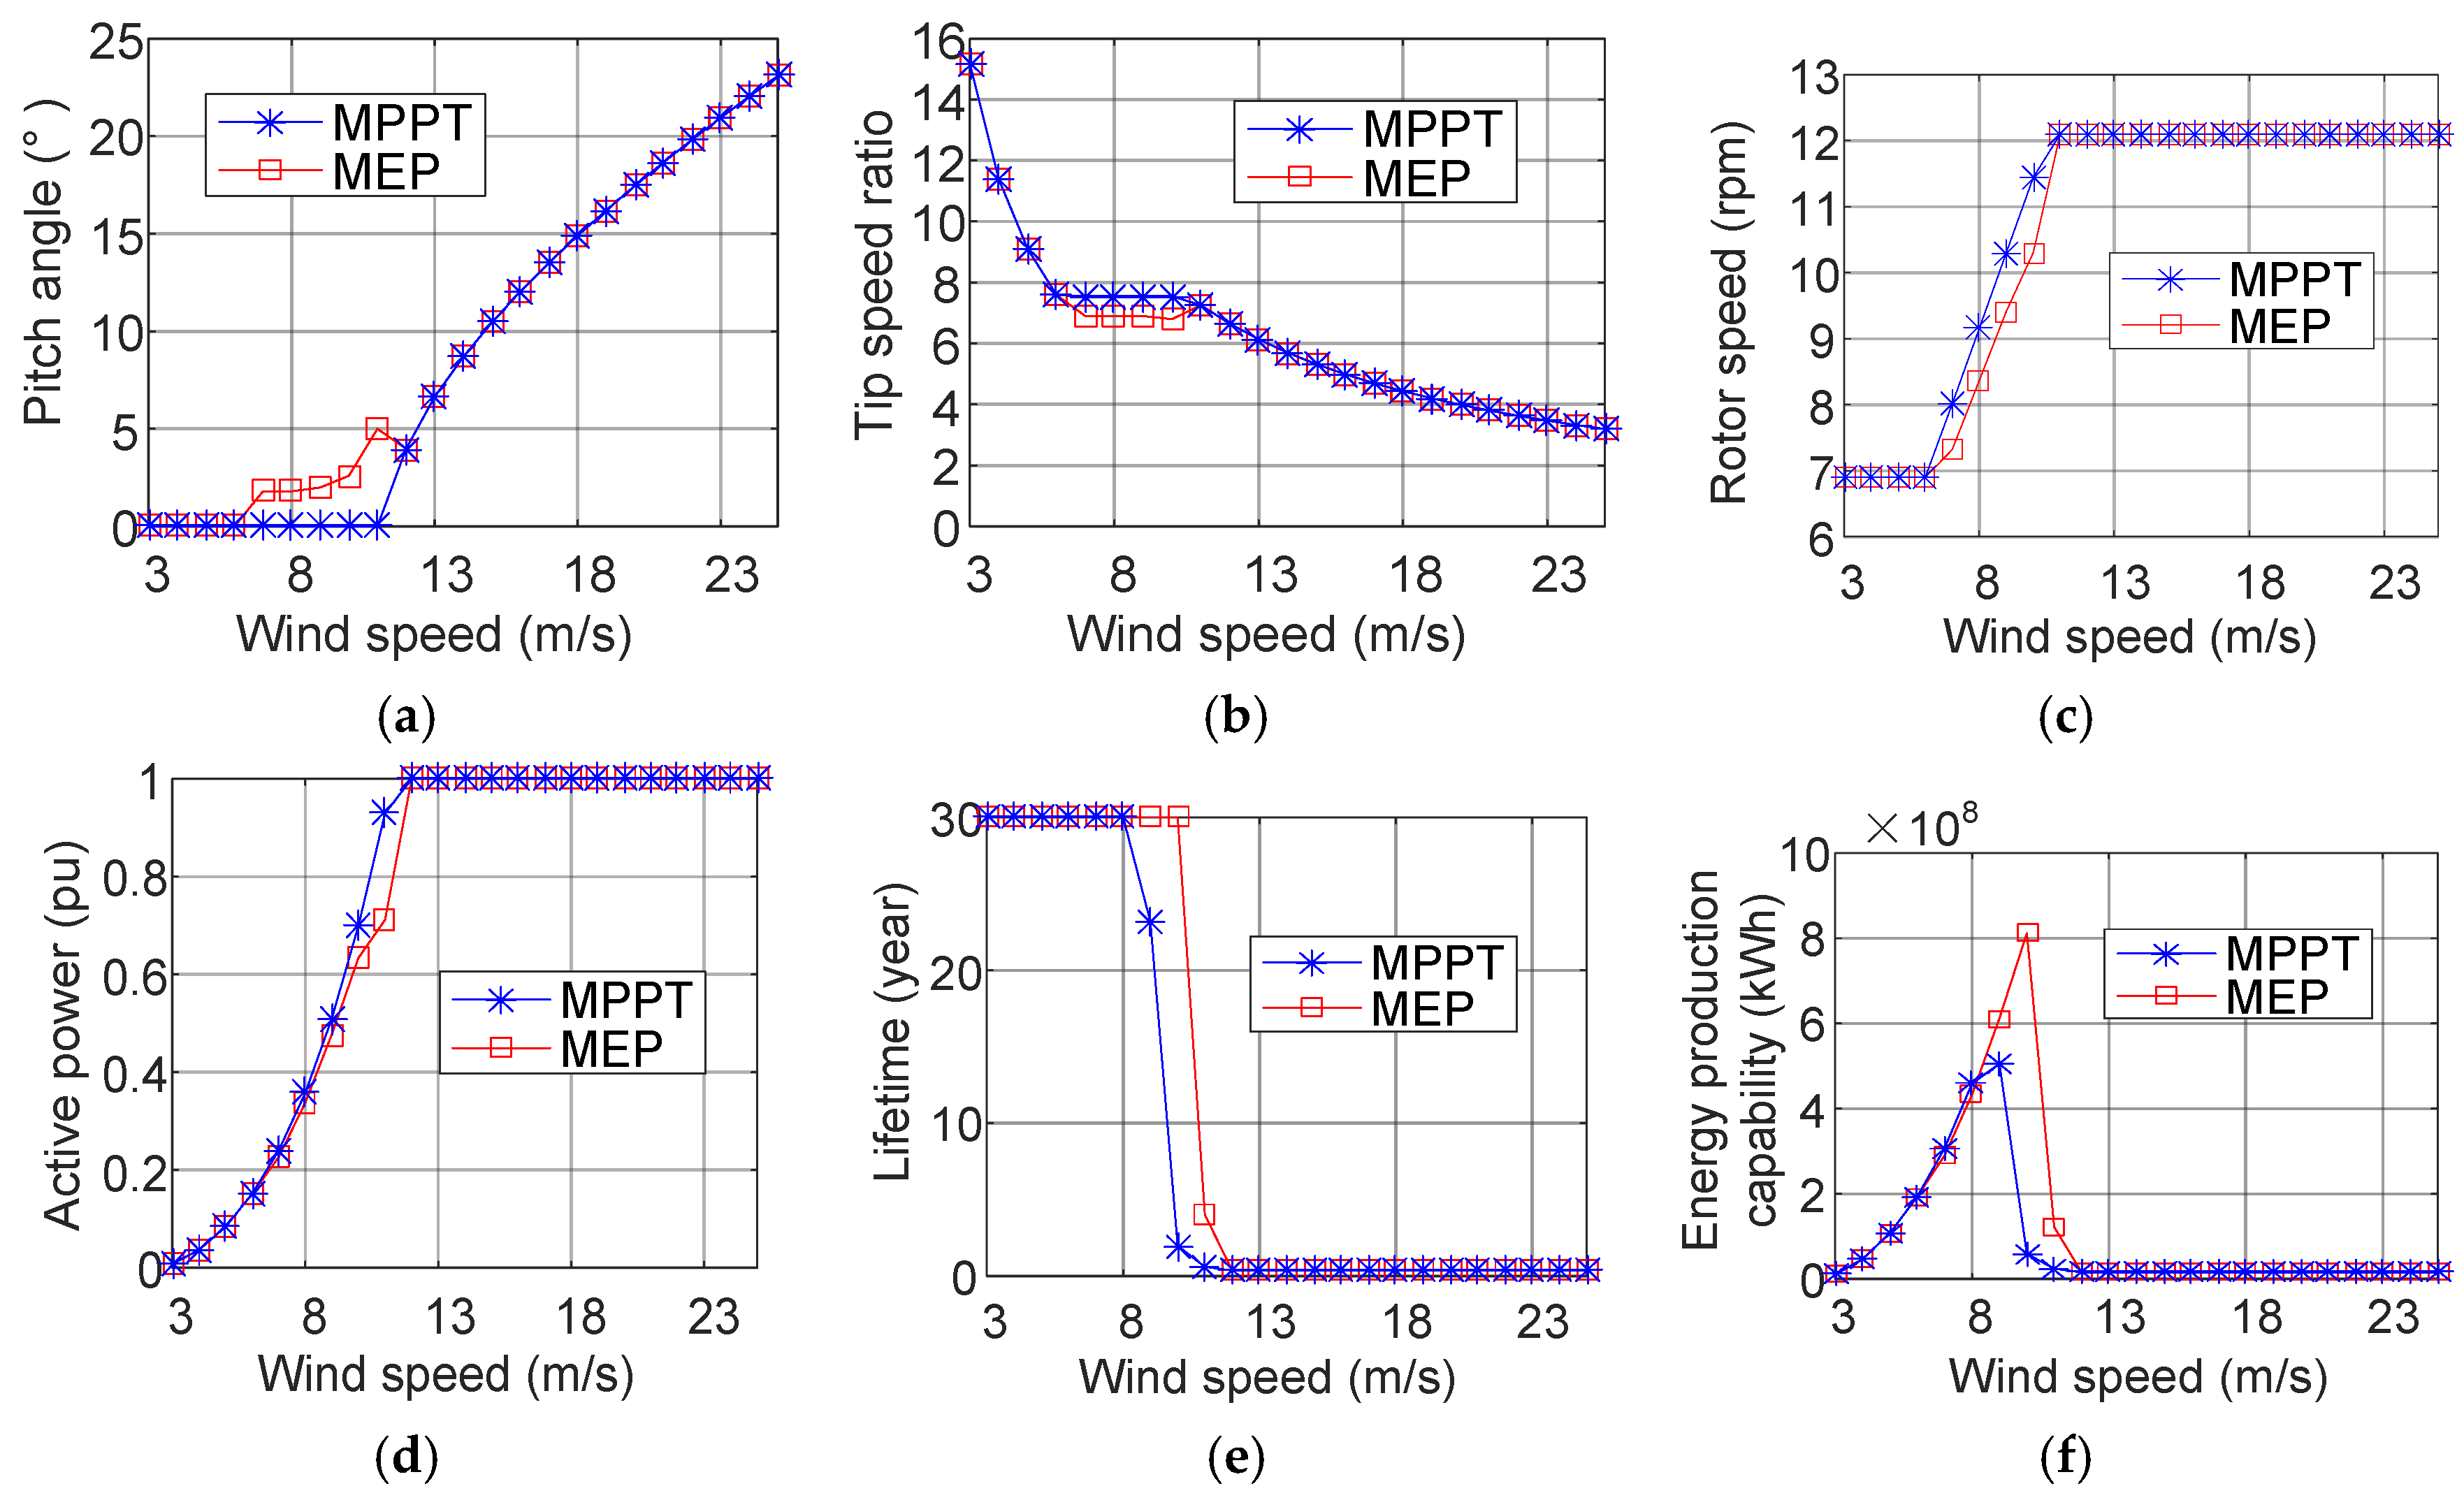
5.3. Optimization of WT1

At constant wind direction of 270° and constant ambient wind speeds over the whole year, with the optimized parameters of WT2 shown in Figure 16, the wind speed of WT2, the maximum energy production of WT2, and the total energy production of the wind farm are shown in Figure 17 at various pitch angles and tip speed ratios of WT1. The optimal pitch angle and tip speed ratio of WT1 at each constant ambient wind speed can be obtained at the maximum energy production of the wind farm. The optimized pitch angle and tip speed ratio, the corresponding rotor speed, the active power, the lifetime, and the maximum energy production capability of WT1 at each constant ambient wind speed are shown in Figure 18.

5.4. Optimized Energy Production of the Wind Farm

With the optimized energy production of WT1 and WT2 as shown in Figure 16f and Figure 18f, the optimized energy production of the wind farm at constant wind direction of 270° and each constant ambient wind speed is shown in Figure 19a. The optimized pitch angle and tip speed ratio of WT1 at other wind directions can be selected with the same method as was performed for the 270° wind direction by changing the wake overlap area, as shown in Figure 3a. With the wind speed and wind direction distribution as shown in Figure 12a and Figure 13a, the energy production of the wind farm at all wind directions and wind speeds are shown in Figure 19b, where the wind speed distribution is assumed to be the same at each wind direction. Compared with the MPPT method, the energy production of WT1, WT2, and the wind farm are all increased by 43.56%, 42.12%, and 42.85%. As described in 5.2, the energy production of a single wind turbine can be increased by selecting the optimal pitch angle and tip speed ratio. Thus, the energy production of the wind farm can be increased regardless of whether the wind directions cause the wake effect in the wind farm or not.

6. Conclusions

The DFIG wind turbine has two degrees of control freedom for active power control, which are the pitch angle and the tip speed ratio. In a wind farm, the pitch angle and the tip speed ratio of the upstream wind turbine also determine the wind speed of the downstream wind turbines considering the wake effect. Compared with the MPPT method, the total active power generation of the wind farm can be increased by optimizing the pitch angle and tip speed ratio of each wind turbine. As a consequence, the annual energy production of the wind farm can be increased. However, since the lifetime of the wind turbine is determined by the pitch angle and tip speed ratio as well, the optimized active power control method can rarely increase the energy production capability of the wind farm across its lifespan, which relates to the active power generation and the lifetime of the wind turbine.
In this paper, based on the B10 lifetime estimation of wind turbines, the optimal pitch angle and tip speed ratio of each wind turbine are selected to maximize the energy production of the wind farm across its lifespan. With the optimized pitch angle and tip speed ratio, the pitch angle curve and the active power curve as the look-up table implemented by the wind turbine controller for active power control can be optimized. Compared with the MPPT method, the energy production of the wind farm can be significantly increased. Moreover, as the energy production can be increased in a single wind turbine, the proposed active power control method can increase the energy production of the wind farm across its lifespan regardless of the wind directions that induce wake effect in the wind farm.

Acknowledgments

The authors would like to thank the Aalborg University and the Sino-Danish Centre for Education and Research for the funding support.

Author Contributions

J.T., D.Z. and F.B. conceived and designed the simulations; J.T. performed the simulations; J.T., D.Z., C.S., F.B. and Z.C. analyzed the data; J.T., D.Z. and C.S. contributed materials tools; J.T. wrote the paper.

Conflicts of Interest

The authors declare no conflict of interest. The founding sponsors had no role in the design of the study; in the collection, analyses, or interpretation of data; in the writing of the manuscript, and in the decision to publish the results.

References

  1. Blaabjerg, F.; Ma, K. Future on power electronics for wind turbine systems. IEEE J. Emerg. Sel. Top. Power Electron. 2013, 1, 139–152. [Google Scholar] [CrossRef]
  2. Chung, H.S.; Wang, H.; Blaabjerg, F.; Pecht, M. Reliability of Power Electronic Converter Systems; Institution of Engineering and Technology: Stevenage, UK, 2015. [Google Scholar]
  3. Zhou, D.; Blaabjerg, F.; Lau, M.; Tonnes, M. Optimized reactive power flow of DFIG power converters for better reliability performance considering grid codes. IEEE Trans. Ind. Electron. 2015, 62, 1552–1562. [Google Scholar] [CrossRef]
  4. Hahn, B.; Durstewitz, M.; Rohrig, K. Reliability of Wind Turbines, Experiences of 15 Years with 1500 WTs. ISET, 2007. Available online: http://renknownet2.iwes.fraunhofer.de/pages/wind_energy/data/2006-02-09Reliability.pdf (accessed on 9 February 2006).
  5. Electronic Components and Systems (ECS) Division. Handbook for Robustness Validation of Automotive Electrical/Electronic Modules; ZVEL: Berlin, Germany, 2008. [Google Scholar]
  6. Hirschmann, D.; Tissen, D.; Schroder, S.; De Doncker, R.W. Inverter design for hybrid electrical vehicles considering mission profiles. In Proceedings of the IEEE Vehicle Power and Propulsion Conference, Chicago, IL, USA, 7–9 September 2005; pp. 1–6.
  7. Busca, C.; Teodorescu, R.; Blaabjerg, F.; Munk-Nielsen, S.; Helle, L.; Abeyasekera, T.; Rodriguez, P. An overview of the reliability prediction related aspects of high power IGBTs in wind power applications. Microelectron. Reliab. 2011, 51, 1903–1907. [Google Scholar] [CrossRef]
  8. Yang, S.; Bryant, A.; Mawby, P.; Xiang, D.; Ran, L.; Tavner, P. An industry-based survey of reliability in power electronic converters. IEEE Trans. Ind. Appl. 2011, 47, 1441–1451. [Google Scholar] [CrossRef]
  9. Richardeau, F.; Pham, T.T.L. Reliability calculation of multilevel converters: Theory and applications. IEEE Trans. Ind. Electron. 2013, 60, 4225–4233. [Google Scholar] [CrossRef]
  10. Behjati, H.; Davoudi, A. Reliability analysis framework for structural redundancy in power semiconductors. IEEE Trans. Ind. Electron. 2013, 60, 4376–4386. [Google Scholar] [CrossRef]
  11. ABB Application Note. Load-Cycling Capability of HiPak IGBT Modules. Available online: https://library.e.abb.com/public/1f4fb71e0af3356883257c8d00443ca1/Load-cycling%20capability%20of%20HiPak_5SYA%202043-04.pdf (accessed on 4 February 2014).
  12. Wintrich, A.; Nicolai, U.; Tursky, W.; Reimann, T. Application Manual Power Semiconductors; ISLE Verlag: Ilmenau, Germany, 2011. [Google Scholar]
  13. Scheuermann, U.; Schmidt, R. A new lifetime model for advanced power modules with sintered chips and optimized Al wire bonds. In Proceedings of the PCIM, Nuremberg, Germany, 14–16 May 2013; pp. 810–813.
  14. Krohn, S.; Morthorst, P.E.; Awerbuch, S. The Economics of Wind Energy Euro. Wind Energy Association (EWEA), Technical Report, Brussels, Belgium, March 2009. Available online: http://www.ewea.org/fileadmin/ewea_documents/documents/publications/reports/Economics_of_Wind_Main_Report_FINAL-lr.pdf (accessed on 16 March 2009).
  15. Barthelmie, R.J.; Folkerts, L.; Larsen, G.C.; Rados, K.; Pryor, S.C.; Frandsen, S.T.; Lange, B.; Schepers, G. Comparison of wake model simulations with offshore wind turbine wake profiles measured by Sodar. J. Atmos. Ocean. Technol. 2006, 23, 888–901. [Google Scholar] [CrossRef]
  16. Gebraad, P.M.O.; Teeuwisse, F.W.; van Wingerden, J.W.; Fleming, P.A.; Ruben, S.D.; Marden, J.R.; Pao, L.Y. Wind plant power optimization through yaw control using a parametric model for wake effects—A CFD simulation study. Wind Energy 2014, 19, 95–114. [Google Scholar] [CrossRef]
  17. Serrano González, J.; Burgos Payán, M.; Riquelme Santos, J.; González Rodríguez, Á.G. Maximizing the overall production of wind farms by setting the individual operating point of wind turbines. Renew. Energy 2015, 80, 219–229. [Google Scholar] [CrossRef]
  18. Barthelmie, R.J.; Hansen, K.; Frandsen, S.T.; Rathmann, O.; Schepers, J.G.; Schlez, W.; Phillips, J.; Rados, K.; Zervos, A.; Politis, E.S.; et al. Chaviaropoulos, Modelling and measuring flow and wind turbine wakes in large wind farms offshore. Wind Energy 2009, 12, 431–444. [Google Scholar] [CrossRef]
  19. Duckworth, A.; Barthelmie, R.J. Investigation and validation of wind turbine wake models. Wind Eng. 2008, 32, 459–475. [Google Scholar] [CrossRef]
  20. Tian, J.; Su, C.; Soltani, M.; Chen, Z. Active power dispatch method for a wind farm central controller considering wake effect. In Proceedings of the IECON 2014—40th Annual Conference of the IEEE Industrial Electronics Society, Dallas, TX, USA, 30 October–1 November 2014; pp. 5450–5456.
  21. Marden, J.R.; Ruben, S.D.; Pao, L.Y. A model-free approach to wind farm control using game theoretic methods. IEEE Trans. Control Syst. Technol. 2013, 21, 1207–1214. [Google Scholar] [CrossRef]
  22. Gebraad, P.M.O.; Dam, F.C.; Wingerden, J.W. A model-free distributed approach for wind plant control. In Proceedings of the 2013 American Control Conference, Washington, DC, USA, 17–19 June 2013; pp. 628–633.
  23. Duong, M.Q.; Grimaccia, F.; Leva, S.; Mussetta, M.; Ogliari, E. Pitch angle control using hybrid controller for all operating regions of SCIG wind turbine system. Renew. Energy 2014, 70, 197–203. [Google Scholar] [CrossRef]
  24. Duong, M.Q.; Grimaccia, F.; Leva, S.; Mussetta, M.; Le, K.H. Improving transient stability in a gride-connected squirrel-cage induction generator wind turbine system using a fuzzy logic controller. Energies 2015, 8, 6328–6349. [Google Scholar] [CrossRef] [Green Version]
  25. Shariatpanah, H.; Fadaeinedjad, R.; Rashidinejad, M. A new model for PMSG-based wind turbine with Yaw control. IEEE Trans. Energy Convers. 2013, 28, 929–937. [Google Scholar] [CrossRef]
  26. Wu, B.; Lang, Y.; Zargari, N.; Kouro, S. Power Conversion and Control of Wind Energy Systems; Wiley: Seoul, Korea, 2011; pp. 34–35. [Google Scholar]
  27. Muyeen, S.M.; Takahashi, R.; Murata, T.; Tamura, J. A variable speed wind turbine control strategy to meet wind farm grid code requirements. IEEE Trans. Power Syst. 2010, 25, 331–340. [Google Scholar] [CrossRef]
  28. Jonkman, J.; Butterfield, S.; Musial, W.; Scott, G. Definition of a 5-MW Reference Wind Turbine for Offshore System Development; Technical Report NREL/TP-500-38060; National Renewable Energy Laboratory: Golden, CO, USA, 2009. [Google Scholar]
  29. Katic, I.; Højstrup, D.; Jensen, N.O. A sample model for cluster efficiency. In Proceedings of the European Wind Energy Association Conference, Rome, Italy, 7–9 October 1986; pp. 407–410.
  30. Jensen, N.O. A Note on Wind Generator Interaction; Technical Report Risø-M-2411; Risø National Laboratory: Roskilde, Denmark, 1984. [Google Scholar]
  31. Mortensen, N.G.; Heathfield, D.N.; Myllerup, L.; Landberg, L.; Rathmann, O. Wind Atlas Analysis and Application Program: WAsP 8 Help Facility; Risø National Laboratory: Roskilde, Denmark, 2005. [Google Scholar]
  32. Tian, J.; Zhou, D.; Su, C.; Chen, Z.; Blaabjerg, F. Reactive Power Dispatch Method in Wind Farms to Improve the Lifetime of Power Converter Considering Wake Effect. IEEE Trans. Sustain. Energy 2016. [Google Scholar] [CrossRef]
  33. Tian, J.; Su, C.; Chen, Z. Reactive Power Capability of the Wind Turbine with Doubly Fed Induction Generator. In Proceedings of the 39th IEEE Industrial Electronics Society Conference, Vienna, Austria, 10–13 November 2013; pp. 5310–5315.
  34. Zhou, D.; Blaabjerg, F.; Franke, T.; Tonnes, M.; Lau, M. Comparison of wind power converter reliability with low-speed and medium-speed permanent-magnet synchronous generators. IEEE Trans. Ind. Electron. 2015, 62, 6575–6584. [Google Scholar] [CrossRef]
  35. Amro, R.; Lutz, J.; Lindemann, A. Power cycling with high temperature swing of discrete components based on different technologies. In Proceedings of the PESC, Aachen, Germany, 20–26 June 2004; pp. 2593–2598.
  36. Yildirim, H.C.; Marquis, G.; Barsoum, Z. Fatigue assessment of high frequency mechanical impact (HFMI)-improved fillet welds by local approaches. Int. J. Fatigue 2013, 52, 57–67. [Google Scholar] [CrossRef]
Figure 1. Configuration of a Doubly-Fed Induction Generator (DFIG) wind turbine including power converter and controller. RSC, Rotor-Side Converter; GSC, Grid-Side Converter.
Applsci 07 00065 g001
Figure 2. NREL DFIG 5 MW wind turbine with: (a) power coefficient in respect to pitch angle and tip speed ratio; (b) active power, pitch angel, tip speed ratio, and rotor speed in respect to the wind speed with Maximum Power Point Tracking (MPPT) control.
Applsci 07 00065 g002
Figure 3. (a) Speed relationship between the upstream (v1) and downstream wind turbine (v2) in Katic wake model; (b) thrust coefficient of the NREL 5 MW wind turbine.
Applsci 07 00065 g003
Figure 4. Flow chart to estimate the lifetime of rotor-side converter from wind speed v to accumulated annual damage (AD) in the wind turbine.
Applsci 07 00065 g004
Figure 5. Layout of the wind farm with two NREL 5 MW wind turbines.
Applsci 07 00065 g005
Figure 6. Comparison between WT1 operating at the tip speed ratio of 7.55 and 6.5, at the wind direction of 270° and ambient wind speed of 9 m/s: (a) the active power of WT1, where the base value is 5 MW; (b) the wind speed of WT2; (c) the active power of WT2, where the base value is 5 MW; (d) the total active power of the wind farm, where the base value is 10 MW.
Applsci 07 00065 g006
Figure 7. Comparison of the tip speed ratio, rotor speed and active power of WT1 between the MPPT method and the Maximum Power Generation (MPG) method at 270° wind direction.
Applsci 07 00065 g007
Figure 8. Total active power of the wind farm in terms of the pitch angle and tip speed ratio of WT1 at 270° wind direction and 9 m/s ambient wind speed.
Applsci 07 00065 g008
Figure 9. Comparison between the MPPT control and MPG control at the wind direction of 270°: (a) pitch angle, tip speed ratio, rotor speed, and active power of WT1; (b) active power of WT1, active power of WT2, and the total active power of the wind farm.
Applsci 07 00065 g009
Figure 10. Active power generation of WT1 and the whole wind farm at various wind directions: (a) pitch angle, tip speed ratio, rotor speed, and active power of WT1; (b) comparison of the total active power of the wind farm between the MPPT and the MPG control.
Applsci 07 00065 g010
Figure 11. Comparison of: (a) B10 Lifetime of power converter; (b) energy production of each turbine between the MPPT method and the MPG method at the wind direction of 270°.
Applsci 07 00065 g011
Figure 12. Energy production comparison between the MPPT method and the MPG method at the constant wind direction of 270°: (a) Field wind speed distribution; (b) Energy production of the wind farm at each ambient wind speed; (c) Total energy production of the wind farm at all ambient wind speeds.
Applsci 07 00065 g012
Figure 13. Energy production comparison between the MPPT method and the MPG method considering the field wind direction: (a) Wind direction distribution; (b) Energy production of the wind farm at typical wind directions of 270°, 276° and 282°; (c) Total energy production of the wind farm.
Applsci 07 00065 g013
Figure 14. Flow chart to obtain the optimal pitch angle and tip speed ratio in the wind farm with two turbines.
Applsci 07 00065 g014
Figure 15. The active power, lifetime, and energy production in terms of the pitch angle and tip speed ratio at the wind speed of: (a) 7 m/s; (b) 9 m/s; (c) 11 m/s.
Applsci 07 00065 g015
Figure 16. At constant wind direction of 270° and constant wind speed across the whole year, comparison between the MPPT method and the MPG method of: (a) pitch angle; (b) tip speed ratio; (c) rotor speed; (d) active power; (e) lifetime; (f) energy production capability of WT2.
Applsci 07 00065 g016aApplsci 07 00065 g016b
Figure 17. Wind speed of WT2, maximum energy production of WT2, and total active power generation of WT1 and WT2 in terms of the pitch angle and tip speed ratio of WT1 at wind direction of 270° and at the ambient wind speed of: (a) 7 m/s; (b) 9 m/s; (c) 11 m/s.
Applsci 07 00065 g017aApplsci 07 00065 g017b
Figure 18. At the wind direction of 270°, comparison between the MPPT method and the proposed MEP method of: (a) pitch angle; (b) tip speed ratio; (c) rotor speed; (d) active power; (e) lifetime; (f) energy production capability of WT1.
Applsci 07 00065 g018
Figure 19. Comparison of: (a) energy production of the wind farm at constant wind direction of 270° without wind speed and direction distribution; (b) comparison of the energy production of WT1, WT2, and the wind farm at the real wind speed and direction distribution between the MPPT method and the proposed MEP method.
Applsci 07 00065 g019
Table 1. Parameters of NREL 5 MW wind turbine [28].
ParameterValue
Rated Power5 MW
Rotor Diameter126 m
Cut-in, Rated, Cut-out Wind Speed3 m/s, 11.4 m/s, 25 m/s
Min. and Max. Rotor Speed6.9 rpm, 12.1 rpm
Gearbox Ratio97:1
Number of Pole-pairs3
Synchronous Frequency50 Hz
Electrical Generator Efficiency94.4%

