Article

Tribological Properties of Aluminum Nanoparticles as Additives in an Aqueous Glycerol Solution

Department of Mechanical Engineering, National Kaohsiung University of Applied Sciences, 415 Jiangong Rd., Sanmin District, Kaohsiung 80778, Taiwan
*
Author to whom correspondence should be addressed.
Appl. Sci. 2017, 7(1), 80; https://doi.org/10.3390/app7010080
Submission received: 13 October 2016 / Revised: 30 December 2016 / Accepted: 9 January 2017 / Published: 13 January 2017

Abstract

:
The object of this research is to investigate the tribological properties of glycerol lubricant with aluminum nanoparticles as an additive and sodium dodecyl sulfate (SDS) as the dispersive medium for iron to iron friction using a thrust collar tribotester. Meanwhile, the effects of different concentrations of aluminum nanoparticles, SDS, and deionized water in glycerol on tribology properties of iron to iron friction were studied. The experimental parameters were set up according to the Taguchi technique, their influence on the coefficient of friction (COF) and wear rate were examined by response surface methodology (RSM) and analysis of variance (ANOVA) methods. The analysis results were employed to optimize the parameters to obtain the best lubricant effects. The optimal combination of the parameters for both minimum COF and wear rate was found to be 0.6667 weight percent (wt %) of aluminum nanoparticles, 2 wt % of SDS, and 10 wt % of deionized water content of glycerol. The wear surface topography and the average roughness of the surface were also examined using a scanning electron microscope (SEM) and a Mitutoyo Surftest SJ-400 instrument. The results show that aluminum nanoparticles used as an additive in lubricant reduce the surface roughness of a collar remarkably. The energy dispersive spectrometer (EDS) was utilized to confirm the deposition of aluminum nanoparticles on the collar surface leading to decreased friction and wear.

1. Introduction

In the search of green lubricant, vegetable oil and glycerol were considered as the replacement for traditional mineral oil. Vegetable oil and glycerol are both environmental friendly lubricants, however, the thermal stability and flow properties of glycerol are better than vegetable oil. Glycerol based oil has been used as industrial lubricant, for example, the lubricant branded biolube GLY produced by Molylub of Germany is used in food processing machinery. The glycerol product branded Glycerin of P&G Co. (Cincinnati, OH, USA) is also used as a lubricant in the manufacturing of paper.
A glycerol based solution for use as a lubricant for plug valves was reported in March’s [1] patent. In their invention, 78 wt %–89 wt % of glycerol was used as the base oil and has the effect of preventing the corrosion of underlying metal. Hefner’s invention [2] of glycerol triether compounds were excellent lubricants for dissolution in internal combustion engine fuels, especially spark ignition engine fuels. Kyllönen [3] formulated a lubricant that consists of glycerol, water, carboxymethyl cellulose, and sodium polyphosphate. The lubricant is used as a transport chain lubricant for the food industry, steel industry, and car industry.
In recent years, researchers have pointed out the numerous advantages of adding nanoparticles to lubricant oil. With its miniscule size, nanoparticles can easily mix with the lubricant oil to enhance its lubricating properties. The nanoparticles added to the lubricant oil help in preventing corrosion, reducing friction, and modifying the viscosity of the oil. Numerous articles have shown the effectiveness of adding nanoparticles to lubricants. Peña-Parás et al. [4] compared the influence of two kinds of nanoparticles as additives on GL-4 fully-formulated oil and poly-alpha olefin 8 base oil. Their experimental results showed that CuO additives had better effects on tribological behavior than Al2O3 nanoparticles in two types of synthetic oils. With 2 wt % CuO concentration dispersed in PAO 8, the wear scar diameter reduced by 14% and the coefficient of friction reduced by 18%. Research studies [5,6] tested the tribological behavior of ZnO/Al2O3 composite nanoparticles as additives to the lubricant. Their results showed that when added to lubricant the composite nanoparticles reduced friction and wear better than pure ZnO and Al2O3. Gu et al. [7] synthesized and modified the surface of TiO2 nanoparticles with a double-coated agent. The concentration of nanoparticles ranged from 0.1 vt % to 1.6 vt % in a water-based medium. Their experimental results showed that the TiO2-modified nanoparticles could increase the applicable load, reduce the friction force, and increase the anti-wear capacity of pure water.
Chang et al. [8] added 25 nm TiO2 nanoparticles into a base oil. Their experiments using lubricant with 0.01 wt % TiO2 nanoparticle additives showed significant reduction in coefficient of friction (COF) and wear rate in comparison to using a pure base oil lubricant. Zin et al. [9] investigated the tribology behavior of Pegasus 1005 oil with carbon nano-horns, TiO2, and Cu nanoparticle additives. Their results showed that the friction reduction of engine oil containing Cu nanoparticles of 130 nm was more effective than the engine oil containing 50 nm nanoparticles. The COF of carbon nano-horns additives decreased by 12% when compared with raw oil, while the effect on the coefficient of friction with TiO2 nanoparticles was negligible.
Zhang et al. [10] synthesized copper nanoparticles and added them into paraffin oil to investigate their tribological performance. Their results showed that Cu nanoparticles of size 2–5 nm, when modified with oleic acid and oleylamine, reduced the COF of steel pair and displayed excellent thermal stability. The mechanisms of the decreased friction and inhibition of wear due to the nanoparticles in lubricant through colloidal effect, rolling effect, protective film effect, and the third body were presented in several previous studies [11,12,13,14].
The ANOVA technique and Taguchi robust design method were used to investigate the effect of parameters, such as the nanoparticle additive concentration, the applied load, temperature, and speed to the tribology behavior of lubricant. Peng et al. [15] employed the Taguchi technique to determine the optimal aluminum nanoparticles size in oleic acid and ethanol. Their results revealed that the optimal nanoparticles size is 65 nm. Thakre et al. [16,17] added three kinds of Al2O3 nanoparticle sizes with different concentrations to regular engine oil to evaluate their tribological properties. L18 orthogonal array and ANOVA analysis were used to determine the optimum COF. The analysis results showed that the minimum coefficient of friction was obtained with 0.8 wt % of medium nanoparticles size (60 nm) and 160 N apply force at 1200 rpm rotational speed.
Koshy et al. [18] enhanced the stabilization properties of MoS2 nanoparticles in oil by mixing in a sodium dodecyl sulfate surfactant. The ANOVA analysis method was adopted by the authors to investigate the effect of surfactant-modified MoS2 nanoparticles as additives on the thermal-physical properties as well as the tribological behavior.
Studies of glycerol used as lubricant have demonstrated that it has the potential to reduce friction and wear. Shi et al. [19] studied the viscosity of glycerol solution and its lubrication characteristics and found they are better than rapeseed oil, particularly when the water content is less than 20 wt %. Zhou et al. [20] investigated the effect of temperature and water content in glycerol in respect of friction and wear behavior using a Si3N4 ball on a disc tribo-tester. They found that the wear was intensified with an increase in temperature, and at 30 °C, the amount of wear was less than when the concentration of glycerol was higher. Yan et al. [21] showed that when the ethylene glycol concentration is larger than 10% in lubricant solution, it exhibits good tribological properties in the sliding bearings of self-mated Si3N4 balls.
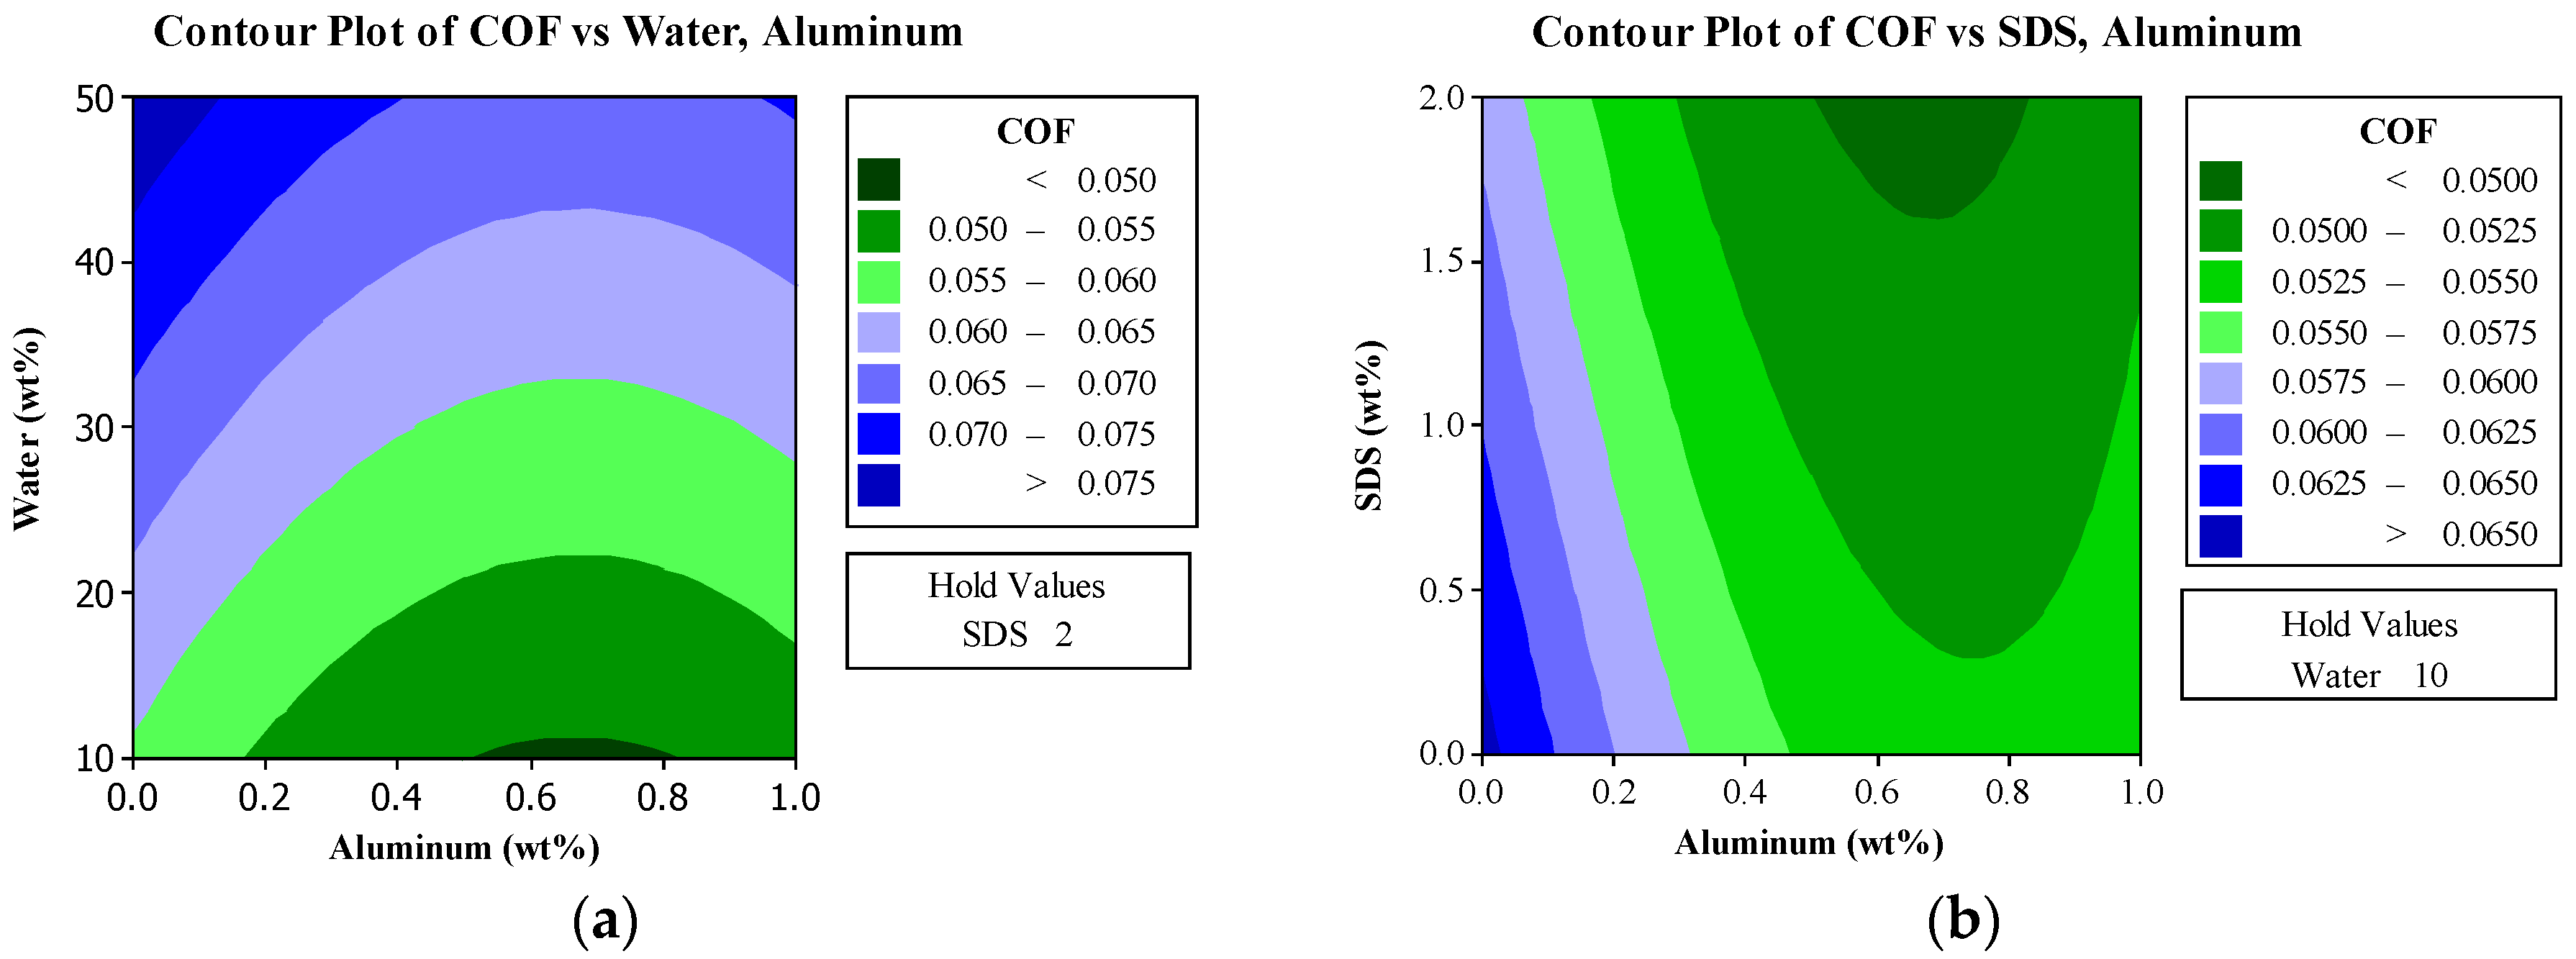
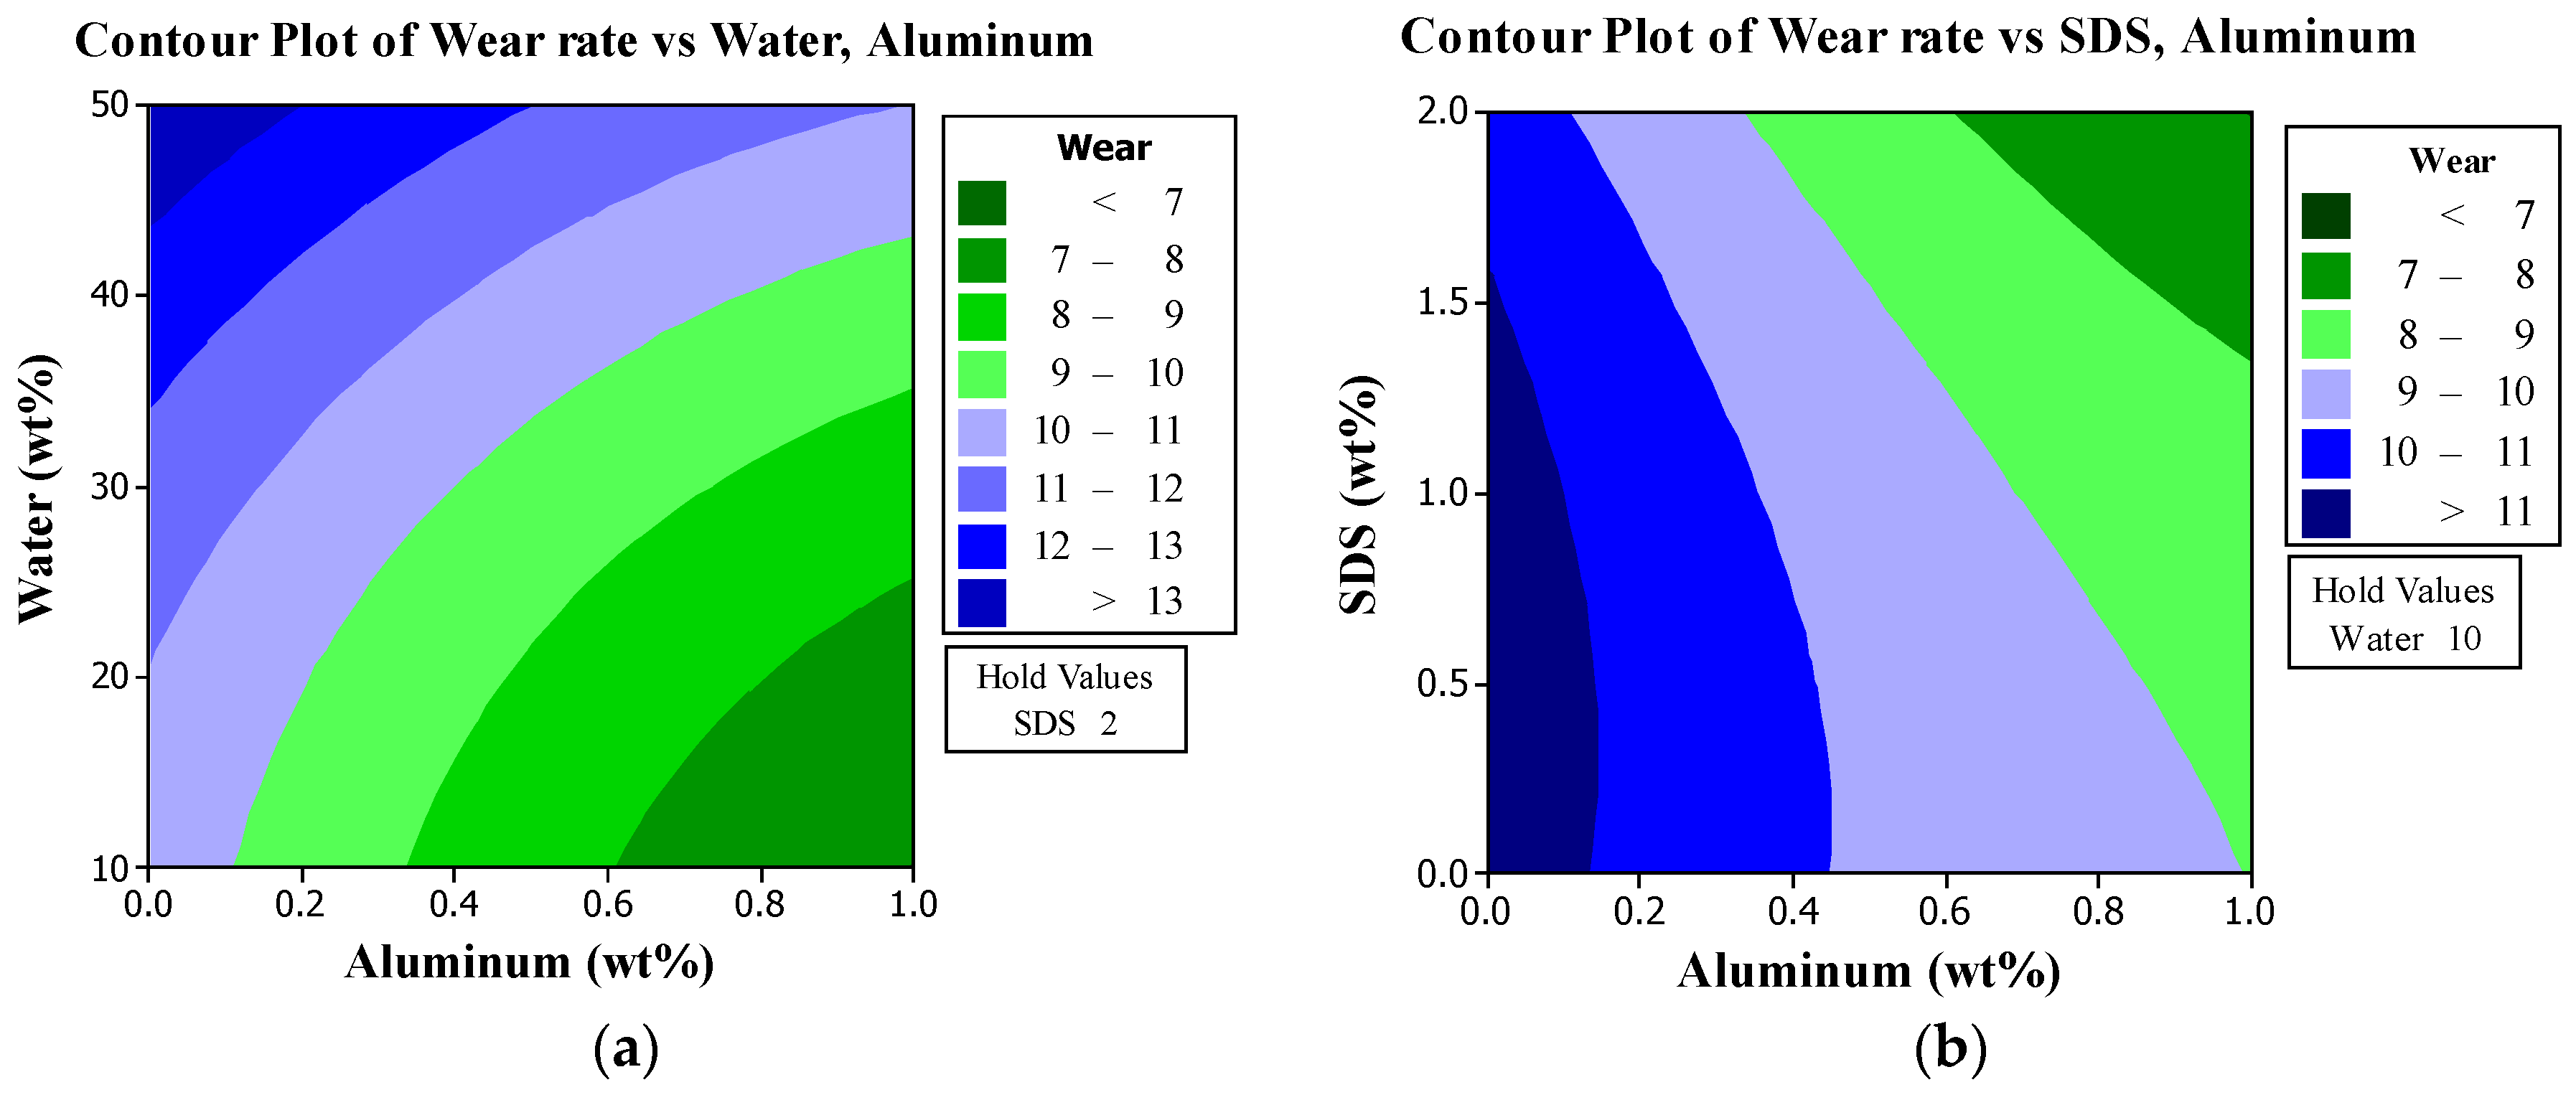
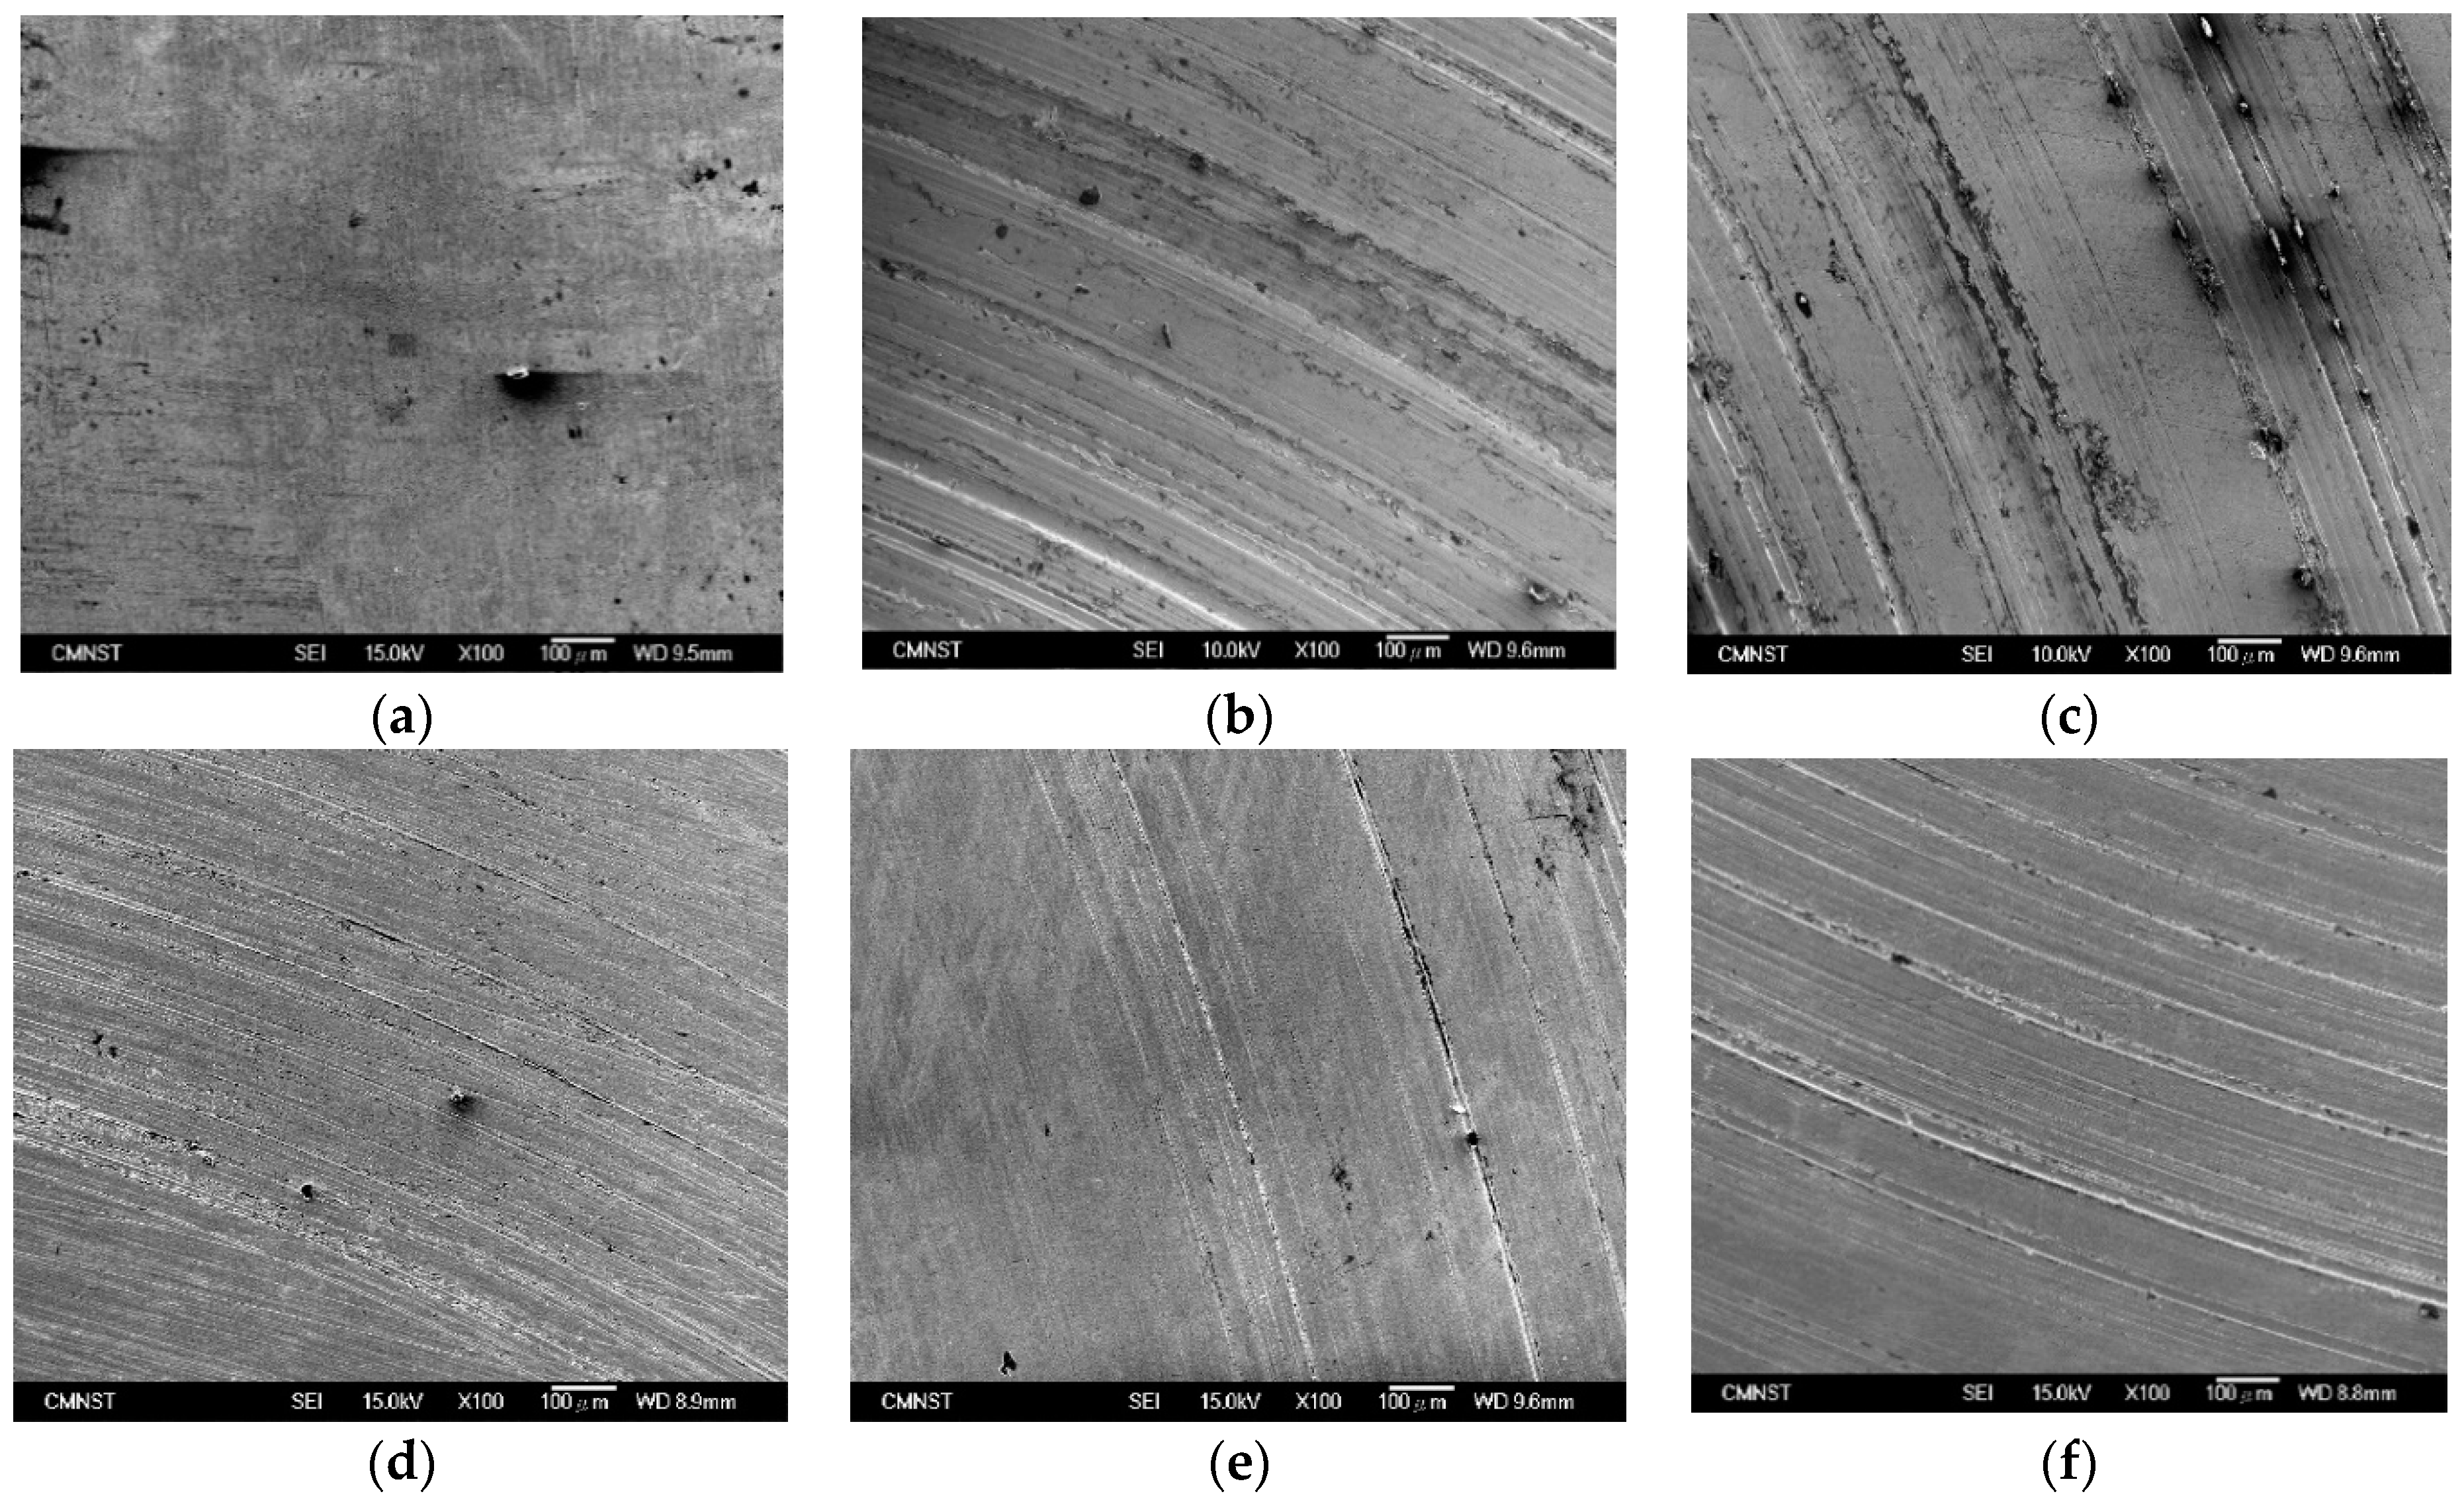
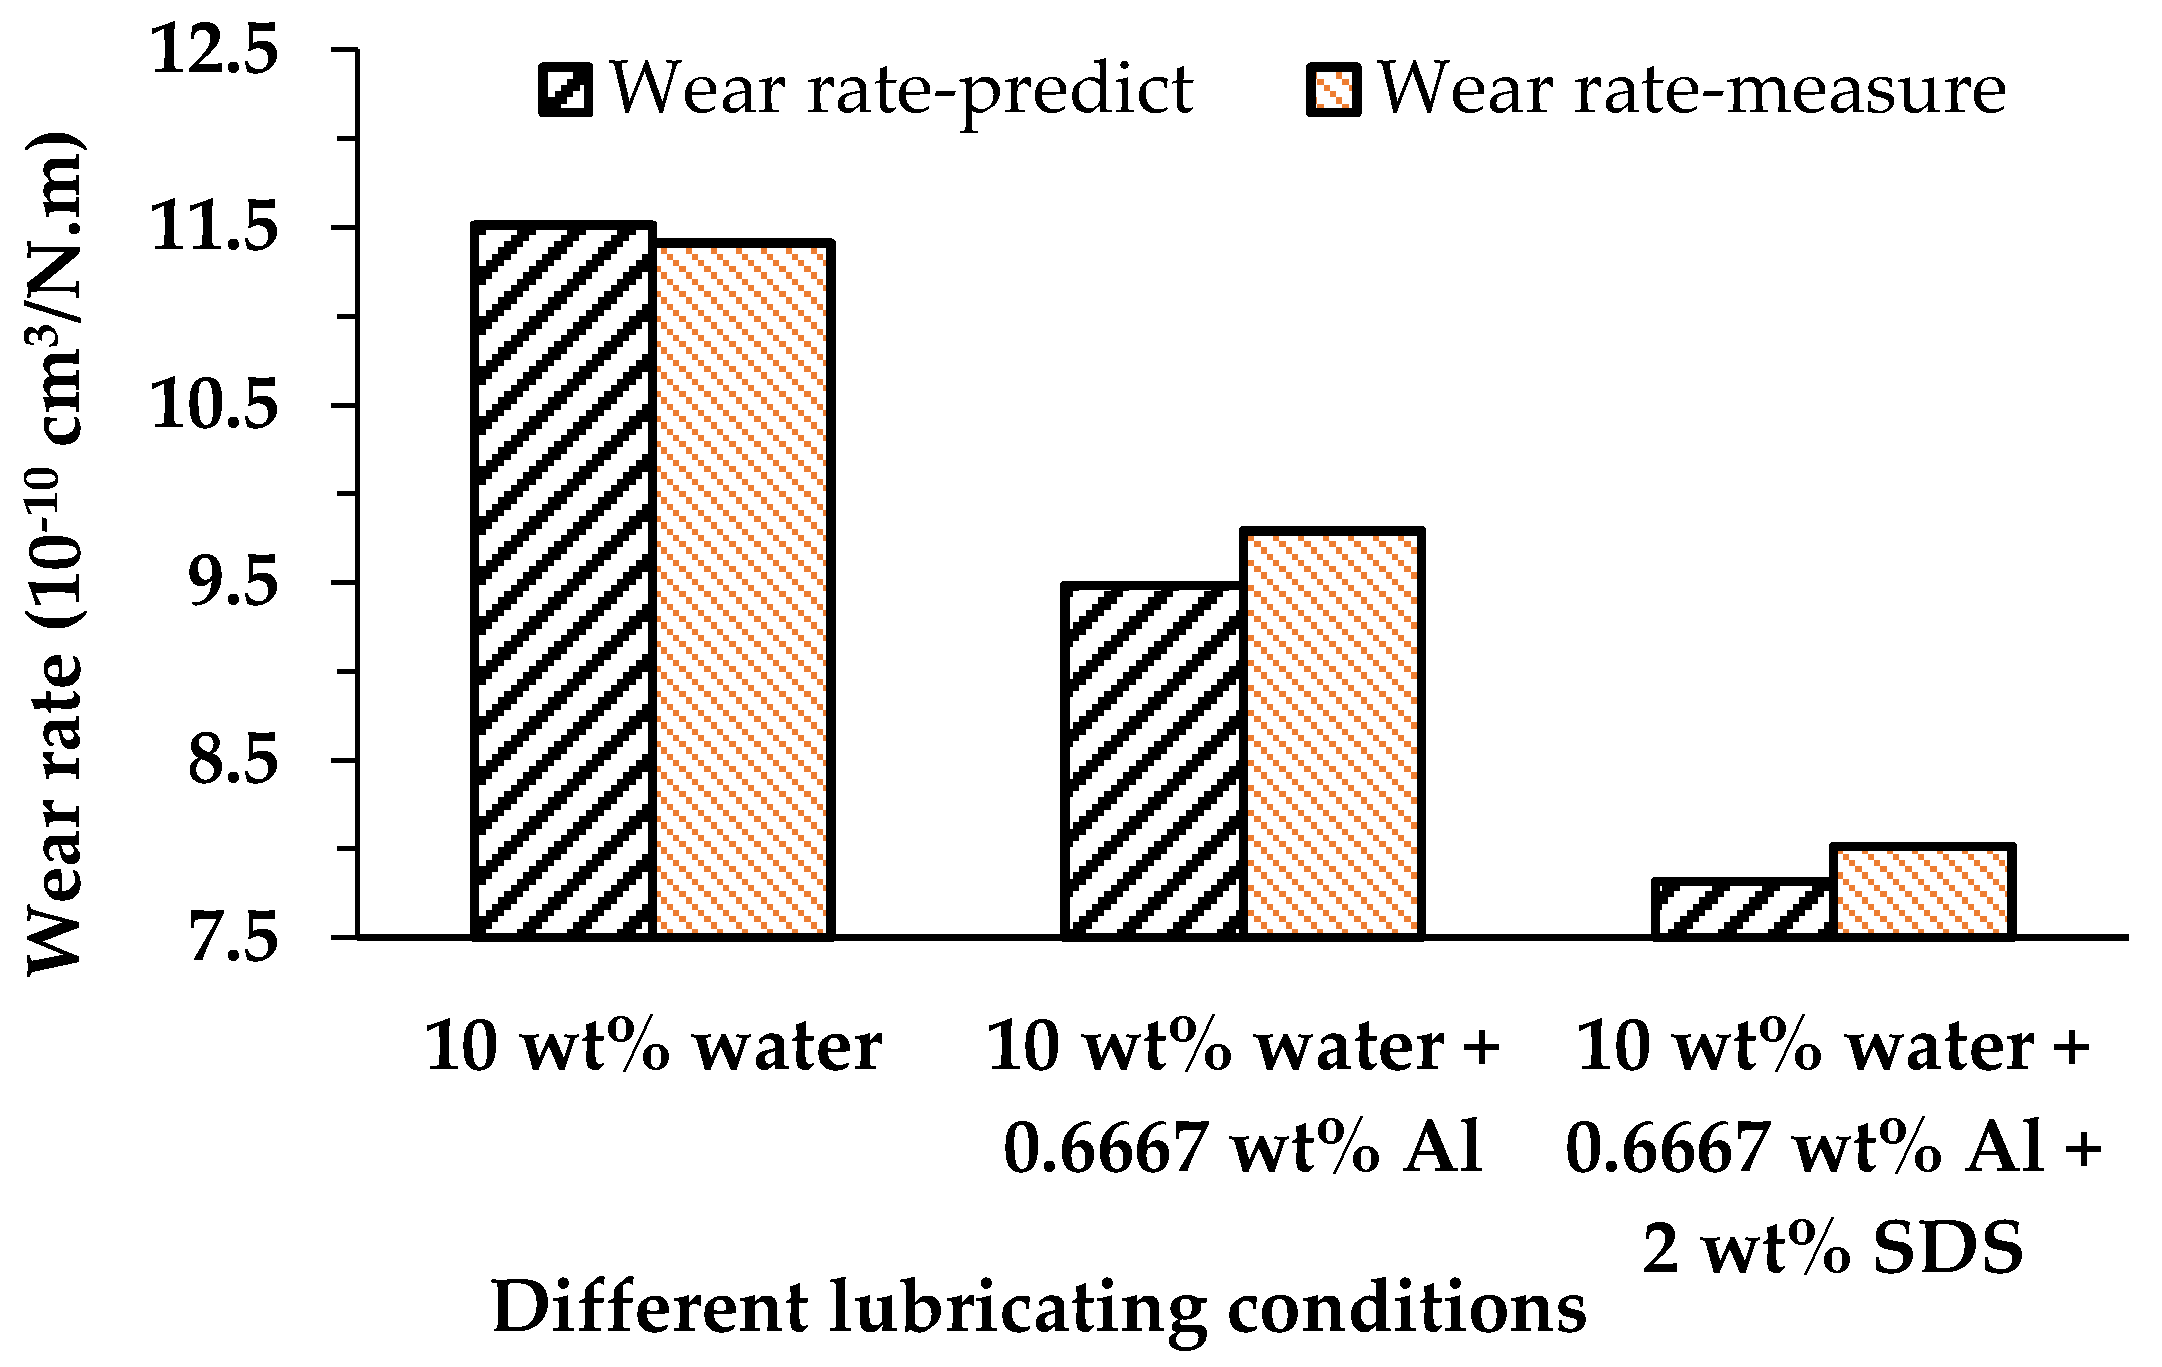
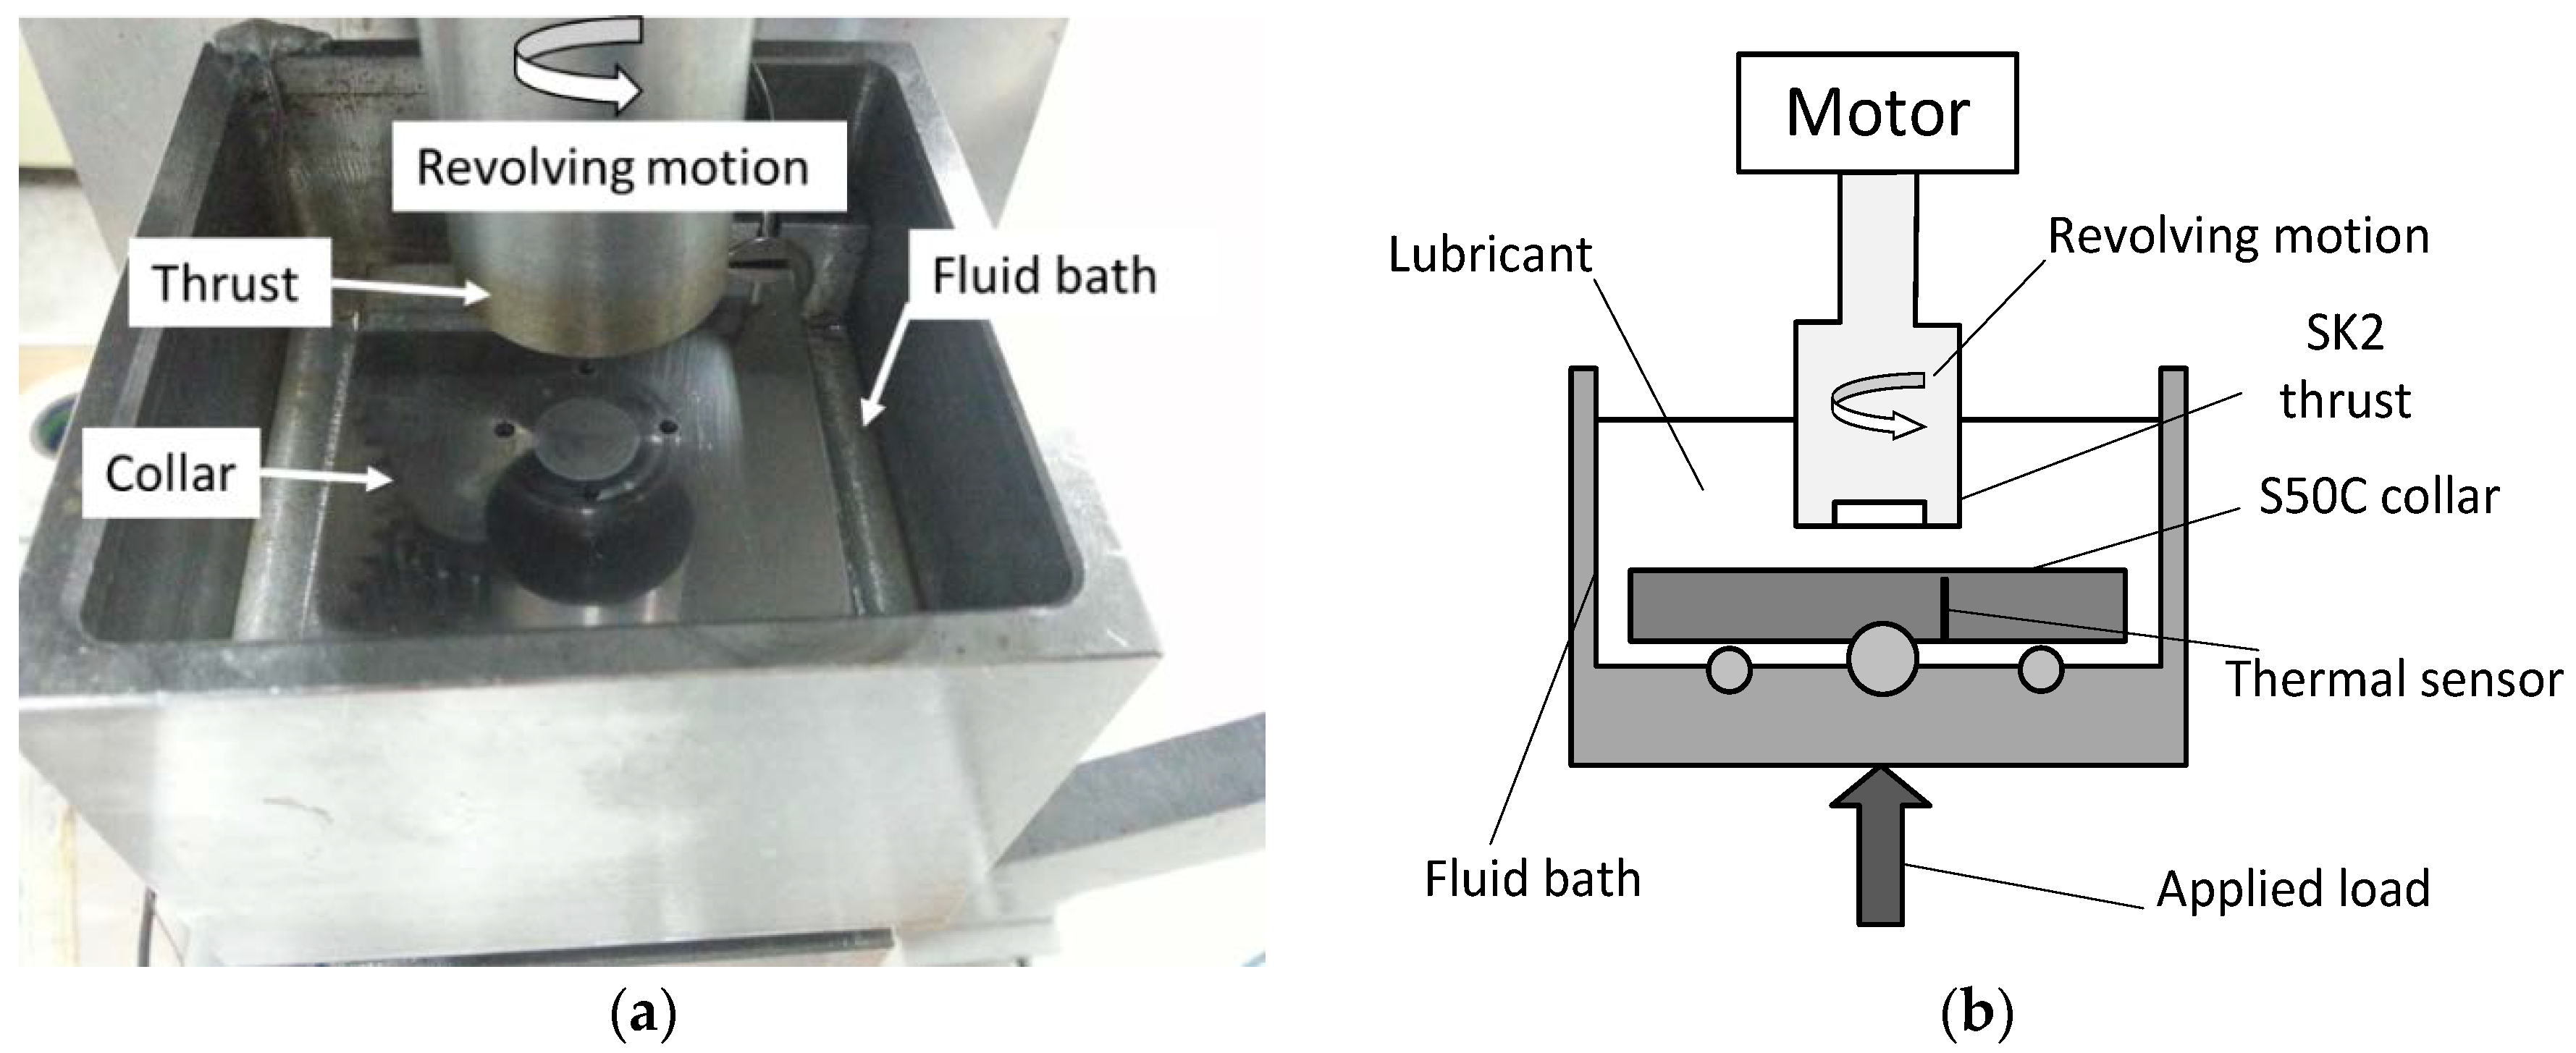
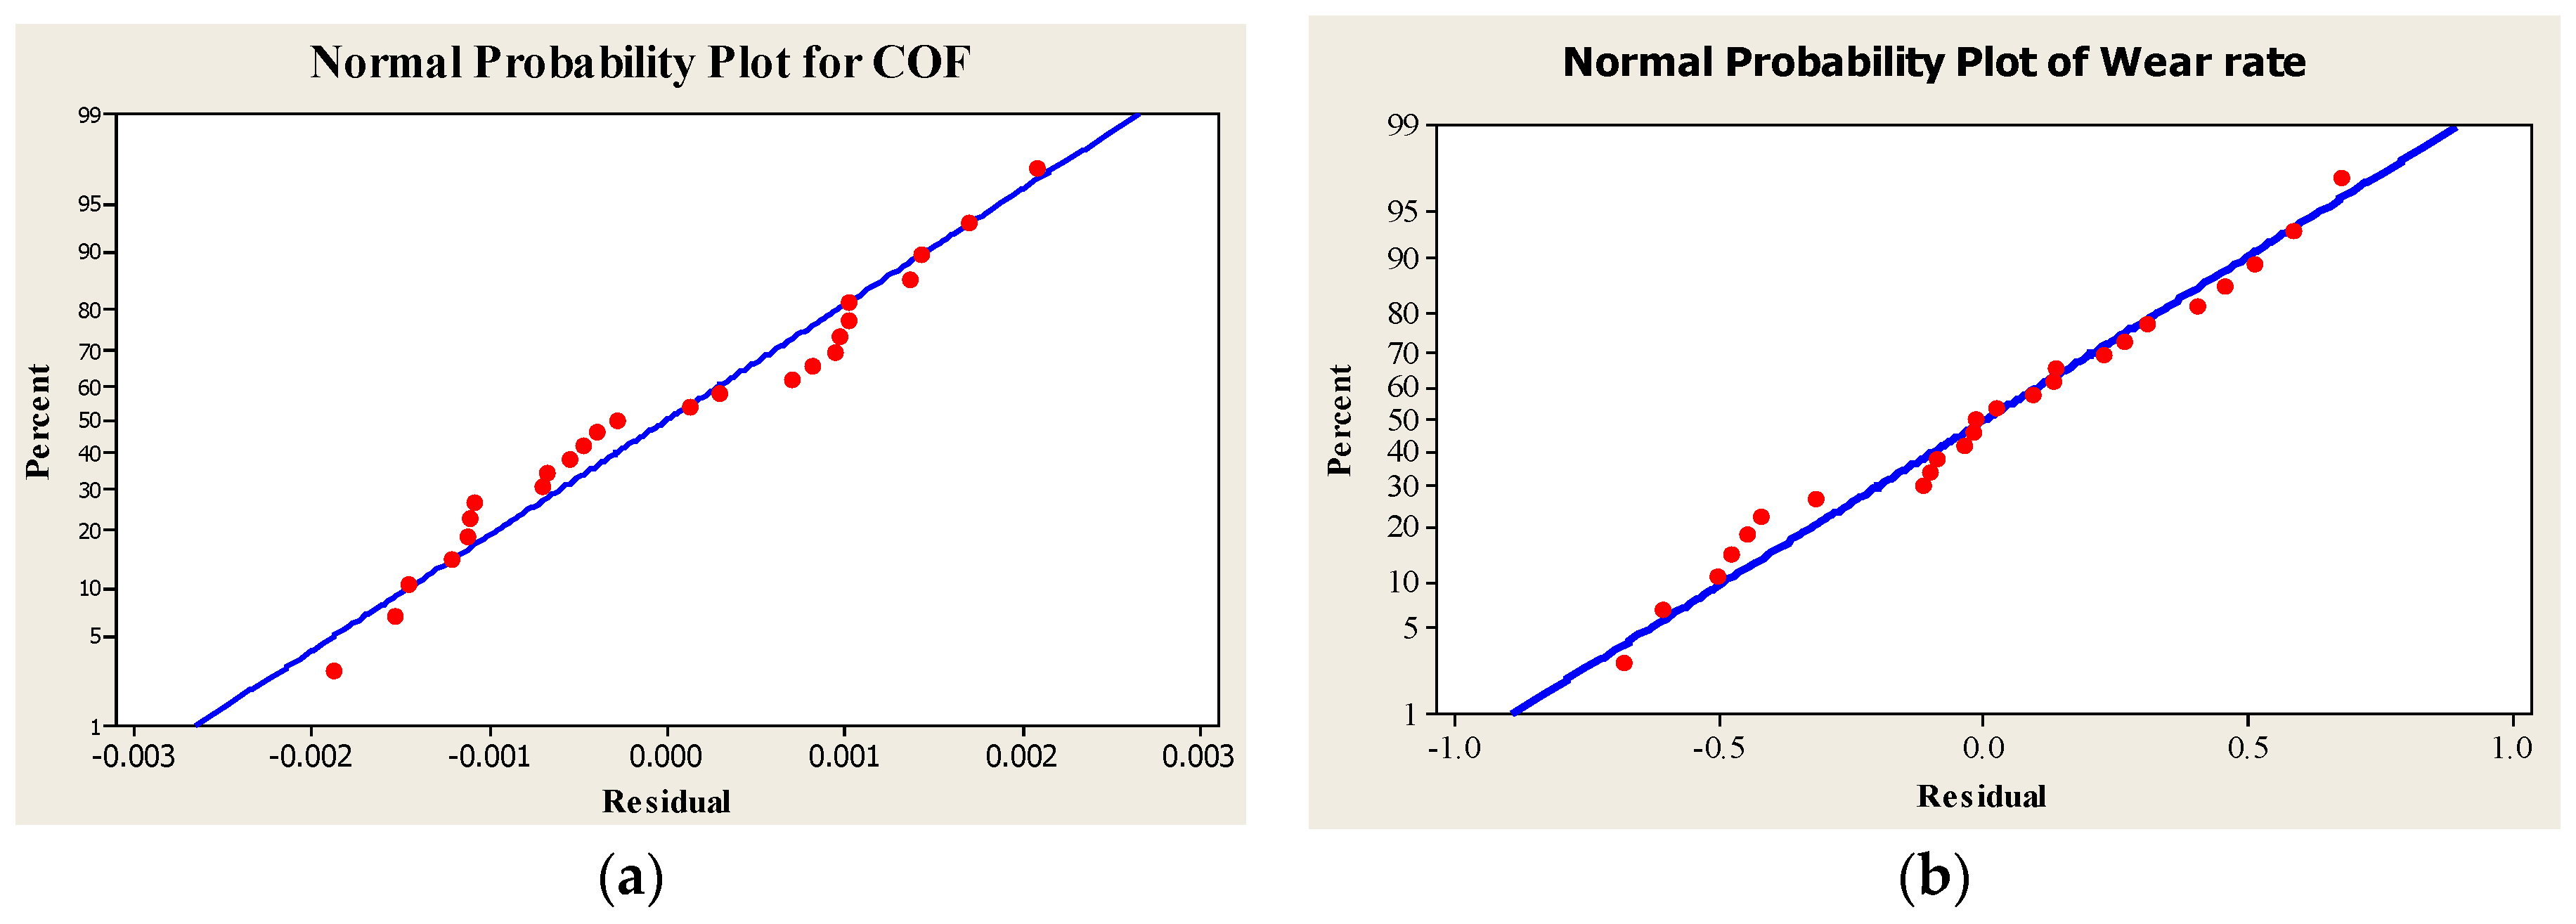
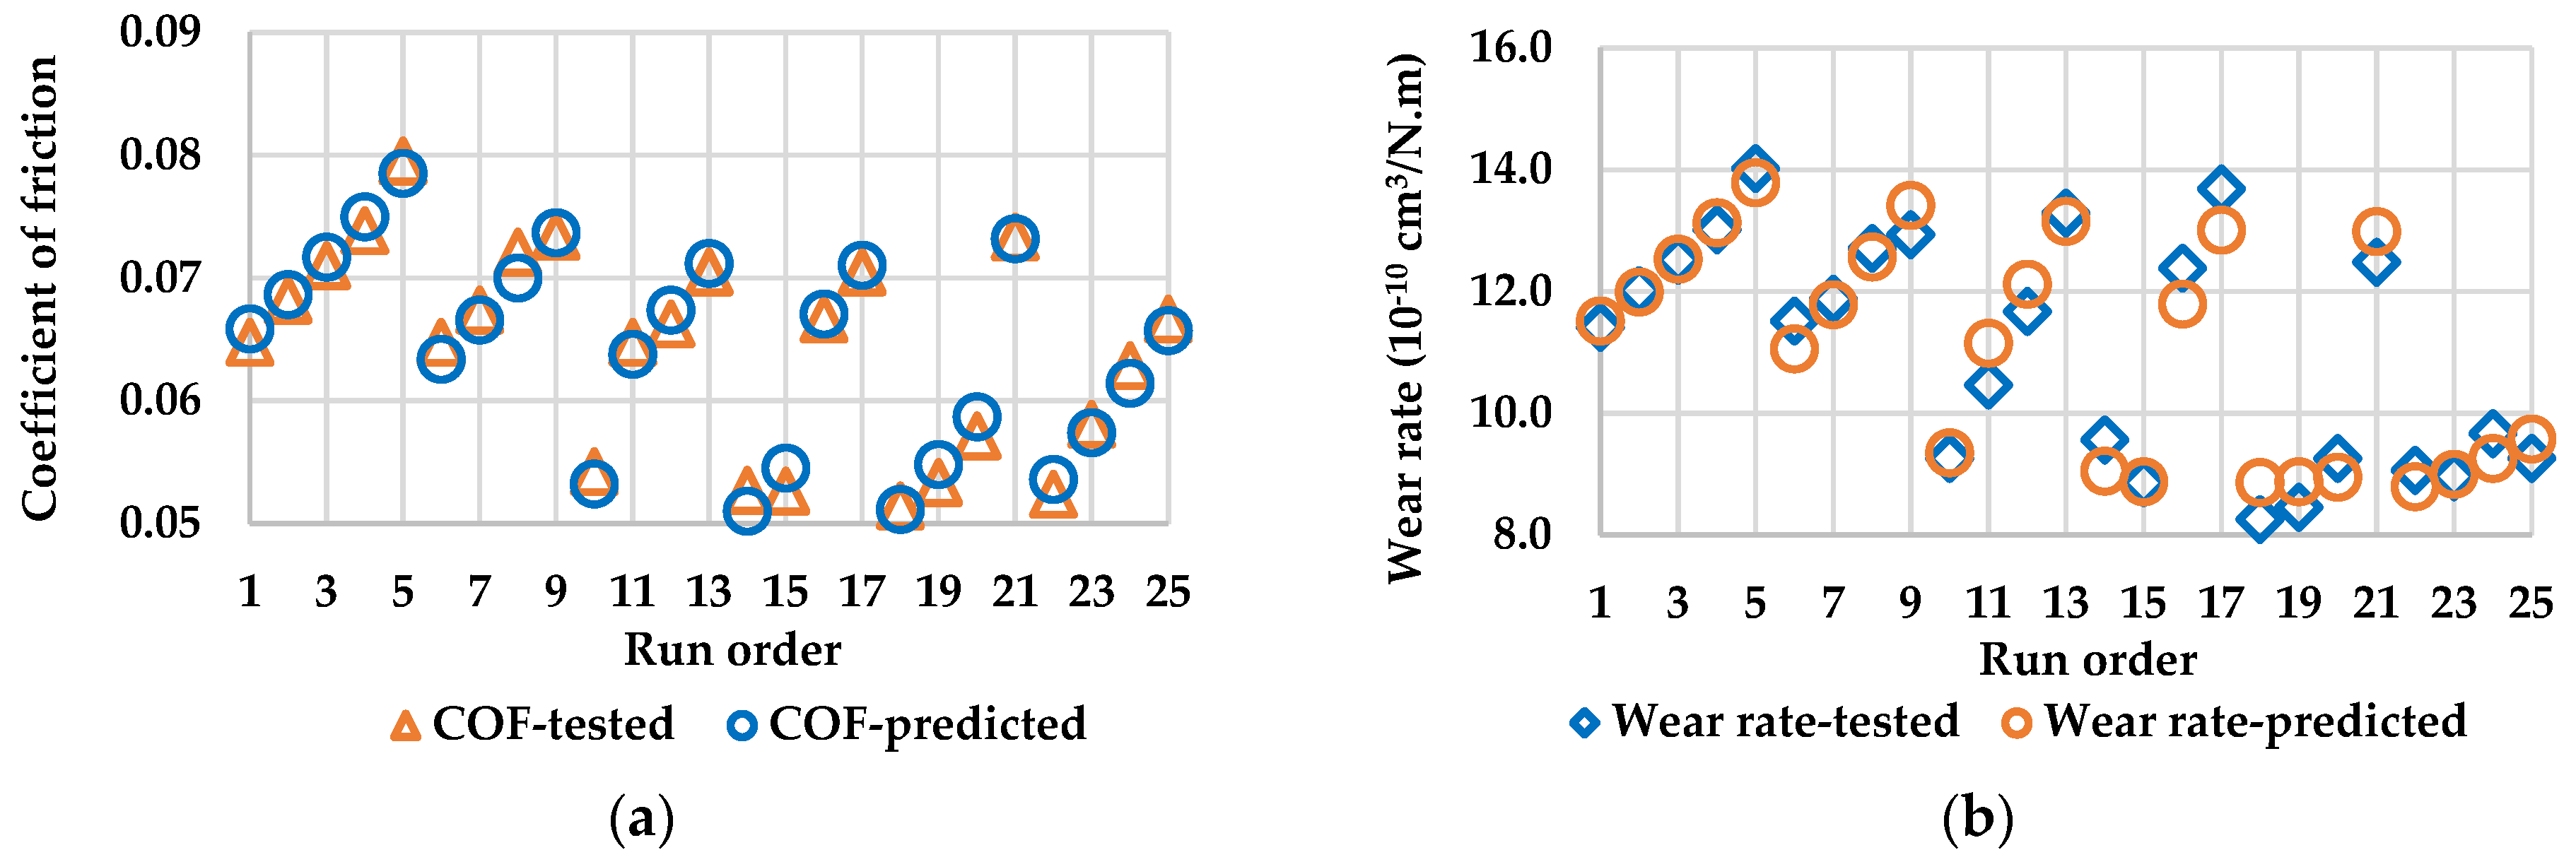
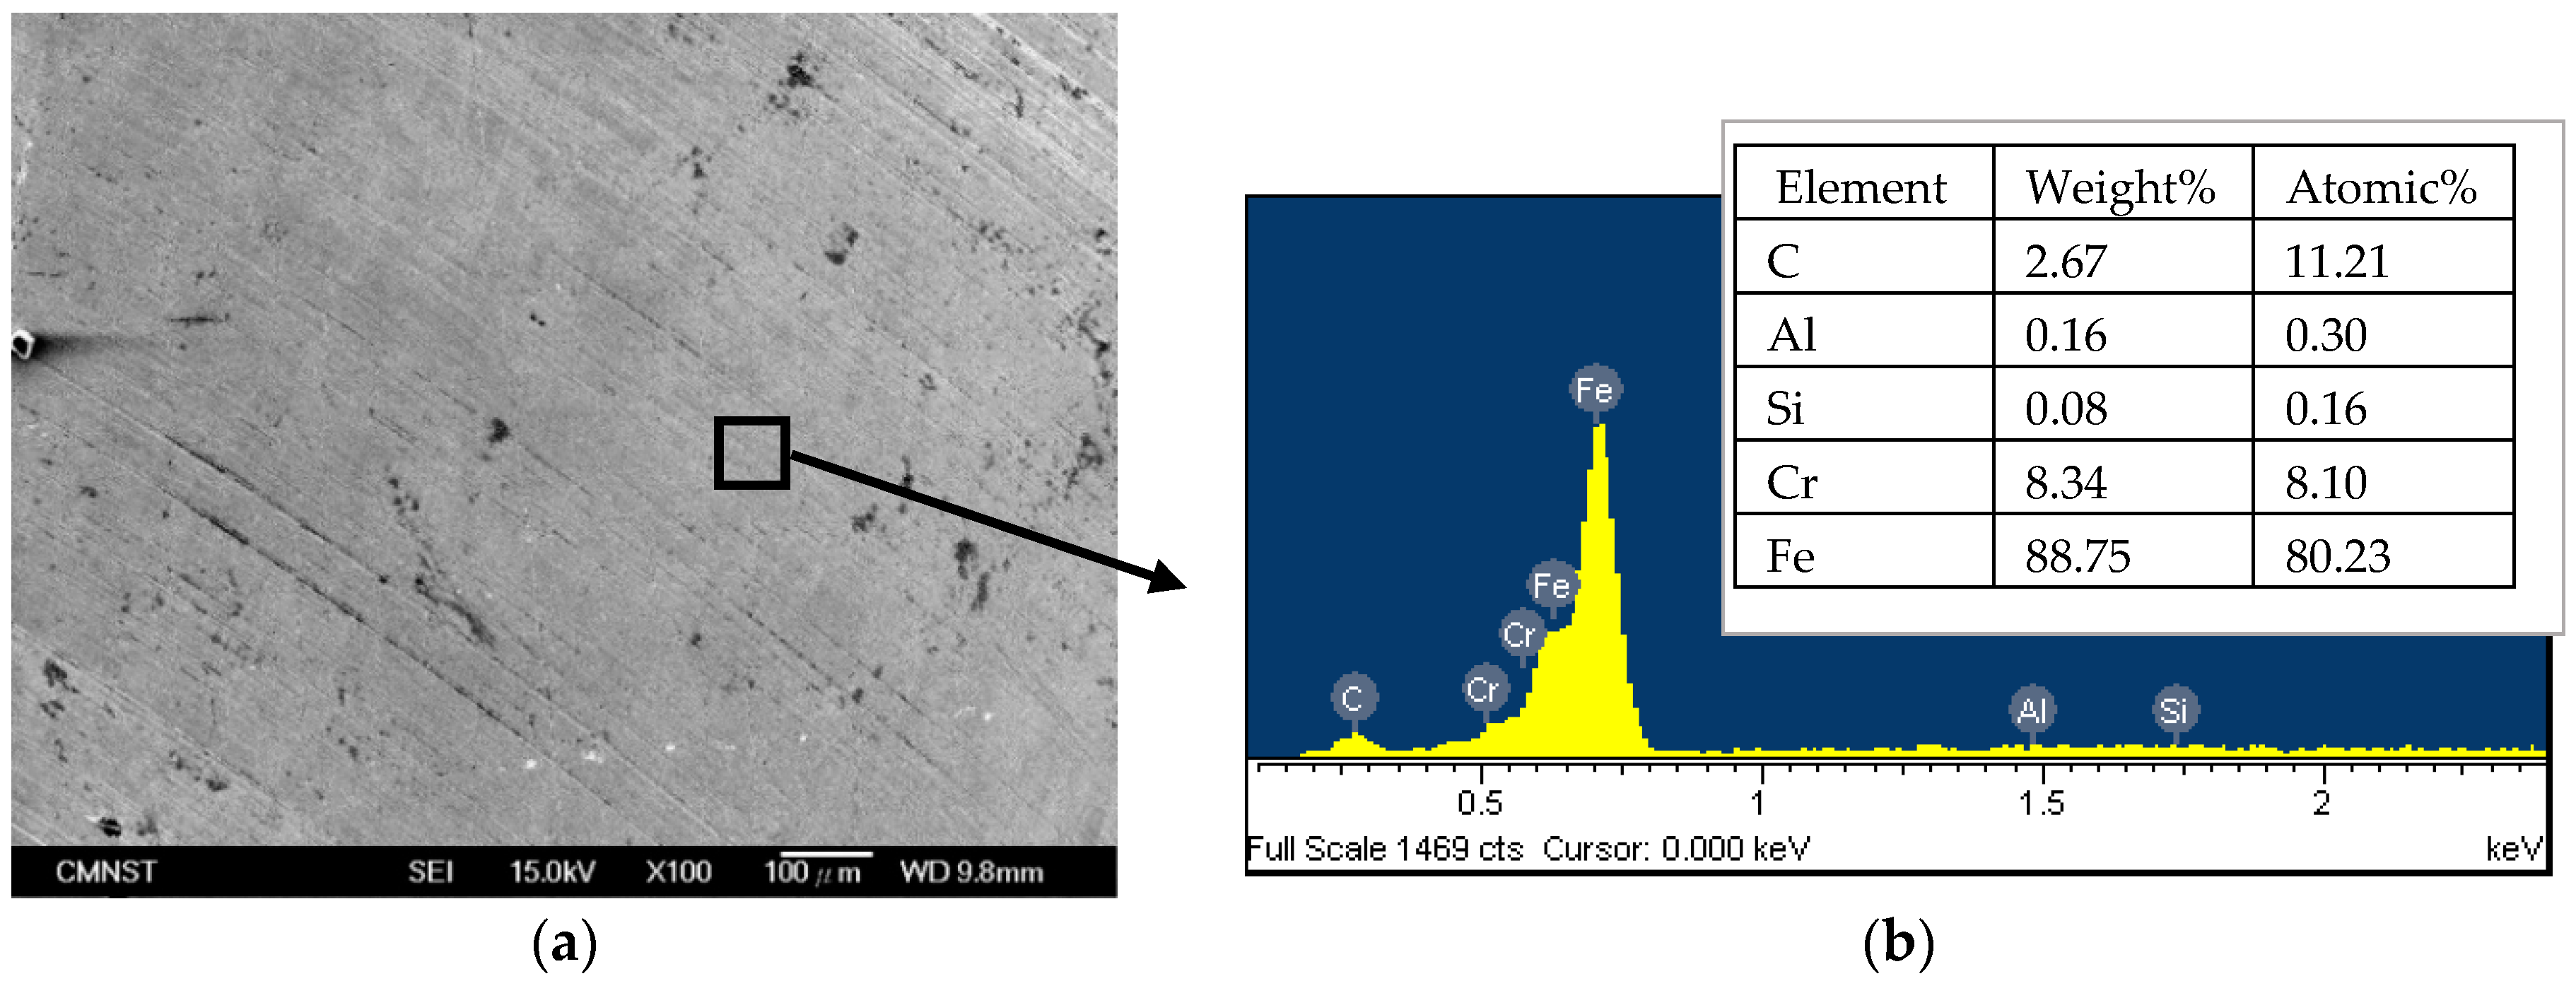
In this research, the influences of aluminum nanoparticles, sodium dodecyl sulfate as the dispersal agent, and the water content of glycerol on the characteristics of friction and wear were studied. The experimental design included methods such as Taguchi technique, ANOVA analysis, and response surface methodology in this research. Surface roughness measurement, scanning electron microscope (SEM), and energy dispersive spectrometer (EDS) are used to study the effects of aluminum nanoparticles as the additive to glycerol lubricant.

2. Experimental Setup

2.1. Lubricant Preparation

Glycerol (purity ≥ 99%) from Scharlau Co., Barcelona, Spain was the lubricant fluid employed in this research. The properties of glycerol are listed in Table 1. An aqueous glycerol solution was prepared by adding 10 wt %–50 wt % of deionized (DI) water into the glycerol liquid.
Aluminum nanoparticles of 99.9% purity with an average particle size of 50 nm from the Long Ton Co., Keelung, Taiwan were used as the additive to the lubricant in this study. The characteristic properties of the aluminum nanoparticles are listed in Table 2. The size and the morphological distributions of the nanoparticles used as part of this study were verified using scanning electron microscope (SEM, JEOL Ltd., Tokyo, Japan), as shown in Figure 1.
Sodium dodecyl sulfate (SDS) was selected as the surfactant in this research. Physical properties of the SDS are listed in Table 3. The weight percentage of SDS was 0 wt % to 2 wt %, and the concentration of aluminum particles was 0 to 1 wt % in an aqueous glycerol solution. The mixture was then stirred by ultrasonic vibration machine for 30 min at 20 °C to ensure uniform distribution of the nanoparticles.

2.2. Tribological Experiment

The tribological experiment was conducted on a thrust collar tribotester designed by the authors, as shown in Figure 2. The thrust of SK2 steel with a hardness of 60 HRC was fixed and slid against an iron plate made of S50C steel with a hardness of 254 HV. The outer diameter, inner diameter, and the length of thrust were 25 mm, 10 mm, and 49.5 mm, respectively. The dimensions of the flat plate were 50 mm × 50 mm, 6 mm thick. The chemical properties of the thrust and collar are listed in Table 4.
The surface roughness of the specimen was measured by a Mitutoyo Surftest SJ-400 apparatus (Mitutoyo Corporation, Kanagawa, Japan). The average roughness value (Ra) of the thrust and the collar were from 0.024 µm to 0.048 µm. When the friction test was completed, the collar was removed and cleaned in an ultrasonic bath for further SEM and EDS analysis.
The normal force was applied by a dead weight and the friction force between the thrust and the collar was measured via a load cell every 0.5 s. The weight of the collar was measured using a SI-304 precision electronic balance (Denver Instrument, Bohemia, NY, USA) before and after the experiment was run to calculate the wear rate of the collar.
The coefficient of friction μ is given by equation [22]:
μ = 3 M ( R 1 2 R 2 2 ) 2 F ( R 1 3 R 2 3 ) ,
where M (N·mm) is the friction moment, F (N) is the applied load, and R 1 (mm) and R 2 (mm) are the outer radius and inner radius of thrust, respectively.
The wear rate is calculated as:
w = Δ W ρ F L   ( c m 3 N · m ) ,
where w   ( c m 3 / N · m ) is the wear rate, Δ W (g) is the mass loss, ρ (g/cm3) is the density of steel, F (N) is the applied load, and L (m) is the sliding distance.
Each experiment was performed for 120 min at a rotational speed of 600 rpm, applied load of 90 N, 27 °C, and the humidity was between 45%–50%.

2.3. Taguchi Design of Experiments

The Taguchi method was adopted in the design of experiment (DOE). The standardized Taguchi L25 orthogonal array is used to conduct research on relevant parameters and to determine their values in order to minimize the coefficient of friction as well as wear rate. The factors, and their levels as mentioned, are specified in Table 5. The level range of each factor is selected based on a number of recent studies [12,14,21,22,23,24]. The 25 given experiments were performed in a random continuity order to exclude any other incorporeal agents, which might contribute whatsoever to the friction force and wear rate.

2.4. ANOVA, RSM, and Multiple Response Optimization

ANOVA analysis was employed in this research to evaluate the design parameters and to identify which factors significantly affected the output response. ANOVA enumerates a list of the regression coefficients, namely, the interactive effects, and the p-value to determine the statistically significant effects. If the p-value is less than 0.05, that indicates a 95% confidence level of the model’s significance.
RSM, a response surface methodology, is used to predict the COF and wear rate that are present. RSM [25] is a compilation of statistical and mathematical techniques that are employed to create the model and to optimize the independent variables of a physical system. The outputs (responses) and the input factors have their relationship as an empirical model function, noted as:
f = y ( A , B , C ) + ε
where f represents the dependent outputs (i.e., COF, wear rate); y is the function of response; ε represents the statistical error; and ,   A , B , and C are the parameters of aluminum nanoparticles (wt %), SDS (wt %), and the water content of glycerol (wt %), respectively.
Second-degree polynomial formulae are used to describe the effect of one output in dependence of the variables input, noted as:
f = a 0 + j = 1 k a j x j + j = 1 k a j j x j 2 + i < j = 2 k a i j x i x j + ϵ ,
where x j is the variables factor; a 0 , a j , a j j , and a i j are constants; and ϵ is the random error of observation response.
In this research, the optimization of multiple responses (i.e., both COF and wear rate) are the desirability functions. Each response of y j (target or object) is converted into an individual desirability function d j in the range:
0 d j 1
The overall desirability functions are associated in the form:
D = ( d 1 d 2 d 3 d m ) 1 m ,
where D ,   m are desirability and the number of responses, respectively.
If the target (or objective) for response y reaches the minimum value:
d = { 1 y < T ( U y U T ) r T y U 0 y > U
where T ,   U , and r are the target, upper boundary, and weight of the desirability function, respectively. The r value depends on the target, r > 1 means close to the target, 0 < r < 1 signifies the less important target.

3. Results and Discussion

3.1. Analysis for COF and Wear Rate

The tribological experiments with varying parameters on thrust collar tribotester were conducted, and the results of the COF and wear rate for each run are listed in Table 6.
The ANOVA analysis for the COF and wear rate were performed to determine the effect of main factors on the COF and wear rate, the results are listed in Table 7 and Table 8. The confidence level of the predicted model was 95% for the COF and wear rate. The regression coefficient p-value (<0.0001) indicates that the predicted model is significant. It was found that the p-value for factor C (water) was the most significant factor for both COF and wear rate with a percentage contribution of 67.21% and 54.42%, respectively. The Rsq and adjusted Rsq values were 0.9805 and 0.9707, respectively, for the COF which indicates that the regression model is significant, which shows an agreement between the experiments and prediction data. For wear rate, the Rsq and adj-Rsq values were 0.9564 and 0.9346, respectively. This also indicates the regression model is meaningful.
Figure 3 shows the normal probability plot of COF and wear rate. The red dots are the experimental values and the blue lines are predicted values. It shows that the data are approximately normal distribution and the range of residuals rested approximately in a straight line. Hence, it could be noted that a quadratic model is adequate for anticipating the equations for both COF and wear rate.
The prediction equations using RSM method for COF and wear rate were established by the quadratic statistical model as follow:
For the coefficient of friction,
μ = 6.14242 × 10 2 3.34854 × 10 2   A 3.67034 × 10 3   B +   4.34705 × 10 4   C + 2.21161 × 10 2   A 2 + 1.72662 × 10 4   B 2 + 7.98774 × 10 7   C 2 + 2.05759 × 10 3   A   B 1.17572 × 10 5   A   C
For the wear rate,
w = 11.3578 4.25313   A + 3.25112 × 10 1   B + 2.09611 × 10 3   C + 1.54672   A 2 4.09254 × 10 1   B 2 + 1.32396 × 10 3   C 2 5.12327 × 10 1   A   B + 1.8322 × 10 2   A   C ,
where A = concentration of aluminum nanoparticles (wt %), B = concentration of SDS (wt %), and C = water content in glycerol (wt %).
A comparison of the predicted and experimental value for both COF and wear rate is shown in Figure 4. It exhibited the proper correlation between the predicted and experimental values, which confirmed the suitability of the predictive model with the confidence interval of 95%.
The effects of the combined parameters on COF and wear rate are shown in contour plots of Figure 5 and Figure 6, respectively. It shows that the COF decreases and reaches a value of less than 0.05 at a water of 10 wt % with nanoparticles of 0.55 wt % to 0.82 wt % and SDS of 1.6 wt % to 2 wt %. The wear rate is in the range from 7 × 10⁻¹⁰ (cm3/N·m) to 8 × 10⁻¹⁰ (cm3/N·m) with the water of 10 wt % in glycerol, 2 wt % of SDS, and the nanoparticle concentration from 0.61 wt % to 1.0 wt %.

3.2. Optimization for Both the Coefficient of Friction and Wear Rate

The desirability function for multiple objective optimizations was applied to analyze the correlations between all factors, and it was accomplished by using Minitab 16.2.0 software (Minitab Inc., State College, PA, USA). The input parameters are displayed in Table 9, and the target parameters were chosen to be the minimum value of the COF and wear rate.
The best set of parameters obtained after the cross-analysis was with the aluminum nanoparticle concentration of 0.6667 wt %, SDS concentration of 2 wt %, and 10 wt % water content of glycerol, as shown in Table 10. With the desirability level of one, the predicted minimum values for the COF and wear rate are 0.0494 and 7.8155 × 10⁻¹⁰ (cm3/N·m), respectively.
The percentage errors between the measured and predicted values for COF and wear rate are 3.13 and 2.46, respectively. The results are consistent with the analysis mentioned earlier. The predictive model has high confidence and is entirely relevant to the optimum levels for both COF and wear rate.

3.3. Mechanisms of Friction Reduction and Anti-Wear

Figure 7b is the SEM image of the wear surface with pure lubricant (no nanoparticles), the roughness of the surface is high, the image shows deep wear tracks along the sliding direction. The measured COF was also high.
In Figure 7c–f, the wear tracks on the collar surfaces obviously decreased corresponding to an increase in the concentration of nanoparticles in the aqueous glycerol solution, as compared to the wear tracks in Figure 7b. The scratches on the collar surfaces in Figure 7d,e, with the presence of 0.5 wt % and 0.75 wt % of nanoparticles, exhibit relative smoothness and the depth of tracks are less than other friction surfaces shown in Figure 7c,f. Therefore, the surface roughness of the collars for both test 14 and 18 are low, revealing the remarkable reduction in the COF and wear rate.
The EDS analysis (Figure 8b) of the wear surface (Figure 8a) of optimal concentration parameters shows the tribo-film contains aluminum formed on the collar surface. The film formed by the nanoparticles deposited on the friction surface acts like a protection film that reduces the direct contact of two mating surfaces. Another wear reduction mechanism is in the form of the aluminum nanoparticles acting like bearing balls to prevent the collision of the thrust and collar surfaces.
Table 11 lists the Ra of the collars before and after each experiment. The highest roughness is 0.187 µm for test 1, for which the lubricant has no nanoparticles. The experiments that had lower surface roughness exhibited tiny wear traces, thus suggesting lower COF values. The combined effects of the tribo-film and the ball-bearing of nanoparticles prevent the development of wear tracks. The same results have been reported by Bogunovic et al. [26] and Zhang et al. [27].
The COF curves of friction tests of 120 min are displayed in Figure 9; the COF was the highest for the lubricant with 10 wt % water content of glycerol among the three experiments. The influence of nanoparticles in lubricant became apparent upon observing the results of 0.6667 wt % aluminum nanoparticles and 10 wt % water content of glycerol, whereby the COF dropped to 0.0549. With optimal concentration levels of 0.6667 wt % nanoparticles, 2 wt % of SDS, and 10 wt % water content of glycerol, the COF further reduced to 0.051.
Figure 10 shows the comparison of wear rate between predicted and measured values for different lubricating conditions. It can be seen that the wear rate decreased with the presence of nanoparticles in the lubricant. At the optimal concentration, the measurement value of wear rate achieved 8.0128 × 10⁻¹⁰ (cm3/N·m), 42.4% less than that of glycerol with 10 wt % of water.
The kinematic viscosity of lubricants was measured before and after each experiment following ASTM D445 at 40 °C, as shown in Figure 11. The values indicated that there was not a notable change in kinematic viscosity before and after each experiment.
Figure 12 shows the Stribeck curves of different rotational speed experiments with the applied load 90 N and aqueous glycerol solution as lubricant. The curves show that lubrication was in the mixed/elastohydrodynamic regime.
The SEM images of aluminum nanoparticles before and after experiment No. 10 and the experiment with optimal concentrations are shown in Figure 13. The images showed that the nanoparticles sizes did not change and that no aggregation of nanoparticles was observed. The addition of SDS in aqueous glycerol solution enhanced the stability of aluminum nanoparticles.

4. Conclusions

This study investigated the tribological properties of aluminum nanoparticle additives on glycerol solutions with the following conclusions obtained:
  • Through ANOVA analysis, the three control factors (concentration of nanoparticles, concentration of SDS, and water content of glycerol) have 98.05% and 95.64% of confident level effects on the COF and wear rate. According to the RSM analysis, the regression equation of the model fits well with the experiment data.
  • The most significant factor effect on both COF and wear rate was the DI water content in glycerol, followed by concentration of aluminum nanoparticles, and lastly the SDS content.
  • The application of multi-objective optimization has shown that the best set of parameters was 0.6667 wt % for aluminum, 2 wt % for SDS, and 10 wt % DI water content of glycerol—both the wear rate and COF were the least when using the abovementioned parameters.
  • The images from SEM and EDS observation showed that the collar friction traces became fewer and lighter when the optimal concentration of nanoparticles was added to the lubricant. The bearing ball effect of nanoparticles and the deposition of metal film on the wear surface were identified as the mechanisms that contributed to the reduction of the COE and wear rate.

Acknowledgments

The authors are very grateful to the Department of Mechanical Engineering of National Kaohsiung University of Applied Sciences and Center for Micro/Nano Science and Technology of National Cheng Kung University for providing equipment and technical support.

Author Contributions

Vu Nguyen-Anh Le designed and performed the experiments, analyzed the data, and wrote the paper. Jau-Wen Lin provided and developed the research orientation and, in general, helped to improve the quality of the work.

Conflicts of Interest

The authors declare no conflict of interest.

References

  1. March, W.A. Hydrocarbon Resistant Glycerol Base Lubricant. U.S. Patent No. 2878184, 17 March 1959. [Google Scholar]
  2. Hefner, R.E.; Pruitt, M.E. Glycerol Triether Lubricant Compositions. U.S. Patent No. 2,841,479, 1 July 1958. [Google Scholar]
  3. Kyllönen, M. Lubricant Composition. Patent No. WO2015173465, 19 November 2015. [Google Scholar]
  4. Peña-Parás, L.; Taha-Tijerina, J.; Garza, L.; Maldonado-Cortés, D.; Michalczewski, R.; Lapray, C. Effect of CuO and Al2O3 nanoparticle additives on the tribological behavior of fully formulated oils. Wear 2015, 332–333, 1256–1261. [Google Scholar] [CrossRef]
  5. Chen, Q.; Zheng, S.; Yang, S.; Li, W.; Song, X.; Cao, B. Enhanced tribology properties of ZnO/Al2O3 composite nanoparticles as liquid lubricating additives. J. Sol-Gel Sci. Technol. 2012, 61, 501–508. [Google Scholar] [CrossRef]
  6. Duan, G.; Hu, X.; Song, X.; Qiu, Z.; Gong, H.; Cao, B. Morphology evolution of ZnO submicroparticles induced by laser irradiation and their enhanced tribology properties by compositing with Al2O3 nanoparticles. Adv. Eng. Mater. 2015, 17, 341–348. [Google Scholar] [CrossRef]
  7. Gu, Y.; Zhao, X.; Liu, Y.; Lv, Y. Preparation and tribological properties of dual-coated TiO2 nanoparticles as water-based lubricant additives. J. Nanomater. 2014, 2014, 8. [Google Scholar] [CrossRef]
  8. Chang, H.; Li, Z.Y.; Kao, M.J.; Huang, K.D.; Wu, H.M. Tribological property of TiO2 nanolubricant on piston and cylinder surfaces. J. Alloys Compd. 2010, 495, 481–484. [Google Scholar] [CrossRef]
  9. Zin, V.; Agresti, F.; Barison, S.; Colla, L.; Fabrizio, M. Influence of Cu, TiO2 nanoparticles and carbon nano-horns on tribological properties of engine oil. J. Nanosci. Nanotechnol. 2015, 15, 3590–3598. [Google Scholar] [CrossRef] [PubMed]
  10. Zhang, Y.; Xu, Y.; Yang, Y.; Zhang, S.; Zhang, P.; Zhang, Z. Synthesis and tribological properties of oil-soluble copper nanoparticles as environmentally friendly lubricating oil additives. Ind. Lubr. Tribol. 2015, 67, 227–232. [Google Scholar] [CrossRef]
  11. Qiu, S.; Zhou, Z.; Dong, J.; Chen, G. Preparation of Ni nanoparticles and evaluation of their tribological performance as potential additives in oils. J. Tribol. 1999, 123, 441–443. [Google Scholar] [CrossRef]
  12. Chen, S.; Liu, W. Characterization and antiwear ability of non-coated ZnS nanoparticles and ddp-coated ZnS nanoparticles. Mater. Res. Bull. 2001, 36, 137–143. [Google Scholar] [CrossRef]
  13. Chiñas-Castillo, F.; Spikes, H.A. Mechanism of action of colloidal solid dispersions. J. Tribol. 2003, 125, 552–557. [Google Scholar] [CrossRef]
  14. Rapoport, L.; Leshchinsky, V.; Lapsker, I.; Volovik, Y.; Nepomnyashchy, O.; Lvovsky, M.; Popovitz-Biro, R.; Feldman, Y.; Tenne, R. Tribological properties of WS2 nanoparticles under mixed lubrication. Wear 2003, 255, 785–793. [Google Scholar] [CrossRef]
  15. Peng, D.X.; Kang, Y.; Chen, S.K.; Shu, F.C.; Chang, Y.P. Dispersion and tribological properties of liquid paraffin with added aluminum nanoparticles. Ind. Lubr. Tribol. 2010, 62, 341–348. [Google Scholar] [CrossRef]
  16. Thakre, A.A.; Thakur, A. Study of behaviour of aluminium oxide nanoparticles suspended in SAE20W40 oil under extreme pressure lubrication. Ind. Lubr. Tribol. 2015, 67, 328–335. [Google Scholar] [CrossRef]
  17. Thakre, A.A.; Shinde, A.; Mundhe, G. Improvement in boundary lubrication characteristics of SAE20W40 oil using aluminum oxide nanoparticles. J. Tribol. 2015, 138, 034501–034504. [Google Scholar] [CrossRef]
  18. Koshy, C.P.; Rajendrakumar, P.K.; Thottackkad, M.V. Evaluation of the tribological and thermo-physical properties of coconut oil added with MoS2 nanoparticles at elevated temperatures. Wear 2015, 330–331, 288–308. [Google Scholar] [CrossRef]
  19. Shi, Y.; Minami, I.; Grahn, M.; Björling, M.; Larsson, R. Boundary and elastohydrodynamic lubrication studies of glycerol aqueous solutions as green lubricants. Tribol. Int. 2014, 69, 39–45. [Google Scholar] [CrossRef]
  20. Zhou, X.; Lin, B.; Yan, S.; Wang, A.; Zhang, X.; Ge, S. Influence of temperature and concentration on tribological properties of silicon nitride in glycerol aqueous solution. Ceram. Int. 2016, 42, 3786–3796. [Google Scholar] [CrossRef]
  21. Yan, S.; Lin, B.; Zhang, X.; Wang, A.; Zhou, X. Investigation of the running-in process of silicon nitride sliding in aqueous solutions of ethylene glycol. Tribol. Int. 2015, 90, 386–392. [Google Scholar] [CrossRef]
  22. Meriam, J.L.; Kraige, L.G. Engineering Mechanics—Statics, 7th ed.; John Wiley & Sons, Inc.: Hoboken, NJ, USA, 2006. [Google Scholar]
  23. Wang, X.-J.; Li, H.; Li, X.-F.; Wang, Z.-F.; Lin, F. Stability of TiO2 and Al2O3 nanofluids. Chin. Phys. Lett. 2011, 28, 086601. [Google Scholar] [CrossRef]
  24. Liu, C.; Desai, K.G.H.; Tang, X.; Chen, X. Solubility of rofecoxib in the presence of aqueous solutions of glycerol, propylene glycol, ethanol, span 20, tween 80, and sodium lauryl sulfate at (298.15, 303.15, and 308.15) k. J. Chem. Eng. Data 2005, 50, 2061–2064. [Google Scholar] [CrossRef]
  25. Myers, R.H.; Montgomery, D.C.; Anderson-Cook, C.M. Response Surface Methodology: Process and Product Optimization Using Designed Experiments, 3rd ed.; John Wiley & Sons, Inc.: Hoboken, NJ, USA, 2009. [Google Scholar]
  26. Bogunovic, L.; Zuenkeler, S.; Toensing, K.; Anselmetti, D. An oil-based lubrication system based on nanoparticular TiO2 with superior friction and wear properties. Tribol. Lett. 2015, 59, 1–12. [Google Scholar] [CrossRef]
  27. Zhang, M.; Wang, X.; Liu, W.; Fu, X. Performance and anti-wear mechanism of Cu nanoparticles as lubricating oil additives. Ind. Lubr. Tribol. 2009, 61, 311–318. [Google Scholar] [CrossRef]
Figure 1. Scanning electron microscope (SEM) image of aluminum nanoparticles.
Applsci 07 00080 g001
Figure 2. (a) Thrust collar friction and wear test platform; (b) Schematic drawing of the working principle for the tribotest used to evaluate the friction force and wear.
Applsci 07 00080 g002
Figure 3. Normal probability plot of: (a) coefficient of friction; (b) wear rate.
Applsci 07 00080 g003
Figure 4. Comparison data between experiment and expectation: (a) for COF; and (b) for wear rate.
Applsci 07 00080 g004
Figure 5. Contour plot for coefficient of friction at: (a) SDS of 2 wt %; (b) water of 10 wt %.
Applsci 07 00080 g005
Figure 6. Contour plot for wear rate (10−10 cm3/N·m) at: (a) SDS of 2 wt %; (b) water of 10 wt %.
Applsci 07 00080 g006
Figure 7. SEM micrographs of collar surface. (a) Collar surface before test; (b) collar surface after test with only 10 wt % water content in glycerol of trial 1; (cf) Collar surfaces after test with different concentrations of aluminum nanoparticles at 0.25, 0.5, 0.75, and 1.0 wt % of experiment number 10, 14, 18, and 22, respectively.
Applsci 07 00080 g007
Figure 8. (a) SEM topography and (b) energy dispersive spectrometer (EDS) result of collar surface after test for optimal concentration parameters.
Applsci 07 00080 g008
Figure 9. The effect of different concentration on coefficient of friction.
Applsci 07 00080 g009
Figure 10. Comparison of wear rate for experiments and predicted values.
Applsci 07 00080 g010
Figure 11. Comparison of the kinematic viscosity.
Applsci 07 00080 g011
Figure 12. Stribeck curve for different rotational speeds.
Applsci 07 00080 g012
Figure 13. SEM micrograph of aluminum nanoparticles (a) before; (b) after experiment No. 10; (c) before the experiment using optimal concentrations and (d) after the experiment with optimal concentrations.
Applsci 07 00080 g013
Table 1. Typical characteristics of glycerol.
PropertyRange
Chemical formulaC3H8O3
Relative molecular mass (g/mol)92.1
Density at 20 °C (g/cm3)1.26
Refractive index1.47
Melting point (°C)18
Boiling point (°C)120
Flash point (°C)160
Ignition temperature (°C)400
pH (100 g/L H2O, 20 °C)5
Table 2. Properties of aluminum nanoparticles.
MorphologySpherical
Purity (%)99.9
ColorBlack
Average particle size (nm)50
Specific surface area (m2/g)20
Bulk density (g/cm3)0.23
Table 3. Properties of sodium dodecyl sulfate.
Chemical FormulaNaC12H25SO4
Purity (%)99
Relative molecular mass (g/mol)288.372
AppearanceWhite solid
Density (g/cm3)1.01
Melting point (°C)206
Table 4. The chemical composition of specimens.
SpecimensChemical Elements (wt %)
CSiMnSPFe
Thrust SK21.15–1.250.15–0.350.15–0.50≤0.030≤0.030Balance
Collar S50C0.47–0.530.15–0.350.60–0.90≤0.035≤0.030Balance
Table 5. Control factors and their levels for experiments. SDS, sodium dodecyl sulfate.
FactorsParametersCoded Variables Level
12345
AConcentration of nanoparticles (wt %)00.250.50.751
BConcentration of SDS (wt %)00.511.52
CWater content of glycerol (wt %)1020304050
Table 6. Experimental results of coefficient of friction (COF) and wear rate as per orthogonal array.
Run OrderActual FactorCoefficient of FrictionWear Rate (10−10 cm3/N·m)
A: Nanoparticles (wt %)B: SDS (wt %)C: Water (wt %)
100100.064711.4114
200.5200.068112.0120
301300.071012.5125
401.5400.073813.0130
502500.079514.0140
60.250200.064711.5115
70.250.5300.067311.8741
80.251400.072012.7027
90.251.5500.073412.9329
100.252100.05429.2578
110.50300.064710.4654
120.50.5400.066211.6729
130.51500.070413.2829
140.51.5100.05279.5597
150.52200.05268.8553
160.750400.066612.3773
170.750.5500.070413.6854
180.751100.05148.2515
190.751.5200.05338.4527
200.752300.05719.2576
2110500.073312.4779
2210.5100.05239.0565
2311200.05818.9559
2411.5300.06289.6603
2512400.06669.2578
Table 7. ANOVA analysis for coefficient of friction.
SourceDegrees of FreedomSequential Sums of SquaresAdjusted Sums of SquaresAdjusted Mean of SquaresF-Valuep-Value% Contribution
Model80.0015700.0015700.000196100.55<0.000198.06
A10.0002920.0002920.000292149.52<0.000118.24
B10.0000640.0000530.00005327.27<0.00014.00
C10.0010760.0009180.000918470.22<0.000167.21
A210.0001340.0001340.00013468.51<0.00018.37
B210.0000000.0000000.0000000.050.8260.00
C210.0000000.0000000.0000000.170.6840.00
A × B10.0000040.0000030.0000031.780.2010.25
A × C10.0000000.0000000.0000000.020.8810.00
Error160.0000310.0000310.000002---
Total240.001601-----
Rsq = 0.9805; Adjusted Rsq = 0.9707.
Table 8. ANOVA analysis for wear rate.
SourceDegrees of FreedomSequential Sums of SquaresAdjusted Sums of SquaresAdjusted Mean of SquaresF-Valuep-Value% Contribution
Model877.469777.46979.683743.85< 0.000195.64
A122.262322.262322.2623100.8< 0.000127.48
B17.90765.67245.672425.68< 0.00019.76
C144.083333.218733.2187150.41< 0.000154.42
A210.65420.65420.65422.960.1050.81
B210.44140.54960.95462.490.10340.54
C211.899230.92030.92034.170.0582.34
A × B10.11850.21530.21530.970.3380.15
A × C10.11020.11020.11020.500.4900.14
Error163.53363.53360.2209---
Total2481.0033-----
Rsq = 0.9564; Adjusted Rsq = 0.9346.
Table 9. Constraints and targets for multi-objective optimization.
ConditionObjectLower BoundTargetUpper BoundWeight
A: Nanoparticles (wt %)Is in range0-1-
B: SDS (wt %)Is in range0-2-
C: Water (wt %)Is in range10-50-
Coefficient of frictionMinimum0.05140.05140.07951
Wear rate (10−10 cm3/N·m)Minimum8.25158.251514.01401
Table 10. The results of the optimization for responses.
ResponseOptimum ConditionsPredicted ValueExperimental Value% Error
Nanoparticles (wt %)SDS (wt %)Water (wt %)
COF0.66672100.04940.0513.13
Wear rate (cm3/N·m)0.66672107.8155 × 10−108.0128 × 10−102.46
Table 11. Measurement the roughness of collar surface before and after trials.
Specimen (Trial No.)Roughness (Ra) of Collar Surface (µm)
Before TestAfter TestRise-in-Roughness
10.0410.2280.187
100.0240.1630.139
140.0350.0810.046
180.0240.0560.032
220.0330.1250.092
Optimal concentration0.0390.0670.028

