1. Introduction
Many concrete structures in civil engineering use prestressing steel wires as reinforcement elements bearing fatigue loads. Nowadays, cold drawing is the conforming process most widely used in industry for obtaining prestressing steel wires. Residual stresses appear in cold-drawn pearlitic steel wires due to the non-uniform distribution of plastic strain during wire drawing [
1]. Such residual stresses are a problem of major concern in engineering, since they can produce—under certain conditions—the catastrophic failure of structural components such as prestressing steel wires [
2]. So, any effort leading to reduced residual stress is very welcome. In the particular case of wire drawing, different methods are used to obtain more efficient and reliable components. Some of them are composed of diverse post-drawing treatments whose aim is to release the stress distribution after the cold drawing process [
3]. Others are based on design modifications of the process, mainly focused on the die geometry [
4,
5,
6,
7,
8,
9,
10,
11]. However, for certain cases (mainly when the surface residual stresses are compressive in nature), an improvement of the mechanical behavior against fatigue is achieved [
12]. Thus, the use of surface post-treatments such as shot peening (whose aim is to introduce compressive stresses in the component surface and its vicinity) is currently widespread in industry.
Cold drawn wires are highly susceptible to degradation phenomena related to hydrogen damage, in particular to hydrogen embrittlement (HE) [
13,
14,
15,
16]. Stress–strain state plays a key role in such a type of failure [
17,
18]. Thus, a reduction of the residual stress state yields to a reduction of the HE susceptibility of prestressing steel wires, thereby reducing the risk of in-service failure. In this paper, the effects of diverse cyclic loading scenarios on the residual stress field generated by cold drawing are analyzed. To achieve this goal, firstly, a numerical simulation by the finite element (FE) method was carried out for estimation of the residual stress distribution in a real (commercial) prestressing steel wire. Later, a wire with the aforementioned residual stress field was simulated by FE under different in-service fatigue load cases to reveal the effect of the cyclic loading scheme.
2. Numerical Modelling
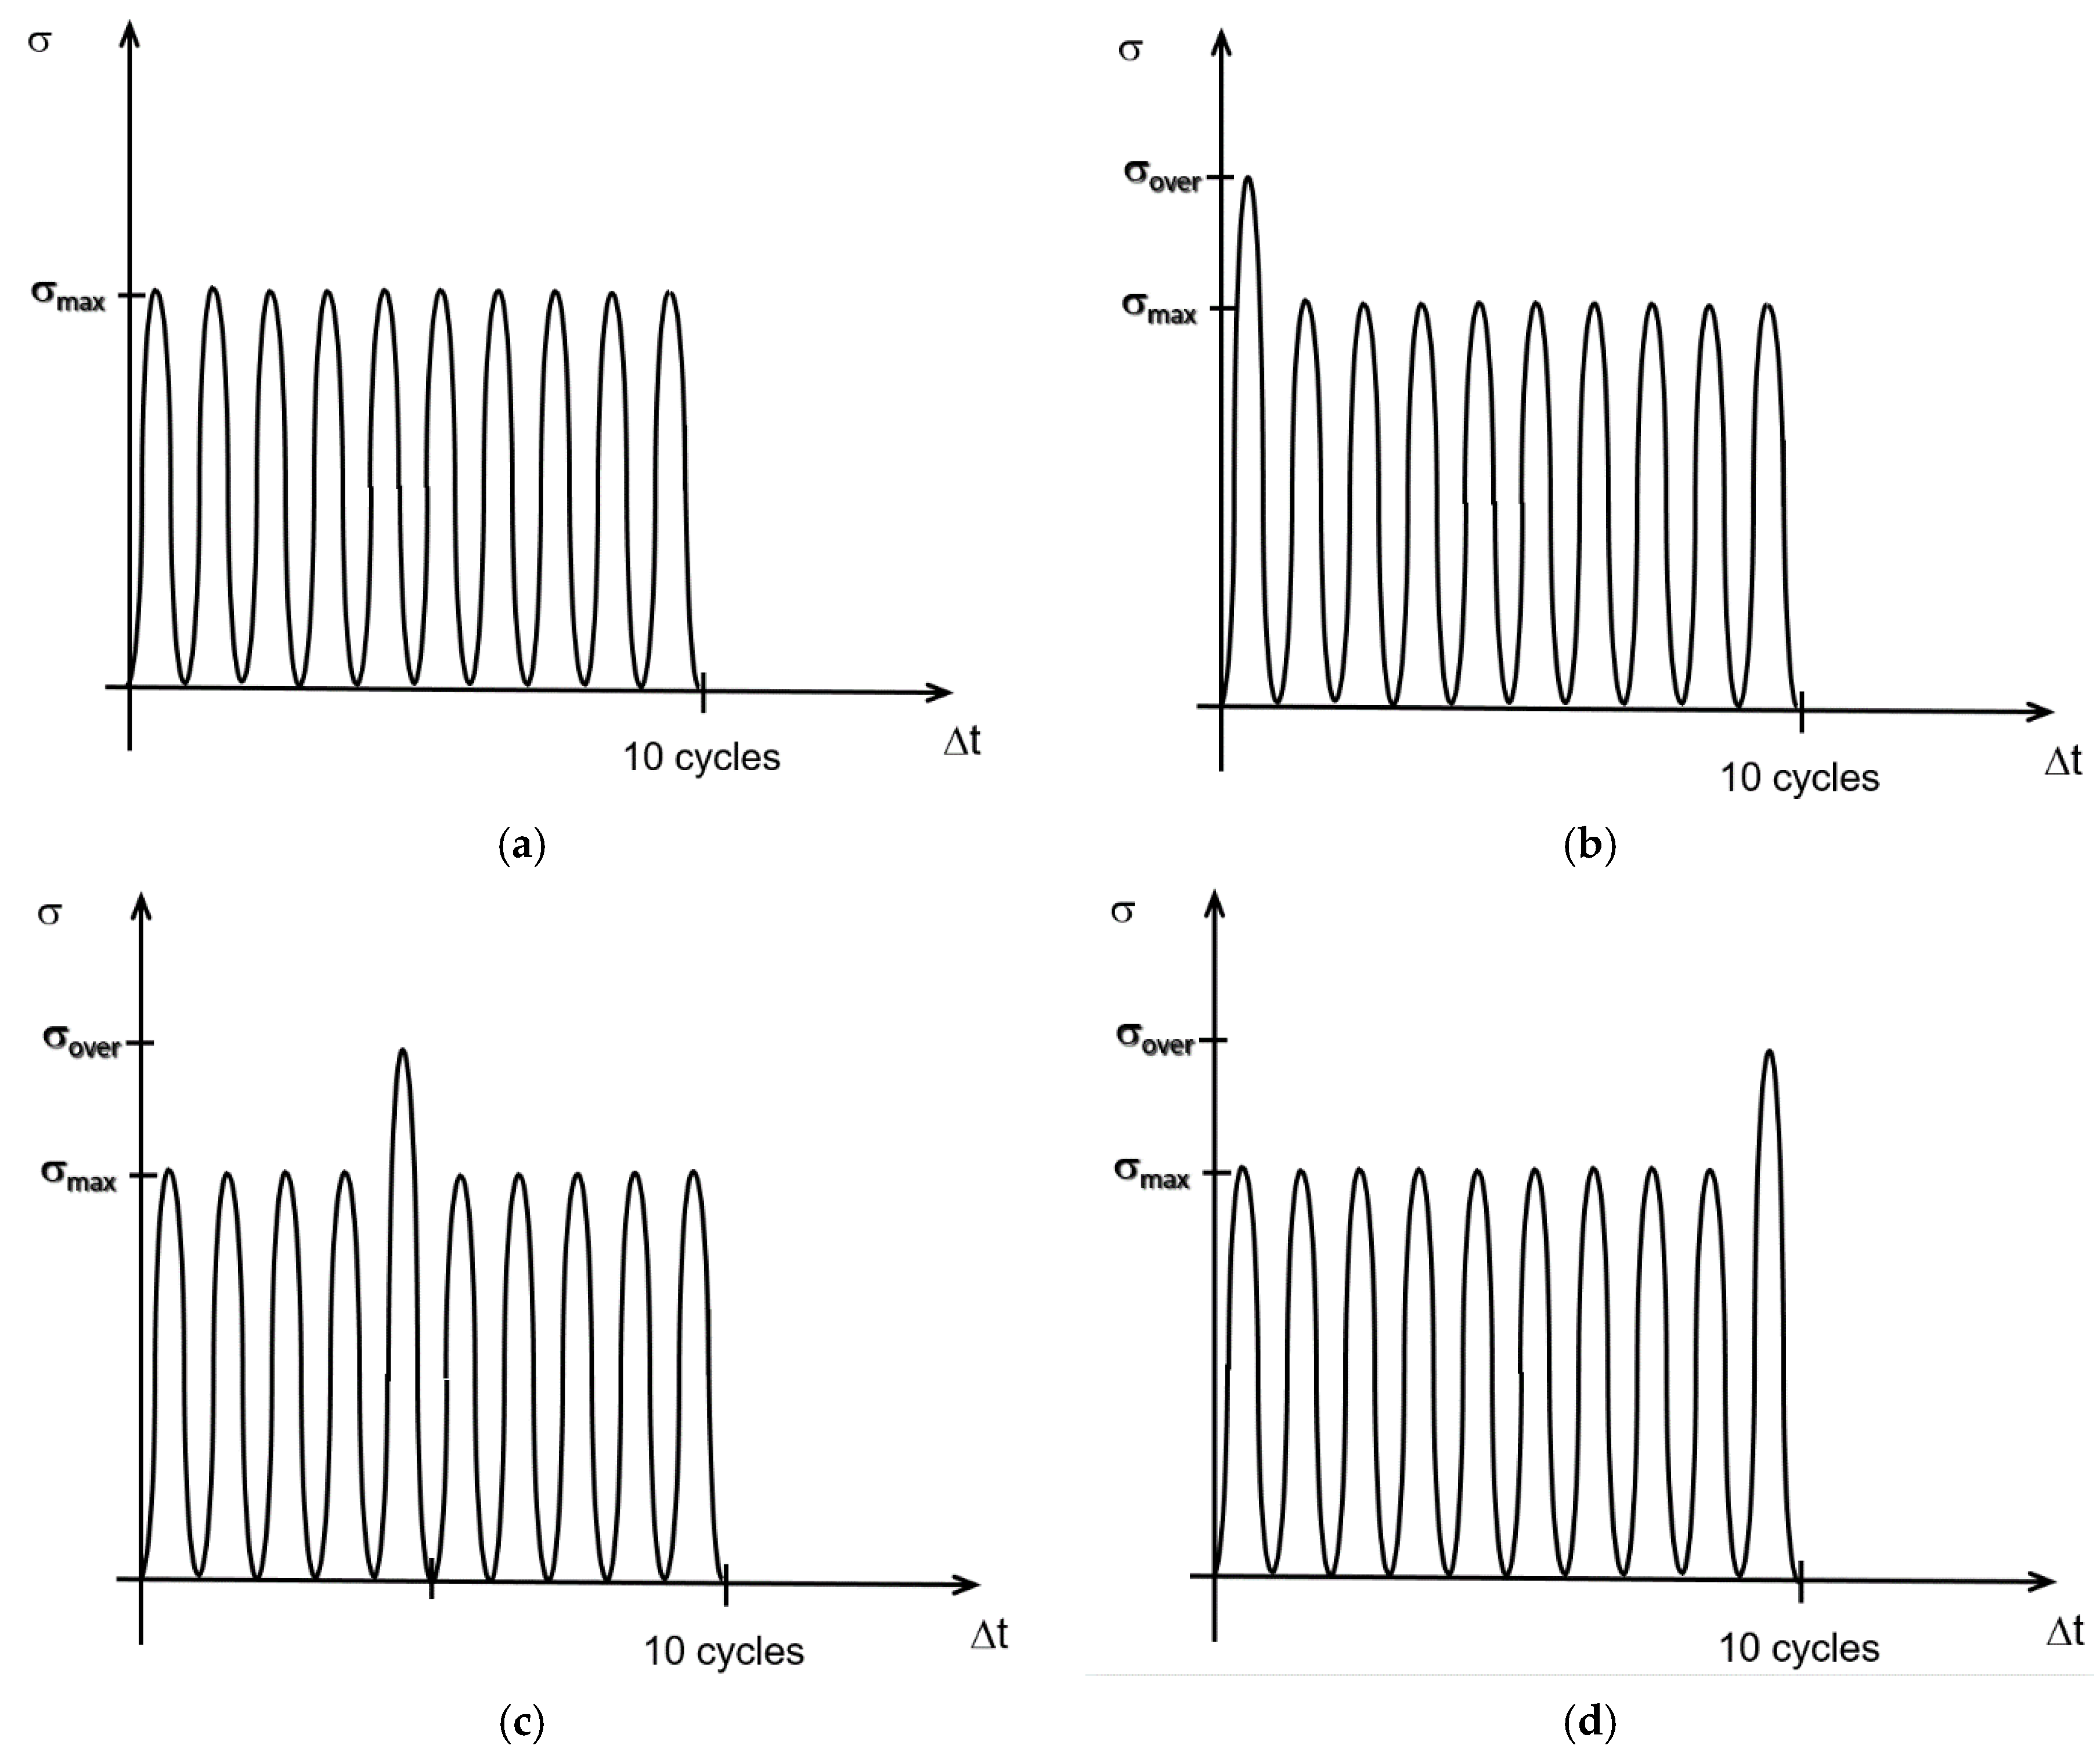
Five different cyclic loading schemes were analyzed. All of them consist of a sinusoidal variation with time with a stress factor
R = σ
min/σ
max = 0 (
Figure 1a), as summarized in
Table 1. This way, loading cycles oscillate between a null stress and a different maximum stress (σ
max) for each case of study. Thus, Load I and Load II applies a maximum load within the material elastic domain (i.e., about 75% and 90% of σ
Y = 1300 MPa, 0.002% offset yield strength of a typical prestressing steel used in construction [
19]: 1000 and 1200 MPa, respectively). Three additional loading schemes were also considered: a load that reaches the material yield strength at maximum load (Load III), and two loading where the maximum stress overcomes the material yield strength: Load IV, 110% of yield strength (i.e., 1400 MPa) and Load V, 125% of yield strength (i.e., 1600 MPa), respectively. In all cases, a number of cycles (
N) of 10 was applied in accordance to the null effect of this parameter, accounting for the results presented in previous analyses [
20,
21]. Furthermore, papers [
22,
23] show how the crack tip advance due to local plasticity appears during the first loading cycles.
Prestressing steel wires can undergo overloading during their life in-service [
24]. It is thus interesting to include this issue in the analysis. To do so, diverse overload schemes were considered in terms of the loading sequence: (i) initial overload (
Figure 1b); (ii) intermediate overload (
Figure 1c); and (iii) final overload (
Figure 1d). In addition, the effect of the intensity of the overload was considered in terms of the overload ratio (μ), defined as μ = σ
overload/σ
max. Thus, four different overloads ranging from 1200 MPa to 1600 MPa (Loadings Ia–Id in
Table 2) were considered for the lowest in-service loading (Loading I, 1000 MPa according to
Table 1). In the same way, three overloads ranging from 1300 MPa to 1600 MPa (Loadings IIa–IIc in
Table 2) were considered for the highest in-service loading (Loading II, 1200 MPa according to
Table 1).
The stress state during in-service conditions can be estimated as the addition of stress generated by in-service loading (commonly variable in time; i.e., fatigue) and the residual stress state caused by manufacturing. In the case of prestressing steel wires, the conforming process of these structural components (wire drawing) applies a progressive reduction of the wire diameter in several stages (drawing steps). As a result, heavy plastic strains appear in the final wire, causing strain hardening (increasing the material strength) and non-negligible residual stress. It is a common practice to obtain those states from numerical simulation of the cold drawing process by FE [
6,
8,
10], and experimentally by means of synchrotron and neutron diffraction techniques [
25], and more recently by laser ultrasonic [
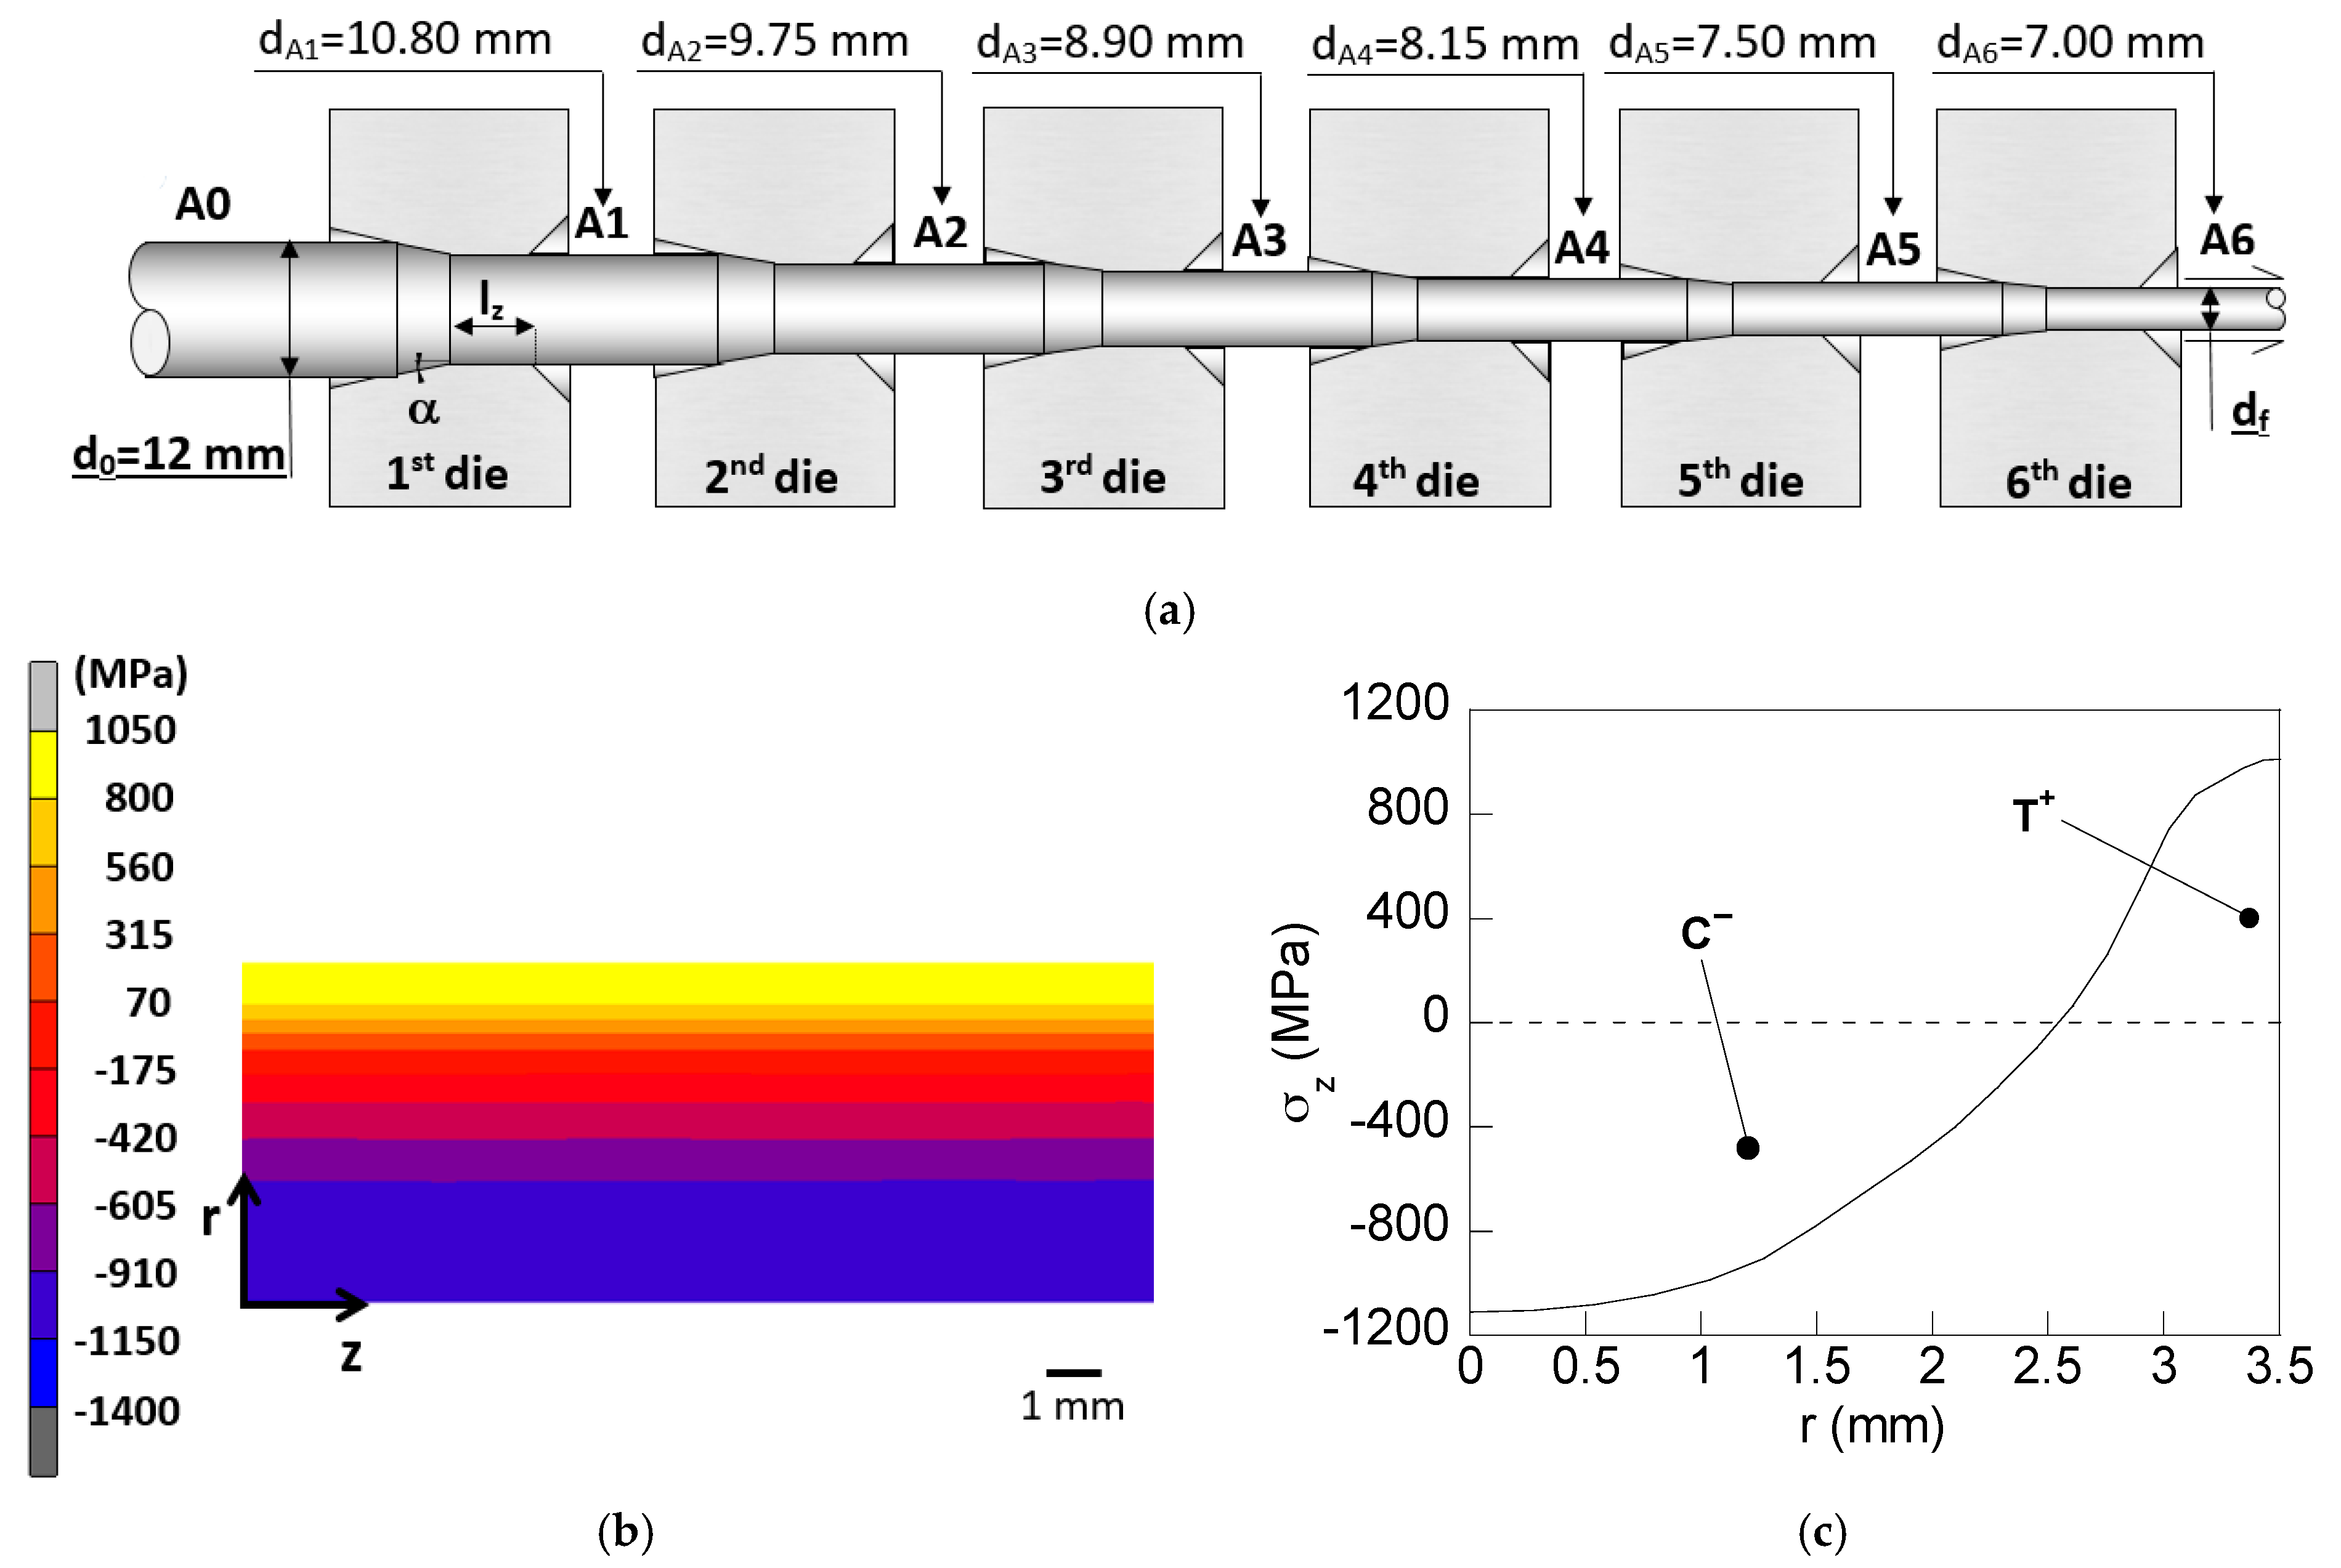
26]. In both procedures, similar values were obtained for conventional prestressing steels. In this paper, to achieve an estimation of those states, a numerical simulation of a real drawing chain was carried out by means of a commercial FE code (MSC.Marc©). Accordingly, the wire section is progressively reduced from an initial diameter of 12 mm to a final diameter of 7 mm during seven drawing steps, according to the following sequence (cf.
Figure 2a):
d0 = 12.00 mm,
d1 = 10.80 mm,
d2 = 9.75 mm,
d3 = 8.90 mm,
d4 = 8.15 mm,
d5 = 7.50 mm,
d6 = 7.00 mm.
The revolute symmetry allows for simplification of the geometry to an axisymmetric case, with the consequent savings in computing time. Four-node quadrilateral elements were selected for meshing the wire due to its simple geometry. Diverse meshes were tested until the required convergence in results was achieved. It is worth remarking that the results of this simulation reveal the residual stress state (
Figure 2b) that will be used later as an input in the numerical simulation of the in-service loading considering both stress states: the residual and that caused by in-service loading. The same mesh was used in both simulations.
To achieve the required high accuracy in the radial dimensions of the prestressing steel wire after cold drawing process, the dimensions of the drawing dies at the contact zone must remain the same during the plastic straining of the cold drawn wire. Thus, the drawing dies must not undergo plastic strains or wear, and the dies must also undergo low elastic strains. Taking these design requirements into account, the drawing dies are commonly made of high strength and stiffness ceramics materials such as tungsten carbides. Accordingly, in this study, the drawing dies of the drawing chain shown in
Figure 2a are modelled as rigid bodies [
17]. Two parameters are needed to define the geometry of the drawing die: the inlet die angle (α) and the bearing length (
lz) [
10]. Common values used in industry for both parameters (α = 7° and
lz =
d0) were chosen for each of the drawing steps of the considered drawing chain (labeled as A in
Figure 2).
The boundary conditions applied in the FE modelling are the following: a prescribed axial displacement imposed on the front extreme of the rod, and null displacement imposed to those nodes placed at the symmetry axis of the wire. Elastoplastic analysis was performed using large deformations and large strains, with updated Lagrangian formulation. The simple geometry of the wire in the 2D axisymmetric approach (a rectangle) allows the consideration of a simple mesh of four-node quadrilateral elements. During cold drawing, the outer surface of the wire is in contact with the die, thereby undergoing plastic strains. In this way, the meshing of the wire was locally refined at the contact surface. Thus, on one hand, the size of the quadrilateral elements is progressively reduced in the radial direction, and on the other hand, the same size of the elements in the axial direction was used. Thus, the elements of the zone where the main variations are expected to appear (near the contact zone between the wire and the drawing die) have a lower size.
According to the results, the wire at the end of the process exhibits a uniform distribution of axial stress in the axial direction (
Figure 2b). However, in the radial direction of the wire, axial residual stress is non-uniformly distributed with tensile stress (T
+) near the wire surface and compressive stress (C
−) in the wire core (
Figure 2c).
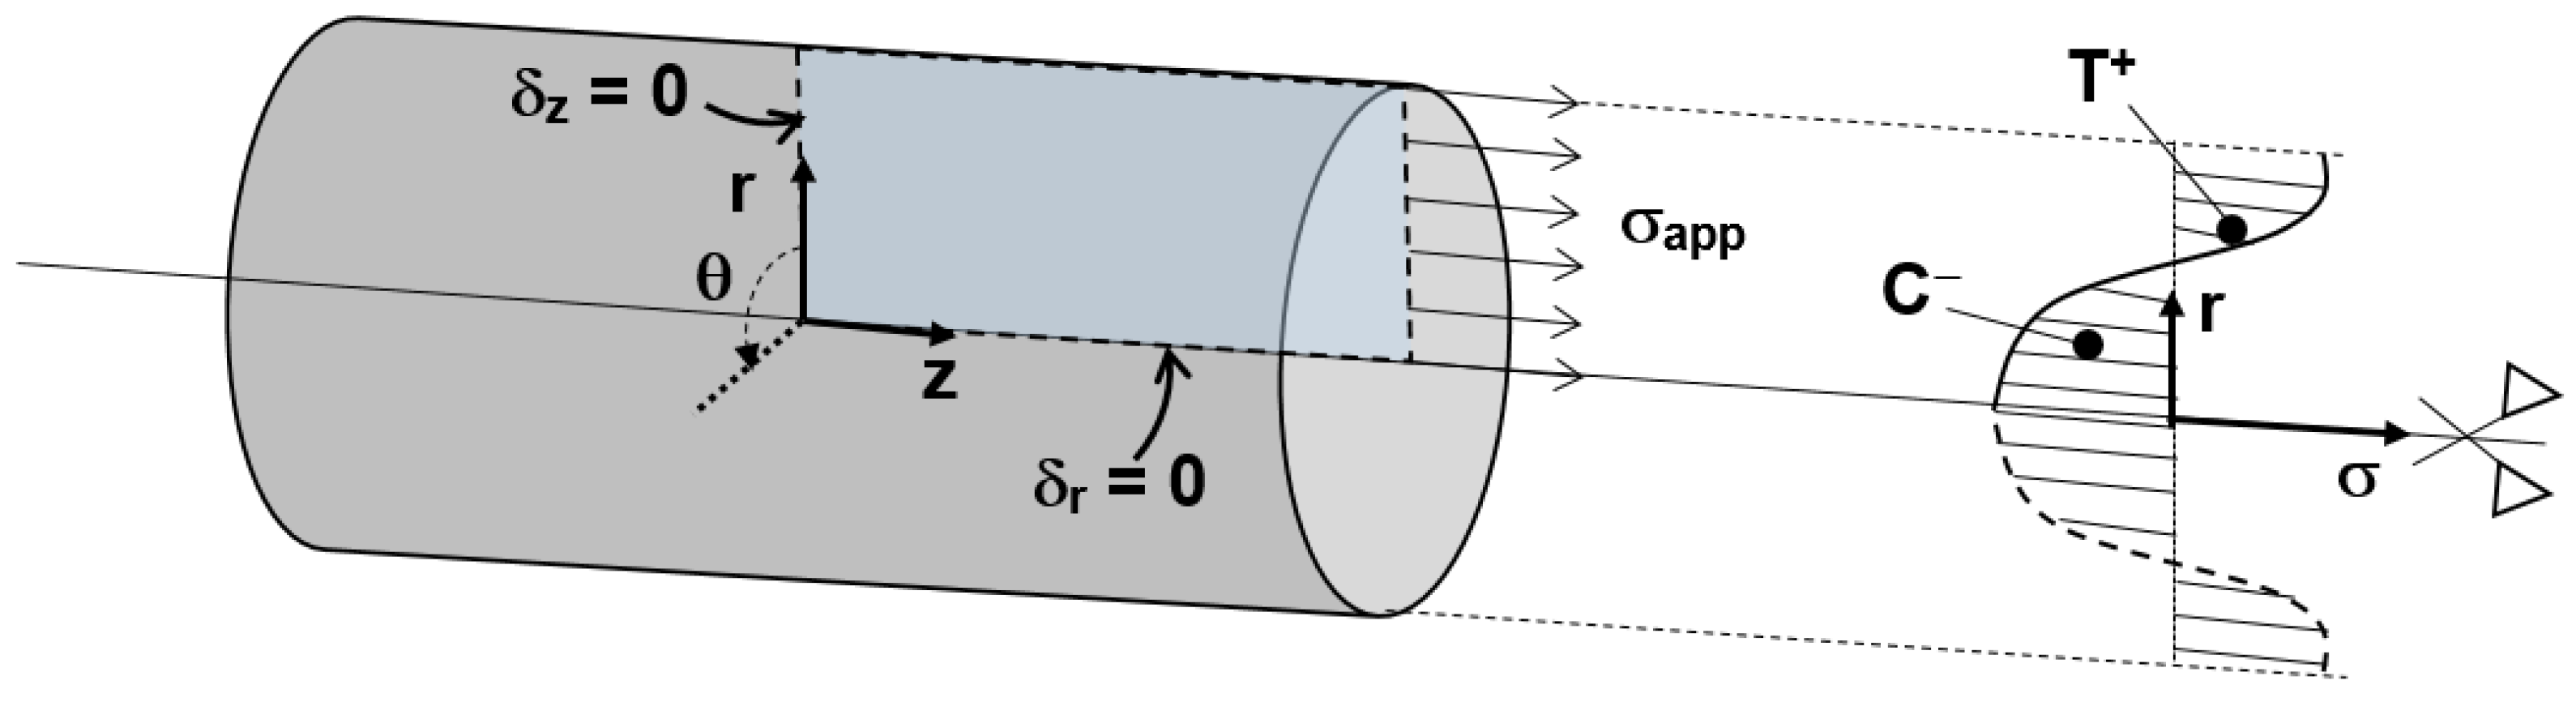
Regarding the second numerical simulation, the same commercial FE code (MSC.Marc©) was used to carry out the simulation of the cyclic loading applied to the prestressing steel wires. Due to the axisymmetric geometry of the wire, the three-dimensional (3D) case is simplified to an equivalent two-dimensional (2D) problem by applying null displacement in the radial direction (δ
r) at the symmetry axis of the wire. Accordingly, a null displacement in the axial direction (δ
x) was imposed at the symmetry central transversal plane of the wire (
Figure 3). In this way, an important saving in computing time is achieved in simulations. Finally, a cyclic loading (σ
app) corresponding to each of the previously depicted cases of study (
Table 1) was applied at one edge of the wire.
In order to include the previously obtained residual stress profile in the numerical simulations of in-service cyclic loading, the same mesh used in the numerical simulation of wire drawing was considered: the FE size progressively decreases as the radial coordinate
r increases. Thus, the mesh is more refined in the tensile zone (T
+ in
Figure 2c), where the main variations in the residual stress were observed, whereas in the wire core (where less significant variations appear), a coarse mesh is suitable. Thus, an accurate approach to the residual stress profile (
Figure 2c) can be achieved by assigning an initial stress value to each element (constant in each finite element).
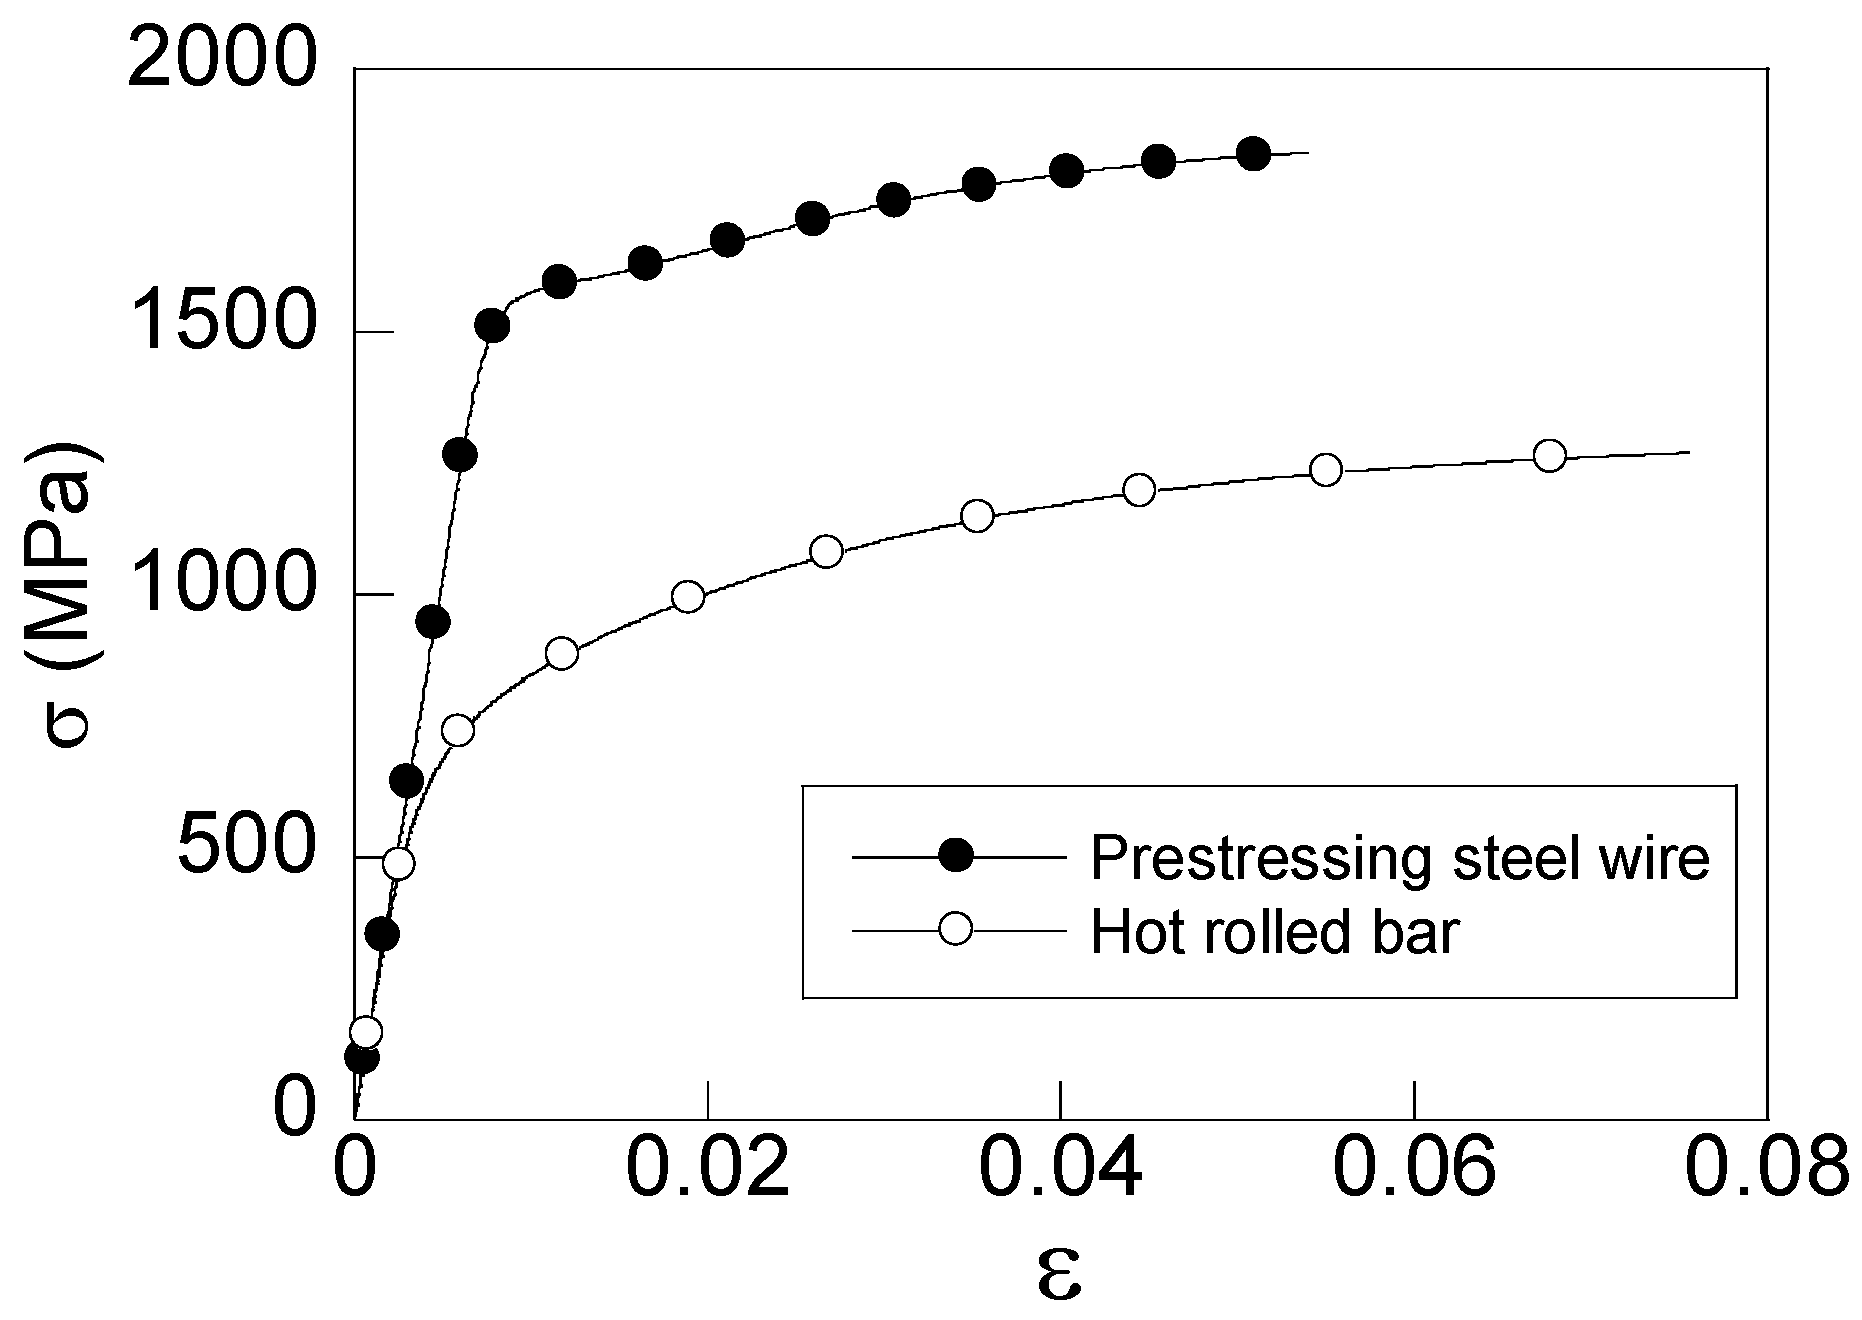
In wire drawing simulations, the base material at the beginning of the manufacturing chain is a hot-rolled pearlitic steel whose chemical composition is: 0.740% C, 0.700% Mn, 0.200% Si, 0.015% P, 0.023% S. Experimental tensile tests up to fracture were carried out to obtain the stress–strain curve (blank points in
Figure 4), according to which Young’s modulus
E = 199 GPa and 0.2% offset yield strength σ
Y = 710 MPa were obtained. In the case of the simulations of cyclic loading that were carried out, the constitutive model for the material was chosen to be elasto-plastic with isotropic strain hardening rule given by the master stress and strain curve obtained experimentally from a simple tensile test (full points in
Figure 4). Results provide the following material properties: Young modulus,
E = 200 GPa and 0.002% offset yield stress, σ
Y = 1300 MPa.
3. Influence of the Maximum Cyclic Loading
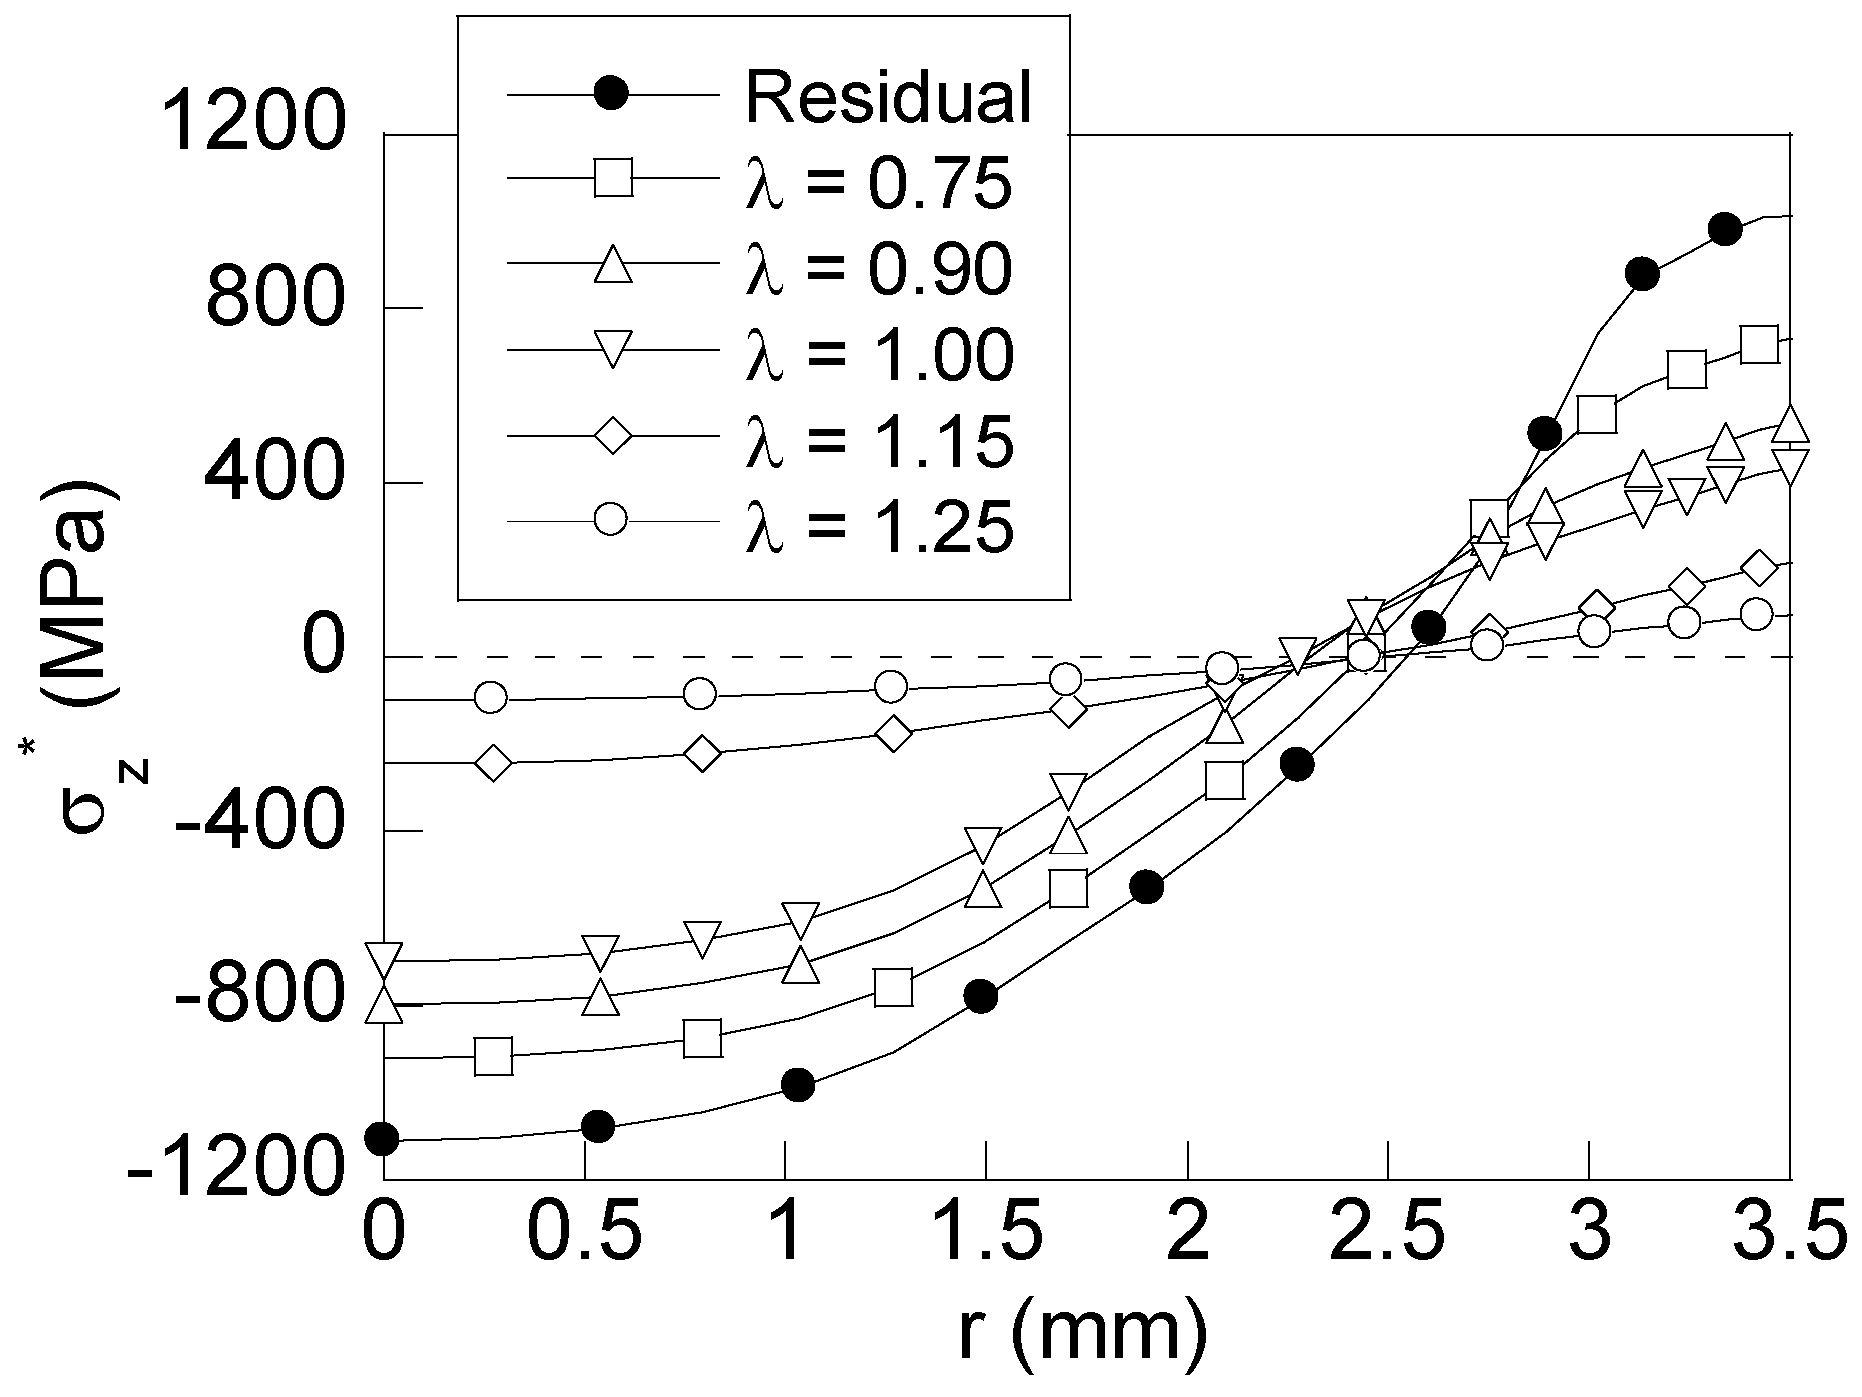
To reveal the effects of the cyclic loading on the residual stress distribution appearing in a heavily drawn wire, the radial distributions of axial stress (obtained after applying a uniform cyclic loading according to the different cases of study depicted in
Table 1) are compared in
Figure 5 with the residual stress distribution obtained after wire drawing (
Figure 2c). For the sake of clarity, a new variable—the effective axial stress σ
z*—is defined as the difference between the axial stress and the in-service applied stress, as shown in the following equation:
As a consequence of the cyclic loading, the distribution of the residual axial stress undergoes significant changes at both the tensile zone (near the wire surface,
Figure 2c) and the compressive zone (close to the wire core,
Figure 2c). The variations consist of a redistribution of the residual stress profile with stress reductions for all points. The intensity of the stress reduction increases with the maximum cyclic loading applied to the wire. Thus, for loadings under the material yield strength, the stress reduction at the wire surface is as high as 28% for the lowest loading (Loading I, 1000 MPa) and 48% for Loading II (1200 MPa). In the case of the cyclic loading with maximum stress equal to the material yield strength (Loading III), the stress reduction is slightly lower than that corresponding to Loading II. Consequently, a similar stress relief can be obtained by using in-service loading within the elastic regime without generating a generalized plasticity in the wire. Nevertheless, the highest reductions are obtained when the maximum cyclic loading overcomes the material yield strength, as seen in the distributions for Loadings IV and V (
Figure 5), where a huge reduction is achieved in the wire surface surroundings and the wire core, resulting in an almost plain (uniform) distribution of residual stress in the radial direction of the wire.
Considering these results, plastic strains caused during the cyclic loading are key for understanding the observed residual stress redistribution. In this way, for the loading cases below the material yield strength, the plasticity locally appears in the tensile zone as a result of the addition of the residual stress (of tensile nature) and the in-service stress caused by the cyclic loading. Consequently, large and non-recoverable strains are generated in the near-surface surroundings. Out of this zone, the stresses remain within the elastic regime, thus being low and completely recoverable when loading is removed. Consequently, in these cases, the main changes appear in the wire surface vicinity with soft reductions in the wire core. However, when the loading is equal to or higher than the material yield strength, the whole wire undergoes plastic strains, and consequently, a huge reduction appears through the whole wire radius. According to the obtained results, a cyclic loading of just 15% higher than the material yield strength (Loading IV) causes a reduction of the stress at the wire surface as high as 80%.
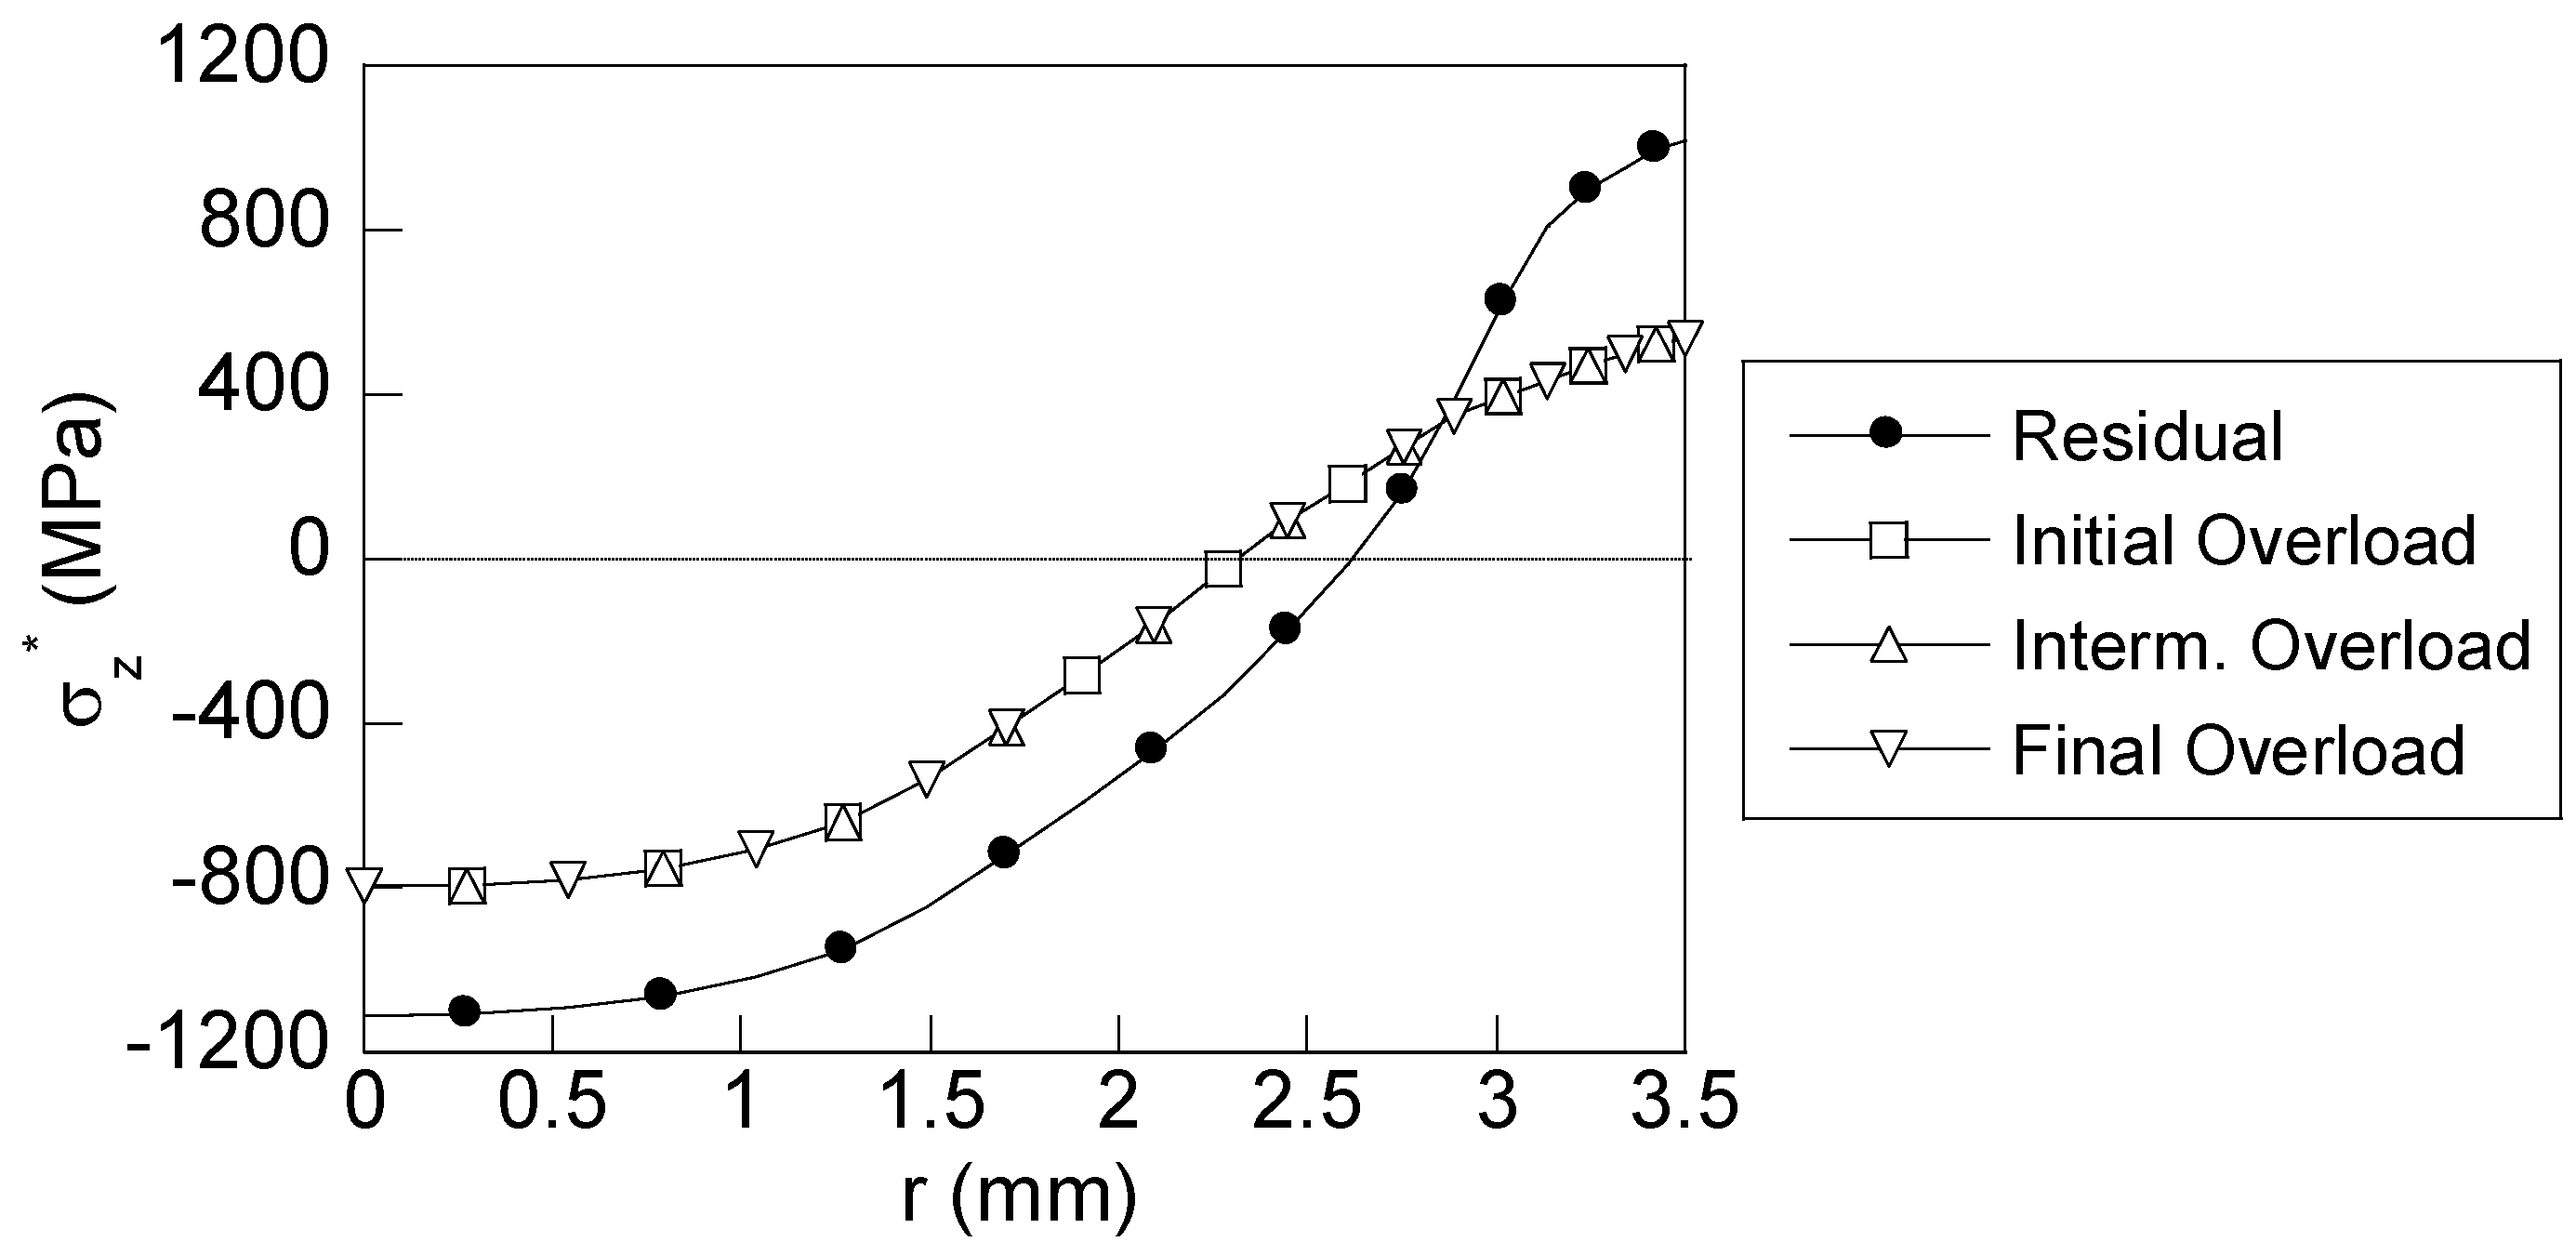
On the other hand, for the case considering an in-service overload, the first analysis consists of finding out the influence of the instant when the overload is applied. To achieve this goal, three cases were considered: initial overload, intermediate overload, and final overload (
Figure 1b–d). The radial distributions of the axial stress for each case are plotted in
Figure 6.
As can be observed, no significant changes appear in the stress distribution at the end of the final cycle. Thus, the influence of the overload sequence can be considered as a second-order effect, and thereby negligible within the framework of this work. Therefore, hereafter, all results were obtained assuming a cyclic loading with an initial overload defined in terms of the dimensionless parameter μ, as is described in
Table 2.
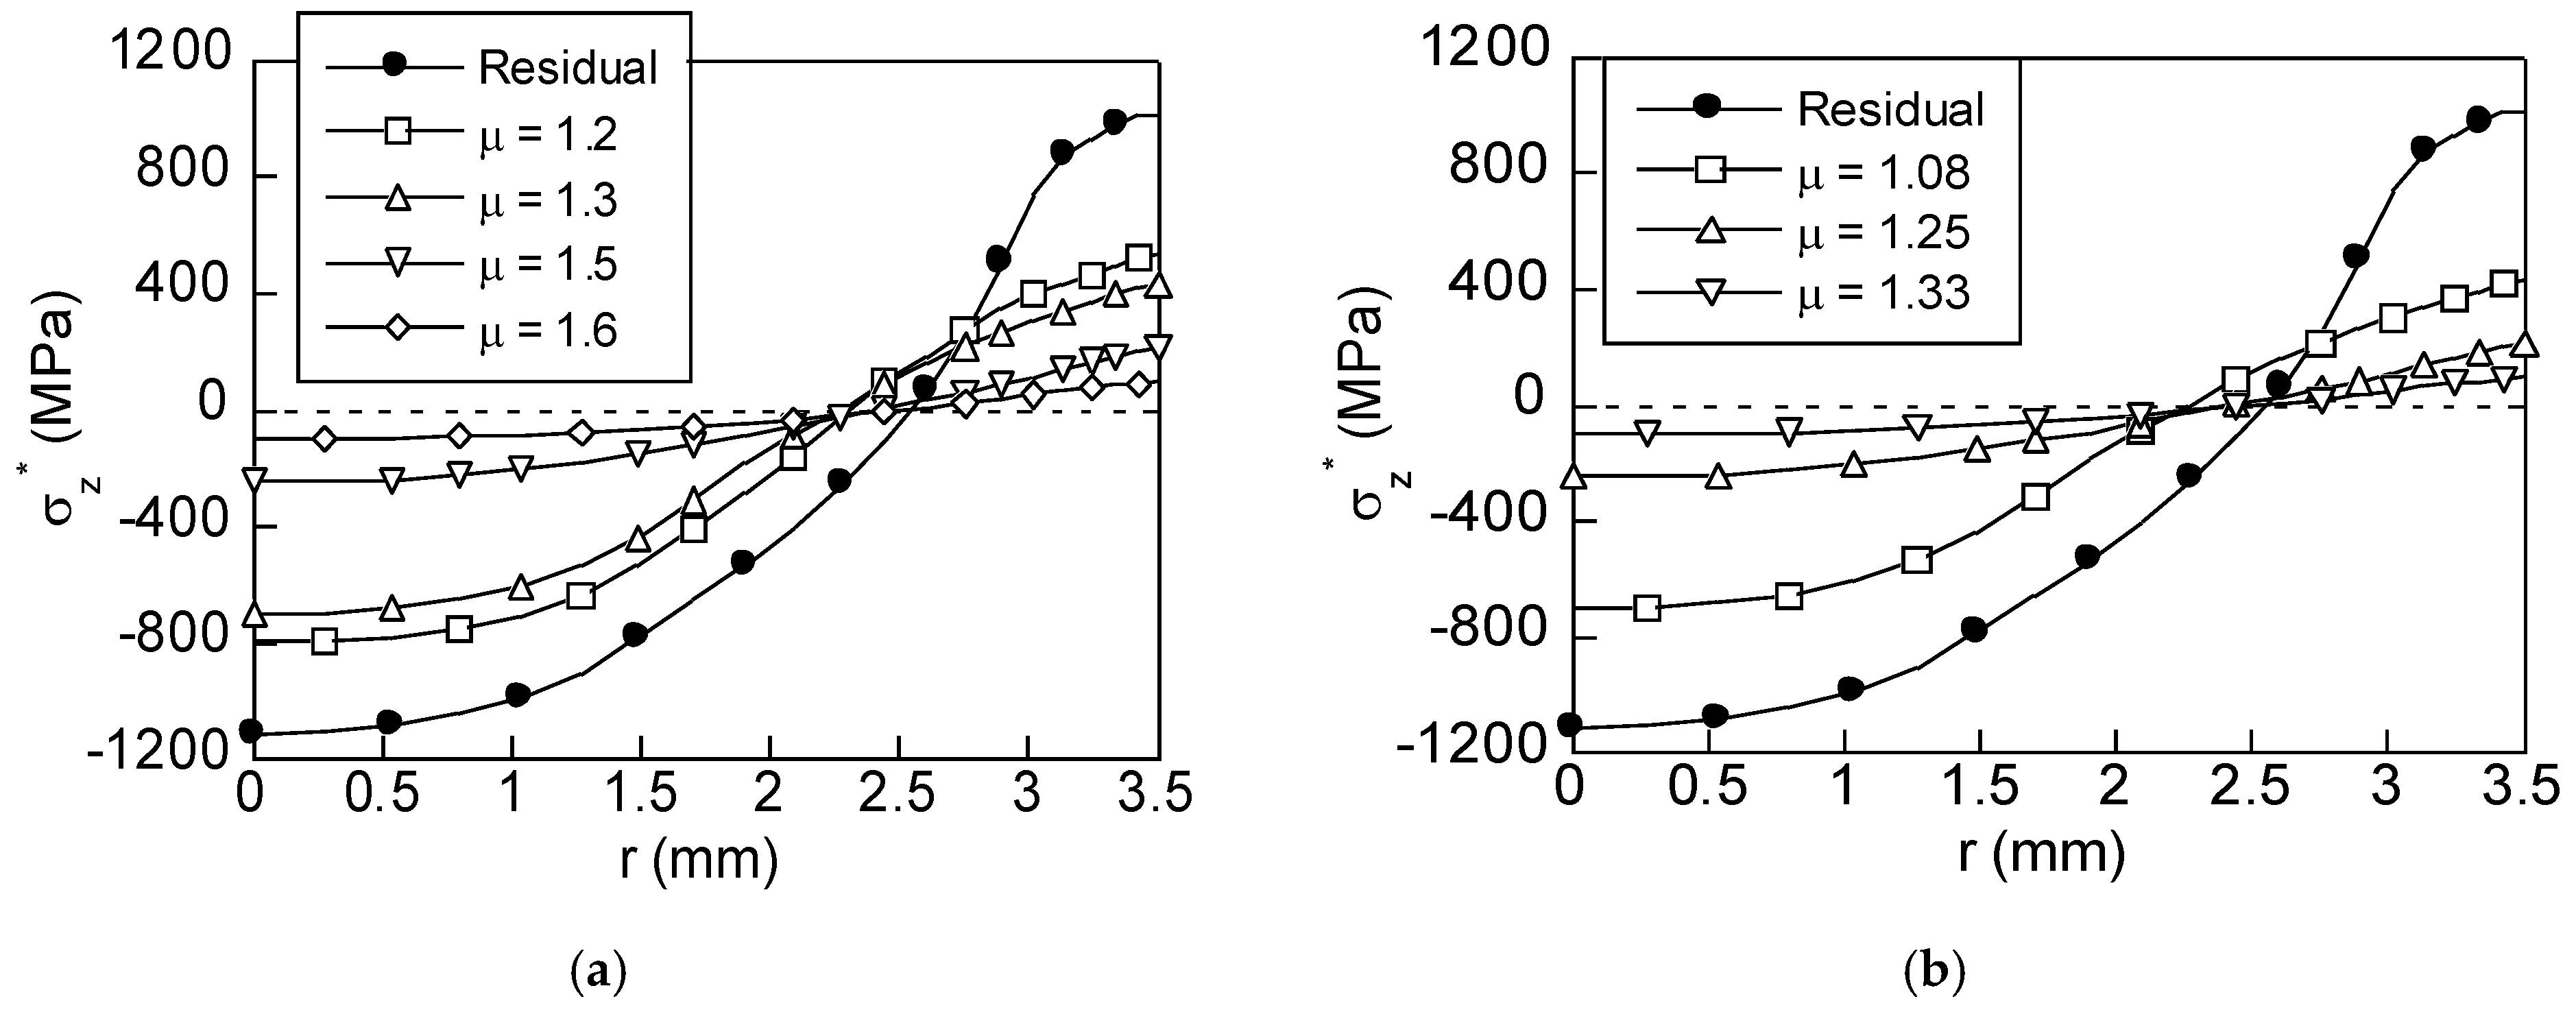
Thus,
Figure 7a,b represents the radial distributions of the axial stress after cyclic loading of maximum stress level of 1000 MPa and 1200 MPa, respectively, considering different values of μ according to
Table 2.
The effect of plastic strains is also reflected in a residual stress redistribution after the overload during cyclic loading. Thus, a progressive reduction of the stress state at the wire surface and the wire core is caused as the intensity of the overload grows. Thus, for the lowest value of the overload (Loading Ia, μ = 1.2), a remarkable 47% reduction of the stress is achieved at the wire surface, and for the highest value of μ (Loading Id, μ = 1.6), the reduction is as high as 90%. This effect is also shown in the compressive stress zone of the distribution. As observed in the case of uniform cyclic loading (no overload), significant reductions are achieved in the compressive stress zone only for overloads overcoming the material yield strength. Consequently, the stress distributions obtained after overloading are more uniformly distributed in the radial direction of the wire.
4. Discussion
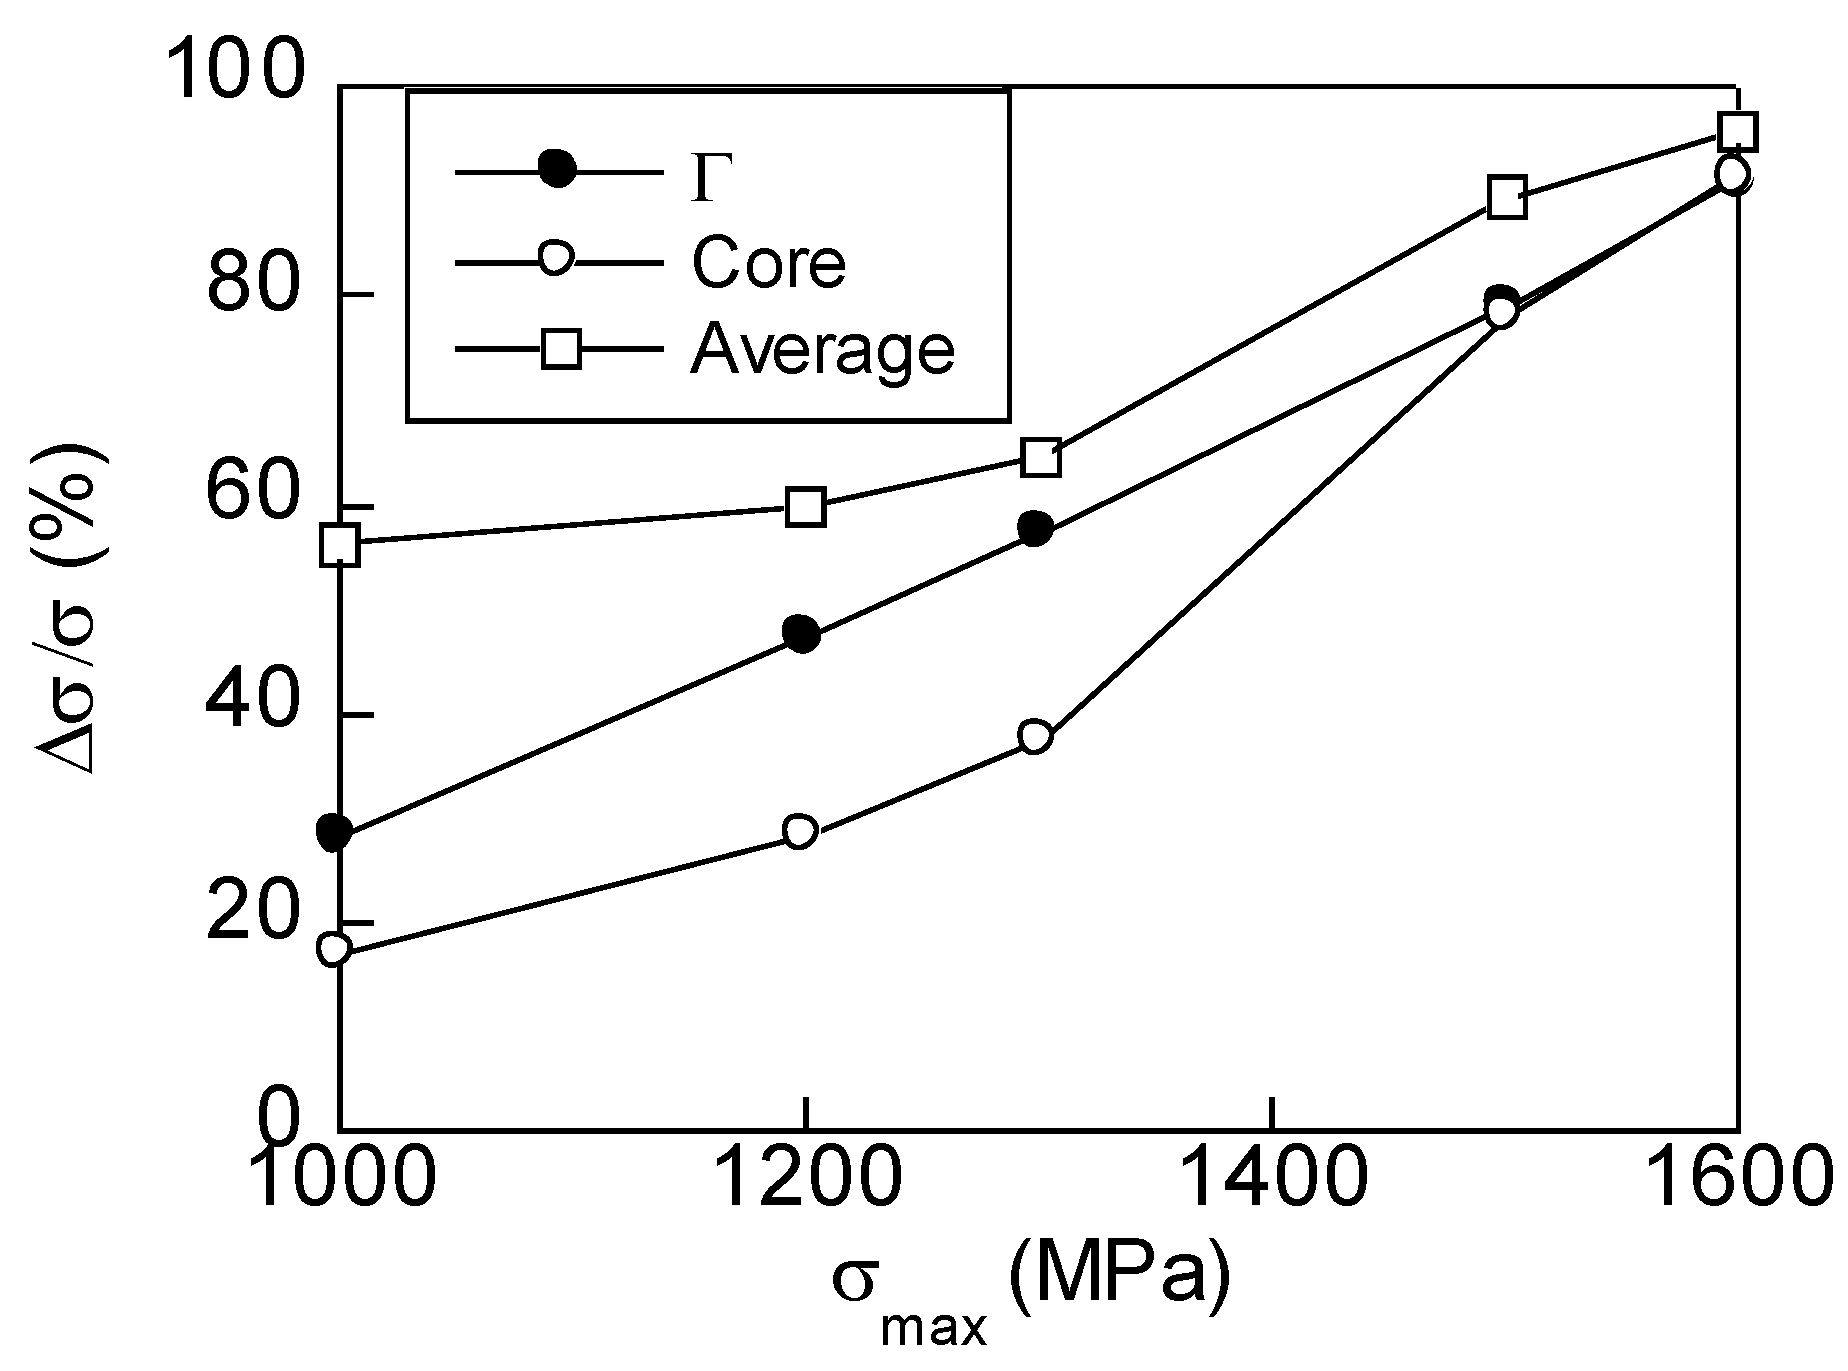
To analyse the variations of stress reduction with the cyclic loading, a dimensionless parameter (Δσ/σ) is defined as the reduction of the axial stress (Δσ) divided by the axial residual stress itself (σ). This parameter is evaluated at the wire surface, Γ (maximum stress in the tensile zone, cf.
Figure 2b), and in the wire core (maximum stress in the compressive zone, cf.
Figure 2b). In addition, it was also applied for the average stress as a measure of the uniformity of the stress distribution. Taking this into account, the values of this parameter are represented in
Figure 8 against the value of the maximum in-service stress (σ
max) for the first study (uniform cyclic loading) and against the overload ratio (μ) for the second one (cyclic loading with overload). As observed in
Figure 8, a linear growing trend is exhibited for the stress reduction at the wire surface.
Figure 8 reveals different trends for the three analysed stress reductions. Thus, at the wire surface, a highly linear growing trend is observed with the maximum cyclic loading. The correlation coefficient is as high as 0.999. Consequently, the fitting equation (Δσ/σ = −77.234 + 0.104 σ
max) could be useful for estimation of the stress reductions expected when another maximum stress loading level is applied. The stress reduction can be as high as 50% for stress within the elastic regime (Loading I and II in
Table 1), and as high as 90% for the highest loading considered (Loading V in
Table 1) within the plastic regime.
On the other hand, in the wire core, the stress reduction grows linearly with the maximum stress loading, but in two different ways, depending on if the maximum stress is higher or lower than the material yield strength. Thus, the slope (variation of the stress reduction) of the first stage (σmax < σY) is lower (due to the negligible effect of local plasticity in the wire core) than for the second stage (σmax > σY), where full plasticity appears.
This way, the stress reduction for the lowest loading (Loading I in
Table 1, 1000 MPa) is only 20%, and can be as high as 30% for the case in which the maximum stress reaches the material yield strength (Loading III in
Table 1, σ
max = σ
Y). However, in those cases which generate plastic strains at the wire core, the stress reduction reaches the same values obtained at the wire surface. Finally, the variations of the stress reduction for the average stress obviously exhibit the same trend observed in the case of the wire core: soft reductions (low slope in
Figure 8) as the maximum cyclic loading is increased for the cases of local plastic strains near the wire surface, and high reductions (high slope in
Figure 8) when the maximum cyclic loading overcomes the material yield strength, so a higher stress reduction can be achieved applying lower increments of the maximum cyclic stress.
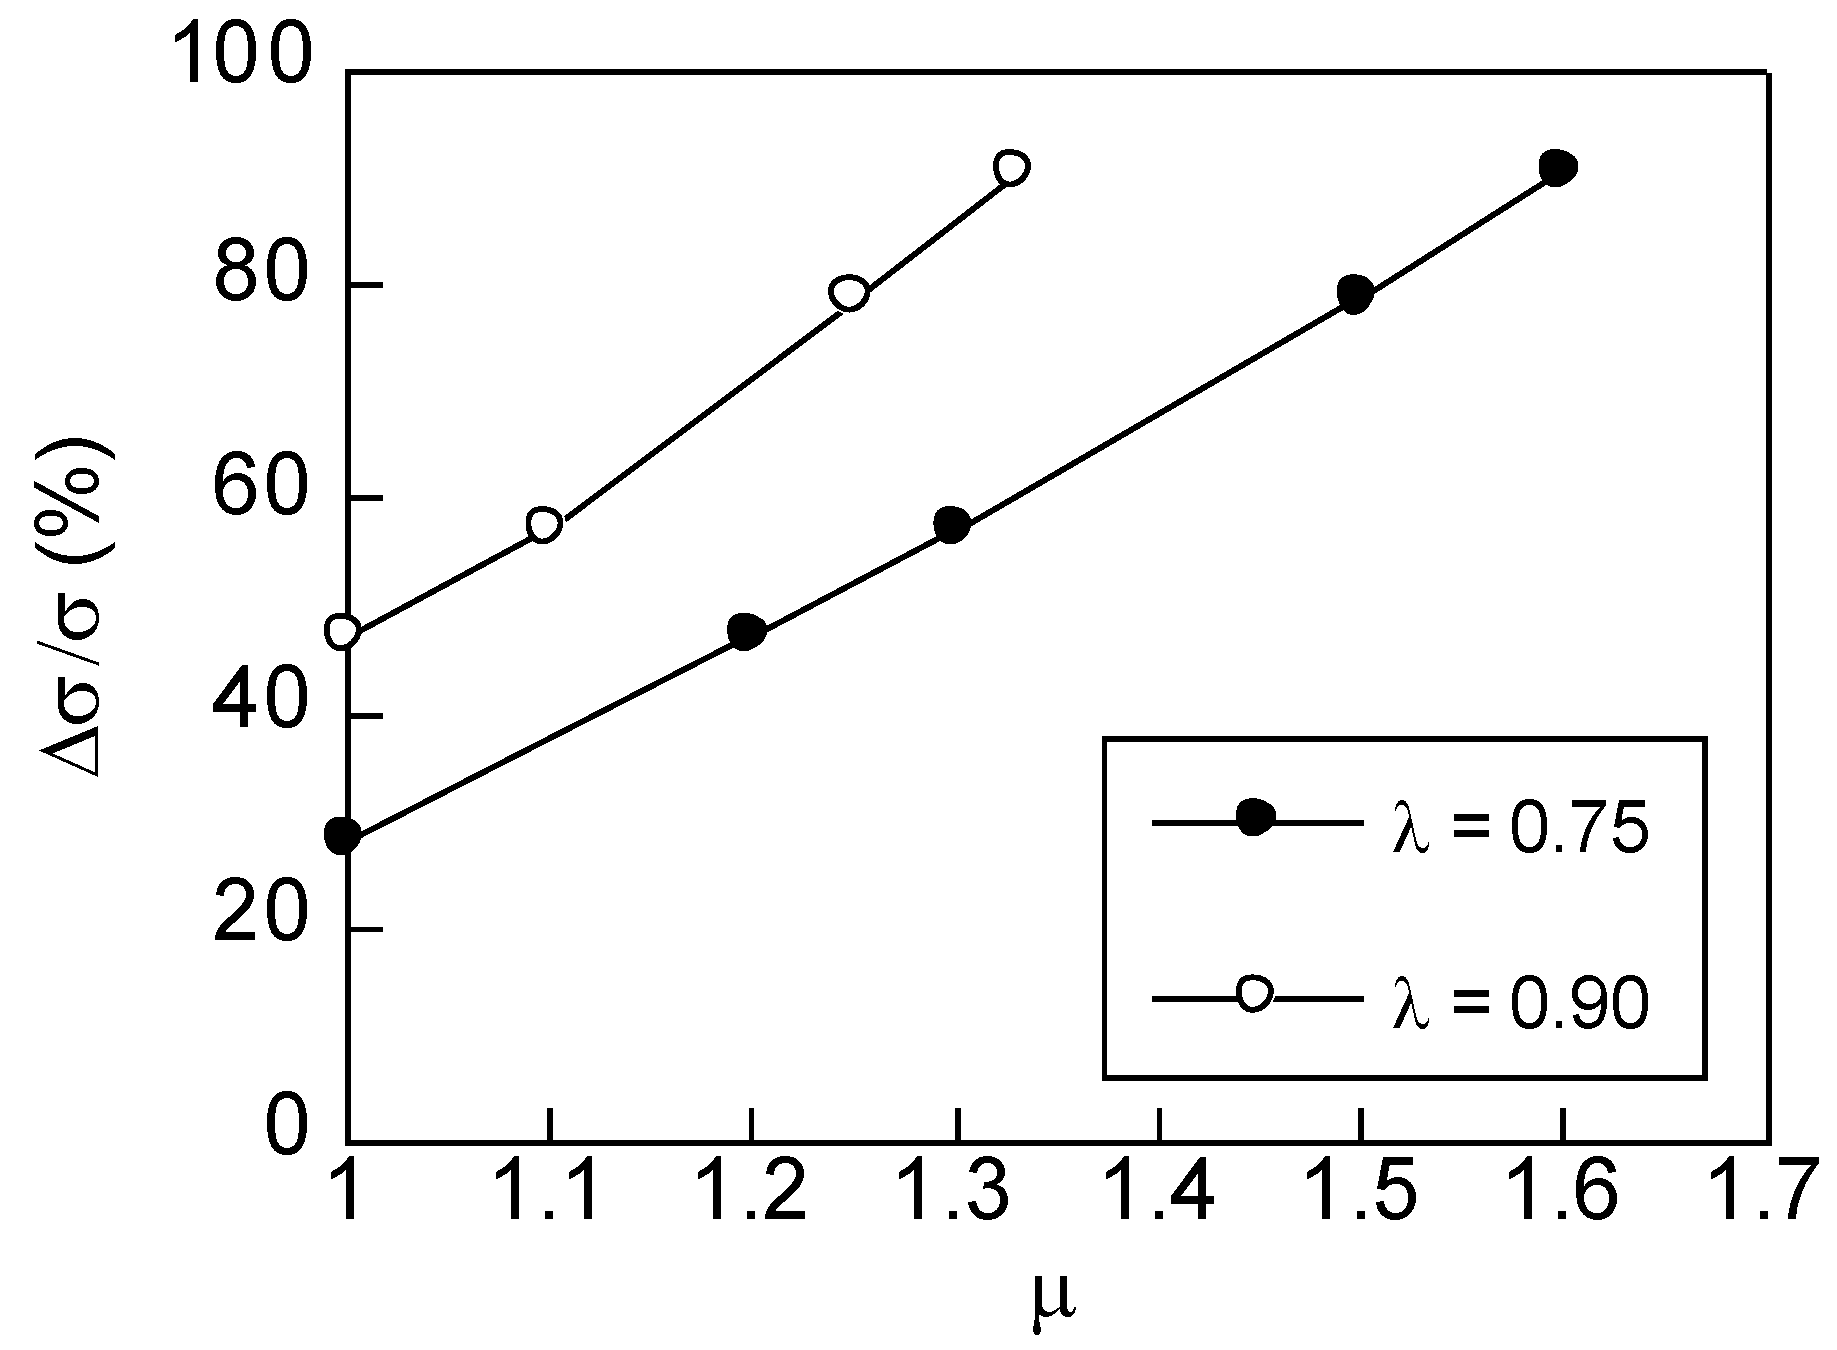
In the case of the results obtained for cyclic loading with overloads, the stress reduction achieved for the two base cyclic loading (0.75 σ
Y and 0.90 σ
Y) are shown in
Figure 9 for the wire surface and in
Figure 10a,b for the wire core and average stress, respectively. As in the case of uniform constant maximum stress loading, a highly linear growing trend is achieved for the stress reduction at the wire surface, reaching reductions as high as 90% for the highest overload (Loading Id and Loading IIc in
Table 2).
It is worth highlighting that the same stress reductions can be obtained by using a higher overload stress and lower maximum in-service loading (Loadings Ia–d in
Table 2) or by applying a lower overload stress and a higher maximum in-service loading (Loadings IIa–c in
Table 2). On both ways, the same stress reduction is achieved for loadings higher than the material yield strength. In addition, the same stress reduction can be achieved by applying a uniform cyclic loading of 1200 MPa (Loading II in
Table 1) or by an overload of the same maximum stress (1200 MPa) and a base cyclic stress of 1000 MPa; i.e., μ = 1.2 (Loading Ib in
Table 2). This can be useful in design, since applying cyclic loading allows a significant stress reduction to be obtained at the wire surface, thereby reducing the fatigue cracking and increasing the life in-service of these components.
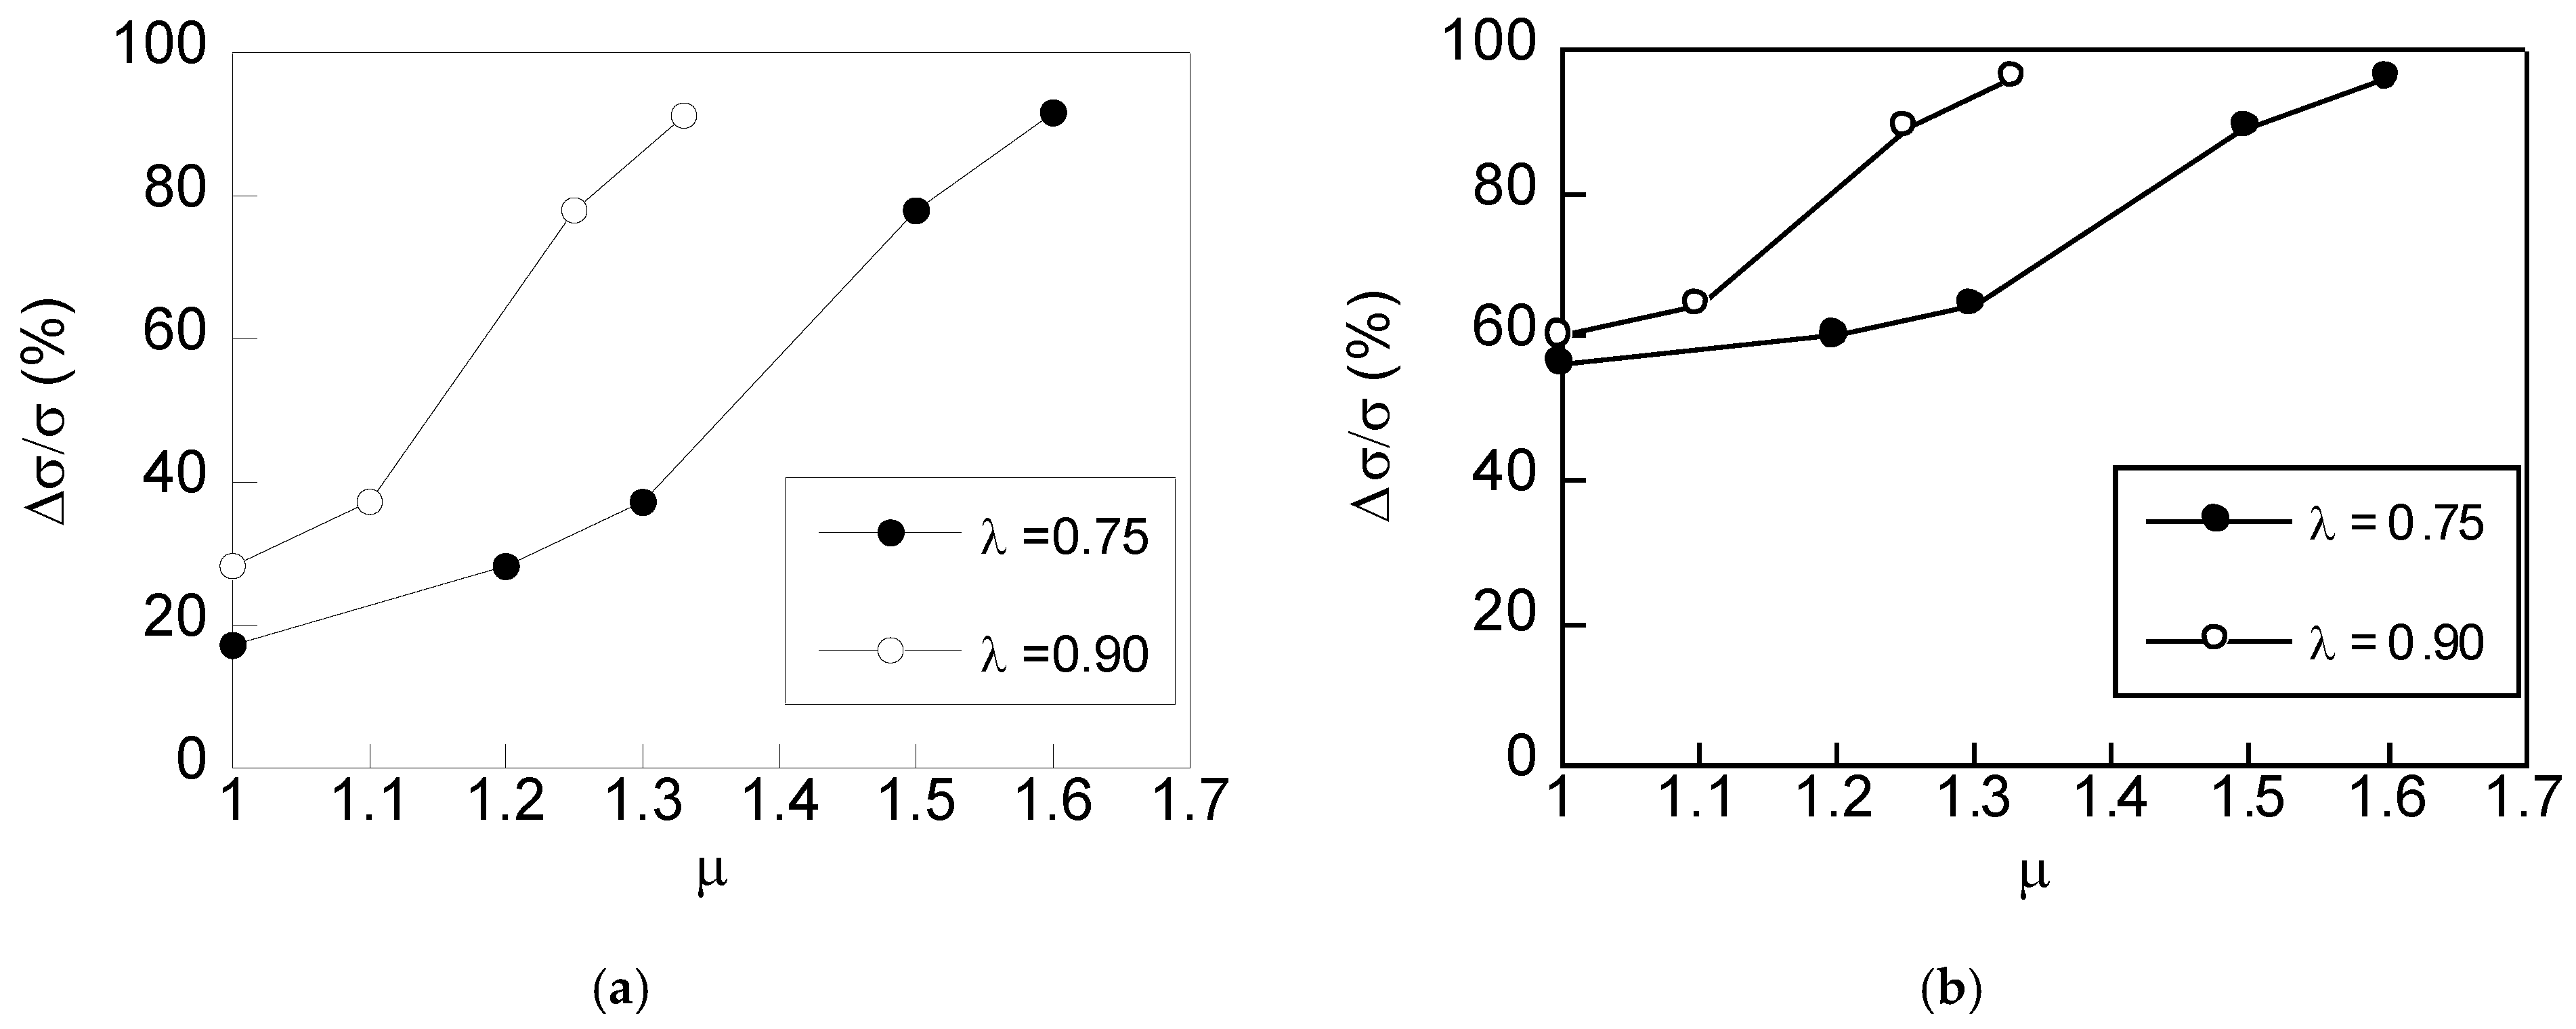
In the case of the variations of the stress reductions at the wire core and the reduction of the average stress for cyclic overloading, the same double-linear trend is observed. Thus, for those cases in which the overload stress is below the material yield strength, the variation of the stress reduction with the overload factor μ is low (low slope in
Figure 10a,b), whereas the variation is higher when the overload stress overcomes the material yield strength (high slope in
Figure 10a,b).
As in the case of the wire surface, the same stress reductions can be achieved by applying a higher overload with a lower base stress or by a lower overload with a higher base stress. For instance, a stress reduction of 90% is obtained with the lower base loading (0.75 σ
Y) and the higher overload ratio (μ = 1.6, Loading Id in
Table 2), or with the higher base loading (0.90 σ
Y) and a lower overload ratio (μ = 1.3, Loading IIc in
Table 2).
Considering the significant stress reductions obtained after cyclic loading, the exposed approach has many advantages from an engineering design point of view, since a significant reduction of tensile residual stresses at the wire surface is achieved by applying common values of the in-service cyclic loadings. Thus, the fatigue life and the structural integrity against HE phenomena of these components can be improved.
However, caution must be taken to avoid the material over-damage or overstressing. As explained in [
27], controlled overloads also enlarge the life in-service of prestressing steel cracked wires in the presence of hydrogenating environments. Thus, the plastic zone and the compressive residual stresses generated by an overload in the vicinity of the crack tip acts as a barrier for hydrogen entry, delaying the hydrogen microstructural damage leading to HE.


