Pulsed Thermography Applied to the Study of Cultural Heritage


Dipartimento di Ingegneria Industriale, Università degli Studi di Roma Tor Vergata, via del Politecnico 1, 00133 Roma, Italy
*
Author to whom correspondence should be addressed.
Appl. Sci. 2017, 7(10), 1010; https://doi.org/10.3390/app7101010
Submission received: 23 August 2017
/
Revised: 26 September 2017
/
Accepted: 27 September 2017
/
Published: 29 September 2017
(This article belongs to the Special Issue Novel Ideas for Infrared Thermography also Applied in Integrated Approaches)
Abstract
:In this paper, an overview of the recent applications of pulsed infrared thermography is presented. Pulsed infrared thermography, which provides stratigraphic information by analyzing the heat diffusion process within the sample after a thermal perturbation, is applied to the investigation of different kinds of cultural heritage artefacts. In particular, it is used to analyze repairs, decorative elements, and casting faults on bronzes, to detect texts hidden or damaged in ancient books/documents, and to characterize paint decorations. Moreover, the integration of pulsed infrared thermography and three-dimensional shape recording methods is proposed in order to provide a three-dimensional representation of the thermographic results. Finally, it is shown how the obtained thermographic results may be crucial from the historical and artistic points of view for understanding the modus operandi of a specific artist and/or of a workshop and for reconstructing the manufacturing process of the analyzed artefacts.
1. Introduction
In recent years, the number of non-destructive investigations applied to the study of cultural heritage artefacts has increased. In fact, the characterization of structures and materials, as well as of the artistic features of cultural heritage, enables us to consistently improve our understanding and helps in determining their preservation state. When investigating cultural heritage, two of the main purposes consist of the characterization of the artefact constituent materials and the study of the manufacturing process. They are often achieved by the application of specific diagnostics, namely non-destructive testing (NDT), which enables the investigation of artwork materials without causing damage [1,2]. Among them, infrared thermography (IRT) has been successfully applied to the investigation of cultural heritage structures and materials [3,4,5,6,7,8,9,10,11,12,13,14,15]. In particular, in the active IRT approach, an external stimulus is required to generate temperature variations whose time evolution may witness the presence of subsurface anomalies [16]. Active IRT allows researchers to obtain both qualitative and quantitative evaluations of the sample structure as a function of depth by monitoring the transient behavior of the induced temperature change. Depending on the external excitation mode, different configurations of active IRT can be identified, the main ones being pulsed and lock-in IRT. They are based on the photothermal techniques which in general have been proven to be useful in determining some thermophysical parameters in liquids and solids [17,18,19,20,21,22]. Pulsed IRT involves recording the time dependence of the distribution of the infrared (IR) radiation locally emitted across the sample surface following the heating of the sample produced by a pulsed illumination [16]. On the other hand, in the lock-in IRT configuration, an oscillating temperature field is produced by a periodic heating of the sample surface, then detected by a synchronized IR camera according to the lock-in processing technique [16,23]. With respect to pulsed IRT, a larger signal to noise ratio can be obtained in the thermographic images, but the gathering of that information originating at different depths in the sample requires several measurements performed at different frequencies instead of a single one as a function of time.
In the last years, pulsed IRT has been the most applied configuration in the study of different kinds of small-size artefacts, such as library and archival materials, archaeological findings [24,25,26], and works of art [27]. In particular, it has been proposed for the investigation of the mosaic preservation state [28,29,30,31] and for the study of sculptures [27,32]. In 2015, IRT was used by Di Tuccio et al., to analyze the cracks of the “Ratto delle Sabine”, a model mainly composed of raw clay in the outer part and of several different materials in the inner part, to evaluate the level of weathering of the statue, in particular that related to the previously mentioned cracks [32].
Concerning the study of books and documents, IRT has been used to study historical bindings, providing information on both the assembled structure and the various component materials. In the bookbinding analysis, the thermographic imaging allowed researchers to detect the presence of damage, to investigate the adhesion state of the different parts of the bookbinding, and consequently to evaluate their preservation state [33].
In the study of paintings, IRT has been applied to reveal the adhesion of the paint layer to the support, to observe the canvas or wood texture, and to detect defects [34,35,36] also investigated by other imaging techniques [37,38,39,40,41]. Different thermographic configurations have been used for the analysis of wood-based and canvas-based paintings, providing successful results, for instance, in the detection of delaminations and degraded regions and also in the study of pentimenti and underdrawings by integrating IRT with other imaging techniques [13,42,43,44,45]. Moreover, in 2012, Daffara et al. proposed a new method called Thermal Quasi-Reflectography (TQR), which consists of recording the middle-wave infrared (MWIR) radiation reflected by the investigated sample. Such a method has been successfully applied to the study of mural paintings showing details that are not revealed by conventional infrared reflectography (IRR) [46].
In this review, the results obtained in the past, as well as the new ones, which were considered useful for a more complete description of the state of the art of pulsed IRT applications in the field of cultural heritage are presented. Accordingly, the results are grouped based on the three main categories: the analysis of bronze sculptures, the recovery of hidden or lost texts in ancient books and documents, and the characterization of painted decorations in archival and library supports. First, the application of pulsed IRT to the analysis of ancient bronzes, like the Capitoline She Wolf, which aimed to detect features under the polished and patinated surfaces, are reviewed [47,48,49]. Some geometrical characteristics of the casting faults are also investigated by means of a series of quantitative studies [49]. Moreover, the results obtained by IRT in the detection of hidden or invisible book contents are shown. It is described how texts found in many historical bookbindings, generally belonging to scraps of older books and reused to assemble more recent book structures, can be investigated without dismantling the bookbinding [50]. Different kinds of paint decorations on parchment supports are also analyzed by IRT. In particular, IRT is proposed for the investigation of structural, surface, and subsurface features in illuminations [51]. It is shown how IRT allows researchers to characterize the conservation state of the gildings, revealing detachments and inhomogeneities of the gold leaf, and how it can be employed in the detection of subsurface features buried beneath the paint layer, like underdrawings and pentimenti [52], which are commonly investigated by other techniques operating in the infrared region [52,53].
2. Method
The studies reviewed in this paper have been performed by means of a pulsed IRT analysis. This basically consists in quickly heating the sample by the absorption of a light pulse, consisting of radiation in the ultra-violet (UV), visible (VIS), and near-infrared (NIR) range, and analyzing the subsequent temperature decay phase with an infrared camera which records the radiation emitted in the middle-wave infrared region (MWIR) or in the long-wave infrared region (LWIR) [16]. The presence of inhomogeneities of the thermal properties, possibly associated with subsurface defects, alters the local heat diffusion rate and, consequently, the temperature at the corresponding surface point where a thermal profile of the inhomogeneities can therefore be displayed in the infrared image, the so called thermogram, generated by the IR camera. The thermograms are recorded at regular time intervals during the thermal perturbation and the subsequent cooling phase associated with the heat diffusion into the sample volume. Pulsed IRT can be applied in two different modes: the front face heating mode, where the heating and the detection are carried out on the same sample surface, and the rear face heating mode, where they are carried out on opposite sides of the sample [16]. In both modes, the analysis of the time evolution of the temperature distribution at the sample surface also allows researchers to determine the value of the thermal diffusivity (D) of the constituting material [9,24,49,56]. The determination of D, a physical quantity which accounts for the rate at which a thermal perturbation diffuses throughout a material, is fundamental to perform quantitative studies of the geometrical characteristics of some subsurface features. The quantitative analysis of the thermographic results and, in particular, that of the time dependence of the thermographic signal, requires the processing of experimental results according to a theoretical model. Therefore, by solving the one dimensional heat diffusion equation when the pulsed light absorption occurs at a sample surface (x = 0), one obtains the following expression for the time dependence of the temperature rise at a depth x in the sample [57,58]:
where ρ is the density, c is the specific heat, k is the thermal conductivity, and Q is the absorbed heat per unit surface. The time dependence in the exponential function is only characterized by the sample thickness L and the thermal diffusivity D. Therefore, substituting in the expression x = 0 or x = L, the solution at the sample front face or rear face heating modes, respectively, is obtained.
For the front face heating mode, substituting x = 0, yields:
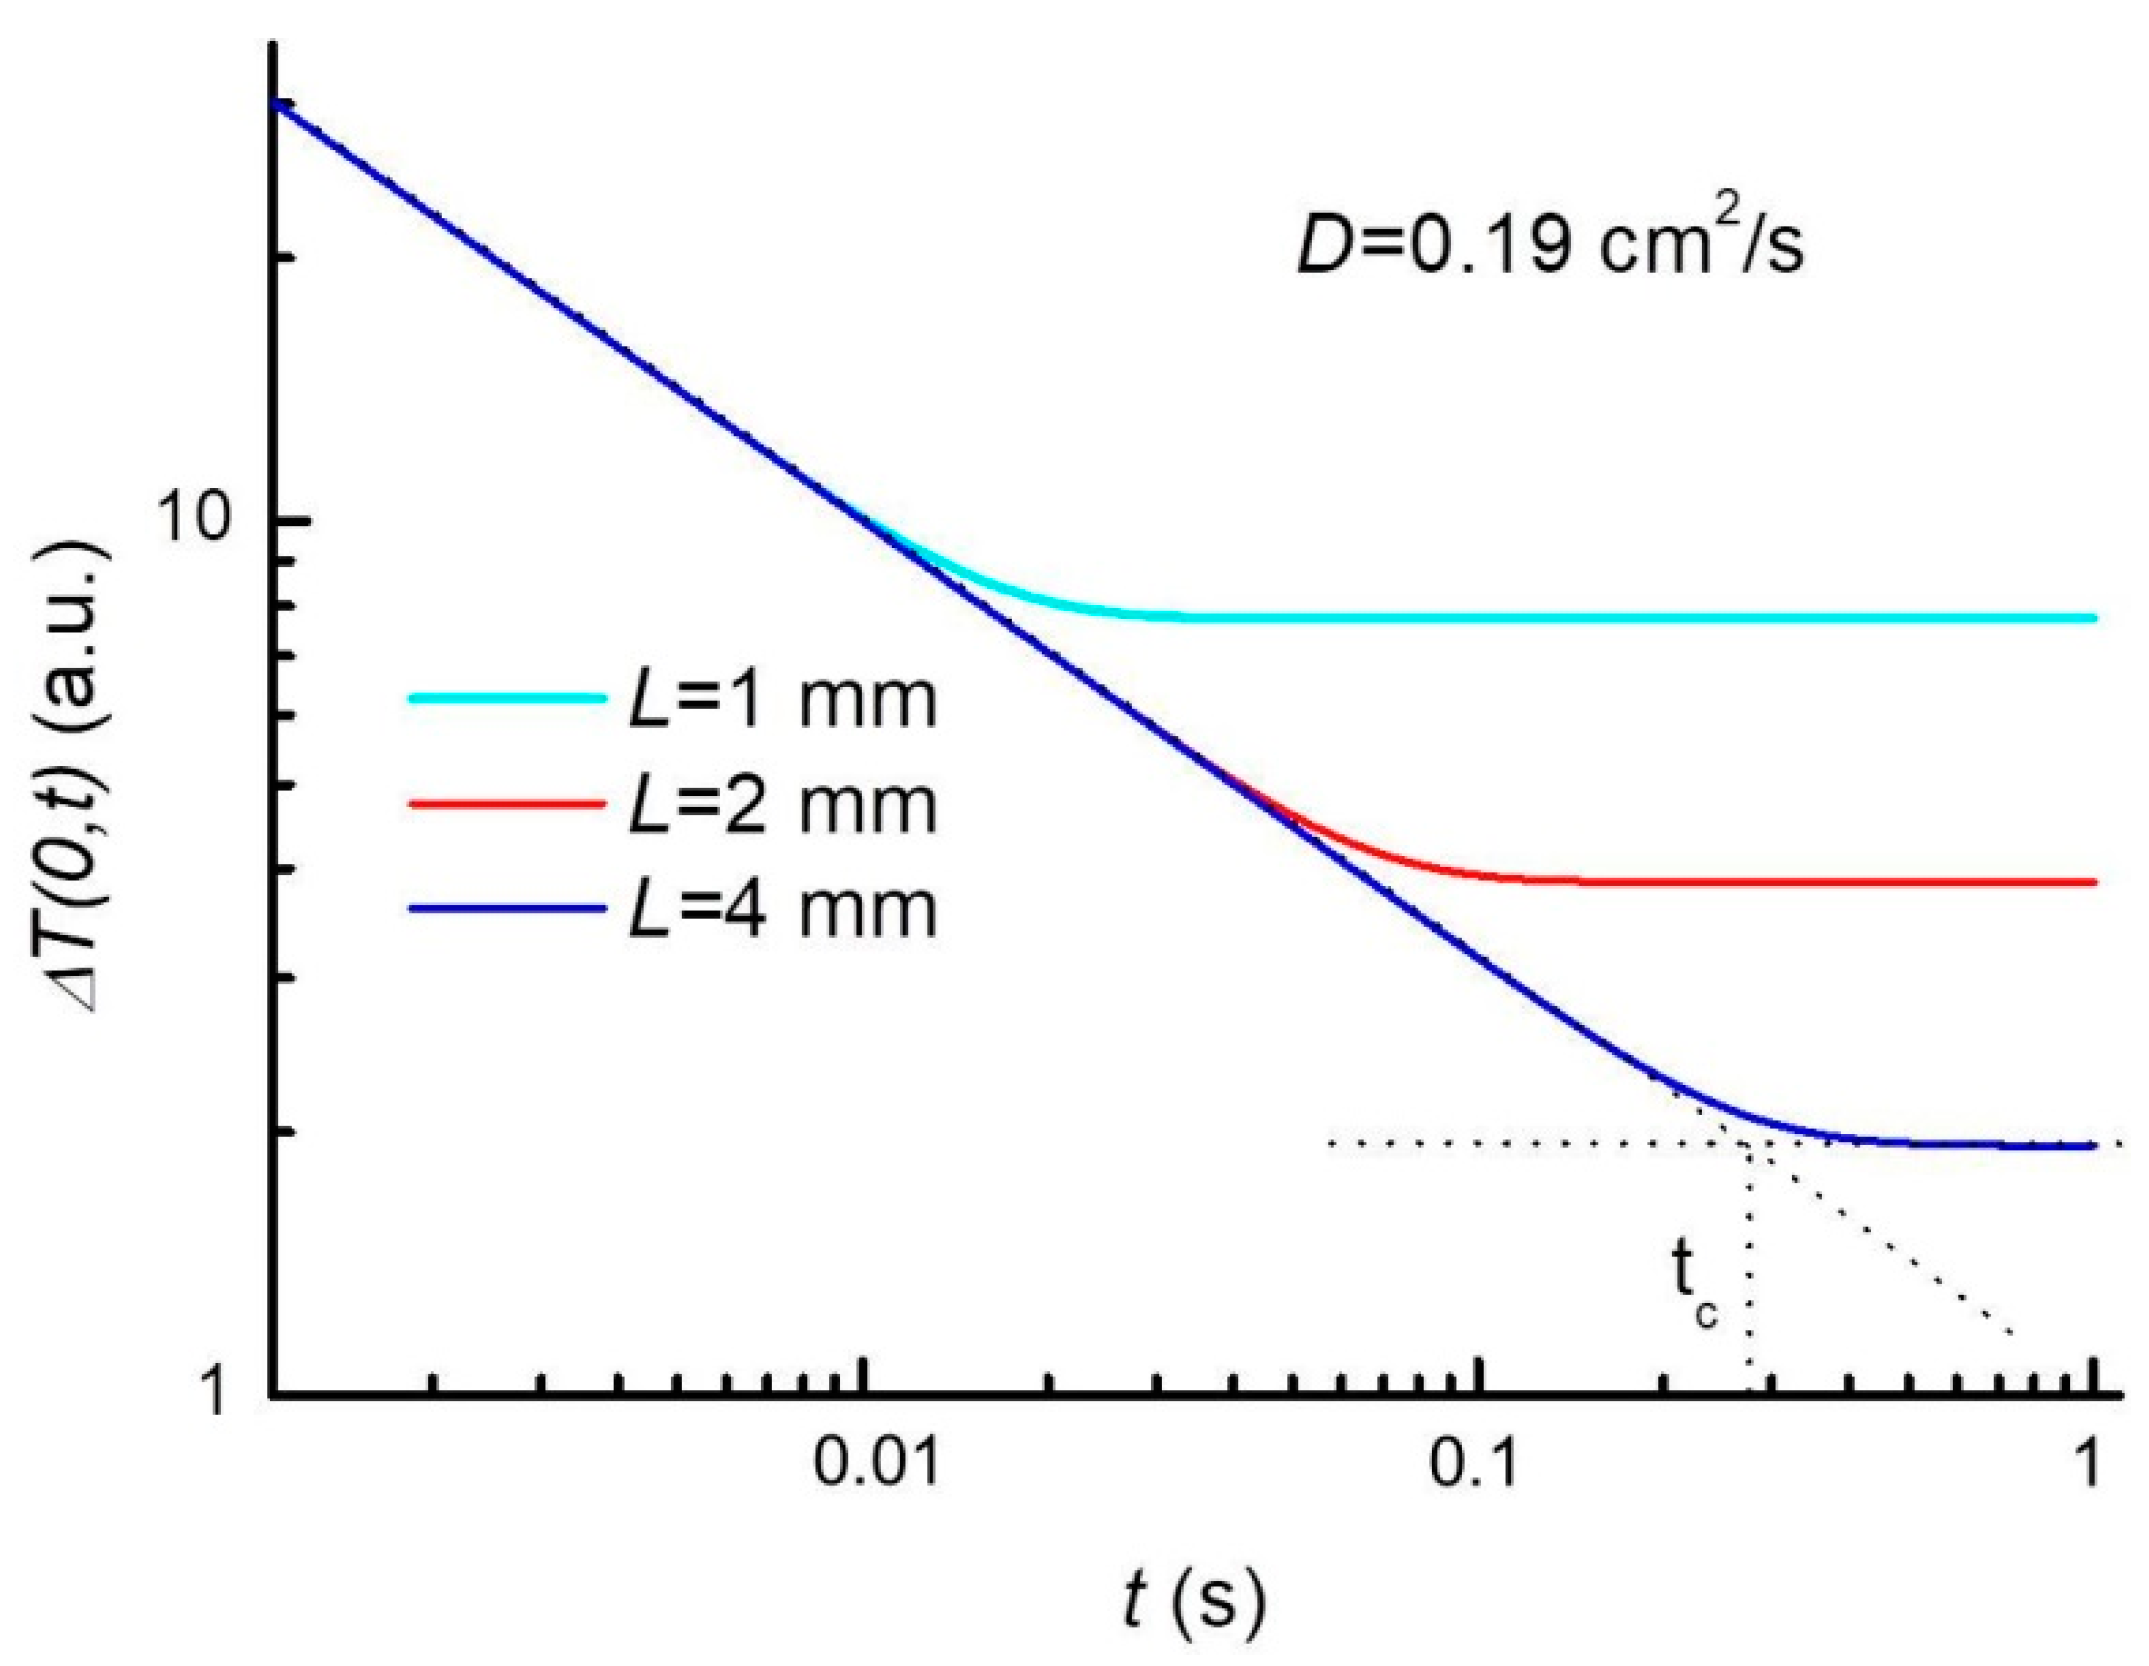
Figure 1 shows the double logarithmic plot of the decay of the surface temperature with the time calculated for different L values and for D = 0.19 cm2/s, which is the typical value for bronze [24]. Two different behaviors are clearly shown. The first one, characterized by a −1/2 slope line in the logarithmic plot, is observed at short times when the surface temperature change ∆T(0,t) evolves as t−1/2, as expected from the theory of the heat diffusion in a semi-infinite homogeneous material according to which the temperature change can be expressed as [16]:
Deviations from this decay rate occur when the heat reaches the opposite surface x = L and further diffusion is inhibited. At larger times, ∆T(0,t) stabilizes to the thermal equilibrium value [57]:
corresponding to a horizontal plateau in the graph.
The front face heating mode of pulsed IRT allows a determination of the sample thermal diffusivity. From the plot shown in Figure 1, it is possible to derive the crossing time tc which corresponds, in the ∆T(0,t) plot, to the intersection point of the lines extrapolating the time dependence described by the Equations (3) and (4). Such a crossing time tc is therefore related to the thermal diffusivity by [59]:
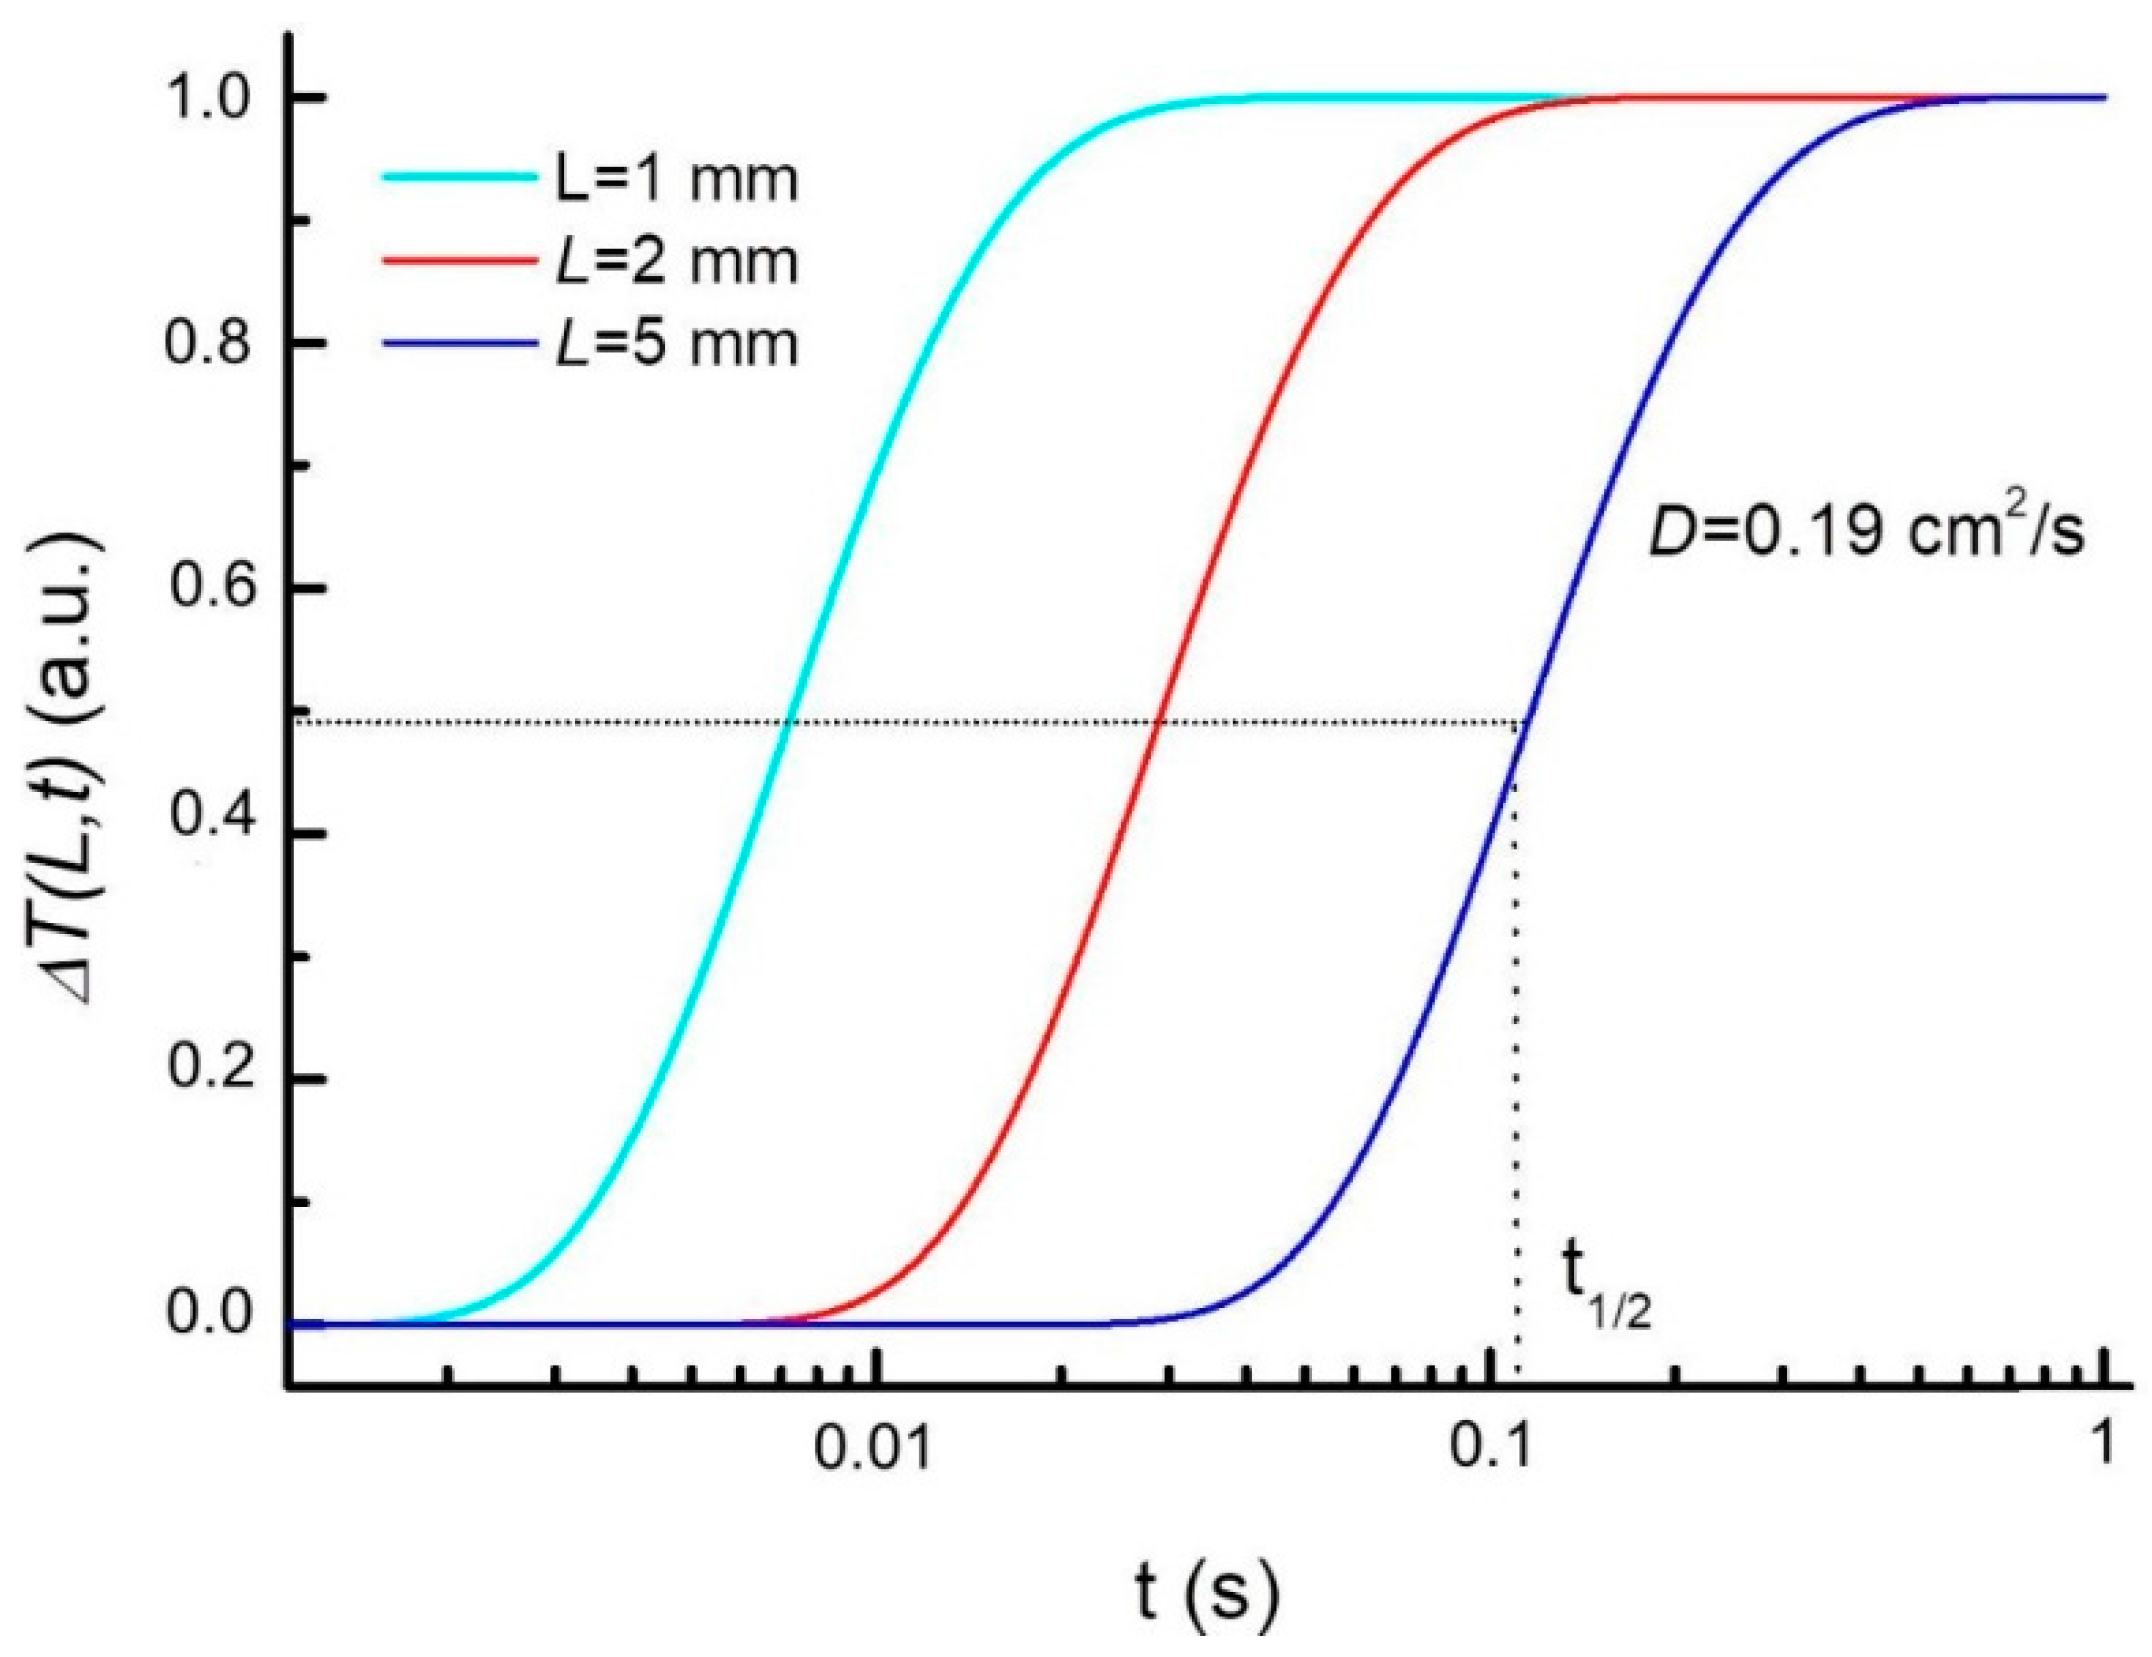
For the rear face heating mode, the solution can be obtained by substituting x = L in Equation (1), so that:
Figure 2 shows the semi-logarithmic plot of the normalized transient temperature rise ∆T(L,t) vs. time calculated for the same L and D values of Figure 1. Such a configuration also enables researchers to evaluate the thermal diffusivity from the t1/2 time at which the transient temperature ∆T(L,t) reaches half of its maximum value (see Figure 2). The diffusivity can be obtained from the expression [56]:
From Equation (7), D can be evaluated when L is known and vice-versa.
3. Results
Hereafter, some recent applications of pulsed IRT, performed by the same authors of this review, are described and discussed according to the three categories already presented. It should be briefly remarked that the results were obtained by using the following instrumentation. To illuminate the investigated artefacts from one to four “BOWENS ESTIME 3000”, flash lamps with a pulse duration of about 2 ms have been used, each of them having a power output adjustable from 125 W to 3000 W. The IR camera employed to record the thermograms is a CEDIP Jade III MWIR (320 × 240 pixel InSb focal plane array, 30 μm pitch, 3–5 μm wavelength range). A poly(methyl methacrylate) filter of 10 mm thick was placed in front of the lamps to prevent any MWIR radiation emitted from the lamps reaching the sample and being reflected back into the IR camera.
3.1. Analysis of Bronzes
From an artistic point of view, a very interesting application of pulsed IRT consists in the possibility to study historical bronzes produced by means of the lost wax method. According to this method, after casting, the bronze requires the repairing of casting faults—like cavities, porosities, and openings—and the cold working process, a finishing step where several tools, such as chisels, burins, and files, are used [60,61]. Finally, the marks left by such tools are usually erased or concealed during the subsequent polishing of the surface and/or the patination [60]. However, these workings produce plastic deformations and inhomogeneities in the structure of the bronze and they can be identified by IRT [61], even after the final polishing.
For opaque samples like bronzes, after the light pulse is absorbed at the sample surface, the heat diffuses towards the sample volume and in the case of a homogeneous material, it will give rise to a homogeneous evolution of the temperature distribution at the sample surface. On the other hand, as stated earlier on, the presence of inhomogeneities beneath the surface, like cavities, locally affects the heat propagation rate and it results in a localized temperature difference at the sample surface with respect to the surroundings (thermal contrast).
Recently, the IRT approach has been applied to the study of the Capitoline She Wolf, one of the most important historical bronzes hosted in the Capitoline Museums of Rome. In particular, the She Wolf mechanical and metallurgic repairs, decorative elements, and casting faults, such as cavities, have been detected in order to add information on the adopted casting method. Moreover, some geometrical information concerning the bronze thickness and the depth of the casting faults has been obtained by means of a series of quantitative studies. This requires prior knowledge of the thermal diffusivity of the constituting bronze, which is therefore measured by analyzing the time dependence of the pulsed IRT data obtained in different points of the bronze.
3.1.1. Repairs and Decorative Elements
Mechanical and Metallurgic Repairs
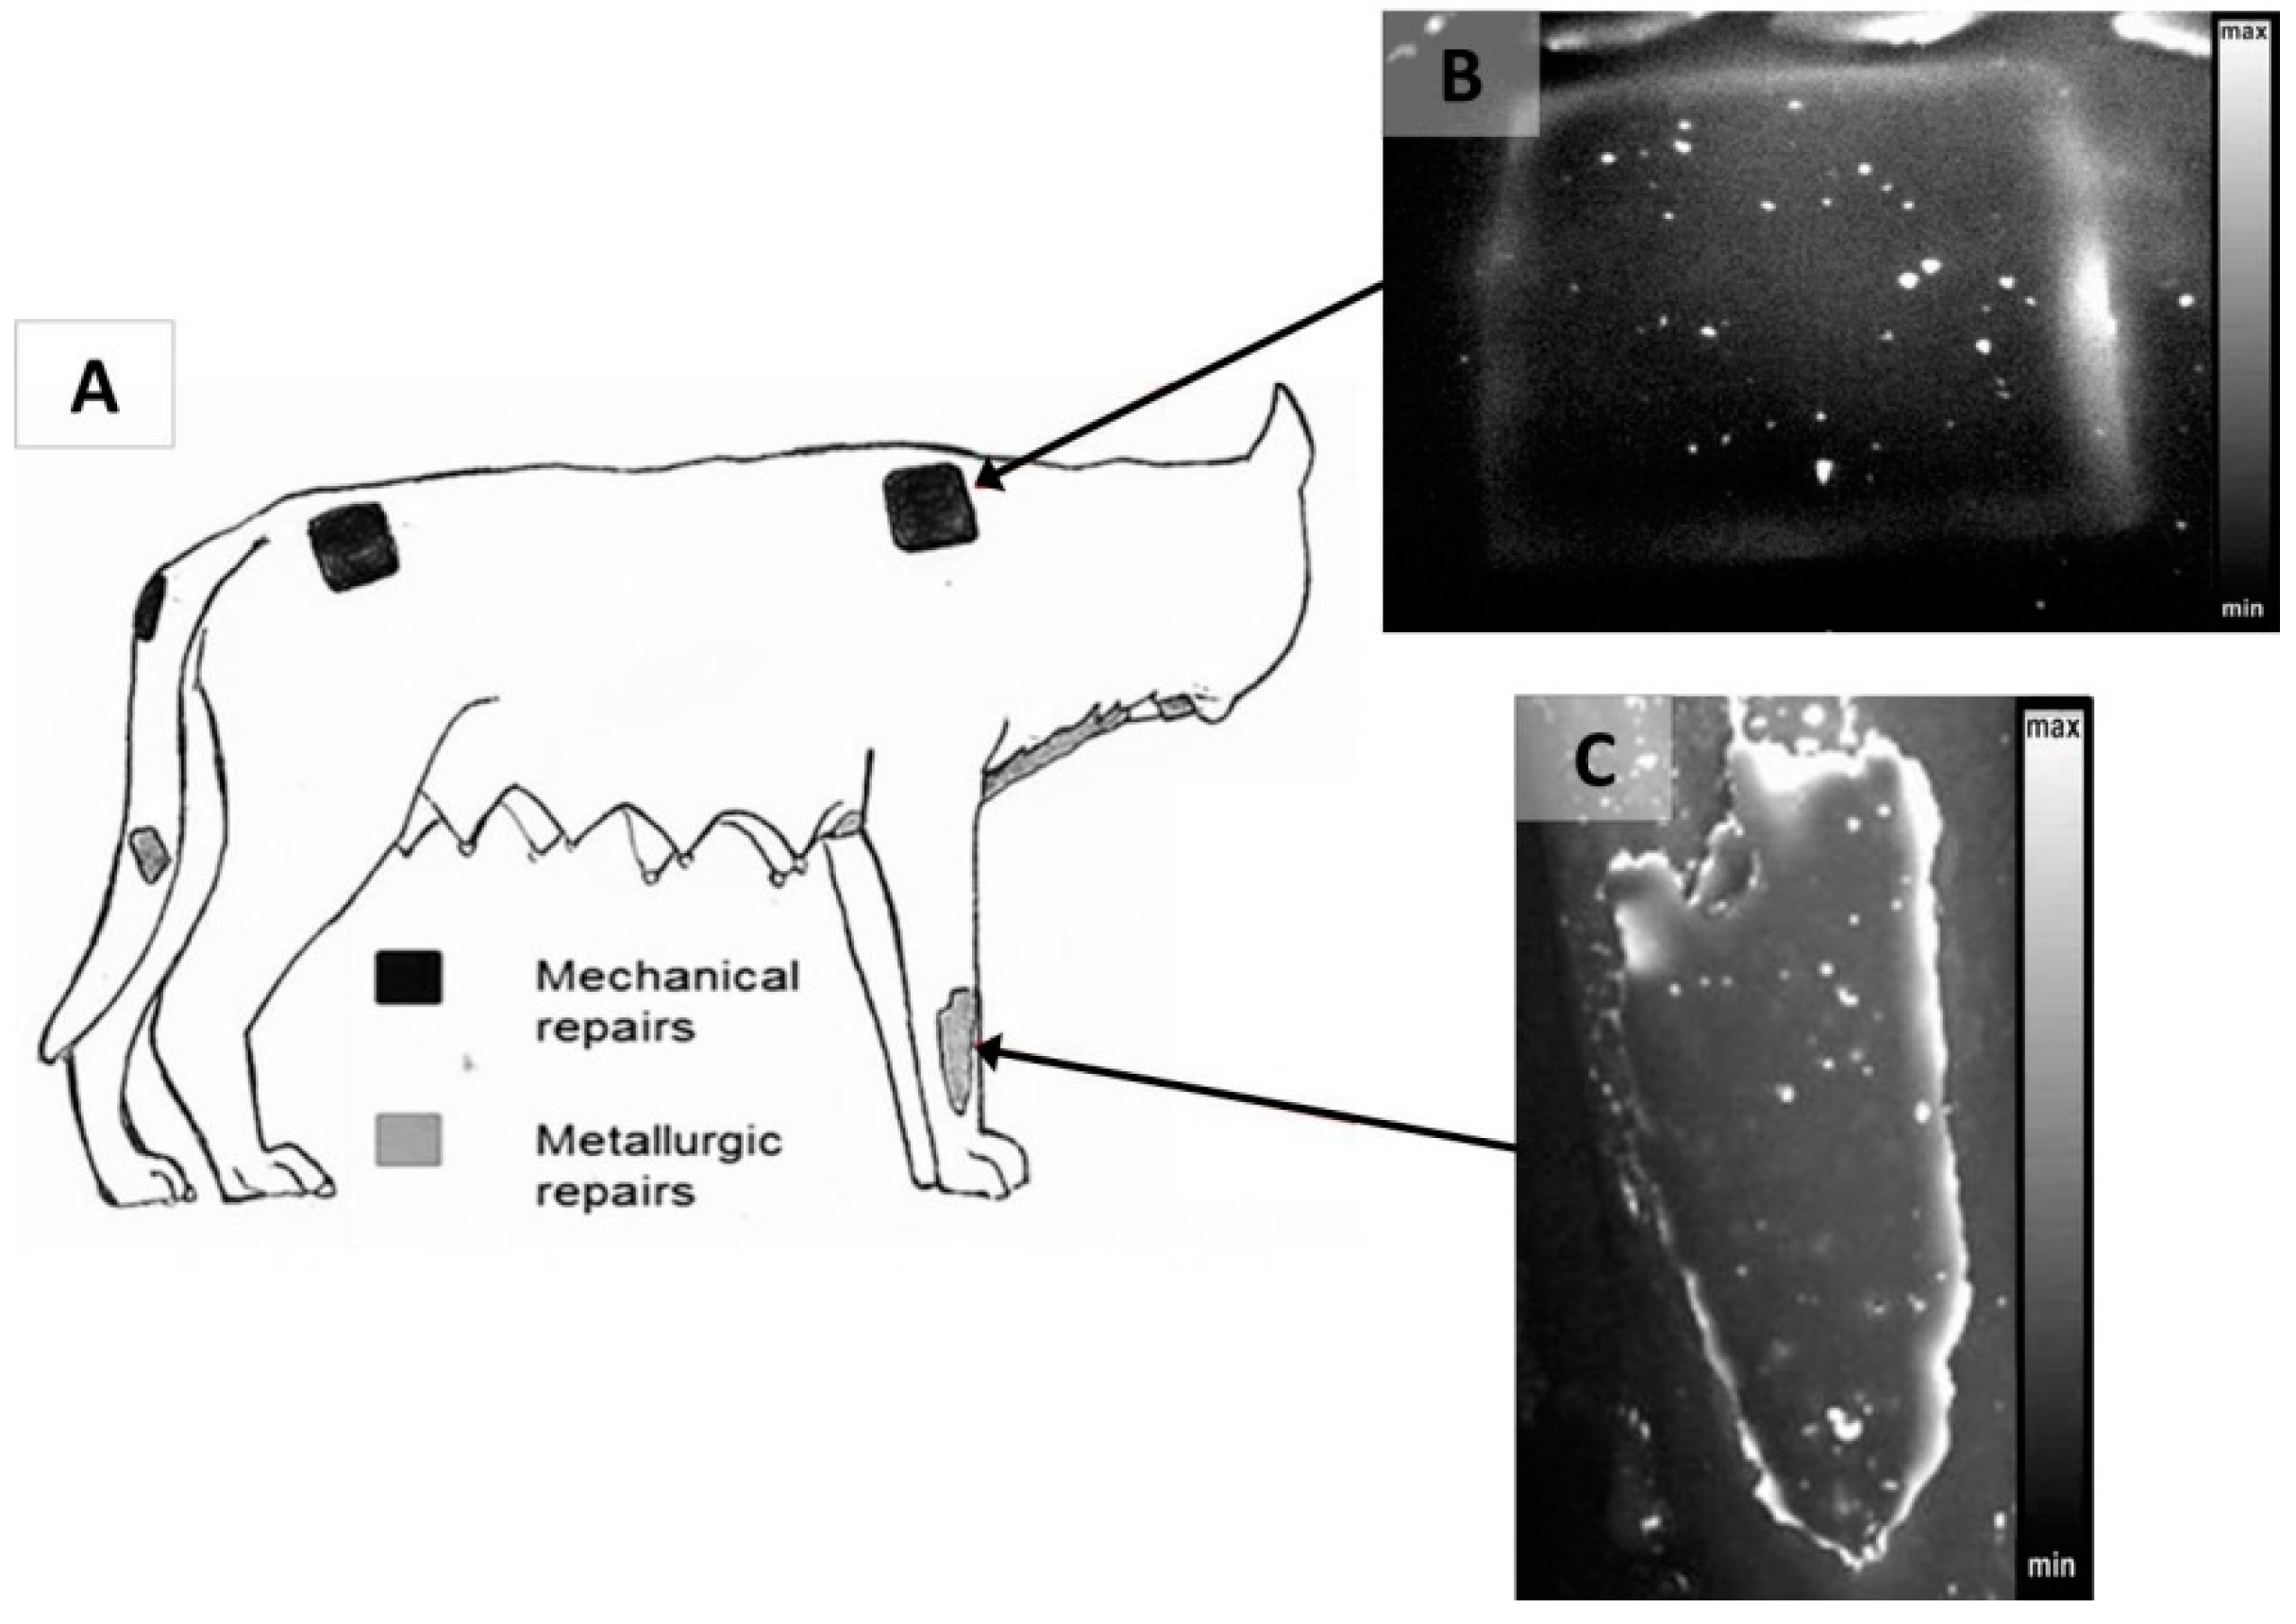
After the casting and the removal of the internal core material, the bronze sculpture can present openings made in order to insert the scaffolding elements necessary to support the mould inserted during the casting, which is then removed. These openings can be mended by different methods, the main ones referred to as mechanical and metallurgical repairs [48,62]. Mechanical repairs consist of regular patches, wedged into undercut holes, which are commonly planned and well executed. Differently, metallurgic repairs are made by forming a clay mould over the missing area and then filling it first with wax and, then, with bronze in the so called casting on method [62]. In the case of the Capitoline She Wolf, both mechanical and metallurgic repairs have been identified by means of the pulsed IRT and are sketched in Figure 3A. Concerning the mechanical repairs, for instance, the patch shown by the thermogram of Figure 3B had been made in order to fill the hole left after the removal of one of the scaffolding bars on which the sculpture is moulded [60]. As the area behind the patch is empty, a regularly shaped cavity with a depth smaller than the bronze wall thickness was applied around the hole, in order to host the patch. Then, the patch was mechanically forced into the cavity to cover the hole. Thermogram 3B shows a brighter (hotter) rectangle in the areas of the patch near its edges, which corresponds to the presence of a thermal barrier to the local heat propagation from the surface, while the central part, probably thicker, appears darker (cooler). Such thermographic features are consistent with a poor thermal contact between the patch edge and the underlying cavity support, where the bronze thus cools less rapidly than its surroundings. On the other hand, the patch of the right front paw, shown by the thermogram in Figure 3C, has been made in a metallurgic way. In this case, the local casting has given rise to an irregular patch, where the local casting material bonds with the gap contour areas. The lighter areas near the patch edges in the thermogram (Figure 3C) are due to the non-ideal thermal contact with the underlying gap edges. Such features also reveal the thinner nature of the edges of the patch, which becomes progressively thicker when moving toward its central area. The thermograms of Figure 3B,C have been obtained with the front face heating induced by using two flash lamps at their maximum power (3 kW each). It is worth noting that for this kind of analysis, the use of more lamps (three and four) has also been tested without obtaining a significant improvement in the quality of the thermograms, while making the illumination arrangement much more difficult for such in situ investigations.
Decorative Elements
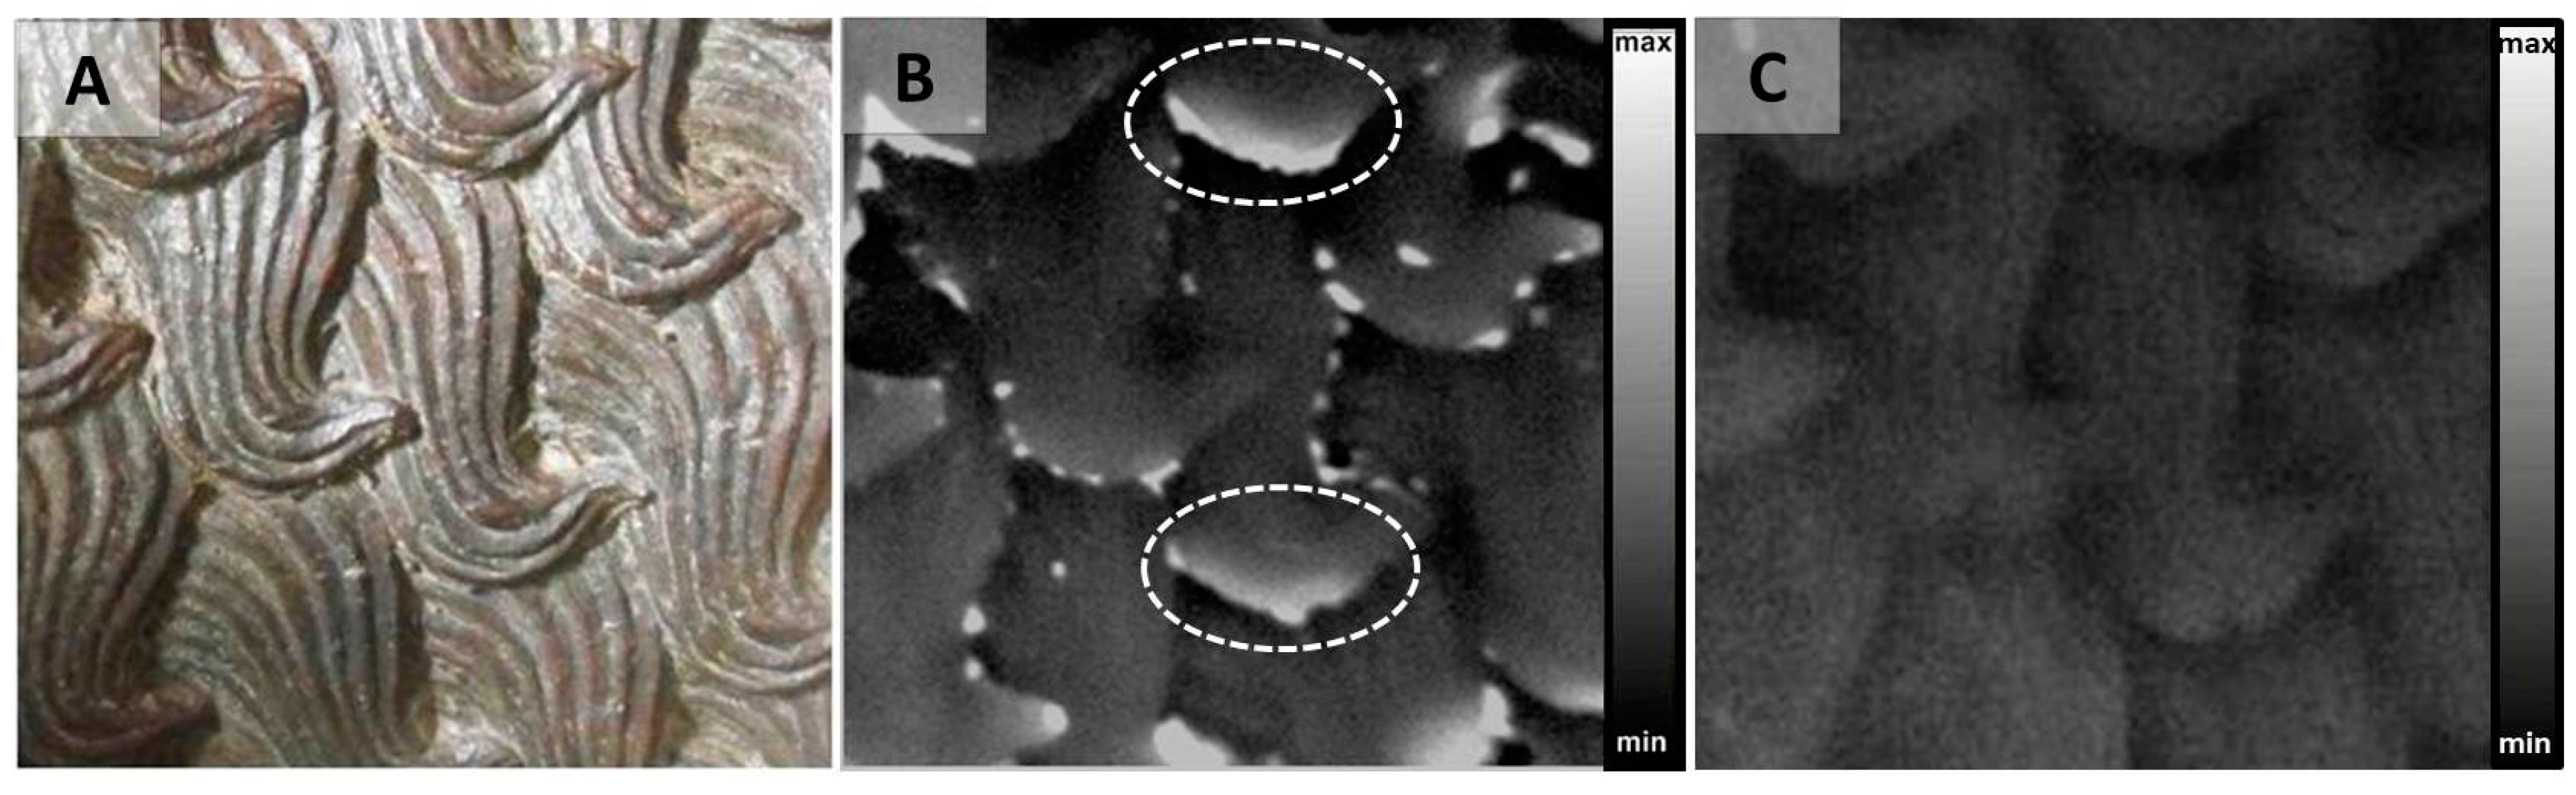
IRT can also be used to investigate bronze decorative elements. For instance, it has been applied to the analysis of the She Wolf fur [47] in order to obtain information on its manufacturing process. The thermogram of Figure 4B, obtained with the front face heating produced by two flash lamps operating at 3 kW, reveals a series of inhomogeneities at the fur edges, circled by the dotted lines. These inhomogeneities could be generated during the casting process and in particular during the moulding of the wax model. In fact, each fur element is obtained from a serial model whose wax print was presumably applied directly on the wax model of the She Wolf body [47]. For this reason, the ihnomogenities at the fur edges could be associated with infiltration of the material used to make the external cloak in possible gaps left between the superimposed fur and the body wax models. A non-perfect adhesion of the fur onto the body would be not surprising if one considers the body surface curvature and the irregularities due to the curl superposition. Such an explanation to account for the observed features is supported by the analysis performed on a contemporary bronze copy of the She Wolf preserved at the Capitoline Museums. It cannot present inhomogeneities at the fur edges, being obtained from the plaster cast of the original She Wolf and by using the indirect lost wax method [60]. This is confirmed by the corresponding thermogram reported in Figure 4C, which shows no inhomogeneities at the fur edges. It is worth noting that the two thermograms have been obtained in two separate sequences obtained on the two different samples, adopting the same experimental configuration (front face heating) by using two flash lamps operating at 3 kW, and processing the thermograms, collected at a similar time delay from the perturbation. In the thermogram of Figure 4B, the contrast was chosen so as to maximize the visibility of the features at the fur edge. No similar features could be detected at any contrast in the thermogram of Figure 4C.
3.1.2. Evaluation of the She Wolf Thermal Diffusivity and Quantitative Studies
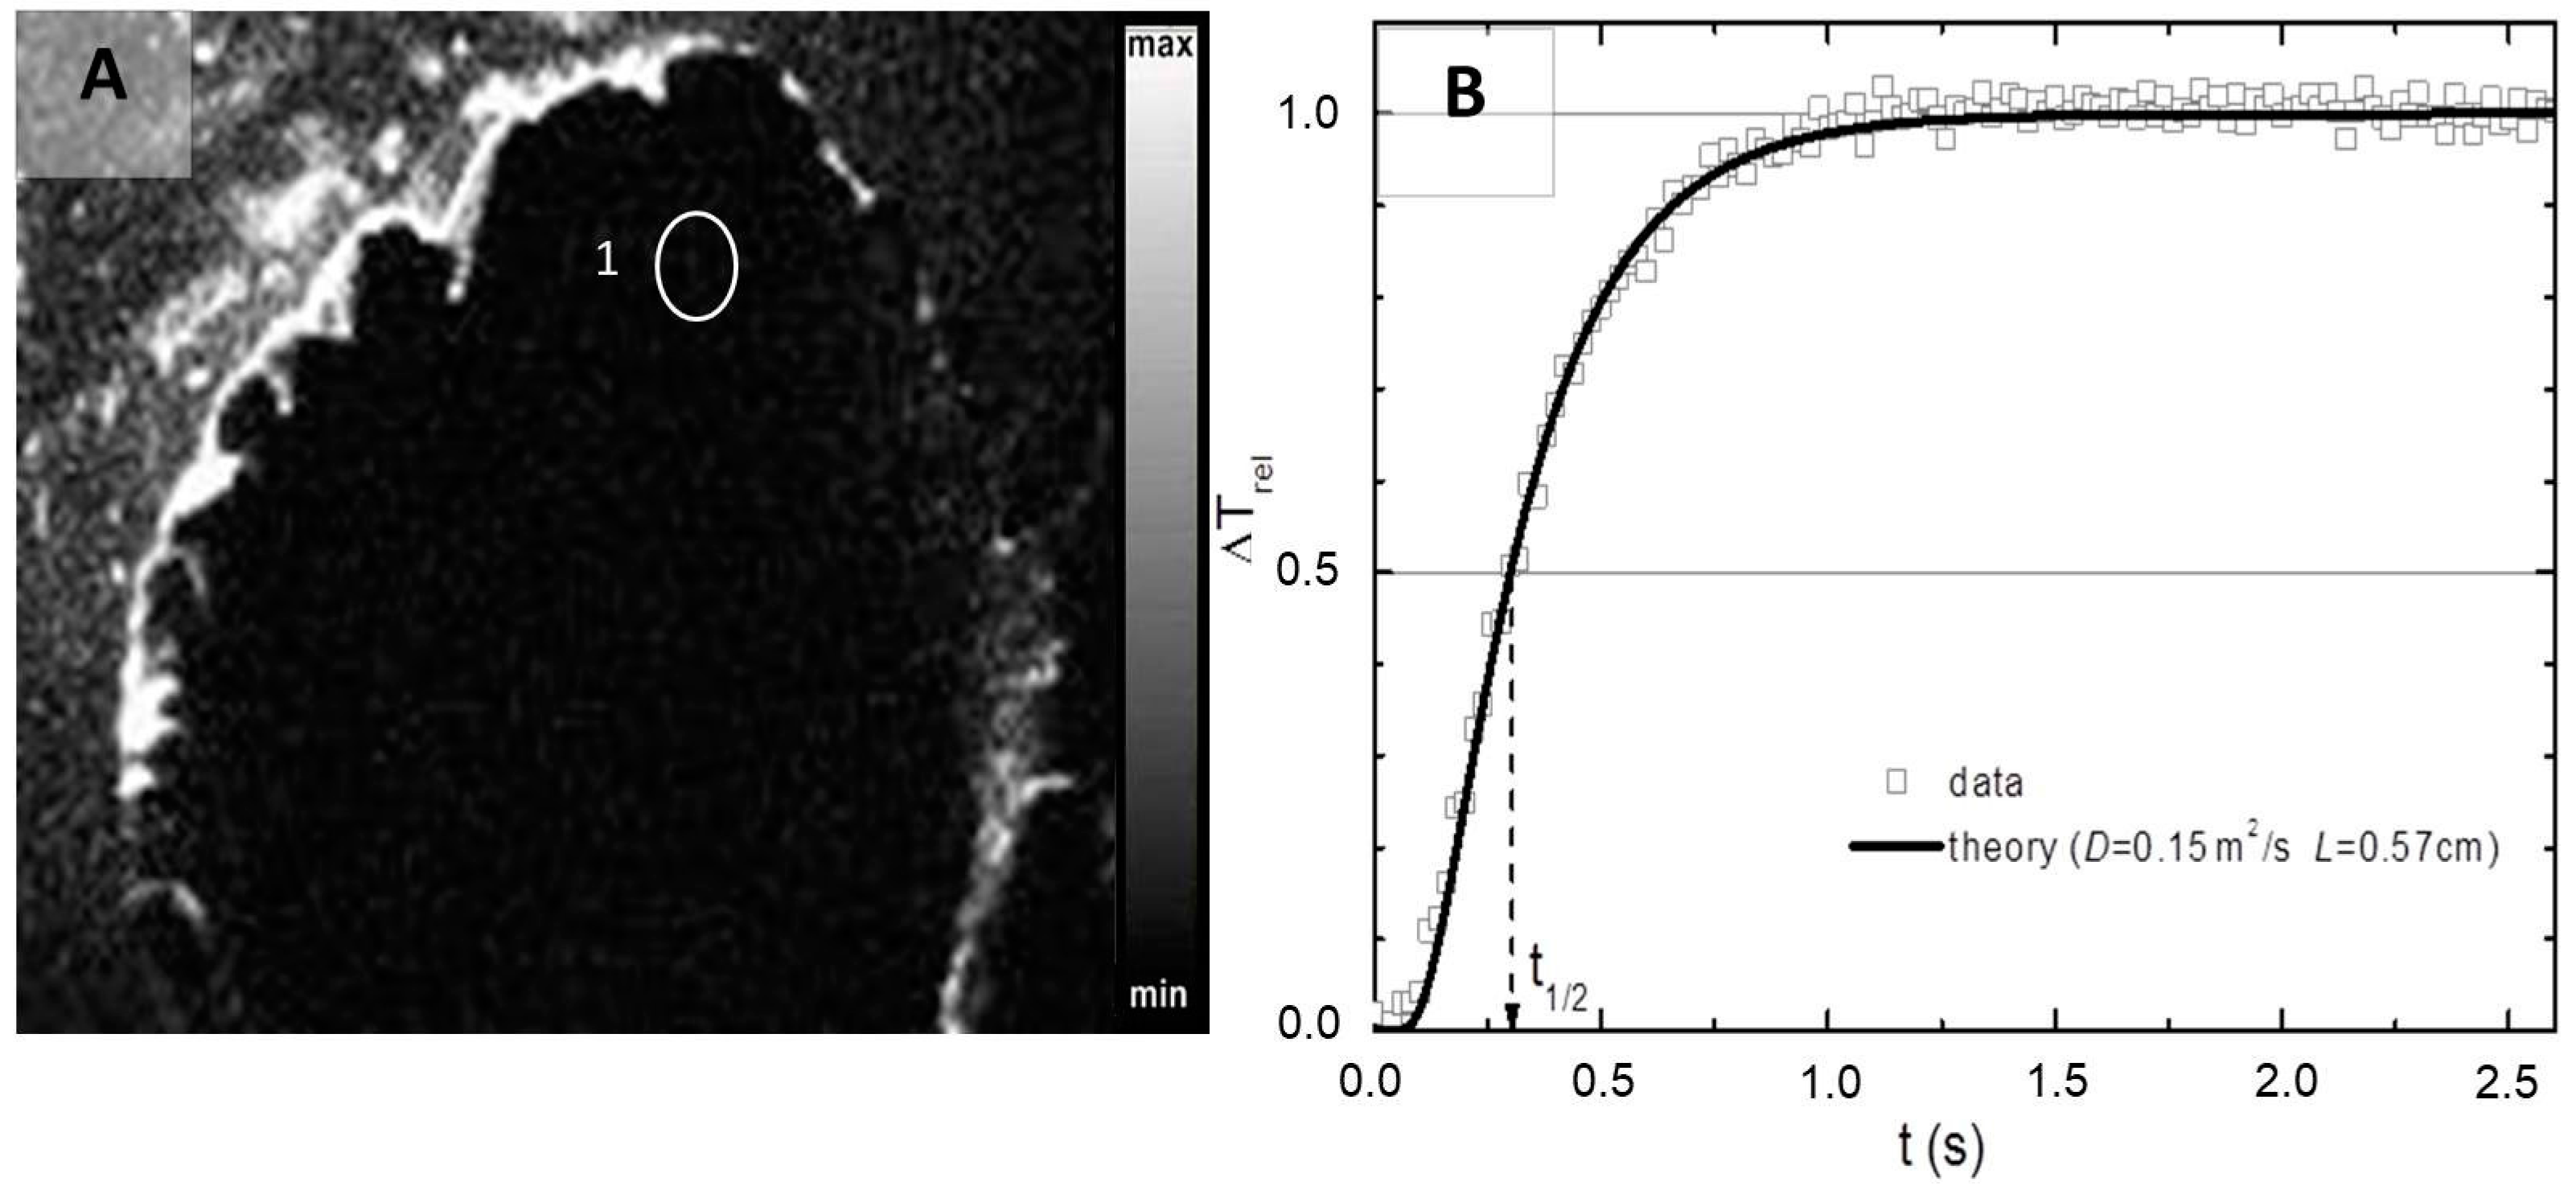
As mentioned earlier on, in order to quantitatively characterize the geometrical aspects of some of the detected subsurface features, it is essential to first determine the bronze thermal diffusivity. In the case of the She Wolf, the thermal diffusivity has been determined at the right ear, using the rear face heating mode since both the ear sides could be accessed by the necessary instrumentation. The heating was generated by a single 3 kW flash lamp oriented perpendicularly to the illuminated surface. Figure 5A shows the thermogram obtained on the ear, where the average thickness of the bronze had been measured in zone 1 as L = 0.57 cm. This area was selected because both the surfaces are well finished there, the curvature is negligible, and it is close enough to the edge to allow researchers to measure its thickness by means of a micrometer. Figure 5B shows the time dependence of the thermographic signals originating from the area selected in the thermogram, normalized to the corresponding maximum stationary value. The continuous black line represents the best fit to the experimental data obtained, neglecting the heat losses to the surrounding air, using Equation (1) with x = L, which has yielded a value of D = 0.15 ± 0.02 cm2/s. It must be remarked that the thermal diffusivity can also be determined by evaluating the time when the thermographic signal crosses a level corresponding to half of its maximum value, as expressed in Equation (7). Moreover, this latter procedure leads to a value of D = 0.15 ± 0.02 cm2/s. The reported uncertainty was set at two times the standard deviation of the mean obtained from repeated measurements of L and performed in zone 1. It is worth noting that the value of D has also been determined by using the front face heating mode in a completely different area of the She Wolf, namely in the right rear paw, giving values similar to those obtained in the correspondence of the ear [49].
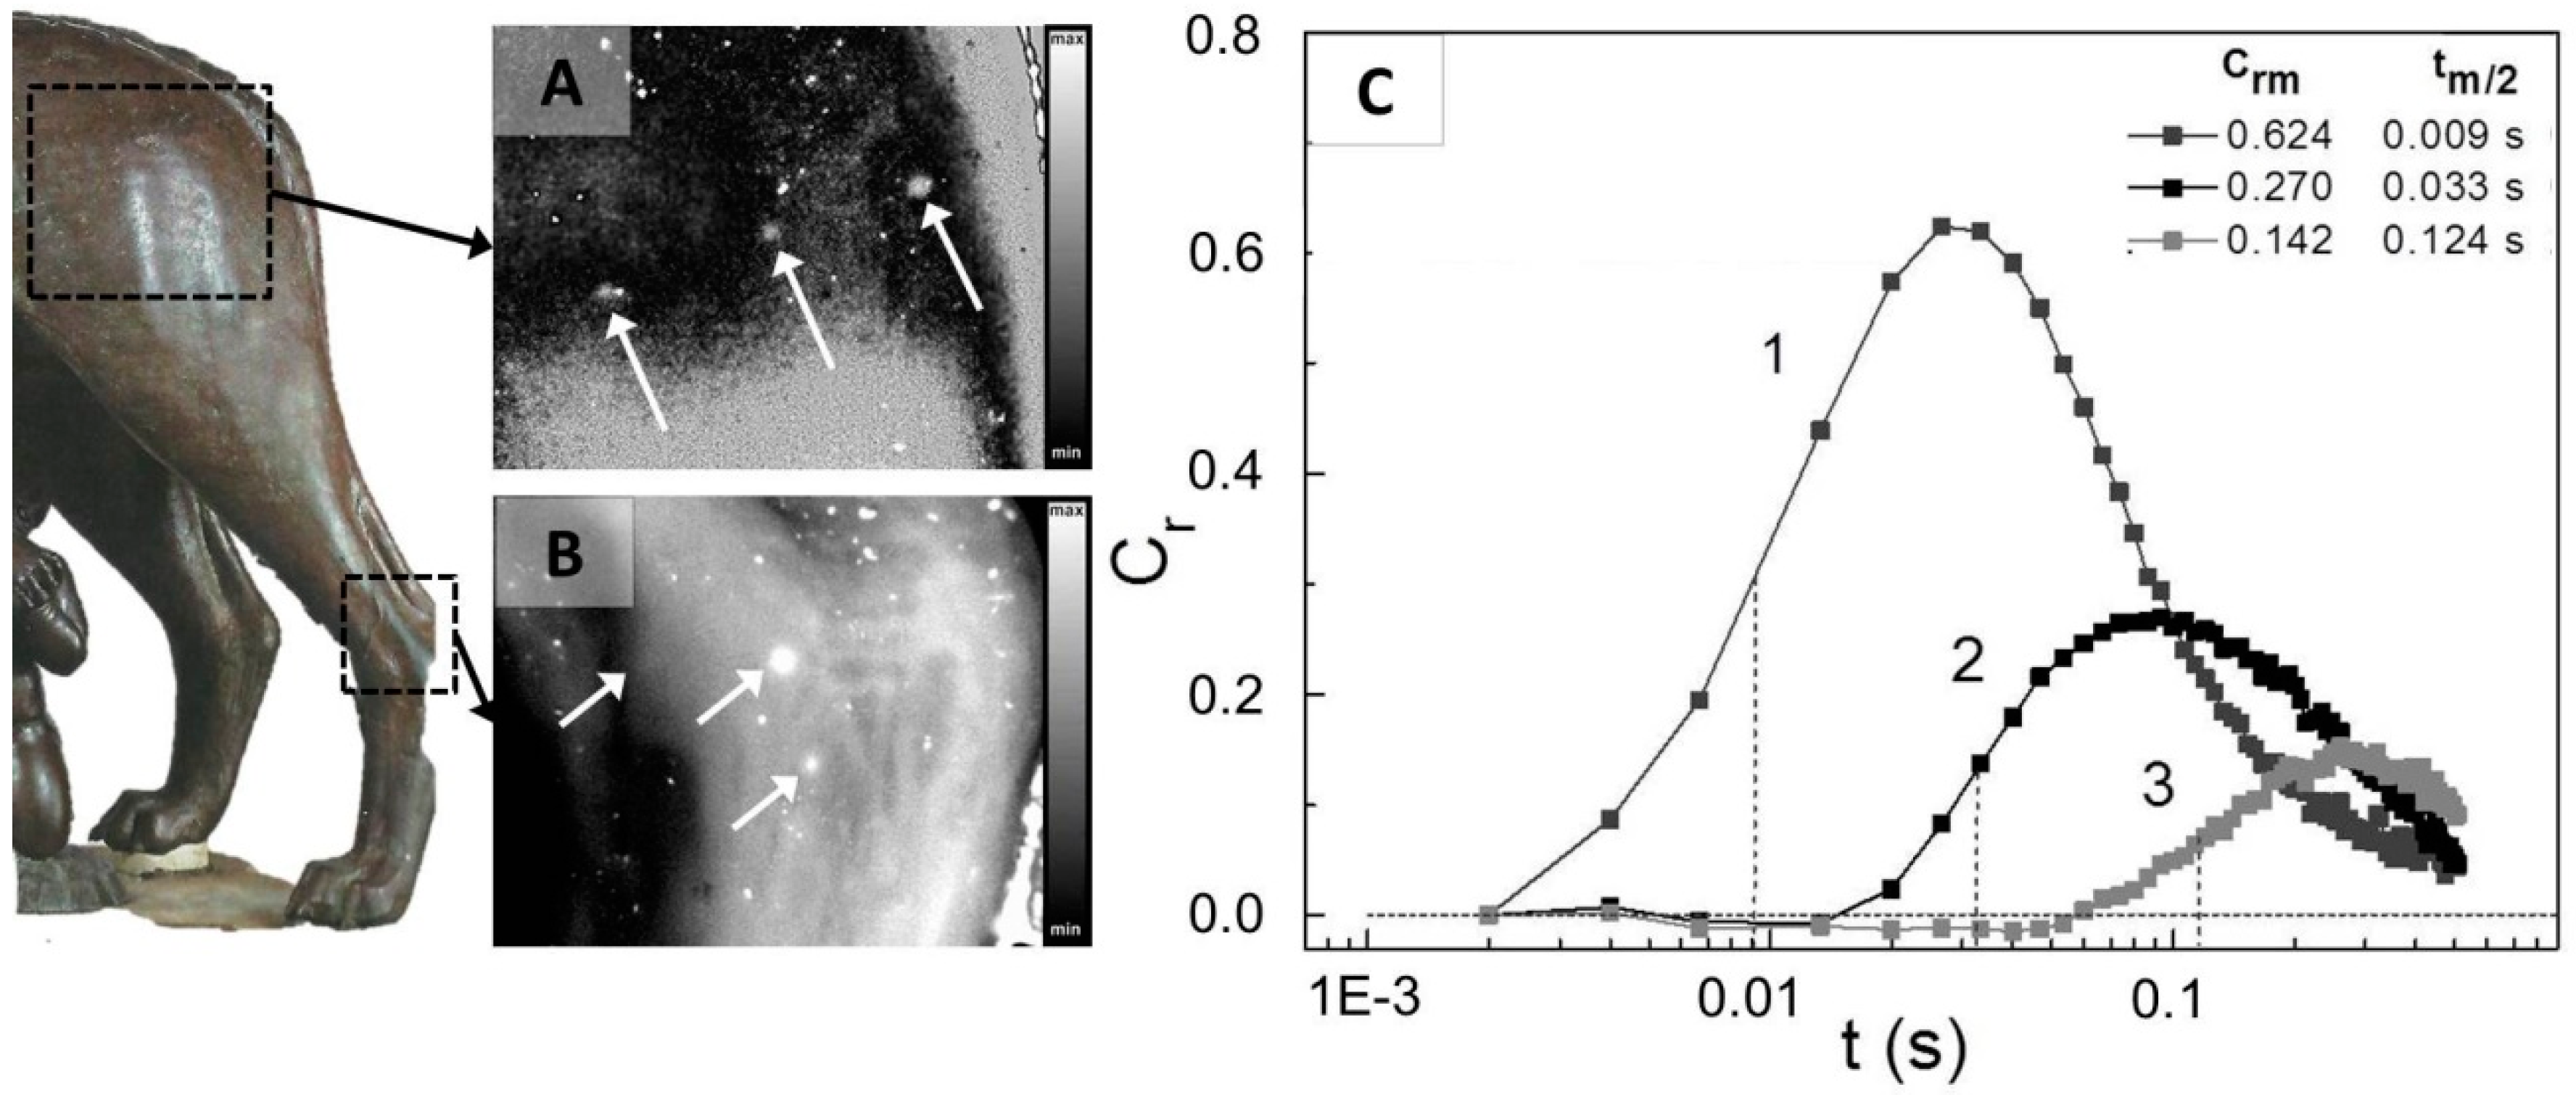
Once the thermal diffusivity is known, it may be possible to analyze the structural and geometrical subsurface elements and casting faults, like the cavities which originate from the trapping of air bubbles in the molten metal, and to obtain information on their relative depth. Figure 6A,B show the thermograms, obtained by the front face heating mode, where different cavities are revealed in the rear left paw. The arrows in Figure 6B indicate the thermographic features of two cavities which can be viewed in the same thermogram, and the position of a third cavity which, being at a greater depth, presents a clear contrast when that of the shallower two cavities has pretty much faded away.
Evaluations concerning the depth of the cavities can be performed by analyzing the time dependence of the so called contrast coefficient [63]:
where Tc represents the temperature evolution obtained over the area of the cavity, and T0 is that determined in a position where no subsurface faults are present. According to the results of the one dimensional heat diffusion theory obtained for a laterally semi-infinite discontinuity, the time dependence of Cr should display a bell shaped profile like those reported in Figure 6C for each of the cavities indicated in Figure 6B. The maxima of the different Cr profiles appear at different times, indicating the fact that the cavities are buried in the bronze volume at different depths. Within the limit of validity of such a theoretical model, the depth of the fault can then be determined by the expression:
where the denominator, with α = 0.386, β = 0.397 and γ = 0.0853, represents the best polynomial fit obtained to reproduce the dependence from Crm, of the so called Fourier number [63] in correspondence to tm/2, the time when Cr assumes half of its maximum value [63]. When real defects such as those shown in Figure 6A are considered, the applicability of the one dimensional theory can be limited by the effect of their finite lateral extension and other deviations from the geometry considered by the theoretical model. Therefore, the analysis of curves like the ones in Figure 6B relating to defects of an unknown size and shape can provide, essentially, information on the relative depth of the studied features, rather than absolute measurements of L.
3.2. Recovery of Hidden or Lost Texts in Ancient Books/Documents
In the last years, several techniques have been used for the recovery of lost and/or hidden writings and, in particular, for the investigation of erased and overwritten texts in palimpsest [64]. For instance, ultraviolet fluorescence (UVF) [65], hyperspectral imaging (HSI) [66], and multispectral imaging (MSI) [67,68,69] have been applied, respectively, to the recovery of the readability of damaged or censured texts, to the study of burnt papyri and parchments, and to the recovery of the contrast of erased iron gall inks on parchment [65]. Among the imaging techniques, IRR has been successfully used to examine faded texts written with carbon-based inks, improving the contrast between the ink and the support [70]. However, none of the mentioned techniques have proven to be successful in investigating texts buried inside the structure of ancient books. In fact, such written elements are often not accessible and, for this reason, a technique that could provide the possibility to detect and characterize them without dismantling the bookbinding is extremely useful. Such a topic has only been faced in recent times, using IRT and spectroscopic techniques, like a macro-Xray fluorescence (XRF) scanner [71,72].
Here, the applications of IRT to the analysis of texts buried in historical bookbindings, generally belonging to scraps of older books reused in the assembly of a new book, are shown. Moreover, this article also reports on the IRT investigation of ancient manuscripts and documents affected by different forms of deterioration and physical degradation phenomena which cause the loss of readability of the textual elements laying on the leaves surface.
3.2.1. Bookbindings
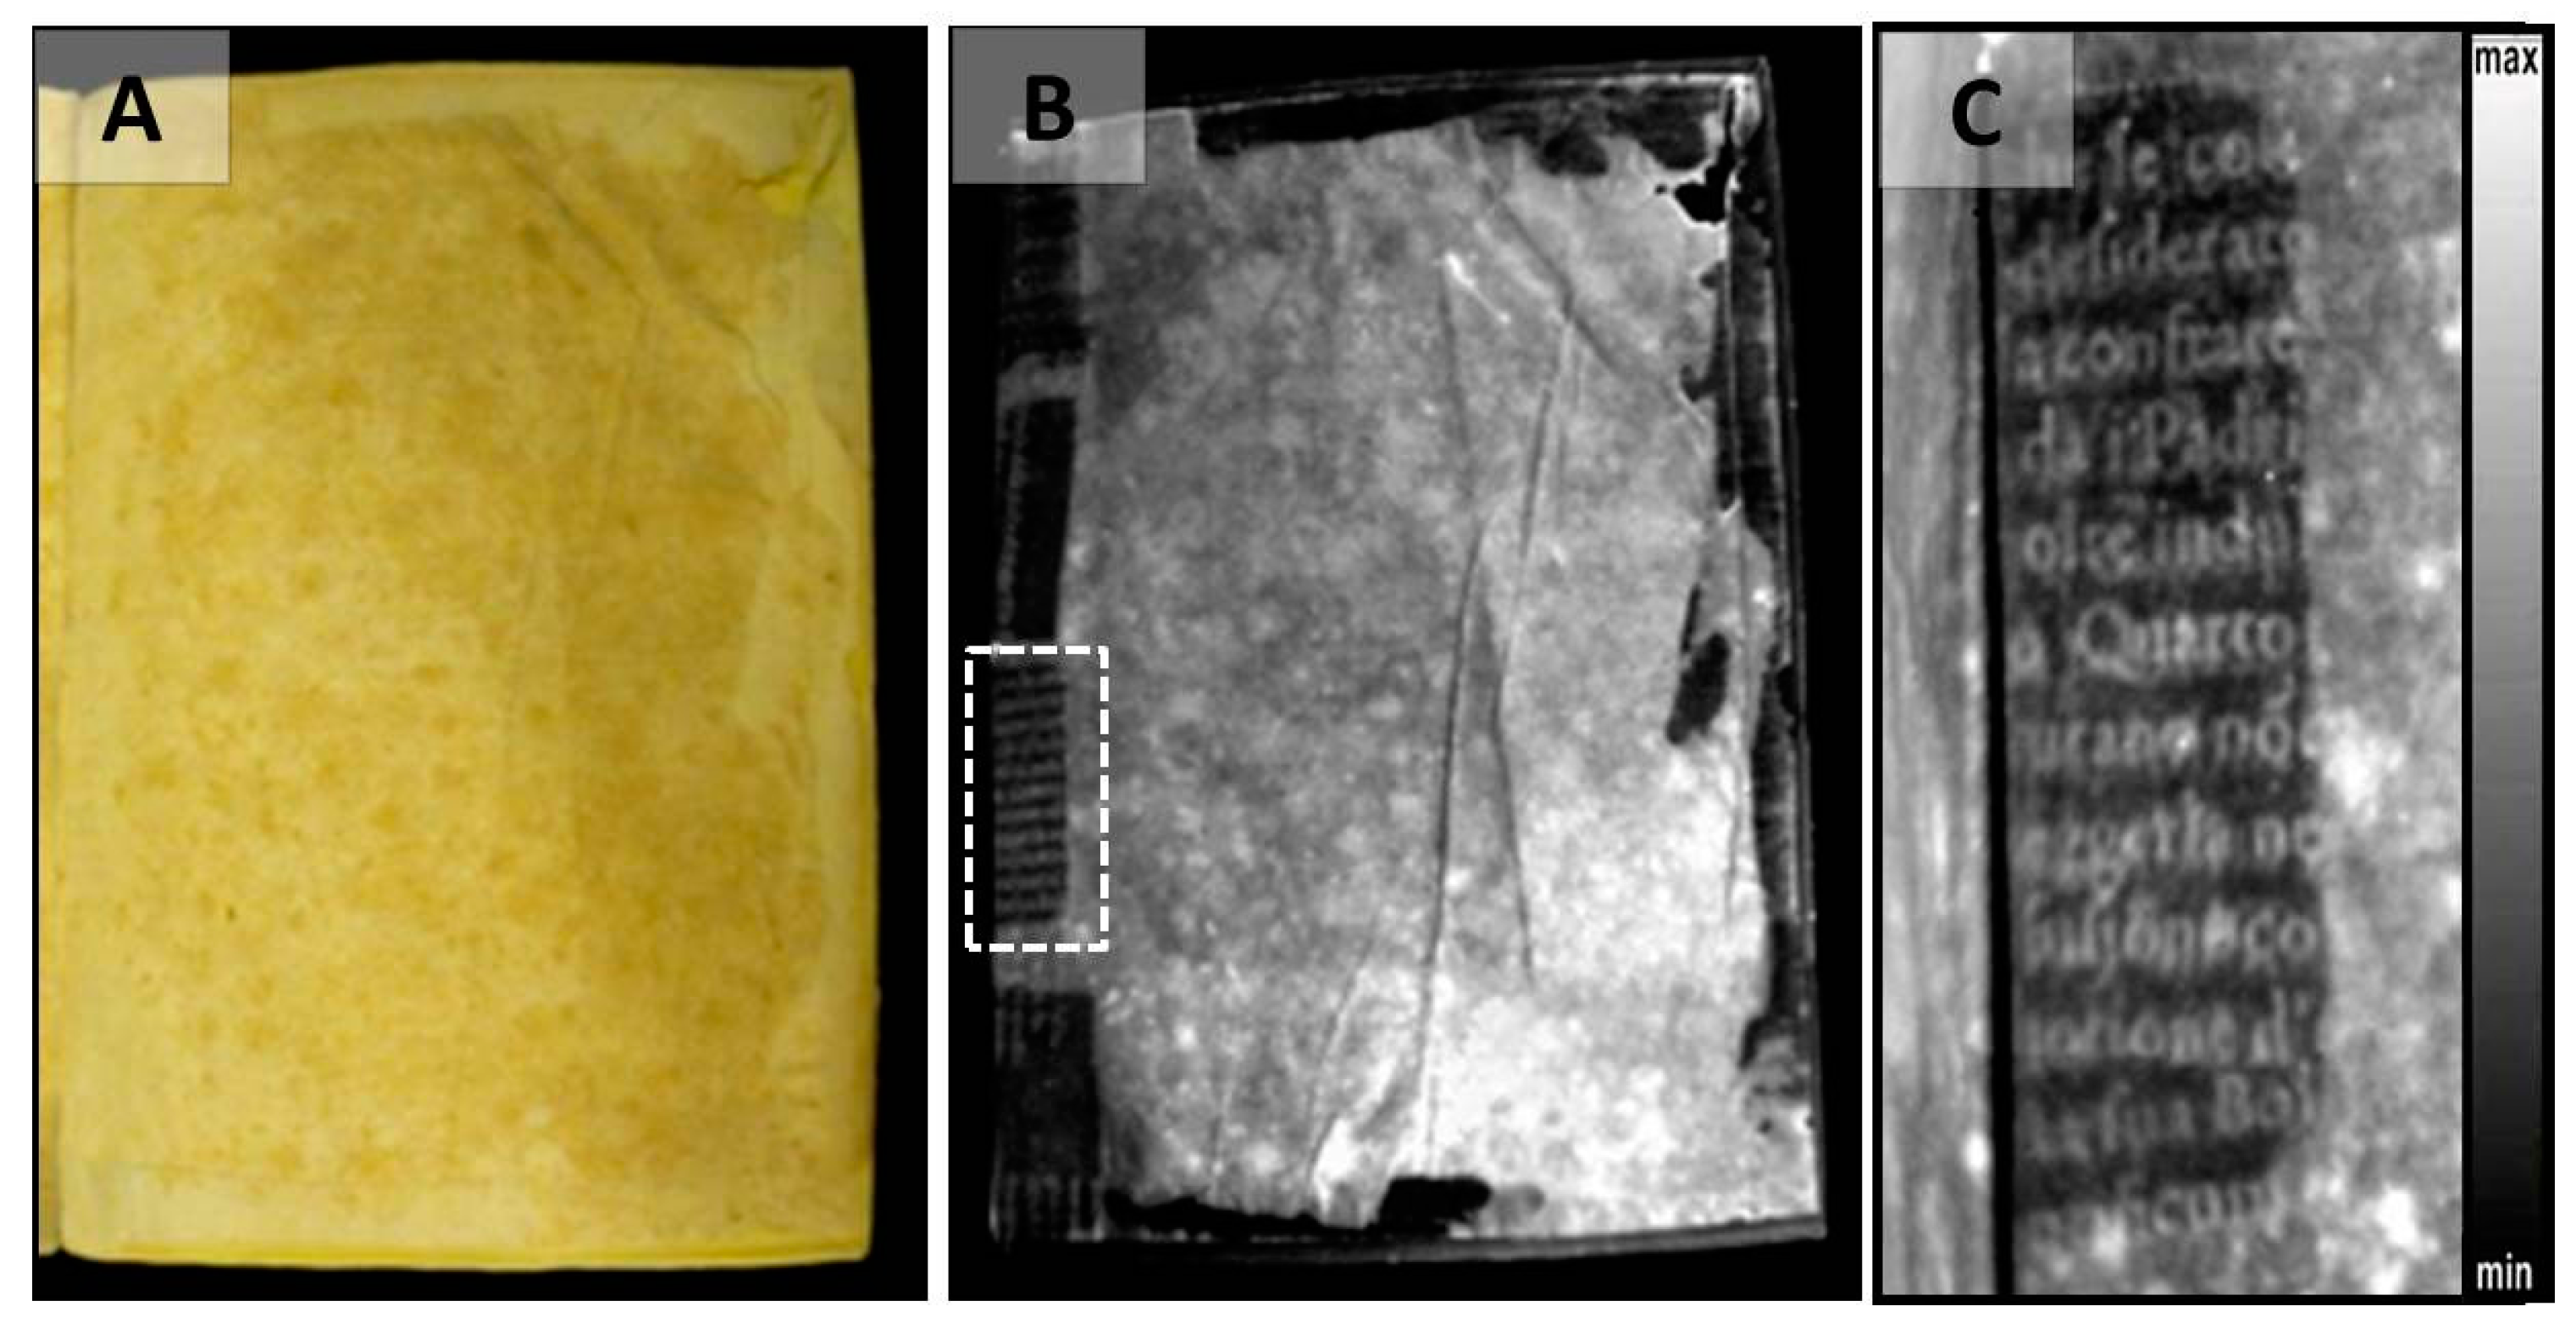
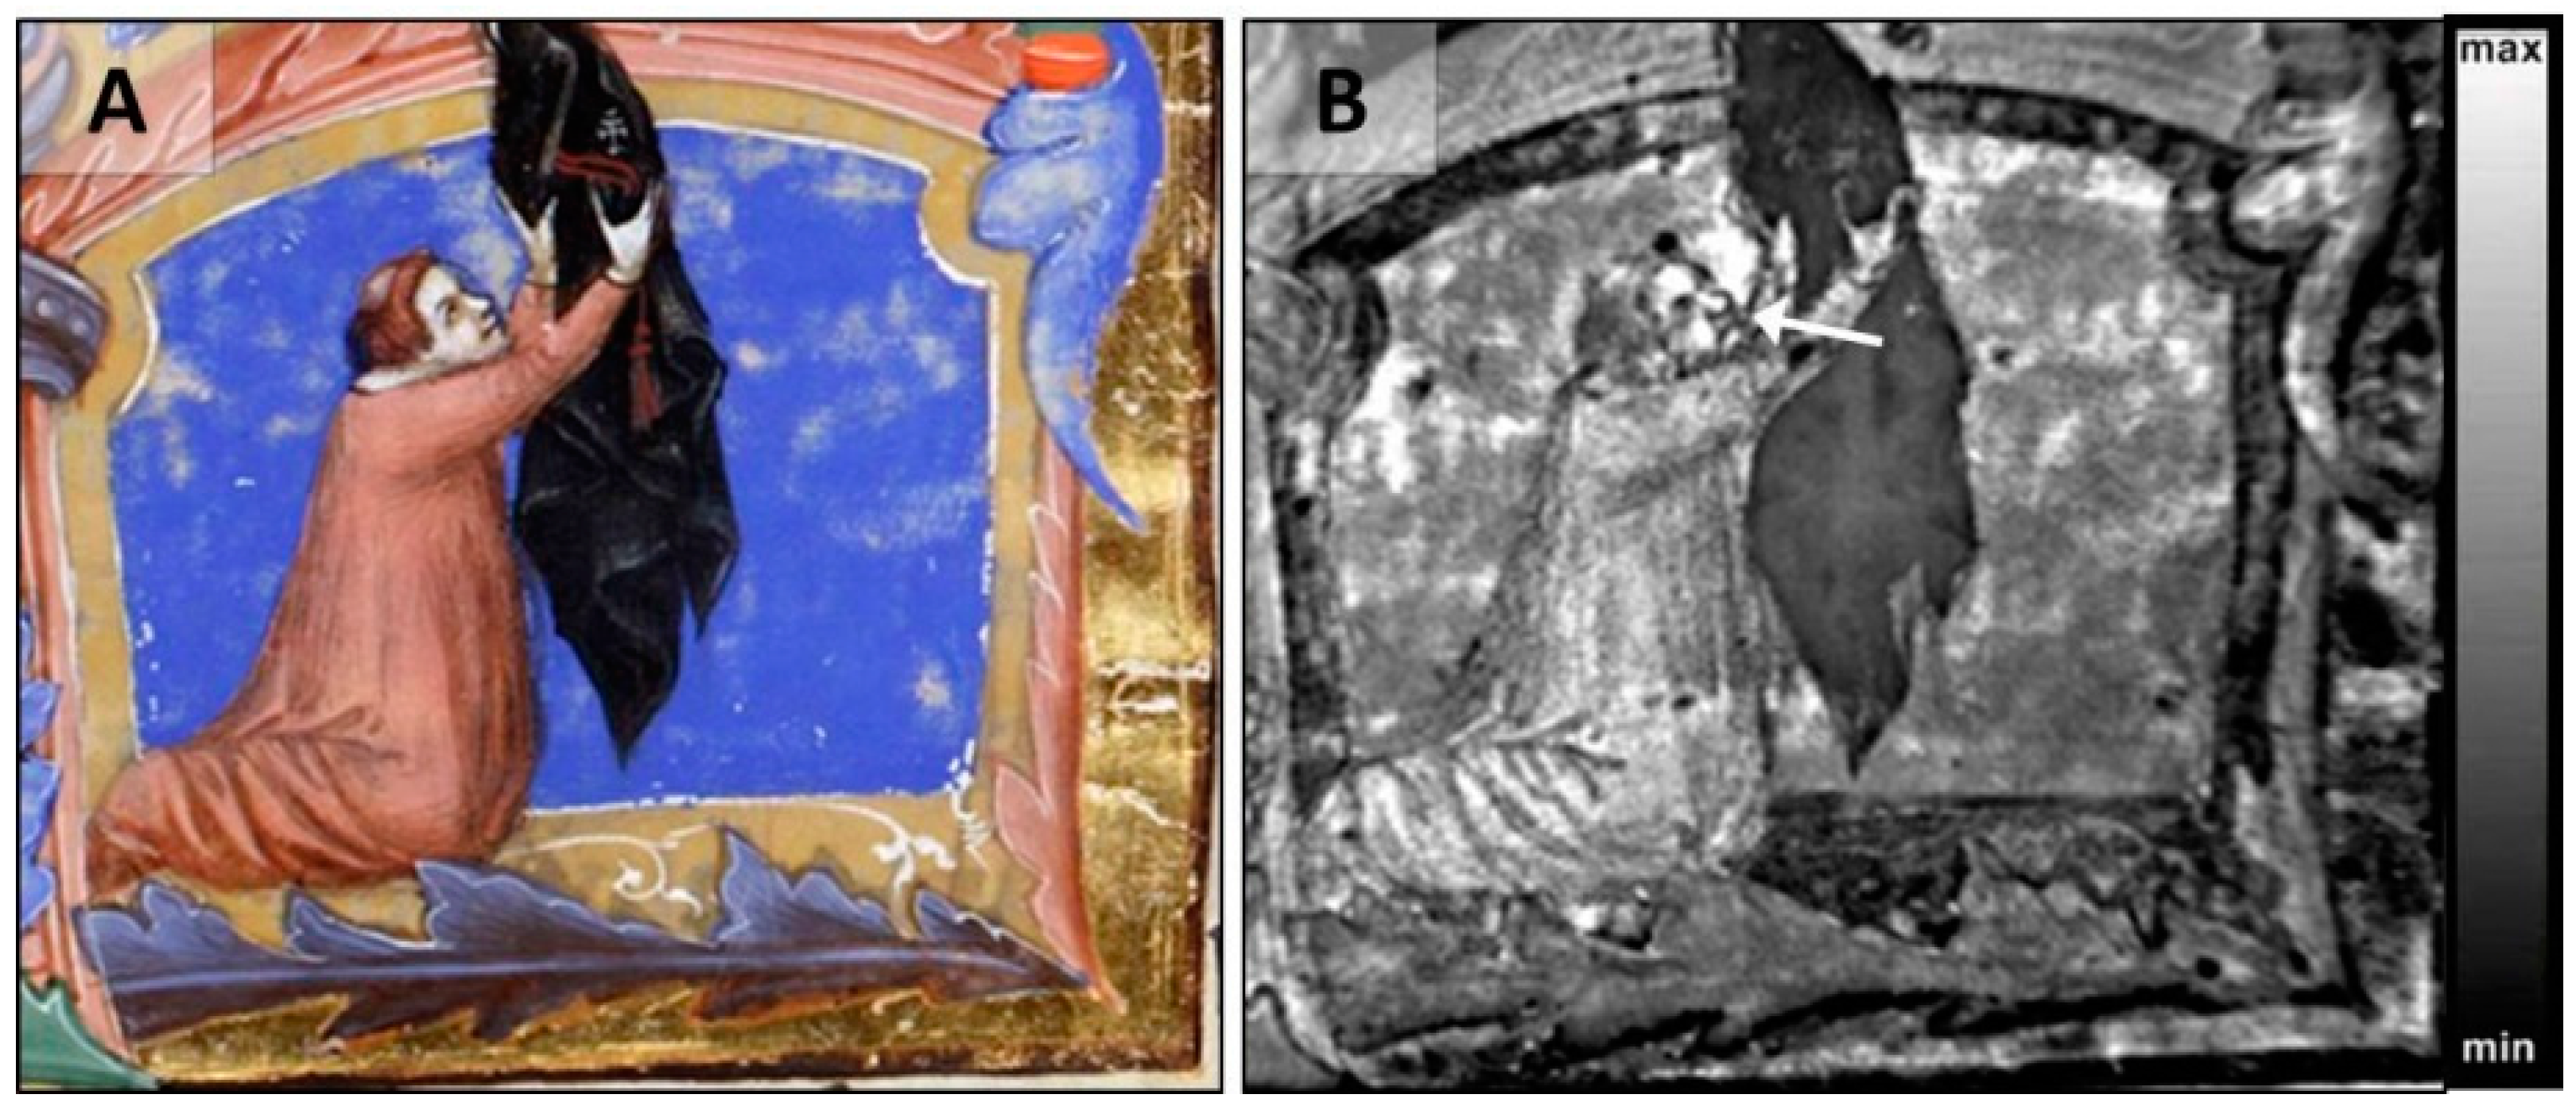
In the study of texts buried inside book structures, a possible IRT application concerns the detection of written scraps reused as a lining which are glued between the end paper and the board, connecting the spine to both the front and back boards [73]. An example of the use of these scraps can be observed in a XVI century book of the Biblioteca Angelica of Rome with uncoloured and poorly preserved end papers (Figure 7A). The thermograms in Figure 7B,C have been obtained by illuminating the artefact with two flash lamps set each, at 2 kW power output. They enable the detection of written scraps (Figure 7B) and allow researchers to actually read the text (Figure 7C). The contrast in the thermogram is generated by the larger amount of IR radiation emitted from the text with respect to the one from the surroundings. This is due to both the overheating of the ink, induced by the direct absorption of the light diffused through the overlying paper, and to the larger IR emissivity of the ink with respect to the surrounding material. Moreover, once the IR radiation is emitted from the buried text, it travels through the leaf to reach the IR camera, maintaining, unlike the VIS radiation, a substantial unscattered component because of its greater wavelength [50].
3.2.2. Damaged Surface Texts
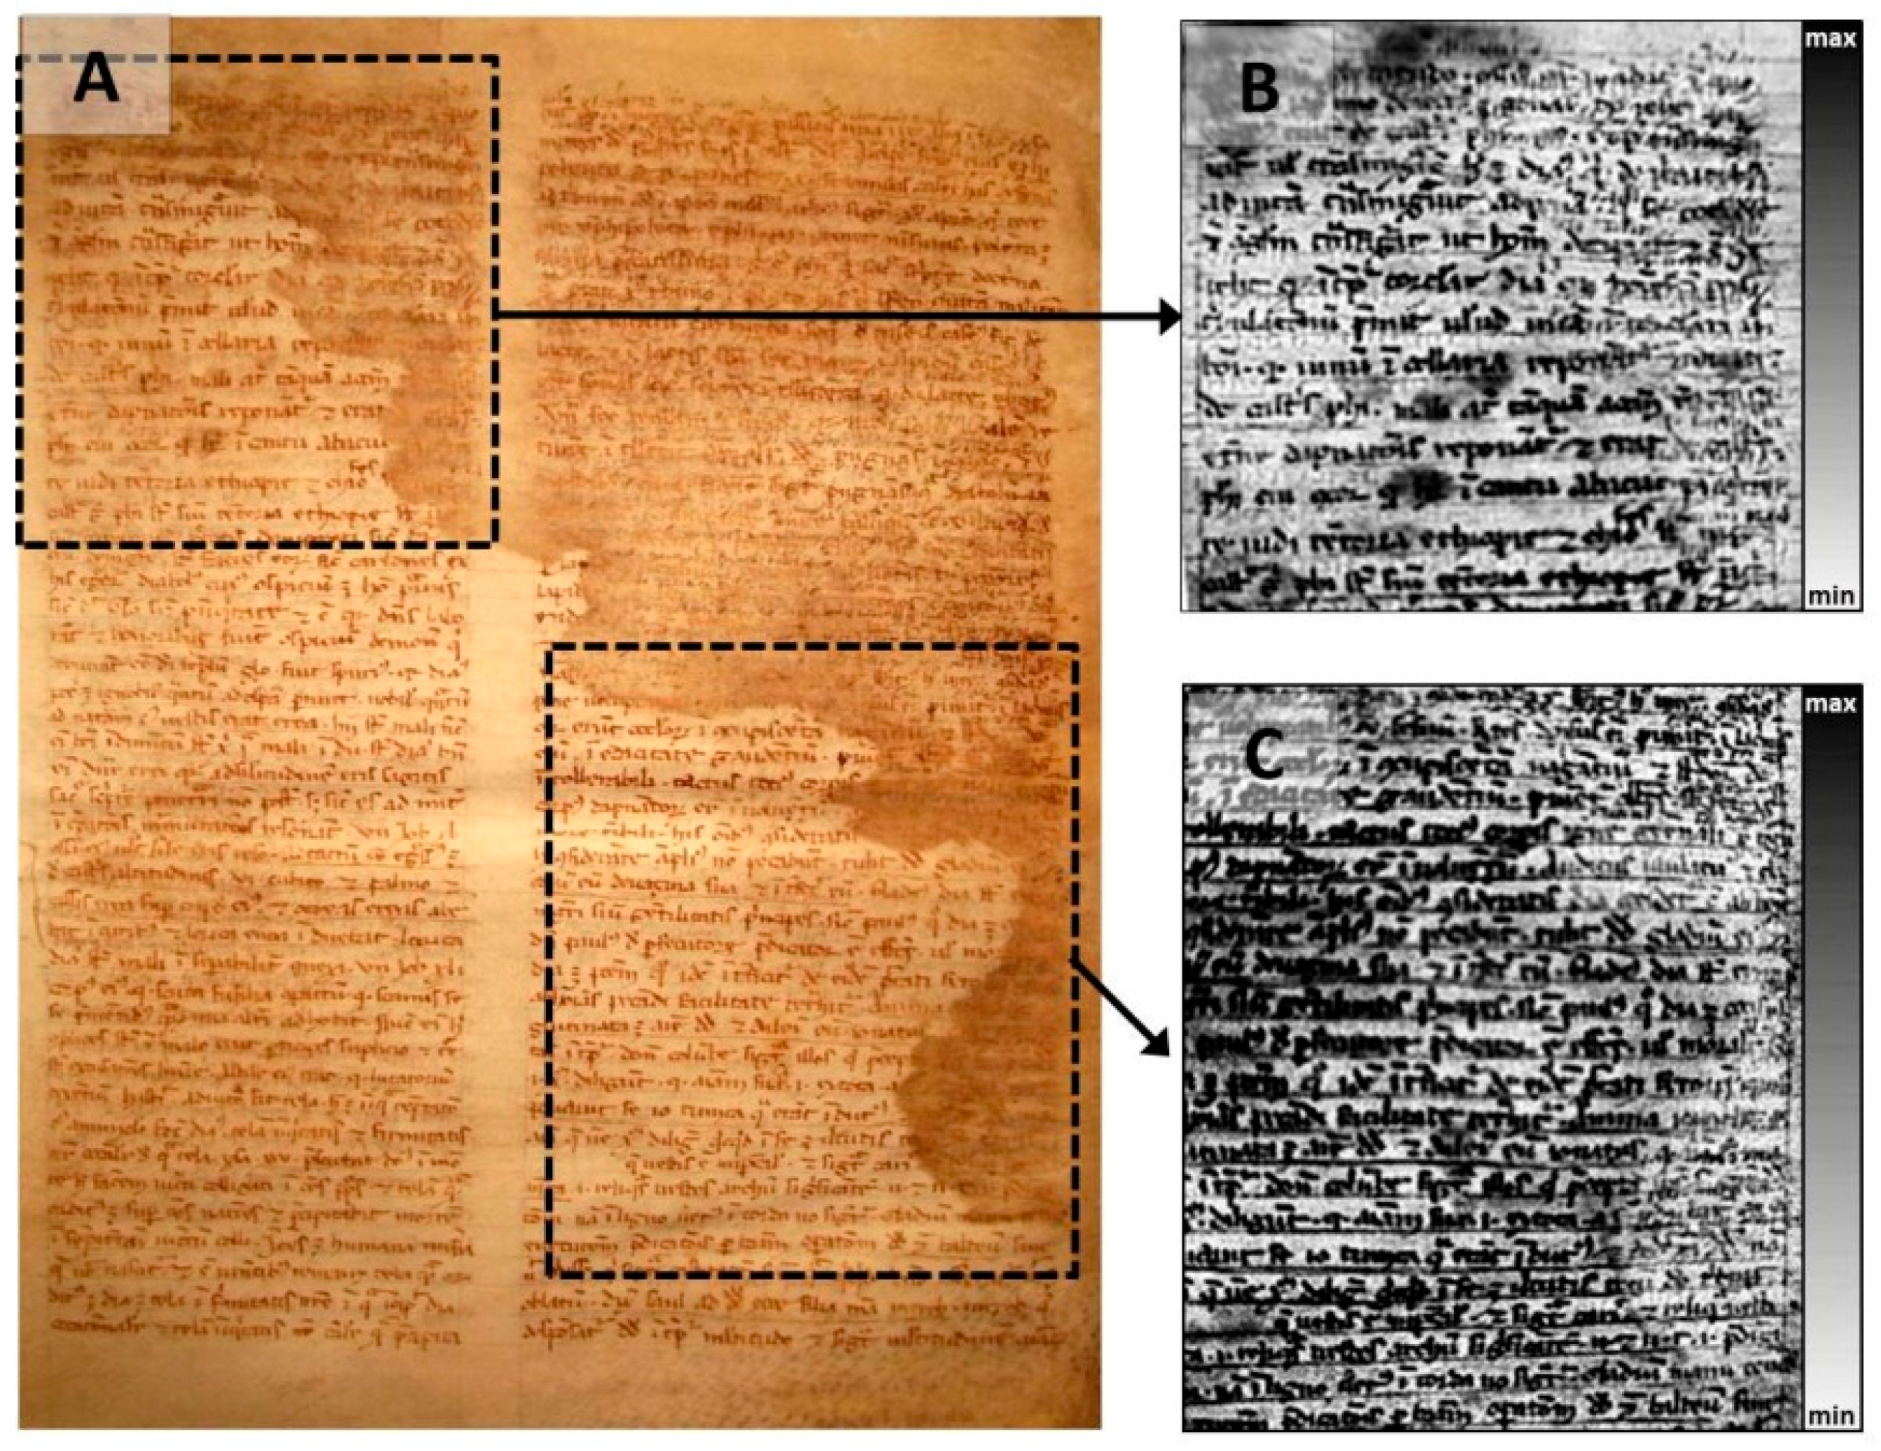
Ancient manuscripts and documents are often affected by different forms of deterioration and physical degradation phenomena, due to a combination of factors—such as environmental conditions, dirt, effects of natural disasters, handling, and biological attacks—all causing the loss of readability of their textual elements [74]. IRT has proved to be able to recover many of the elements belonging to the surface of the artefacts, like texts on parchment or leather, that have become invisible to a simple optical inspection. As an example, the results obtained by the analysis performed on the XIII century manuscript “ms 509/D813”, hosted at the Biblioteca Angelica of Rome, are reported. The manuscript, an Expositio about the Old Testament, is composed of 127 written parchment folios in part affected by water damage. The last pages are also characterized by several extended water stains that caused the reduction of the readability of the writing, which appears totally deleted around the edge of the water stains (Figure 8). In the case of folio 124 verso, the thermograms performed on different damaged areas (Figure 8B,C) show a partial recovery of the inked text in all the investigated parts. Such thermograms have been obtained by illuminating the leaves with two flash lamps whose power output was set at 1 kW. The possibility to recover the ink contrast by means of IRT relies on the local heating produced on the ink residues which effectively absorb parts of the incident light spectrum (UV-VIS-NIR) and by the different emission properties characterizing such residues and the surrounding support. In particular, two basic mechanisms can be proposed to explain the recovery of the text. Concerning the first possible mechanism, once the loss of the pigmental component of the ink occurs, traces of some other lighter components associated with the ink solvent (often not at all visible) are left in the support in correspondence of the lost text. Their presence can generate specific local absorption different from that of the surroundings, particularly in the UV and NIR spectral ranges. As a consequence, the photothermal perturbation induces different temperature values between the text area and the surroundings originating from the thermal contrast that make the text readable in the thermograms. A possible additional contribution to the contrast enhancement arises from the difference of the IR emissivity values between the areas containing the residual light components of the original ink and that of the surroundings, resulting in a different amount of locally emitted IR radiation, independently of their temperature difference.
3.3. Characterization of Painted Decoration on Archival and Library Supports
3.3.1. Gildings
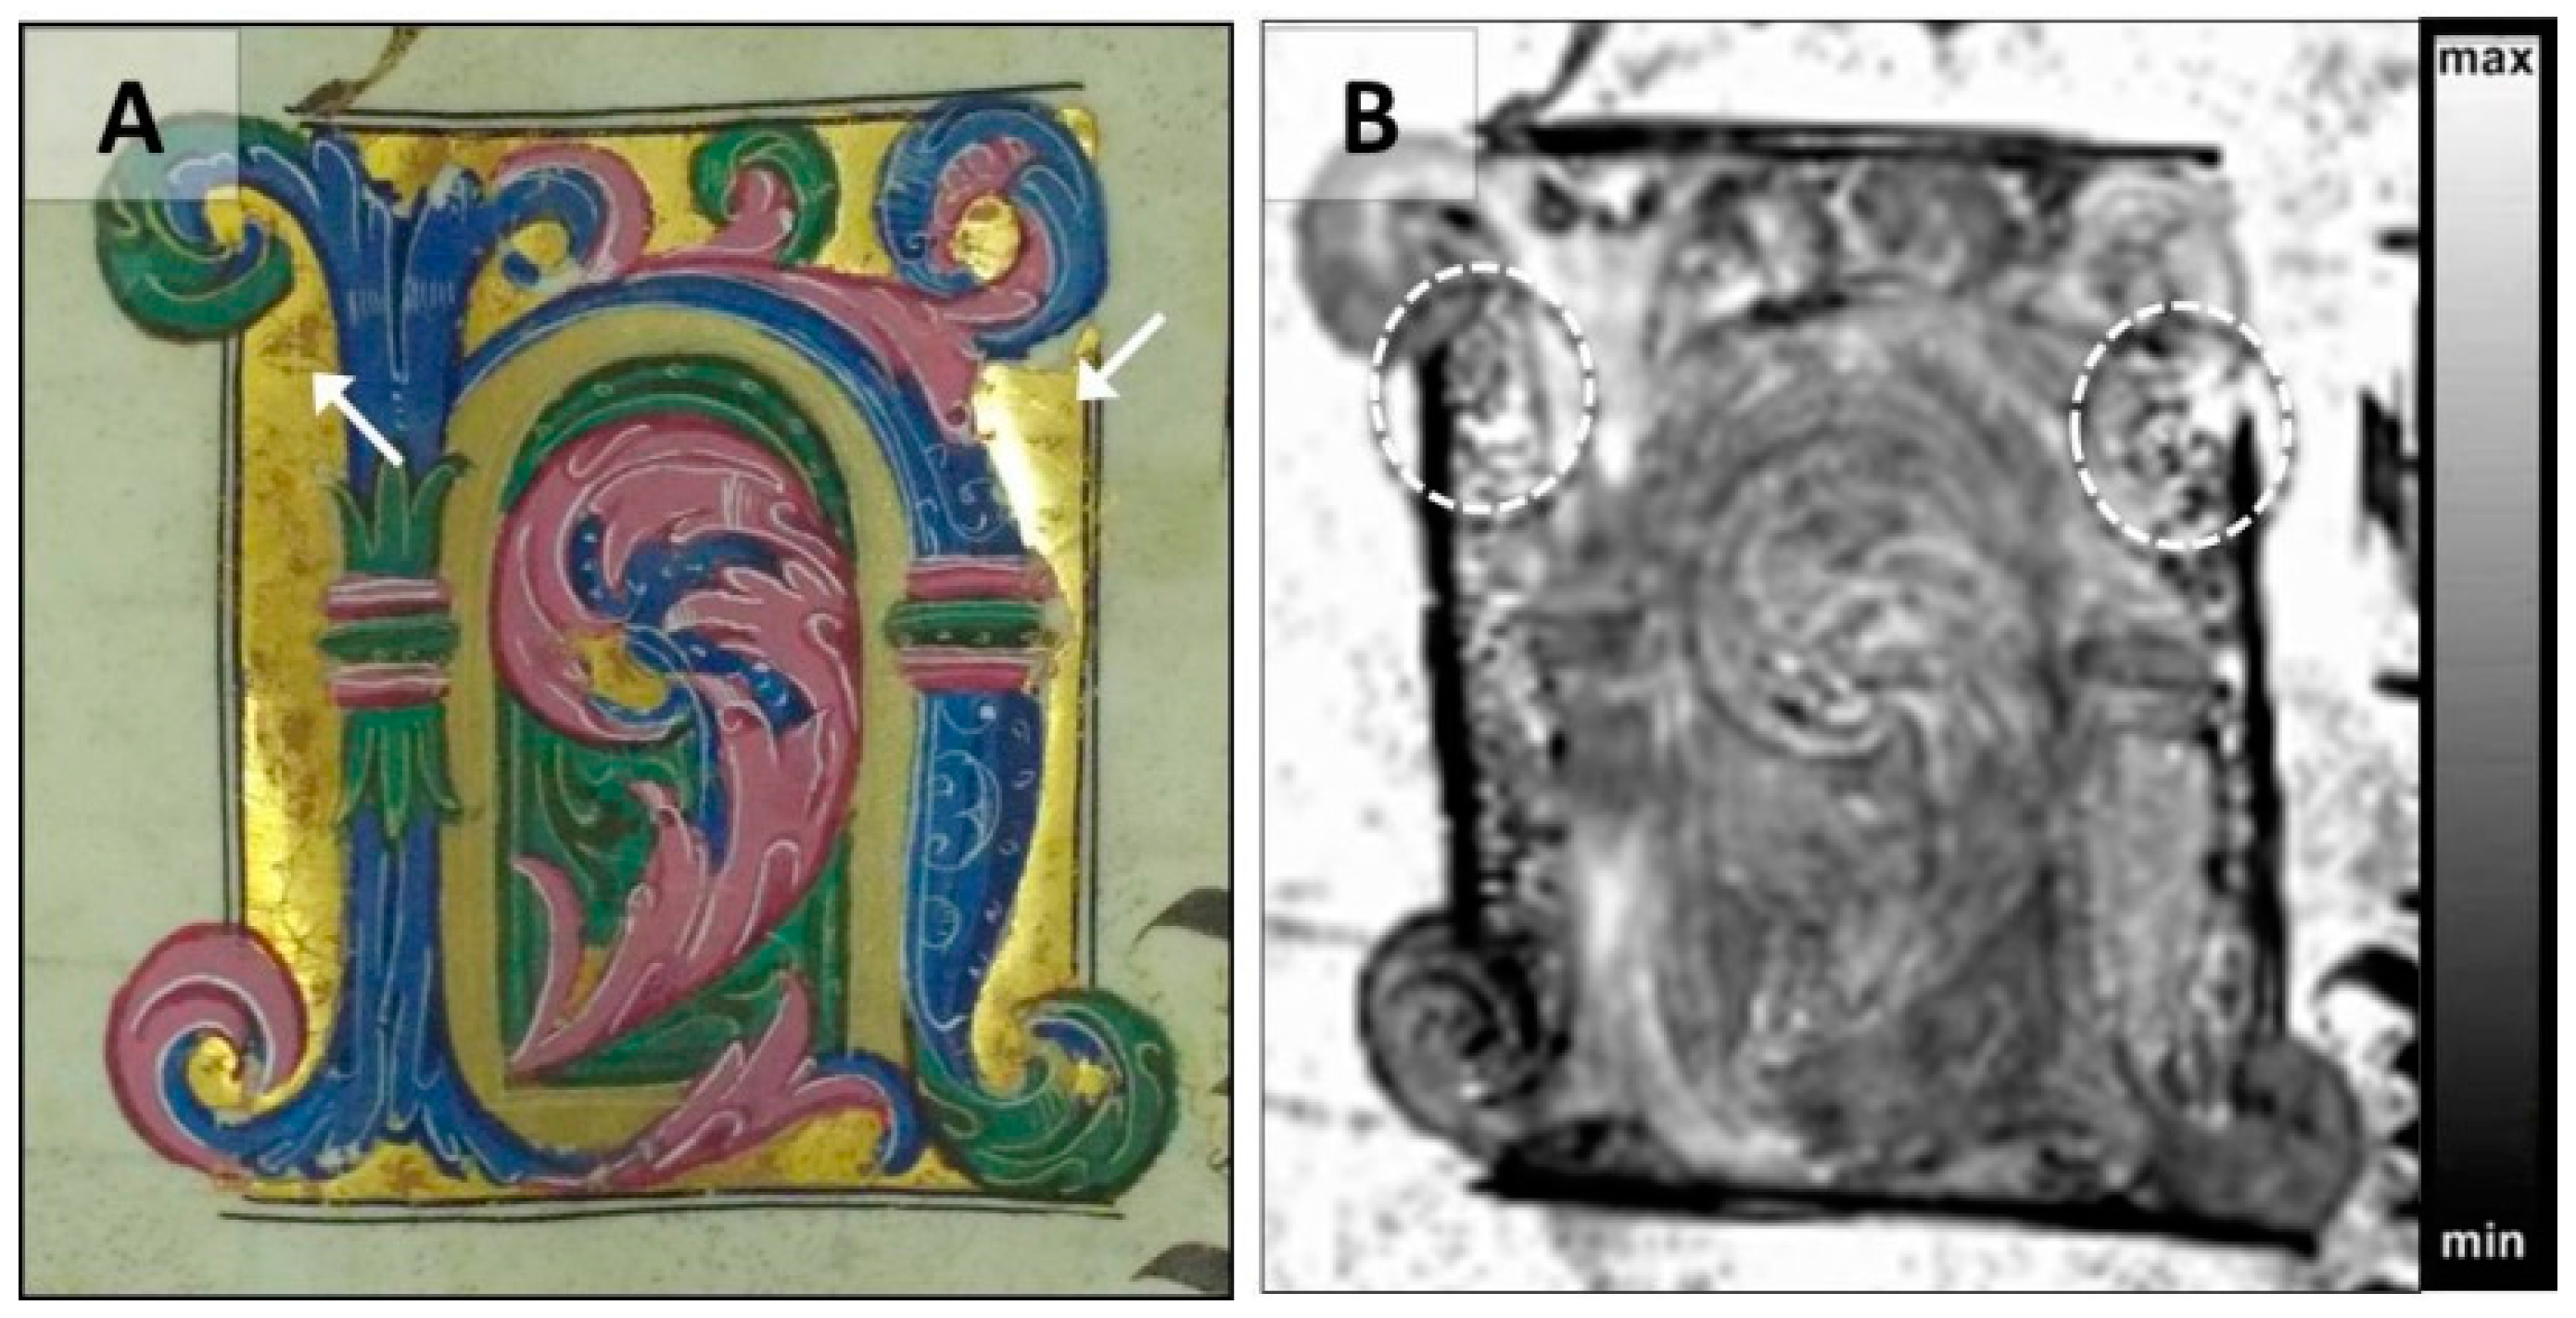
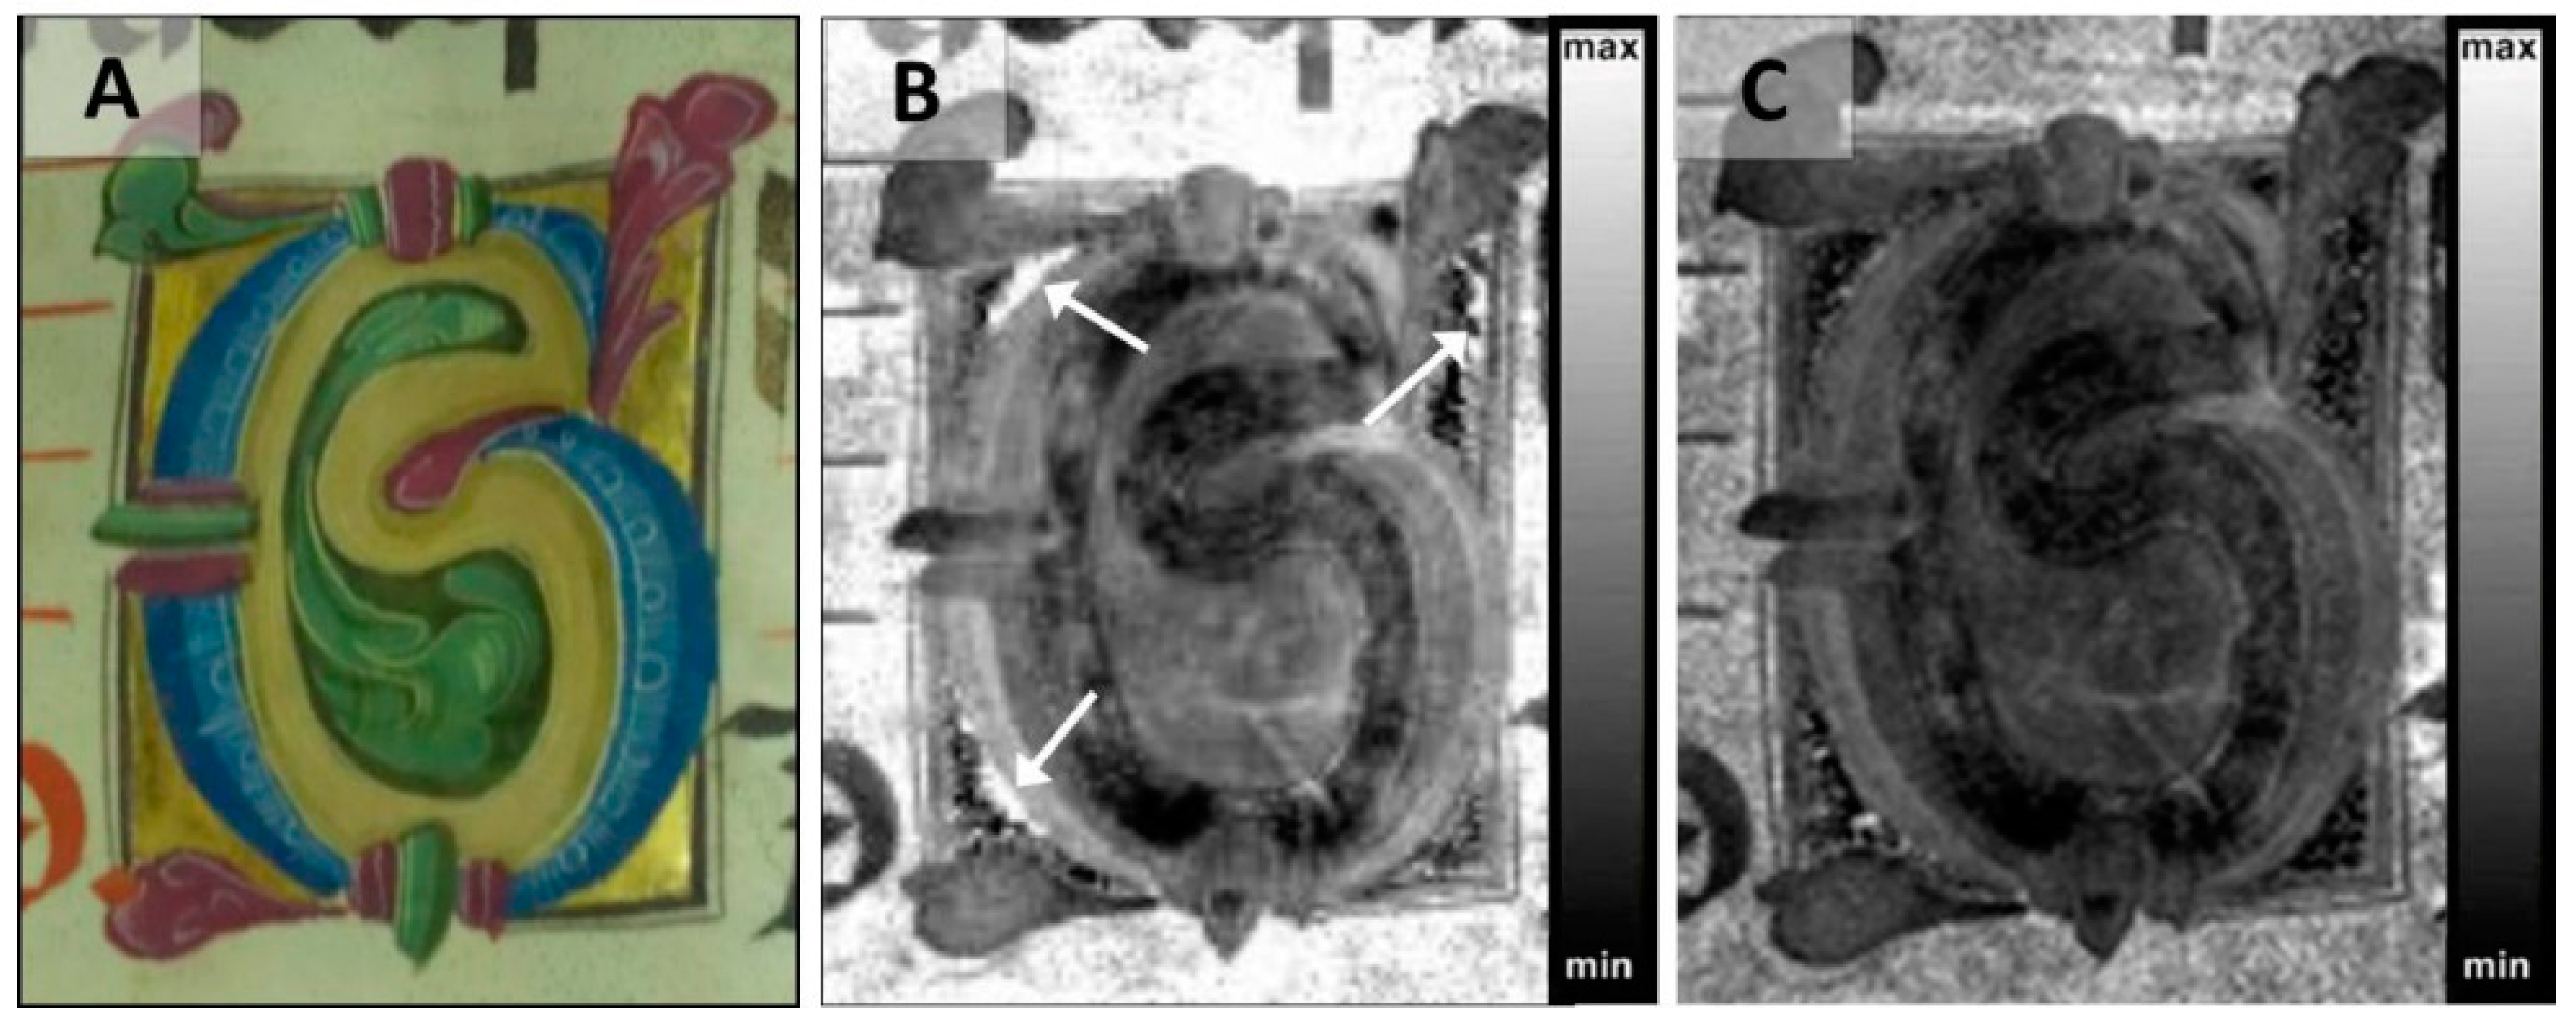
Concerning the study of the gildings, the adhesion and the integrity of the gold leaves represent two of the main aspects to be studied for the characterization of gilded manuscripts or paintings. In 2016, Cosentino et al. mainly used terahertz technology to locate the gilding leaves under the paint layer and also to investigate their preservation state [75]. Recently, IRT has also been applied to detect detachments and inhomogeneities in illuminations [51]. In fact, the gold leaf areas are often affected by a fine pattern of cracks (craquelure). The craquelure, visible at the surface like in the case of the illuminated letter of Figure 9A, belonging to a XV century antiphonary (Biblioteca Angelica of Rome), usually consists of cracks and flakes of the gold leaf sometimes associated with detachments from the substrate. The detachments can be detected as lighter areas in the thermogram of Figure 9B, obtained by front face pulsed heating induced by two 1 kW flash lamps, where their extension is shown to be larger than that observed at the surface. However, detachment of the gold foils can occur even in areas not affected by the craquelure. For instance, the illumination in Figure 10 appears quite well preserved to a simple optical inspection (Figure 10A). However, the corresponding thermogram (Figure 10B) reveals brighter areas, indicated by the arrows, which correspond to detachment of the gold leaf. Moreover, Figure 10C shows the thermogram obtained after the restoration process, where the gold leaf had been consolidated by sturgeon glue. The absence of the brighter areas in the thermogram confirms the improved adhesion between the gold leaf and the substrate following the restoration treatments. The results point out the role that IRT can play in detecting adhesion defects in the illuminations, in being able to direct the necessary restoration steps, and finally in assessing their effectiveness [51].
3.3.2. Recovery of Damaged or Buried Features in Paint Decorations
Pentimenti
In the study of illuminations, as in the case of other kinds of paintings [76], an interesting aspect concerns the analysis of the pentimenti, mostly based on the detection of the underdrawing which may appear different from the final form of the illumination [52]. For instance, in the lower scene of the illumination of folio 239 verso belonging to the mid-14th century manuscript Liber Regulae S. Spiritus De Saxia (Archivio di Stato di Roma), a pentimento can be observed (Figure 11). In this case, the thermogram in Figure 11B, obtained with two flash lamps set to 500 W, shows a different position of the head of the monk whose orientation is shown to be different from that in the final painting, where a dense blue paint layer has been then used in order to efficiently cover the change. The optothermal mechanism that allows the IRT to reveal the underdrawing can be explained in the following way. The incident visible light, though scattered when crossing the external painted layer, gets selectively absorbed by the various features, including the preparatory drawing, at the substrate, thus inducing a contrast of the local temperature distribution and therefore of the IR radiation emitted in the 3–5 μm range [51]. Because of its larger wavelength with respect to the visible, the emitted IR radiation maintains a substantial unscattered component while traveling back through the painted layer to the camera and generates the thermographic image of the underdrawing.
Damaged Surface Decoration
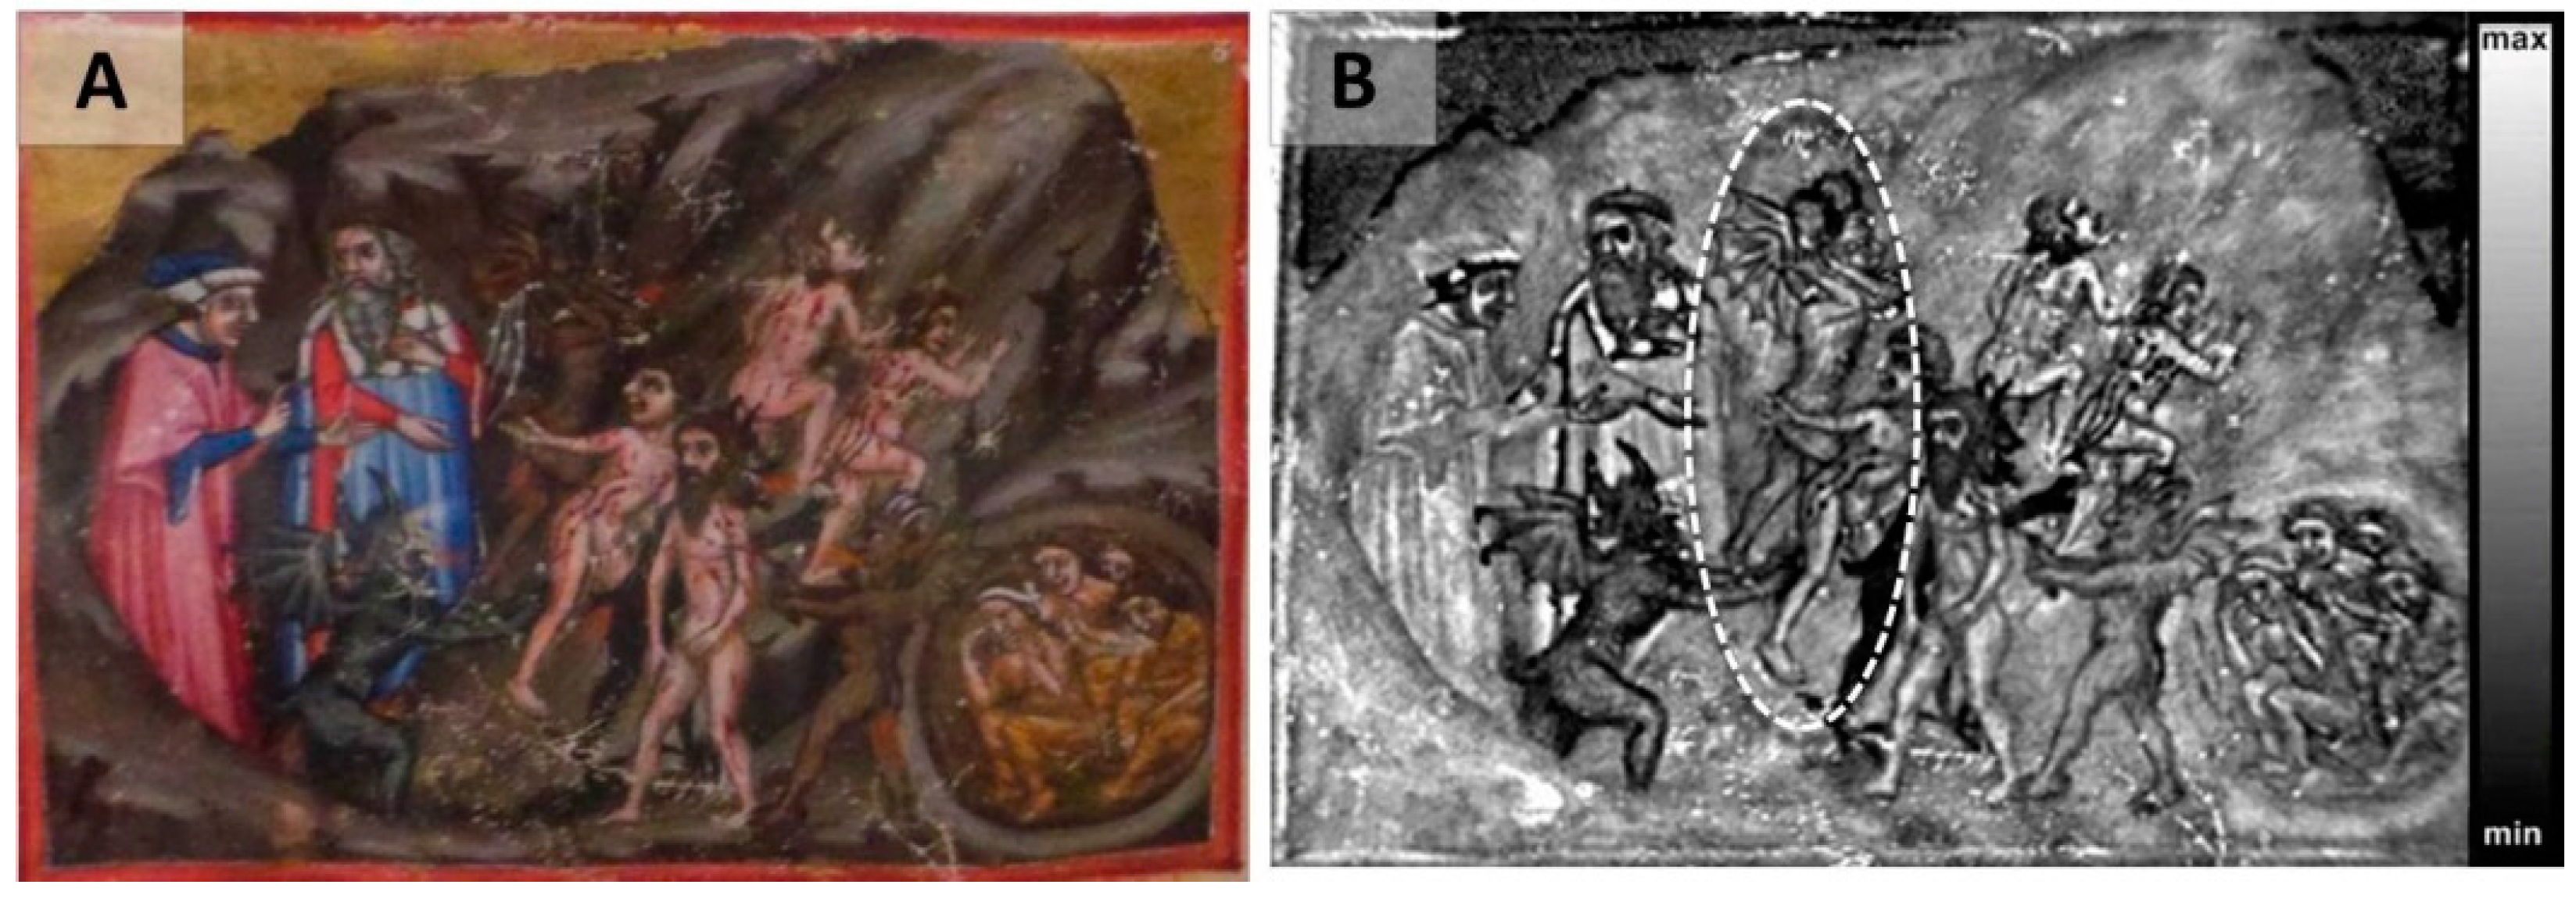
Another interesting application of IRT consists in the possibility to investigate the effect of damage on parchment artefacts, which causes the loss of the surface paint layer. Currently, MSI and HSI analysis are routinely employed to study pictorial and graphic features [77] and for the recovery of the original contrast between pigments and supports in damaged parchment manuscripts [78]. In particular, recent studies have demonstrated the potentiality of UVF in enhancing the readability of faded features in manuscripts [79]. Specifically, UVF has been shown to be useful in identifying the retouches and the damaged areas through the study of their characteristic UV luminescence [80]. In this paper, in order to study these kind of features, a XIV century illuminated copy of the Divina Commedia by Dante Alighieri (“ms 1102”of the Biblioteca Angelica of Rome) has been analyzed by IRT. The manuscript contains thirty four illuminations, which appear faded and in some cases partially erased. For instance, in the case of folio 15 verso, IRT allows researchers to enhance the contrast of some faded figures (Figure 12). The thermogram (front face heating by two flash lamps set at 500 W) of such an illumination (Figure 12B) shows several elements, such as the head and the wing of the demon highlighted by the dashed circle that have partly lost contrast in the photograph of Figure 12A. This is due to the presence of residuals of the materials used to make the original paint decoration that can induce differences in the local light absorption and emission properties and therefore in the local IR emission with respect to surrounding ones, causing the thermal contrast in the thermogram.
3.4. 3D Thermographic Representation of the Capitoline Brutus
In recent years, 3D modelling techniques have often been used in the study of cultural heritage artefacts [55,81] to integrate them with other imaging techniques in order to improve the display of the obtained results. In this regard, hereafter, an application of a method [54], based on the integration of pulsed IRT imaging and 3D laser scanning technologies [82,83,84,85], is presented and used to obtain a 3D thermographic representation of the Capitoline Brutus, so as to observe the structural and subsurface elements of the artefact in their geometrical contest. Concerning the procedure, it consists of the simultaneous use of a 3D scanner, a thermal camera, and a system for the thermal perturbation. Together with the acquisition of the sample geometrical data by the 3D scanning device, the IRT set-up enables the acquisition of thermograms. This provides the possibility to translate and rotate the position of the points captured by the IR camera into the geometrical space defined by the 3D scanner. Knowing the relative position of the IR camera and of the geometric sensors (for the 3D scanner), the thermographic features can be matched to the spatial coordinates obtained by the 3D scanning technique. The result is a 3D display of the features revealed by the thermograms [48,49]. For instance, in Figure 13, 3D thermographic imaging of the Capitoline Brutus is shown. In this representation, surface and sub-surface features, like the junction line and the skull cup (indicated by the arrow in Figure 13), appear in their position on a 3D geometrical reconstruction which can be freely reoriented to provide the most suitable viewing angle. Moreover, different 3D-IRT reconstructions, obtained at different delays with respect to the heating pulse, provide information corresponding to different depths in the observed object. In this regard, an important perspective of the 3D thermography concerns the possible integration with other kinds of imaging techniques to provide a single 3D reconstruction where images from different diagnostics can be simultaneously displayed. Such a reconstruction could be virtually explored by browsing along the surface and through the layers beneath it, providing a tool, not only for scholars, but for any kind of end user, able to easily show surface and subsurface features as revealed by IRT and other NDT imaging techniques [86,87].
4. Conclusions
In this paper, some recent applications of IRT have been reported showing how this technique can be successfully applied to the study of a large variety of cultural heritage structures and materials. In particular, the recent results obtained by pulsed IRT in the study of bronzes, hidden or faded texts, and painted decorations have been illustrated. In the analysis of bronzes, IRT is able to detect different kinds of repairs and to characterize their structure. The thermal diffusivity of the bronze alloy can also be measured by analyzing the time dependence of the thermographic signal originating from particular areas of the statue, providing the possibility to perform an evaluation of the depth of some of the observed features. In the investigation of texts buried within the bookbindings, it has been shown that IRT can successfully analyze written scraps buried beneath the end papers and used to support the binding between the board and the spine. The importance of this kind of analysis is related to the possibility it provides to detect and characterize subsurface texts without dismantling or damaging the books. IRT has also been proposed for the analysis of damaged texts on the outer surface of parchment artefacts and for the study of illuminations belonging to a series of ancient decorated manuscripts, where the obtained information has played an important role in defining the restoration processes. In particular cases, for example, the IRT analysis revealed areas of poor or non-adhesion of the gold leaf to the substrate not detectable by visual inspection and it has contributed to the decision by the restorers to consolidate the golden parts. It has also reported on the results concerning the application of the pulsed IRT in the display of features buried beneath the paint layer, like underdrawings and pentimenti, and in the recovery of damaged surface paintings. Finally, a new method consisting of the integration of pulsed IRT with 3D laser scanning technology is presented, providing a 3D thermographic representation of the surface and subsurface features of the artefacts.
Acknowledgments
The authors would like to thank Claudio Parisi Presicce and Elena Di Gioia, Capitoline Museums, for hosteding them in their institution during the measurement campaigns and for their precious suggestions. They wish to thank Mirella Fidomanzo and Fiammetta Terlizzi, Biblioteca Angelica of Rome, and Paolo Bonora and Orietta Verdi, Archivio di Stato di Roma, for their contribution to this work. They also want to thank Pier Paolo Valentini for the 3D laser scanning analysis. This work is funded by the SMART CAMPUS program (E82I15000980002).
Conflicts of Interest
The authors declare no conflict of interest.
References
- Poldi, G.; Villa, G.C.; Bonizzoni, L. Dalla Conservazione Alla Storia Dell’arte: Riflettografia e Analisi non Invasive per lo Studio dei Dipinti; Edizioni della Normale: Pisa, Italy, 2006. [Google Scholar]
- Thickett, D.; Cheung, C.S.; Liang, H.; Twydle, J.; Maev, R.G.; Gavrilov, D. Using non-invasive non-destructive techniques to monitor cultural heritage objects. Insight 2017, 59, 230–235. [Google Scholar] [CrossRef]
- Grinzato, E.; Bressan, C.; Marinetti, S.; Bison, P.; Bonacina, C. Monitoring of the Scrovegni Chapel by IR thermography: Giotto at infrared. Infrared Phys. Technol. 2002, 43, 165–169. [Google Scholar] [CrossRef]
- Carlomagno, G.M.; Meola, C. Comparison between thermographic techniques for frescoes NDT. NDT&E Int. 2002, 35, 559–565. [Google Scholar]
- Meola, C.; Carlomagno, G.M. Recent advances in the use of infrared thermography. Meas. Sci. Technol. 2004, 15, R27–R58. [Google Scholar] [CrossRef]
- Avdelidis, N.; Moropoulou, A. Applications of infrared thermography for the investigation of historic structures. J. Cult. Herit. 2004, 5, 119–127. [Google Scholar] [CrossRef]
- Ludwig, N.; Rosina, E. Dynamic IRT for the frescoes assessment: The study case of Danza Macabra in Clusone (Italy). In Proceedings of the SPIE 5782 Thermosense XXVII, Orlando, FL, USA, 5 April 2005. [Google Scholar]
- Sfarra, S.; Theodorakeas, P.; Ibarra-Castanedo, C.; Avdelidis, N.P.; Ambrosini, D.; Cheilakou, E.; Paoletti, D.; Koui, M.; Bendada, A.; Maldague, X. How to Retrieve Information Inherent to Old Restorations Made on Frescoes of Particular Artistic Value Using Infrared Vision? Int. J. Thermophys. 2015, 36, 3051–3070. [Google Scholar] [CrossRef]
- Mercuri, F.; Zammit, U.; Orazi, N.; Paoloni, S.; Marinelli, M.; Scudieri, F. Active infrared thermography applied to the investigation of art and historic artefacts. J. Therm. Anal. Calorim. 2011, 104, 475–485. [Google Scholar] [CrossRef]
- Bodnar, J.L.; Candoré, J.C.; Nicolas, J.L.; Szatanik, G.; Detalle, V.; Vallet, J.M. Stimulated infrared thermography applied to help restoring mural paintings. NDT&E Int. 2012, 49, 40–46. [Google Scholar]
- Candoré, J.C.; Bodnar, J.L.; Detalle, V.; Grossel, P. Non-destructive testing of works of art by stimulated infrared thermography. Eur. Phys. J. Appl. Phys. 2012, 57, 21002. [Google Scholar] [CrossRef]
- Mercuri, F.; Cicero, C.; Orazi, N.; Paoloni, S.; Marinelli, M.; Zammit, U. Infrared Thermography Applied to the Study of Cultural Heritage. Intern. J. Thermophys. 2014, 36, 1189–1194. [Google Scholar] [CrossRef]
- Gavrilov, D.; Maev, R.G.; Almond, D.P. A review of imaging methods in analysis of works of art: thermographic imaging method in art analysis. Can. J. Phys. 2014, 92, 341–364. [Google Scholar] [CrossRef]
- Bison, P.; Bortolin, A.; Cadelano, G.; Ferrarini, G.; López, F.; Maldague, X. Comparison of image processing techniques for the on-site evaluation of damaged frescoes. In Proceedings of the SPIE 9105 Thermosense: Thermal Infrared Applications XXXVI 91050E, Baltimora, MD, USA, 21 May 2014. [Google Scholar]
- Waugh, R.C. The Physics and Implementation of Thermography. In Development of Infrared Techniques for Practical Defect Identification in Bonded Joints; Springer: Cham, Switzerland, 2016; Chapter 4; pp. 39–57. [Google Scholar]
- Maldague, X. Theory and Practice of Infrared Technology for Nondestructive Testing; Wiley: New York, NY, USA, 2001. [Google Scholar]
- Mercuri, F.; Zammit, U.; Scudieri, F.; Marinelli, M. Thermal and optical study of the kinetics of the nematic-isotropic transition in octylcyanobiphenyl. Phys. Rev. E 2003, 68, 041708–041720. [Google Scholar] [CrossRef] [PubMed]
- Dadarlat, D.; Neamtu, C.; Pop, R.; Marinelli, M.; Mercuri, F. On the selection of the experimental parameters in a thermalwave-resonator-cavity (TWRC) configuration. J. Optoelectron. Adv. Mater. 2007, 9, 2847–2852. [Google Scholar]
- Zammit, U.; Marinelli, M.; Mercuri, F.; Paoloni, S. Effect of confinement and strain on the specific heat and latent heat over the Nematic−isotropic phase transition of 8CB liquid crystal. J. Phys. Chem. B 2009, 113, 14315–14322. [Google Scholar] [CrossRef] [PubMed]
- Zammit, U.; Paoloni, S.; Mercuri, F.; Marinelli, M.; Scudieri, F. Self consistently calibrated photopyroelectric calorimeter for the high resolution simultaneous absolute measurement of the specific heat and of the thermal conductivity. AIP Adv. 2012, 2, 012135. [Google Scholar] [CrossRef]
- Zammit, U.; Mercuri, F.; Paoloni, S.; Marinelli, M.; Pizzoferrato, R. Simultaneous absolute measurements of the thermal diffusivity and the thermal effusivity in solids and liquids using photopyroelectric calorimetry. J. Appl. Phys. 2015, 117, 105104. [Google Scholar] [CrossRef]
- Paoloni, S.; Mercuri, F.; Zammit, U. Simultaneous specific heat, thermal conductivity and imaging evaluations in thin samples of 8CB liquid crystal dispersed with microemulsion of DDAB/water micelles. J. Chem. Phys. 2016, 145, 124506. [Google Scholar] [CrossRef] [PubMed]
- Wu, D.; Busse, G. Lock-in thermography for non-destructive evaluation of materials. Rev. Gén. Therm. 1998, 37, 693–703. [Google Scholar] [CrossRef]
- Scudieri, F.; Mercuri, F.; Volterri, R. Non-invasive Analysis of Artistic Heritage and Archaeological Findings by Time Resolved IR Thermography. J. Therm. Anal. Calorim. 2001, 66, 307–314. [Google Scholar] [CrossRef]
- Grinzato, E. Temperature monitors works of art health as human beings. In Proceedings of the 16th World Conference on NDT, Montreal, QC, Canada, 30 August–3 September 2004. [Google Scholar]
- Gomez-Heras, M.; Martinez-Perez, L.; Fort, R.; Alvarez de Buergo, M. Decay assessment through thermographic analysis in architectural and archaeological heritage. In Proceedings of the EGU General Assembly 2010, Vienna, Austria, 2–7 May 2010. [Google Scholar]
- Blessey, K.; Young, C.; Nunn, J.; Coddington, J.; Shepard, S. The Feasibility of Flash Thermography for the Examination and Conservation of Works of Art. Stud. Conserv. 2010, 55, 107–120. [Google Scholar] [CrossRef]
- Avdelidis, N.; Koui, M.; Ibarra-Castanedo, C.; Maldague, X. Thermographic studies of plastered mosaics. Infrared Phys. Technol. 2007, 49, 254–256. [Google Scholar] [CrossRef]
- Theodorakeas, P.; Avdelidis, N.P.; Cheilakou, E.; Koui, M. Quantitative analysis of plastered mosaics by means of active infrared thermography. Constr. Build. Mater. 2014, 73, 417–425. [Google Scholar] [CrossRef]
- Mazioud, A.; Ibos, L.; Dumoulin, J. Detection of buried mosaics in plaster layers by square pulse thermography: Laboratory study on different hidden structures. In Proceedings of the Asia International Conference on Quantitative InfraRed Thermography, Mahabalipuram, India, 6–10 July 2015. [Google Scholar]
- Sfarra, S.; Ibarra-Castanedo, C.; Theodorakeas, P.; Avdelidis, N.P.; Perilli, S.; Zhang, H.; Nardi, I.; Koui, M.; Maldague, X.P. Evaluation of the state of conservation of mosaics: Simulations and thermographic signal processing. Int. J. Therm. Sci. 2017, 117, 287–315. [Google Scholar] [CrossRef]
- Di Tuccio, M.C.; Ludwig, N.; Gargano, M.; Bernardi, A. Thermographic inspection of cracks in the mixed materials statue: Ratto delle Sabine. Herit. Sci. 2015, 3, 10. [Google Scholar] [CrossRef]
- Sfarra, S.; Tortora, M.; Regi, M.; Casieri, C.; Perilli, S.; Cerichelli, G.; Paoletti, D. Detection of incipient defects in book bindings. In Proceedings of the QIRT 13, A functional Use of the Infrared Vision Combined with Optical and Nuclear Magnetic Resonance (NMR) Spectroscopy Techniques, Gdańsk, Poland, 4–8 July 2016. [Google Scholar]
- Ibarra-Castanedo, C.; Khodayar, F.; Klein, M.; Sfarra, S.; Maldague, X.; Helal, H.; Tayoubi, M.; Marini, B.; Barré, J.C. Infrared vision for artwork and cultural heritage NDE studies: Principles and case studies. Insight 2017, 59, 243–248. [Google Scholar] [CrossRef]
- Sfarra, S.; Ibarra-Castanedo, C.; Ambrosini, D.; Paoletti, D.; Bendada, A.; Maldague, X. Integrated approach between pulsed thermography, near-infrared reflectography and sandwich holography for wooden panel paintings advanced monitoring. Russ. J. Nondestruct. Test. 2011, 47, 284–293. [Google Scholar] [CrossRef]
- Sfarra, S.; Theodorakeas, P.; Ibarra-Castanedo, C.; Avdelidis, N.P.; Paoletti, A.; Paoletti, D.; Hrissagis, K.; Bendada, A.; Koui, M.; Maldague, X. Importance of integrated results of different non-destructive techniques in order to evaluate defects in panel paintings: The contribution of infrared, optical and ultrasonic techniques. In Proceedings of the SPIE 8084, San Francisco, CA, USA, 22–27 January 2011. [Google Scholar]
- Buchta, D.; Hein, N.; Pedrini, G.; Krekel, C.; Osten, W. Artwork Inspection by Shearography with Adapted Loading. Exp. Mech. 2015, 55, 1691–1704. [Google Scholar] [CrossRef]
- Morawitz, M.; Hein, N.; Alexeenko, I.; Wilke, M.; Pedrini, G.; Krekel, C.; Osten, W. Detection of transport and age induced damages on artwork: an advanced concept. In Proceedings of the Optics for Arts, Architecture, and Archaeology IV, Munich, Germany, 13–16 May 2013. [Google Scholar]
- Groves, R.M.; Pradarutti, B.; Kouloumpi, E.; Osten, W.; Notni, G. Multi-sensor evaluation of a wooden panel painting using terahertz imaging and shearography. In Proceedings of the Optics for Arts, Architecture, and Archaeology II, Munich, Germany, 17–18 June 2019. [Google Scholar]
- Tornari, V.; Bonarou, A.; Castellini, P.; Esposito, E.; Osten, W.; Kalms, M.K.; Smyrnakis, N.; Stasinopulos, S. Laser-based systems for the structural diagnostic of artwork: An application to XVII-century Byzantine icons. In Proceedings of the Lasers in Metrology and Art Conservation, Munich, Germany, 22 October 2001. [Google Scholar]
- Kujawinska, M.; Malesa, M.; Malowany, K.; Piekarczuk, A.; Tymińska-Widmer, L.; Targowski, P. Digital image correlation method: A versatile tool for engineering and art structures investigations. In Proceedings of the 22nd Congress of the International Commission for Optics: Light for the Development of the World, Puebla, Mexico, 3 November 2011. [Google Scholar]
- Ambrosini, D.; Daffara, C.; Di Biase, R.; Paoletti, D.; Pezzati, L.; Bellucci, R.; Bettini, F. Integrated reflectography and thermography for wooden paintings diagnostics. J. Cult. Herit. 2010, 11, 196–204. [Google Scholar] [CrossRef]
- Maev, R.G.; Gavrilov, D. Thermography in Analysis of Works of Art: Choice of the Optimal Approach. In Proceedings of the 13th International Symposium on Nondestructive Characterization of Materials (NDCM-XIII), Le Mans, France, 20–24 May 2013. [Google Scholar]
- Zhang, H.; Sfarra, S.; Saluja, K.; Peeters, J.; Fleuret, J.; Duan, Y.; Fernandes, H.; Avdelidis, N.; Ibarra-Castanedo, C.; Maldague, X. Non-destructive Investigation of Paintings on Canvas by Continuous Wave Terahertz Imaging and Flash Thermography. J. Nondestruct. Eval. 2017, 36, 34. [Google Scholar] [CrossRef]
- Bendada, A.; Sfarra, S.; Ibarra-Castanedo, C.; Akhloufi, M.; Caumes, J.-P.; Pradere, C.; Batsale, J.C.; Paoletti, D.; Maldague, X. Subsurface imaging for panel paintings inspection, passing through the ultraviolet, the visible, the infrared and the terahertz spectra. Opto-Electron. Rev. 2015, 23, 88–99. [Google Scholar] [CrossRef]
- Daffara, C.; Ambrosini, D.; Pezzati, L.; Paoletti, D. Thermal Quasi-Reflectography: A new imaging tool in art conservation. Opt. Express 2012, 20, 14746–14753. [Google Scholar] [CrossRef] [PubMed]
- Giuffredi, A.; Mercuri, F.; Parisi Presicce, C.; Salerno, C.S.; Paoloni, S.; Orazi, N. La Lupa Capitolina: Indagini termografiche per lo studio delle tecniche di formatura e delle finiture del bronzo dopo la fusione. Bull. Della Comm. Archeol. Comunale Roma 2014, 114, 9–24. [Google Scholar]
- Mercuri, F.; Orazi, N.; Zammit, U.; Giuffredi, A.; Salerno, C.S.; Cicero, C.; Paoloni, S. The manufacturing process of the Capitoline She Wolf: A thermographic method for the investigation of repairs and casting faults. J. Archaeol. Sci. Rep. 2017, 14, 199–207. [Google Scholar] [CrossRef]
- Mercuri, F.; Paoloni, S.; Orazi, N.; Cicero, C.; Zammit, U. Pulsed infrared thermography applied to quantitative characterization of the structure and the casting faults of the Capitoline She Wolf. Appl. Phys. A 2017, 123, 317. [Google Scholar] [CrossRef]
- Mercuri, F.; Gnoli, R.; Paoloni, S.; Orazi, N.; Zammit, U.; Cicero, C.; Marinelli, M.; Scudieri, F. Hidden text detection by Infrared Thermography. Restaurator 2013, 34, 195–211. [Google Scholar]
- Doni, G.; Orazi, N.; Mercuri, F.; Cicero, C.; Zammit, U.; Paoloni, S.; Marinelli, M. Thermographic study of the illuminations of a 15th antiphonary. J. Cult. Herit. 2014, 15, 692–697. [Google Scholar] [CrossRef]
- Ricciardi, P.; Delaney, J.K.; Glinsman, L.; Thoury, M.; Facini, M.; De la Rie, E.R. Use of visible and infrared reflectance and luminescence imaging spectroscopy to study illuminated manuscripts: Pigment identification and visualization of underdrawings. In Proceedings of the SPIE 7391, San Jose, CA, USA, 24–29 January 2009. [Google Scholar]
- Loreti, E.; Carbonetti, C.; Cicero, C.; Marinelli, M.; Mercuri, F.; Migliore, L.; Orazi, N.; Orlanducci, S.; Paoloni, S.; Pasqualucci, A.; et al. Studio e restauro delle pergamene dell’Archivio Boncompagni-Ludovisi conservato presso l’Archivio Segreto Vaticano. Collect. Arch. Vaticani 2016, 102, 423–458. [Google Scholar]
- Orazi, N.; Mercuri, F.; Paoloni, S.; Valentini, P.P. Metodo e Apparato di Analisi Termografica Tridimensionale. Patent 0001406058, 19 November 2012. [Google Scholar]
- Mercuri, F.; Orazi, N.; Zammit, U.; Paoloni, S.; Marinelli, M.; Valentini, P.P. Thermographic analysis of cultural heritage: Recent applications and perspectives. E-PS 2012, 9, 84–89. [Google Scholar]
- Philippi, I.; Batsale, J.C.; Maillet, D.; Degiovanni, A. Measurement of thermal diffusivities through processing of infrared images. Rev. Sci. Instrum. 1995, 66, 182. [Google Scholar] [CrossRef]
- Carlsaw, H.; Jaeger, J. Conduction of Heat in Solids, 2nd ed.; Oxford University Press: Oxford, UK, 1959. [Google Scholar]
- Parker, W.J.; Jenkins, R.J.; Butler, C.P.; Abbott, G.L. Flash Method of Determining Thermal Diffusivity, Heat Capacity, and Thermal Conductivity. J. Appl. Phys. 1961, 32, 1679–1684. [Google Scholar] [CrossRef]
- Delpech, P.H.; Bosher, D.; Deom, A.; Balageas, D. Utilisation de la transformation de Laplace pour la determination des grandeurs thermiques. In Proceedings of the Colloque de la Societe Francaise des Thermiciens, Palaiseau, France, 16–17 May 1990. [Google Scholar]
- Giuffredi, A. Formatura e Fonderia, Guida ai Processi di Lavorazione; Alinea Editrice S.R.L.: Florence, Italy, 2010. [Google Scholar]
- Orazi, N.; Mercuri, F.; Zammit, U.; Paoloni, S.; Marinelli, M.; Giuffredi, A.; Salerno, C.S. Thermographic analysis of bronze sculptures. Stud. Conserv. 2016, 61, 236–244. [Google Scholar] [CrossRef]
- Oron, A. The Athlit Ram: Classical and Hellenistic Bronze Casting Technology. Ph.D. Thesis, Texas A&M University, College Station, TX, USA, 2001. [Google Scholar]
- Krapez, J.C. Infrared and Thermal Testing. In Nondestructive Testing Handbook; Maldague, X., Ed.; ASNT: Columbus, OH, USA, 2001; Volume 3, p. 411. [Google Scholar]
- Salerno, E.; Tonazzini, A.; Bedini, L. Digital image analysis to enhance underwritten text in the Archimedes palimpsest. Int. J. Doc. Anal. Recognit. 2007, 9, 79–87. [Google Scholar] [CrossRef]
- Knox, K.T.; Easton, R.L. Recovery of Lost Writings on Historical Manuscripts with Ultraviolet Illumination. IS&T Rep. 2003, 18, 1–5. [Google Scholar]
- Shiel, P.; Malte, R.; Keating, J. The ghost in the manuscript: Hyperspectral text recovery and segmentation. In Kodikologie und Paläographie im Digitalen Zeitalter—Codicology and Palaeography in the Digital Age; Schriften des Instituts für Dokumentologie und Editorik: Norderstedt, Germany, 2009; pp. 159–174. [Google Scholar]
- Giacometti, A.; Campagnolo, A.; MacDonald, L.; Mahony, S.; Robson, S.; Weyrich, T.; Terras, M.; Gibson, A. The value of critical destruction: Evaluating multispectral image processing methods for the analysis of primary historical texts. Digit. Scholarsh. Humanit. 2017, 32, 101–122. [Google Scholar] [CrossRef]
- Hedjam, R.; Cheriet, M. Historical document image restoration using multispectral imaging system. Pattern Recognit. 2013, 46, 2297–2312. [Google Scholar] [CrossRef]
- Tonazzini, A.; Salerno, E.; Mochi, M.; Bedini, L. Blind source separation techniques for detecting hidden texts and textures in document images. In Image Analysis and Recognition. Lecture Notes in Computer Science 3212; Campilho, A., Kamel, M., Eds.; Springer: Berlin, Germany, 2004; Volume 3212, pp. 241–248. [Google Scholar]
- Gargano, M.; Bertani, D.; Greco, M.; Cupitt, J.; Gadia, D.; Rizzi, A. A perceptual approach to the fusion of visible and NIR images in the examination of ancient documents. J. Cult. Herit. 2015, 16, 518–525. [Google Scholar] [CrossRef]
- Duivenvoorden, J.R.; Käyhkö, A.; Kwakkel, E.; Dik, J. Hidden library: visualizing fragments of medieval manuscripts in early-modern bookbindings with mobile macro-XRF scanner. Herit. Sci. 2017, 5, 6. [Google Scholar] [CrossRef]
- Albertin, F.; Romito, M.; Peccenini, E.; Bettuzzi, M.; Brancaccio, R.; Morigi, M.P.; del Rio, M.; Raines, D.; Margaritondo, G.; Psaltis, D. From closed testaments to books: Virtual X-ray Reading as an alternate digitization technology for fragile documents. In Proceedings of the IS&T Archiving Conference 2017, Riga, Latvia, 8–10 May 2017. [Google Scholar]
- Caldelli, E. I frammenti della biblioteca Vallicelliana. In Studio Metodologico Sulla Catalogazione dei Frammenti dei Codici Medievali e sul Fenomeno del loro Riuso; Istituto Storico Italiano per il Medioevo: Roma, Italy, 2012. [Google Scholar]
- Piñar, G.; Sterflinger, K.; Pinzari, F. Unmasking the measles-like parchment discoloration: Molecular and microanalytical approach. Environ. Microbiol. 2015, 17, 427–443. [Google Scholar] [CrossRef] [PubMed]
- Cosentino, A. Terahertz and Cultural Heritage Science: Examination of Art and Archaeology. Technologies 2016, 4, 6. [Google Scholar] [CrossRef]
- Groves, R.M.; Osten, W.; Doulgeridis, M.; Kouloumpi, E.; Green, T.; Hackney, S.; Tornari, V. Shearography as part of a multi-functional sensor for the detection of signature features in movable cultural heritage. In Proceedings of the Optics for Arts, Architecture, and Archaeology 661810, Munich, Germany, 19 July 2007. [Google Scholar]
- Daffara, C.; Pampaloni, E.; Pezzati, L.; Barucci, M.; Fontana, R. Scanning multispectral IR reflectography SMIRR: an advanced tool for art diagnostic. Acc. Chem. Res. 2010, 43, 847–856. [Google Scholar] [PubMed]
- Easton, R.L.; Knox, K.T.; Christens-Barry, W.A. Multispectral Imaging of the Archimedes Palimpsest, In Applied Imagery Pattern Recognition Workshop. In Proceedings of the 32nd conference IEEE, Washington, DC, USA, 15–17 October 2003. [Google Scholar]
- Montani, I.; Sapin, E.; Pahud, A.; Margot, P. Enhancement of writings on a damaged medieval manuscript using ultraviolet imaging. J. Cult. Herit. 2012, 13, 226–228. [Google Scholar] [CrossRef]
- Lettner, M.; Diem, M.; Sablatnig, R.; Miklas, H. Digital image analysis for the investigation of ancient manuscripts In Layers of perception. In Proceedings of the 35th Conference on Computed Applications and Quantitative Methods in Archaeology, Berlin, Germany, 2–6 April 2007. [Google Scholar]
- Fassi, F.; Fregonese, L.; Ackermann, S.; Troia, V.D. Comparison Between Laser Scanning And Automated 3D Modelling Techniques To Reconstruct Complex And Extensive Cultural Heritage Areas. ISPRS 2013, 73–80. [Google Scholar] [CrossRef]
- Grubisic, I.; Gjenero, L.; Lipic, T.; Sovic, I.; Skala, T. Active 3d scanning based 3d thermography system and medical applications. In Proceedings of the 34th International Convention MIPRO, Opatija, Croatia, 23–27 May 2011. [Google Scholar]
- Burrows, S.E.; Dixon, S.; Pickering, S.G.; Li, T.; Almond, D.P. Thermographic detection of surface breaking defects using a scanning laser source. NDT&E Int. 2011, 44, 589–596. [Google Scholar]
- Kadobayashi, R.; Kochi, N.; Otani, H.; Furukawa, R. Comparison and evaluation of laser scanning and photogrammetry and their combined use for digital recording of cultural heritage. Int. Arch. Photogramm. Remote Sens. Spat. Inf. Sci. 2004, 35, 401–406. [Google Scholar]
- Bohler, W.; Marbs, A. 3D scanning and photogrammetry for heritage recording: A comparison. In Proceedings of the 12th International Conference on Geoinformatics, Ga¨vle, Sweden, 7–9 June 2004. [Google Scholar]
- Groves, R.M.; Li, A.; Liu, X.; Hackney, S.; Peng, X.; Osten, W. 2.5D virtual reality visualisation of shearography strain data from a canvas painting. In Proceedings of the Optics for Arts, Architecture, and Archaeology II, 739109, Munich, Germany, 7 July 2009. [Google Scholar]
- Malesa, M.; Malowany, K.; Tymińska-Widmer, L.; Kwiatkowska, E.A.; Kujawńska, M.; Rouba, B.J.; Targowski, P. Application of digital image correlation (DIC) for tracking deformations of paintings on canvas. In Proceedings of the Optics for Arts, Architecture, and Archaeology III 80840L, Munich, Germany, 6 June 2011. [Google Scholar]
Figure 1.
Double logarithmic plot of the decay of the surface temperature with time calculated for D = 0.19 cm2/s and for the thickness (L) values reported in the inset.
Figure 1.
Double logarithmic plot of the decay of the surface temperature with time calculated for D = 0.19 cm2/s and for the thickness (L) values reported in the inset.

Figure 2.
Semi-logarithmic plot of the normalized transient temperature rise ∆T(L,t) vs. time calculated for the same L and D values of Figure 1.
Figure 2.
Semi-logarithmic plot of the normalized transient temperature rise ∆T(L,t) vs. time calculated for the same L and D values of Figure 1.

Figure 3.
(A) Sketch of the positions of the mechanical and metallurgic repairs on the She Wolf statue; thermograms of the mechanical patch on the shoulder (B) and of the cast-on patch on the right front paw (C) [48].
Figure 3.
(A) Sketch of the positions of the mechanical and metallurgic repairs on the She Wolf statue; thermograms of the mechanical patch on the shoulder (B) and of the cast-on patch on the right front paw (C) [48].

Figure 4.
(A) Photograph of the She Wolf fur; (B) thermogram of the original statue where ihnomogeneities at the fur edges are highlighted by the dashed circles; (C) thermogram of the She Wolf copy where no inhomogeneity is detected [47].
Figure 4.
(A) Photograph of the She Wolf fur; (B) thermogram of the original statue where ihnomogeneities at the fur edges are highlighted by the dashed circles; (C) thermogram of the She Wolf copy where no inhomogeneity is detected [47].

Figure 5.
(A) Thermogram obtained at the She Wolf right ear. The label indicates the spot in which the time dependence of the radiometric signal, displayed in Figure 5B, was analyzed; (B) time dependence of the thermographic data obtained by rear face heating in zone 1 of the right ear. The continuous line represents the theoretical results obtained with L = 0.57 cm and D = 0.15 cm2/s. The vertical dashed line intercepts the t1/2 value [48,49].

Figure 6.
She Wolf, left rear paw. Thermograms (A,B) obtained by the front face heating mode where the arrows indicate some pseudo-spherical cavities; (C) time dependence of the contrast coefficients obtained over the cavities of Figure 6B. The vertical dashed lines intercept the tm/2 values (see text) for the various curves [48,49].

Figure 7.
XVI century book, Biblioteca Angelica of Rome. (A) Photograph and (B) corresponding thermogram; (C) magnification of the dashed area in 7B [50].
Figure 7.
XVI century book, Biblioteca Angelica of Rome. (A) Photograph and (B) corresponding thermogram; (C) magnification of the dashed area in 7B [50].

Figure 8.
XIII century manuscript “ms 509/D813”, Biblioteca Angelica of Rome. (A) Photograph of folio 124 verso; (B,C) thermograms of the areas indicated by the dashed rectangles in Figure 8A. For ease of viewing and to better compare the thermographic results with the photographic image, the thermograms are presented with an inverted grey palette.

Figure 9.
Antiphonary, XV century, Biblioteca Angelica of Rome. (A) Photograph of the illuminated letter of folio 117 verso, where the arrows indicate the craquelure; (B) thermogram showing extended detachments from the substrate around some of the observed cracks marked by circles [51].
Figure 9.
Antiphonary, XV century, Biblioteca Angelica of Rome. (A) Photograph of the illuminated letter of folio 117 verso, where the arrows indicate the craquelure; (B) thermogram showing extended detachments from the substrate around some of the observed cracks marked by circles [51].

Figure 10.
Antiphonary, XV century, Biblioteca Angelica of Rome. (A) Photograph of the illuminated letter of folio 142 recto; (B) thermogram before the restoration showing the detachment of the gold leaf from its substrate, indicated by the arrows; (C) thermogram after the restoration [51].
Figure 10.
Antiphonary, XV century, Biblioteca Angelica of Rome. (A) Photograph of the illuminated letter of folio 142 recto; (B) thermogram before the restoration showing the detachment of the gold leaf from its substrate, indicated by the arrows; (C) thermogram after the restoration [51].

Figure 11.
Liber Regulae S. Spiritus De Saxia, XIV century, Archivio di Stato di Roma. (A) Photograph of the illumination of folio 239 verso; (B) thermogram showing a pentimento (indicated by the arrow).
Figure 11.
Liber Regulae S. Spiritus De Saxia, XIV century, Archivio di Stato di Roma. (A) Photograph of the illumination of folio 239 verso; (B) thermogram showing a pentimento (indicated by the arrow).

Figure 12.
Commedia, XIV century, Biblioteca Angelica of Rome. (A) Photograph of the illumination of folio 15 verso; (B) thermogram where the dashed circle marks the demon.
Figure 12.
Commedia, XIV century, Biblioteca Angelica of Rome. (A) Photograph of the illumination of folio 15 verso; (B) thermogram where the dashed circle marks the demon.

Figure 13.
3D representation of the thermographic results obtained for the Capitoline Brutus. The arrows indicate the junction line on the neck and the skullcap.
Figure 13.
3D representation of the thermographic results obtained for the Capitoline Brutus. The arrows indicate the junction line on the neck and the skullcap.

© 2017 by the authors. Licensee MDPI, Basel, Switzerland. This article is an open access article distributed under the terms and conditions of the Creative Commons Attribution (CC BY) license (http://creativecommons.org/licenses/by/4.0/).
Share and Cite
MDPI and ACS Style
Mercuri, F.; Orazi, N.; Paoloni, S.; Cicero, C.; Zammit, U. Pulsed Thermography Applied to the Study of Cultural Heritage. Appl. Sci. 2017, 7, 1010. https://doi.org/10.3390/app7101010
AMA Style
Mercuri F, Orazi N, Paoloni S, Cicero C, Zammit U. Pulsed Thermography Applied to the Study of Cultural Heritage. Applied Sciences. 2017; 7(10):1010. https://doi.org/10.3390/app7101010
Chicago/Turabian StyleMercuri, Fulvio, Noemi Orazi, Stefano Paoloni, Cristina Cicero, and Ugo Zammit. 2017. "Pulsed Thermography Applied to the Study of Cultural Heritage" Applied Sciences 7, no. 10: 1010. https://doi.org/10.3390/app7101010
Note that from the first issue of 2016, this journal uses article numbers instead of page numbers. See further details here.