Article

Material Optimization for a High Power Thermoelectric Generator in Wearable Applications

1
School of Electrical Engineering, Korea Advanced Institute of Science and Technology (KAIST), 291 Daehak-ro, Yuseong-gu, Daejeon 34141, Korea
2
School of Chemical and Biological Engineering, Seoul National University (SNU), 1 Gwanak-ro, Gwanak-gu, Seoul 08826, Korea
*
Author to whom correspondence should be addressed.
Appl. Sci. 2017, 7(10), 1015; https://doi.org/10.3390/app7101015
Submission received: 13 September 2017 / Revised: 26 September 2017 / Accepted: 26 September 2017 / Published: 30 September 2017

Abstract

:
Thermoelectric power generation using human body heat can be applied to wearable sensors, and various applications are possible. Because the thermoelectric generator (TEG) is highly dependent on the thermoelectric material, research on improving the performance of the thermoelectric material has been conducted. Thus far, in developing thermoelectric materials, the researchers have focused on improving the figure of merit, ZT. For a TEG placed on the human body, however, the power density does not always increase as the material ZT increases. In this study, the material properties and ZT of P-type BiSbTe3 were simulated for carrier concentration ranging from 3 × 10¹⁷ to 3 × 1020 cm−3, and the power density of a TEG fabricated from the material dataset was calculated using a thermoelectric resistance model for human body application. The results revealed that the maximum ZT and the maximum power density were formed at different carrier concentrations. The material with maximum ZT showed 28.8% lower power density compared to the maximum obtainable power density. Further analysis confirmed that the mismatch in the optimum carrier concentration for the maximum ZT and maximum power density can be minimized when a material with lower thermal conductivity is used in a TEG. This study shows that the ZT enhancement of materials is not the highest priority in the production of a TEG for human body application, and material engineering to lower the thermal conductivity is required to reduce the optimum point mismatch problem.

1. Introduction

Thermoelectric generators (TEGs), which convert waste heat into electricity, are one of the most promising energy harvesting devices [1]. In particular, thermoelectric power generation from human body heat is becoming a promising field as it can be applied to Internet of Things (IoT) and wearable electronics [2]. It has been reported that thermoelectric devices can generate around 30 μW/cm2 of power when they are attached to the human body [3], and that level of power can drive low-power chips such as sensors in wearable devices [4,5]. As higher power density generation is always desirable, various studies have been carried out to improve the device performance.
Many efforts have been made toward enhancing the figure of merit (ZT) values in several existing TE material classes for applications in varied temperature ranges, including silicides [6], half-Heuslers [7,8], and tellurides (e.g., of Bi [9], Pb [10,11] and Ge [12,13]). On the other hand, from the perspective of device engineering, it is important to increase the output power. The maximum efficiency of power generation is one of the most frequently used indicators for device performance because it represents generated power per unit of heat flux. The equation of power generation efficiency is shown below [14,15].
η = P Q i n = T h T c T h 1 + Z d e v T 1 1 + Z d e v T + T c T h ,
where Th and Tc are the temperatures at the hot and cold side of the device, respectively, and ZdevT is the ZT of the device. As shown in the Equation (1), generated power from the device is increased with ZdevT for constant input heat flux. In the practical situation, the ZdevT changes depending on the contact resistance in the device [16], the thermal parasitic resistance [17], etc. All of these factors, however, are negligible in the ideal case and the material ZT is a more dominant factor that affects ZdevT. If the condition is ideal and the N and P type of thermoelectric leg (TE leg) have the same properties, ZdevT is exactly the same as material ZT [14]. Therefore, improving the performance of the thermoelectric material is the best way to improve the performance of the thermoelectric device. This is consistent with existing research on thermoelectric materials that focus on increasing material ZT.
For the TEG placed on the human body, however, heat flux passing through the thermoelectric (TE) material is not constant. Thus, the output power of the device placed on the human body is not proportional to the power generation efficiency and ZT is no longer the only factor that increases the output power. Leonov et al. suggested a thermal resistance model of thermoelectric generation on the human body [18]. In the model, the thermal resistance outside of the device is large enough, thus the thermal resistance of the device is negligible and heat flux through the device changes as the material or the structure of the device changes.
Various studies have confirmed that output power can be changed by structural variation even though the devices are made of the same thermoelectric material. The optimum conditions regarding device structure have been studied to generate maximum power density on the human body. Variables related to the device structure and the environment such as the fill factor and the TE leg height were optimized for human body application [19,20,21,22].
On the other hand, in human body applications, few studies on material engineering for higher power density have been reported. In general, the performance of the thermoelectric materials can be improved by such processes as doping [23], polycrystalline grain size control [24], superlattice period control [25], etc. These engineering techniques change the three main properties of the TE material: the Seebeck coefficient (α), the electrical conductivity (σ), and the thermal conductivity (κ). These properties trade off against each other, as shown in the equation of ZT = (α2 σT)/κ [26]. As a result, the material engineering techniques reported to date are aimed at finding the maximum point of the ZT.
Mayer et al. confirmed the importance of material thermal conductivity in a heat sink-limited condition [26]. Suarez et al. showed that when the material ZT is fixed, as the thermal conductivity of the material decreases, power density generated from body heat increases [20]. However, while this result emphasizes the importance of material thermal conductivity in device simulations, it does not suggest how this affects the engineering of the materials.
In this study, an experiment was conducted based on P-type BiSbTe3 which is commercially used for a room temperature condition [27]. Material properties of the P-type BiSbTe3 according to carrier concentration were extracted, and then the power density of the device was calculated for each material property. The material properties were simulated by using first-principles calculations [28], and the power density was calculated based on the thermal resistance model in the human body application. The results showed that the optimum carrier concentration for ZT and power density were different. In this study, the cause of the discrepancy between the carrier concentrations for the maximum ZT and the maximum power density in the human body application was analyzed and a theoretical approach for material engineering was proposed in order to reduce this mismatch.

2. Materials and Methods

A simulation based on the composition ratio and the lattice structure of materials was carried out to obtain the physical properties according to carrier concentration. A device simulation with the material properties was then performed to calculate the power density in the human body application.

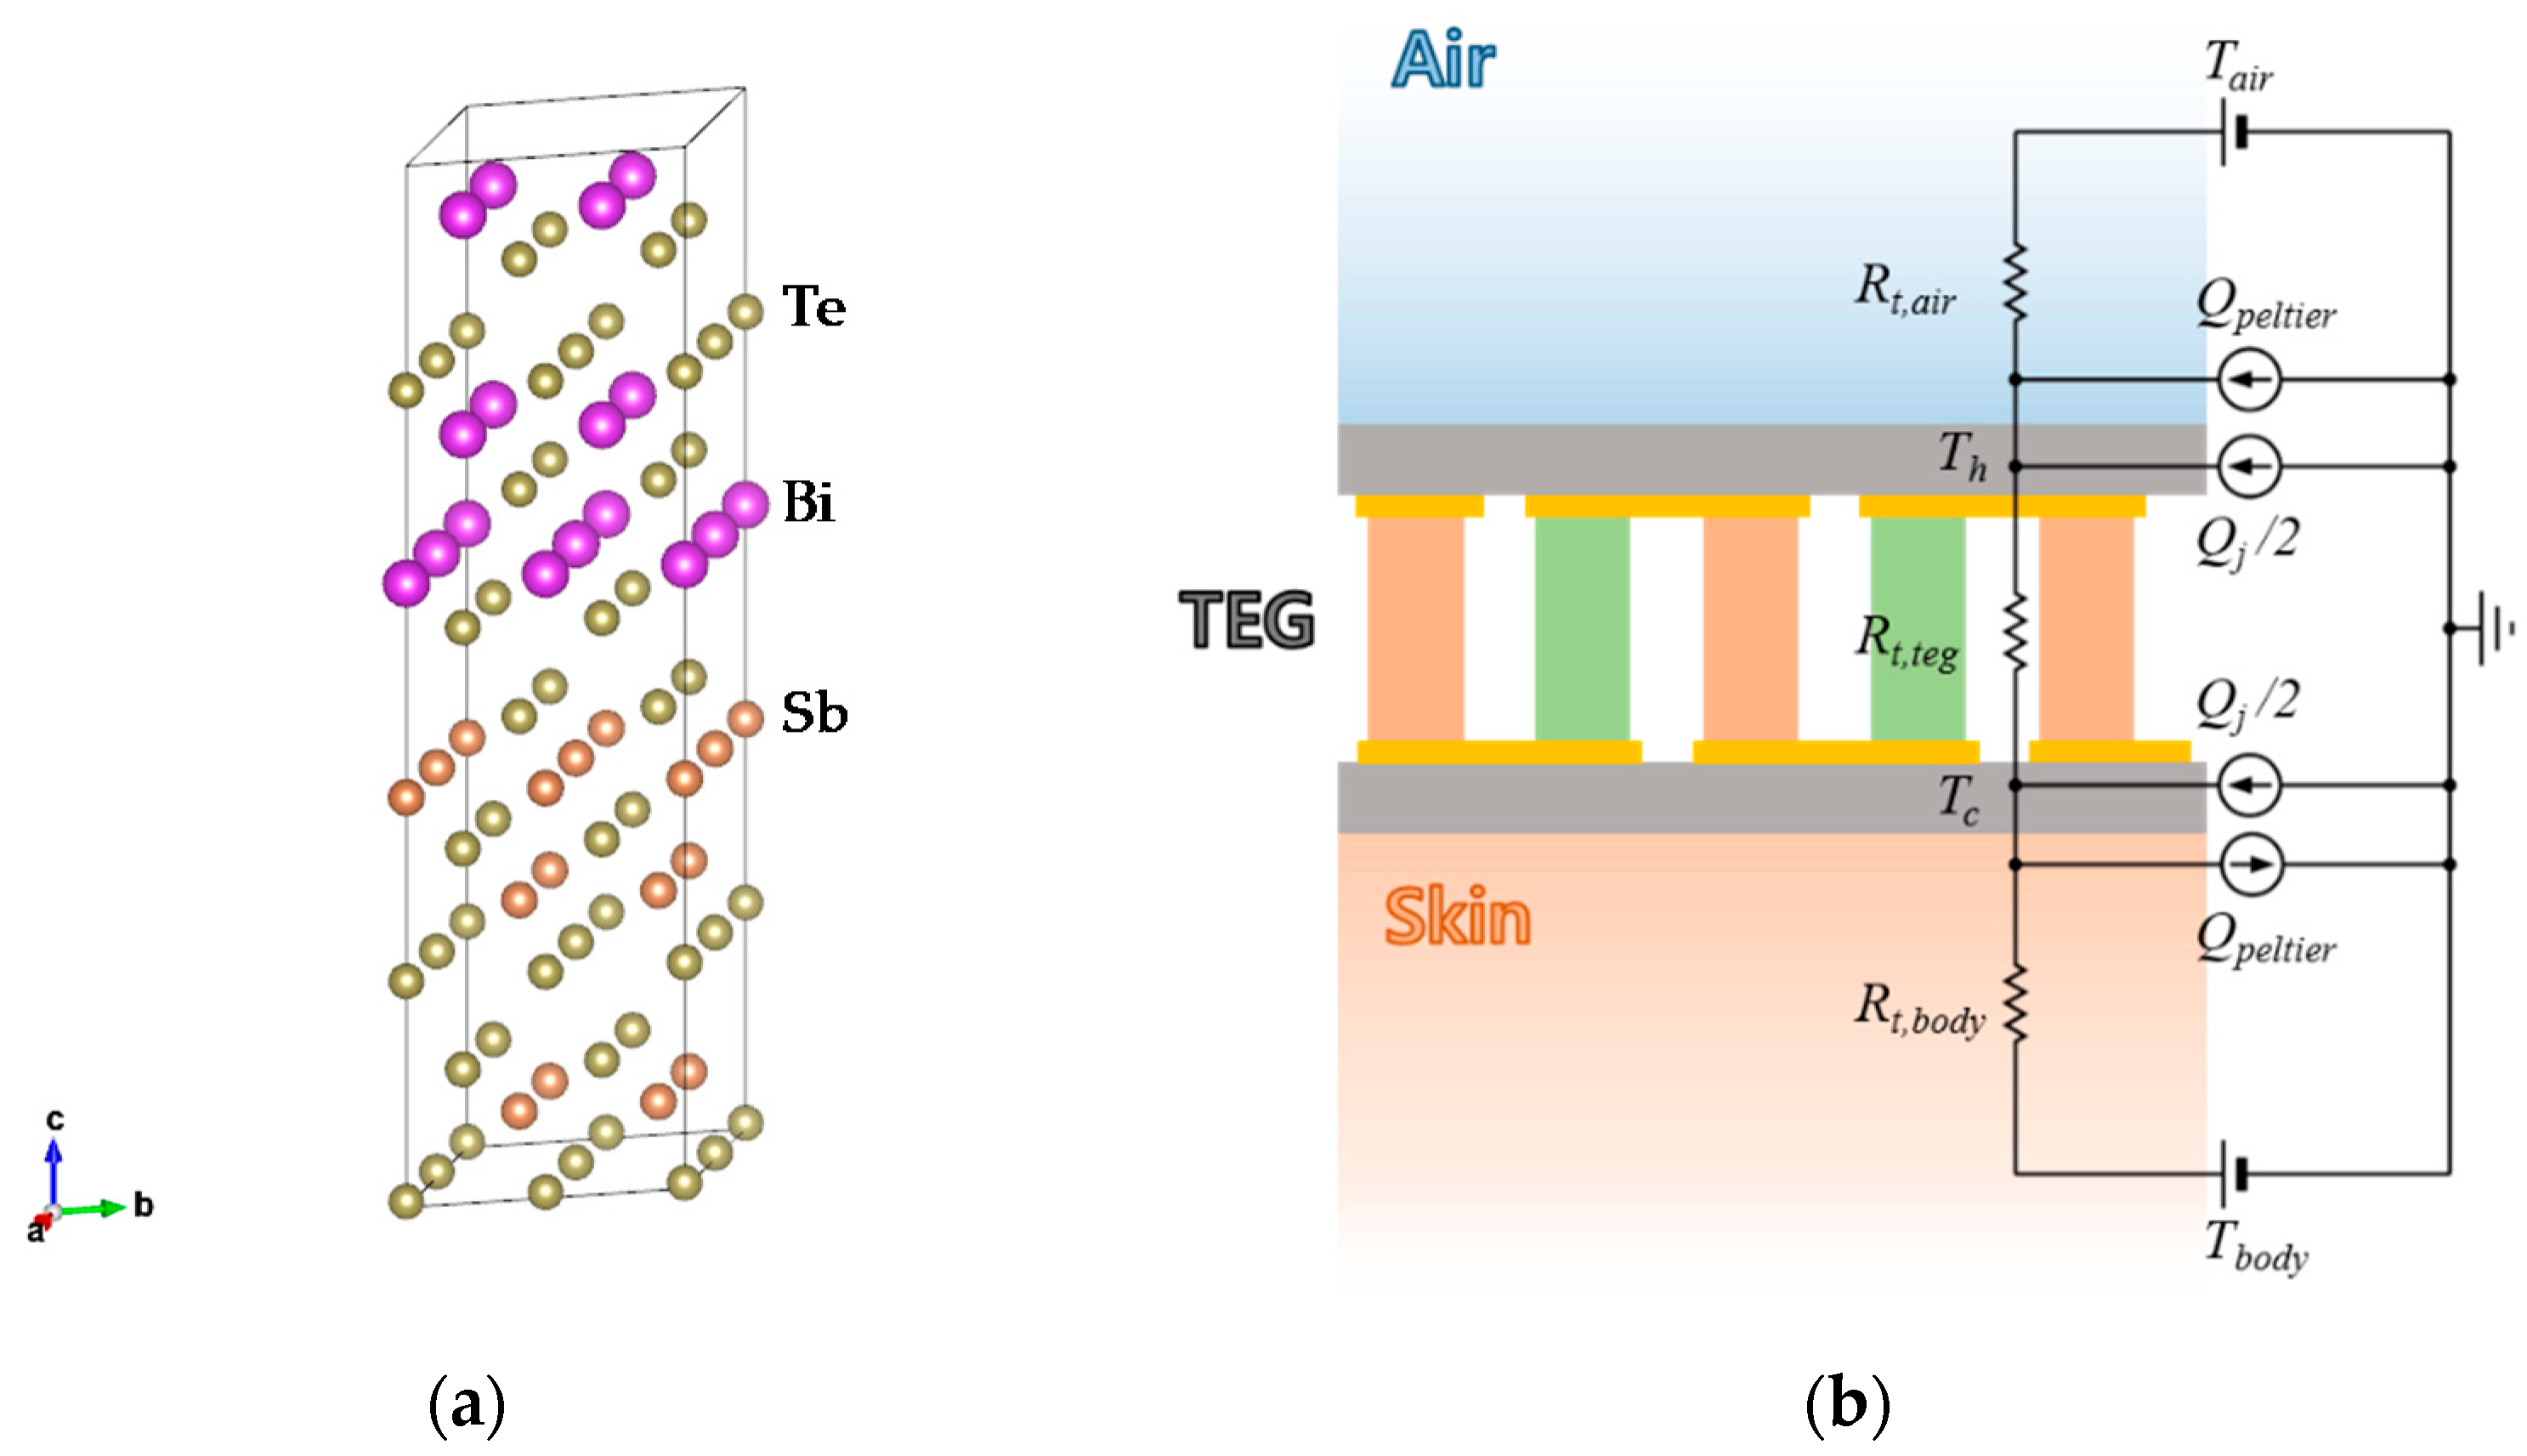
2.1. Thermoelectric Material Simulation

To simulate the P-type BiSbTe3, the structural coordinates of Sb2Te3 (R−3 m, 166) were built, which are reported in inorganic crystal structure databases [29]. As shown in Figure 1a, three layers of Sb were substituted as Bi in the 2 × 2 × 1 supercell of Sb2Te3 (totally 60 atoms) [30]. The Bi 5d, 6s and 6p, Sb 4d, 5s and 5p, and Te 5s and 5p electrons were treated as valence electrons. The Vienna ab initio simulation package (VASP) [31] was used for the Density Functional Theory (DFT) calculations using the projector augmented wave (PAW) method [32] and the Perdew–Burke-Ernzerhof (PBE) functional [33]. The cutoff energy of the basis set was set to 550 eV. The energy and the force of the ions were converged within 10−5 eV and 10−3 eV/Å, respectively. The k-point meshes were set to 5 × 5 × 5 by the Monkhorst–Pack method [34]. The electronic thermal conductivity, electrical conductivity, and Seebeck coefficient were estimated by solving the Boltzmann Transport Equation (BTE) with Relaxation Time Approximation (RTA) [35,36] using BoltzTraP code [37]. A constant relaxation time was used for the calculations to match the result with the experimental electrical resistivity of the Bi0.5Sb1.5Te3 at carrier concentration of 2 × 1021 cm−3. The lattice thermal conductivity was also taken from the experimental value of Bi0.4Sb1.6Te3 [38].
Figure 2 shows the data obtained from the simulation and the ZT graph at room temperature (300 K) at each carrier concentration. The data were extended through curve fitting for further analysis. As theoretically suggested, the thermal conductivity and the electrical conductivity increase with the carrier concentration while the Seebeck coefficient decreases and the ZT has a maximum at around 1019 cm−3.

2.2. Device Simulation in the Human Body Application

A thermal resistance model based on human body application was constructed in order to calculate the power density of the device that consists of the material from the simulation. A thermal resistance model based on previous studies [18,20] was used, as shown in Figure 1b. The Peltier effect and load matching were considered while Joule heat was negligible in the model.
Under steady-state conditions, the maximum power density at the matched load derived from the model is given by the following equation.
P max = [ N α { R t , t e g R t , a i r + R t , t e g + R t , b o d y + { R t , t e g N 2 α 2 T R T E G + R L ( R t , a i r + R t , b o d y ) } } ( T b o d y T a i r ) ] 2 R L ( 1 + R T E G / R L ) 2
where
R L = R T E G + R t , t e g N α T ( R t , a i r + R t , b o d y R t , a i r + R t , t e g + R t , b o d y ) ,
Here, N is the number of TE leg couples and α is the Seebeck coefficient of one couple. RTEG and RL are electrical resistances of the TEG and matched load, respectively.
The power density according to the carrier concentration obtained from the material data and Equation (2) was compared with the ZT of the material. The N-type and P-type materials used in the device simulation are assumed to have identical properties to make device ZT the same as material ZT. The conditions related to the device structure are listed in Table 1.
These conditions are based on a device that can be used in practical applications on the human body. The fill factor (FF) is lower than that of commercial devices because the optimum FF in the human body application is much lower than the FF of commercial devices [20]. Table 2 shows the conditions related to environments of human body application. The heat transfer coefficient of air corresponds to the natural convection condition in a typical indoor environment.

3. Results

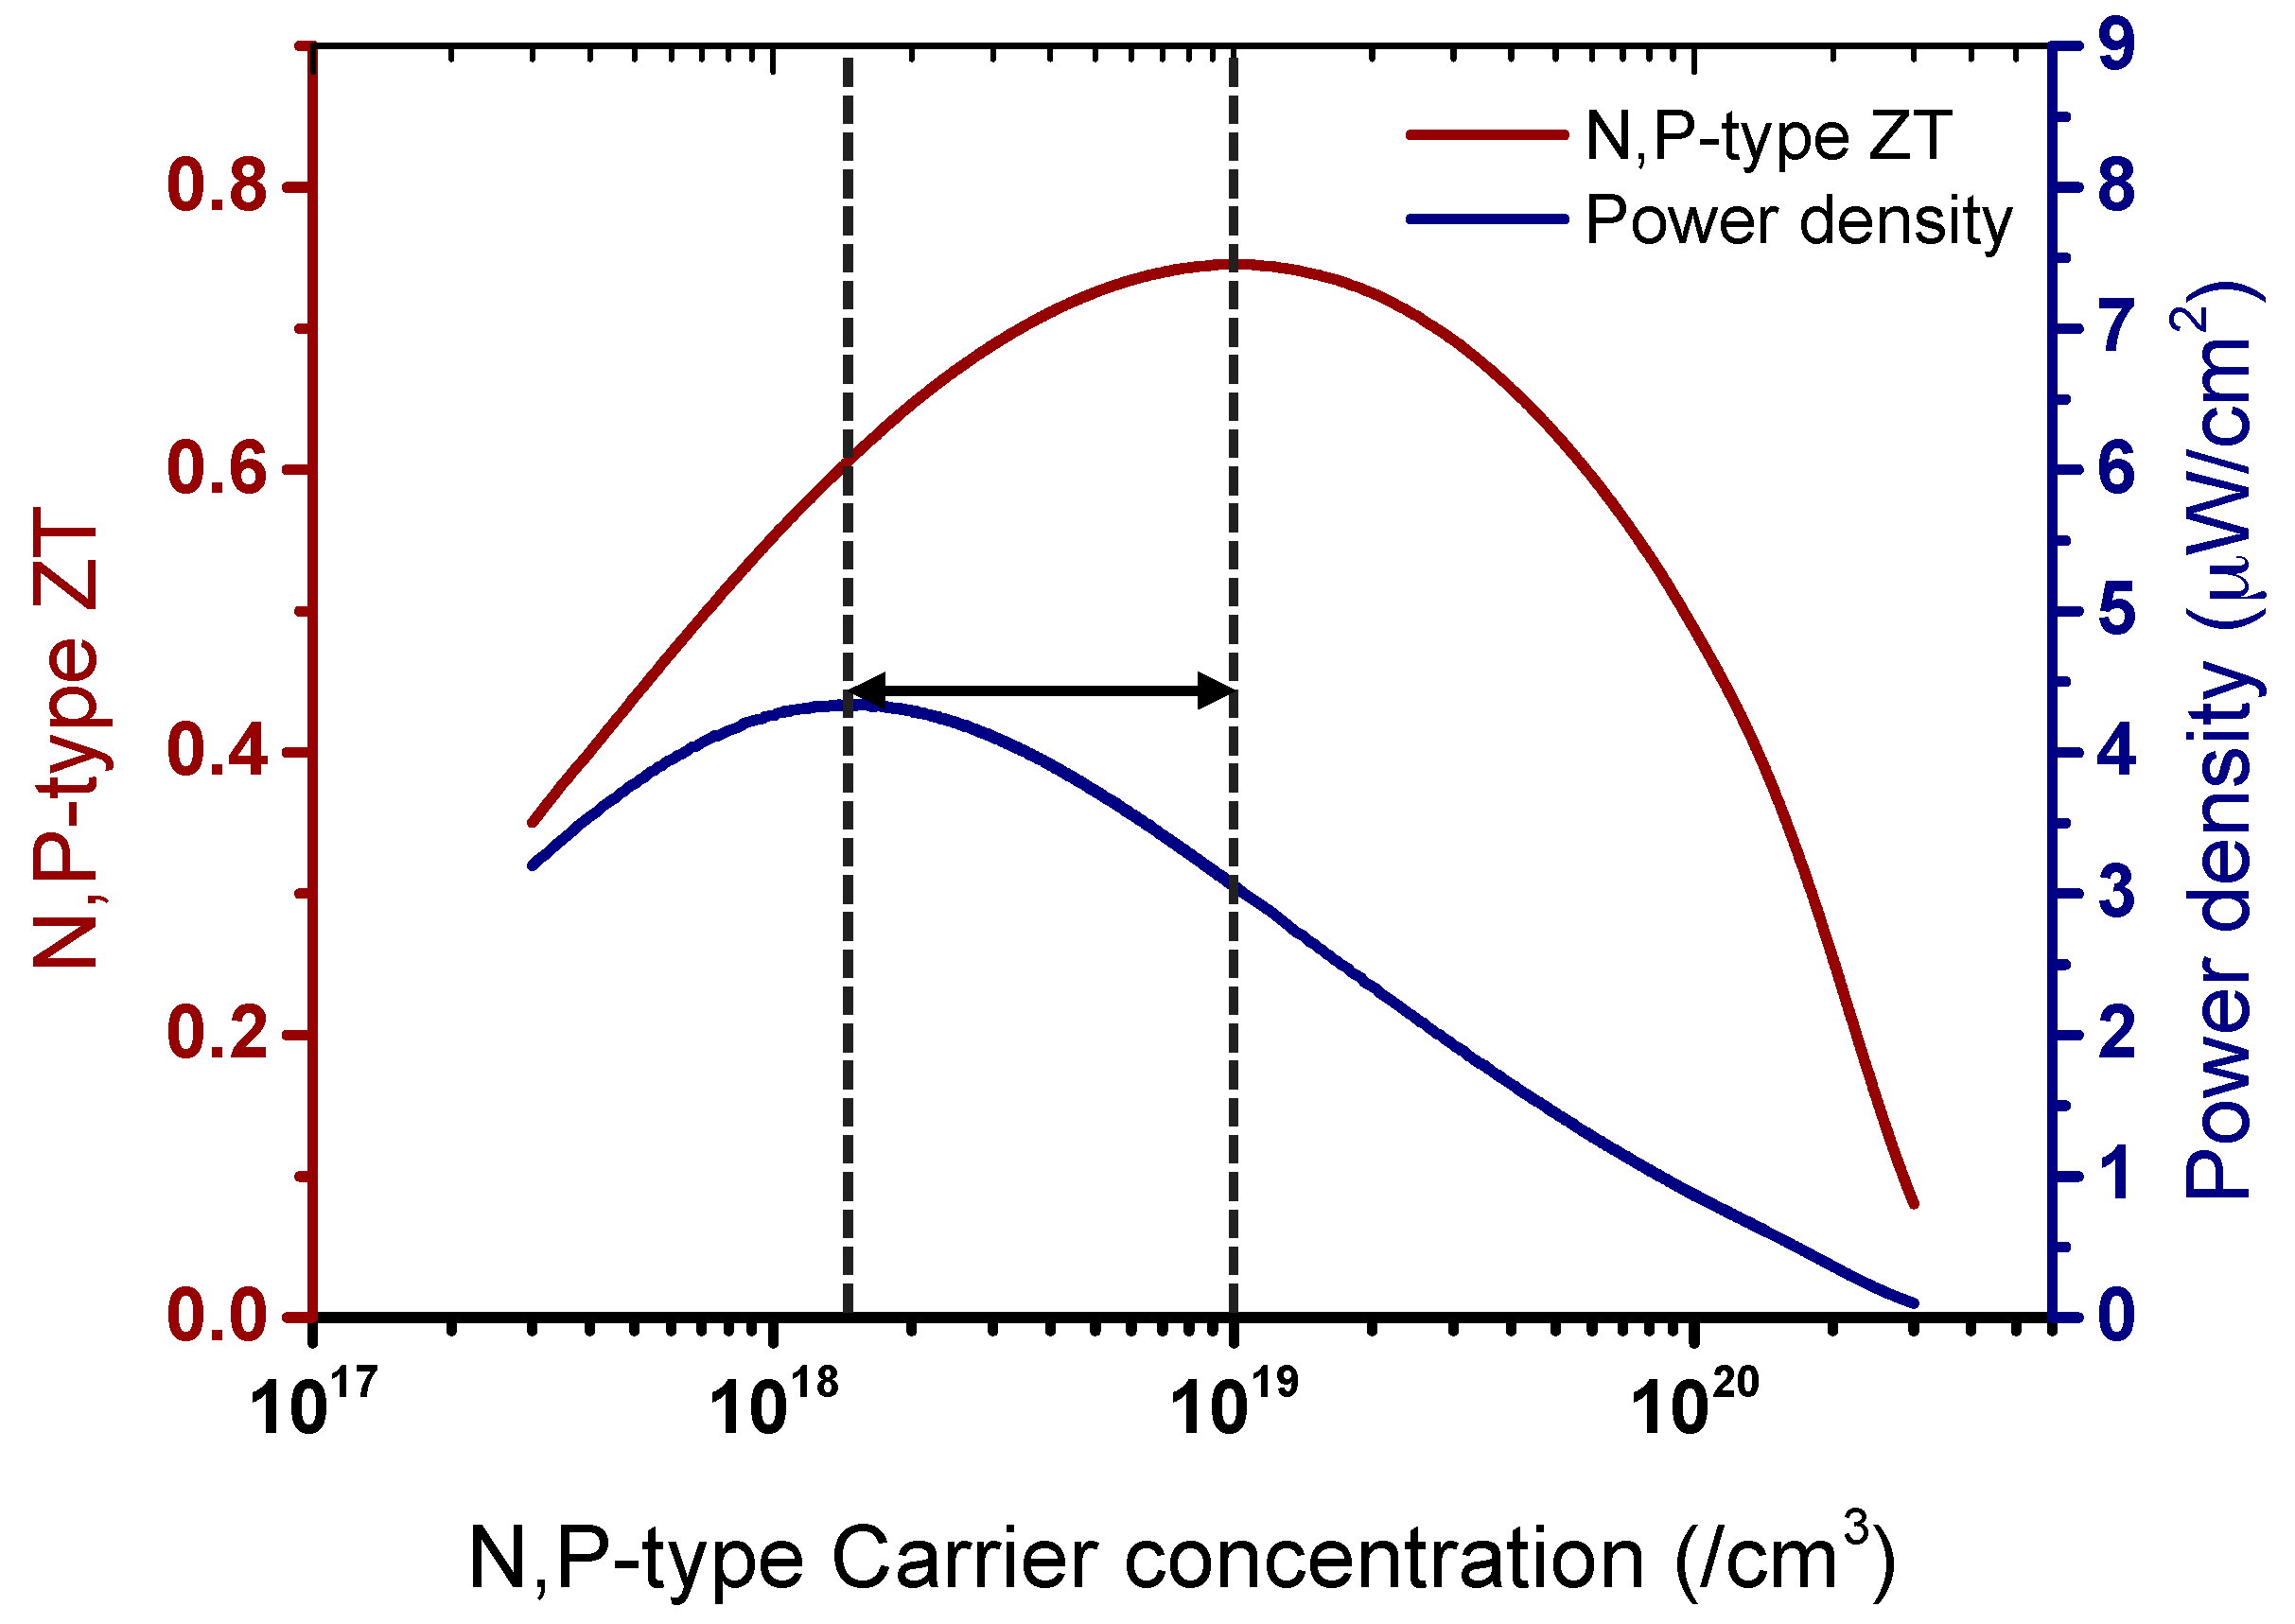
3.1. Carrier Concentration Difference between Maximum ZT and Maximum Power Density

In previous research, it was shown that low thermal conductivity is advantageous for energy harvesting on the human body while the ZT remains at the same value [20]. However, in the practical engineering of a material, such as doping level control, ZT also changes while the thermal conductivity is adjusted [39]. Therefore, in order to understand the optimal engineering direction of the thermal conductivity, a device simulation to find the optimum point of the power density should be performed concurrently.
The material ZT of P-type BiSbTe3 and the power density of the device according to carrier concentration are shown in Figure 3. Figure 3 shows that the maximum point of ZT and the power density are misaligned. When the material is engineered at the concentration that maximizes ZT as the conventional methods do, the device made of the material generates 28.8% less power density than the maximum power density.
As shown in Figure 3, the optimal point of the power density is shifted to the left from the optimal point of the ZT. As shown in Equation (2), among the variables that affect the power density, the three key properties of the ZT are the only factors that are controlled by the carrier concentration. Among the three properties, it can be inferred that the thermal conductivity has a stronger influence on the power density than the ZT. Since the left side of the graph means lower thermal conductivity of the material, this interpretation is consistent with the existing theory that low thermal conductivity is more advantageous for energy harvesting on the human body [26].

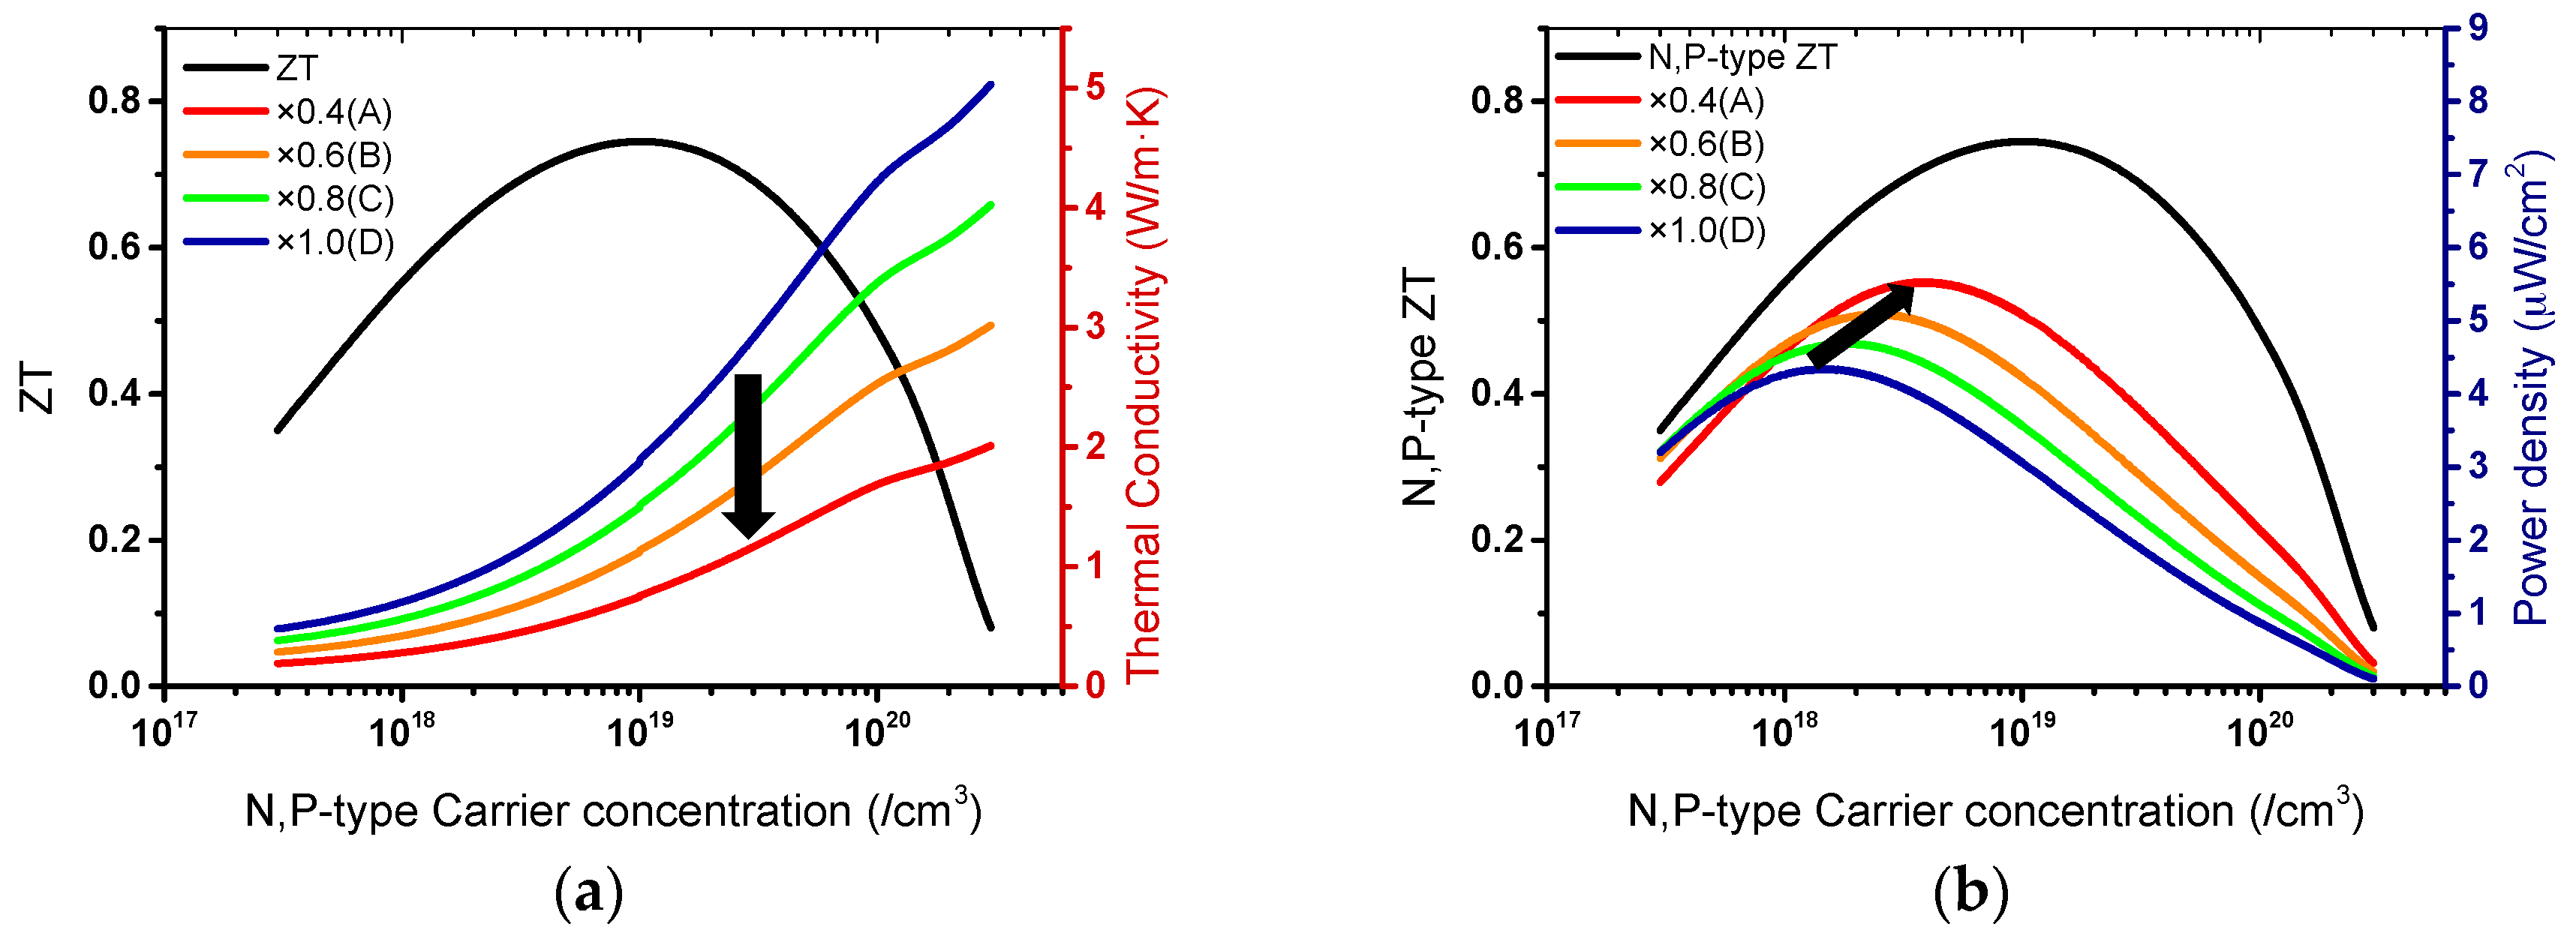
3.2. Power Density for Different Thermal Conductivity

Device simulations were conducted for different materials with different thermal conductivity distributions in order to verify that the discrepancy between the concentrations of the maximum power density and the maximum ZT is caused by the thermal conductivity. Materials A, B, and C were obtained by multiplying the thermal conductivity and electrical conductivity of the previously simulated P-type BiSbTe3 material (Material D) by 0.4, 0.6, and 0.8, respectively. In this case, the ZT distribution of materials A, B, and C is assumed to remain the same as that of material D because the thermal conductivity change in the denominator of the ZT equation can be compensated for by electrical conductivity in the numerator.
Figure 4a shows the ZT and thermal conductivity distribution according to the carrier concentration of each material. The power density values of the device for materials A, B, C, and D are shown in Figure 4b. The distribution of power density changed with the change of the thermal conductivity of the material, although ZT is the same. As the thermal conductivity decreases, the power generation of the device increases on the human body, which is consistent with the result of Suarez et al. However, it is observed that the carrier concentration of maximum power density approaches that of the maximum ZT as the material thermal conductivity becomes lower.
Therefore, in order to compensate for the power loss caused by the high thermal conductivity at the ZT maximum point, the carrier concentration of the maximum power density needs to shift to the left by reducing the thermal conductivity, although ZT decreases. If the thermal conductivity is low enough at the ZT maximum point, as with material A, the maximum point of power density is barely shifted.
As a result, in order to use the thermoelectric material to harvest human body heat, it is necessary to design a material at the optimum carrier concentration calculated from the device simulation, rather than engineering it at the maximum ZT. However, if the thermal conductivity of the material is distributed below a certain value, a shift of maximum power density is hardly observed. In this case, the power density at the carrier concentration of the maximum ZT is close to the maximum power density.

3.3. Device Structure and Environment Variation

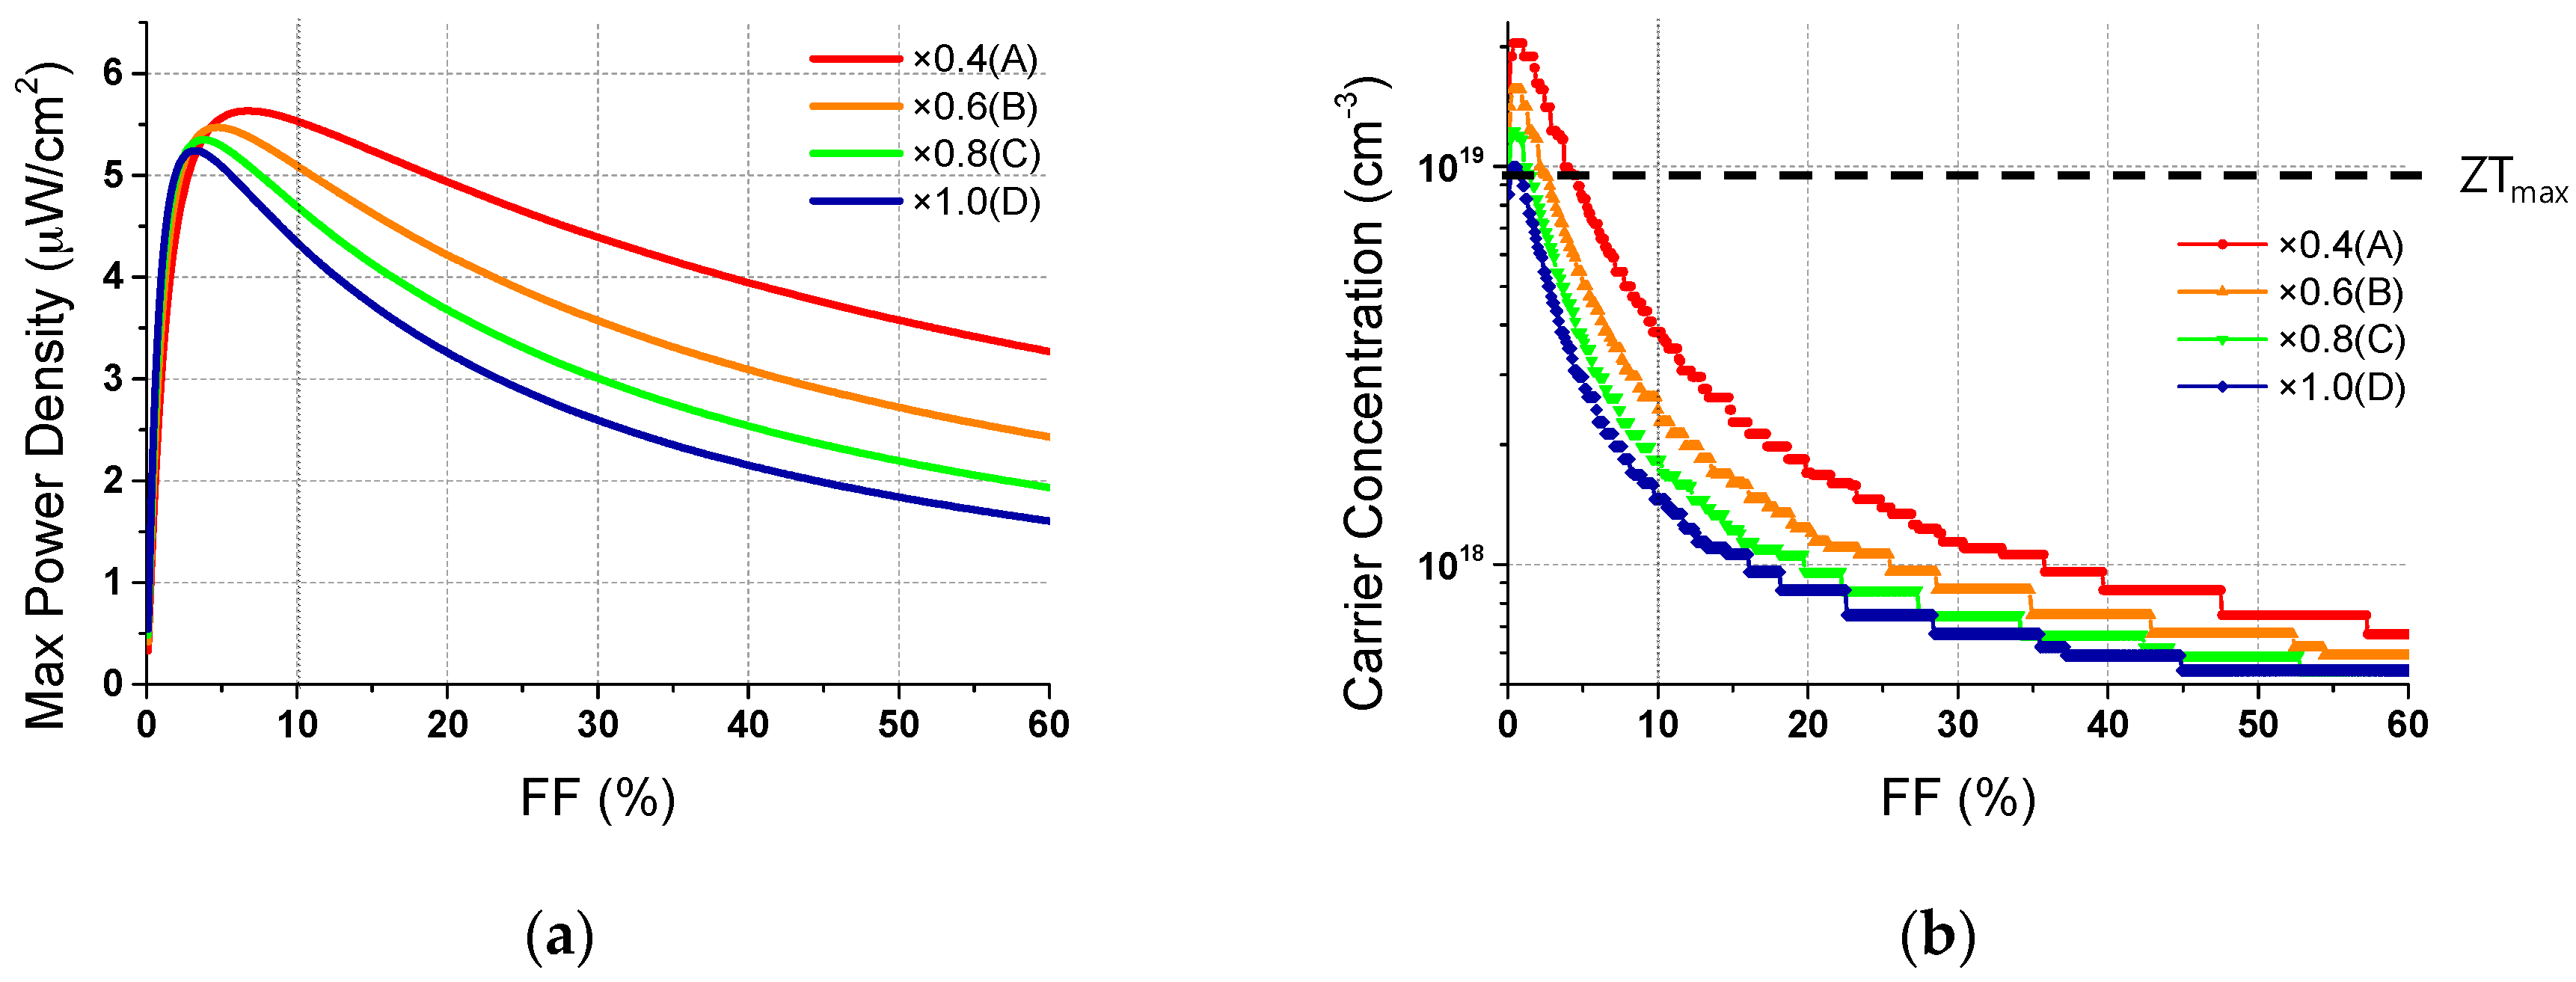
3.3.1. Fill Factor Variation

For a TEG placed on the human body, the area of the material compared to the entire area of the device is optimized to balance the temperature difference across the device and the power factor of the material, which is called the optimum fill factor (FF). The analyses above were conducted with the condition of FF = 10%.
In general, materials based on Bismuth Telluride have high thermal conductivity and therefore have a very low optimum FF [19,20]. As shown in Figure 5b, the optimum FF of a given material A–D is always below 10%. On the other hand, in order to utilize thermoelectric elements in power generation applications, a sufficiently high output voltage must be ensured [40]. Since 1 couple of TE legs cannot generate more than 1 mV for 1 K of temperature difference, a thermoelectric device should have many TE legs, which increases the fill factor of the device. In addition, considering the stability of the device structure, the actual device should be fabricated with larger FF than the optimum FF. Therefore, in practical applications, the FF should be more than 10%.
As shown in Figure 5a, the tendency of the maximum power density increasing with lower thermal conductivity is always maintained. Figure 5b shows the difference in the optimum carrier concentration between ZT and power density. The thick dashed line indicates the carrier concentration at the maximum ZT, and the carrier concentration at the maximum power density is always located below it. In addition, the difference becomes smaller for a lower thermal conductivity material and smaller for a lower FF, but the tendency is still maintained even if the FF changes within the fabrication conditions of the practical device.

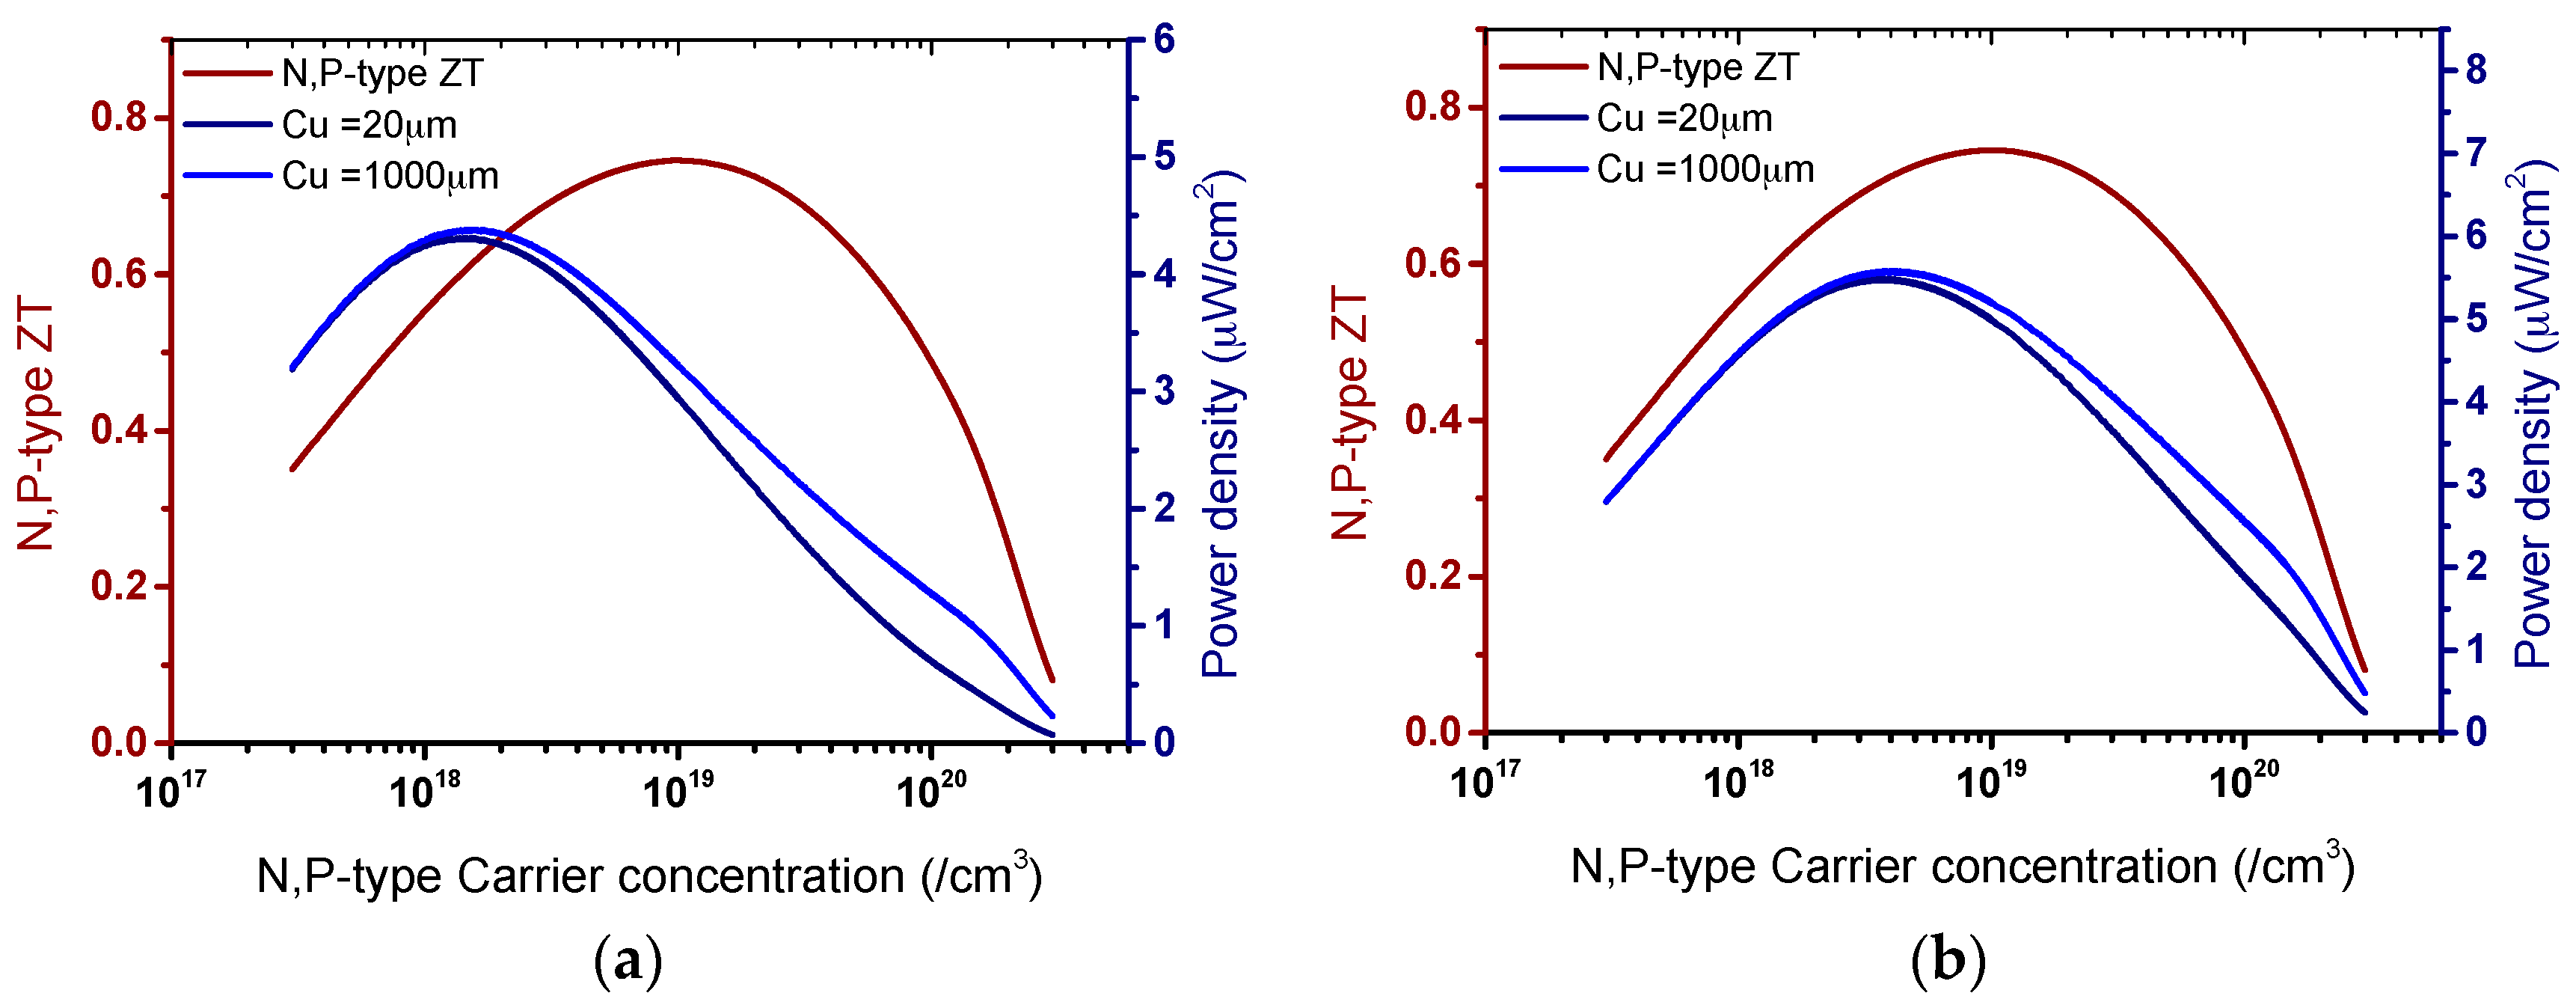
3.3.2. Copper Electrode Thickness Variation

Although it has been confirmed that the difference in the optimum carrier concentration between the material ZT and the device power density is influenced by the thermal conductivity, it is necessary to confirm the influence of changes of the device structure. The copper pad in the device is used as an interconnection between the thermoelectric materials, and when the copper pad is too thin, it degrades the ZT of the device [16]. As shown in Figure 6, when the copper is thickened, the copper resistance decreases and the power density of the device increases slightly.
Figure 6 shows the maximum power density according to the carrier concentration with copper thickness variation for the two materials A and D, presented in Figure 4, which have different thermal conductivities. In the case of Figure 6a, the power density is calculated by changing the copper thickness in the device using material D, which has high thermal conductivity. The optimum carrier concentration of maximum power density shifted more than that of material A, which has relatively low thermal conductivity, as shown in Figure 6b. In other words, when a material having a low thermal conductivity is used, the optimum point is close to ZT and the stability against copper pad thickness change is improved.

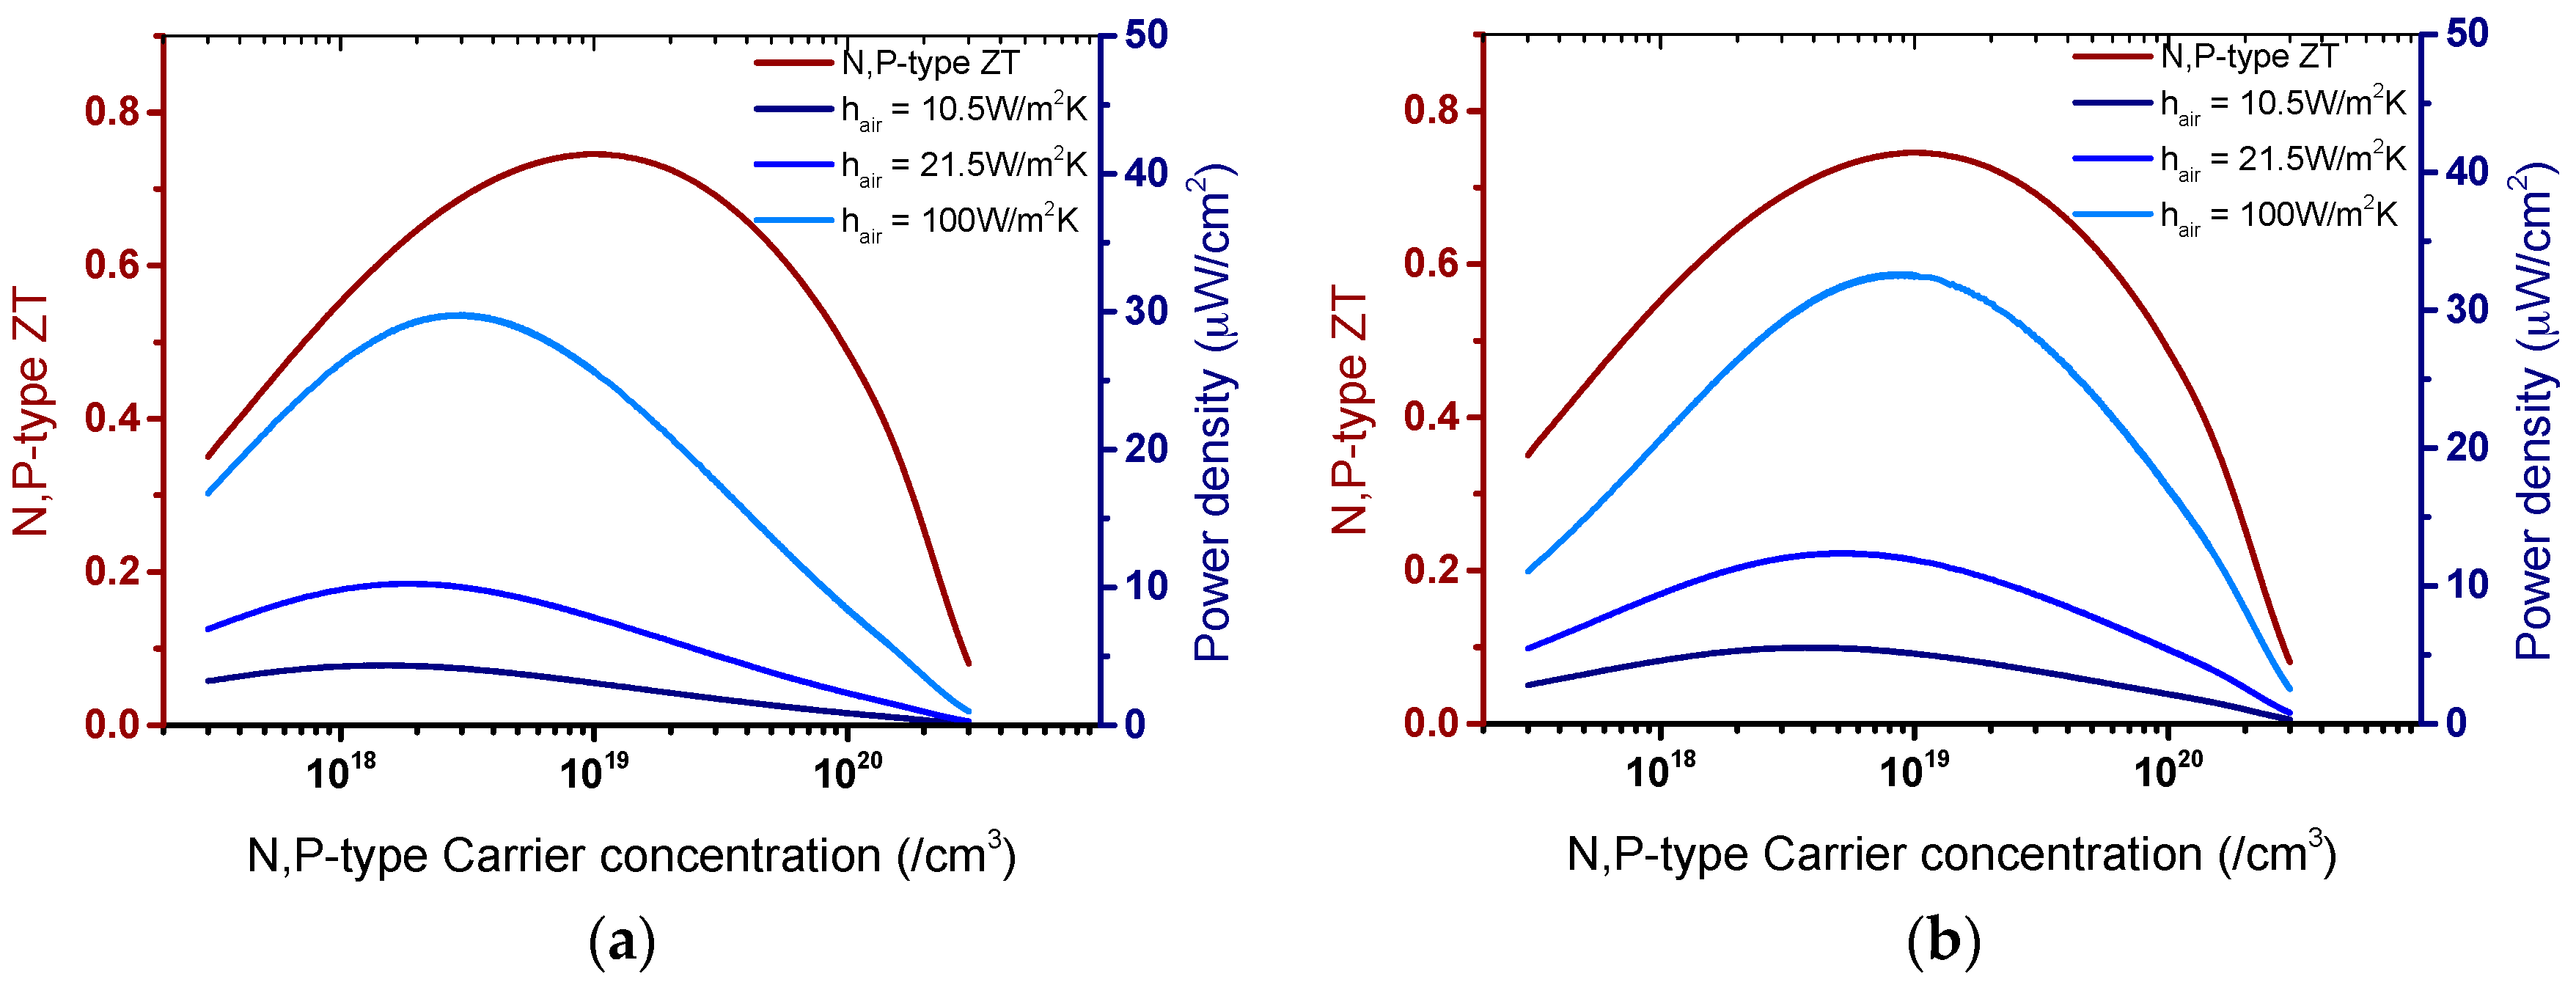
3.3.3. Convection Environment Variation

In addition to device parameters, changes in the external environment also affect the power density of the device. In the case of a human body application, the thermal resistance between the core of the body and the TEG does not change, but the thermal resistance of TEG to air changes dramatically depending on the convection environment such as wind speed or heatsink structure [20,27,41,42]. It is necessary to investigate whether this external environment change affects the optimum carrier concentration of the power density.
Figure 7a shows the results of calculating the power density according to the convective heat transfer coefficients hair, which affects the thermal resistance from TEG to air. As hair increases, the power density increases sharply due to the rapid decrease of the external thermal resistance. At the same time, the carrier concentration of maximum power density also shifts to the right. Because the proportion of the device thermal resistance to the thermal resistance of the entire system is increased, the power density according to the carrier concentration behaves as if the thermal resistance of the material increases.
In the environment where a temperature difference is forcibly applied, the power density should show the same tendency as the power factor. Since the carrier concentration of the maximum power factor is always higher than that of the ZT [14], the maximum power density can be located at the right of the maximum point of ZT when the external thermal resistance becomes small enough. However, this case is not likely to occur even if hair is extremely high because the thermal resistance between the body core and the TEG is sufficiently large in the human body application.

4. Discussion

Since the power generation efficiency of a thermoelectric device increases with the ZT of the device, it has been generally considered that an increase of the output power is also accompanied by an increase in ZT. However, the human body applications and related thermal model are different from the general applications of a thermoelectric generator. The condition for high power density is also changed. To date, research has suggested that the power generation on the human body increases as the thermal conductivity of TE materials is reduced while the ZT is maintained. However, there has been no suggestion for the direction of material engineering to obtain higher power output in human body applications. Therefore, maximizing the material ZT is still considered the only way to raise the device performance.
As an example of material engineering through doping, this study shows that the carrier concentration of maximum ZT can be different from the carrier concentration of the maximum power density on the human body. Since the shift direction of the power density graph is always to the left, which means lower thermal conductivity, the cause of this difference is considered to be the high thermal conductivity of the thermoelectric material in the device. In order to confirm this, the power density was calculated for various materials with different thermal conductivities. As a result, the difference in the carrier concentration between ZT and power density was reduced for materials with lower thermal conductivity.
In addition, it was shown that the shift of the power density curve by the change of the device parameters such as the FF and Cu thickness could be reduced when a material with low thermal conductivity was used. Environment variables such as air convection conditions can be changed. The carrier concentration of the maximum power density shifts toward that of the maximum ZT with an increase of the convective heat transfer coefficient because the influence of the thermal resistance of the device becomes large with a decrease of external thermal resistance.
This study confirms that it is possible to improve the performance of a thermoelectric device by engineering the material in addition to the conventional method of device structure optimization. To do this, the optimal doping of the material should be determined considering a thermal resistance model, rather than merely ZT improvement. In addition, a material with low thermal conductivity can achieve maximum power density at the same carrier concentration as that yielding the maximum ZT.
These results can be applied not only for doping but also to various material engineering methods that change the thermal conductivity and ZT simultaneously. This study emphasizes the importance of material engineering as well as the device structure in human body applications. Furthermore, while previous studies simply concentrated on the selection of the proper material for the TEG, in this paper, the improvement of the power density was studied from the perspective of material engineering. Based on these results, the researchers have suggested a direction for material engineering.

Acknowledgments

This work was supported by the National Research Foundation of Korea (NRF) Grant funded by the Korean Government (MSIP) (NRF-2015R1A5A1036133).

Author Contributions

Byung Jin Cho and Won Bo Lee conceived and designed the experiments; Gyusoup Lee performed experiments; Garam Choi and Hyo Seok Kim contributed material data for simulation; Gyusoup Lee, Choong Sun Kim, Yong Jun Kim, Hyeongdo Choi and Seongho Kim analyzed the data; Gyusoup Lee wrote the paper.

Conflicts of Interest

The authors declare no conflict of interest.

References

  1. Paradiso, J.A.; Starner, T. Energy scavenging for mobile and wireless electronics. IEEE Pervasive Comput. 2005, 4, 18–27. [Google Scholar] [CrossRef]
  2. Kim, S.J.; We, J.H.; Cho, B.J. A wearable thermoelectric generator fabricated on a glass fabric. Energy Environ. Sci. 2014, 7, 1959–1965. [Google Scholar] [CrossRef]
  3. Leonov, V. Thermoelectric energy harvesting of human body heat for wearable sensors. IEEE Sens. J. 2013, 13, 2284–2291. [Google Scholar] [CrossRef]
  4. Leonov, V.; Vullers, R.J.M. Wearable thermoelectric generators for body-powered devices. J. Electron. Mater. 2009, 38, 1491–1498. [Google Scholar] [CrossRef]
  5. Leonov, V.; Van Hoof, C.; Vullers, R.J. Thermoelectric and Hybrid Generators in Wearable Devices and Clothes. In Proceedings of the IEEE Sixth International Workshop on Wearable and Implantable Body Sensor Networks, Berkeley, CA, USA, 3–5 June 2009. [Google Scholar]
  6. Gelbstein, Y.; Tunbridge, J.; Dixon, R.; Reece, M.J.; Ning, H.P.; Gilchrist, R.; Summers, R.; Agote, I.; Lagos, M.A.; Simpson, K.; et al. Physical, mechanical and structural properties of highly efficient nanostructured n- and p- silicides for practical thermoelectric applications. J. Electron. Mater. 2014, 43, 1703–1711. [Google Scholar] [CrossRef]
  7. Appel, O.; Schwall, M.; Kohne, M.; Balke, B.; Gelbstein, Y. Effects of microstructural evolution effects on the thermoelectric properties of spark plasma sintered Ti0.3Zr0.35Hf0.35NiSn half-Heusler compound. J. Electron. Mater. 2013, 42, 1340–1345. [Google Scholar] [CrossRef]
  8. Appel, O.; Zilber, T.; Kalabukhov, S.; Beeri, O.; Gelbstein, Y. Morpholoical effects on the thermoelectric properties of Ti0.3Zr0.35Hf0.35Ni1+δSn alloys following phase separation. J. Mater. Chem. C 2015, 3, 11653–11659. [Google Scholar] [CrossRef]
  9. Vizel, R.; Bargig, T.; Beeri, O.; Gelbstein, Y. Bonding of Bi2Te3 based thermoelectric legs to metallic contacts using Bi0.82Sb0.18 alloy. J. Electron. Mater. 2016, 45, 1296–1300. [Google Scholar] [CrossRef]
  10. Gelbstein, Y. Pb1-xSnxTe Alloys—Application Considerations. J. Electron. Mater. 2011, 40, 533–536. [Google Scholar] [CrossRef]
  11. Gelbstein, Y. Phase morphology effects on the thermoelectric properties of Pb0.25Sn0.25Ge0.5Te. Acta Mater. 2013, 61, 1499–1507. [Google Scholar] [CrossRef]
  12. Dado, B.; Gelbstein, Y.; Mogilansky, D.; Ezersky, V.; Dariel, M.P. Structural evolution following spinodal decomposition of the pseudo-ternary compound (Pb0.3Sn0.1Ge0.6)Te. J. Electron. Mater. 2010, 39, 2165–2171. [Google Scholar] [CrossRef]
  13. Hazan, E.; Ben-Yehuda, O.; Madar, N.; Gelbstein, Y. Functional graded germanium-lead chalcogenides-based thermoelectric module for renewable energy applications. Adv. Energy Mater. 2015, 5, 1500272. [Google Scholar] [CrossRef]
  14. Snyder, G.J.; Toberer, E.S. Complex thermoelectric materials. Nat. Mater. 2008, 7, 105–114. [Google Scholar] [CrossRef] [PubMed]
  15. Rowe, D.M. General Principle and Basic Considerations. In Thermoelectrics Handbook: Macro to Nano; Rowe, D.M., Ed.; CRC Press: Boca Raton, FL, USA; Taylor & Francis: Boca Raton, FL, USA, 2006; pp. 1-1–1-14. ISBN 9780849322648. [Google Scholar]
  16. Ebling, D.; Bartholomé, K.; Bartel, M.; Jägle, M. Module geometry and contact resistance of thermoelectric generators analyzed by multiphysics simulation. J. Electron. Mater. 2010, 39, 1376–1380. [Google Scholar] [CrossRef]
  17. Tritt, T.M.; Subramanian, M.A. Thermoelectric materials, phenomena, and applications: A bird’s eye view. MRS Bull. 2006, 31, 188–198. [Google Scholar] [CrossRef]
  18. Leonov, V.; Fiorini, P. Thermal matching of a thermoelectric energy scavenger with the ambience. In Proceedings of the European Conference on Thermoelectrics, Paris, France, 22 October 2007; pp. 129–133. [Google Scholar]
  19. Lee, Y.G.; Kim, J.; Kang, M.S.; Baek, S.H.; Kim, S.K.; Lee, S.M.; Lee, J.; Hyun, D.B.; Ju, B.K.; Moon, S.E.; et al. Design and Experimental Investigation of Thermoelectric Generators for Wearable Applications. Adv. Mater. Technol. 2017, 2, 1600292. [Google Scholar] [CrossRef]
  20. Suarez, F.; Nozariasbmarz, A.; Vashaee, D.; Öztürk, M.C. Designing thermoelectric generators for self-powered wearable electronics. Energy Environ. Sci. 2016, 9, 2099–2113. [Google Scholar] [CrossRef]
  21. Yazawa, K.; Shakouri, A. Cost-efficiency trade-off and the design of thermoelectric power generators. Environ. Sci. Technol. 2011, 45, 7548–7553. [Google Scholar] [CrossRef] [PubMed]
  22. Leonov, V. Simulation of maximum power in the wearable thermoelectric generator with a small thermopile. Microsyst. Technol. 2011, 17, 495–504. [Google Scholar] [CrossRef]
  23. Yamashita, O.; Sadatomi, N. Thermoelectric properties of Si1−x Gex (x ≤ 0.10) with alloy and dopant segregations. J. Appl. Phys. 2000, 88, 245–251. [Google Scholar] [CrossRef]
  24. Jacguot, A.; Liu, W.L.; Chen, G.; Fleurial, J.P.; Dauscher, A.; Lenoir, B. Figure-of-Merit and Emissivity Measurement of Fine-Grained Polycrystalline Silicon Thin Films. In Proceedings of the ICT’02 Twenty-First International Conference on Thermoelectrics, Long Beach, CA, USA, 29 August 2002; pp. 118–121. [Google Scholar]
  25. Hicks, L.D.; Dresselhaus, M.S. Effect of quantum-well structures on the thermoelectric figure of merit. Phys. Rev. B 1993, 47, 12727. [Google Scholar] [CrossRef]
  26. Mayer, P.M.; Ram, R.J. Optimization of heat sink–limited thermoelectric generators. Nanoscale Microscale Thermophys. Eng. 2006, 10, 143–155. [Google Scholar] [CrossRef]
  27. Bahk, J.H.; Fang, H.; Yazawa, K.; Shakouri, A. Flexible thermoelectric materials and device optimization for wearable energy harvesting. J. Mater. Chem. C 2015, 3, 10362–10374. [Google Scholar] [CrossRef]
  28. Oh, M.W.; Ryu, B.; Lee, J.E.; Joo, S.J.; Kim, B.S.; Park, S.D.; Min, B.K.; Lee, H.W. Electronic Structures and Seebeck Coefficients of Bi2Te3, Sb2Te3, and (Bi0.25Sb0.75)2Te3: A First-Principles Calculation Study. J. Nanoelectron. Optoelectron. 2015, 10, 391–396. [Google Scholar] [CrossRef]
  29. Anderson, T.L.; Krause, H.B. Refinement of the Sb2Te3 and Sb2Te2Se structures and their relationship to nonstoichiometric Sb2Te3−ySey compounds. Acta Crystallogr. Sect. B 1974, 30, 1307–1310. [Google Scholar] [CrossRef]
  30. Momma, K.; Izumi, F. VESTA 3 for three-dimensional visualization of crystal, volumetric and morphology data. J. Appl. Crystallogr. 2011, 44, 1272–1276. [Google Scholar] [CrossRef]
  31. Kresse, G.; Hafner, J. Ab initio molecular dynamics for liquid metals. Phys. Rev. B 1993, 47, 558. [Google Scholar] [CrossRef]
  32. Kresse, G.; Joubert, D. From ultrasoft pseudopotentials to the projector augmented-wave method. Phys. Rev. B 1999, 59, 1758. [Google Scholar] [CrossRef]
  33. Perdew, J.P.; Burke, K.; Ernzerhof, M. Generalized gradient approximation made simple. Phys. Rev. Lett. 1996, 77, 3865. [Google Scholar] [CrossRef] [PubMed]
  34. Pack, J.D.; Monkhorst, H.J. Special points for Brillouin-zone integrations—A reply. Phys. Rev. B 1977, 16, 1748. [Google Scholar] [CrossRef]
  35. Mahan, G.D.; Sofo, J.O. The best thermoelectric. Proc. Natl. Acad. Sci. USA 1996, 93, 7436–7439. [Google Scholar] [CrossRef] [PubMed]
  36. Kittel, C. Introduction to Solid State Physics, 8th ed.; John Wiley & Sons, Inc.: Hoboken, NJ, USA, 2005; ISBN 978-0-471-41526-8. [Google Scholar]
  37. Madsen, G.K.; Singh, D.J. BoltzTraP. A code for calculating band-structure dependent quantities. Comput. Phys. Commun. 2006, 175, 67–71. [Google Scholar] [CrossRef]
  38. Fan, X.A.; Yang, J.; Zhu, W.; Bao, S.; Duan, X.; Zhang, Q. Thermoelectric properties of P-type Te-doped (Bi, Sb)2Te3 alloys by mechanical alloying and plasma activated sintering. J. Alloys Compd. 2008, 448, 308–312. [Google Scholar] [CrossRef]
  39. Seo, S.; Lee, K.; Jeong, Y.; Oh, M.W.; Yoo, B. Method of efficient Ag doping for Fermi level tuning of thermoelectric Bi0.5Sb1.5Te3 alloys using a chemical displacement reaction. J. Phys. Chem. C 2015, 119, 18038–18045. [Google Scholar] [CrossRef]
  40. Leonov, V.; Fiorini, P.; Sedky, S.; Torfs, T.; Van Hoof, C. Thermoelectric MEMS generators as a power supply for a body area network. In Proceedings of the 13th International Conference on Solid-State Sensors, Actuators and Microsystems, TRANSDUCERS’05, Seoul, South Korea, 5–9 June 2005; Volume 1, pp. 291–294. [Google Scholar]
  41. Esarte, J.; Min, G.; Rowe, D.M. Modelling heat exchangers for thermoelectric generators. J. Power Sour. 2001, 93, 72–76. [Google Scholar] [CrossRef]
  42. Lossec, M.; Multon, B.; Ahmed, H.B. Sizing optimization of a thermoelectric generator set with heatsink for harvesting human body heat. Energy Convers. Manag. 2013, 68, 260–265. [Google Scholar] [CrossRef]
Figure 1. (a) Crystal structure of P-type BiSbTe3 (b) Thermal resistance model of the human body application. Peltier effect and load matching were considered. Rt,air, Rt,teg, and Rt,body are thermal resistances of air, thermoelectric generator (TEG), and body, respectively. Tair is ambient temperature and Tbody is core temperature of the body. Qj is Joule heat generated by current through the device, and Qpeltier is heat flux generated by the Peltier effect.
Applsci 07 01015 g001
Figure 2. Material data simulated by using first-principles calculations. (a) The Seebeck coefficient, the electrical conductivity; (b) the thermal conductivity, and the ZT according to the carrier concentration were obtained.
Applsci 07 01015 g002
Figure 3. The material ZT and the power density of P-type BiSbTe3 according to carrier concentration. The carrier concentration of the maximum power density shifted to the left side from the ZT maximum point.
Applsci 07 01015 g003
Figure 4. (a) The material data obtained by multiplying the electrical conductivity and the thermal conductivity of the P-type BiSbTe3 data (D) by 0.4 (A), 0.6 (B), and 0.8 (C). (b) Device simulation using the thermoelectric material with different thermal conductivity but with the same ZT. From material D to material A, the thermal conductivity decreases and the maximum power density increases. The carrier concentration of the maximum power density shifts to the right as the thermal conductivity decreases.
Applsci 07 01015 g004
Figure 5. (a) Carrier concentration at which the maximum power density is obtained for each material (A, B, C, D) and (b) power density at that time according to FF change.
Applsci 07 01015 g005
Figure 6. The power density distribution of (a) material D and (b) material A based TEG with variation of the copper thickness.
Applsci 07 01015 g006
Figure 7. The power density distribution of (a) material D and (b) material A based TEG with variation of the convective heat transfer coefficient between TEG and air (hair).
Applsci 07 01015 g007
Table 1. Variables related to the device structure. All variables were applied to values that could be used in a human body application.
VariablesValues
Fill factor (FF)10%
TE leg height2.5 mm
TE leg width2.0 mm
Contact resistance10−6 Ω·cm2
Copper pad width1.4 × Leg width
Copper pad thickness35 μm
Thermal conductivity of filler0.03 W/m·K
Table 2. Variables related to human body application. Heat transfer coefficients are the calculated values from experimental data of the human body application.
VariablesValues
Body core temperature37 °C
Ambient temperature25 °C
Heat transfer coefficient (skin)39.2 W/m2·K
Heat transfer coefficient (air)10.5 W/m2·K

