Evaluation of Adhesion and Hysteresis Friction of Rubber–Pavement System

Department of Civil and Environmental Engineering, University of Idaho, Moscow, ID 83844, USA
*
Author to whom correspondence should be addressed.
Appl. Sci. 2017, 7(10), 1029; https://doi.org/10.3390/app7101029
Submission received: 1 September 2017
/
Revised: 25 September 2017
/
Accepted: 30 September 2017
/
Published: 7 October 2017
(This article belongs to the Special Issue Advanced Asphalt Materials and Paving Technologies)
Abstract
:Tire-pavement friction is a key component in road safety. Adhesion and hysteresis are the two main mechanisms that affect the friction between rubber tires and pavements. This study experimentally examined the relationship between rubber–pavement adhesion and friction. The adhesive bond energy between rubber and pavement surfaces was calculated by measuring the surface energy components of rubber and aggregates. The friction was measured in the laboratory using a dynamic friction tester. The results revealed that there is a fair correlation between the adhesive bond energy and measured coefficient of friction. A rubber–pavement system with higher adhesion provided higher friction at low speed. In addition, the results demonstrated that there is a strong correlation between rubber–pavement friction and rubber properties. Softer rubber provided higher friction and vice versa. The results of this study provide an experimental verification of the relationship between adhesion and pavement surface friction. The adhesive bond energy and rubber rheological properties could be incorporated in computational models to study tire-pavement friction in different conditions (e.g., speed and temperature).
1. Introduction
Tire-pavement friction is one of the main factors that contribute to road safety. An adequate level of friction between the vehicle tire and pavement surface reduces the number of crashes, especially in wet pavement conditions [1]; therefore, an appropriate level of traction between rubber tires and pavements is essential for safe driving. Rubber is the principal component of vehicle tires. It is an elastomer that exhibits unique physical and chemical properties. It has low Young’s modulus and high yield strain, as compared with other materials.
It is documented that rubber generates three different forms of friction: adhesion, deformation, and wear. Previous studies have shown that the adhesion force is the most influential component in rubber friction in dry conditions and low speed [2,3]. It is postulated that the adhesion between rubber tires and pavements is highly influenced by the surface free energy, which depends on the chemical composition of rubbers. Yet, to the best of the authors’ knowledge, no studies have been carried out to investigate the effect of surface free energy of rubber on traction with pavements.
The theory of rubber friction recognizes three major friction forces: adhesion force, bulk deformations (hysteresis), and cohesion losses due to the wearing of rubber [4]. The adhesion friction force is formed due to rubber–pavement interaction at a microtexture level and highly dependent on the true area of contact, and thus the adhesion friction is dominant for smooth contact at low speeds and dry conditions [3]. The hysteresis component of friction is caused by the bulk deformation of rubber material as it comes into contact with pavement asperities. Such deformation causes energy losses as rubber slides over the pavement surface. These energy losses are caused by the hysteretic losses in the rubber material due to loading and unloading [3]. The third major component of friction (cohesion losses) is caused by the wearing of rubber as it slides over the pavement surface. Pavement texture has an important role in the friction components—a recent study showed that higher pavement microtexture and macrotexture result in higher frictional properties [5]. The study also showed that pavement surfaces initially had lower frictional properties due to the thin film of asphalt coating the aggregates at the surface. The friction increased as the binder film was removed by traffic, exposing the microtexture. Then, the friction deceased due to polishing and abrasion of the aggregates at the surface.
2. Objectives
The main goal of this study was to investigate the effect of adhesion between rubber and pavement surface on friction at low speed. In addition, we evaluated the effect of rubber rheological properties on friction with pavements. These objectives were achieved by conducting the following tasks:
- Measure the surface energy components of different rubber and aggregate materials.
- Calculate the adhesive bond energy between rubber materials and aggregates.
- Measure the rheological properties of test rubber materials at different temperatures and loading frequencies.
- Measure the coefficient of friction between rubber and hot mix asphalt (HMA) substrates.
- Investigate the correlation between the calculated adhesive bond energy and the measured coefficient of friction between rubber and pavement surfaces.
- Investigate the correlation between the rubber dynamic modulus and the coefficient of friction.
We measured the surface free energy of test rubber materials using a Sessile drop device, while the surface energy components of aggregates were measured using a universal sorption device (USD). The surface free energy of the rubber materials and aggregates were used to calculate the adhesion between the rubber materials and aggregates used in preparing the HMA test substrates. The friction between rubber sliders prepared using test rubber materials and HMA substrates was measured using the dynamic friction tester (DFT) in dry conditions at low speed. In addition, we measured the dynamic modulus of test rubber materials at different temperatures and loading frequencies using a dynamic mechanical analyzer (DMA).
3. Theory of Surface Energy
There are two major components contributing to pavement friction: adhesion and hysteresis. The adhesion component of pavement friction is dominant at low speeds in dry conditions, while the hysteresis component is dominant at higher speeds in wet conditions [6]. The adhesion between any materials is a function of their surface free energy components, where the adhesion force is developed at the molecular level [7,8]. The atoms at surface have lower level of bond energy compared to the atoms in bulk. As molecules in the material bulk are surrounded by other molecules from all sides, an external work must be applied to create a new surface area [7]. This work is known as the total surface free energy of the material and is denoted with Greek letter gamma (γ), the surface free energy is measured in units of ergs/cm2 or mJ/m2. The two most recognized theories to explain the surface free energy are: the two-component theory, and the acid-base theory. According to the two-component theory, the total surface free energy is caused by dispersion forces (e.g., Lifshitz-van der Waals forces) and specific forces (e.g., H-bonding). The total surface free energy is the sum of these two forces as shown in the Equation (1) [9,10].
γ = γDispersive + γSpecific
According to the acid-base theory, the total surface free energy for any material has three components; nonpolar component also known as Lifshitz-van der Waals (γLW), and two polar components: Lewis acid (γ+), and Lewis base (γ−) [11,12]. The total surface energy can be calculated from these three components as given in Equation (2).
Several theories explain the adhesion between two materials by studying the interfacial forces between the materials [13]. The adhesion between rubber tires and pavement surface is one mechanism leading to friction and is dominant at low speeds. The adhesion between rubber and aggregate can be measured if the surface free energies of both materials are known. The adhesion between two materials (A and B) is a function of the surface free energy components of these two materials, as given in Equation (3) [7].
The amount of work required to separate the two materials at the interface in vacuum is referred as the adhesive bond energy (WAB). The adhesive bond energy between rubber sample (subscript A) and an aggregate (subscript B) can be calculated using Equation (3), while the cohesive bond energy of a single material (e.g., rubber) (WAA) can be calculated according to Equation (4) [7].
3.1. Methods for Measuring Surface Energy
3.1.1. Sessile Drop Method
The Sessile drop method is commonly used to measure the surface free energy between a probe liquid and solid surface by means of measuring the contact angle between a droplet of a selected probe liquid and material surface [14]. The Sessile drop test measures the contact angle between a drop of liquid of known surface energy and a solid material, to calculate the surface free energy (SFE) of solid material surfaces. The Young’s equation (Equation (5)), defines the equilibrium at the three-phase contact of solid-liquid and gas [15].
where θ is the contact angle between a solid surface and a drop of probe liquid. The contact angle is measured from a static image using a charged-coupled device (CCD) camera as shown in Figure 1. The Young equation assumes that the surface is chemically homogeneous and topographically smooth.
γSV = γSl + γLV cos (θ)
In the Sessile drop technique, a droplet of probe liquid is placed on the test surface using a micro-syringe. The Sessile drop device (Figure 2a) uses a CCD camera static image to measure the contact angle between the used probe liquid of known surface energy and the rubber surface. The contact angle is the average value of the measured right and left contact angles (Figure 2b).
To determine the surface energy components of a material, three different probe liquids are used in the test. However, in order to minimize experimental error in calculating the surface energy components, Little and Bhsain [7] recommended using five different probe liquids (water, glycerol, ethylene glycol, formamide, and diiodomethane) with known surface energy components. Table 1 summarizes the surface energy components of the five probe liquids used in this study.
3.1.2. Universal Sorption Device
The surface free energy components of aggregates are often measured using the universal sorption device (USD). In this method, the aggregate particles are placed in a sealed cell under vacuum and controlled temperature. The USD uses a magnetic suspension balance to measure the mass of the aggregate particle and probe vapor adsorbed on the aggregate surface when aggregates are subjected to different pressures of probe vapor. The relationship between the amount of probe vapor adsorbed on aggregate surface and the partial pressure is called the adsorption isotherm which is used to determine the spreading pressure (πe) [7]. The spreading pressure (πe) is a function of the surface energy components of aggregate particles (S) and probe vapor (V), as given in Equation (6).
Several researchers used the USD to measure the surface free energy components of aggregates [16,17,18]. In this study, the USD test was used to determine the surface free energy of the gabbro and limestone aggregates. The surface energy components of rubber and aggregates are used to calculate the adhesive bond energy or work of adhesion (WAB), (Equation (3)) between rubber sliders and HMA surfaces.
4. Test Materials and Laboratory Experiments
In this study, six different rubber materials were used to investigate the frictional properties between laboratory-prepared rubber sliders and HMA slabs prepared from limestone and gabbro aggregates. The rubber materials used in this study included pure gum, Styrene Butadiene Rubber (SBR), Nitrile, Ethylene Propylene Diene Monomer (EPDM), Neoprene, and Butyl. These materials were selected in testing as they cover a wide range of rubber properties in terms of dynamic modulus, elongation, and durability. Table 2 summarizes the rubber properties as provided by the manufacturer.
Two sources of aggregates were evaluated in this study (gabbro and limestone). The gabbro and limestone aggregates were used to prepare HMA slabs. The gabbro is an igneous rock while the limestone is a sedimentary rock. Gabbro has rough surface compared to limestone [19]. These aggregates are used in road construction in the State of Qatar. Table 3 presents the aggregate gradation used to prepare both gabbro and limestone substrates. It should be noted that the same aggregate gradation and binder type (Pen 60–70) were used in preparing the asphalt mixture substrates. The optimum binder content was found to be 4.3% for gabbro and 4.7% for limestone. The mixing and compaction temperatures were 143 °C and 135 °C, respectively.
The asphalt mixtures were prepared following the AASHTO T-312, and the test slabs were compacted using a small vibratory compactor as shown in Figure 3.
5. Measuring Frictional Properties
We used a dynamic friction tester (DFT) to measure the coefficient of friction between rubber sliders (Figure 4), prepared using the test rubber materials, and HMA substrate at low speed (20 km/h) in dry conditions. The DFT uses three rubber sliders attached to a rotating desk (Figure 5). The rotating desk is lowered on the surface once the specified speed is reached and the coefficient of friction is measured with speed until the rotating desk comes to a complete stop.
For the prepared HMA substrates, the aggregates on the surface were coated with a thin asphalt binder. We used a three-wheel polisher to remove this thin film of binder to ensure direct contact between rubber sliders and aggregates. The surface energy components of asphalt binder are different than those of aggregate samples and thus it may affect the adhesive bond energy between rubber and surface aggregates. In the field, this thin layer of asphalt binder is removed under traffic in a short period of time. The three-wheel polisher consists of pneumatic rubber wheels that rotate over the test HMA substrate as shown in Figure 6. The DFT device was used to measure the coefficient of friction between the prepared rubber sliders (Figure 4) and HMA substrates.
6. Measuring Rubber Properties
The dynamic mechanical analyzer (DMA) device was used to measure the dynamic modulus of rubber samples tested in this study (Figure 7). The rubber test sample for the DMA testing was 50 mm in length, 16.8 mm in width, and 6.4 mm thick. The test was performed at different test temperatures (0 to 70 °C) and frequencies (0.1–70 Hz). The temperature was controlled during the test by placing the DMA inside an environmental chamber. The dynamic modulus is calculated by dividing the maximum applied cyclic tensile stress by the resulting strain.
7. Test Results and Discussion
7.1. Adhesion Friction
The average contact angle between rubber samples and the test probe liquids was recorded using the Sessile drop device. Each measurement represents the average contact angle measured from right and left. The results for the measured contact angles in degrees are presented in Table 4. Based on the contact angle measurements, the surface energy components were calculated for each rubber material using Equation (7), which is discussed in detail by Little and Bhasin [7].
The surface free energy components are summarized in Table 5. The surface free energy components of the aggregates were measured using a Universal Sorption Device (USD) from a previous study [20]. The surface free energy components for the gabbro and limestone aggregates are shown in Table 6. It was found that gabbro rock has the higher total surface free energy compared to limestone.
The adhesive bond energy between different rubber and aggregate samples was calculated from their surface free energy components according to Equation (3). Figure 8 shows the calculated adhesive bond energies between the rubber and aggregates. The SBR and Pure Gum rubber materials were found to provide the highest adhesion with test substrates made with gabbro and limestone. The adhesive bond energy between limestone and SBR rubber was 79.91 ergs/cm2. The Neoprene was found to provide the lowest adhesion with HMA substrates compared to other rubber materials. Also, the limestone was found to provide higher adhesion with rubber materials compared to gabbro in most cases.
The coefficient of friction between rubber sliders and HMA substrates was measured using the DFT at low speed (20 km/h) in dry conditions. The adhesion component of the friction is dominant at low speed. Figure 9a shows the relationship between the adhesive bond energy and the coefficient of friction for gabbro and limestone separately, while Figure 9b shows the relationship between the coefficient of friction versus the adhesive bond energy between test rubber materials and all the test HMA substrates (both gabbro and limestone). It was found that there is a fair correlation between the adhesive bond energy and measured coefficient of friction. This relationship demonstrates that higher adhesion between rubber and pavement surface increases the coefficient of friction at low speed as one expects; however, this study provided an experimental verification to such relationship. In the meantime, we believe that this relationship is affected by two experimental limitations. First, the asphalt binder film was not fully removed from the aggregates on the surface. We attempted to minimize this effect be removing most of the film thickness by polishing the slab using the three-wheel polisher for 5000 cycles until the aggregate particles surface is exposed. The application of more cycles was found to polish the aggregates which should be avoided since the surface energy components of aggregate will change with change in the texture of the surface. Second, the surface energy components of rubber were calculated based on the contact angle between smooth rubber samples and probe liquids. Meanwhile, we observed that the surface of rubber sliders, used in DFT, was not completely smooth due to cutting the rubber sheet to prepare the sliders. These two limitations may contribute to this fair correlation between adhesive bond energy and measured coefficient of friction at low speed.
7.2. Hysteresis Friction
The DMA results demonstrated that the dynamic modulus (E*) of rubber material increased with the loading frequency and decreased with temperature as expected. Figure 10 shows the E* master curves of the test rubber materials. The Pure Gum rubber provided the lowest E* value compared to other rubber materials, while the Nitrile rubber had the highest E*. From Figure 10, it can be clearly seen that the Pure Gum rubber is the softest followed by the SBR rubber while the Nitrile rubber is the stiffest. The rubbers dynamic modulus at room temperature (20 °C) were correlated with the measured coefficient of friction.
Figure 11 shows the relationship between the dynamic modulus values of rubber samples and the coefficient of friction between rubber sliders and HMA substrates. There is a strong correlation between the complex modulus at room temperature (20 °C) and the coefficient of friction at 30 km/h. The researchers observed that there was no significant change in the coefficient of friction measured using DFT with speed after 30 km/h. Figure 11 demonstrates that softer rubbers provide higher coefficient of friction while stiffer rubbers provided lower coefficient of friction regardless the aggregate type.
8. Summary and Conclusions
This study experimentally examined the relationship between the rubber–pavement adhesion and friction. We calculated the surface energy components for rubber materials by measuring the contact angle between rubber materials and different probe liquids. The contact angle was measured using a Sessile drop device. Similarly, the surface energy components of aggregate samples were measured using a USD device. The adhesive bond energy between rubber and aggregates was calculated based on the surface energy components of both materials. In addition, we measured the coefficient of friction between different rubber materials and HMA substrates prepared using different rock types. The results showed that there is a fair correlation between adhesive bond energy and friction between rubber and pavement surfaces. In addition, the results demonstrated that there is a strong relationship between friction and rubber elastic modulus. Softer rubber provided higher friction. The results of this study provide an experimental verification of the relationship between adhesion and friction of rubber and pavement surface. The adhesive bond energy and rubber rheological properties could be incorporated in computational models to study tire-pavement friction in different conditions (e.g., speed and temperature). We recommend testing more aggregate types and rubber materials to evaluate the adhesion friction.
Acknowledgments
This publication was made possible by an NPRP award (NPRP No. 7-482-2-184: Thermo-Mechanical Tire-Pavement Interaction: Computational Modelling and Field Measurements) from the Qatar National Research Fund (QNRF – a member of The Qatar Foundation). The statements made herein are solely the responsibility of the authors.
Author Contributions
Mohammad Al-Assi and Emad Kassem conceived, designed and performed the experiments, analyzed the data, and wrote the paper.
Conflicts of Interest
The authors declare no conflict of interest.
References
- Noyce, D.; Bahia, H.; Yambo, J.; Kim, G. Incorporating Road Safety into Pavement Management: Maximizing Asphalt Pavement Surface Friction for Road Safety Improvements; Draft Literature Review and State Surveys; Midwest Regional University Transportation Center (UMTRI): Madison, WI, USA, 2005. [Google Scholar]
- Roberts, A.D. Rubber Adhesion at High Rolling Speeds. J. Nat. Rubber Res. 1988, 3, 4. [Google Scholar]
- Hall, J.W.; Smith, K.L.; Titus-Glover, L. Guide for Pavement Friction; Contractors final report for NCHRP Project 01-43; National Cooperative Highway Research Program: Washington, DC, USA, 2009; Available online: https://www.nap.edu/download/23038# (accessed on 12 August 2017).
- Kummer, H. Unified Theory of Rubber and Tire Friction, 1st ed.; College of Engineering, Pennsylvania State University: University Park, PA, USA, 1966. [Google Scholar]
- Woodward, D.; Millar, P.; Lantieri, C.; Sangiorgi, C.; Vignali, V. The wear of Stone Mastic Asphalt due to slow speed high stress simulated laboratory trafficking. Constr. Build. Mater. 2016, 110, 270–277. [Google Scholar] [CrossRef]
- Dunford, A. Friction and the Texture of Aggregate Particles Used in the Road Surface Course. Ph.D. Thesis, University of Nottingham, Nottingham, UK, 2013. [Google Scholar]
- Little, D.; Bhasin, A. NCHRP Report W104: Using Surface Energy Measurements to Select Materials for Asphalt Pavement; Transportation Research Board: Washington, DC, USA, 2006. [Google Scholar]
- Berg, J. Interfaces and Colloids; World Scientific: Hackensack, NJ, USA, 2010; pp. 250–268. [Google Scholar]
- Fowkes, F. Determination of Interfacial Tensions, Contact Angles, and Dispersion Forces in Surfaces by Assuming Additivity of Intermolecular Interactions in Surfaces. J. Phys. Chem. 1962, 66, 382. [Google Scholar] [CrossRef]
- Fowkes, F. Attractive Forces at Interfaces. Ind. Eng. Chem. 1964, 56, 40–52. [Google Scholar] [CrossRef]
- Van Oss, C.; Chaudhury, M.; Good, R. Interfacial Lifshitz-Van Der Waals and Polar Interactions in Macroscopic Systems. Chem. Rev. 1988, 88, 927–941. [Google Scholar] [CrossRef]
- Van Oss, C. Use of The Combined Lifshitz–Van Der Waals and Lewis Acid–Base Approaches in Determining the Apolar and Polar Contributions to Surface and Interfacial Tensions and Free Energies. J. Adhes. Sci. Technol. 2002, 16, 669–677. [Google Scholar] [CrossRef]
- Adamson, A.; Gast, A. Physical Chemistry of Surfaces, 1st ed.; Wiley: New York, NY, USA, 1997. [Google Scholar]
- Hejda, F.; Solar, P.; Kousal, J. Surface Free Energy Determination by Contact Angle. In Proceedings of the 19th Annual Conference of Doctoral Students—WDS 2010, Prague, Czech, 1–4 June 2010; Part III. pp. 25–30. [Google Scholar]
- Bracco, G.; Holst, B. Surface Science Techniques, 1st ed.; Springer: Berlin, Germany, 2013. [Google Scholar]
- Cheng, D. Surface Free Energy of Asphalt-Aggregate Systems and PerformanceAnalysis of Asphalt Concrete Based on Surface Free Energy. Ph.D. Thesis, Texas A&M University, College Station, TX, USA, 2002. [Google Scholar]
- Hefer, A. Adhesion in Bitumen-Aggregate Systems and Quantification of the Effects of Water on the Adhesive Bond. Ph.D. Thesis, Texas A&M University, College Station, TX, USA, 2004. [Google Scholar]
- Zollinger, C. Application of Surface Energy Measurements to Evaluate Moisture Susceptibility of Asphalt and Aggregates. Master’s Thesis, Texas A&M University, College Station, TX, USA, 2005. [Google Scholar]
- Masad, E.; Rezaei, A.; Chowdhury, A.; Harris, P. Predicting Asphalt Mixture skId Resistance Based on Aggregate Characteristics. Technical Report 0-5627-1. 2009. Available online: https://static.tti.tamu.edu/tti.tamu.edu/documents/0-5627-1.pdf (accessed on 17 August 2017).
- Kassem, E.; Garcia Cucalon, L.; Masad, E.; Little, D. Effect of warm mix additives on the interfacial bonding characteristics of asphalt binders. Int. J. Pavement Eng. 2016, 1–14. [Google Scholar] [CrossRef]
Figure 1.
Contact angle between liquid and solid surfaces.
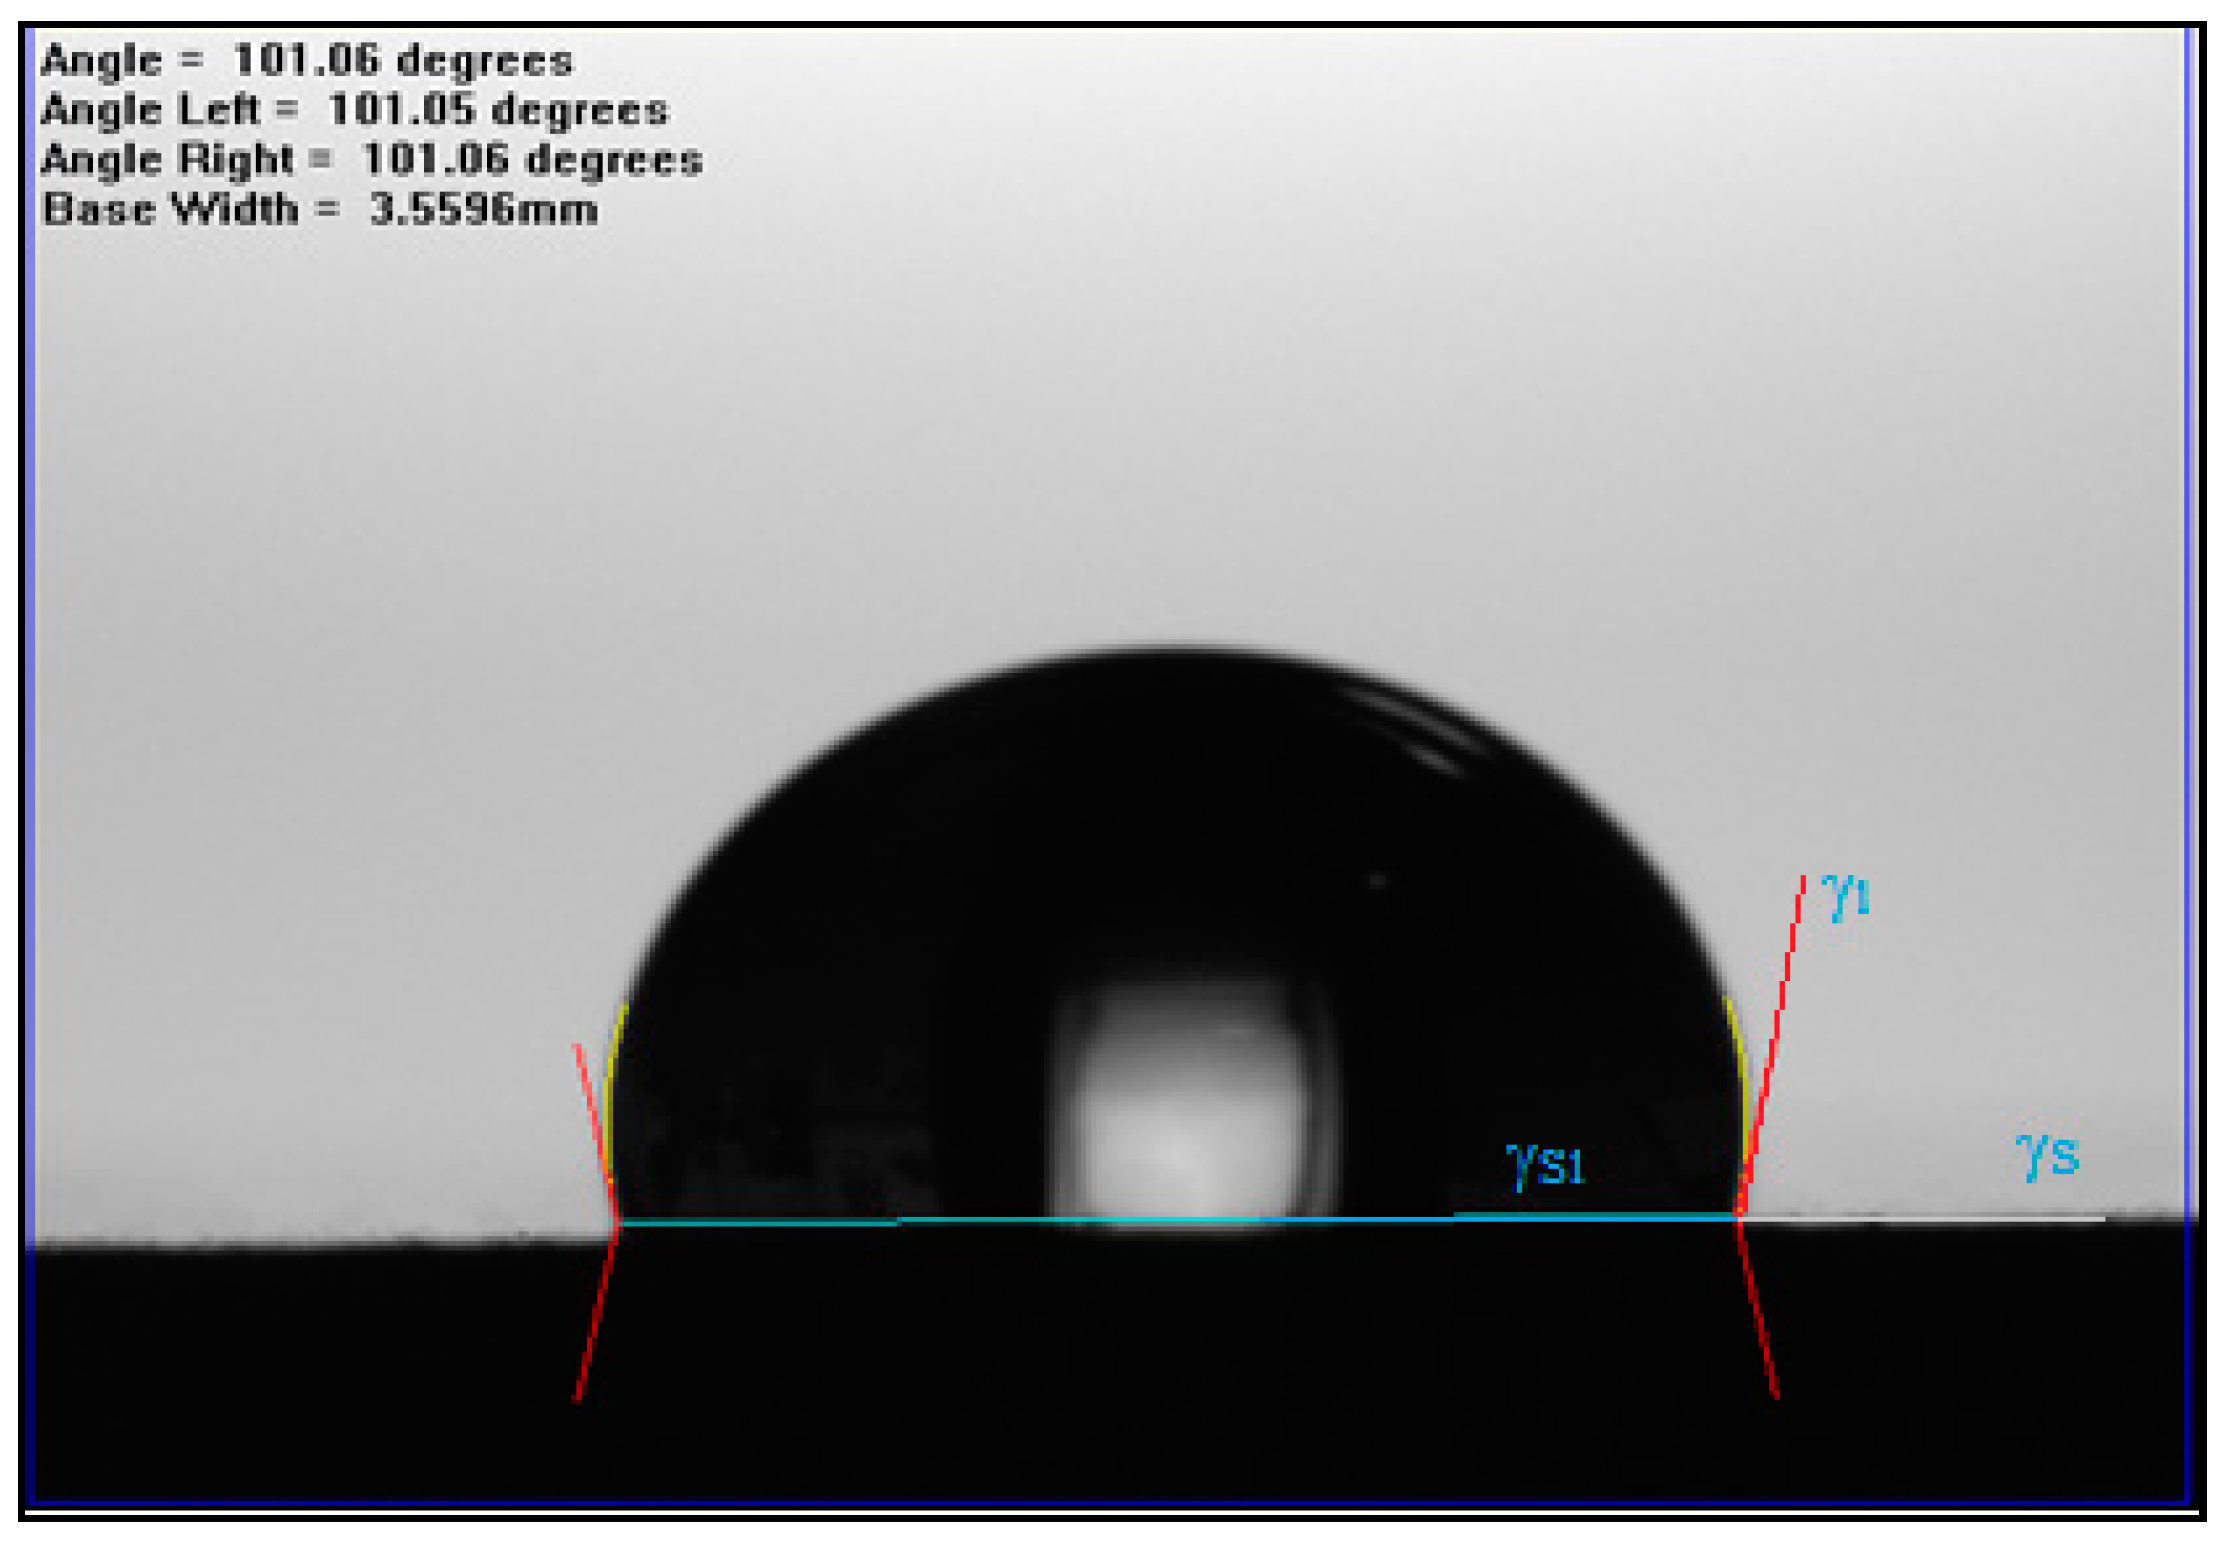
Figure 2.
(a) Sessile drop device; (b) Sketch of Sessile drop contact angle measurement.
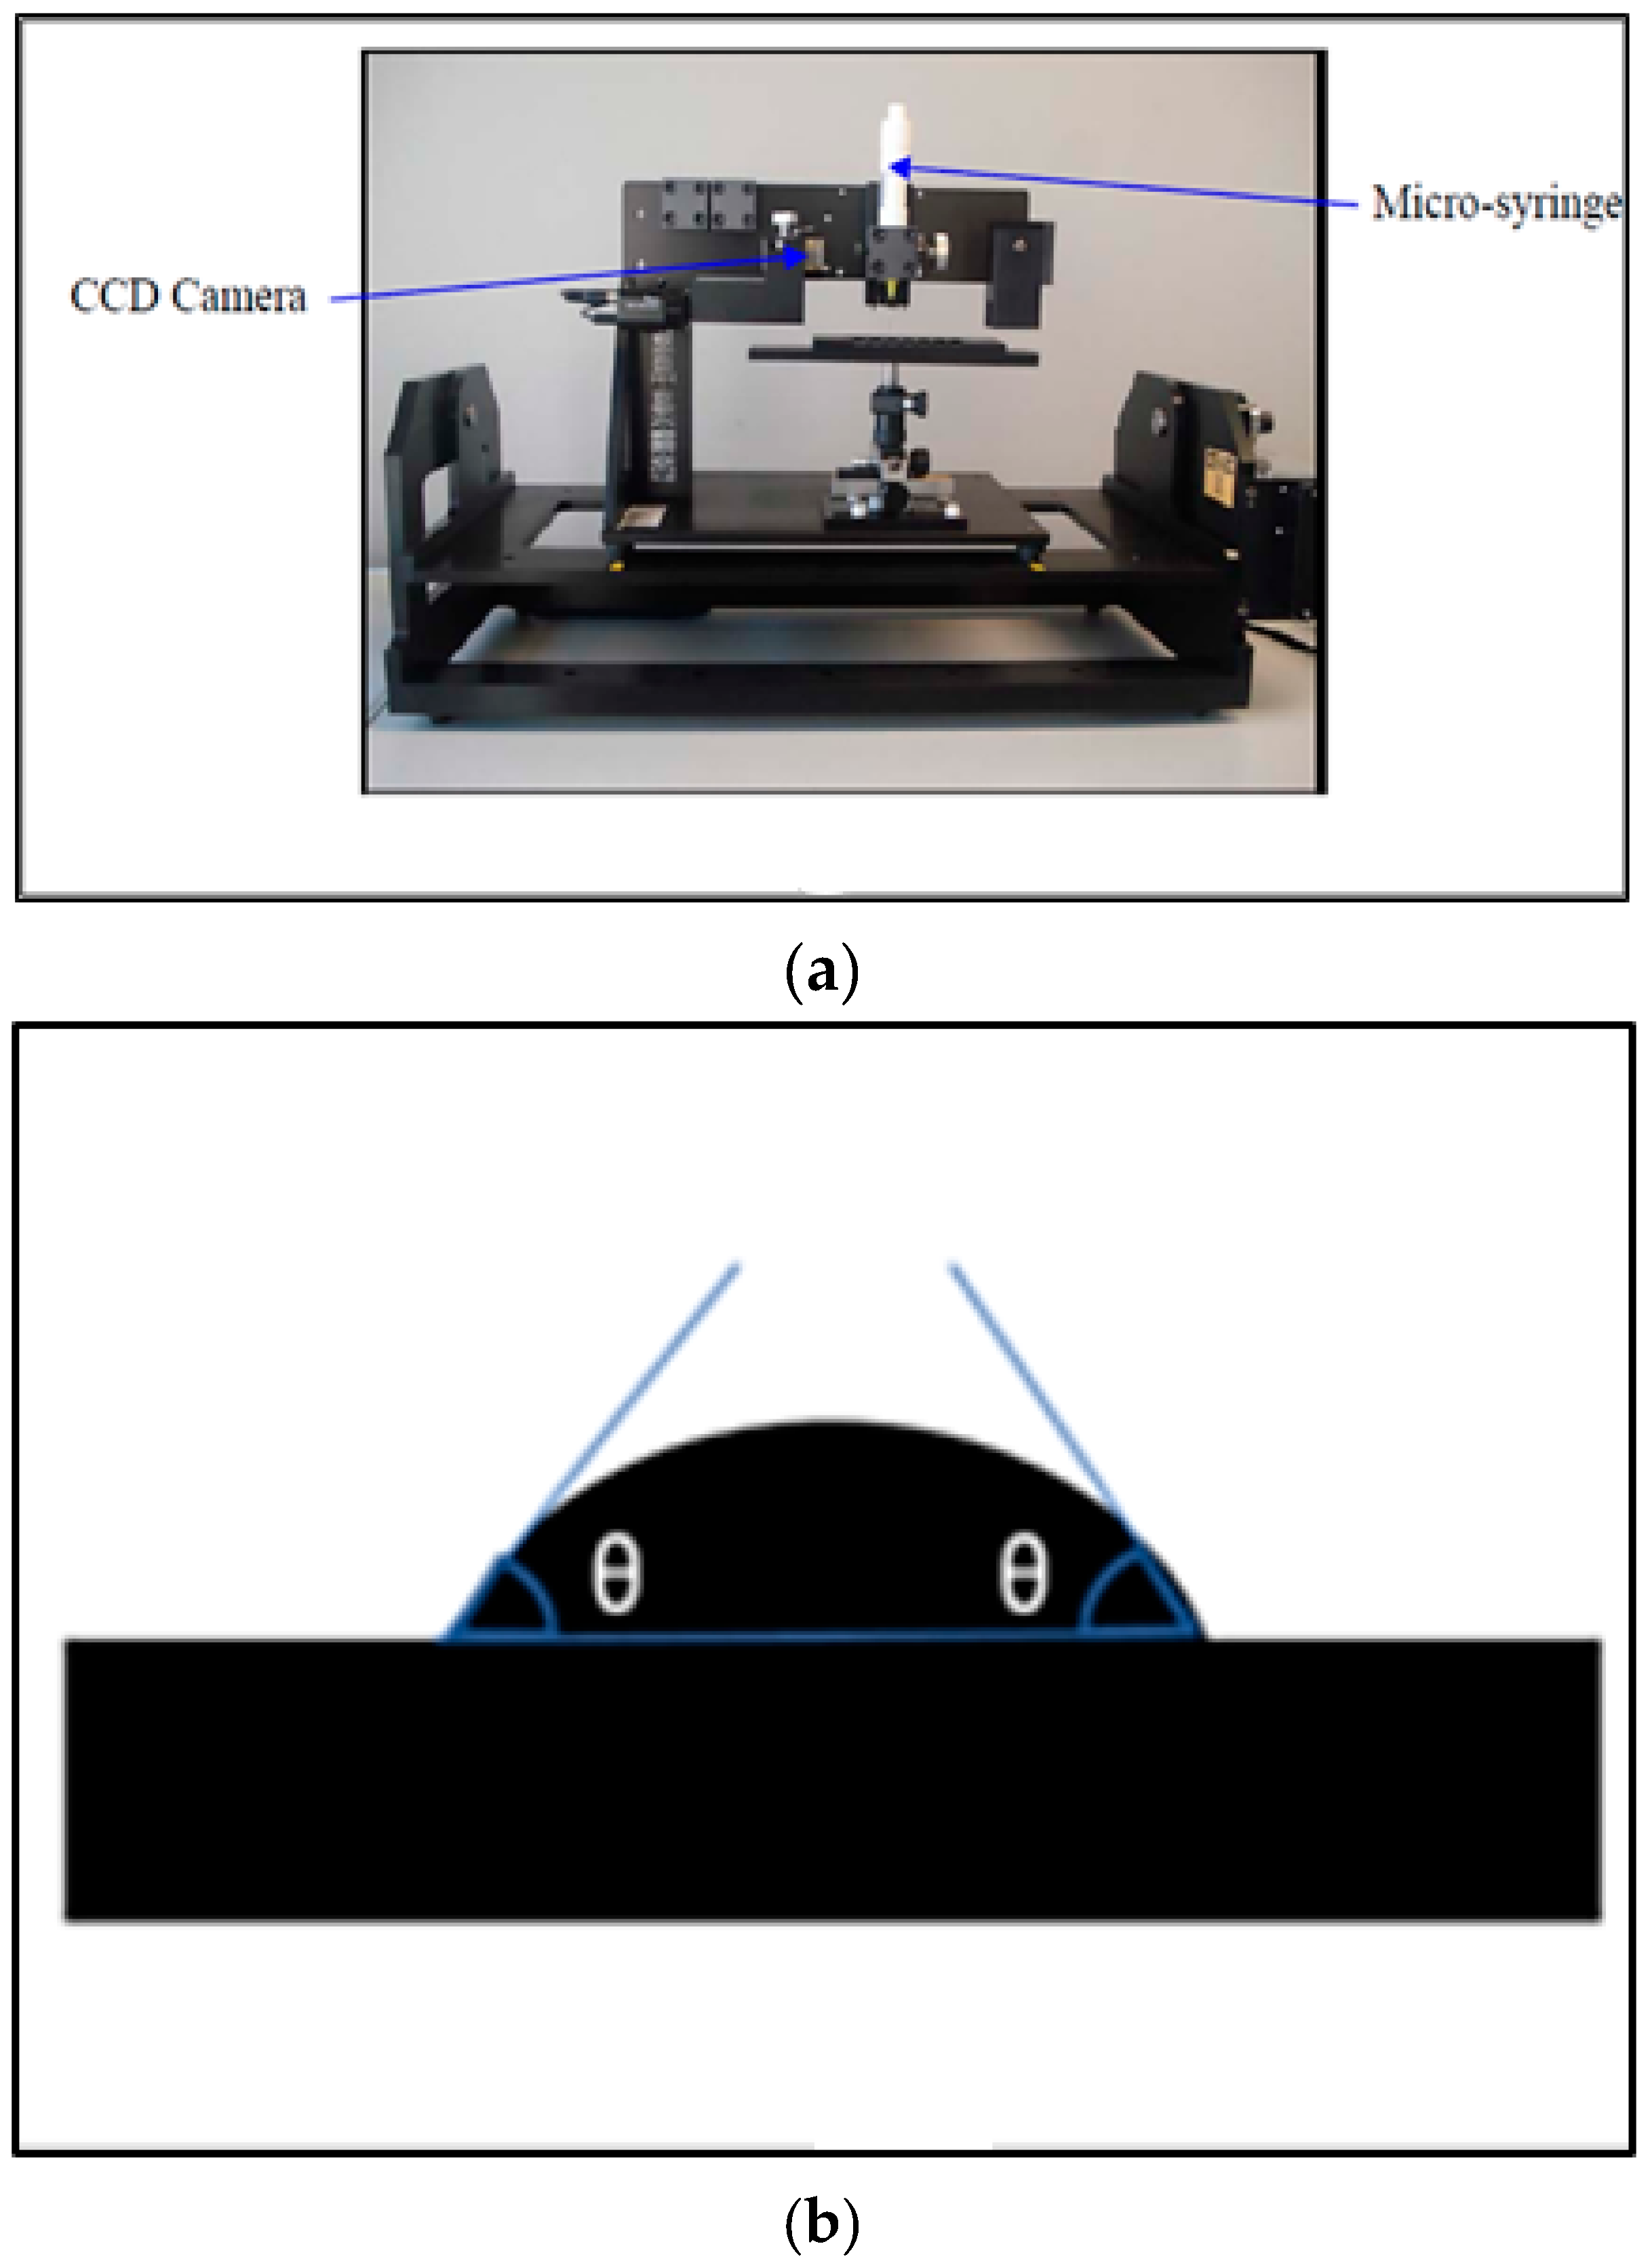
Figure 3.
Preparing hot mix asphalt (HMA) slabs.
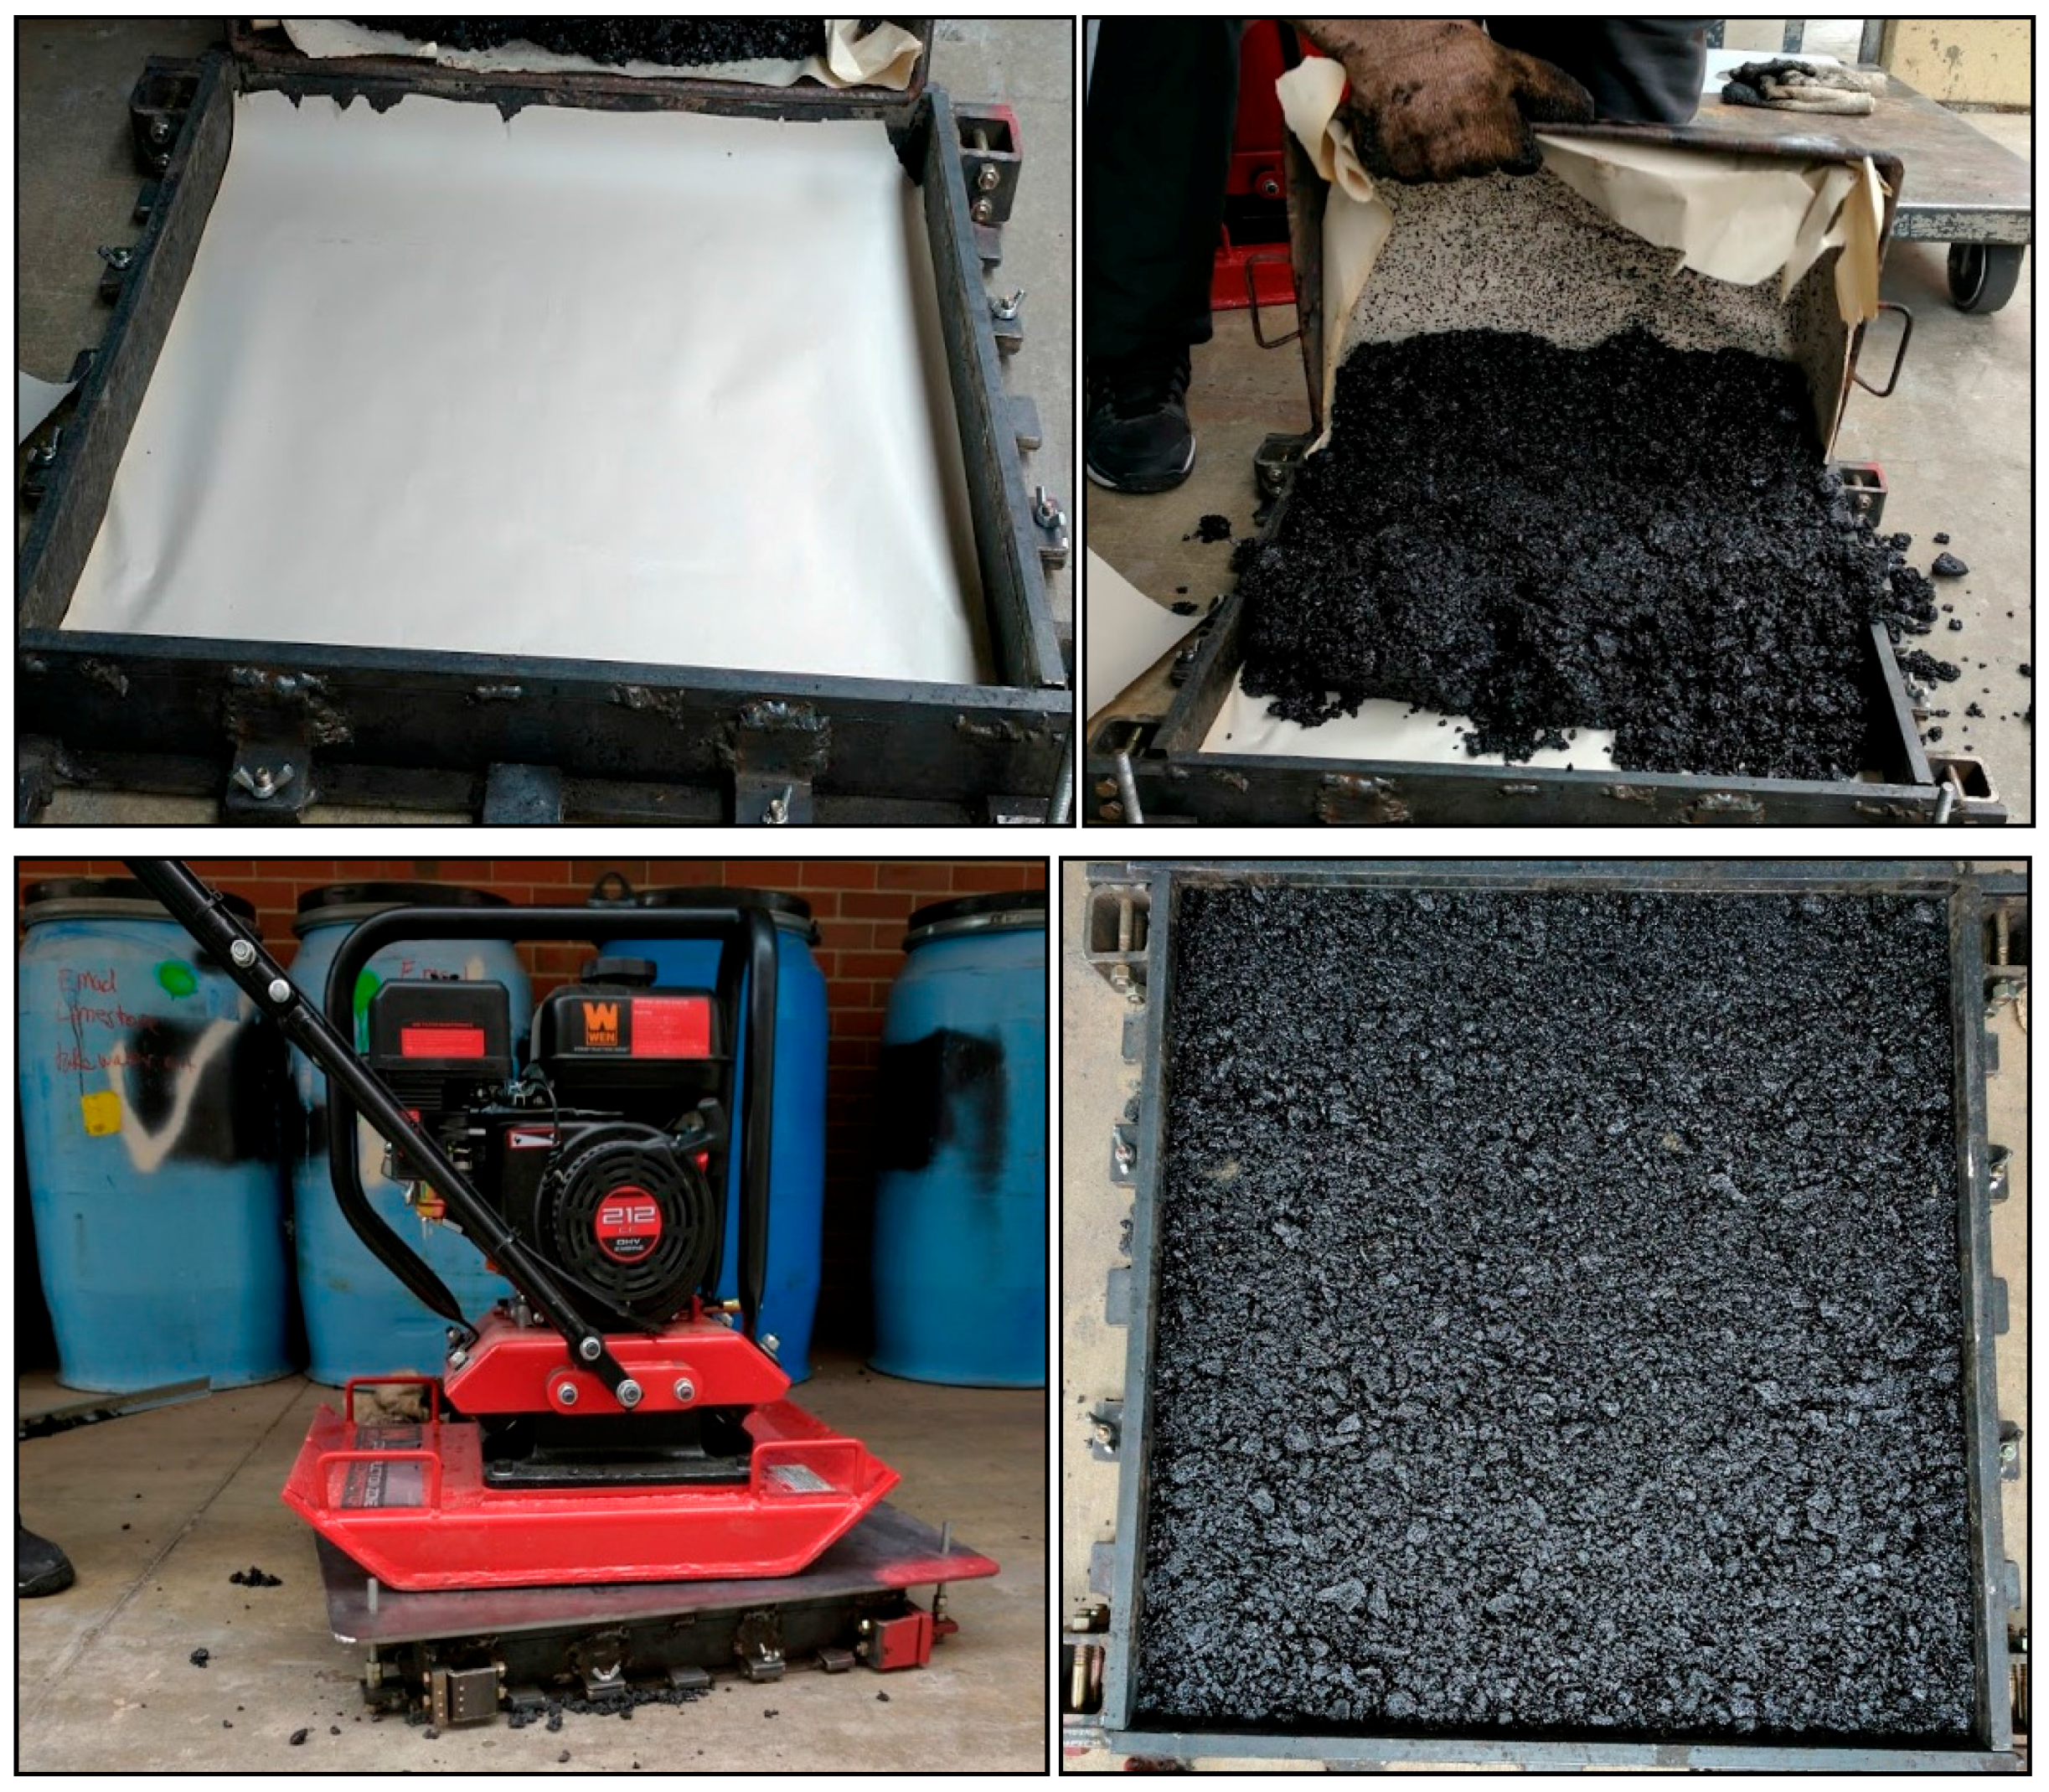
Figure 4.
Prepared rubber sliders from test rubber materials.

Figure 5.
(a) Dynamic friction tester (DFT) device; (b) Bottom of the DFT with three rubber sliders.
Figure 5.
(a) Dynamic friction tester (DFT) device; (b) Bottom of the DFT with three rubber sliders.
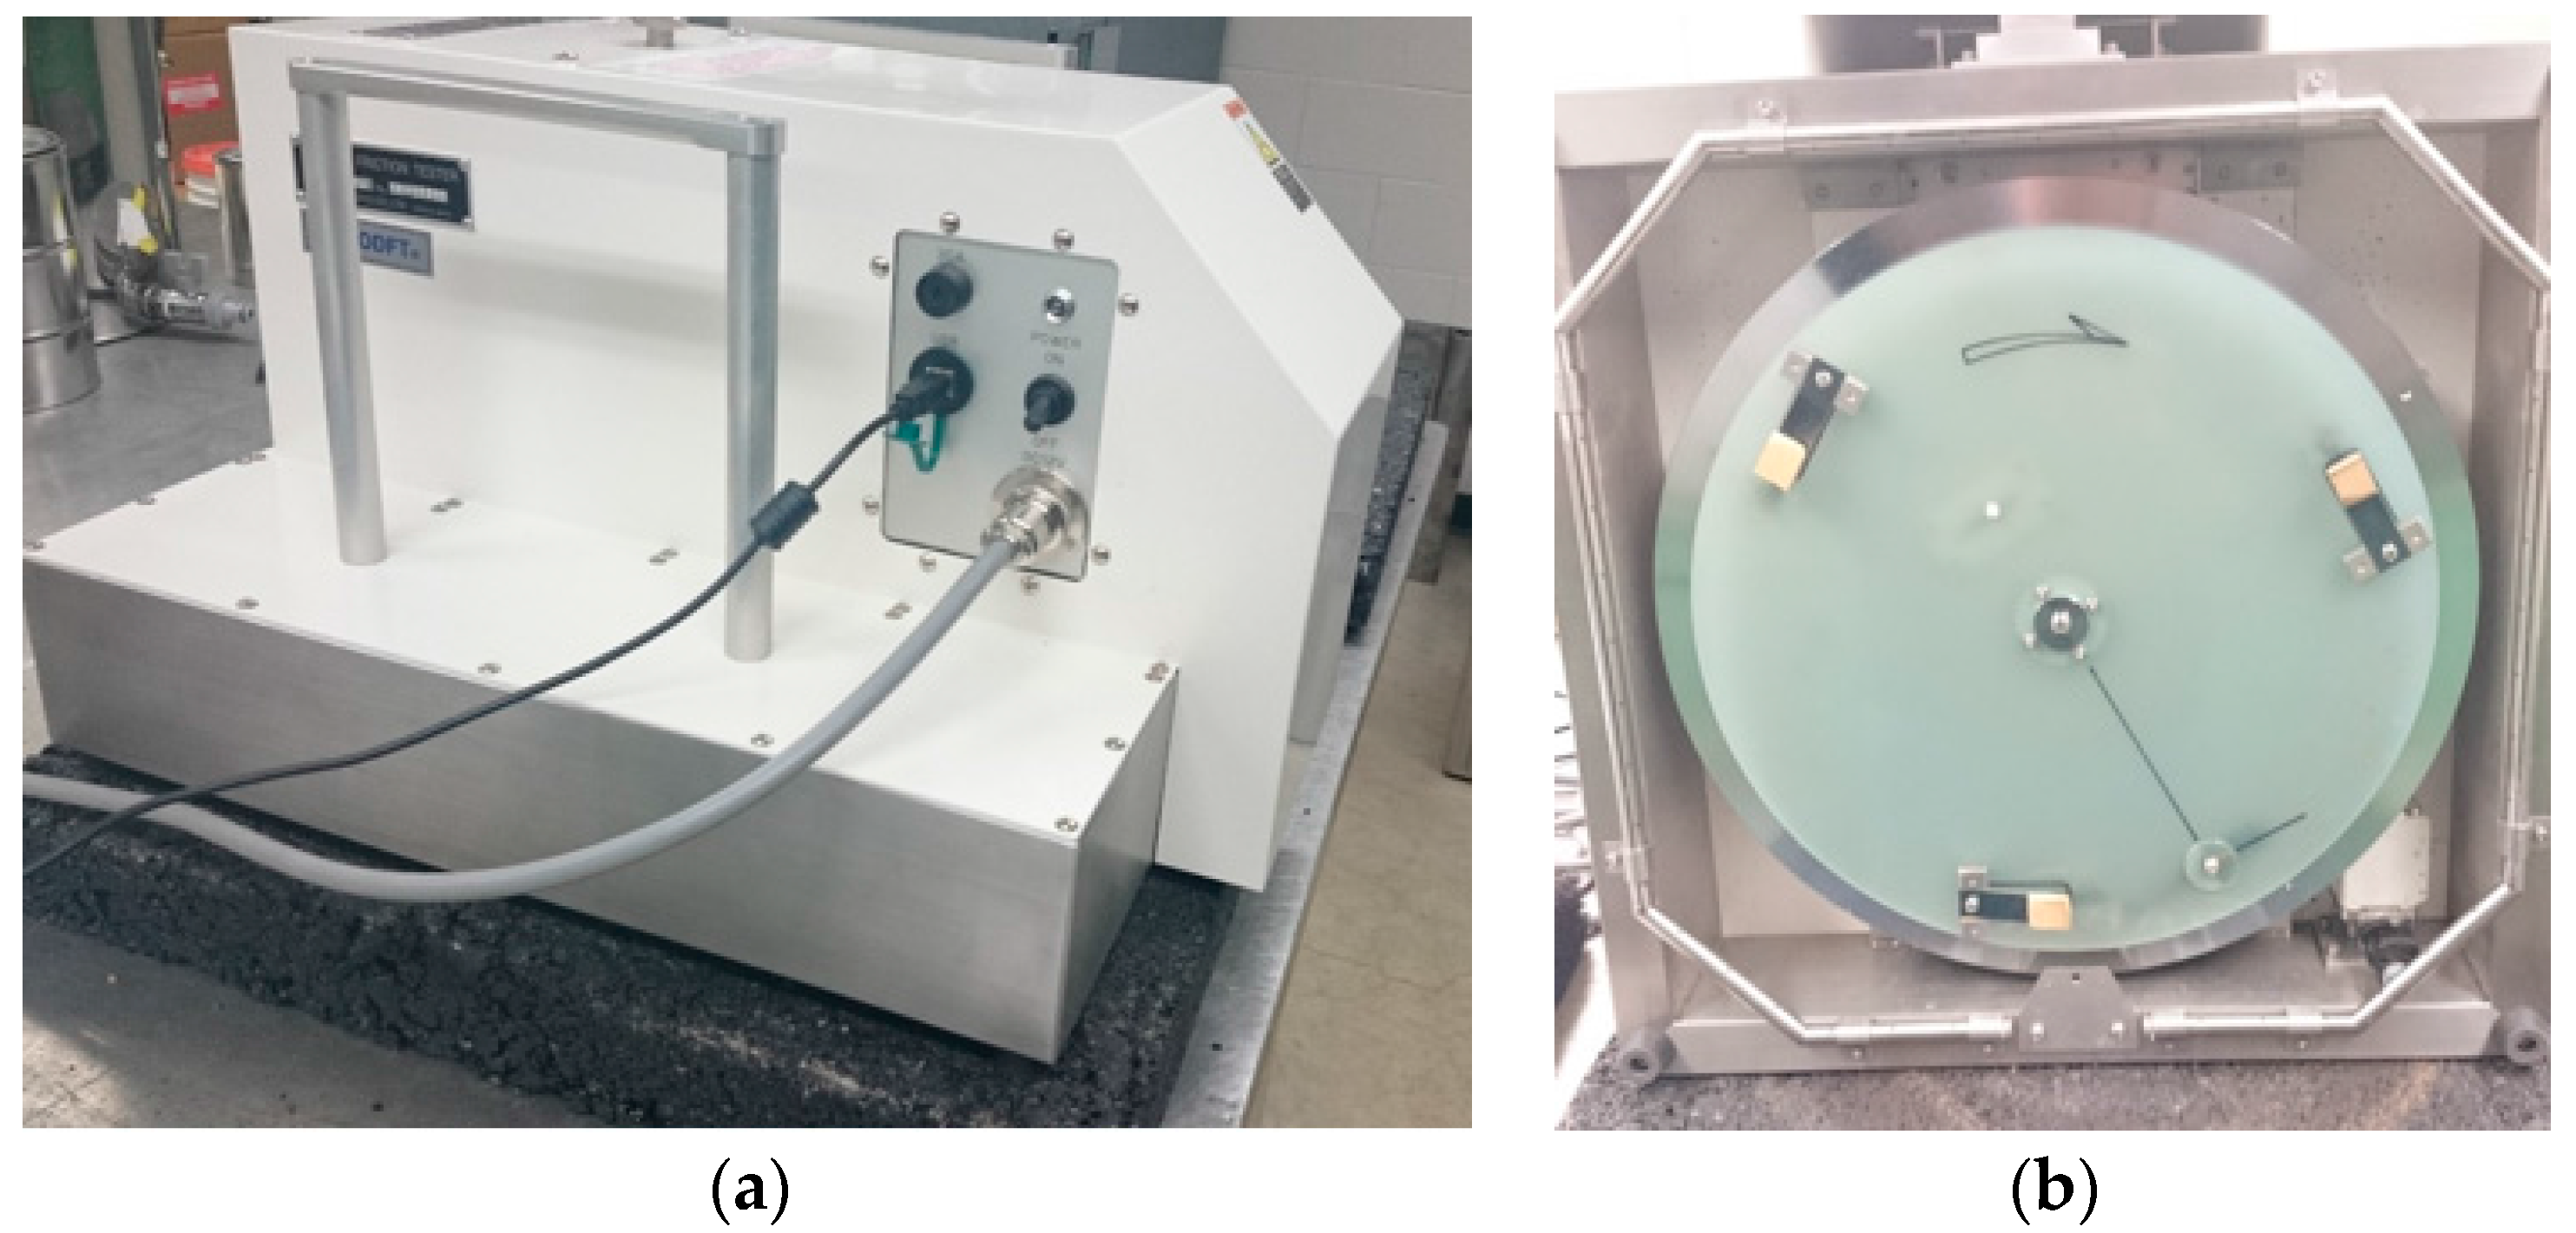
Figure 6.
Three-wheel polisher.
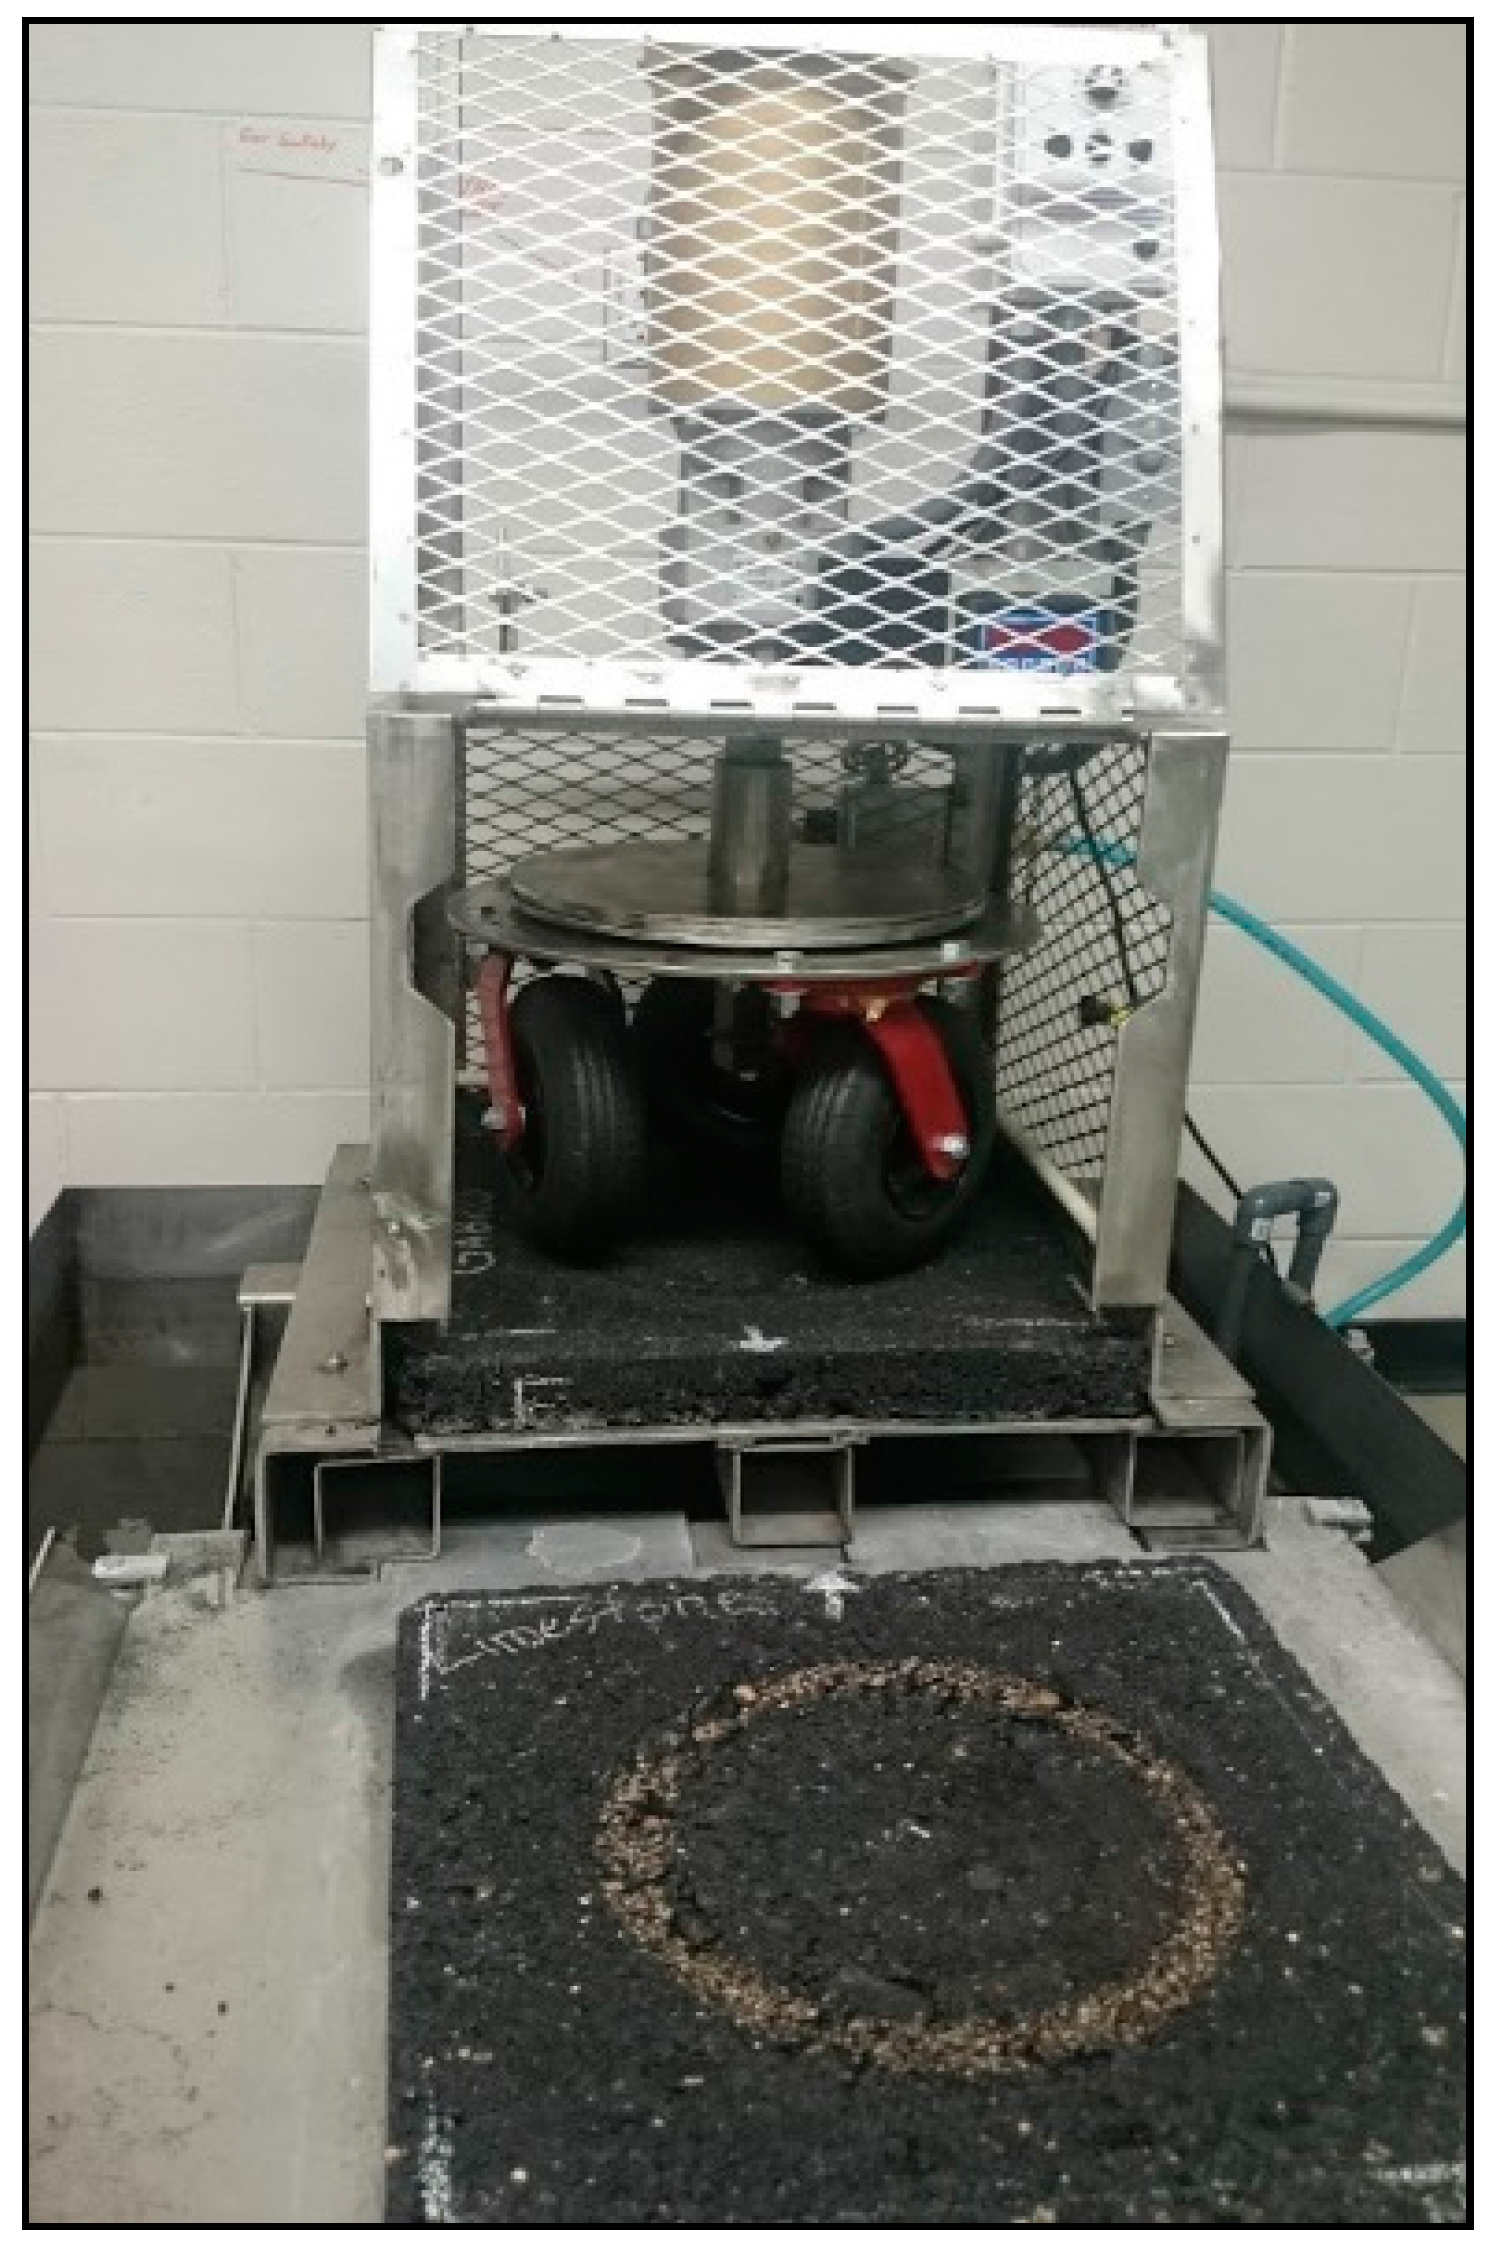
Figure 7.
Testing rubber specimen in the dynamic mechanical analyzer (DMA) device inside a temperature-control chamber.
Figure 7.
Testing rubber specimen in the dynamic mechanical analyzer (DMA) device inside a temperature-control chamber.
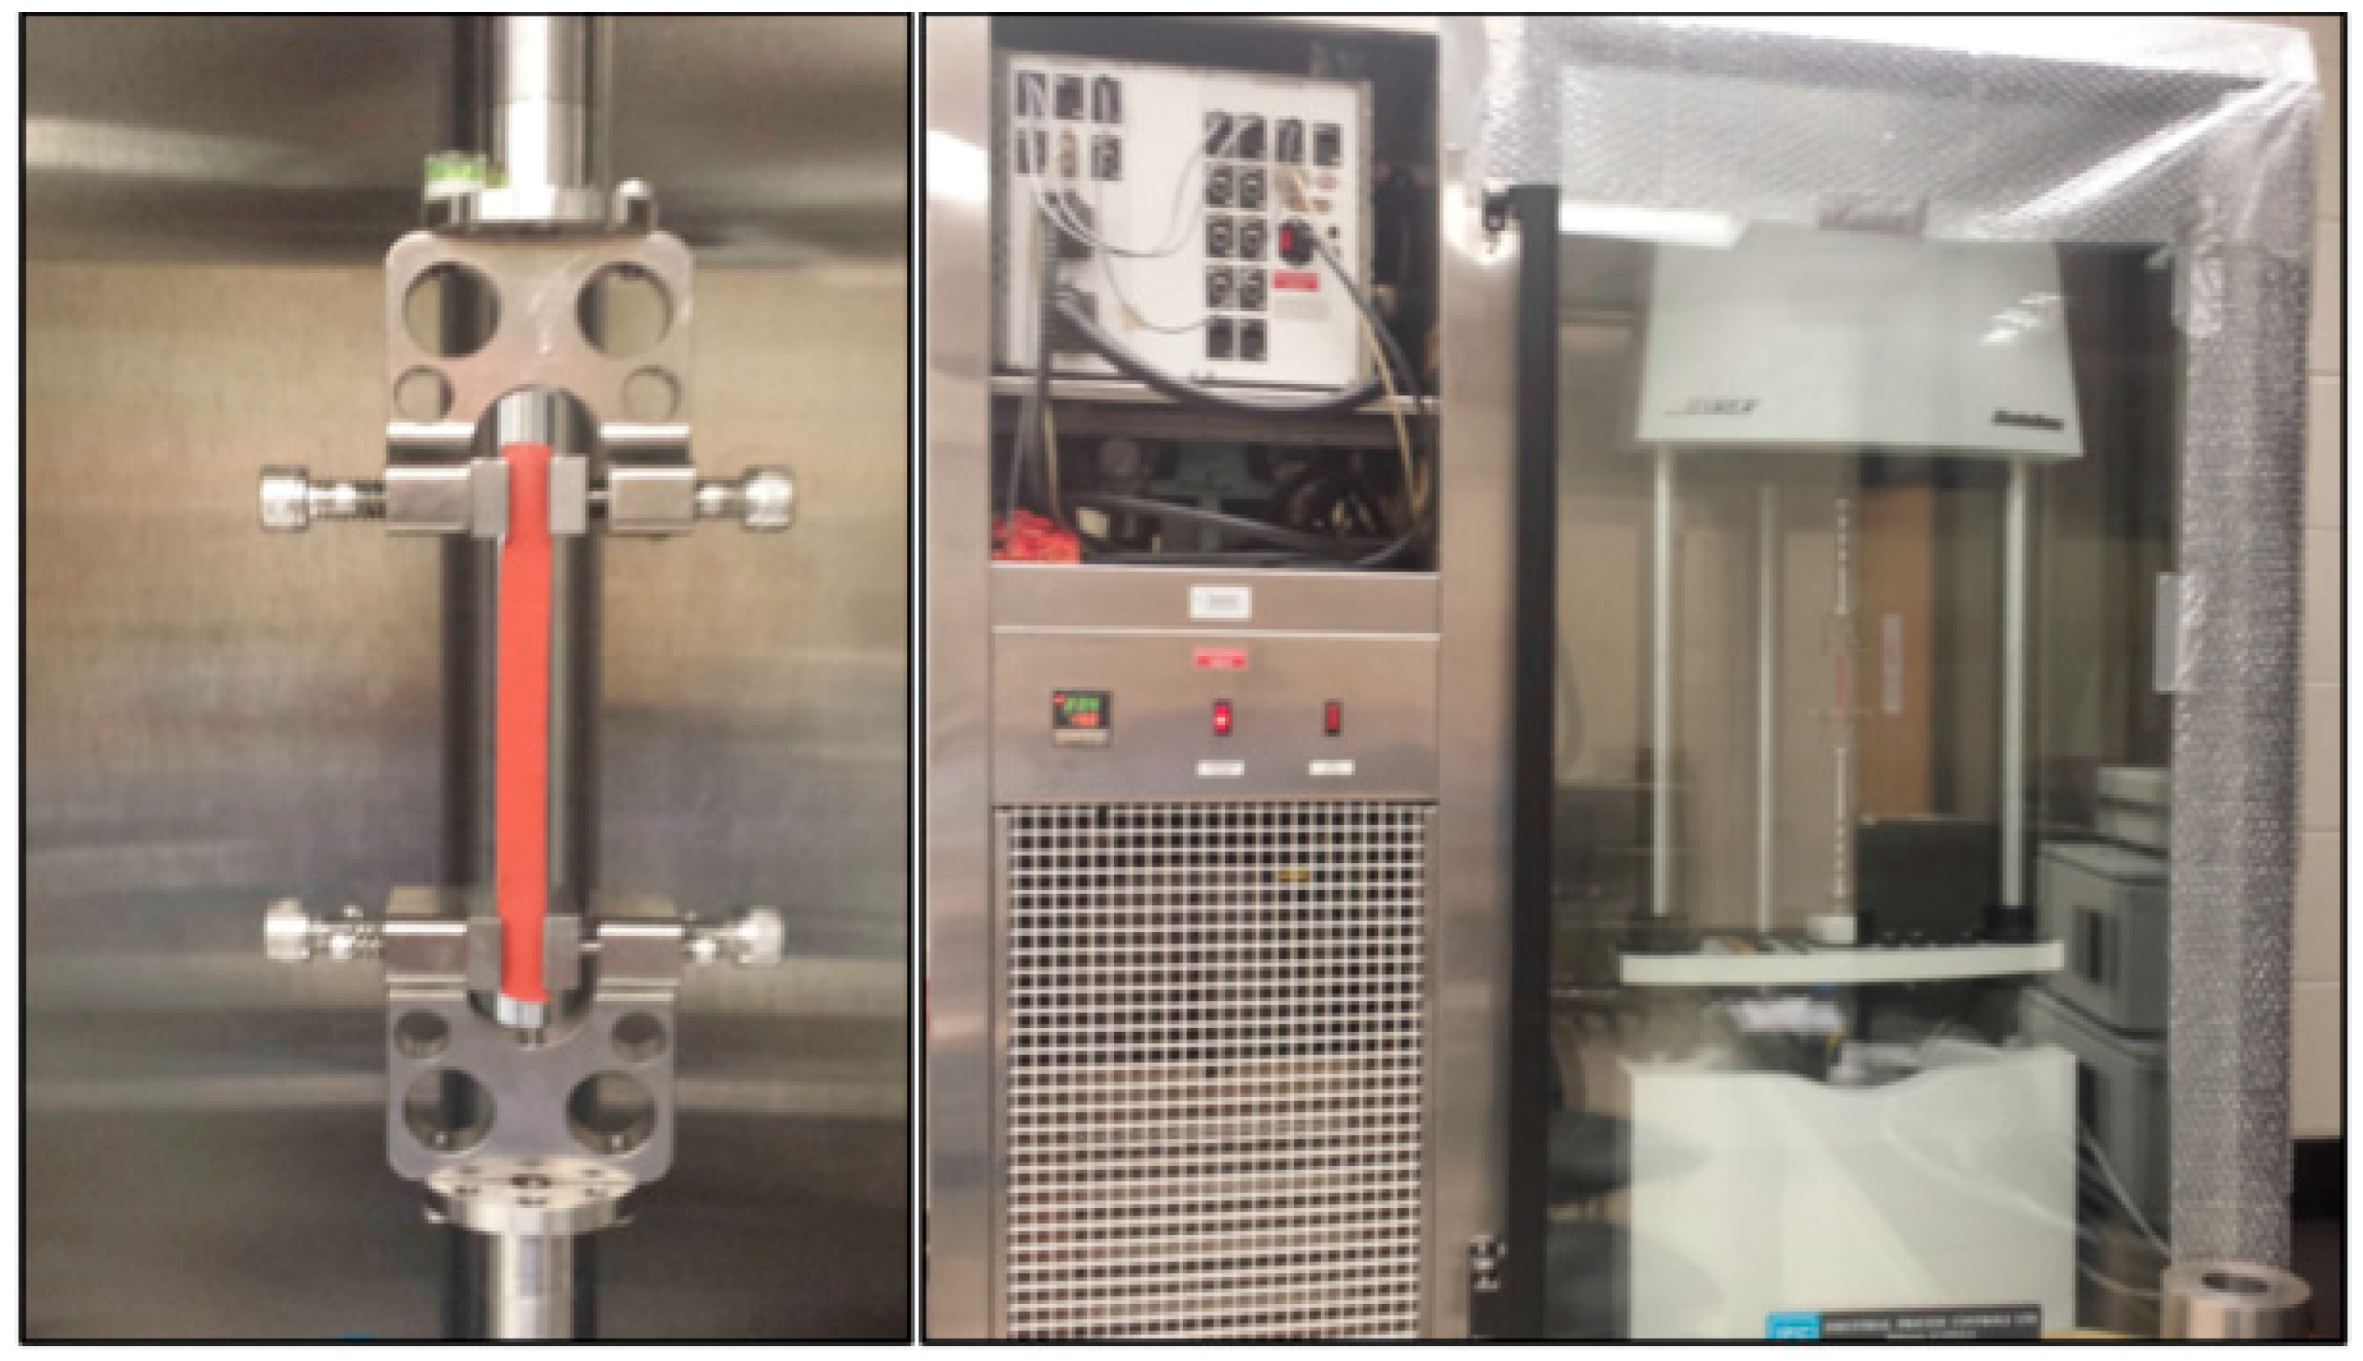
Figure 8.
Adhesive bond energy between rubbers and aggregates materials.

Figure 9.
Measured coefficient of friction vs. the adhesive bond energy for (a) limestone and gabbro slabs separately (b) both gabbro and limestone slabs.
Figure 9.
Measured coefficient of friction vs. the adhesive bond energy for (a) limestone and gabbro slabs separately (b) both gabbro and limestone slabs.
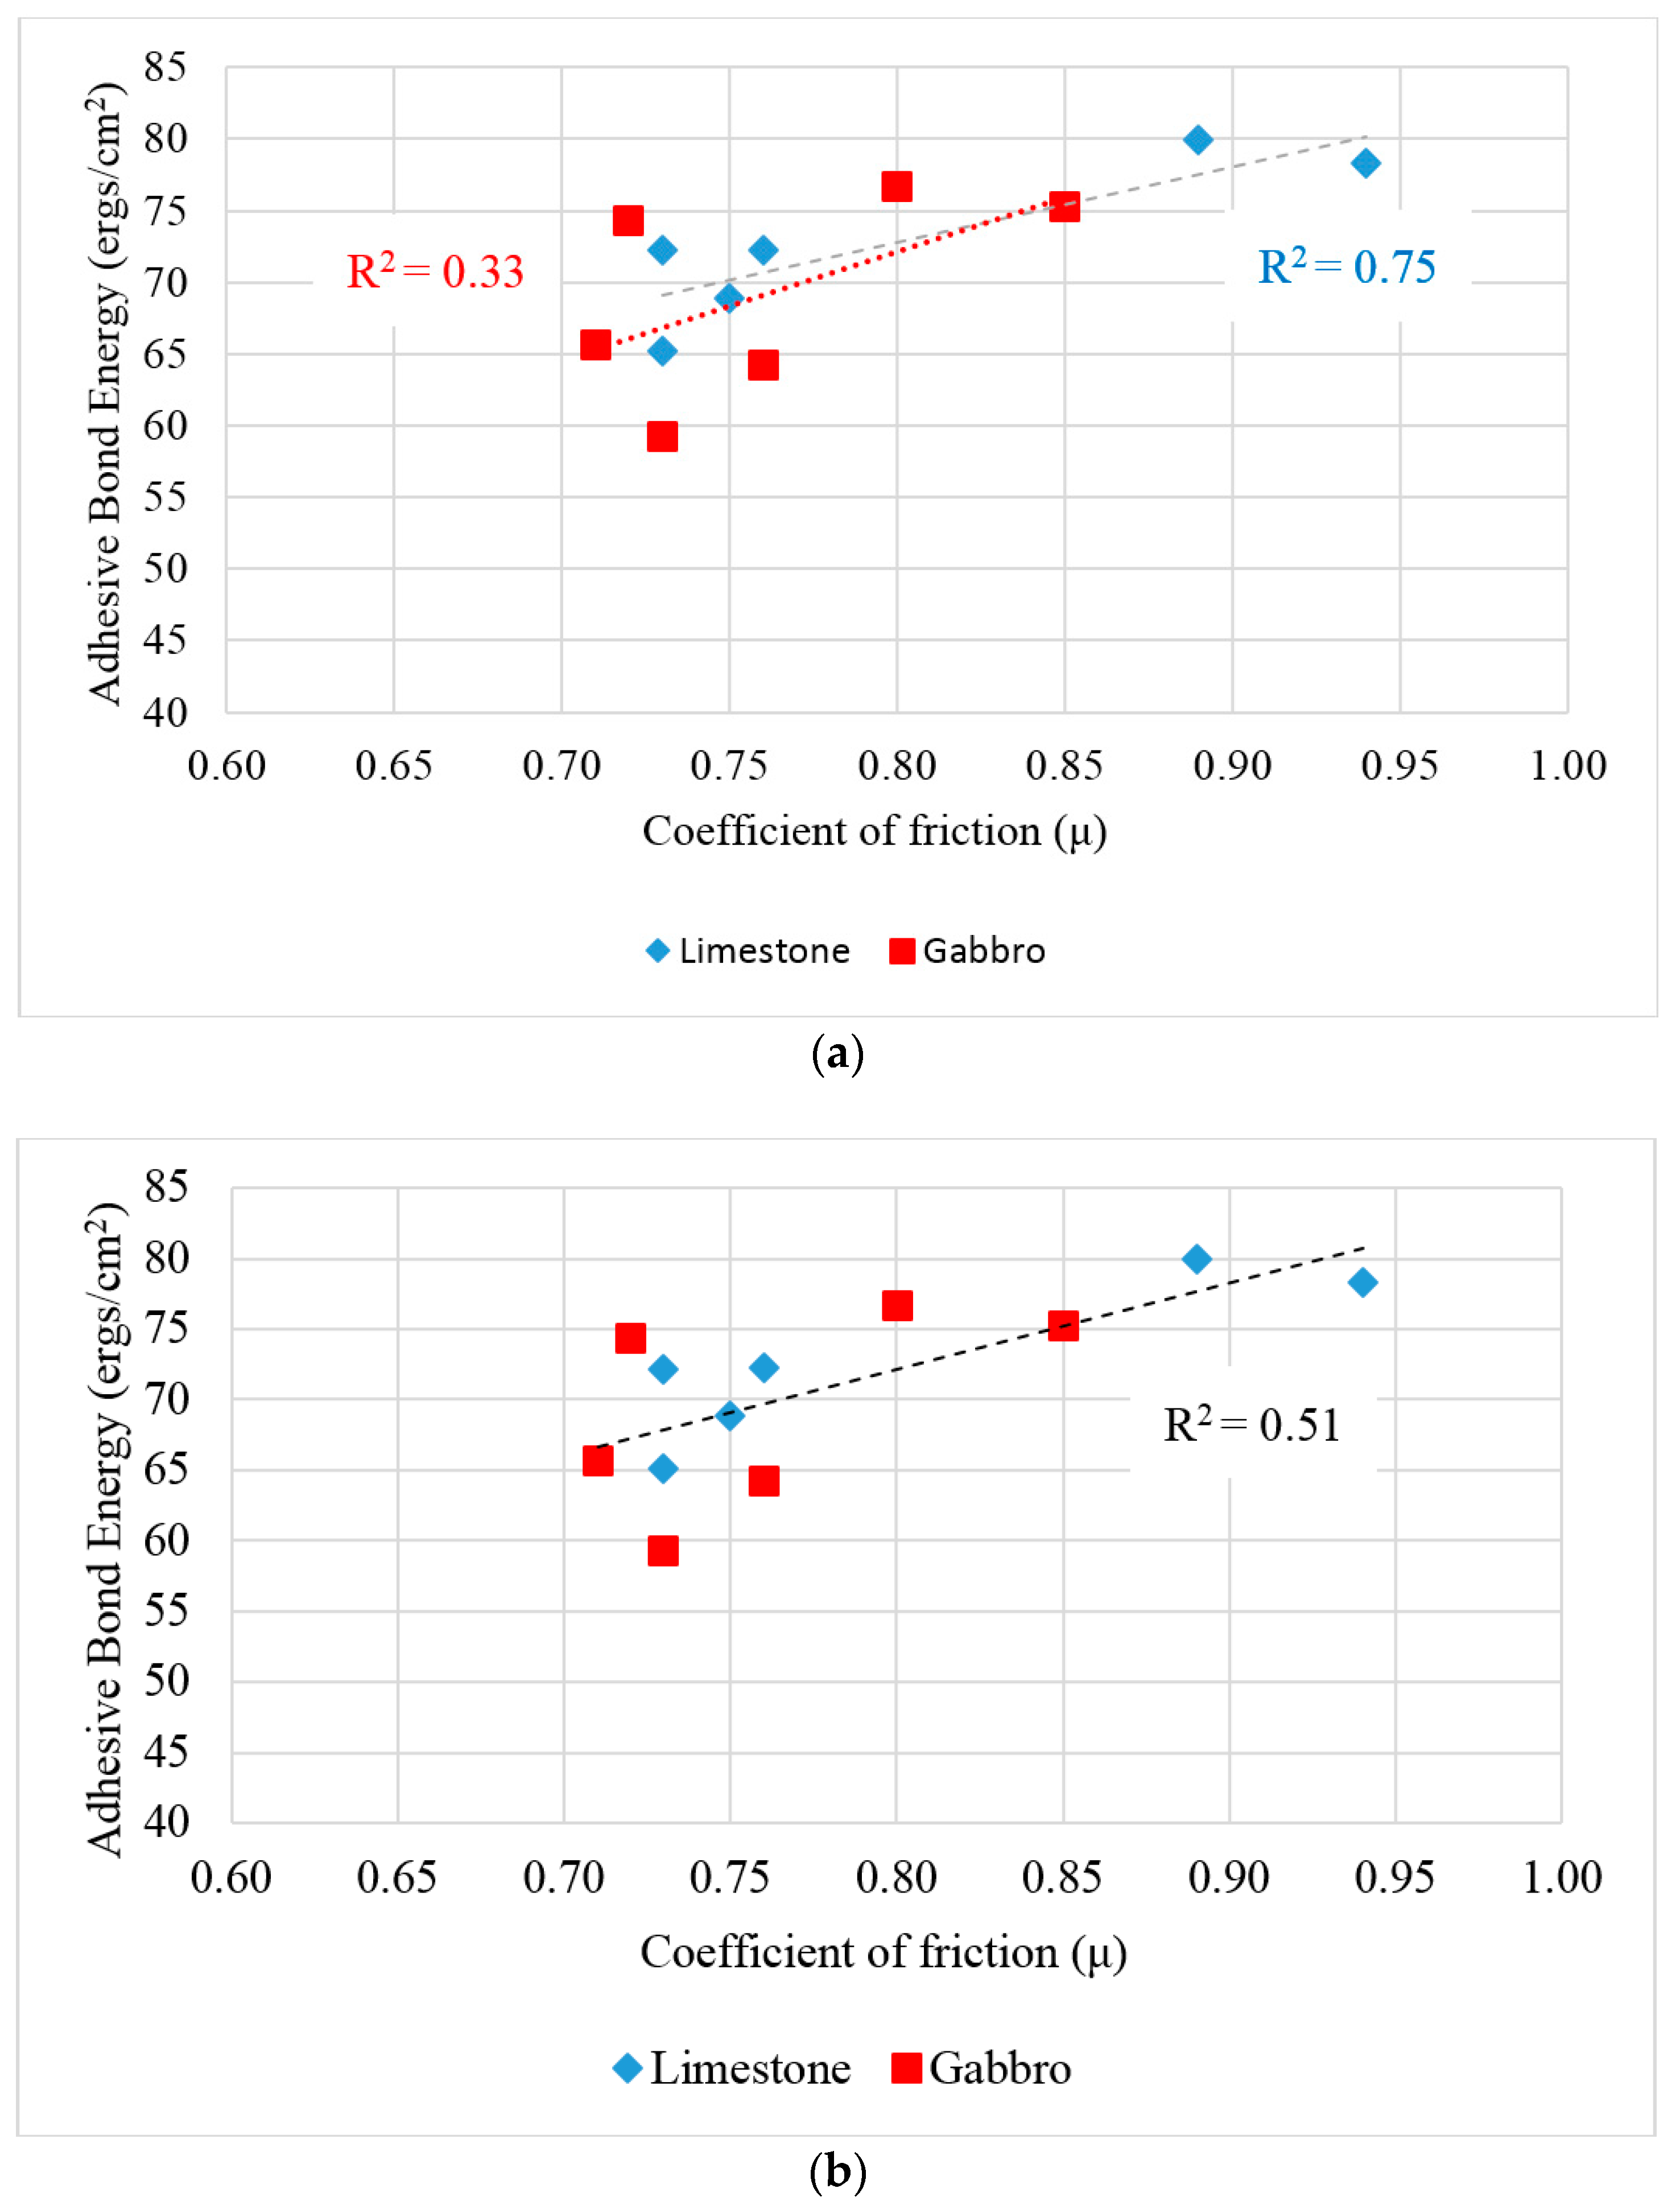
Figure 10.
E* Master curves of the test rubber materials.
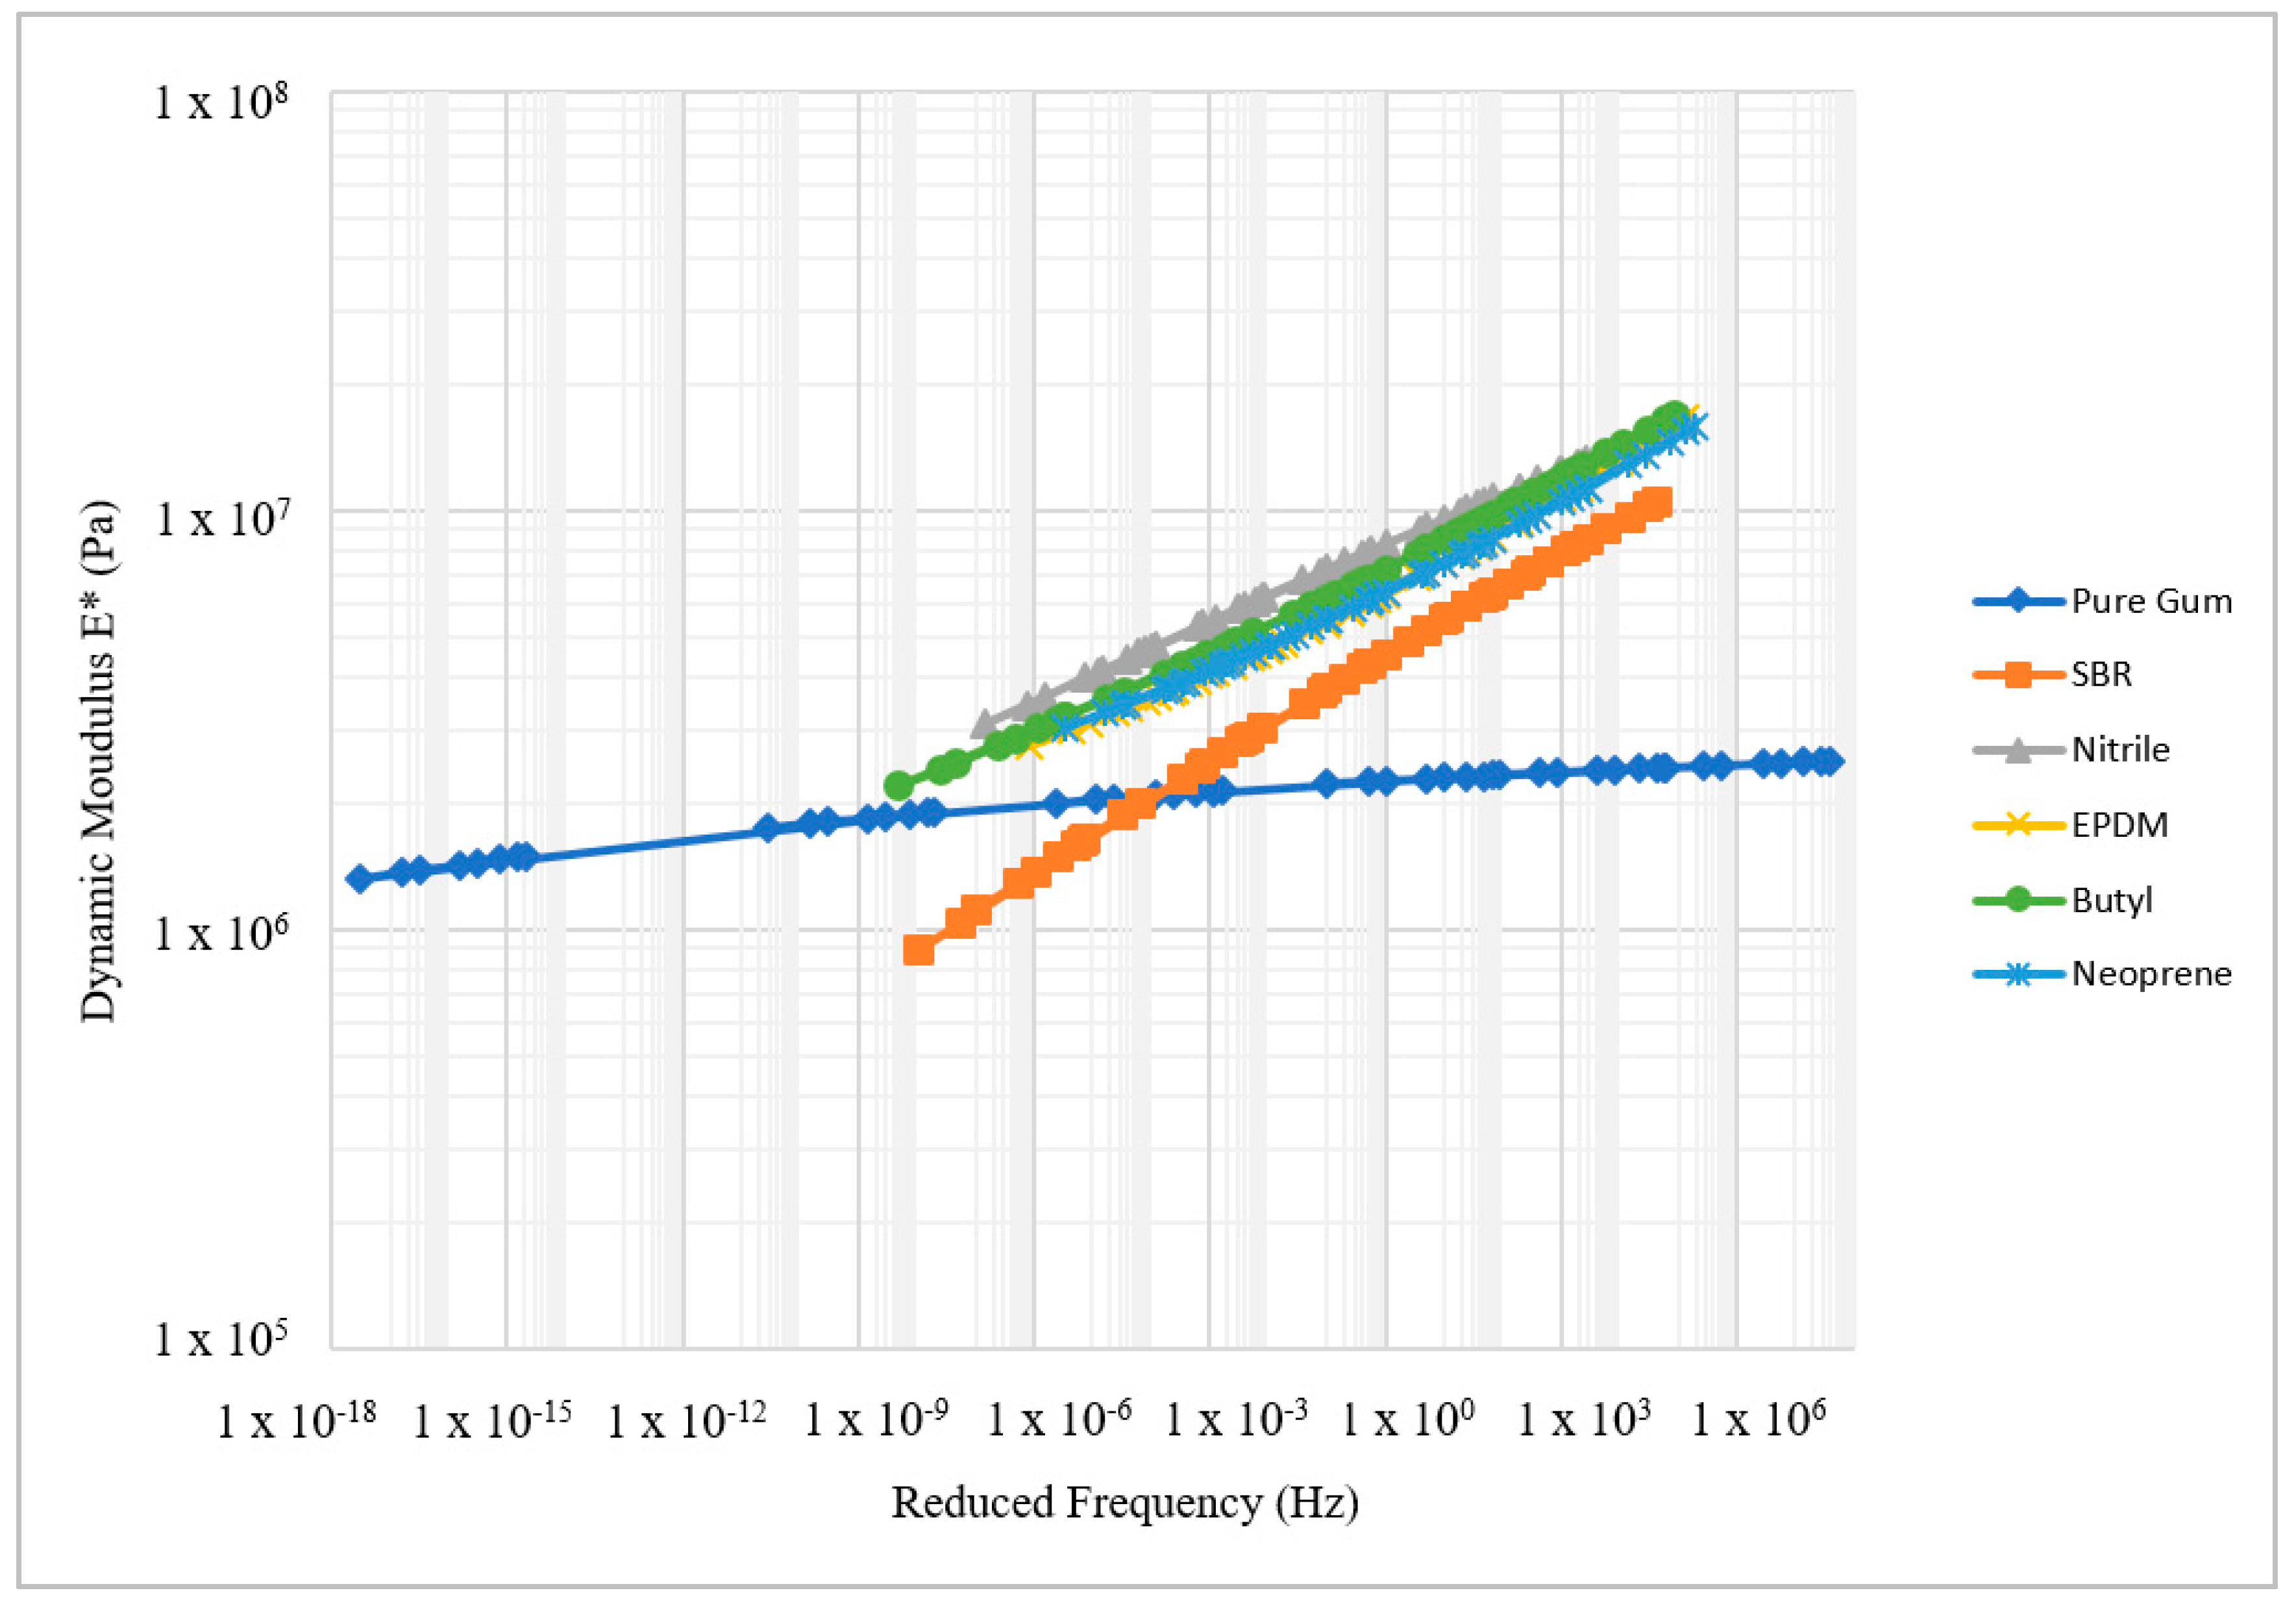
Figure 11.
Relationship between the rubber dynamic modulus and the coefficient of friction.


Table 1.
Surface free energy components for selected probe liquids (ergs/cm2).
| Probe Liquid | γLW | γ+ | γ− | γTotal |
|---|---|---|---|---|
| Water | 21.80 | 25.50 | 25.50 | 72.80 |
| Glycerol | 34.00 | 3.92 | 57.40 | 64.00 |
| Formamide | 39.00 | 2.28 | 39.60 | 58.00 |
| Methylene Iodide | 50.80 | 0.00 | 0.00 | 50.80 |
| Ethylene Glycol | 29.00 | 1.92 | 47.00 | 47.99 |
Table 2.
Rubber properties as provided by the manufacturer.
| Rubber Type | Tensile Strength (PSI) | Elongation (%) | Composition | Durometer |
|---|---|---|---|---|
| Pure Gum | 3000 | 600 | Organic Gum | 40 A Nominal |
| SBR | 800 | 250 | Styrene Butadiene | 65 Shore A |
| EPDM | 800 | 400 | Synthetic | 60 A Nominal |
| Nitrile | 950 | 250 | Synthetic | 50 A Nominal |
| Neoprene | 1000 | 220 | Synthetic | 60 A Nominal |
| Butyl | 1000 | 350 | Isobutylene Isoprene | 55 Shore A |
Table 3.
Aggregate gradation used for asphalt mixture slabs.
| Sieve Size | % Passing |
|---|---|
| 1.5″ | 100.0 |
| 1″ | 98.6 |
| 3/4″ | 88.2 |
| 1/2″ | 76.9 |
| 3/8″ | 68.9 |
| N4 | 47.1 |
| N8 | 26.5 |
| N16 | 15.8 |
| N30 | 10.5 |
| N50 | 7.9 |
| N100 | 6.1 |
| N200 | 4.2 |
| Pan | 0.0 |
Table 4.
Average contact angle between rubbers and probe liquids using Sessile drop device (degrees).
Table 4.
Average contact angle between rubbers and probe liquids using Sessile drop device (degrees).
| Probe Liquid | Water | Glycerol | Ethylene Glycol | Formamide | Diidomethane | |||||
|---|---|---|---|---|---|---|---|---|---|---|
| Rubber Type | Contact Angle | Std. Dev | Contact Angle | Std. Dev | Contact Angle | Std. Dev | Contact Angle | Std. Dev | Contact Angle | Std. Dev |
| Pure gum | 89.47 | 0.69 | 120.18 | 0.86 | 87.14 | 0.74 | 83.03 | 1.21 | 67.43 | 0.76 |
| SBR | 100.98 | 0.86 | 101.28 | 1.47 | 87.16 | 1.05 | 84.19 | 0.66 | 71.74 | 0.55 |
| Nitrile | 89.04 | 0.74 | 94.77 | 0.82 | 84.32 | 0.89 | 90.35 | 0.99 | 63.03 | 1.04 |
| EPDM | 108.36 | 0.74 | 112.45 | 0.67 | 89.61 | 0.75 | 93.29 | 0.87 | 72.22 | 13.12 |
| Neoprene | 124.58 | 0.89 | 112.02 | 0.74 | 90.23 | 0.95 | 87.54 | 1.75 | 69.63 | 1.64 |
| Butyl | 111.32 | 0.96 | 117.02 | 1.21 | 92.49 | 0.71 | 107.16 | 0.93 | 64.43 | 0.98 |
Table 5.
Measured surface energy of rubber materials using the Sessile drop device.
| Rubber | Surface Energy Components (ergs/cm2) | Standard Deviation (ergs/cm2) | |||||
|---|---|---|---|---|---|---|---|
| γLW | γ+ | γ− | γTotal | γLW | γ+ | γ− | |
| Pure gum | 21.21 | 0.00 | 2.26 | 21.21 | 0.44 | 0.00 | 0.42 |
| SBR | 22.11 | 0.00 | 2.24 | 22.11 | 0.46 | 0.00 | 0.40 |
| Nitrile | 17.08 | 0.00 | 10.33 | 17.08 | 0.54 | 0.00 | 0.67 |
| EPDM | 16.77 | 0.00 | 0.35 | 16.77 | 1.53 | 0.00 | 0.17 |
| Neoprene | 15.30 | 0.00 | 0.00 | 15.30 | 0.69 | 0.00 | 0.00 |
| Butyl | 18.79 | 0.00 | 0.00 | 18.79 | 0.51 | 0.00 | 0.00 |
Table 6.
Measured surface energy of aggregates using universal sorption device (USD) device, (adapted from [20]).
Table 6.
Measured surface energy of aggregates using universal sorption device (USD) device, (adapted from [20]).
| Material | Surface Energy Components (ergs/cm2) | |||
|---|---|---|---|---|
| γLW | γ+ | γ− | γTotal | |
| Limestone | 69.35 | 0.28 | 1075.40 | 104.18 |
| Gabbro | 57.37 | 3.34 | 6277.96 | 346.85 |
© 2017 by the authors. Licensee MDPI, Basel, Switzerland. This article is an open access article distributed under the terms and conditions of the Creative Commons Attribution (CC BY) license (http://creativecommons.org/licenses/by/4.0/).
Share and Cite
MDPI and ACS Style
Al-Assi, M.; Kassem, E. Evaluation of Adhesion and Hysteresis Friction of Rubber–Pavement System. Appl. Sci. 2017, 7, 1029. https://doi.org/10.3390/app7101029
AMA Style
Al-Assi M, Kassem E. Evaluation of Adhesion and Hysteresis Friction of Rubber–Pavement System. Applied Sciences. 2017; 7(10):1029. https://doi.org/10.3390/app7101029
Chicago/Turabian StyleAl-Assi, Mohammad, and Emad Kassem. 2017. "Evaluation of Adhesion and Hysteresis Friction of Rubber–Pavement System" Applied Sciences 7, no. 10: 1029. https://doi.org/10.3390/app7101029
Note that from the first issue of 2016, this journal uses article numbers instead of page numbers. See further details here.