Interactions of Insolation and Shading on Ability to Use Fluorescence Imaging to Detect Fecal Contaminated Spinach

1
USDA (United States Department of Agriculture) Agricultural Research Service, Rm 21, Bldg 303, BARC-East, Powder Mill Rd., Beltsville, MD 20705, USA
2
Department of Agricultural and Biosystems Engineering, Yuma Agricultural Center, University of Arizona, 6425 W. 8th St., Yuma, AZ 85364, USA
*
Author to whom correspondence should be addressed.
Appl. Sci. 2017, 7(10), 1041; https://doi.org/10.3390/app7101041
Submission received: 29 September 2017
/
Accepted: 10 October 2017
/
Published: 12 October 2017
(This article belongs to the Special Issue Hyperspectral Chemical Imaging for Food Authentication)
Abstract
:Fecal contamination of produce in fields is a recognized food safety risk, and it is a requirement that fields be surveyed for evidence of fecal contamination. It may be possible to increase the efficacy of such surveys using imaging techniques that rely on detection of fluorescence responses of fecal material to UV excitation. However, fluorescence responses are easily masked by ambient illumination. This study investigated the potential of using a shroud to reduce the impact of ambient illumination on responses measured using relatively inexpensive optical components. During periods of near peak insolation, even with full shrouding, results indicate that reliable detection would be problematic. Towards dusk, effective imaging could be accomplished even with a gap of 250 cm at the bottom of the shroud. Results suggest that imaging using relatively inexpensive components could provide the basis for detection of fecal contamination in produce fields if surveys were conducted during dawn or dusk, or at night.
1. Introduction
Pathogens of fecal origin are the cause of most food-borne illnesses and fecal contamination of produce fields is a recognized food safety risk. An accepted practice is to survey fields for fecal contamination and signs of animal intrusion. Our laboratory has developed a number of optical techniques with the goal of augmenting such surveys. The most sensitive optical techniques rely on detecting fluorescence responses of materials in feces to UV or violet illumination. However, the low quantum yields of fluorescence responses means that the responses are generally masked by ambient illumination. The purpose of this study was to investigate the possibility of using a shroud to mitigate solar illumination and thereby facilitate detection of fluorescence responses using relatively inexpensive optical instrumentation.
According to the Centers of Disease Control and Prevention (CDC), 128,000 Americans are hospitalized and 3000 die each year due to food-borne illness [1]. Leafy green produce is estimated to be the source of 2.2 million annual incidents of food-borne illness, or 22% of all incidents of food-borne illness [2]. Leafy green produce presents a particular problem with regards to food safety as it is commonly consumed raw, with no kill-step such as cooking or pasteurization. Produce fields are at the apex of the food distribution chain, and any mitigation at this level will thus have the greatest potential impact on reducing outbreaks of food-borne illnesses. A number of mitigation strategies are commonly employed at the field level, including routine surveys of fields for signs of animal intrusion and fecal contamination [3,4]. Signs of animal intrusion are often used as part of surveys to help locate fecal materials left by animals. The importance of birds as a risk factor is receiving more attention as birds have been found to host an increasing number of human pathogens, and as birds often produce no signs of intrusion as they fly over and leave deposits behind. With no sign of intrusion, surveyors generally do not enter fields to check for such deposits. Mitigation strategies for birds include traditional use of scarecrows, loud noises, and, more recently, use of predatory birds as a deterrent [5,6]. An optical technique that allowed surveying entire fields for bird fecal contamination would be a significant improvement over current methods.
Our laboratory has investigated using both fluorescence and reflectance imaging techniques for detection of contaminants. Fluorescence responses to UV excitation have been used to detect fecal contamination on apples [7,8,9], cantaloupes [10], and spinach [11]; and for development of a handheld system to monitor the efficacy of cleaning and sanitation procedures in food processing facilities [12]. A hyperspectral system that uses a laser for illumination to allow capture of time-resolved fluorescence responses was modified for use in produce fields [8,13]. A particular advantage of the laser-based system is that the excitation energy is high enough so that ambient illumination is not an issue. The megawatt power of the expanded laser beam results in short term fluorescence responses that are magnitudes of order brighter than ambient sunlight. A system for use in produce fields that uses reflectance imaging as opposed to fluorescence imaging has also been developed [14]. The reflectance system utilizes images acquired at two different wavelengths. This system uses two cameras with a single lens to allow capture of registered images to facilitate use of transformations that include ratios or subtraction of images. There are concerns with these existing techniques. The laser-induced imaging system is costly and necessitates use of a high-power laser with corresponding safety concerns. The reflectance imaging system has lower sensitivity and has problems with false positives. This study was initiated to investigate the potential of using fluorescence imaging with an LED (light-emitting diode) light source for detection of fecal contamination in produce fields while using a shroud to mitigate effects of ambient sunlight.
2. Materials and Methods
To investigate interactions of insolation and shading on the ability to use fluorescence imaging to detect fecal contamination, a shroud was constructed that included a solid wooden top and vinyl drapery edges. A hyperspectral camera with a tunable filter and a 405 nm light source was mounted in the center of the wooden top. Hyperspectral data sets were acquired at different times of the day with different degrees of shading. Images were acquired of dairy manure placed on a spinach leaf, with both placed on a soil backdrop. The degree of shading was modified by controlling the height of the bottom of the drapes relative to ground height.
2.1. Hyperspectral Imaging System
The portable hyperspectral imaging system has been described in detail [12]. The system consists of a C-mount lens (Rainbow S16mm, 2/3”, Sensei Shoj Co., Osaka, Japan), a liquid–crystal tunable filter (400–720 nm, 20 nm FWHM (Full Width at Half Maximum); VariSpec VIS, Caliper Life Sciences, Waltham, MA, USA), back-correction optics (Channel Systems Inc., Pinawa, MB, Canada), and a monochrome GigE CCD camera (Prosilica GC1380, Allied Vision Technologies, Stadtroda, Germany). Due to the narrow viewing angle of the tunable filter, the filter was placed between the lens and the camera, which necessitated use of the back-correction optics to allow images to be appropriately focused on the camera CCD. Illumination for fluorescence imaging was provided by four 10-watt, 405 nm, LEDs (LED Engin, San Jose, CA, USA). LEDs were mounted in aluminum finned casings to help dissipate heat and could be switched on or off. Power for illumination was provided by an 18 V lithium-ion battery pack. Power for other components was provided by using a portion of the battery pack to provide 12 V.
2.2. Image Acquisition
Image data were acquired using an X61 Thinkpad laptop and an acquisition program written in Visual Basic version 6 (Microsoft, Seattle, WA, USA). The camera was connected to the laptop using the Ethernet port and the filter controller was connected using a USB port. The native resolution of the camera, 1360 H × 1024 V pixels, was binned by three to yield a final resolution of 453 × 341 pixels. Binning was used to reduce noise, and to increase light sensitivity and dynamic range of acquisitions. The acquisition software facilitated the automated capture of a sequence of images from 460 to 720 nm at 5 nm increments. Using a frame rate of 5 fps, a complete hyperspectral data set can be acquired in less than 45 s. The frame rate determines the maximum potential exposure time for individual images. The 12-bit resolution of images was preserved by storing images using the 16-bit TIF greyscale format.
The camera supports gain settings from 0 to 32, and the acquisition software allows individual gains to be set for each acquisition wavelength. For this study, gain routines were modified so that the gain across acquisition wavelengths was identical for a single hyperspectral data set; four data sets for each test circumstance were acquired with gains incremented for individual data sets from 20 to 32 in steps of 4. For more details concerning the acquisition program, please refer to a previous publication [12].
2.3. Image Analysis
Image data were analyzed using a software program written in-house using Visual Basic version 6 (Microsoft, Seattle, WA, USA). First the acquired sequence of TIF image files for a single hyperspectral data set was transformed into a single file in the ENVI (Harris Co., Melbourne, FL, USA) file format. For ENVI files, the program allows visualization of images at any selected wavelength. Any image within the data set can be used to define a region of interest (ROI) that is carried across wavelengths, and multiple ROI can be defined using an image at a particular wavelength or using images at different wavelengths. Spectra for all ROI are displayed on a single graph, and graph data can be saved to a spreadsheet file. These spectral graphs were used to determine spectral characteristics that might allow automated differentiation of targets from background and possible confounding objects.
2.4. Light Shroud
A platform was constructed using a sheet of plywood (1/4”, 4’ × 8’; 0.64 cm, 1.2 × 2.4 m) supported along the edges using wooden studs (2” × 4”; actual dimensions 3.8 × 8.9 cm) cut to appropriate dimensions (Figure 1). Four 24” (61 cm) legs cut from studs were attached at the corners of the platform. A hole was cut in the center of the platform to accommodate the hyperspectral imaging system; the edges around the system were sealed using black plastic panels and tape. Drapes along the edges of the platform were cut from black vinyl fabric. Drapes were attached to the platform with the black side facing inward using staples. Drapes were overlapped about 400 cm on vertical edges and at least 20 cm along the edges of the platform. The height of the drapes relative to ground was adjusted by taping the bottom edge of fabric drapes to the drape areas above.
2.5. Experimental Protocol
The goal of the experimental trials was to determine the relationship among ambient illumination, degree of shrouding, and ability to detect fecal contamination using fluorescence imaging. Trials were to be conducted in Beltsville, MD and a spreadsheet designed to calculate insolation by location, date, and time of day was used to determine times to conduct trials [15]. Measurements were made at three time points: near peak insolation (solar noon), when insolation was about 30% of the maximum value (near sunset), and at night (at least 1 h after sunset). As most leafy green produce grown in the USA is grown in or around Yuma, AZ or Salinas, CA, the spreadsheet was used to relate insolation values for Beltsville to these growing regions.
The test target consisted of a tray containing soil with a spinach leaf purchased from a local grocery store placed in the center of the imaging area. A teaspoon was used to put a dollop of dairy manure collected from the USDA Beltsville dairy in the center of the leaf. New spinach leaves were used at each time point due to concerns that drying over time might affect measurements. Three shroud heights were tested: at ground level, about 100 cm above ground, and about 250 cm above ground. Replicate hyperspectral data sets were collected for each test condition.
3. Results and Discussion
3.1. Goals
The primary goal of this project was to determine if spectral response characteristics could be identified that might allow development of commercial systems for detecting fecal contamination in produce fields using fluorescence imaging and low intensity UV or violet illumination. Goals did not include development and testing of detection algorithms. The ultimate goal was to reduce the potential cost of a commercial system to survey produce fields for fecal contamination. As fluorescence responses of feces to UV excitation are easily masked by solar illumination, test conditions included making measurements in low or no solar light conditions. Growers commonly conduct operations in fields at night, so a requirement that field surveys be conducted at night is not particularly onerous.
Most leafy greens are grown around Yuma, AZ or Salinas, CA, and tests were to be conducted in Beltsville, MD. To facilitate interpretation of data relative to growing areas, graphs of insolation by time of day were constructed for Beltsville for the time data were to be collected and for growing areas during growing seasons. The general form of all graphs was similar with a broad peak during the middle portion of the solar day and sharp slopes near sunrise and sunset (Figure 2). Insolation values during the broad central peaks were generally similar across the tested situations; the major differences in graphs were the duration of the broad peaks, which is simply a function of seasonally dependent day length. The three selected testing times were meant to capture the impact of high insolation values that might occur during the broad peak times, the effects of low level ambient illumination that occurs near sunrise and sunset, and responses when solar illumination was largely absent.
The light shroud used for testing consisted of a platform and drapes. For a commercial survey system, a platform will be necessary to mount a camera or cameras, and a light source. The drapes were added to see if it might be possible to conduct field surveys during the day by mitigating light exposure. However, in commercial use an overlapping split curtain would likely be used instead of the drapes. The 100 cm test condition was meant to mimic the light blocking effectiveness that might result from using a split curtain with actual plants. The 250 cm test condition was meant to mimic a worst case scenario while using a split curtain. The zero cm test condition was meant to examine whether daylight use of a survey system might be possible using more aggressive light mitigation procedures and to better contrast the impact of raising the drape height.
3.2. Spectra
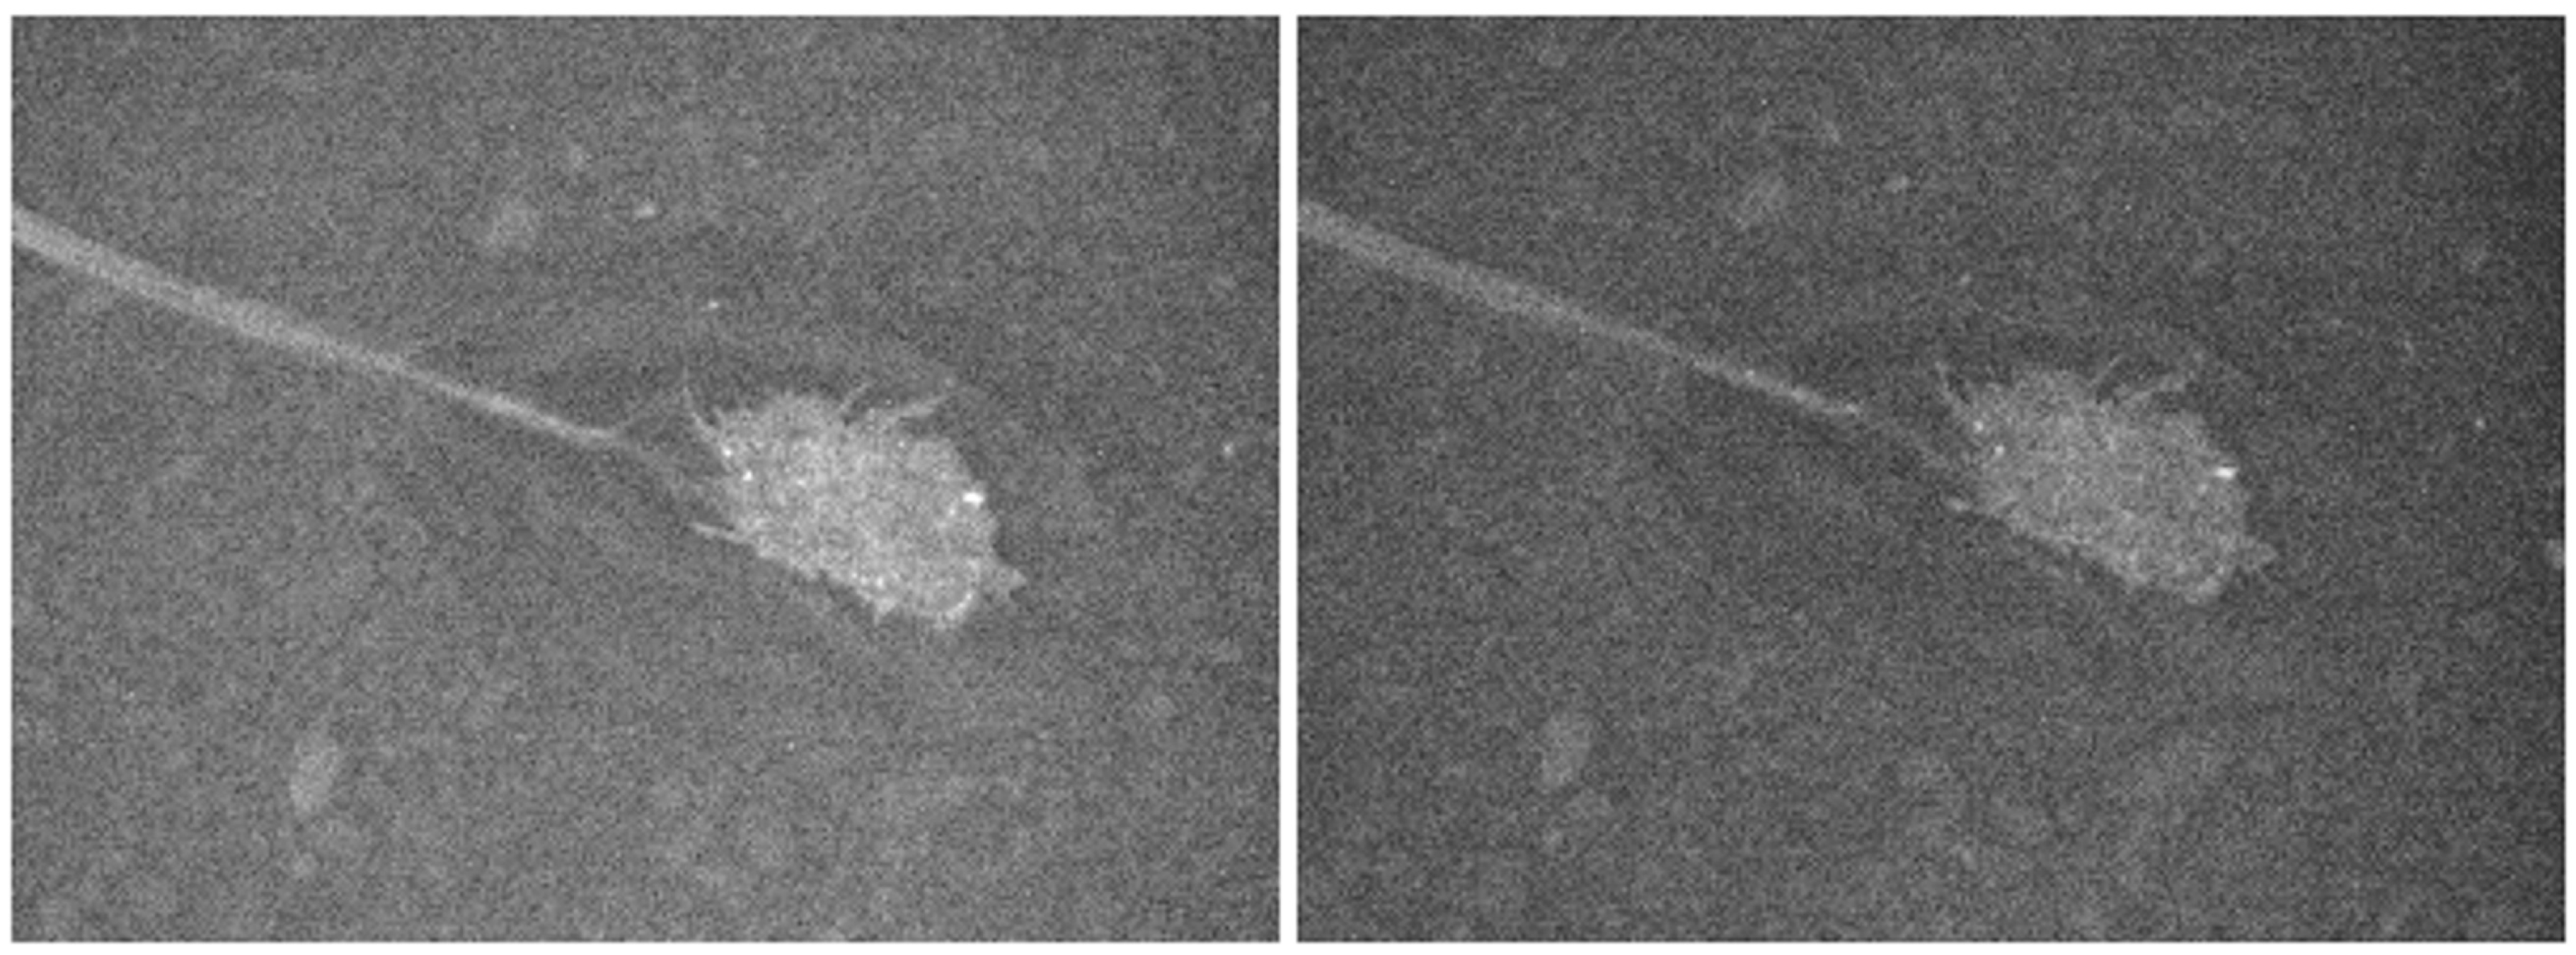
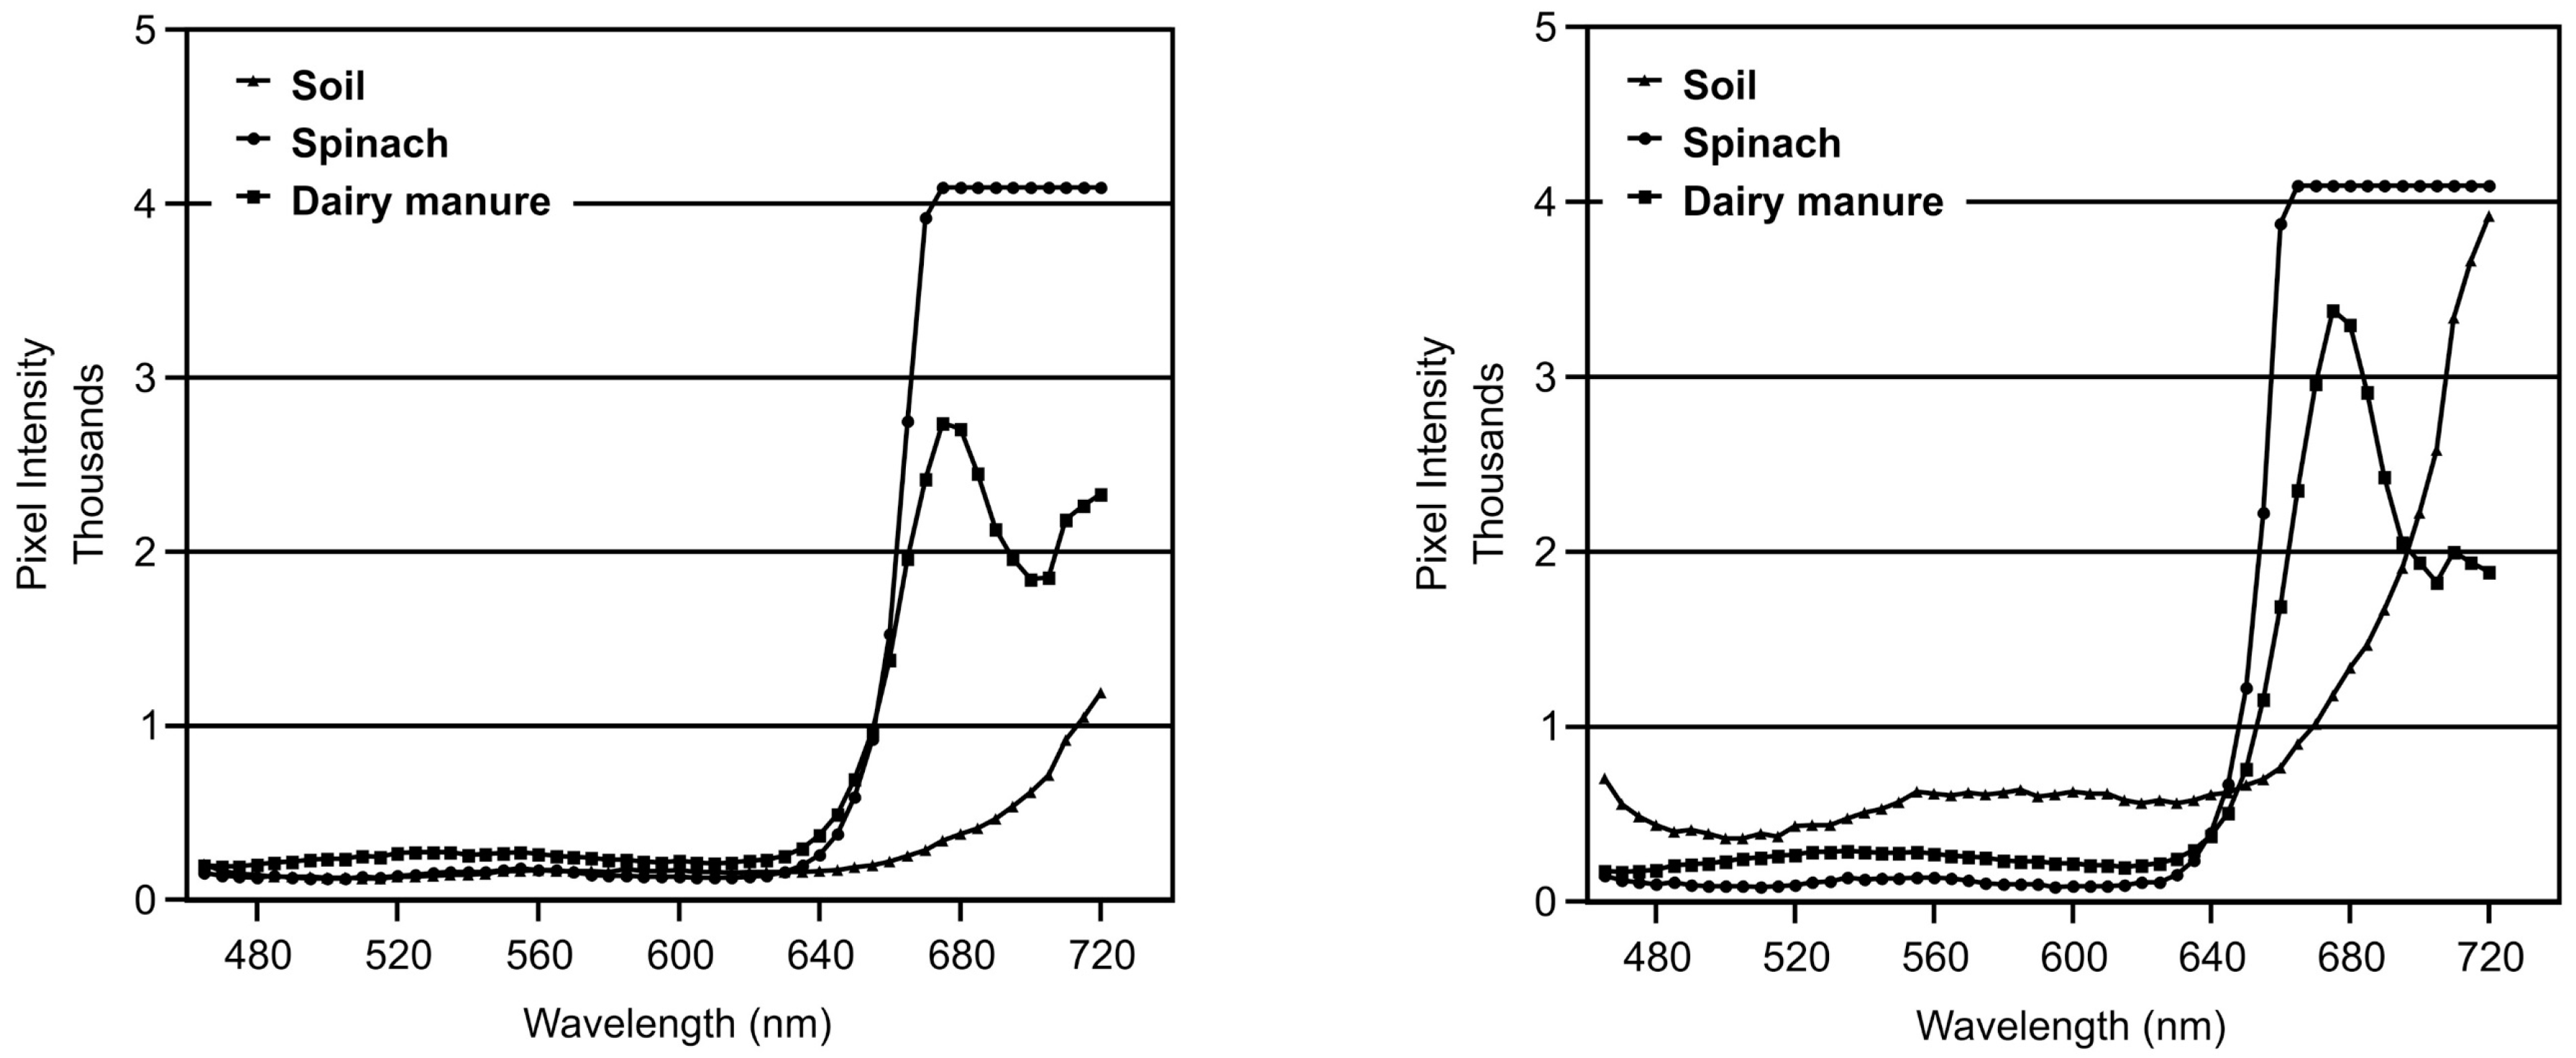
The measurements made after sunset represent the best case concerning effects of mitigating solar illumination and results for the three heights of the drapes were very similar. Presented are the spectra for the lowest and highest camera gains tested for the 250 cm drape condition (Figure 3). The gains are the two extremes of the range of gains tested and the 250 cm condition is theoretically the condition that would allow the most ambient light penetration. The two corresponding spectral graphs demonstrate the predominant spectral characteristics that, considering prior research, might be expected to be used to detect fecal material in a field of leafy greens (Figure 4). Past studies have shown that spectral characteristics of fluorescent responses for fecal materials are similar across animal species and that the optimal illumination wavelength for illumination is around 415 nm [16]. The 405-nm LEDs used for illumination in this study were selected as their emission peak was the closest available to 415 nm. The most obvious spectral characteristic in the fluorescence responses are the broad peaks in the red region. As expected, the response for the spinach leaf was greater than the response for the manure. However, the rise of the response begins at a slightly lower wavelength for the manure as compared to the spinach leaf. This difference has been identified previously and could be used in attempts to develop detection algorithms [16]. Another difference between spectra for manure and spinach is a relatively higher measured response of manure compared to spinach in the blue-green region. The maximum difference was at 525 nm. This also is a recognized phenomenon that has been used to develop very effective detection algorithms [11]. These effective detection algorithms also utilized responses measured in the red region. As the response of manure is higher in the blue and lower in the red compared to spinach, ratios of responses in the blue to responses in the red will amplify response measures for manure compared to spinach. To use the ratio method would require two cameras with appropriate filters. Results by gain suggest that a high gain be used for measurements at 525 nm and a lower gain be used for measurements for a wavelength in the red region. The lower gain in the red region is necessary so the saturation of the detector does not effectively eliminate the differential response of manure compared to spinach. Overall, results demonstrate that measurements at a single wavelength (e.g., 525 nm) might serve as the basis for developing a commercial system to survey produce fields at night.
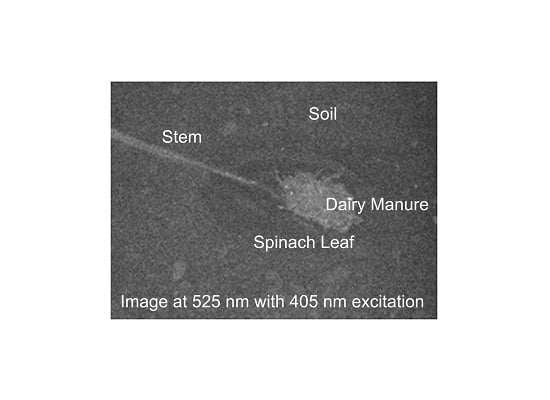
For measurements made near sunset, results were comparable to results at night except for the addition of a spectral response for soil (Figure 5 and Figure 6). Images at 525 nm demonstrated that intensity measurements varied across the soil; consequently, a bright area of soil was used when calculating spectra. The response characteristics of soil could complicate detection schemes. For example, if ratios alone were used for detection, areas of soil would have the highest calculated response. Thus, to successfully use ratios for detection of manure it would be necessary to eliminate soil areas from ratio calculations. Elimination could be accomplished using a mask that was created by setting a threshold in the red region where responses of both manure and spinach are greater than responses for soil.
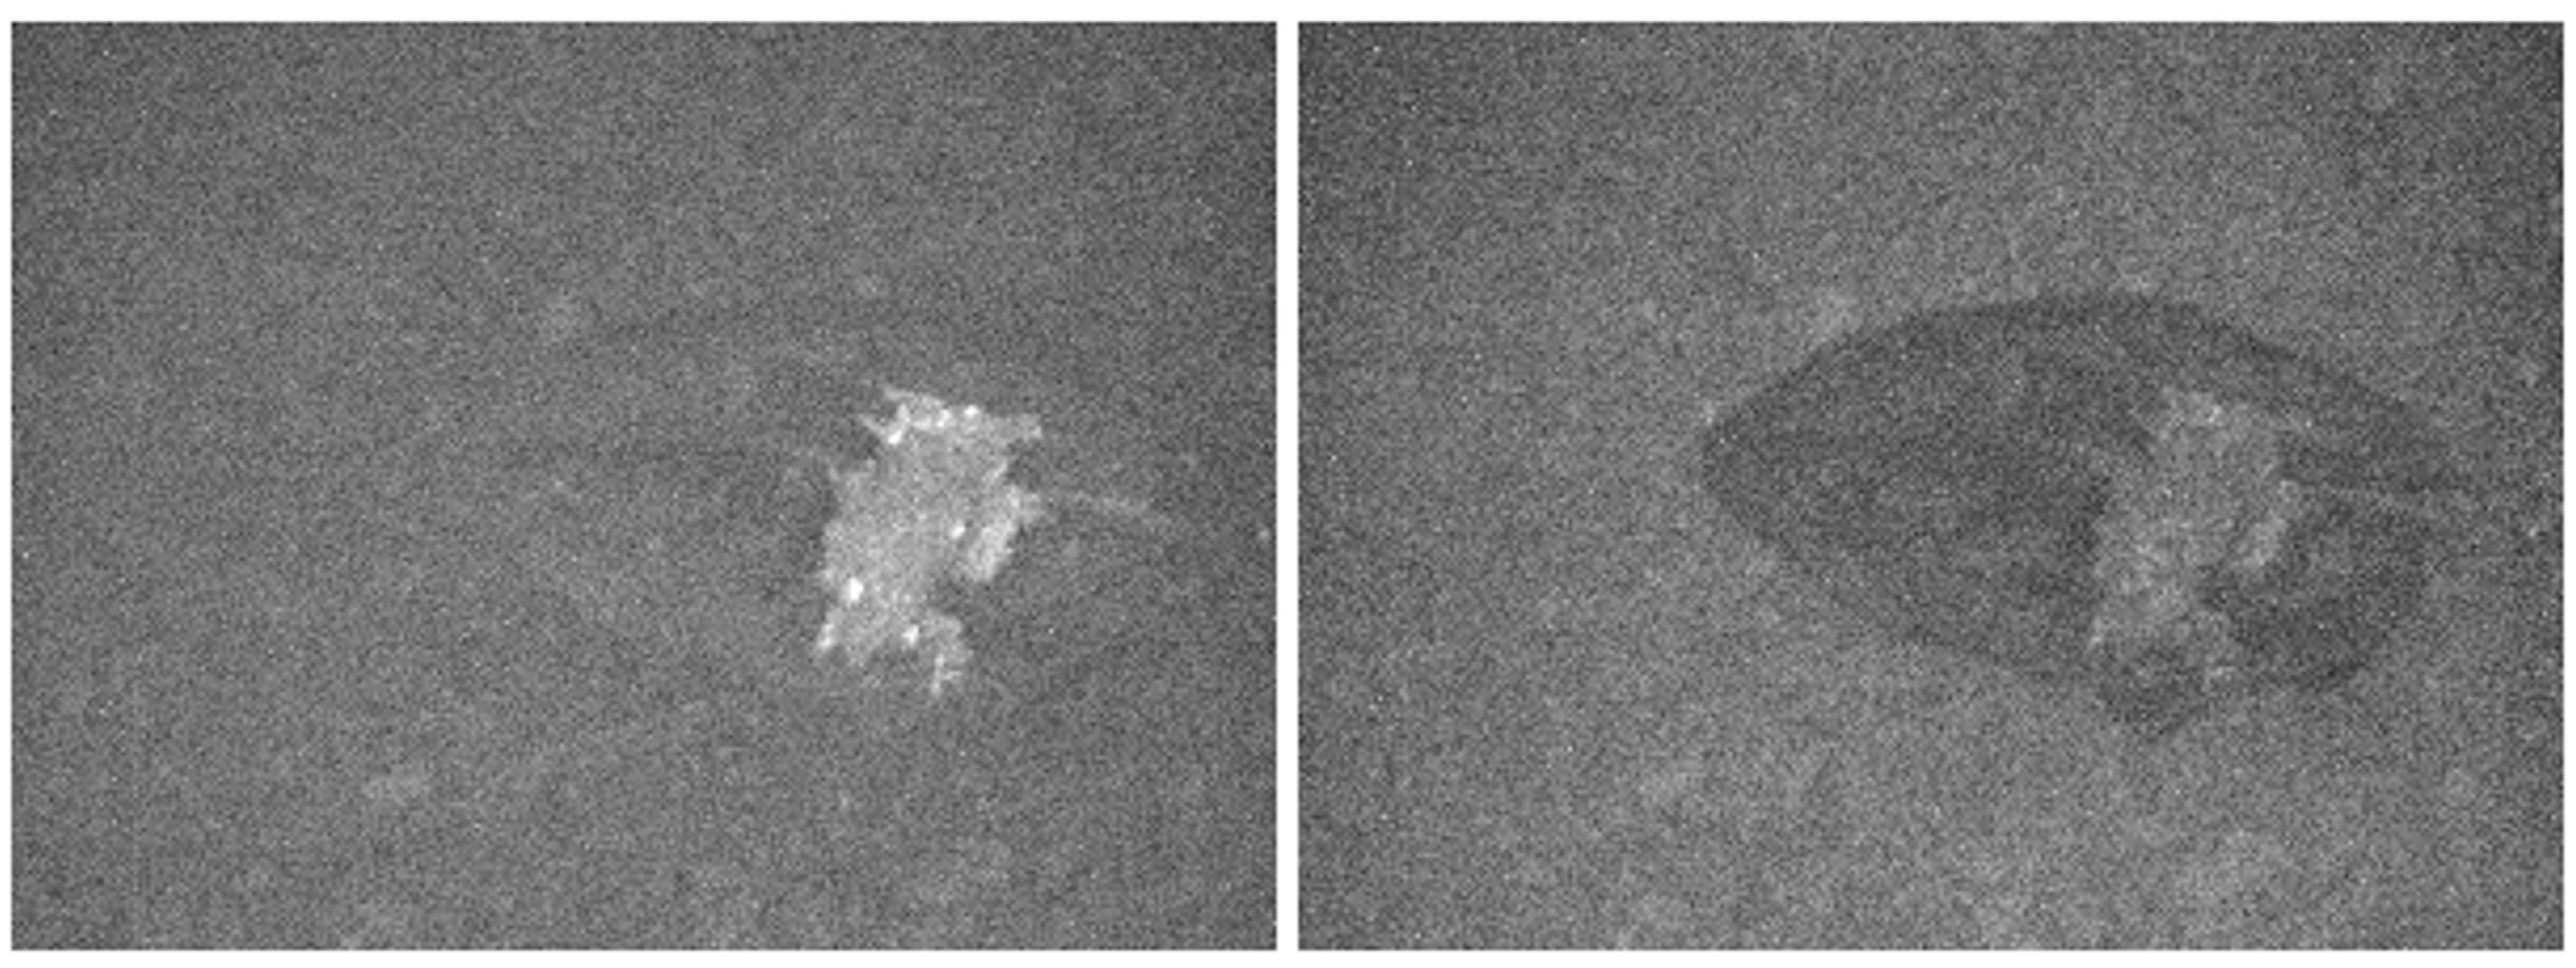
For measurements made in full daylight, results were less positive compared to the other lighting conditions (Figure 7 and Figure 8). For the 250 cm drape condition, images at higher gains were generally saturated. In lower gain images, the intensity of the measured response for soil areas generally exceeded response for the spinach leaf and for the manure. It would be impossible to reliably detect manure under these conditions. For the 100 cm drape condition, results were more positive. At the lowest gain, the intensity of the spectral response at 525 nm was just greater than the response of the spinach leaf and, by using a ratio calculation, the response differential could be marginally accentuated. For the zero drape condition, calculated spectra supported the ability to detect the manure. On a practical basis, detection of manure during field surveys under full daylight will require a more complex shading scheme or the use of a laser-based system that was designed to function in full daylight.
3.3. Implications
The results indicate that a monochrome camera with a 525 nm interference filter, along with a violet LED light source, could serve as the basis for developing a commercial system for surveying fields for fecal contamination. Results obtained near dusk were comparable to results at night, indicating that the system could be designed to work under low-light conditions as well as at night. Results obtained during full daylight suggested that developing a reliable system for use in full daylight using these components would be difficult or impossible. Surveying fields at night is reasonable given that night operations are already common.
Acknowledgments
This work was funded by the USDA. The USDA is an equal opportunity employer.
Author Contributions
Alan M. Lefcourt conceived of this project, conducted the experimental trials, and wrote the manuscript. Mark C. Siemens provided background information on practical considerations for use of the optics in commercial fields.
Conflicts of Interest
The authors declare no conflict of interest.
References
- Centers for Disease Control and Prevention (CDC). CDC Estimates of Foodborne Illness in the United States: Findings. 2011. Available online: https://www.cdc.gov/foodborneburden/pdfs/factsheet_a_findings_updated4-13.pdf (accessed on 5 September 2017).
- Painter, J.A.; Hoekstra, R.M.; Ayers, T.; Tauxe, R.V.; Braden, C.R.; Angulo, F.J. Attribution of foodborne illnesses, hospitalizations, and deaths to food commodities by using outbreaks data, United States, 1998–2008. Emerg. Infect. Dis. 2013, 19, 407–415. [Google Scholar] [CrossRef] [PubMed]
- Local Government Management Agency (LGMA). Commodity Specific Food Safety Guidelines for the Production and Harvest of Lettuce and Leafy Greens. 2013. Available online: http://www.lgma.ca.gov/wp-content/uploads/2014/09/California-LGMA-metrics-08-26-13-Final.pdf (accessed on 31 August 2017).
- Jay-Russell, M.T. What is the Risk from Wild Animals in Food-Borne Pathogen Contamination of Plants? CAB Rev. 2013, 8, 1–16. [Google Scholar] [CrossRef]
- Gil, M.I.; Selma, M.V.; Suslow, T.; Jacxsens, L.; Uyttendaele, M.; Allende, A. Pre-and Postharvest Preventive Measures and Intervention Strategies to Control Microbial Food Safety Hazards of Fresh Leafy Vegetables. Crit. Rev. Food Sci. Nutr. 2015, 55, 453–468. [Google Scholar] [CrossRef] [PubMed]
- Navarro-Gonzalez, N.; Jay-Russell, M.T. Use of Falconry to Deter Nuisance Birds in Leafy Greens Fields in Northern California. In Proceedings of the 27th Vertebrate Pest Conference, Newport Beach, CA, USA, 7–20 March 2016; Timm, R.M., Baldwin, R.A., Eds.; University of California, Davis: Davis, CA, USA, 2016; pp. 209–216. [Google Scholar]
- Yang, C.C.; Kim, M.S.; Kang, S.; Cho, B.K.; Chao, K.; Lefcourt, A.M.; Chan, D.E. Red to Far-Red Multispectral Fluorescence Image Fusion for Detection of Fecal Contamination on Apples. J. Food Eng. 2012, 108, 312–319. [Google Scholar] [CrossRef]
- Lefcourt, A.M.; Kim, M.S.; Chen, Y.R. Detection of Fecal Contamination on Apples with Nanosecond-Scale Time-Resolved Imaging of Laser-induced Fluorescence. Appl. Opt. 2005, 44, 1160–1170. [Google Scholar] [CrossRef] [PubMed]
- Lefcourt, A.M.; Kim, M.S.; Chen, Y.R. Automated Detection of Fecal Contamination of Apples by Multispectral Laser-induced Fluorescence Imaging. Appl. Opt. 2003, 42, 3935–3943. [Google Scholar] [CrossRef] [PubMed]
- Vargas, A.M.; Kim, M.S.; Tao, Y.; Lefcourt, A.M.; Chen, Y.R.; Luo, Y.; Song, Y.; Buchanan, R. Detection of Fecal Contamination on Cantaloupes using Hyperspectral Fluorescence Imagery. J. Food Sci. 2005, 70, e471–e476. [Google Scholar] [CrossRef]
- Tewey, K.J. Time-Resolved Hyperspectral Line-Scan Imaging of Pulsed-Laser Induced Fluorescence: Food Safety Inspection; University of Maryland: Baltimore, MD, USA, 2013. [Google Scholar]
- Lefcourt, A.M.; Wiederoder, M.S.; Liu, N.T.; Kim, M.S.; Lo, Y.M. Development of a Portable Hyperspectral Imaging System for Monitoring the Efficacy of Sanitation Procedures in Food Processing Facilities. J. Food Eng. 2013, 117, 59–66. [Google Scholar] [CrossRef]
- Lefcourt, A.M.; Kistler, R.; Gadsden, S.A.; Kim, M.S. Automated Cart with VIS/NIR Hyperspectral Reflectance and Fluorescence Imaging Capabilities. Appl. Sci. 2016, 7, 3. [Google Scholar] [CrossRef]
- Everard, C.D.; Kim, M.S.; Lee, H.; O’Donnell, C.P. Identifying Fecal Matter Contamination in Produce Fields using Multispectral Reflectance Imaging under Ambient Solar Illumination. In Proceedings of the SPIE Commercial + Scientific Sensing and Imaging, Baltimore, MD, USA, 17 May 2016; p. 986416. [Google Scholar]
- Jenkins, T.; Bolivar-Mendoza, G. Solar Time, Angles, and Irradiance Calculator: User Manual. 2014. Available online: http://aces.nmsu.edu/pubs/_circulars/CR674/welcome.html (accessed on 6 September 2017).
- Kim, M.S.; Lefcourt, A.M.; Chen, Y.R. Optimal Fluorescence Excitation and Emission Bands for Detection of Fecal Contamination. J. Food Prot. 2003, 66, 1198–1207. [Google Scholar] [CrossRef] [PubMed]
Figure 1.
Shroud with camera. Orange backpack is tethered to the camera and is used to house electronics when the camera system is used in a portable mode.
Figure 1.
Shroud with camera. Orange backpack is tethered to the camera and is used to house electronics when the camera system is used in a portable mode.
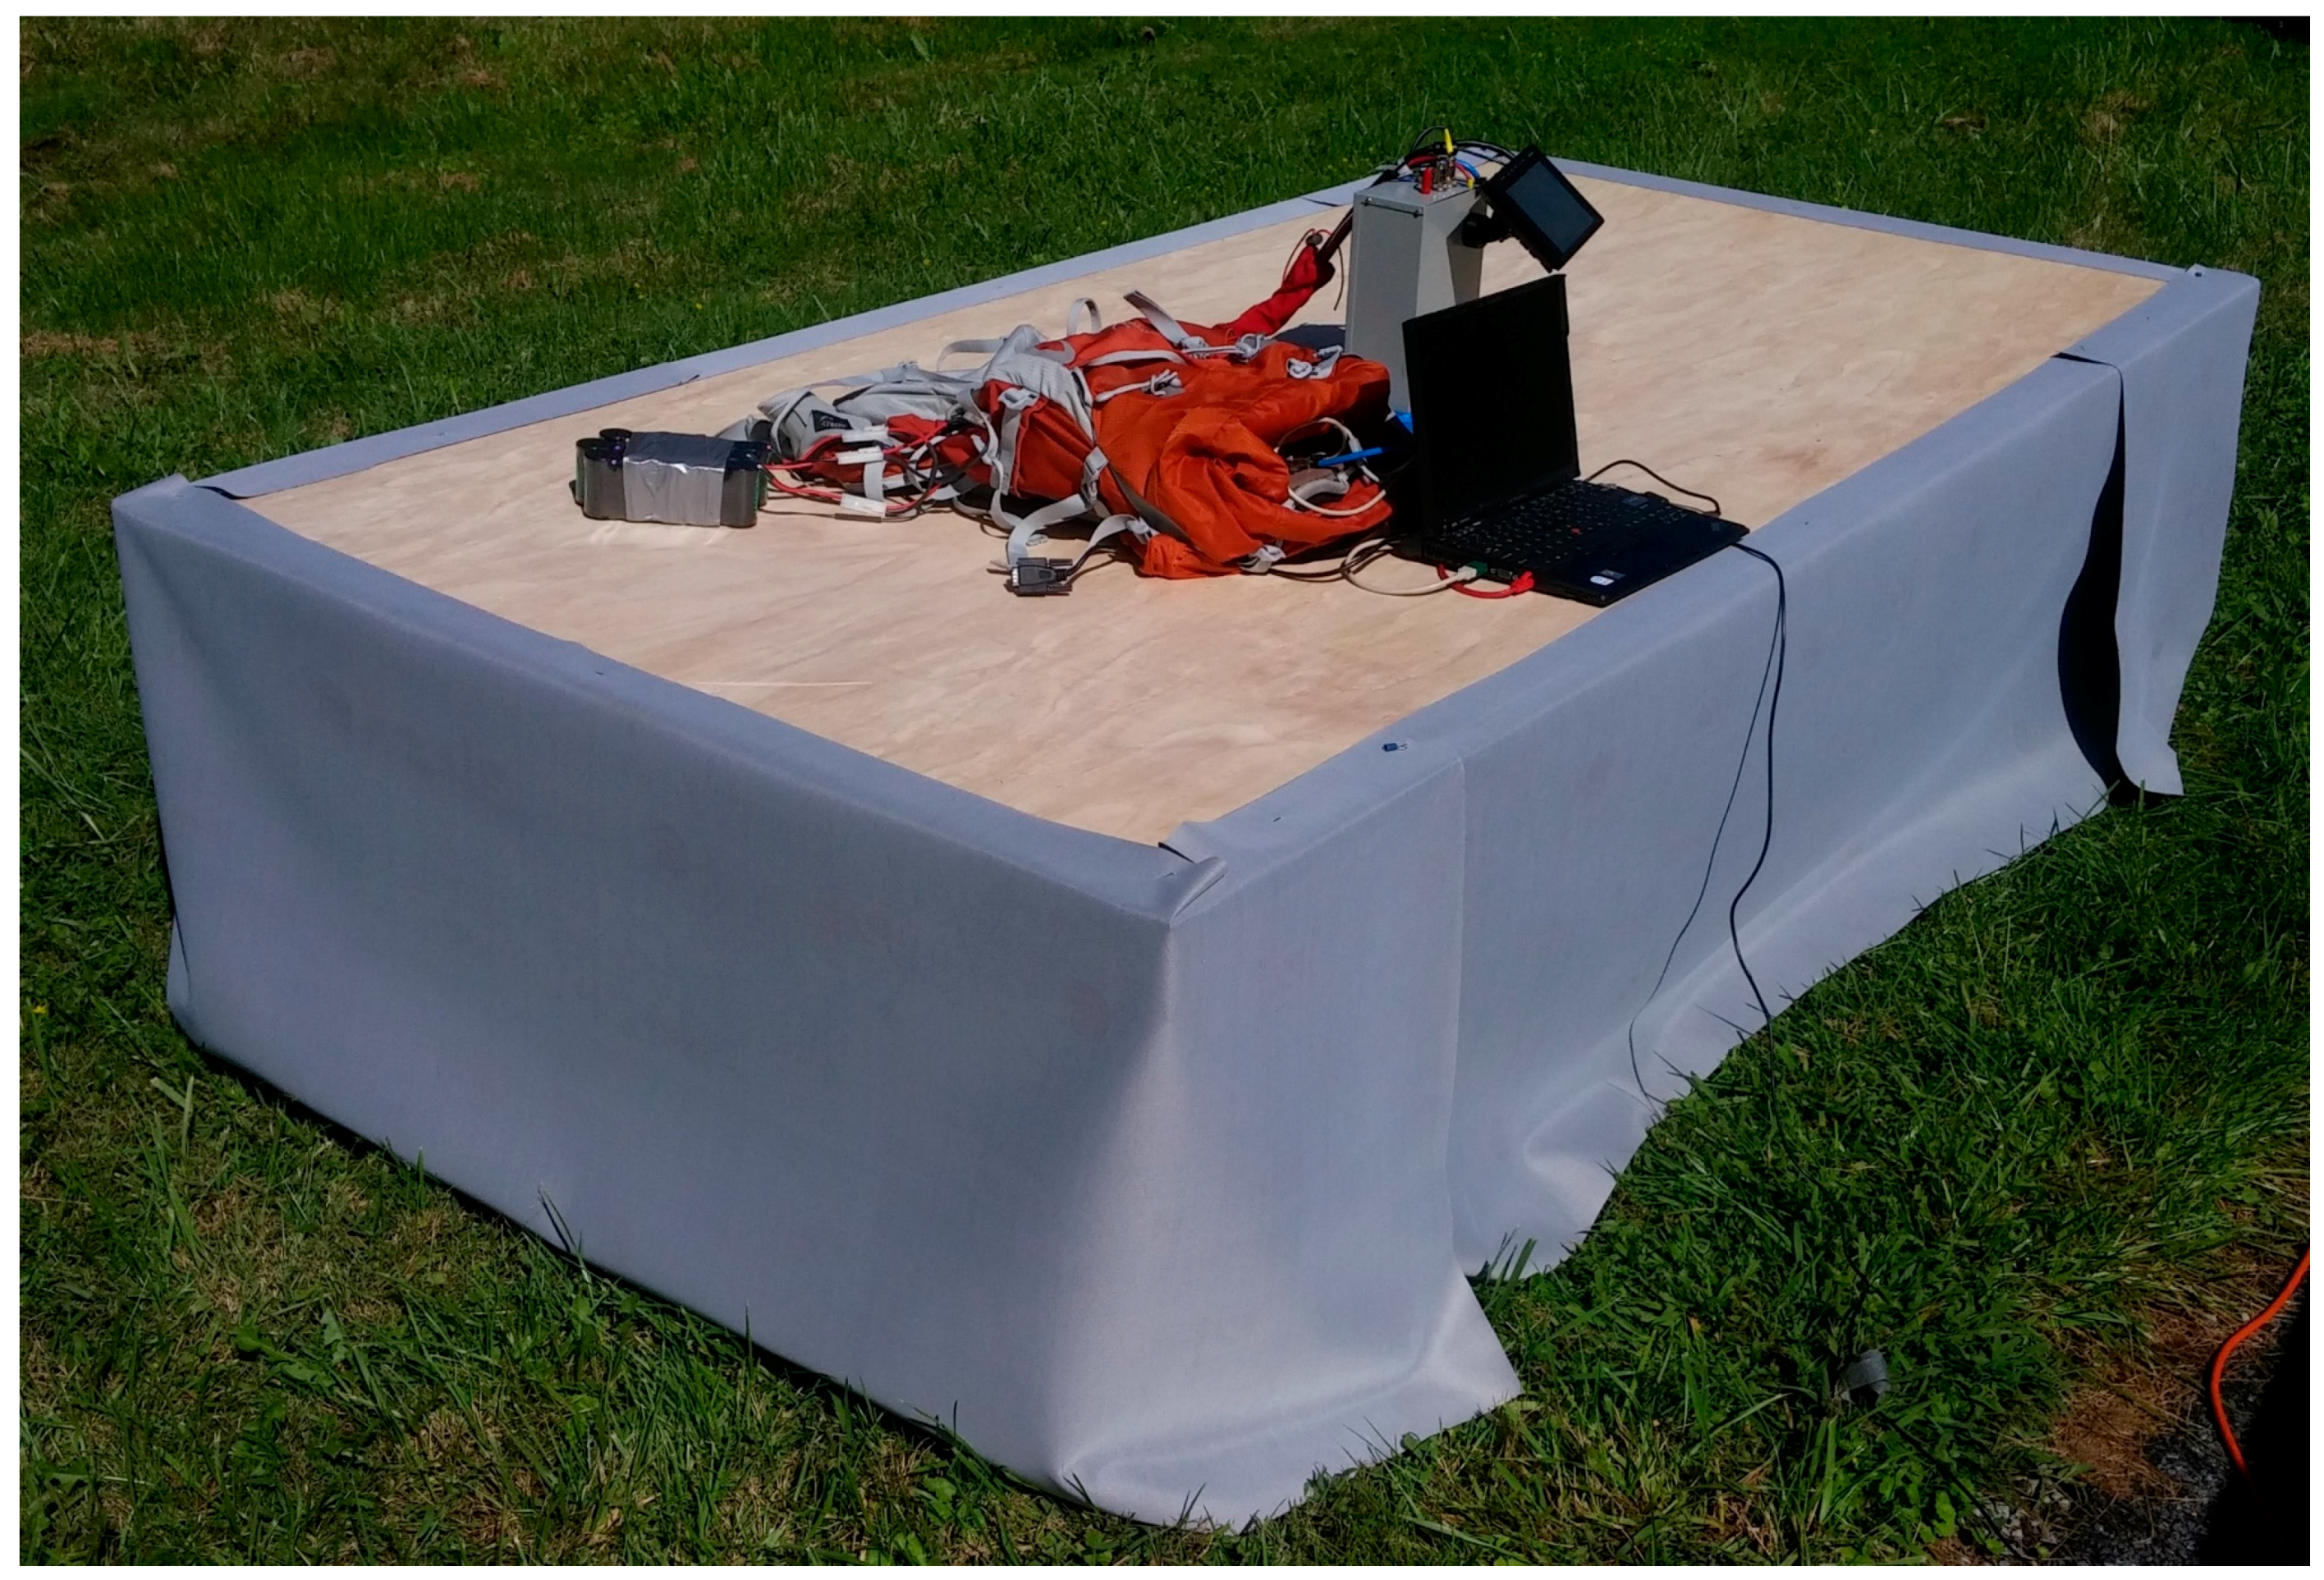
Figure 2.
Insolation by time of day Beltsville, MD.
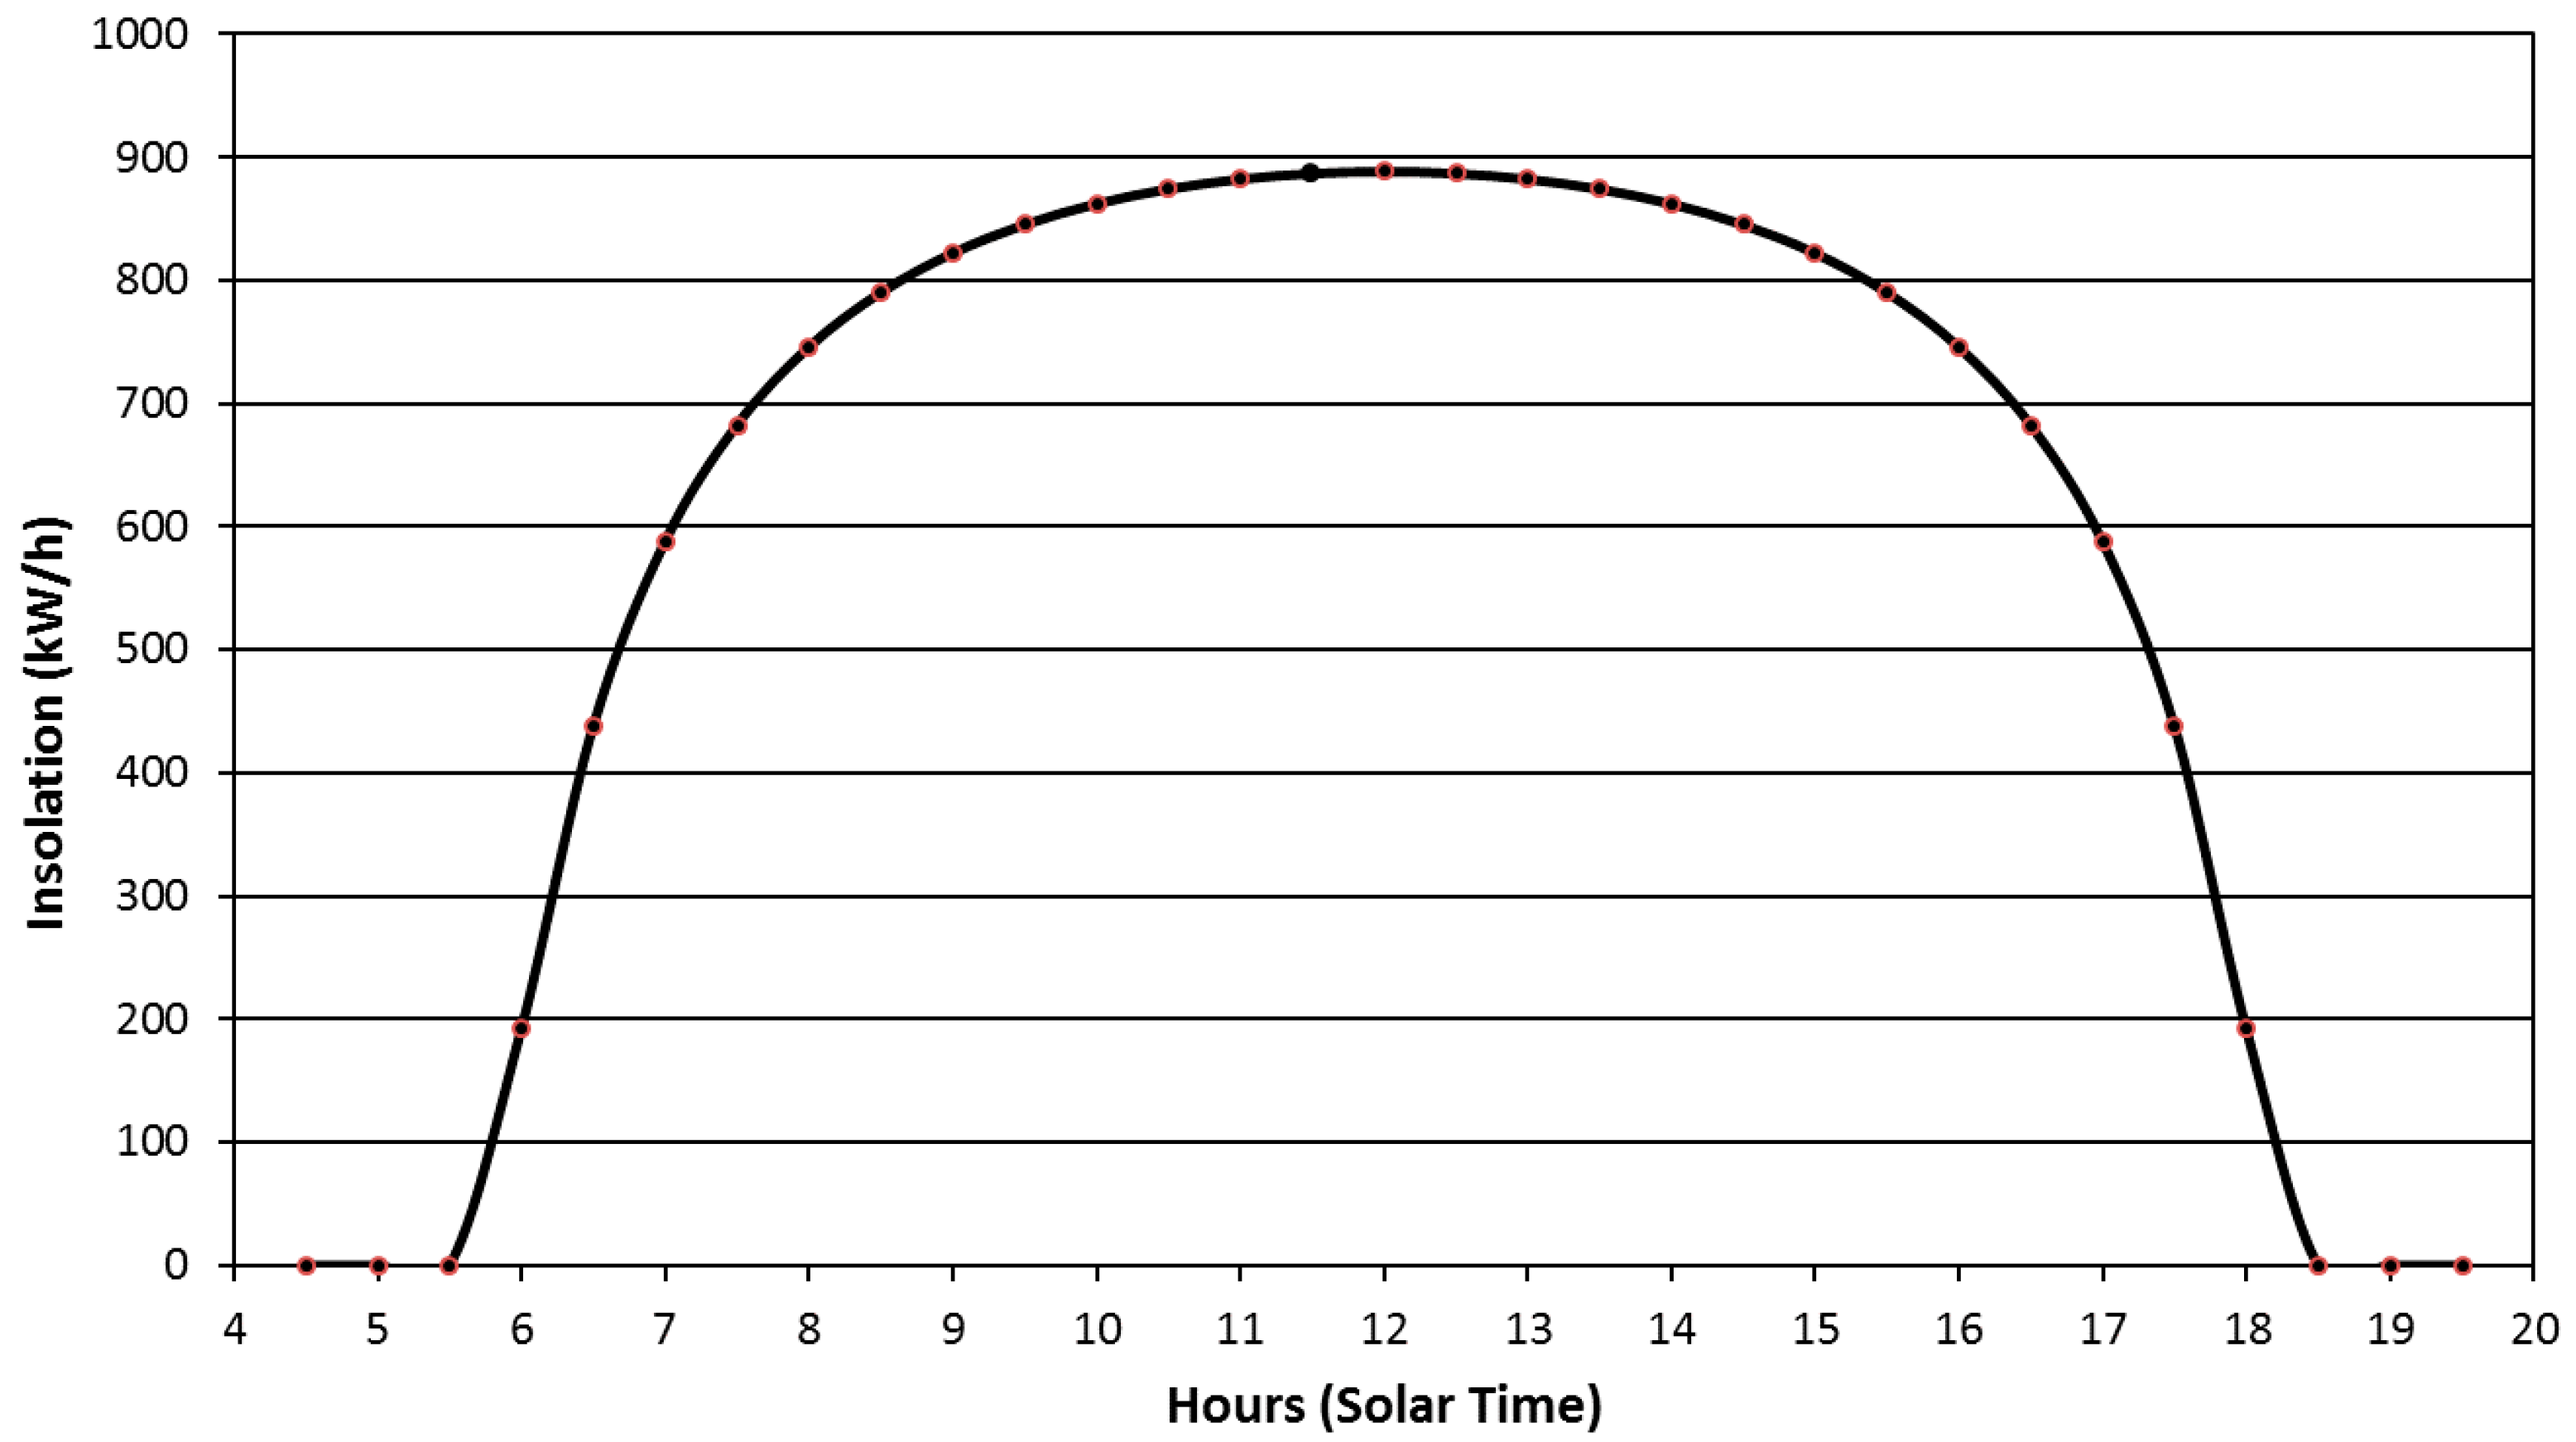
Figure 3.
Gain 20 (left) and gain 32 (right) images at 525 nm of manure on a spinach leaf. Images were acquired at night with the drape raised 250 cm.
Figure 3.
Gain 20 (left) and gain 32 (right) images at 525 nm of manure on a spinach leaf. Images were acquired at night with the drape raised 250 cm.
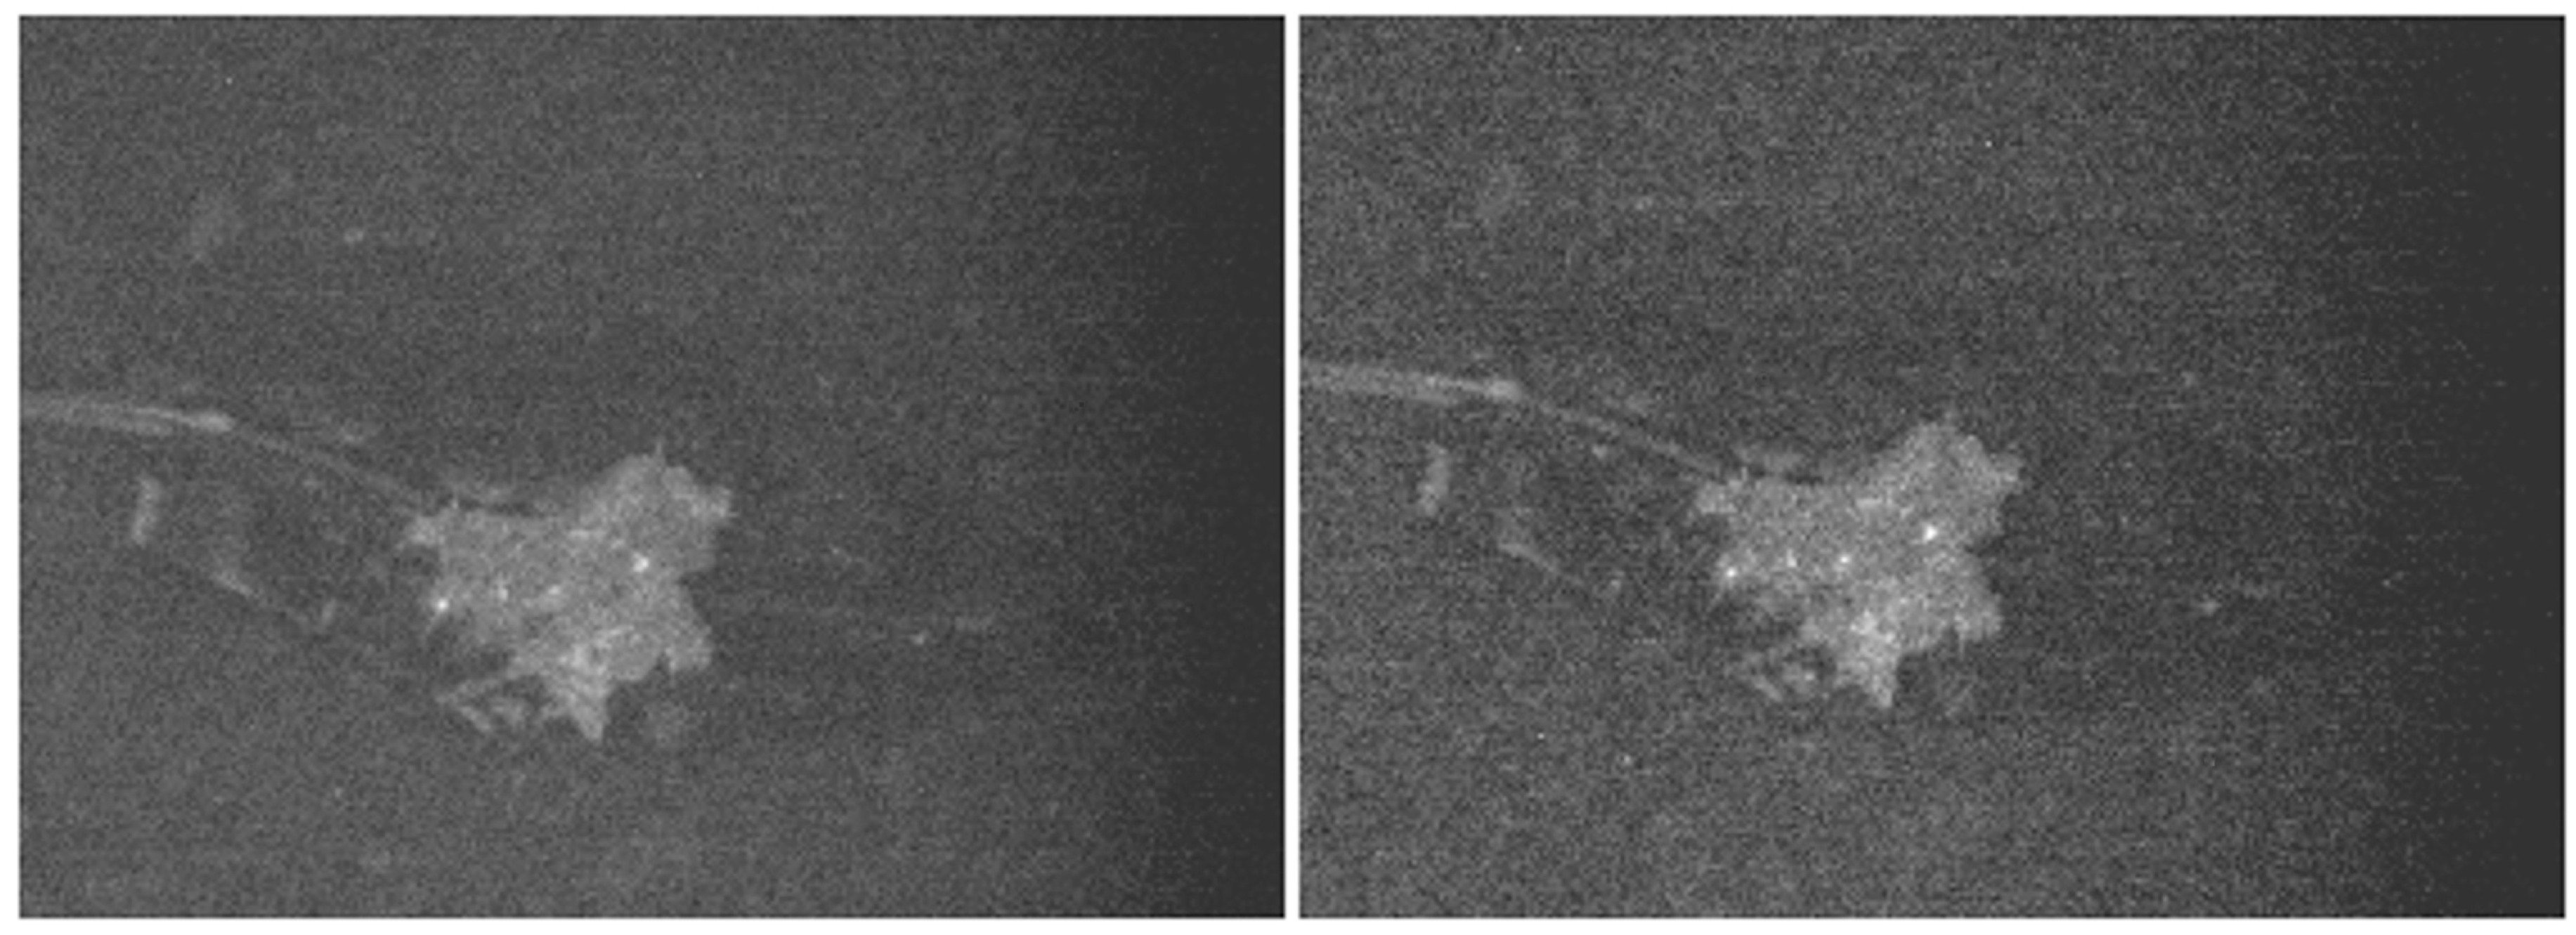
Figure 4.
Spectra at gain 20 (left) and gain 32 (right) of soil, spinach, and dairy manure created using the images in Figure 3. Image was acquired at night with the drape raised 250 cm.
Figure 4.
Spectra at gain 20 (left) and gain 32 (right) of soil, spinach, and dairy manure created using the images in Figure 3. Image was acquired at night with the drape raised 250 cm.
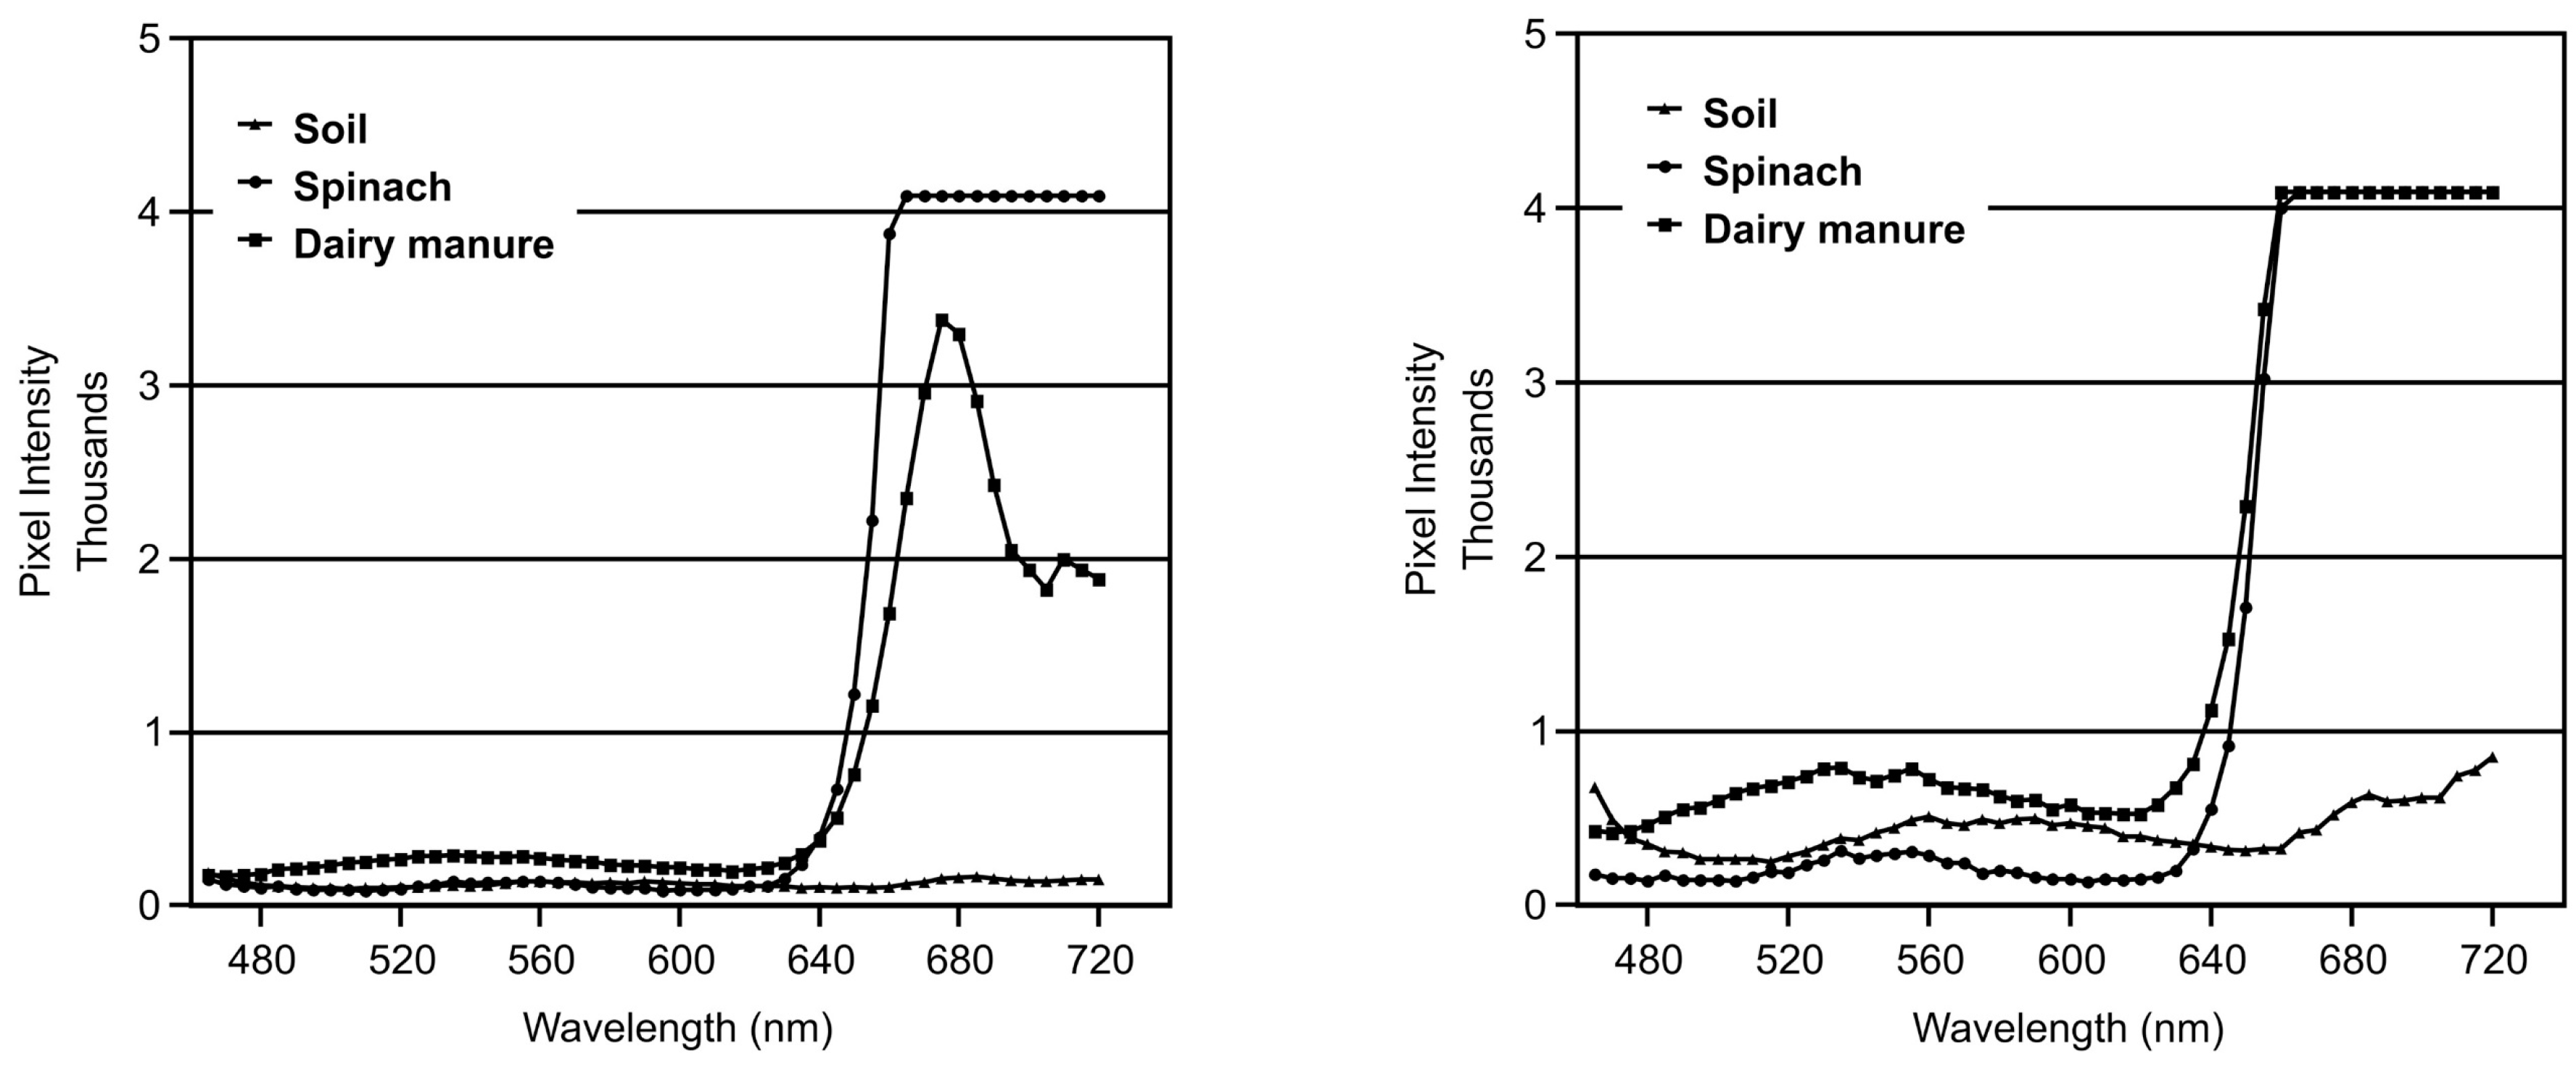
Figure 5.
Gain 20 (left) and gain 32 (right) images at 525 nm of manure on a spinach leaf. Images were acquired at dusk with the drape raised 250 cm.
Figure 5.
Gain 20 (left) and gain 32 (right) images at 525 nm of manure on a spinach leaf. Images were acquired at dusk with the drape raised 250 cm.

Figure 6.
Spectra at gain 20 (left) and gain 32 (right) of soil, spinach, dairy manure, and stem created using the images in Figure 5; note the ROI (region of interest) for soil was selected for a bright area and a ROI was added for the stem as the stem appeared brighter than the leaf. Image was acquired at dusk with the drape raised 250 cm.
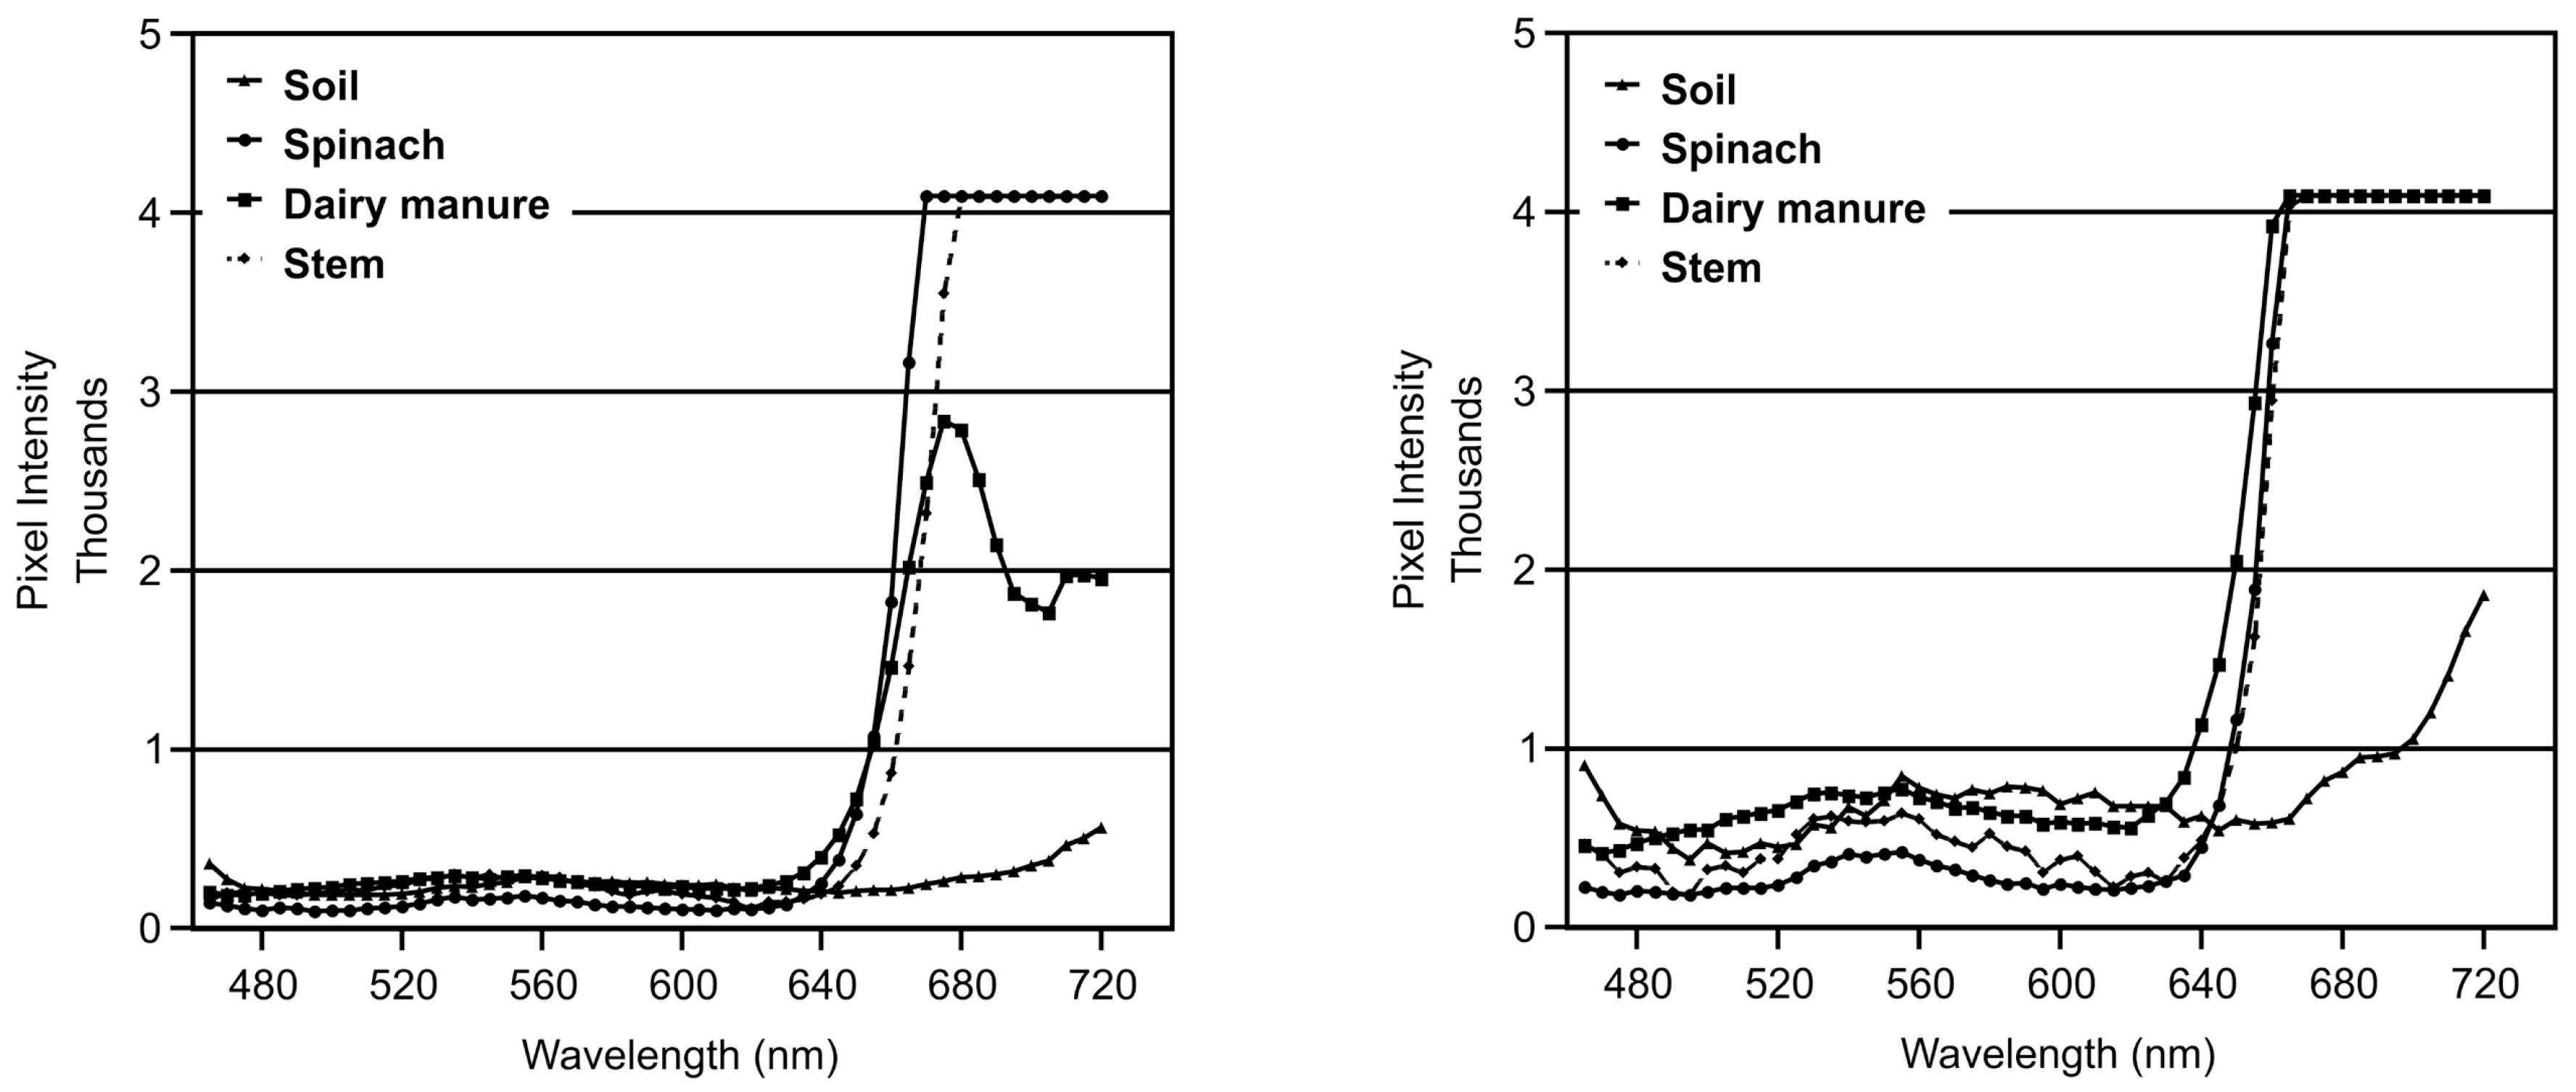
Figure 7.
Gain 20 (left) and gain 32 (right) images at 525 nm of manure on a spinach leaf. Images were acquired near solar noon with the drape fully lowered.
Figure 7.
Gain 20 (left) and gain 32 (right) images at 525 nm of manure on a spinach leaf. Images were acquired near solar noon with the drape fully lowered.

Figure 8.
Spectra at gain 20 (left) and gain 32 (right) of soil, spinach, and dairy manure created using the images in Figure 7. Images were acquired near solar noon with the drape fully lowered.
Figure 8.
Spectra at gain 20 (left) and gain 32 (right) of soil, spinach, and dairy manure created using the images in Figure 7. Images were acquired near solar noon with the drape fully lowered.

© 2017 by the authors. Licensee MDPI, Basel, Switzerland. This article is an open access article distributed under the terms and conditions of the Creative Commons Attribution (CC BY) license (http://creativecommons.org/licenses/by/4.0/).
Share and Cite
MDPI and ACS Style
Lefcourt, A.M.; Siemens, M.C. Interactions of Insolation and Shading on Ability to Use Fluorescence Imaging to Detect Fecal Contaminated Spinach. Appl. Sci. 2017, 7, 1041. https://doi.org/10.3390/app7101041
AMA Style
Lefcourt AM, Siemens MC. Interactions of Insolation and Shading on Ability to Use Fluorescence Imaging to Detect Fecal Contaminated Spinach. Applied Sciences. 2017; 7(10):1041. https://doi.org/10.3390/app7101041
Chicago/Turabian StyleLefcourt, Alan M., and Mark C. Siemens. 2017. "Interactions of Insolation and Shading on Ability to Use Fluorescence Imaging to Detect Fecal Contaminated Spinach" Applied Sciences 7, no. 10: 1041. https://doi.org/10.3390/app7101041
Note that from the first issue of 2016, this journal uses article numbers instead of page numbers. See further details here.