Article

Feature Selection and Classification of Ulcerated Lesions Using Statistical Analysis for WCE Images

1
Center for Intelligent Signal & Imaging Research, Universiti Teknologi PETRONAS, Seri Iskandar 32610, Malaysia
2
Department of Medicine, University of Malaya Medical Center, Kuala Lumpur 50603, Malaysia
*
Author to whom correspondence should be addressed.
Appl. Sci. 2017, 7(10), 1097; https://doi.org/10.3390/app7101097
Submission received: 29 July 2017 / Accepted: 18 September 2017 / Published: 24 October 2017
(This article belongs to the Special Issue Smart Healthcare)

Abstract

:
Wireless capsule endoscopy (WCE) is a technology developed to inspect the whole gastrointestinal tract (especially the small bowel area that is unreachable using the traditional endoscopy procedure) for various abnormalities in a non-invasive manner. However, visualization of a massive number of images is a very time-consuming and tedious task for physicians (prone to human error). Thus, an automatic scheme for lesion detection in WCE videos is a potential solution to alleviate this problem. In this work, a novel statistical approach was chosen for differentiating ulcer and non-ulcer pixels using various color spaces (or more specifically using relevant color bands). The chosen feature vector was used to compute the performance metrics using SVM with grid search method for maximum efficiency. The experimental results and analysis showed that the proposed algorithm was robust in detecting ulcers. The performance in terms of accuracy, sensitivity, and specificity are 97.89%, 96.22%, and 95.09%, respectively, which is promising.

1. Introduction

Gastrointestinal tract (GIT) diseases, such as ulcer, bleeding, Crohn’s disease, cancer or chronic diarrhea are common nowadays. Bleeding and ulcer are some common lesions which affect the small and large bowel. In the United States, approximately 1.6 million Americans currently are currently suffering from inflammatory bowel disease (IBD), representing an increase of about 200,000 since 2011.There are approximately 70,000 new cases of IBD diagnosed each year, and there may be as many as 80,000 children who are suffering from Crohn’s disease (CD) or ulcerative colitis (UC) currently. Additionally, as illustrated reported in the first paper of this issue [1], the incidence number of occurrences of IBD is increasing worldwide [2]. The growth of IBD cases in newly-industrialized countries has paralleled its growth on par with that of the Western world 30 to 40 years ago. Genetic and environmental studies performed in these countries may provide new clues to the pathogenesis of IBD. However, it adds another layer of complexity since risk factors and gene-environment interactions may vary by continents and ethnicities [3]. Traditional endoscopy has been adopted for many years in order to diagnose abnormalities of GIT, whereby a physician controls a flexible endoscope to examine the lower and upper parts of GIT. This technique is limited to inspecting bowel of average length 7–8 m. It imposes high level of discomfort on the patient as well.
Wireless capsule endoscopy (WCE) [4,5] is a recent technology introduced by Given Imaging Ltd. (Yokne’am Illit, Israel) to visualize the entire GIT painlessly. It offers an efficient and comfortable way for visualizing the complete GIT. It has eight skin antennas mounted to the abdomen wall. While moving through the complete GIT, the capsule captures numerous images at approximately 2–4 frames per second (fps), and transfers them wirelessly to the data logger (DL) or recorder unit. This DL is hooked up to the patient waist and the videos/images are stored. Once the examination is complete (i.e., the WCE exits patient’s body after 8 h), the images can be downloaded to a dedicated computer from DL and inspected by clinical experts through specific software. This procedure produces more than 60,000 images per examination and experts spend about 4–5 h to inspect the whole video footage very carefully. In some mild cases, clinicians have to go through each frame manually, leading to visual fatigue. This tedious and time-consuming process is the main drawback of WCE. Various image processing techniques for automatic disease detection (based on size, shape, and depth, including performance matrices) have been developed. Automatic lesion detection, on the other hand, is more efficient for chronic cases.
In this particular work, we have extracted color features for various color spaces. We have analyzed each band in order to separate the ulcer and non-ulcer pixels. Furthermore, it was combined with cross-correlation measure in order to add similarity between two images or matrices. Classification task was performed using support vector machine with and without grid search method in order to quantify the result. The main contribution of this work is the implementation of a novel computer-aided diagnostic method which is used to discriminate ulcer pixels from non-ulcerated ones with high performance in terms of sensitivity, specificity, and accuracy.
This paper is organized in the following manner: Section 2 describes the research background and the related works. Section 3 demonstrates the methodology, and Section 4 describes experimental setup, results, and discussions. Section 5 concludes the current work.

2. Background and Literature

Researchers have ventured into the technology of using automated computer-aided design (CAD) tools, such as WCE for ulcer screening. Precious clinical information in some important lesion areas can be displayed on an image [6,7,8,9]. Deeba [6] has used Retinex theory and the salient region detection method for various pathologies, such as stenosis, chylous cysts, lymphangiectasis, polypoid, bleeding, angioectasia, and ulcers. They have used a color enhancement method to improve the diagnostic yield of the CAD system. A significant improvement in detection performance using the Retinex-based color enhancement method has been achieved. An unsupervised method [10] has been used to localize the region-of-interest in order to detect angioectasia. The utility of IHb index for angioectasia detection has been pioneered to detect other abnormalities.
Yuan [8] has used a saliency detection method based on multi-level super pixel representation in order to outline the ulcer candidates. They have evaluated the corresponding saliency in accordance with the texture and the color feature of each level in the super pixel region. The images have been categorized by using saliency max-pooling with locality-constrained linear coding (LLC).
Iakovidis [9] has presented a method to detect various abnormalities in GIT by considering color as a discriminative feature. This method has been tested on a WCE model. Here, the single image (instead of the complete WCE video footage) has been analyzed. The author [11] has reviewed some current CAD methods employed in enhanced video capsule endoscopy. Various hardware and software problems have been highlighted in a review article [12] for detecting lesions in the small bowel.
Peptic ulcers are usually found in the duodenum (duodenal ulcer) and in the stomach (gastric ulcer). They can be found in small and large bowel areas of the GIT as well. They may cause severe gastrointestinal perforation or gastrointestinal bleeding [13]. Usually, it appears as a white spot in WCE images. In severe cases, these ulcers are accompanied by bleeding and other abnormalities. Ulcer lesions and normal tissue can be differentiated by using color and texture features (see Figure 1).
Feature selection [14] as practiced in machine learning is beneficial for supporting the WCE findings [15,16,17]. In general, feature extraction involves creating many new features mixed with the current ones. Due to the fact that the characterization of complete data variance is not possible after dimensional reduction, a highly-discriminative selecting feature [10] is undoubtedly necessary.
In order to classify the area of interest for capsule endoscopic images, first-order-histogram-based features extracted from various color spaces are very important. Relevant information can be extracted using various color spaces in order to describe the pattern of assured class. In case of bleeding detection, different color spaces [18] such as RGB (Red, Green, Blue), CMYK (Cyan, Magenta, yellow and Key [Black]), YIQ (Luma, chrominance information), CIE Lab, and HSI have been extensively investigated.
Yeh [13] used an improved CH algorithm (chosen name for the color coherence vector, CCV) to extract the color feature. The grey level co-occurrence matrix (GLCM) has been used to extract texture information. In our previous work [19], RGB and Lab color spaces have been chosen for statistical analyses of ulcer and non-ulcerated pixels. This paper extends the work of [19] by incorporating various color bands for statistical analysis.
Figueiredo et al. [20] has proposed a geometry-based automatic colorectal polyp detection method that has motivated the current work. The authors [21] have proposed a new computer-assisted bleeding detector for differentiating between bleeding and non-bleeding regions. The utilized second component from the CIE Lab color space with enhancement and segmentation techniques involves anisotropic diffusion.

3. Methodology

While analyzing the features, it is necessary to perform a few prior steps which are related to image processing. This section shows the complete flow of work. The proposed work focuses on reducing the analysis time while processing huge number of images. RGB color space is the most popular color scheme in visual system [22]; however, it has a few major disadvantages for natural images where high correlation between components can be observed [23]. Figure 2 depicts the flow of methodology for feature classification and extraction.

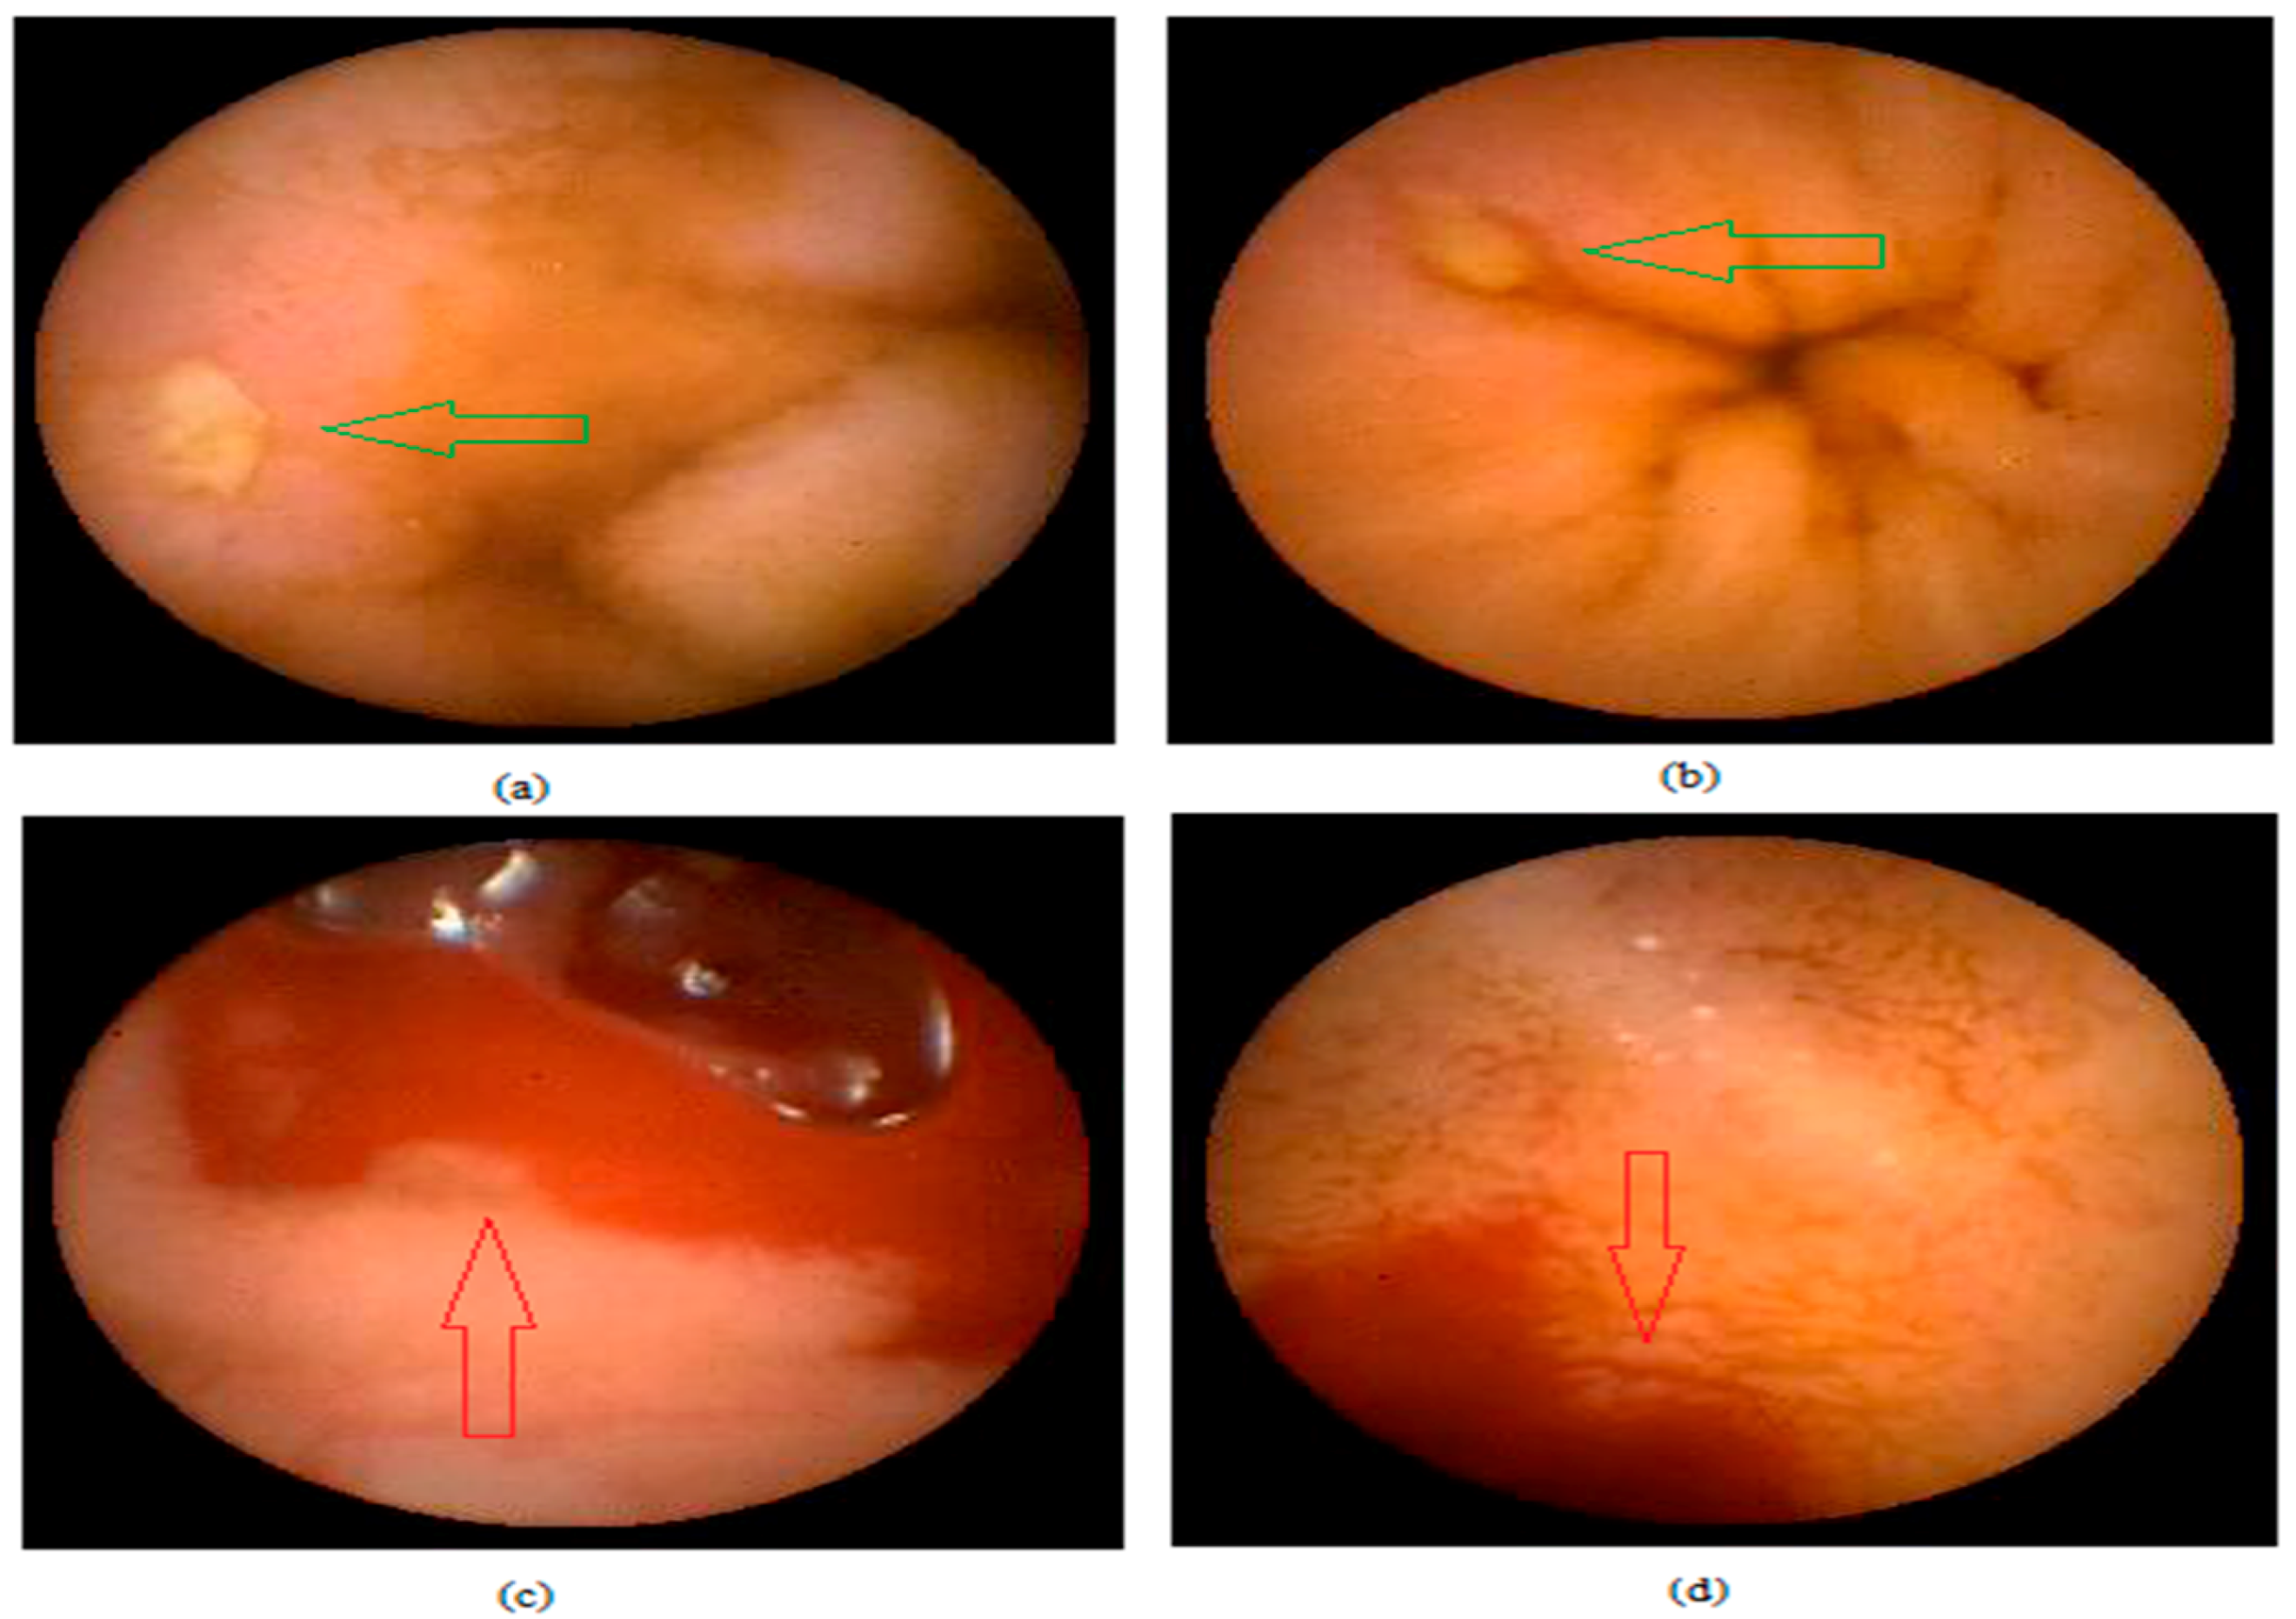
3.1. Image Processing and Enhancement

The video generated after WCE examination is usually saved in a raw format and it cannot be processed directly by any programming platform. Endocapsule software (MAJ-2039) (EC 10, Olympus, Seri Iskandar, Perak, Malaysia, 2014) was used to import raw video in Audio Video Interleave (AVI) format. Subsequently, MATLAB was used to extract all images from the entire video footage in tagged image file format (TIFF) format. We have chosen the TIFF format to represent the WCE color image because it has greatest strength to support the full range of image size, color depth, and resolution. It also supports various compression techniques, where lossless compression allows this format to maintain image resolution without loss of any detail related to image [24]. Image enhancement is essential before applying any techniques in image processing. It is a technique that is able to eliminate non-essential information from an image [25]. In this particular work, we have used wavelet de-noising [26] with three levels of decomposition. Additionally, the db2 wavelet with soft thresholding method was applied to eliminate redundant noise.

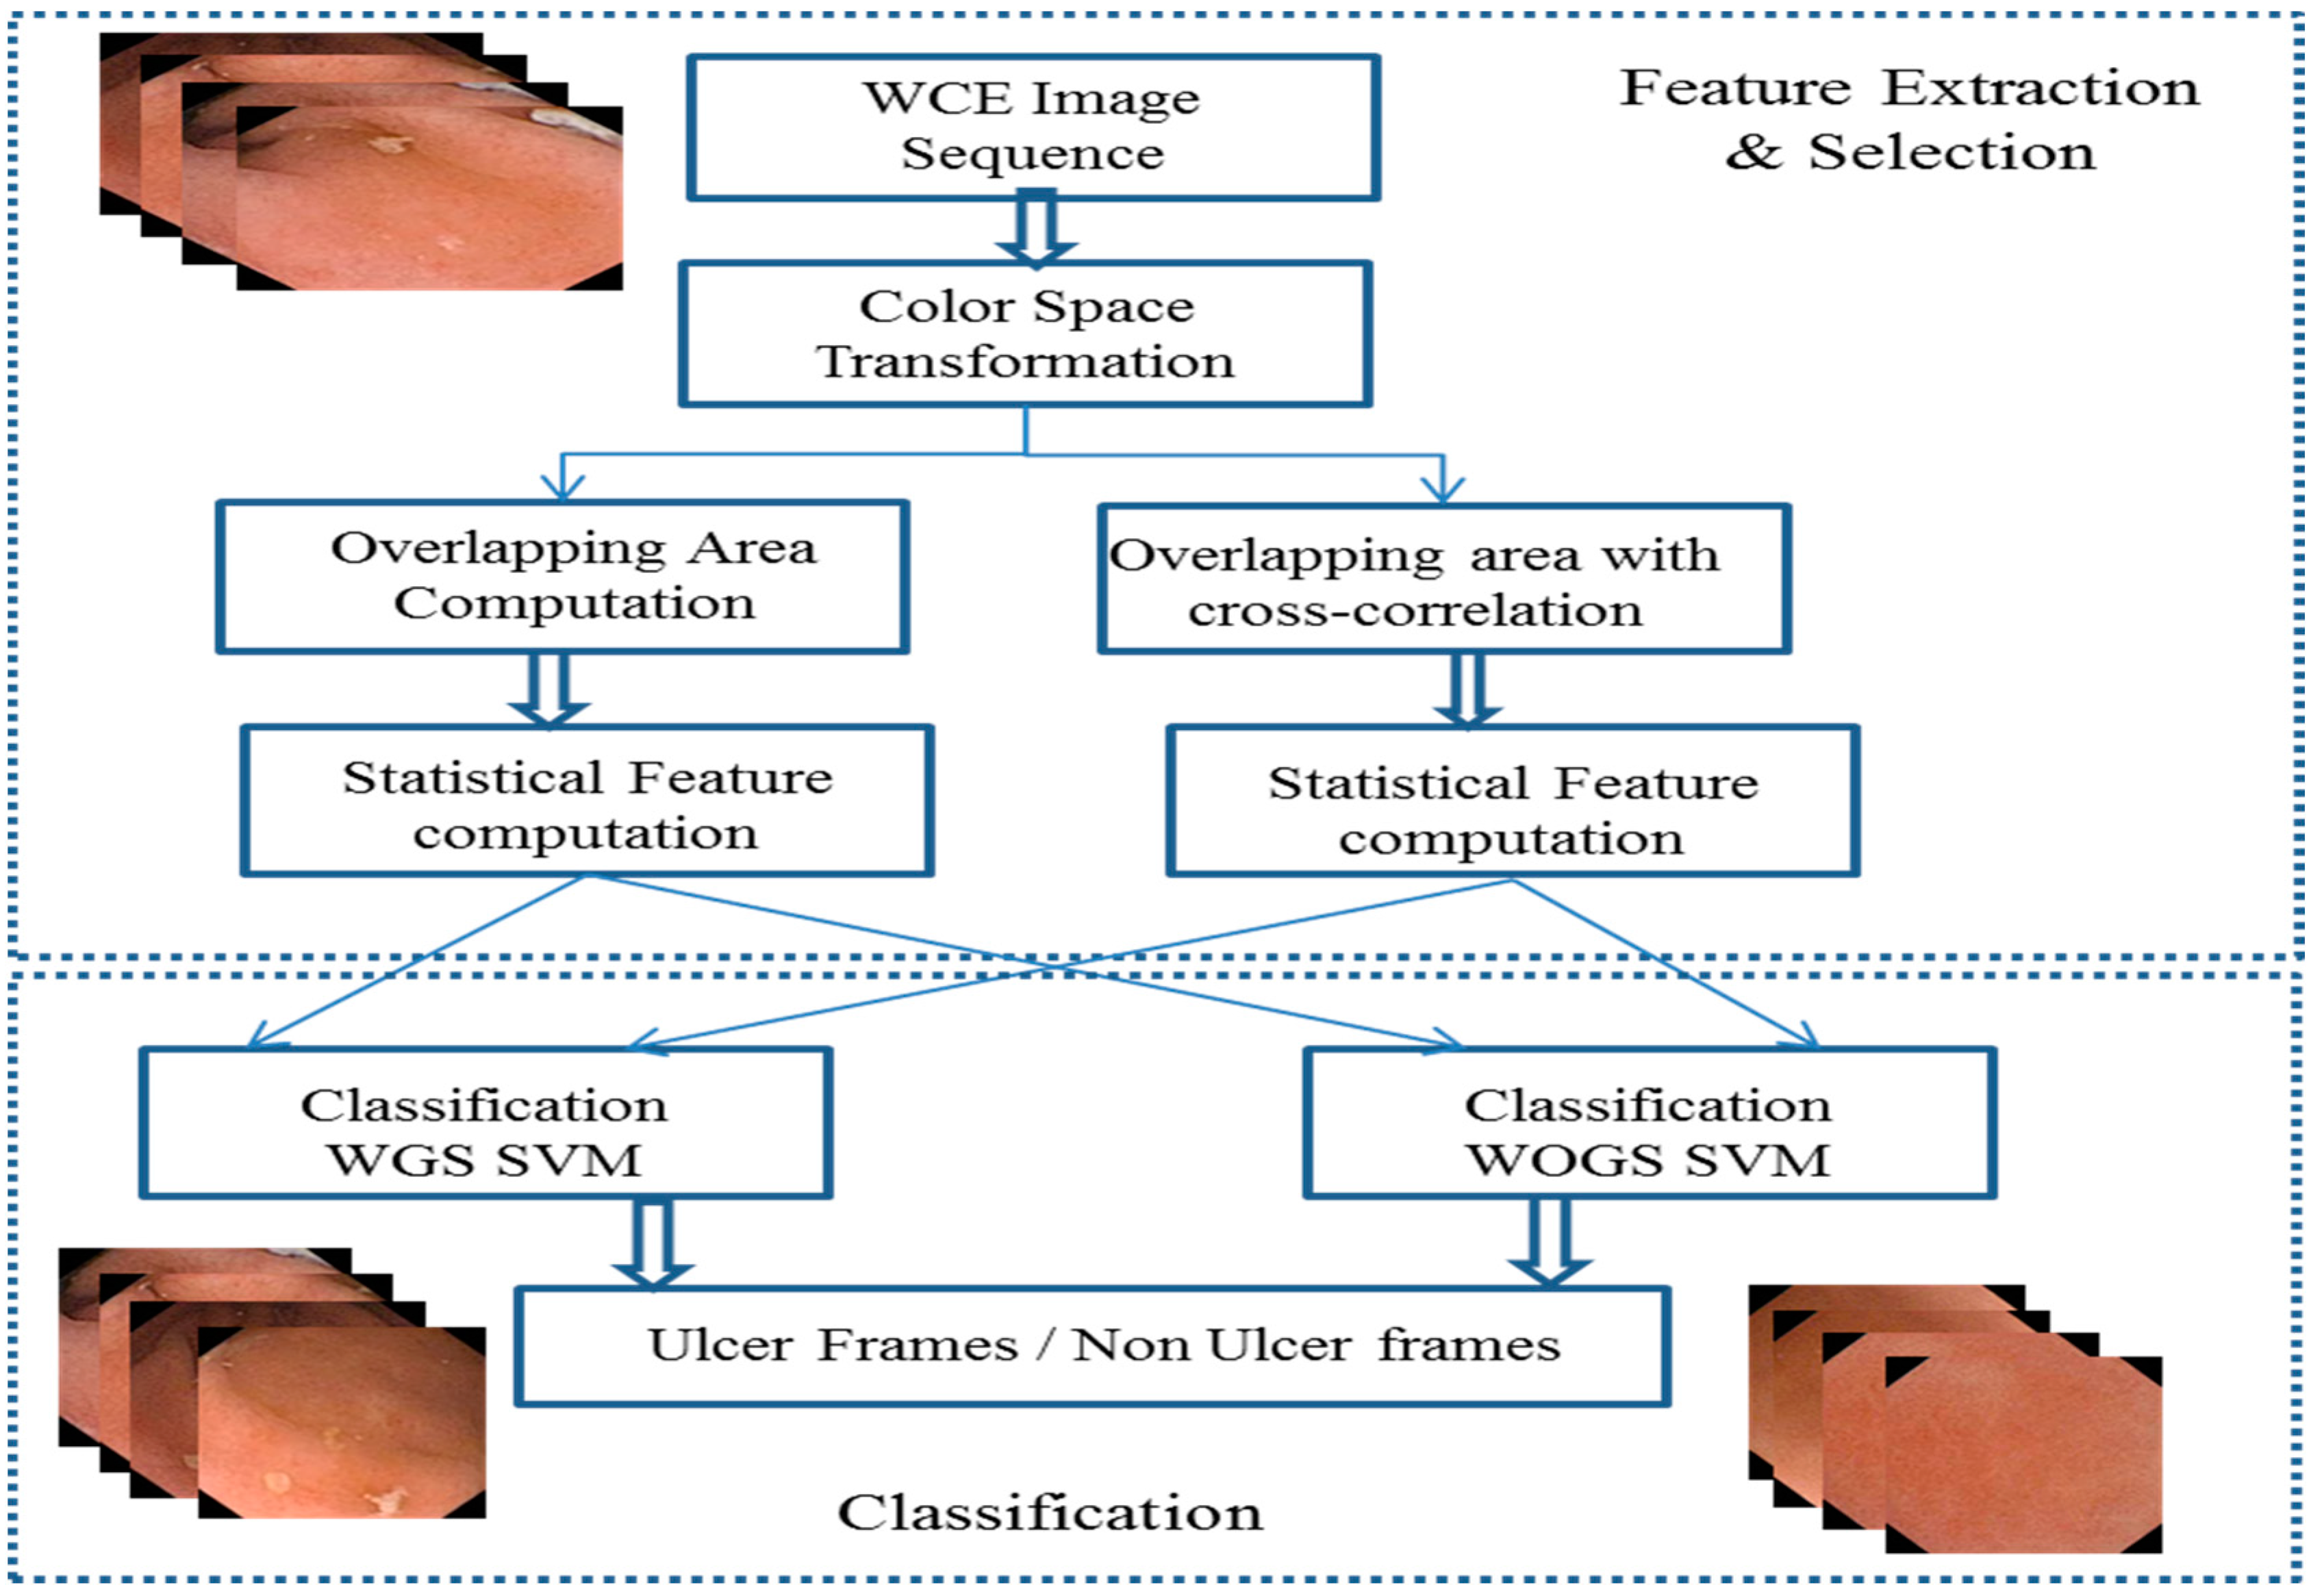
3.2. Feature Extraction and Feature Selection

In this section, we have generated various normalized color spaces for feature analysis. RGB, HSV, YCbCr, CIE Lab, YUV, XYZ, and CMYK color spaces have been chosen for feature extraction and feature selection. By using these secen color spaces, we have analyzed 22 separate color bands individually. These bands contain various information of lesion and it is essential to identify the best band for the classification step.
We have used two methods to identify the best suitable band by separating foreground (non-ulcerated) and ulcer pixels. These methods involve statistical analysis of foreground and ulcer pixels in each band. We have implemented the first method (or Method 1) named as the overlapping area (OA) to measure the overlapping area between ulcer and foreground pixels. The normal distribution curve for foreground and ulcer pixels is analyzed from each pixel set. Here, we are able to highlight the index of separation for each band which shows overlapping area between foreground and ulcer pixels. Of course, lesser overlapping area signifies better separation in a particular band. The second method (or Method 2) uses overlapping area with cross-correlation (OACCorr) value in each band. Cross-correlation [27] is a standard measure for determining similarity between two images or matrices. It is more accurate and computationally more efficient. Additionally, it depends on the calculation of covariance between two bands.
The method of fast normalized cross-correlation is fast, independent, and accurate (in terms of pixel contrast and brightness values) in computing image similarity. This technique involves the estimation of correlation between all bands in the data cube of band i. Equation (1) was used to estimate the correlation values of other bands in j data cube:
N C C i , j     =   x y [ ( D i ( x , y ) D i ¯ ) × ( D j ( x , y ) D j ¯ ) ] x y ( D i ( x , y ) D i ¯ ) 2 × x y ( D j ( x , y ) D j ¯ ) 2
where N C C i , j is the normalized cross-correlation between band i and j, D i ( x , y ) . is the intensity of pixel, (x, y) are the pixel indices within one band, and D i ¯ is the mean of pixel intensity values of band i.
Table 1 shows the OA and OACCorr values for 22 color bands used in extracting the color features. We have used seven color spaces in the following order: RGB, HSV, YCbCr, CIE Lab, YUV, XYZ, and CMYK. The first color space is RGB with rgbR, rgbG, and rgbB color bands with allotted band numbers of 1, 2 and 3, respectively. The second color space is HSV with hsvH, hsvS, and hsvV color bands. Their allotted band numbers are 4, 5 and 6, respectively. The third color space is YCbCr with ycbcrY, ycbcrCB, and ycbcrCR color bands. Their allotted band numbers are 7, 8 and 9, respectively. The fourth color space is CIE Lab with CIE LabL, CIE LabA, and CIE LabB color bands. Their allotted band numbers are 10, 11 and 12, respectively. The fifth color space is YUV with yvuY, yvuU, and yuvV color bands of allotted band numbers 13, 14 and 15, respectively. The sixth color space is XYZ with xyzX, xyzY, and xyzZ color bands of allotted band numbers 16, 17 and 18, respectively. Finally, the seventh color space is CMYK with four bands, i.e., cmykC, cmykM, cmykY, and cmykK. Their allotted band numbers are 19, 20, 21 and 22, respectively. These entire bands are used as feature vector for further classification.
From Table 1 (columns 2 and 3), the overlapping areas of the respective band number and band name obtained using Method 1 are displayed in an incremental manner. For Method 2 (see columns 4 and 5 in Table 1), the overlapping areas added with standard measure of degree of similarity between two images are displayed in an incremental manner as well. For example, if the serial number 1 for feature extraction is analyzed using Method 1, it shows a chromium component (ycbcrCR) of YCbCr with band number 9 that has a lesser overlapping area between ulcer and foreground pixels. If the result of Method 2 is analyzed, the same band (ycbcrCR) is selected as well.

3.3. Machine Learning

SVMs are accurate as they contain appropriate kernels that work well even if the data is not linearly separable in the base future space. By using the kernel functions of SVM [28], one can perform a non-linear classification more accurately by mapping its input to high-dimensional feature spaces [29]. There are various hyperplanes that separate the classes; however, it is important to select the best one which has the largest distance to the nearest data point of two classes. Grid search [30] is the conventional method of performing the optimization of hyper parameter utilizing parameter sweep or grid search through a manually specified subset of the hyper parameter of a learning algorithm. This algorithm must be guided by some performance metric, normally measured by evaluation on a held-out validation set or by cross-validation of the training dataset. For this work, we are using an SVM classifier with an RBF kernel having at least two parameters (regularization constant C and kernel hyper parameter γ) that need to be tuned to achieve high performance on the testing data. The mathematical descriptor is shown below for a binary classification problem: {(x1, y1), (x2, y2), …, (xk, yk)}, where xi ∈ Rn represents the n-dimensional feature vectors, and yi ∈ {1, −1} is the corresponding class label. The SVM requires the solution of the following optimizing problem:
min (   1 2 ω T ω   +   C   i = 1 k ε i ) Subjected   to   y i   ( ω T ϕ ( x i ) + b ) 1 ε i ,   ε i 0 ,   i = 1 ,     , k
Here, εi is the slack variable for misclassified examples, and C is the penalty parameter of error term. In addition, K(xi, xj) = ϕ(xi)Tϕ(xj) is the kernel function. Basically, there are four kernel functions used for pattern recognition and classification: linear kernel, polynomial kernel, radial basis function (RBF), and sigmoid kernel. We have adopted the RBF [28] kernel in this paper:
K ( x i ,   x j ) = exp   ( γ x i x j 2 ) ,   γ   >   0  
Here, γ is the parameter which must be carefully selected in the experiment. The optimum values for parameter C and log2 γ were selected from the range: (−8, 7, 6, …, 6, 7, 8). The grid method [29] was adopted as the searching procedure (a 0.8 step was used). Each γ and C value pair was used in the training data with ten-fold cross-validation in order to evaluate the model performance. Once the optimal values of γ and C were found, they were adopted to train a new SVM model.

4. Experimental Results and Discussions

This work was assisted by the expertise from the endoscopy unit in University of Malaya Medical Centre (UMMC), Kuala Lumpur, Malaysia for medical/clinical advises. The UTP team, on the other hand, was responsible in providing the engineering solutions. We accumulated 30 videos of various abnormalities. Moreover, the experts provided us the ground truth for these videos with labelled ulcerated lesions. This dataset serves as the reference data set for our subsequent analysis. The WCE pill used for generating the dataset was Endocapsule developed by Olympus. The resolution of the dataset provided was 288 × 288. The processor used for this work was Intel (R) Core(TM) i7-2600 CPU @3.20 GHz (Dell Optiplex 990, Seri Iskandar, Malaysia) with 8 GB memory. The chosen programming platform was MATLAB R2017a (Matlab 9.2, MathWorks, Malaysia, 2017).

4.1. Dataset Selection

Our dataset consisted of 48,000 WCE images. These images (16,000 of them) were divided into three groups. In each group, we used 8000 images to create our training set (5000 images were ulcer samples and 3000 images were normal samples) and 8000 images in testing set (5000 images were ulcer samples and 3000 images were normal samples). These images were accumulated from 30 patients and manually-labelled by gastroenterologists.

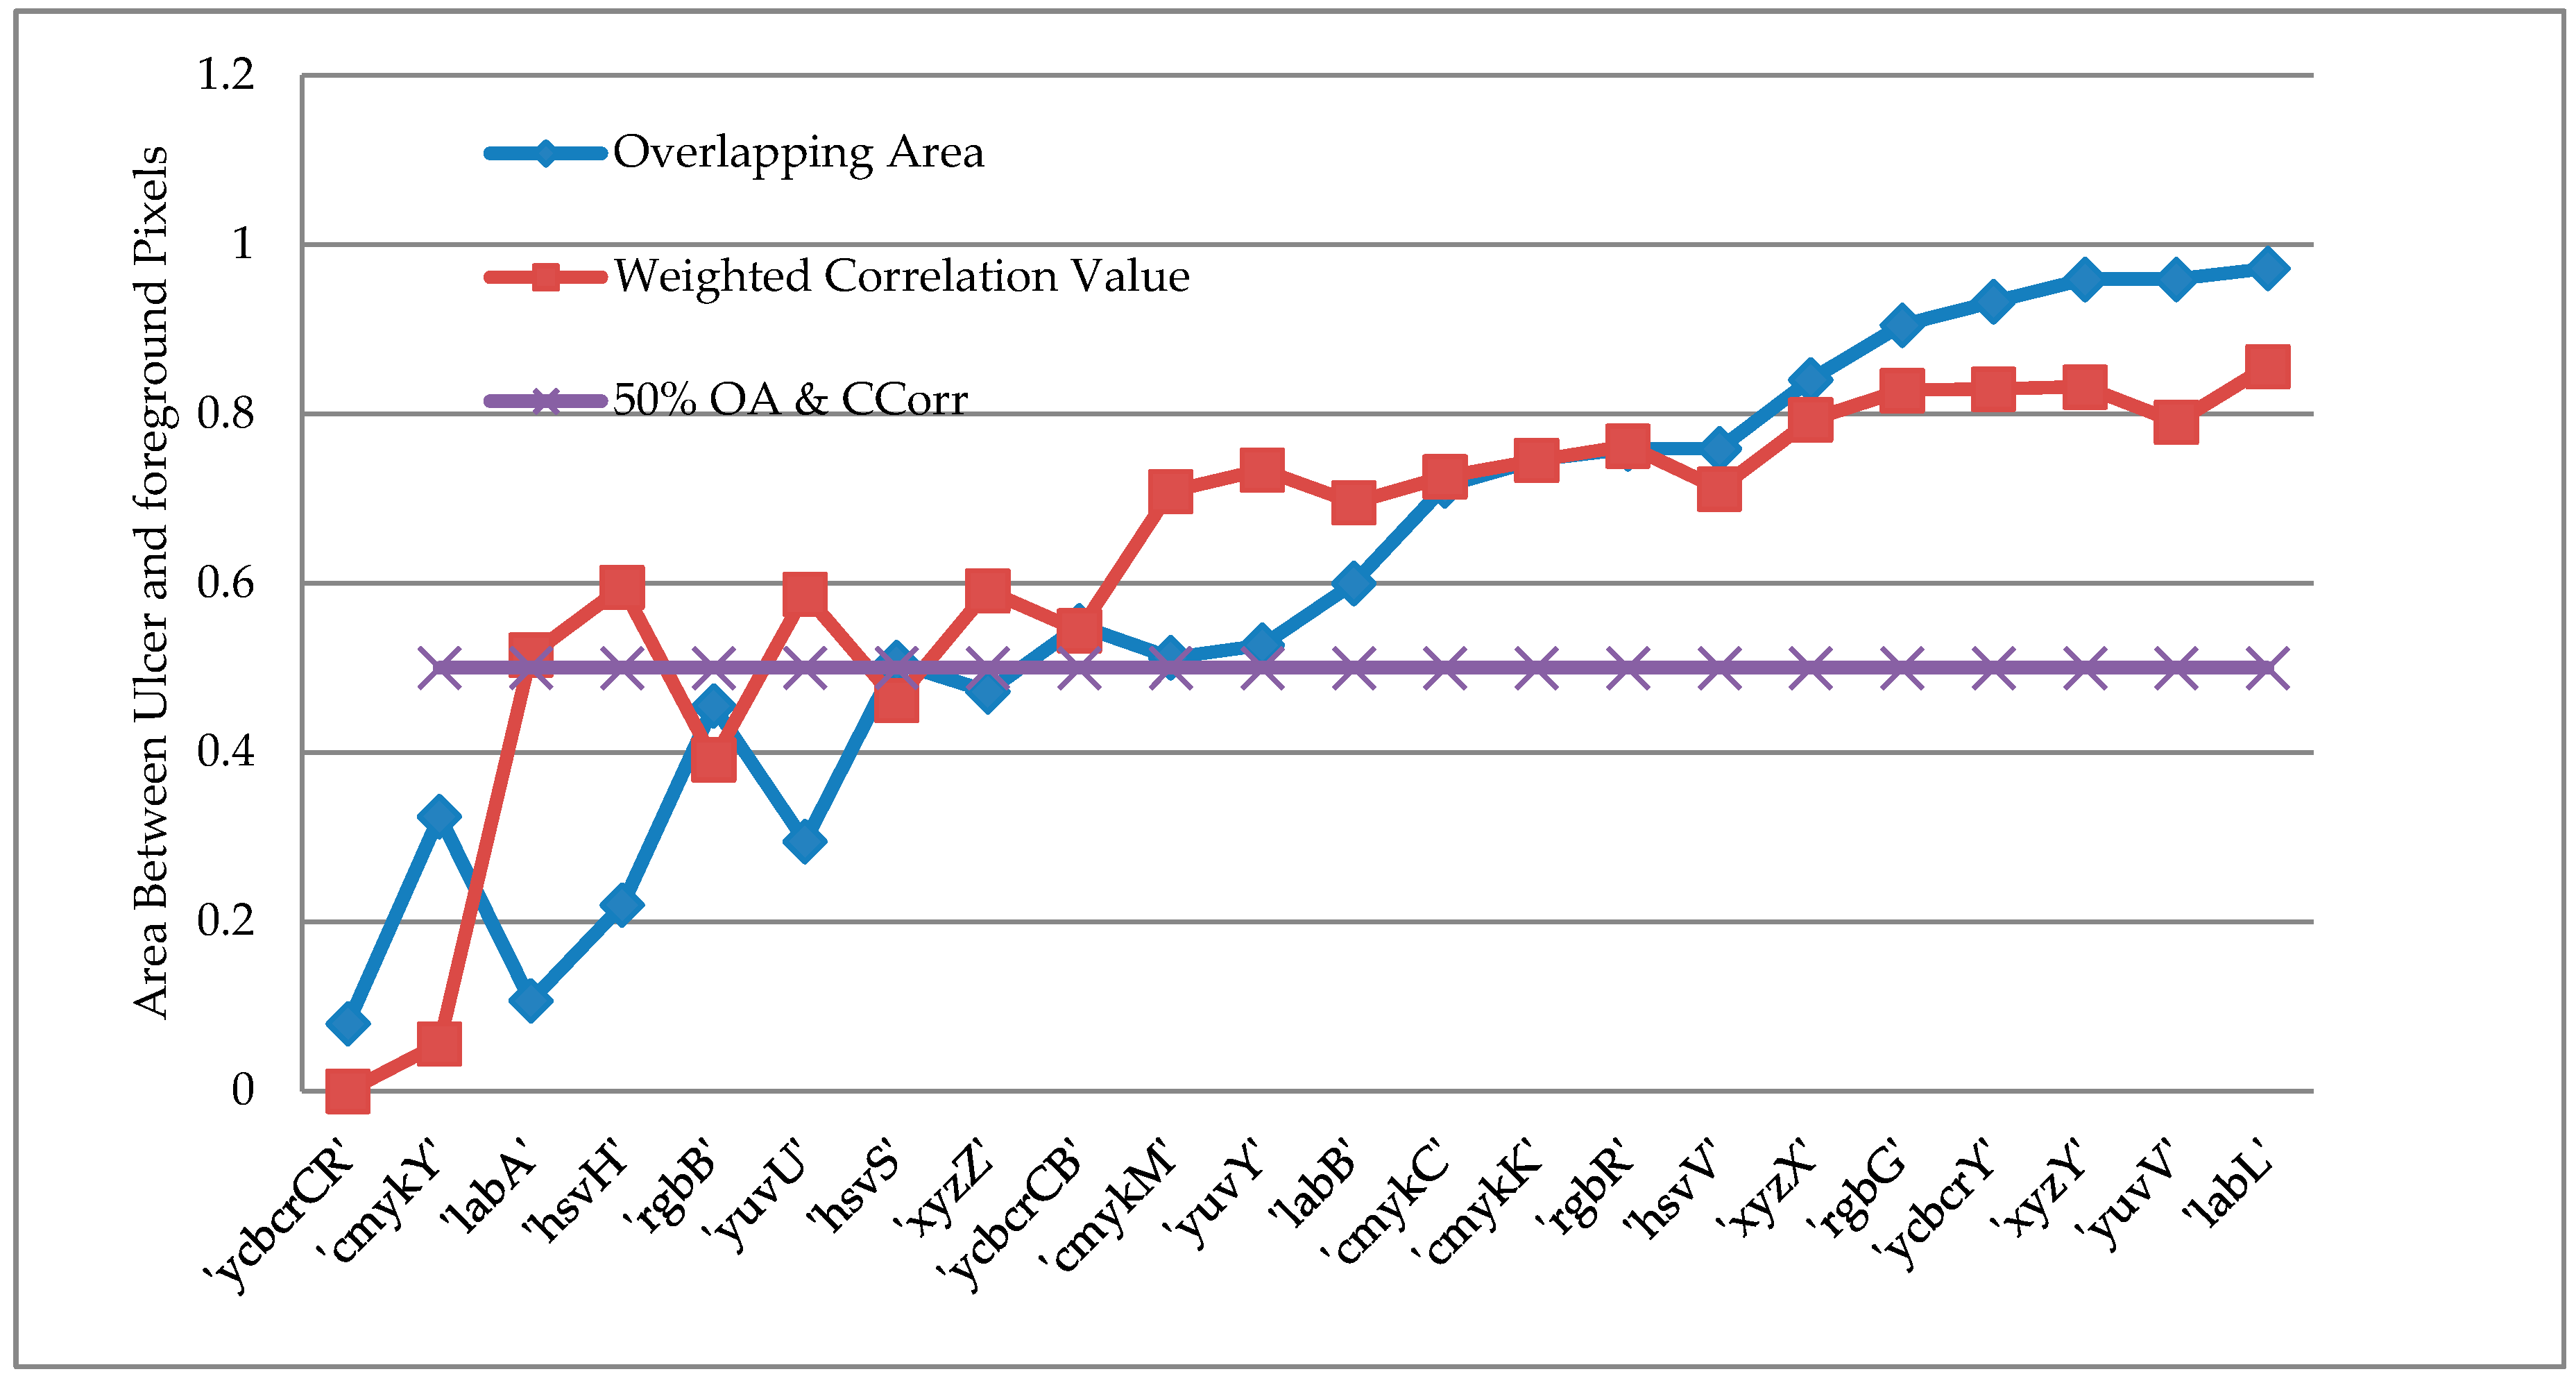
4.2. Results of Statistical Analysis

The results are presented in Table 1.
From Table 1, it is apparent that the overlapping area method (Method 1) can better reveal the ulcer information with the following bands (arranged in the descending performance): ycbcrCR, cmykY, CIE LabA, hsvH, rgbB, yuvU, and CIE LabL. Similarly, by using overlapping area with cross-correlation (Method 2), bands such as ycbcrCr, cmykY, rgbB, and hsvS contains more information for ulcer lesion. In Figure 3, we have extracted the feature vector for each band using Method 1 and Method 2. By choosing 50% of overlapping area and cross-correlation, it gives us six color bands such as ycbcrCR, cmykY, CIE LabA, hsvH, rgbB, and yuvU (i.e., the first six output rows of Table 1) using Method 1 and four color bands such as ycbcrCr, cmykY, rgbB and hsvS (i.e., the first four rows in Table 1) using Method 2. We found that the performance classifiers such as sensitivity, specificity, and accuracy are similar when more than 50% of overlapping area and cross-correlation are chosen. Otherwise, the performance is degraded and we might not be able to extract sufficient features.
The x-axis in Figure 3 shows the color bands for Method 2 (i.e., similar to column 5 in Table 1). A total of 50% of overlapping area (six feature vectors) and cross-correlation (four feature vectors) is taken as feature vector for Method 1 and Method 2. For Method 1 (OA), data on blue line containing ycbcrCR, cmykY, CIE LabA, hsvH, rgbB, and yuvU are chosen as feature vector as they have less overlapping area between ulcer and foreground pixels. For Method 2 (OACCorr), data on red line containing ycbcrCR, cmykC, rgbB, and hsvS are chosen as feature vector the overlapping areas added with standard measure of degree of similarity between two images are displayed in an incremental manner. The selected feature vectors were further fed into the classifier in order to analyze the algorithm performance in terms of sensitivity, specificity, and accuracy.
These bands provide the best result in terms of separating the ulcerated and non-ulcerated pixels. To enhance the result of classification, we fed the selected band to the SVM classifier. In this classifier, we used radial basis function (RBF) as kernel for the SVM. The result of classification for performance matrices is shown in Table 2.

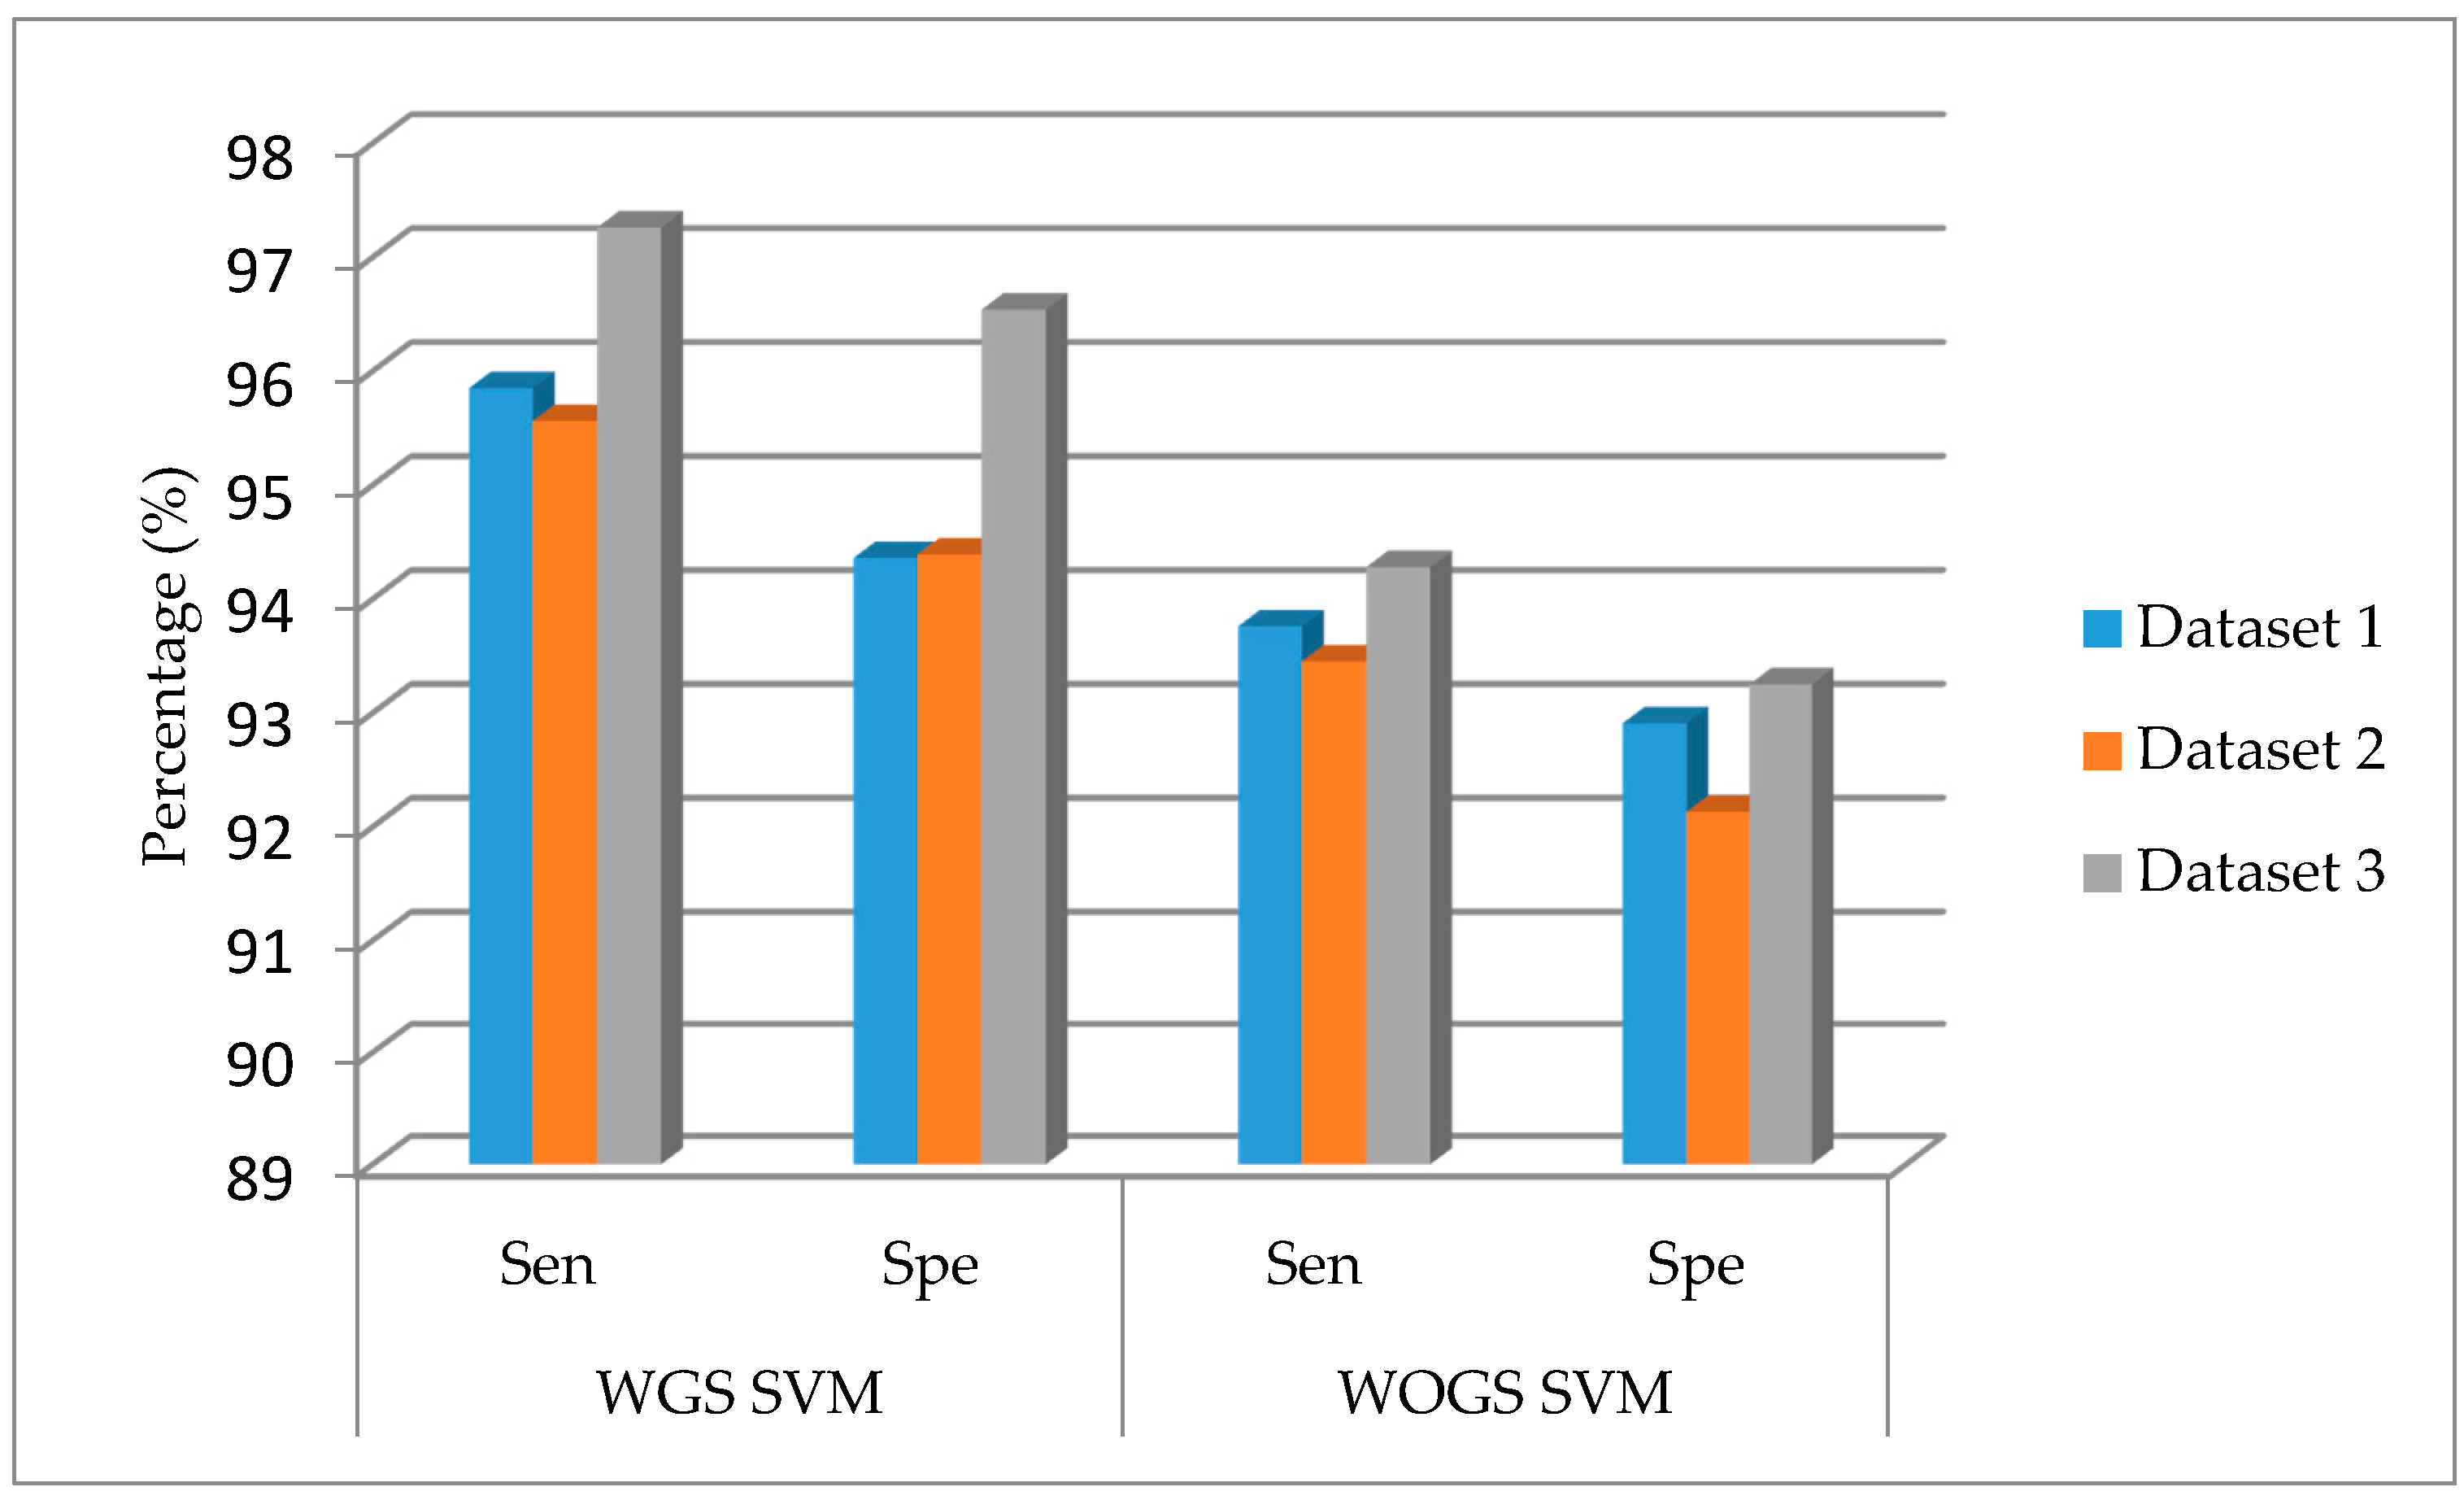
4.3. Performance Metrics

Performance metrics such as accuracy (Acc), sensitivity (Sen), and specificity (Spe) were computed to evaluate the effectiveness of the proposed method. For the experimentation on GIT image data set, the positive sample represents lesion images and the negative sample represents normal images. The equations for sensitivity and specificity can be expressed as:
Accuracy (Acc) = TP + TN/(TP + TN + FP + FN)
Sensitivity (Sen) = TP/(TP + FN)
Specificity (Spe) = TN/(FP + TN)
where TP represents the number of true positives, TN represents the number of true negatives, FP represents the incorrect positive image samples identified and FN represents the incorrect negative image samples identified. From the clinical experts, sensitivity defines the probability of a positive analysis and specificity is the probability of a negative analysis.
In Table 2, SVM (OA) is depicted as Support vector machine for overlapping area. It is computed for seven bands, six bands, and five bands and the results are shown in Table 2. Similarly, SVM (OACCorr) is a support vector machine for overlapping area with cross-correlation value and it is computed for four bands, three bands, and two bands. Here, Cr, Y, A, H and B give better results for Method 1 (OA). On the other hand, Cr, Y and B give the best result with Method 2 (OACCorr). Specifically, Method 2 is more promising than Method 1. The above results shows that combining various color bands can provide more meaningful results.
Figure 4 shows the analyses of SVM (OACCorr) by using grid search method (WGS) and without grid search method (WOGS). The accuracies of 3 datasets have been compared. From the results taken from Cr, Y, B color bands, the extracted feature is more obvious using grid search method. For this method, the average accuracy, sensitivity, and specificity are 97.89%, 96.22% and 95.09%, respectively.
Additionally, we have compared our results of classification with others as presented in Table 3. It is important to note the dataset provided by other authors might be extracted from different capsule. Therefore, for comparison purpose, the dataset employed in the current work has been used for all methods, including those reported by other researchers (Table 3 shows the dataset used by other authors). The authors in [31] combined the merits of both Contourlet transform and Log Gabor filter in HSV color space; however, their dataset was very small. Author from [13] utilized RGB and HSV color space and classification was performed using MLP neural network. By using color coherence vector (CCV), a promising result was attained. As reported in [32], color wavelet covariance feature was used on various color spaces, and Texton boost was applied to classify normal and abnormal tissues. It is interesting to note that the proposed method shows higher sensitivity and higher specificity even for a very large dataset.

5. Conclusions

This paper has outlined a new method for detecting ulcer in an entire GIT. This method utilizes the divide-and-conquers technique to extract ulcer frame from a complete video footage. Statistical analysis has been performed to achieve higher separation between ulcer and non-ulcerated pixels. This technique has sub-parts for computing feature vectors in order to reveal highly-relevant information for ulcer and non-ulcer pixel discrimination which includes image enhancement, transformation of various color space, statistic feature computation, and classification. Statistical analysis has been performed to achieve higher separation between ulcer and non-ulcerated pixels by using this technique. The pixels have been classified using seven color spaces. Instead of using any single color space, it is more important to extract band information using various color spaces in order to achieve more accurate results. In this proposed method, Cr, Y, and B bands have been selected from YCbCr, CMYK, and RGB color spaces, respectively. Additionally, overlapping area with correlation using grid search method has increased the performance in separating the ulcerated pixels from normal pixels. Grid method has been adopted as the searching procedure (0.8 step was used). Each γ and C value pair has been used in the training data with ten-fold cross-validation in order to evaluate the model performance. A large dataset has been used to create training and testing dataset in order to obtain meaningful result. In this work, the sensitivity and the specificity of ulcer classification using the grid search method in SVM are 96.22% and 95.09%, respectively, which are substantially higher than those of classification without grid search method (93.76% and 92.91%, respectively). The main contribution of this work is the implementation of a novel computer aided diagnostic method which can be used to discriminate ulcer pixel from non-ulcerated pixel. The method exhibits promising performance in terms of sensitivity, specificity, and accuracy. The current work has paved the way to providing a reliable computer-aided WCE diagnosis system.

Acknowledgments

This research work is supported by the Centre for Intelligent Signal and Imaging Research (CISIR) and the Graduate Assistantship (GA) scheme, Universiti Teknologi PETRONAS, Perak, Malaysia.

Author Contribution

Shipra Suman finished the draft of this paper. Fawnizu Azmadi Hussin contributed in the design of the experimental work. Aamir Saeed malik contributed in feature extraction and feature selection algorithm for better discrimination between ulcer and foreground pixel. Shiaw Hooi Ho and Ida Hilmi contributed in the labelling of Ulcer dataset used in the experiment. Alex Hwong-Ruey Leow and Khean-Lee Goh have contribution towards disease specification and other challenges found throughout the writing and other reviewing procedure. All authors reviewed and approved the contents of this paper.

Conflicts of Interest

The authors declare no conflict of interest.

Abbreviations

AVIAudio Video Interleaved
CADComputer Aided Design
CCVColor Coherence Vector
DLData Logger
GITGastrointestinal Tract
GLCMGrey Level Co-Occurrence Matrix
LLCLocality-constrained Linear Coding
OAOverlapping Area
OACCorrOverlapping area with Cross-correlation
RBFRadial Basis Function
SVMSupport Vector Machine
WCEWireless Capsule Endoscopy
WGSWith Grid Search
WOGSWithout Grid Search

References

  1. Kaplan, G.G.; Ng, S.C. Understanding and preventing the global increase of inflammatory bowel disease. Gastroenterology 2017, 152, 313–321. [Google Scholar] [CrossRef] [PubMed]
  2. Kaplan, G.G.; Jess, T. The changing landscape of inflammatory bowel disease: East meets West. Gastroenterology 2016, 150, 24–26. [Google Scholar] [CrossRef] [PubMed]
  3. Colombel, J.-F.; Mahadevan, U. Inflammatory Bowel Disease 2017: Innovations and Changing Paradigms. Gastroenterology 2017, 152, 309–312. [Google Scholar] [CrossRef] [PubMed]
  4. Iddan, G.; Meron, G.; Glukhovsky, A.; Swain, P. Wireless capsule endoscopy. Nature 2000, 405, 417. [Google Scholar] [CrossRef] [PubMed]
  5. Ghoshal, U.C. Capsule Endoscopy: A New Era of Gastrointestinal Endoscopy. In Endoscopy of GI Tract; InTech: Rijeka, Crotia, 2013. [Google Scholar]
  6. Deeba, F.; Mohammed, S.K.; Bui, F.M.; Wahid, K.A. Unsupervised Abnormality Detection Using Saliency and Retinex Based Color Enhancement. In Proceedings of the 2016 IEEE 38th Annual International Conference of the Engineering in Medicine and Biology Society (EMBC), Orlando, FL, USA, 16–20 August 2016; pp. 3871–3874. [Google Scholar]
  7. Deeba, F.; Mohammed, S.K.; Bui, F.M.; Wahid, K.A. A Saliency-Based Unsupervised Method for Angioectasia Detection in Capsule Endoscopic Images. CMBES Proc. 2016, 39, 1–11. [Google Scholar]
  8. Yuan, Y.; Wang, J.; Li, B.; Meng, M.Q.-H. Saliency based ulcer detection for wireless capsule endoscopy diagnosis. IEEE Trans. Med. Imaging 2015, 34, 2046–2057. [Google Scholar] [CrossRef] [PubMed]
  9. Iakovidis, D.K.; Koulaouzidis, A. Automatic lesion detection in capsule endoscopy based on color saliency: Closer to an essential adjunct for reviewing software. Gastrointest. Endosc. 2014, 80, 877–883. [Google Scholar] [CrossRef] [PubMed]
  10. Charisis, V.S.; Katsimerou, C.; Hadjileontiadis, L.J.; Liatsos, C.N.; Sergiadis, G.D. Computer-Aided Capsule Endoscopy Images Evaluation Based on Color Rotation and Texture Features: An Educational Tool to Physicians. In Proceedings of the 2013 IEEE 26th International Symposium on Computer-Based Medical Systems (CBMS), Porto, Portugal, 20–22 June 2013; pp. 203–208. [Google Scholar]
  11. Iakovidis, D.K.; Koulaouzidis, A. Software for enhanced video capsule endoscopy: Challenges for essential progress. Nat. Rev. Gastroenterol. Hepatol. 2015, 12, 172–186. [Google Scholar] [CrossRef] [PubMed]
  12. Koulaouzidis, A.; Iakovidis, D.K.; Karargyris, A.; Plevris, J.N. Optimizing lesion detection in small-bowel capsule endoscopy: From present problems to future solutions. Exp. Rev. Gastroenterol. Hepatol. 2015, 9, 217–235. [Google Scholar] [CrossRef] [PubMed]
  13. Yeh, J.-Y.; Wu, T.-H.; Tsai, W.-J. Bleeding and ulcer detection using wireless capsule endoscopy images. J. Softw. Eng. Appl. 2014, 7, 422. [Google Scholar] [CrossRef]
  14. Mohammed, S.K.; Deeba, F.; Bui, F.M.; Wahid, K.A. Feature Selection Using Modified Ant Colony Optimization for Wireless Capsule Endoscopy. In Proceedings of the IEEE Annual Ubiquitous Computing, Electronics & Mobile Communication Conference (UEMCON), New York, NY, USA, 20–22 October 2016; pp. 1–4. [Google Scholar]
  15. Suman, S.; Hussin, F.A.B.; Walter, N.; Malik, A.S.; Ho, S.H.; Goh, K.L. Detection and Classification of Bleeding Using Statistical Color Features for Wireless Capsule Endoscopy Images. In Proceedings of the International Conference on Signal and Information Processing (IConSIP), Vishnupuri, India, 6–8 October 2016; pp. 1–5. [Google Scholar]
  16. Suman, S.; Hussin, F.A.; Walter, N.; Malik, A.S.; Hilmi, I. Automatic Detection and Removal of Bubble Frames from Wireless Capsule Endoscopy Video Sequences. In Proceedings of the 2016 6th International Conference on Intelligent and Advanced Systems (ICIAS), Kuala Lumpur, Malaysia, 15–17 August 2016; pp. 1–5. [Google Scholar]
  17. Suman, S.; Hussin, F.A.; Nicolas, W.; Malik, A.S. Ulcer Detection and Classification of Wireless Capsule Endoscopy Images Using RGB Masking. Adv. Sci. Lett. 2016, 22, 2764–2768. [Google Scholar] [CrossRef]
  18. Ibraheem, N.A.; Hasan, M.M.; Khan, R.Z.; Mishra, P.K. Understanding color models: A review. ARPN J. Sci. Technol. 2012, 2, 265–275. [Google Scholar]
  19. Suman, S.; Walter, N.; Hussin, F.A.; Malik, A.S.; Ho, S.H.; Goh, K.L.; Hilmi, I. Optimum colour space selection for ulcerated regions using statistical analysis and classification of ulcerated frames from wce video footage. In Neural Information Processing, Part I, Proceedings of the 22nd International Conference, ICONIP 2015, Istanbul, Turkey, 9–12 November 2015; Arik, S., Huang, T., Lai, W.K., Liu, Q., Eds.; Springer: Cham, Switzerland, 2015; pp. 373–381. [Google Scholar]
  20. Figueiredo, P.N.; Figueiredo, I.N.; Prasath, S.; Tsai, R. Automatic polyp detection in pillcam colon 2 capsule images and videos: Preliminary feasibility report. Diagn. Ther. Endosc. 2011, 2011. [Google Scholar] [CrossRef] [PubMed]
  21. Figueiredo, I.N.; Kumar, S.; Leal, C.; Figueiredo, P.N. Computer-assisted bleeding detection in wireless capsule endoscopy images. Comput. Methods Biomech. Biomed. Eng. 2013, 1, 198–210. [Google Scholar] [CrossRef]
  22. Colantoni, P. Color Space Transformations. Available online: http://faculty.kfupm.edu.sa/ics/lahouari/Teaching/colorspacetransform-1.0.pdf (accessed on 8 June 2017).
  23. Pascale, D. A review of rgb color spaces… from xyy to r’g’b’. Babel Color 2003, 18, 136–152. [Google Scholar]
  24. Wiggins, R.H.; Davidson, H.C.; Harnsberger, H.R.; Lauman, J.R.; Goede, P.A. Image file formats: Past, present, and future. Radiographics 2001, 21, 789–798. [Google Scholar] [CrossRef] [PubMed]
  25. Suman, S.; Hussin, F.A.; Malik, A.S.; Walter, N.; Goh, K.L.; Hilmi, I.; Ho, S.h. Image Enhancement Using Geometric Mean Filter and Gamma Correction for WCE Images. In Proceedings of the 21st International Conference on Neural Information Processing, Kuching, Malaysia, 3–6 November 2014; pp. 276–283. [Google Scholar]
  26. Saevarsson, B.B.; Sveinsson, J.R.; Benediktsson, J.A. Combined Curvelet and Wavelet Denoising. In Proceedings of the 7th Nordic Signal Processing Symposium, NORSIG 2006, Rejkjavik, Iceland, 7–9 June 2006; pp. 318–321. [Google Scholar]
  27. Ahmed, A.; Sharkawy, M.E.; Ramly, S.E. Analysis of Inter-band Spectral Cross-Correlation Structure of Hyperspectral Data. In Proceedings of the WSEAS International Conference Recent Advances in Computer Engineering Series, Istanbul, Turkey, 21–23 August 2012. [Google Scholar]
  28. Chang, C.-C.; Lin, C.-J. LIBSVM: A library for support vector machines. ACM Trans. Intell. Syst. Technol. (TIST) 2011, 2, 27. [Google Scholar] [CrossRef]
  29. Hsu, C.-W.; Chang, C.-C.; Lin, C.-J. A Practical Guide to Support Vector Classification; National Taiwan University: Taipei City, Taiwan, 2003. [Google Scholar]
  30. Bengio, Y. Practical recommendations for gradient-based training of deep architectures. In Neural Networks: Tricks of the Trade; Springer: Berlin/Heidelberg, Germany, 2012; pp. 437–478. [Google Scholar]
  31. Koshy, N.E.; Gopi, V.P. A New Method for Ulcer Detection in Endoscopic Images. In Proceedings of the 2015 2nd International Conference on Electronics and Communication Systems (ICECS), Coimbatore, India, 26–27 Febuary 2015; pp. 1725–1729. [Google Scholar]
  32. Liu, X.; Gu, J.; Xie, Y.; Xiong, J.; Qin, W. A New Approach to Detecting Ulcer and Bleeding in Wireless Capsule Endoscopy Images. In Proceedings of the 2012 IEEE-EMBS International Conference on Biomedical and Health Informatics (BHI), Hong Kong, China, 5–7 January 2012; pp. 737–740. [Google Scholar]
Figure 1. WCE images with bleeding and ulcer. (a,b) Ulcer image; and (c,d) bleeding images.
Applsci 07 01097 g001
Figure 2. Methodology of proposed feature selection and classification.
Applsci 07 01097 g002
Figure 3. Comparison of overlapping area and Weighted correlation value.
Applsci 07 01097 g003
Figure 4. Performance of the proposed method.
Applsci 07 01097 g004
Table 1. Comparison of overlapping area with overlapping area and cross-correlation method.
Serial No.OAOACCorr
Band No.Band NameBand No.Band Name
19ycbcrCR9ycbcrCR
211CIE LabA21cmykY
34hsvH11CIE LabA
417yuvU4hsvH
521cmykY3rgbB
63rgbB17yuvU
715xyzZ5hsvS
85hsvS15xyzZ
920cmykM8ycbcrCB
1016yuvY20cmykM
118ycbcrCB16yuvY
1212CIE LabB12CIE LabB
1319cmykC19cmykC
1422cmykK22cmykK
151rgbR1rgbR
166hsvV6hsvV
1713xyzX13xyzX
182rgbG2rgbG
197ycbcrY7ycbcrY
2014xyzY14xyzY
2118yuvV18yuvV
2210CIE LabL10CIE LabL
Table 2. Sensitivity, specificity, and accuracy using SVM classifier.
MethodsColor Bands
Cr, Y, A, H, B, UCr, Y, A, H, BCr, Y, A, H
Method 1SVM (OA)SenSpeSenSpeSenSpe
90.3290.5591.9891.5691.5891.23
Cr, Y, B, SCr, Y, BCr, Y
Method 2SVM (OACCorr)SenSpeSenSpeSenSpe
92.5891.8493.7692.9193.0891.36
Table 3. Comparison of performance with other author work.
AuthorColor Space/BandsClassifierDatasetAcc (%)Sen (%)Spe (%)
[31]HSVSVM137 images94.8391.8997.16
[13]RGB, HSV, CCVMLP448 images86.9389.0385.56
[32]Various color spaceJoint boost100 imagesNA91.6784.73
ProposedCr, Y, BWGS SVM (OACCorr)48,000 images97.8996.2295.09

