Principles and Application of Polyimide Fiber Bragg Gratings for Surface Strain Measurement
by
Yangyang Sun
1, 
Jianyong Liu
1,*,
Yuan Wang
2,
Qinghua Zhang
1,
Jianli Duan
1,
Zhenglin Zhang
1,
Xiaodi Huang
1 and
Zewei You
1 1
College of Defense Engineering, PLA University of Science and technology, Nanjing 210007, China
2
Nanjing University of Science and technology, Nanjing 210094, China
*
Author to whom correspondence should be addressed.
Appl. Sci. 2017, 7(10), 995; https://doi.org/10.3390/app7100995
Submission received: 11 August 2017
/
Revised: 21 September 2017
/
Accepted: 22 September 2017
/
Published: 26 September 2017
(This article belongs to the Section Mechanical Engineering)
Abstract
:Although theoretical investigation has demonstrated that fewer strain transfer layers imply a greater strain transfer ratio, as well as increased accuracy, most researchers are still focused on investigating encapsulated Fiber Bragg gratings (FBGs) in surface strain measurements. This is because, in a traditional view, bare FBGs are too fragile to be mounted on the substrate for measuring surface strain. Polyimide FBGs may provide a better balance point between accuracy and protection. A new method to measure surface strain with polyimide fiber Bragg gratings is proposed. Bare polyimide FBGs have a polyimide coating, but like regular non-coated FBGs. This gives polyimide FBGs a higher strain transfer ratio and response frequency. Bare polyimide FBGs can be considered as uncoated FBGs. The coupling of the matrix material of polyimide FBGs is improved as compared to FBGs without coating. In order to verify the capacity for surface strain measurement, polyimide FBGs are mounted to obtain the surface strain of a concrete specimen with SM130-700 interrogator from Micron Optics Incorporation (MOI) with a sampling frequency maximum of 2000 Hz. The experiment demonstrates that polyimide FBGs work well even in dynamic surface strain measurements such as explosion measurement. Validation experiment in this paper also proposed that fewer strain transfer layers can increase dynamic response frequency and coupling between FBG and substrate.
1. Introduction
Surface strain measurement is important and useful for civil engineering experiments. In traditional investigations, electronic strain gauges (ESGs) were commonly used. Recently, Fiber Bragg grating (FBG) sensors have been mounted to measure surface strain. Fiber Bragg gratings (FBGs) are functional fiber-optical sensors with excellent measurement precision, good stability, short response time, and provide quasi-distributed measurement. They have gradually become a preferred sensor and have wide applications in hydraulic engineering, electrical power engineering and the petrochemical industry in the measurement of structural defects and structural stress–strain [1,2,3,4,5,6,7,8].
FBGs can be used in two ways. One is through encapsulation with some protection material; the other is through use of the bare FBG on its own. Encapsulation can provide protection but will increases cost and mounting complexity. Bare FBGs which means FBGs without encapsulation have many benefits, such as high strain transfer ratio, low cost and easy mounting. Although bare FBGs may not be fragile as researchers believe, the confidence of some users is still decreased.
Therefore, polyimide FBG is a perfect solution. Polyimide FBGs are made from FBGs without coating. After the original coating is removed, a polyimide surface is painted outside the cladding of the FBGs. Surface strain measured by bare polyimide FBG can be compared with that measured by uncoated FBG in calibration experiment as shown in Figure 1. From the result, the polyimide coating did not influence the strain measured. Commonly, the polyimide coating can be negligible when mounted to the surface of the substrate [9]. As to say, the bare polyimide FBG can be always considered as uncoated FBG when mounted on the surface of substrate.
Because the diameter of polyimide fiber is much smaller than commonly used fiber, the polyimide coating cannot be removed by fiber-stripping tools. Polyimide-recoated FBGs are stiff enough that fiber cutters cannot cut them off. It can be mounted to the surface of a substrate or specimen to measure the surface strain without any encapsulation or calibration.
Since Cox et al. [10] proposed shear-lag theory, many classical strain transfer models have been studied by researchers. Ansari et al. [11] proposed a strain transfer model for coated bare-fiber Bragg gratings for the first time. Strain transfer ratio of a coated FBG can be impacted by length bonded obviously. It also demonstrated that strain transfer ratio of a coated FBG cannot surpass 90% even the length bonded is over 18cm. This strain transfer model is suited to cases where the interlayer between the fiber and substrate is a soft layer. For an FBG sensor, Li et al. [12,13] proposed an FBG bonding layer substrate three-layer strain-transferring model, fiber-interlayer-substrate, by disregarding the structural differences between the fibers themselves, and conducted experiments on cantilever beams to assess the proposed model. The interlayer in Li’s model must be a stiff layer. That is to say, the modulus of the interlayer must be high enough. Sun et al. [14] made an improvement on Li’s investigation by taking into account temperature variations and non-axial stresses. The angle of stress and substrate is considered. Sun et al. [15] proposed a novel theoretical model for the axial strain distribution of a clamped FBG sensor. Based on the research of Li and Ansari, Kai Tai Wan et al. [16] investigated the influence of four geometric parameters of the adhesive, side width, top thickness, bond length, bottom thickness, and then proposed a strain transfer model to suit stiff-layer cases. It provided a method to rectify Ansari’s strain transfer model when the interlayer is a stiff layer. Zhou et al. [17] presented the strain transfer mechanism and the error modification theory of an embedded FBG sensor. Similarly, Wu et al. [18] established a four-layer core-coating bonding layer substrate model of strain transfer by taking the structural differences among fibers into consideration. Takeda et al. [19] proposed a method in which small-diameter fiber Bragg grating (FBG) sensors were applied for the monitoring of delamination induced by low-velocity impact. Okabe et al. [20,21] detected transverse cracks in Carbon Fiber Reinforced Polymer (CFRP) composites using uncoated fiber Bragg grating sensors and polyimide FBGs.
Based on a strain transfer model of bare FBG, Zhang et al. [22] proposed a method to obtain surface strain on a Carbon Fiber Reinforced Polymer (CFRP)-reinforced concrete arch with bare FBGs, as shown in Figure 2. Based on the Hilbert–Huang transform, the cracking time of the concrete arch can be calculated accurately. You et al. [23] proposed an approach to measure the internal strain of similar material based on embedded bare fiber Bragg gratings. In this research, the impact of substrate modulus to strain transfer ratio is considered carefully because the similar material is a type of low modulus material. Its modulus is always hundreds MPa. The investigation indicates that embedding bare FBG into a specimen can measure the constitutive relation precisely, and it is more accurate than the traditional approach.
All these classical strain transfer models demonstrate that polymeric coating can reduce the strain transfer ratio and that more strain transfer layers mean less strain transfer effectiveness. A new experiment with distributed technology can also obtain these conclusions. In the experiment, an encapsulated fiber was bonded to the cantilever beam by an epoxy adhesive and a glue stripe. Above the beam, the two sections of the fiber were covered by epoxy resin together with another section, and were covered by a glue stripe under the beam. The distributed interrogator was the ODISI OBR 4600 (Luna, Inc, Roanoke, VA, USA). Its minimum sensor spacing is 1 cm. The experiment and result is shown in Figure 3. It is concluded that the strain transfer ratio can be clearly reduced by a multi-layer between the fiber and substrate.
In contrast with other works in the literature, polyimide fiber Bragg gratings are investigated in this paper. Bare fibers are not fragile when covered by epoxy adhesive. The adhesive-fiber composite material sensors are stiff and durable, even in some strict experiments or Structure Health Monitoring (SHM) cases. On the basis of prior research, in this paper the structural differences of the fibers are considered and a three-layer core-bonding layer-substrate model of strain transfer by using the bare polyimide FBG is established. The proposed model was used to investigate the key factors impacting strain transfer. A calibration experiment was conducted to validate the accuracy and applicability of the strain transfer model. The results of this experiment demonstrated the advantages of polyimide FBG in measuring strain. In order to verify the practicality and ability of measuring surface strain field, the polyimide FBGs are used to get the strain in a concrete specimen with the interrogator SM130-700. The experiment shows that polyimide FBGs can be used in any surface strain measurement even in dynamic measurements, such as explosion measurements. It can be more sensitive and accurate than encapsulated optical fiber sensors.
2. Research on the Strain Transfer Model
2.1. Surface-Bonding Stain Transfer Model
Polyimide FBGs are always bonded to the surface of a substrate with adhesive. The layout of a strain transfer system through electronic microscope is shown in Figure 4.
According to the surface-bonding layout of the fiber, a core-bonding-substrate three-layer strain transfer model was established. The 2-D layout of the model is shown in Figure 5 and Figure 6. This model was based on the following three assumptions:
- (1)
- Core, bonding, and substrate are all linear elastic materials.
- (2)
- Because there is no coating, the various interfaces of core-bonding and bonding substrates can be assumed to be perfect contacts, and accordingly, the subjected axial stresses do not exceed the maximum stress, which produces a relative slip between the various interfaces.
- (3)
- Polyimide coating of the fiber can actually be neglected, as to say the polyimide FBG can be considered as uncoated FBG. The representation of the adhesive bonding structure can be considered as a triangle.
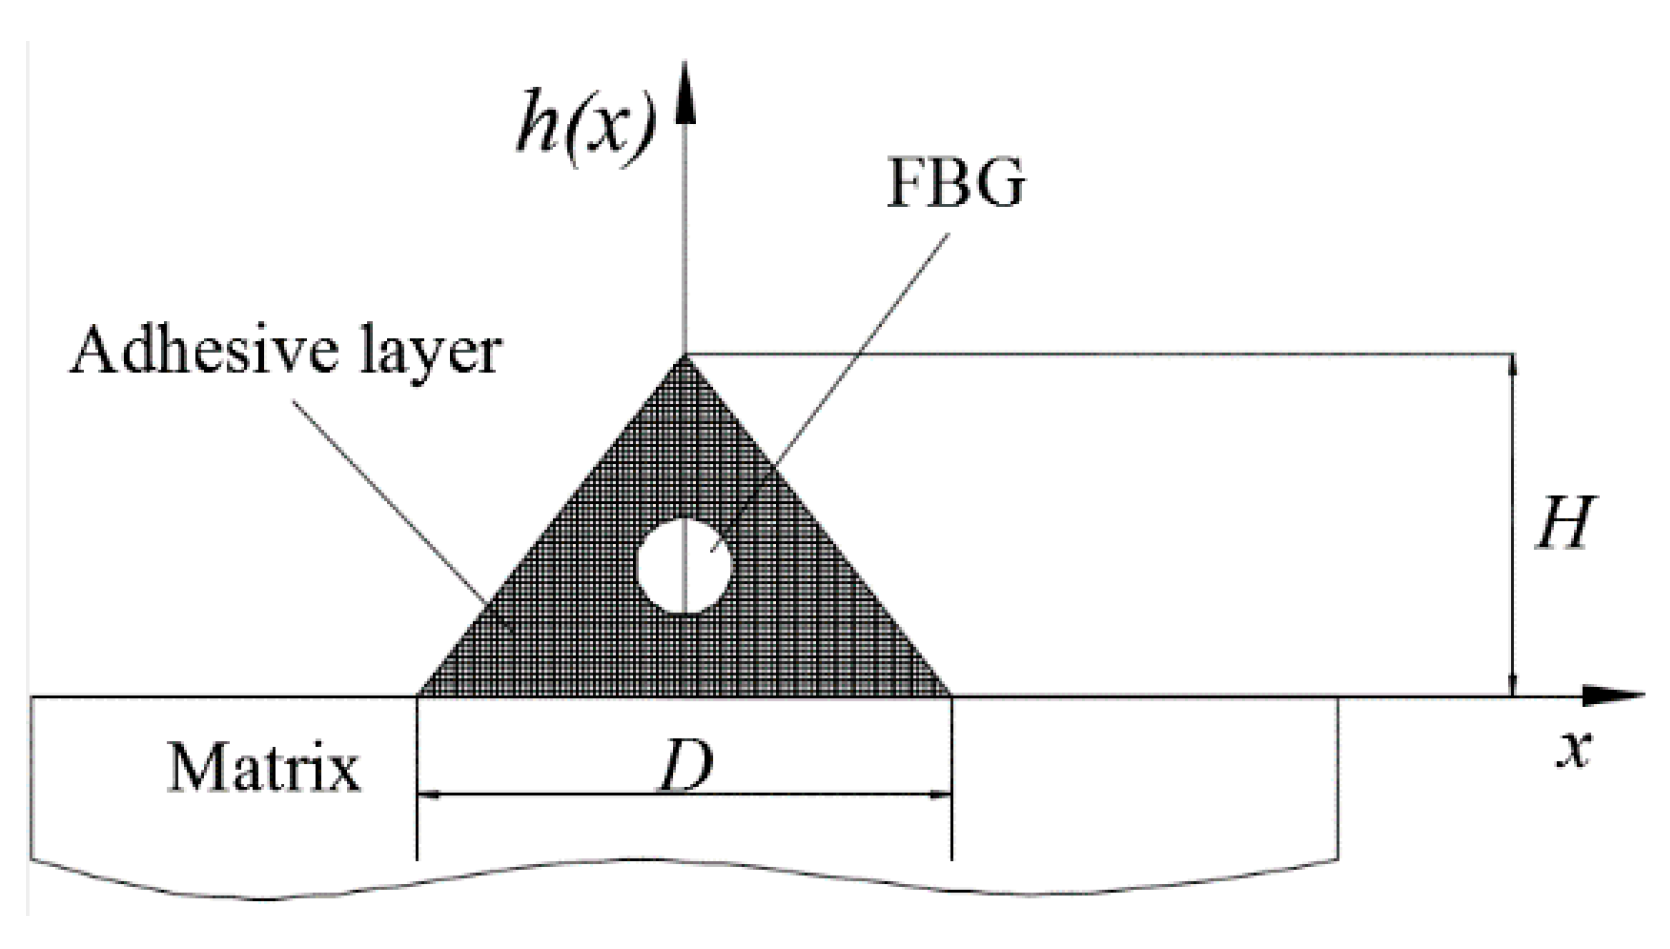
Based on the above assumptions, represents the radius of the FBG; represents the thickness of the upper bonding layer; represents the thickness of the lower bonding layer; and represents the total thickness of the bonding layer and fiber grating. The micro-stresses of bonding layer and fiber grating elements are and , respectively. is the shear stress between the fiber grating and bonding layer. represents the shear stress between bonding layer and substrate layer. Assuming the bonding length and sensor bonding width , since the model is symmetrical along axis h, the right part of the model was selected for analysis.
Applying the principle of static equilibrium to the first layer of fiber grating can produce an equilibrium equation in the x direction:
This was simplified to produce the following:
Similarly, for the infinitesimal segment of the lower bonding layer and selection of the segment , according to actual experiment and the properties of the adhesive, the bonding layer had a triangle shape after the adhesive coagulated. Assuming the vertex of the triangle was (0, H), and other two vertices were (−D/2, 0) and (D/2, 0), then the right boundary equation was as follows:
Through stress analysis on the micro-elements of the bonding layer, the equilibrium equation in x direction can be found:
Substituting Equation (2) into Equation (4) and simplifying produces the following:
Because the fiber grating and bonding layer deformed simultaneously, their strain variation rate was similar, and their elastic moduli are significantly different, so the following conditions can be justified as and , is the fiber modulus, producing the following:
Using the essential of shear-lag model, the following equation can be derived:
Applying integration on Equation (7) along the length 2L, according to symmetry the following equations can be found.
is the shear modulus of the adhesive. Because the fiber grating and bonding layer intersected at the free end of the fiber, there was no stress transfer, so ; substituting it into Equation (8) produces the following:
According to Equation (10), the average strain transfer rate measured by the fiber grating sensor can be expressed as follows:
2.2. Analysis of Strain Transfer Influential Factors
The diameter of polyimide fiber is around 130 μm, and the elastic modulus is 72 GPa [24,25]. These two parameters can be regarded as constants. According to Equation (11), the only decisive factors in strain transfer were the shear modulus of the bonding layer, the thickness of bonding layer, the bonding length, and the fiber width. When the bonding length and width of fiber are confirmed, the average strain transfer ratio of bare polyimide FBG, as shown in Figure 9, increases as the shear modulus increases.
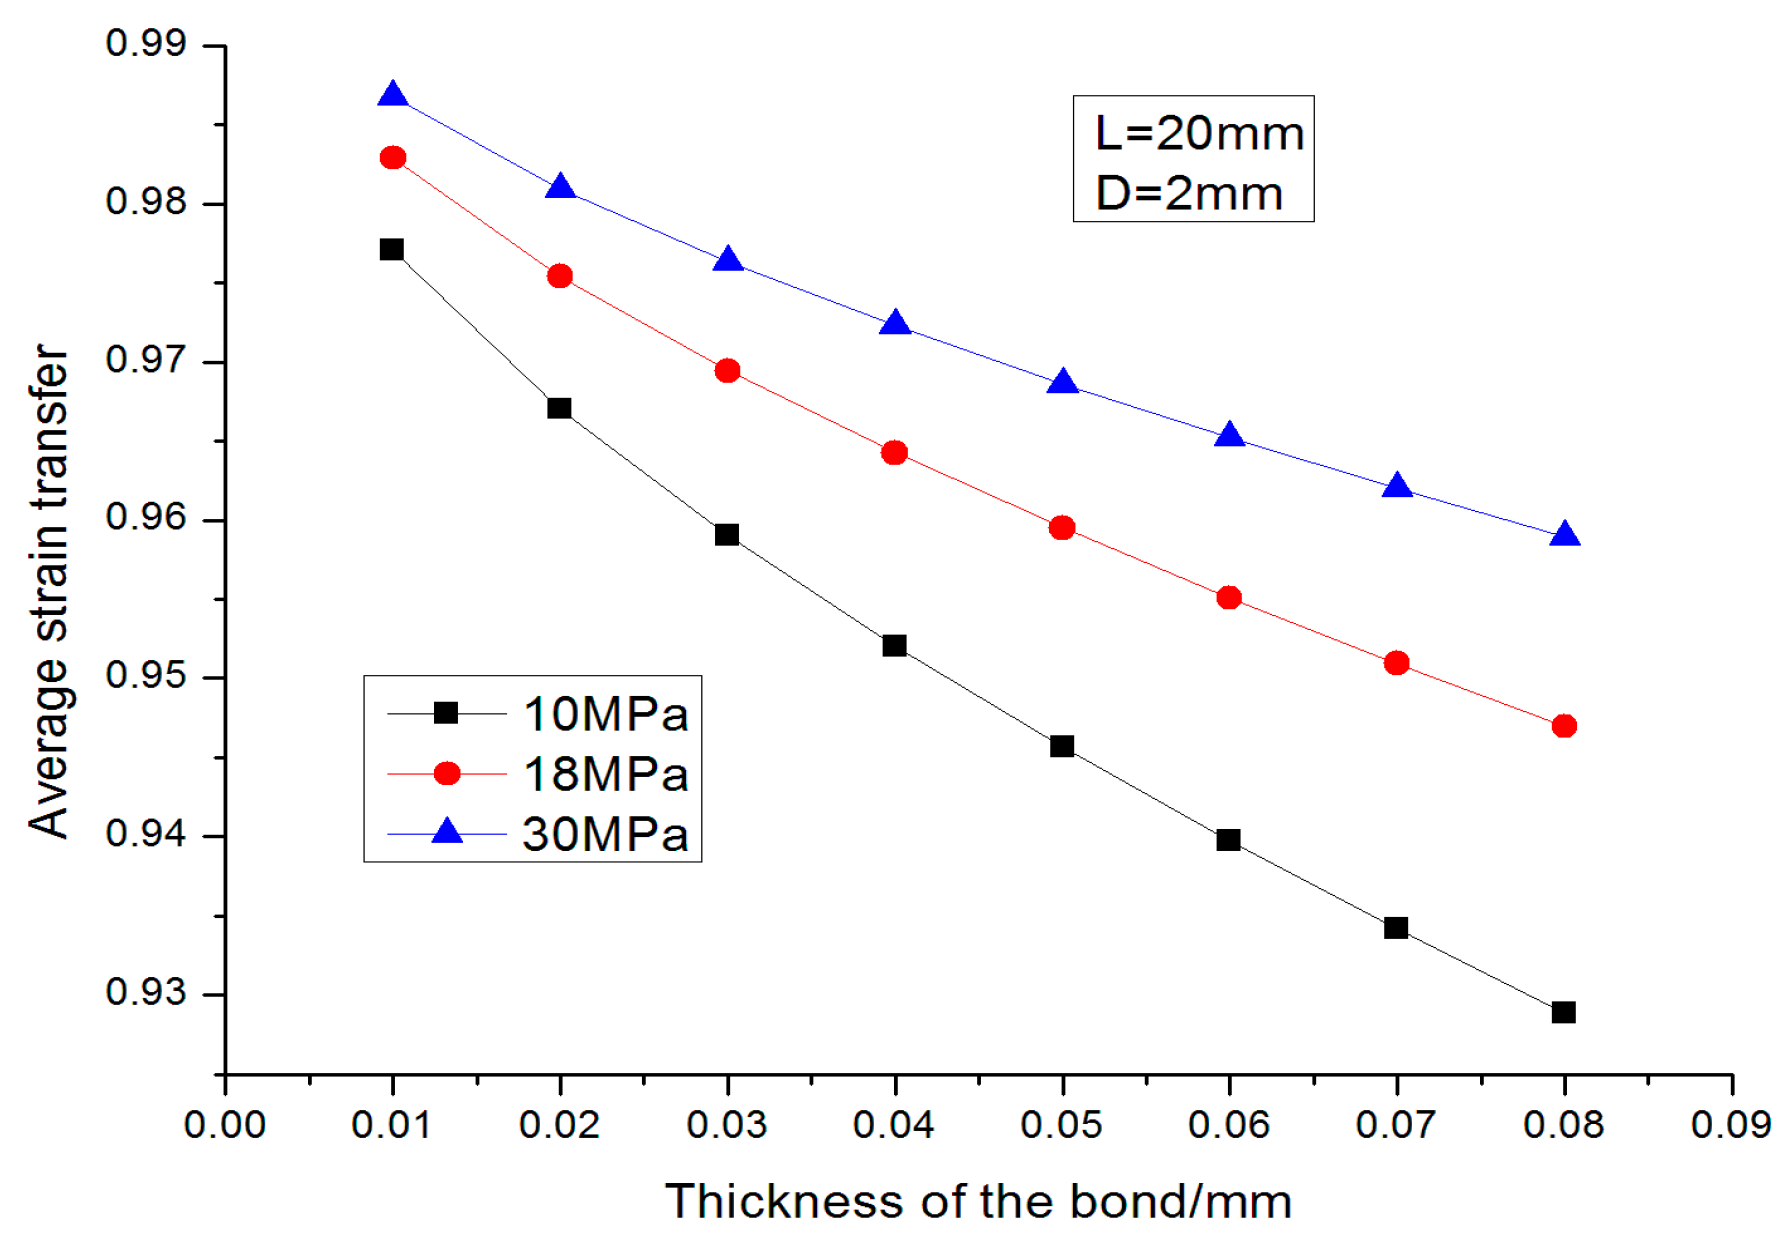
As shown in Figure 10, when the bonding length and width of fiber are fixed, the average strain transfer rate decreases as the thickness of the adhesive layer increases.
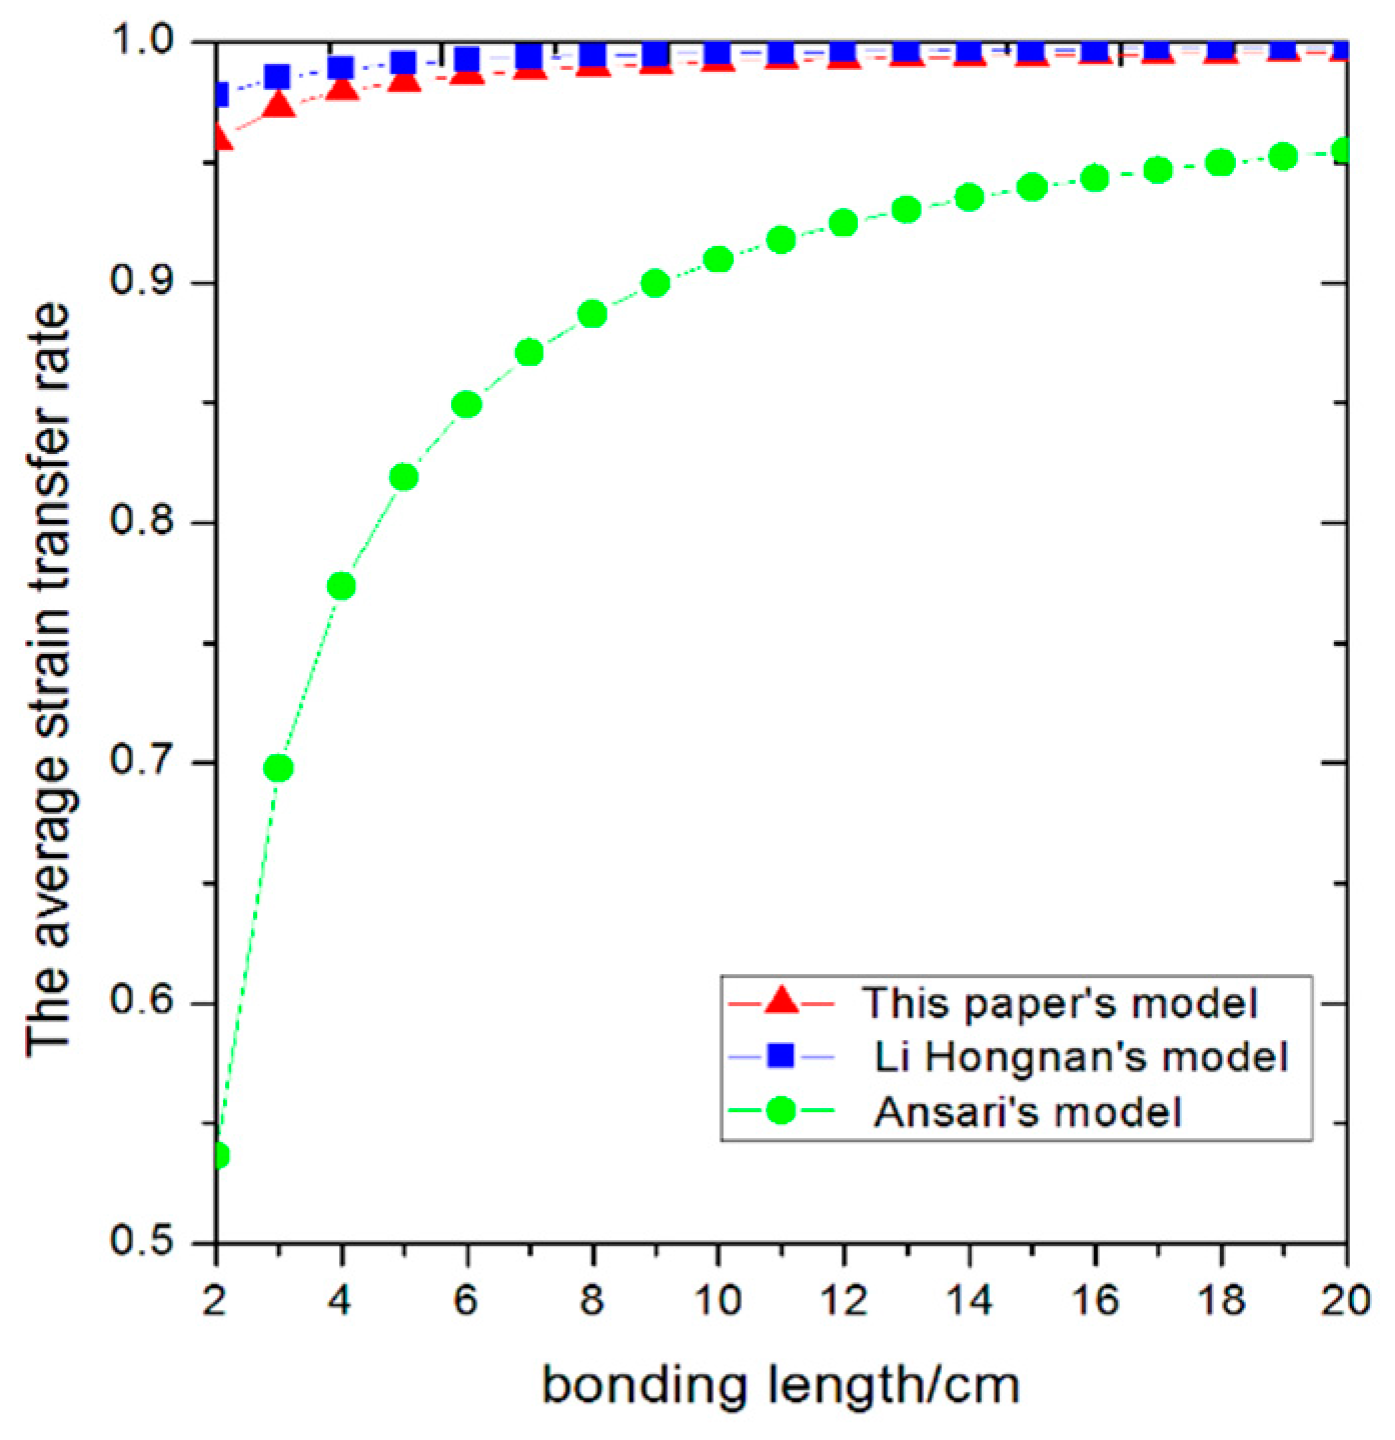
As shown in Figure 11, when the shear modulus of adhesive layer and the thickness of the bonding layer between fiber and substrate were fixed, the average strain transfer rate increased as bonding length and width increased.
As shown in Figure 12, the thickness of the upper adhesive layer of the fiber had little influence on the average strain transfer rate. It is almost negligible.
3. Strain Transfer Ratio Experiment
3.1. Bonding Method for Polyimide FBGs
The most common mounting method for bare polyimide FBGs is bonding as shown in Figure 13. According to previous investigation, the adhesive is very important for bonding. Loctite 401 instant adhesive and E-120HP epoxy adhesive are perfect choices. Bare FBGs can be bonded to substrate by Loctite 401 instant adhesive first. The instant adhesive can fix the fiber very quickly. Then, the fiber can be covered by the E-120HP epoxy adhesive. This type of epoxy adhesive has a 120-minute work life. The epoxy adhesive not only provides enough shear stress, but also provides enough protection for the bare fiber after solidifying. In fact, an instant adhesive can provide some protection after solidifying. In some experiments, even epoxy is not necessary.
3.2. Strain Transfer Ratio Analysis
The experimental system included a cantilever beam, polyimide FBGs, and a fiber grating interrogator, as shown in Figure 14. The FBG matrix fiber in the experiments was SMF-28C. It was recoated by polyimide material after being processed with UV laser-inscribing technology. Its effective reflectivity was greater than 90%. The interrogator in the experiments was SM125-500. This interrogator can identify a fiber grating sensor with a wavelength ranging from 1510 nm to 1590 nm. Its wavelength resolution is up to 1 pm and it can achieve synchronous four-channel 2 Hz sampling.
The experiments were conducted in three groups. Loctite 401 adhesive was used to bond each bare polyimide of the FBGs of different central wavelengths along the longitudinal axis at the central surface of cantilever beam in each group. The bonding length was 25 mm and bonding width was 1 mm. After adhesive had set and was confirmed to be in good condition, one end of the beam was applied stress to produce theoretical strain ; meanwhile, experimental strain was measured and recorded through a fiber grating interrogator. The FBG was above the upper surface of beam after bonding, as shown in Figure 15 in which L represents the length of the cantilever beam, r is the radius of FBG, d is the adhesive thickness between fiber and the upper surface of beam, and h is the thickness of the cantilever beam. R represents the bend radius of the cantilever beam, but it has no use in the following discussion.
In this way, the strain measured from fiber grating is definitely not equal to that of the upper surface of the cantilever beam, and the corresponding coefficient is provided by the following Equation (12):
Assuming the strain transfer rate of adhesive to be , the relationship between the upper surface strain and measured strain of fiber grating on cantilever beam can be expressed as follows:
The average strain transfer rate of bare fiber grating can be calculated as follows:
3.3. Experimental Data Analysis
The average strain transfer rates directly drawn from three groups of experimental data are shown as Figure 16, Figure 17 and Figure 18:
In traditional investigation, strain measured by FBG is considered to be equal to the cantilever beam theoretical strain. This is not accurate. Actually, the fiber is above the surface of the cantilever beam, which cause the measured strain to be higher than the theoretical strain. As to say, the average strain transfer rate must not be greater than 100%. Hence, it can be concluded that the height of fiber above the surface of the cantilever beam has more influence on strain measurement than the average strain transfer rate.
To measure the average strain transfer rate of FBG accurately, the impact of must be eliminated. The diameter of the bare polyimide FBG is about 130 μm, so the radius of it is 65 μm. Because the thickness of the bonding layer was uneven, a thickness gauge was used for measurements along the axial direction of the fiber. After multiple-time measurement, the mean value of adhesive thickness was found to be 50 μm. can be calculated by the following equation:
Table 1 shows the average strain transfer rates from three groups of experiments, theoretical average strain transfer rates calculated from Equation (11), and relative errors.
According to experimental results, the measured average strain transfer rates exceeded 96%, and the relative error with theoretical average strain transfer rate was below 1%. With consideration of experimental operation errors, it can be concluded that the average strain transfer model proposed in this paper is able to produce results that matches the measured results.
4. Practicality Validation of Polyimide FBGs
4.1. Theoretical Validation of Polyimide FBGs in Dynamic Measurement
Another experiment was designed in order to verify the practicality of polyimide FBGs in practical strain measurement. It was a dynamic strain measurement in a reinforced concrete specimen internal explosion experiment. Before the experiment was conducted, the ability of polyimide FBG in dynamic strain measurement needed to be investigated by a theoretical experiment.
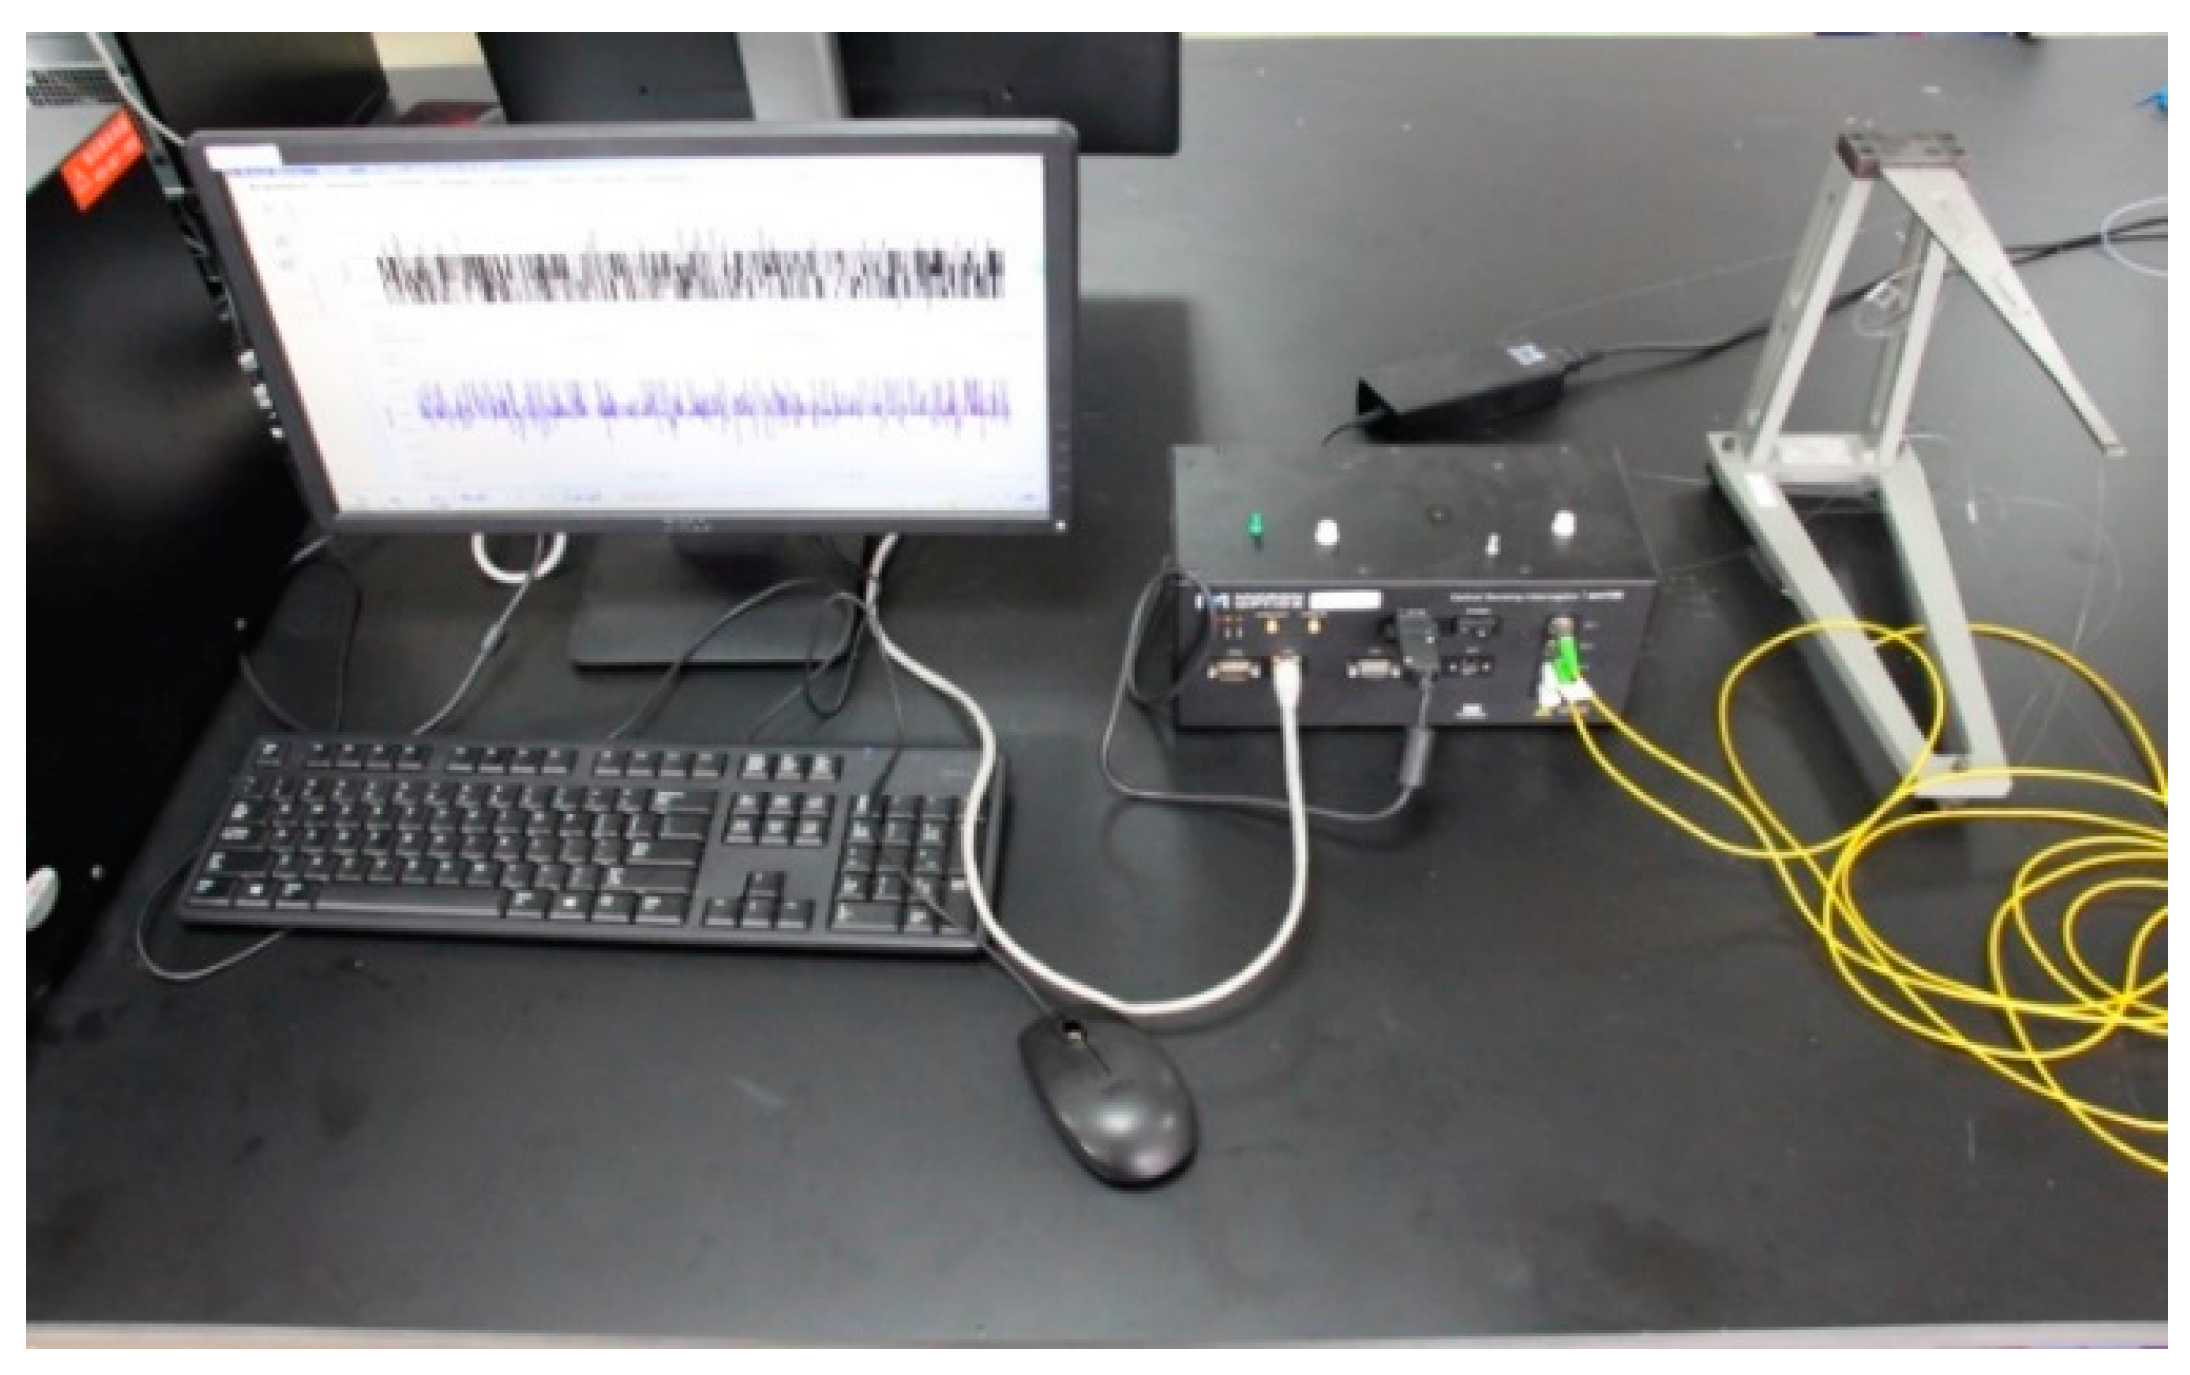
In the theoretical experiment, polyimide FBGs were the same as before. The interrogator used in the experiments was the SM130-700 dynamic interrogator (Micro Optics). The interrogator can identify a fiber grating sensor with wavelength ranging from 1525 nm to 1565 nm. Its wavelength resolution was up to 1 pm and it could achieve synchronous four-channel 2000 Hz sampling. The experiment system are shown in Figure 19.
Two polyimide FBGs were bonded to a cantilever beam along the longitudinal axis at the center. The bonding length was 40 mm and bonding width was 2 mm. After the adhesive had solidified and was confirmed to be in good condition, one end of the beam was applied stress to produce vibration.
As shown in Figure 20, l1 = 45 mm, l2 = 240 mm, l3 = 60 mm, a1 = 9.18 mm, and c = 45.9 mm. The thickness of the cantilever beam h = 35 mm, the density of the beam and Young’s modulus of the beam .
When ,
When ,
The cross section:
When ,
The theoretical basic frequency of the cantilever beam is 52.96 Hz.
As shown in Figure 21, the basic frequency of cantilever measured by FBGs without coating is 51.28 Hz. The relative error between the theoretical and the measurement is 3.2%. The experiment verifies the capacity of polyimide FBGs in dynamic measurement.
4.2. Reinforced Concrete Specimen Internal Explosion Measurement
An experimental system photo is shown in Figure 22. The system consisted of two cylindrical specimens which were made up of C40 concrete and an HRB335 steel bar. The diameter of the specimen was 3.5 m, and thickness of the circle specimen was 1 m. The specimen was deployed in the explosion test installation. There was a cavity between the two cylinder specimens. Sand bags and a rubber cushion were piled surrounding the specimen in order to seal the cavity. Detonating fuses were deployed at the center of the cavity. Ten optical fiber sensors were symmetrically mounted by different types, along the vertical and horizontal radius of the cylinder. The three kinds of optical fiber sensors used in the experiment were bare polyimide FBGs, the MOI (Micron Optics Incorporation) os-3200 non-metallic optical strain gauge and the JPhotonics JPFBGS-200 concrete surface strain gauge. As shown in Figure 22, Positions 1 and 4 show os-3200 non-metallic optical strain gauges. Positions 7 and 8 show JPFBGS-200 concrete surface strain gauges. Positions 2, 3, 5, 6, 9, and 10 show bare polyimide FBGs.
As shown in Figure 23, the central wave length of bare polyimide FBG were 1545 nm and 1550 nm. They were mounted to the surface of the concrete specimen by instant adhesive first, and then covered by E-120HP epoxy adhesive.
The os-3200 is a product from Micron Optics Incorporation, Atlanta, GA, USA while JPFBGS-200 is a product from JPhotonics, an optical fiber sensing incorporation in Hangzhou, China. As shown in Figure 24, the encapsulation body length of MOI os-3200 is 25 mm and the width of it is 5 mm. The encapsulation material is santoprene. os-3200 has a self-adhesive backing that holds the sensor body in place and protects the FBG while epoxy is injected. The epoxy encapsulates the FBG and bonds it to a structure’s surface. The length of JPhotonics JPFBGS-200 is 100 mm. The FBG is encapsulated in a metal tube whose diameter is 10 mm, and the mounted to the surface of the specimen by four screws.
The shear modulus of C40 concrete is, and, and its density is. Hence, speed of the shear stress wave is given by:
The estimated maximum frequency of the shear stress wave in specimen is given by:
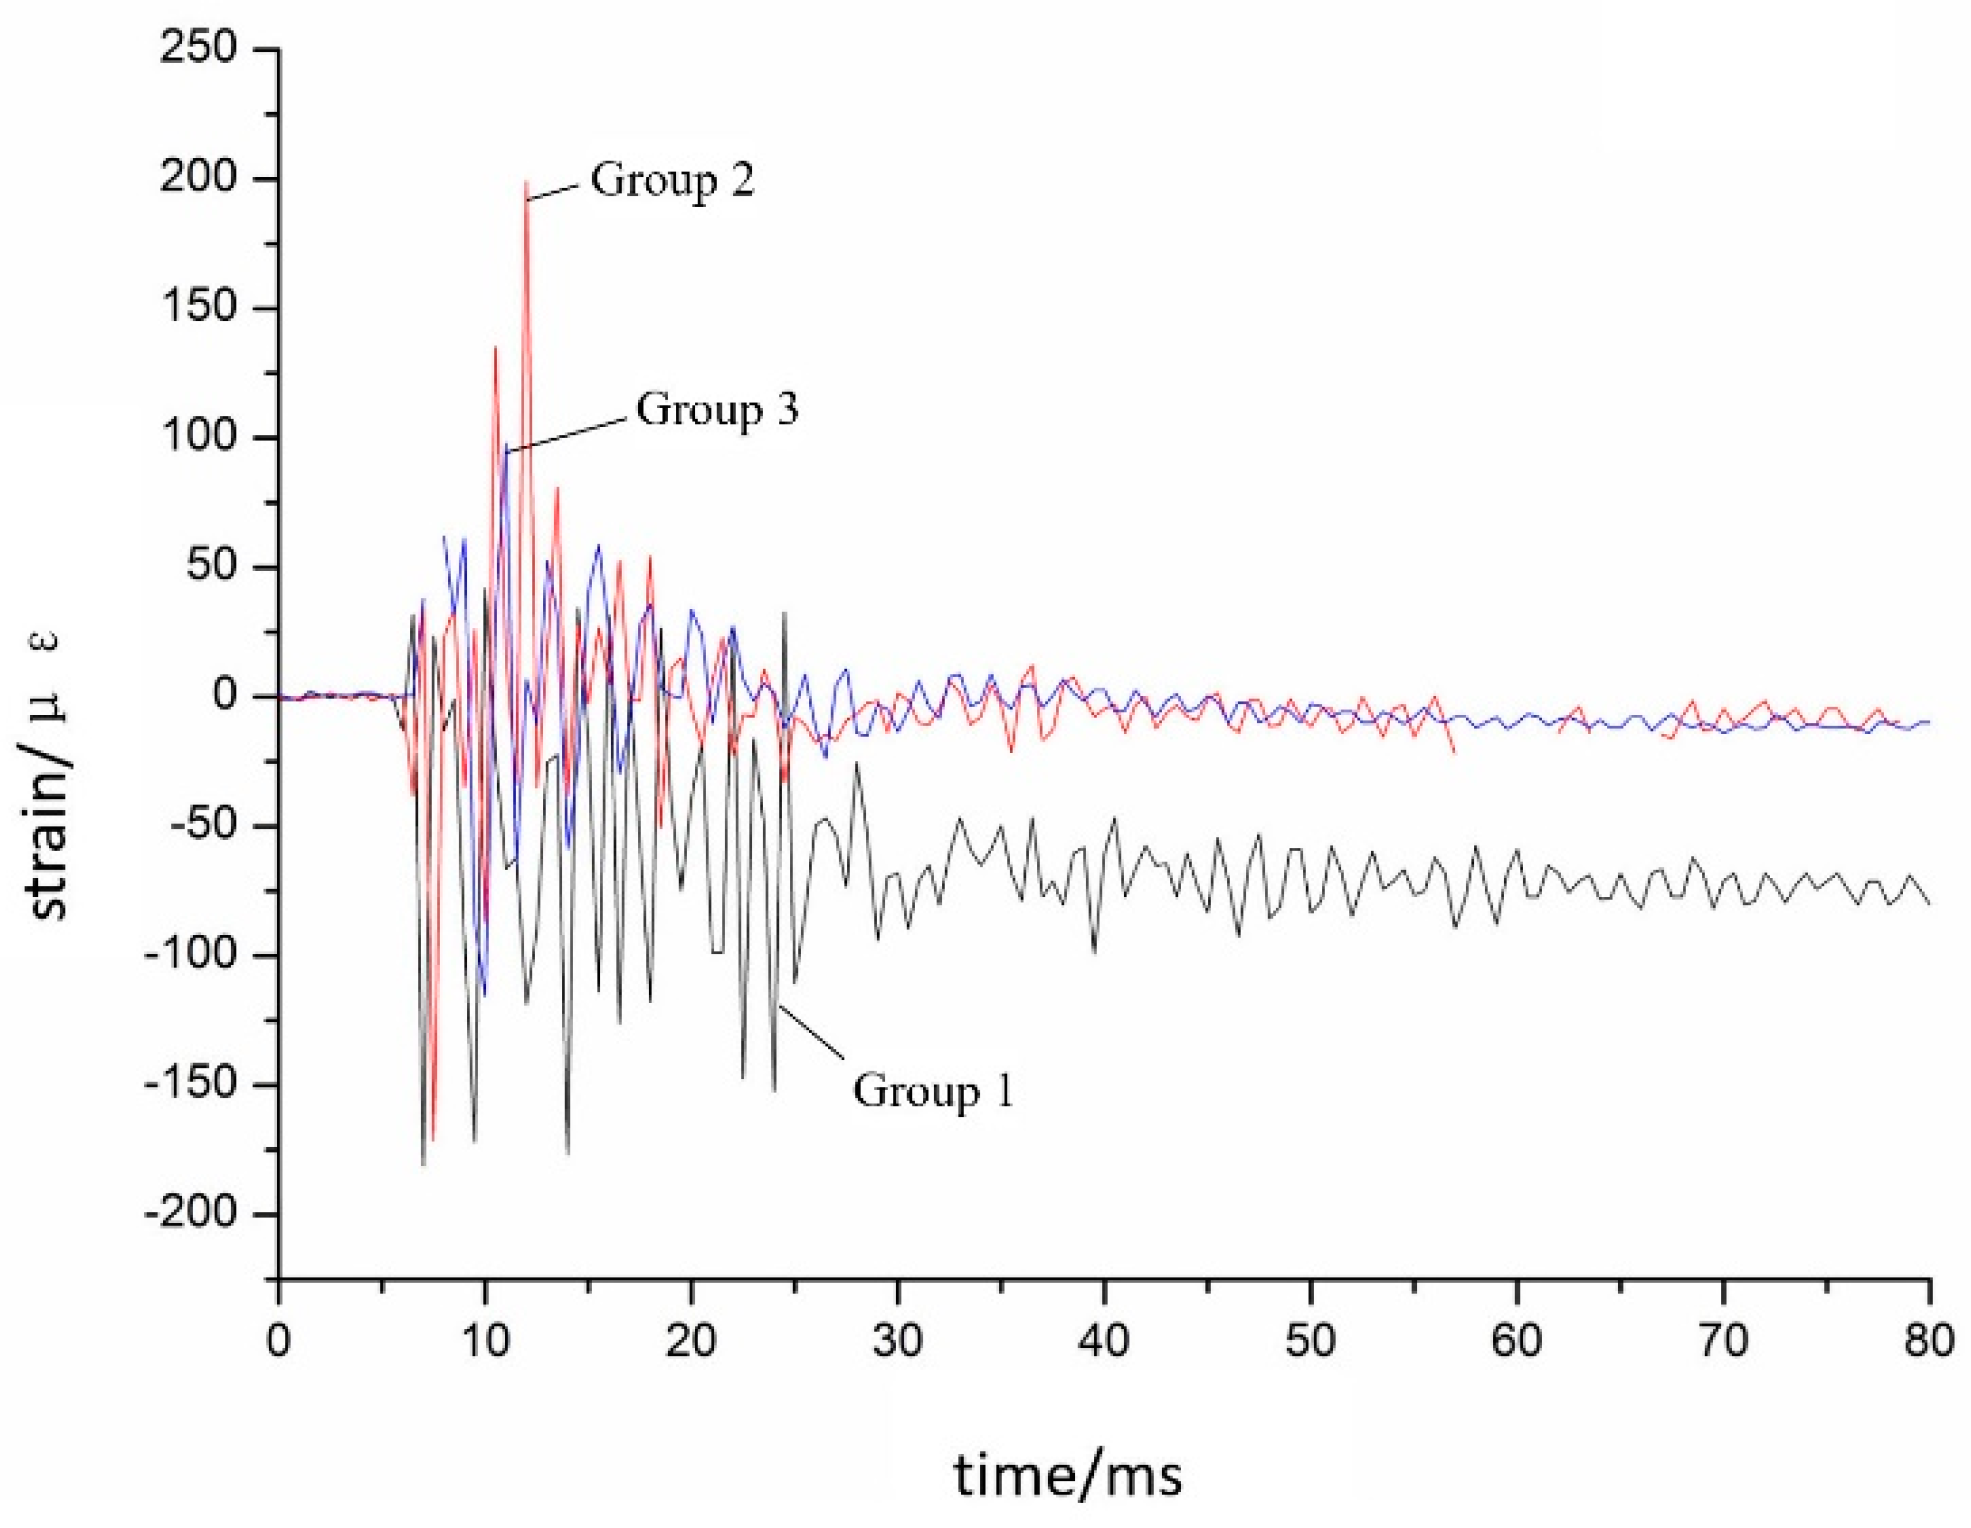
The sampling frequency of SM130 is great enough to obtain data. The experiments were conducted in three groups. During each group, the amount of explosive was increased by 50%. The data of different optical sensors obtained are shown as Figure 25, Figure 26, Figure 27 and Figure 28:
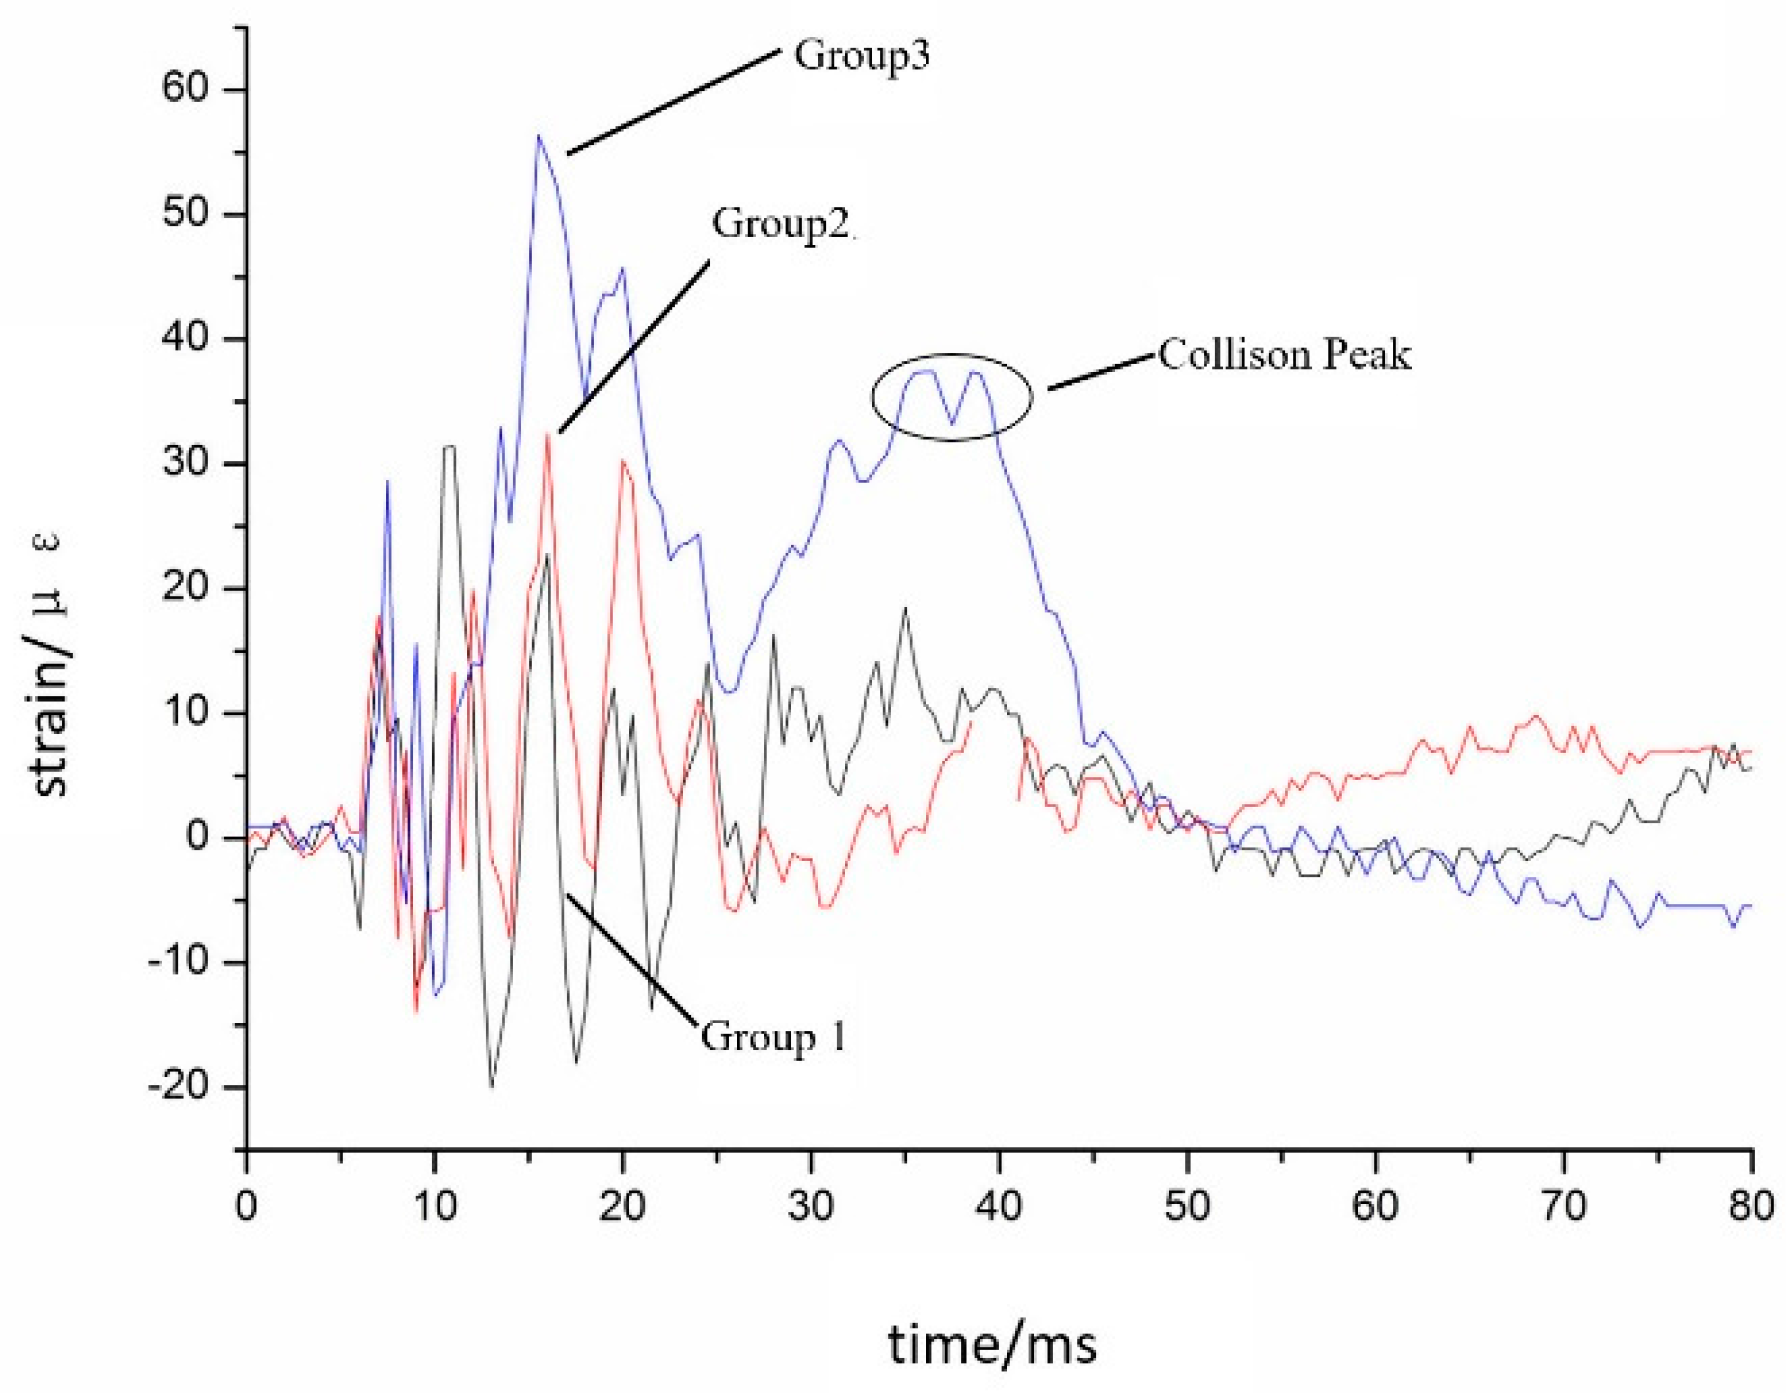
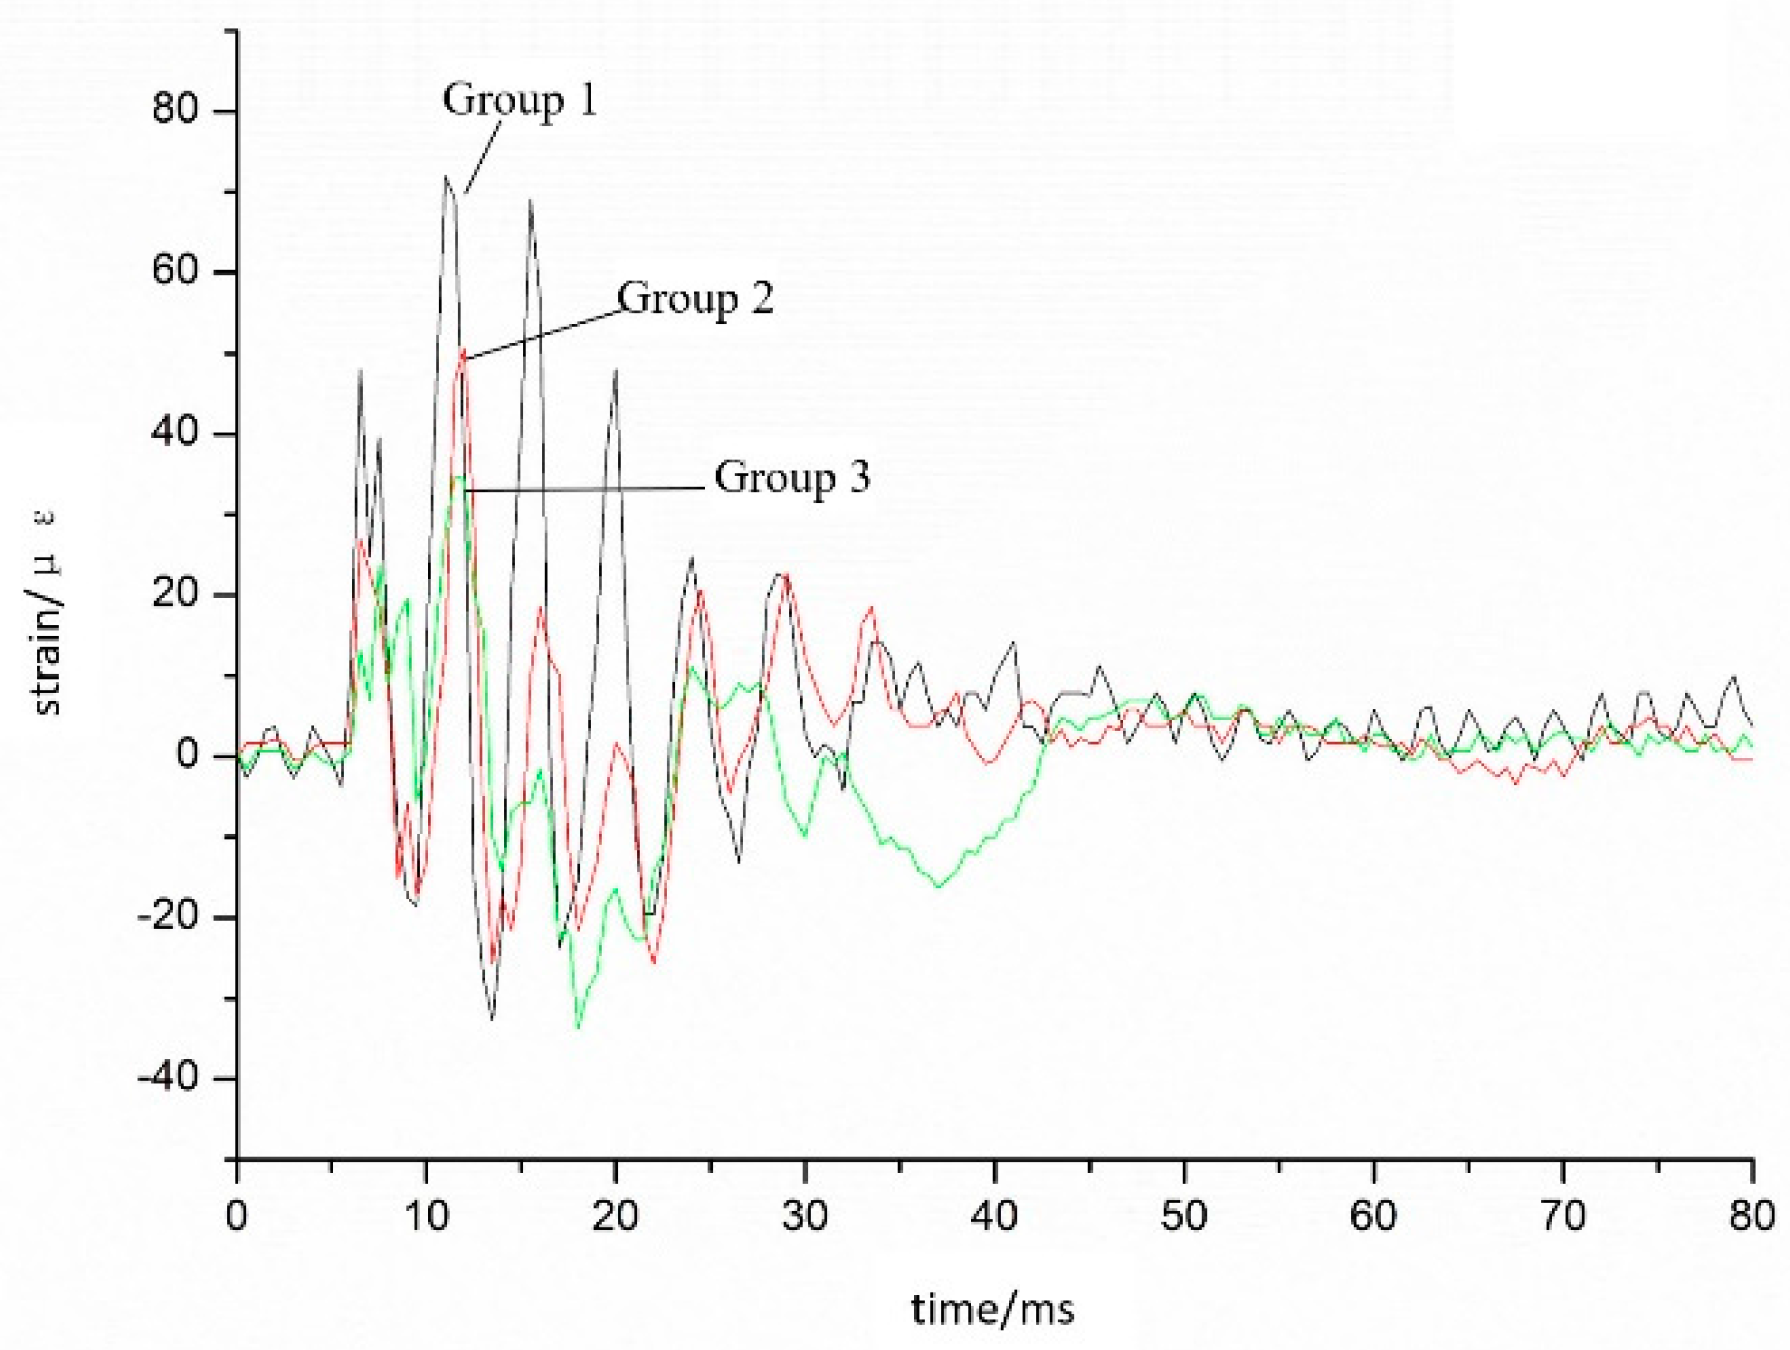
Bare polyimide FBGs can obtain an explosion peak in every group, and the variation of the peak in each group is almost linear to the increase of the explosion. For example, in Figure 25, the peak of group 3 is nearly twice of that of group 2, because amount of the powder was twice that in group 1. In Figure 25 and Figure 26, there is a collision peak. It means that the cylinder specimen collided with the installation surrounding it, and bounced back because the stress of the explosion was too strong.
However, in Figure 27 and Figure 28, there is no collision peak. Both os-3200 and JFBGS-200 had a loss in peak in group 3. This is because there are only three strain transfer layers, fiber-adhesive-substrate, in polyimide FBG strain measurement system. The strain transfer loss is little and adhesive after solidifying can provide enough strength to make sensors have the same response frequency as concrete specimen. As to say, the dynamic coupling of the bare polyimide FBG and substrate is perfect enough. The os-3200 and JFBGS-200 are all encapsulated FBG sensors. There are more strain transfer layers in their strain measurement system. More strain transfer layer can reduce strain transfer ratio and lose some details. Moreover, FBG in JFBGS-200 is encapsulated by a metal tube which has an empty cavity in it. That will decrease response frequency apparently.
The results of the explosion measurement experiment clearly show that the bare polyimide FBG is more sensitive and accurate than the encapsulated optical fiber sensors. Polyimide FBGs are practical and suitable for surface strain measurement even in some strict and difficult experiments.
5. Conclusions
A new method is proposed with polyimide FBGs for surface strain measurement. Several conclusions were drawn and are given as follows:
(1) When mounted on the surface of the substrate, polyimide FBGs should be bonded to the substrate by adhesive first, and then covered by epoxy resin. Solidified epoxy can provide enough protection for polyimide FBGs.
(2) When mounted to measure strain, polyimide FBGs can produce an average strain transfer ratio of over 95%. It means that polyimide FBGs can indicate the substrate strain variation accurately.
(3) The primary factors that influence the average strain transfer ratio of polyimide FBGs include the shear modulus of the bonding layer and the adhesive thickness between the fiber and substrate. Length bonded to the substrate has little influence when the length is over 3 cm.
(4) Polyimide FBGs can be used in some strict measurements, such as explosion measurement and impact measurement.
(5) Fewer strain transfer layers can increase dynamic response frequency and coupling between FBG and substrate.
Acknowledgments
Support for this paper has been received from the following sources: the National Natural Science Foundation of China (51608528), the Jiangsu Province Natural Science Foundation (BK20161467), and the Central Military Committee National Defence Science and Technology Funds (3602052).
Author Contributions
Jianyong Liu and Yuan Wang conceived and designed the experiments; Yangyang Sun, Zhenglin Zhang, Xiaodi Huang and Zewei You performed the experiments; Jianli Duan and Qinghua Zhang analyzed the data; Yangyang Sun, ZeWei You, and Zhenglin Zhang wrote the paper.
Conflicts of Interest
The authors declare no conflict of interest.
References
- Kersey, A.D.; Davis, M.A. Fiber grating sensors. J. Lightwave Technol. 1997, 15, 1442–1463. [Google Scholar] [CrossRef]
- Song, G.B.; Wang, C.J.; Wang, B. Structure health monitoring (SHM) of civil structures. Appl. Sci. 2017, 7, 789. [Google Scholar] [CrossRef]
- Leung, C.K.Y.; Wan, K.T. Review: Optical fiber sensors for civil engineering applications. Mater. Struct. 2015, 48, 871. [Google Scholar] [CrossRef]
- Lopez-Higuera, J.M.; Cobo, L.R. Fiber optic sensors in structural health monitoring. J. Lightwave Technol. 2011, 29, 587–608. [Google Scholar] [CrossRef]
- Liu, H.B.; Zhang, Q. Mechanical Performance Monitoring for Prestressed Concrete Piles Used in a Newly-Built High-Piled Wharf in a Harbor with Fiber Bragg Grating Sensor Technology When Pile Driving. Appl. Sci. 2017, 7, 489. [Google Scholar] [CrossRef]
- Liao, K.X.; Li, J.K. Nuclear power plant prestressed concrete containment vessel structure monitoring during integrated leakage rate test using three kinds of fiber optic sensors. Appl. Sci. 2017, 7, 419. [Google Scholar] [CrossRef]
- Ye, X.; Su, Y.; Han, J. Structural health monitoring of civil infrastructure using optical fiber sensing technology: A comprehensive review. Sci. World J. 2014, 2014, 652329. [Google Scholar] [CrossRef] [PubMed]
- Inaudi, D.; Glisic, B. Long-Range Pipeline Monitoring by Distributed Fiber Optic Sensing. J. Press. Vessel Technol. 2010, 132, 763–772. [Google Scholar] [CrossRef]
- Di Sante, R.; Donati, L.; Troiani, E. Reliability and accuracy of embedded fiber Bragg grating sensors for strain monitoring in advanced composite structures. Met. Mater. Int. 2014, 20, 537. [Google Scholar] [CrossRef]
- Cox, H.L. The elasticity and strength of paper and other fibrous materials. Br. J. Appl. Phys. 1952, 3, 72–79. [Google Scholar] [CrossRef]
- Ansari, F.; Libo, Y. Mechanics of bond and interface shear transfer in optical fiber sensors. J. Eng. Mech. 1998, 124, 385–394. [Google Scholar] [CrossRef]
- Li, H.N.; Zhou, G.D.; Ren, L.; Li, D.S. Strain transfer coefficient analyses for embedded fiber Bragg grating sensors in different host materials. J. Eng. Mech. 2009, 135, 1343–1353. [Google Scholar] [CrossRef]
- Li, D.; Li, H.N. Strain transferring analysis of embedded fiber Bragg grating sensors. Acta Mech. Sin. Chin. Ed. 2005, 37, 435–441. [Google Scholar]
- Sun, L. Application Analysis of Fiber Bragg Grating Sensing; Science Press: Beijing, China, 2011; pp. 23–26. ISBN 9787030327819. [Google Scholar]
- Sun, L.; Li, C. Strain Transfer Analysis of a Clamped Fiber Bragg Grating Sensor. Appl. Sci. 2017, 7, 188. [Google Scholar] [CrossRef]
- Wan, K.T.; Leung, C.K.Y. Investigation of the strain transfer for surface-attached optical fiber strain sensors. Smart Mater. Struct. 2008, 17, 035037. [Google Scholar] [CrossRef]
- Zhou, Z.; Li, J.L. Interface strain transfer mechanism and error modification of embedded FBG strain sensors. J. Harbin Inst. Technol. 2006, 1, 49–55. [Google Scholar]
- Wu, R.; Zheng, B. Influence of layer structure for surface-bonded FBG sensor on measured strain. Opt. Precis. Eng. 2014, 22, 3183–3190. [Google Scholar]
- Takeda, S.; Minakuchi, S. Delamination monitoring of laminated composites subjected to low-velocity impact using small-diameter FBG sensors. Compos. Part A Appl. Sci. Manuf. 2005, 36, 903–908. [Google Scholar] [CrossRef]
- Okabe, Y.; Tsuji, R. Application of chirped fiber Bragg grating sensors for identification of crack locations in composites. Compos. Part A Appl. Sci. Manuf. 2004, 35, 59–65. [Google Scholar] [CrossRef]
- Okabe, Y.; Tanaka, N. Effect of fiber coating on crack detection in carbon fiber reinforced plastic composites using fiber Bragg grating sensors. Smart Mater. Struct. 2002, 11, 892–898. [Google Scholar] [CrossRef]
- Zhang, Q.H.; Wang, Y.; Sun, Y.Y. Hilbert–Huang transform based method for monitoring the crack of concrete arch by using FBG sensors. Optik 2016, 127, 3417–3422. [Google Scholar] [CrossRef]
- You, Z.W.; Wang, Y.; Sun, Y.Y. Constitutive relation measurement of geological mechanics similar material based on fiber Bragg grating. Opt. Eng. 2017, 56, 024105. [Google Scholar] [CrossRef]
- Peters, K.; Studer, M. Embedded optical fiber Bragg grating sensor in a nonuniform strain field: Measurements and simulations. Exp. Mech. 2001, 41, 19–28. [Google Scholar] [CrossRef]
- Botsis, J.; Humbert, L. Embedded fiber Bragg grating sensor for internal strain measurements in polymeric materials. Opt. Laser. Eng. 2005, 43, 491–510. [Google Scholar] [CrossRef]
Figure 1.
Samples of polyimide fiber Bragg gratings (FBGs). (a) Bare Polyimide FBG; (b) Strain transfer ratio experiment for polyimide FBG and uncoated FBG; (c) Bonding types for comparison; (d) Results of strain measured by polyimide FBG and uncoated FBG.
Figure 1.
Samples of polyimide fiber Bragg gratings (FBGs). (a) Bare Polyimide FBG; (b) Strain transfer ratio experiment for polyimide FBG and uncoated FBG; (c) Bonding types for comparison; (d) Results of strain measured by polyimide FBG and uncoated FBG.
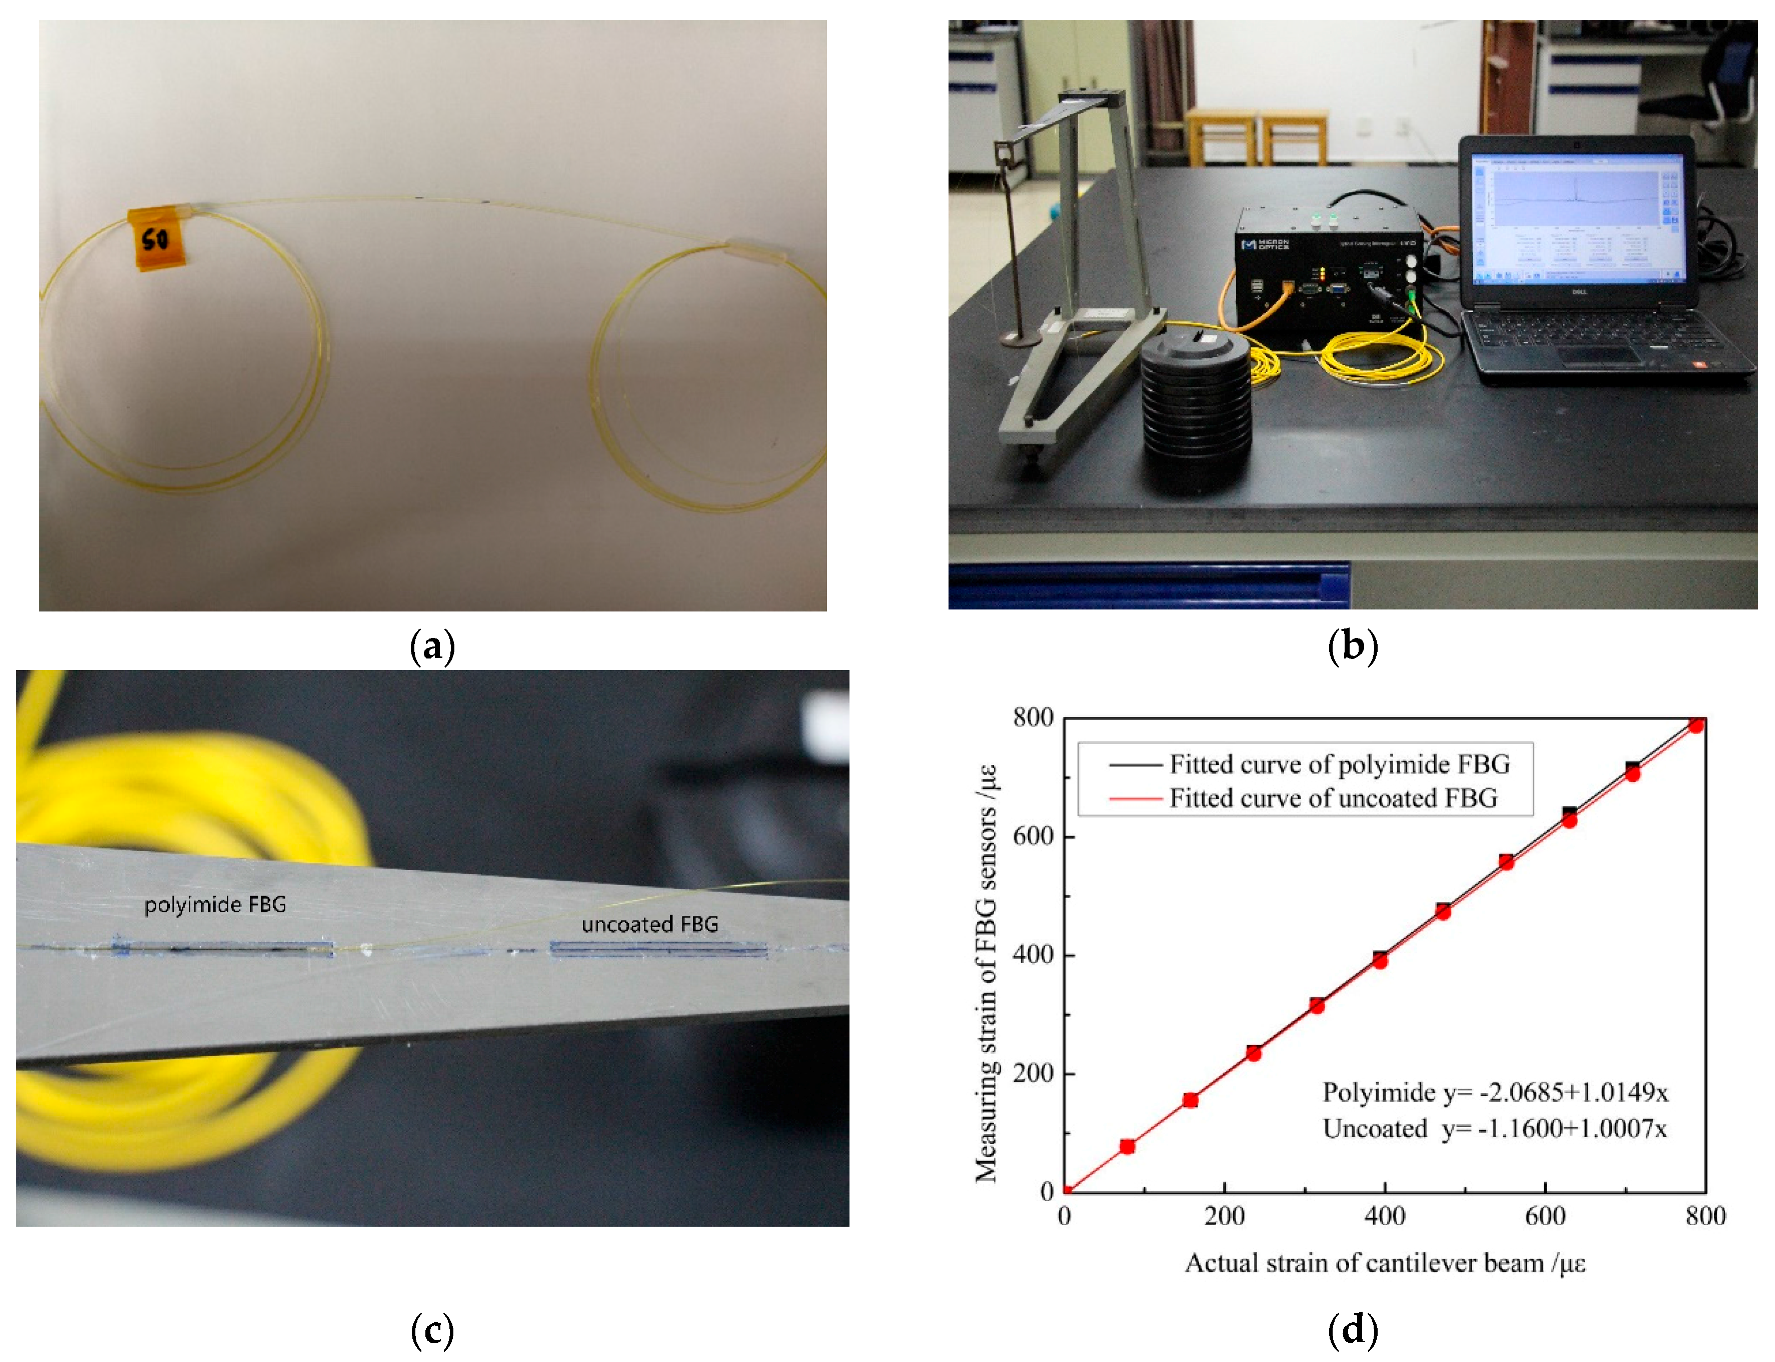
Figure 2.
Samples of polyimide FBGs. (a) Cracking monitoring with bare FBGs; (b) A similar material sensor with bare FBGs.
Figure 2.
Samples of polyimide FBGs. (a) Cracking monitoring with bare FBGs; (b) A similar material sensor with bare FBGs.
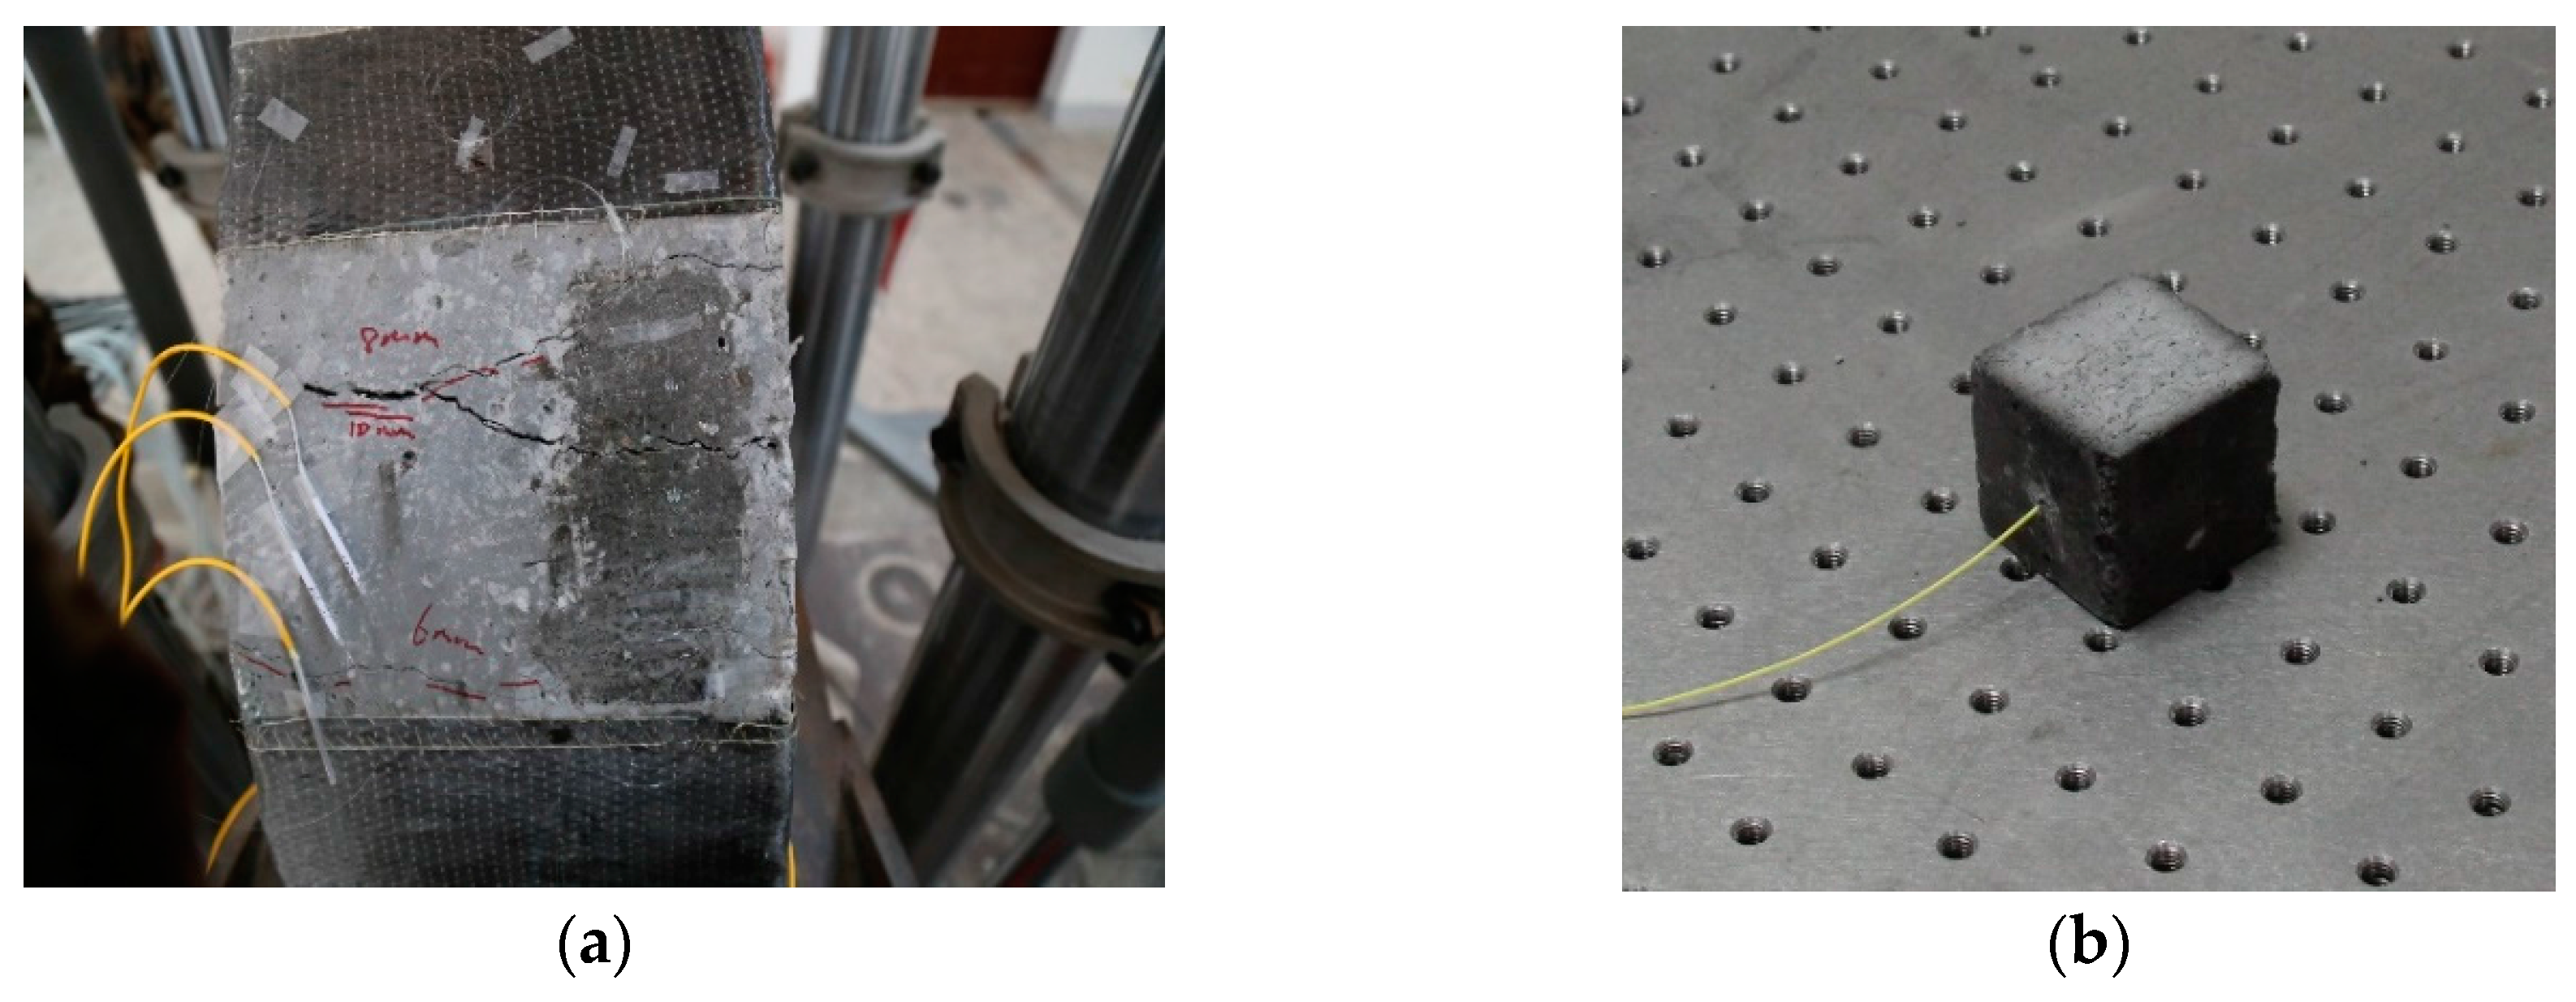
Figure 3.
The strain transfer experiment of the soft layer encapsulated fiber with the distributed sensing interrogator ODISI OBR 4600. (a) The LUNA OBR 4600 distributed sensing system; (b) Fiber bonded to the cantilever beam; (c) Strain measured by OBR 4600 along the fiber; and (d) Strain transfer measured in contrast to strain transfer ratio calculated based on the theoretical strain transfer model.
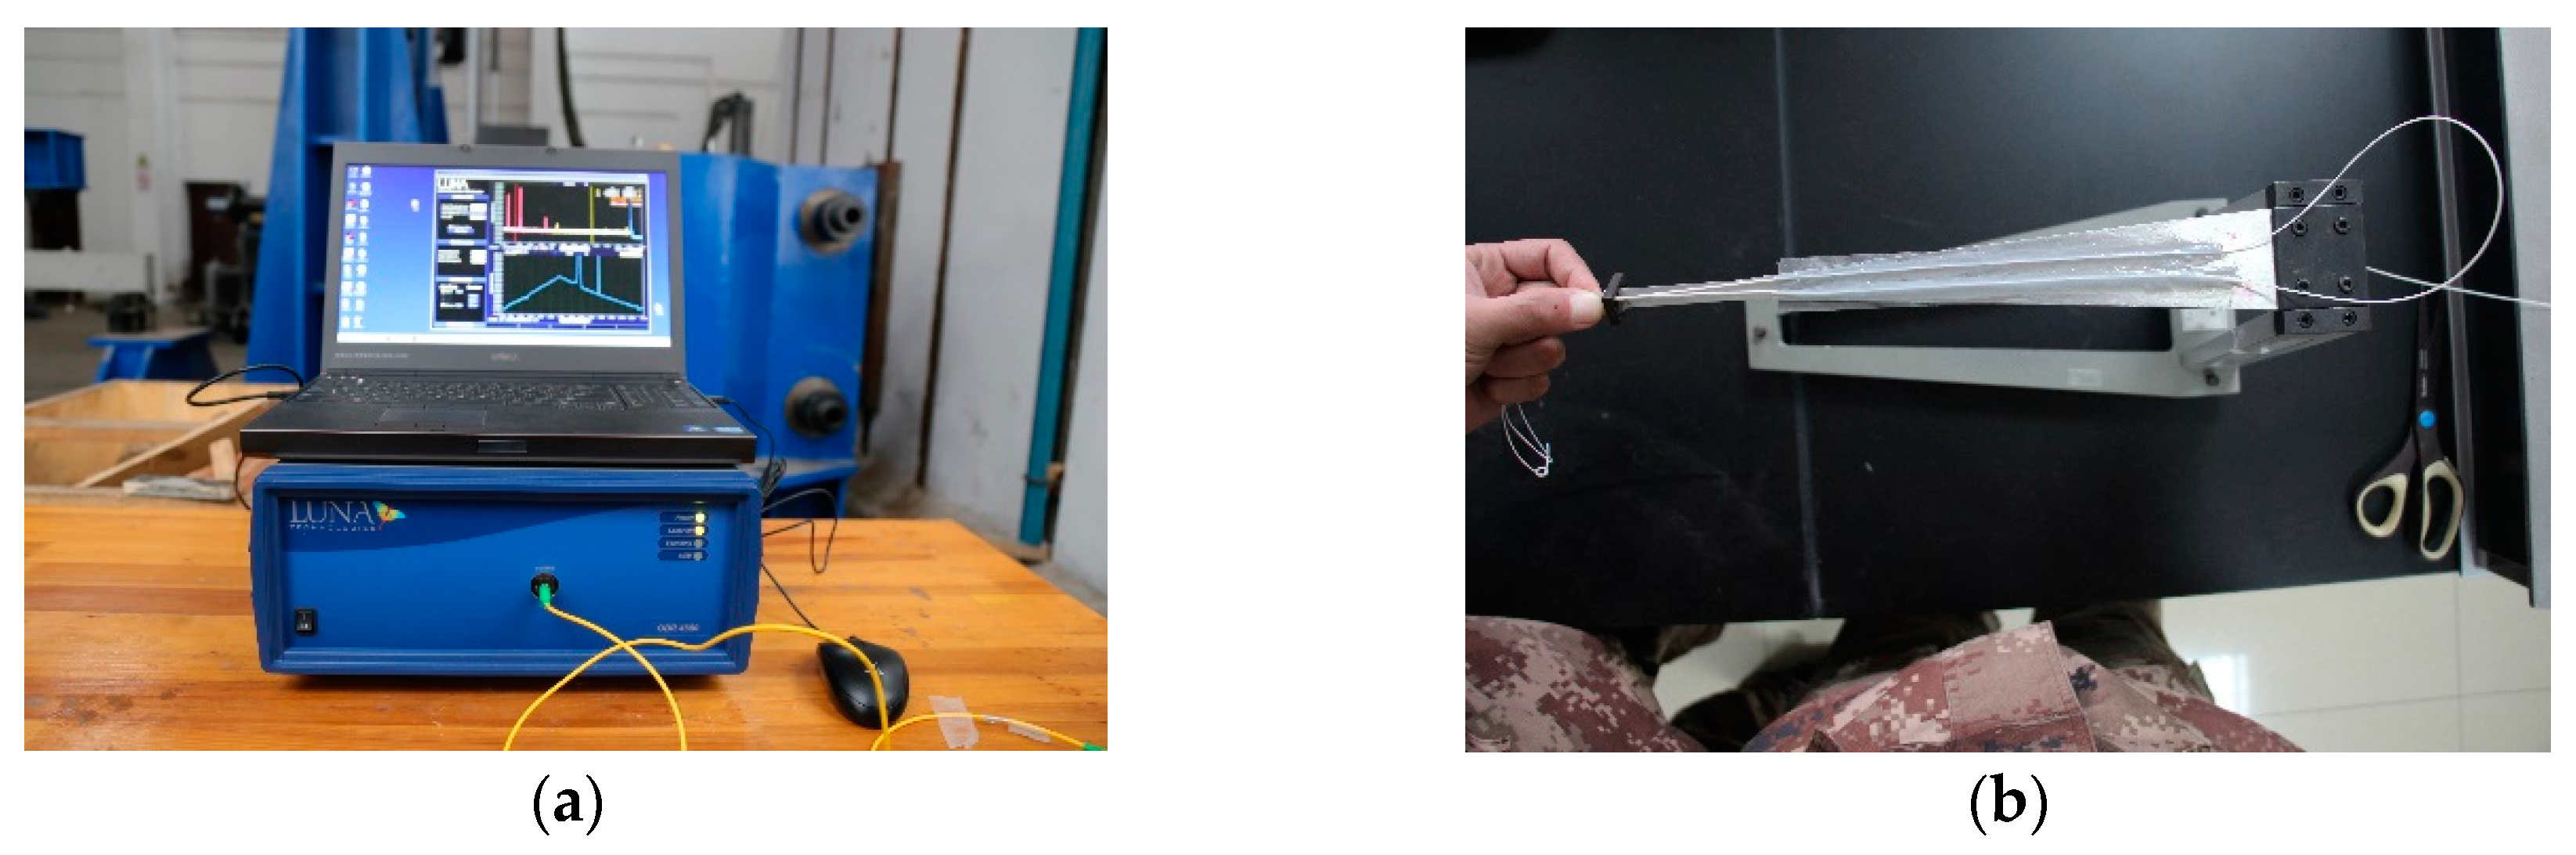
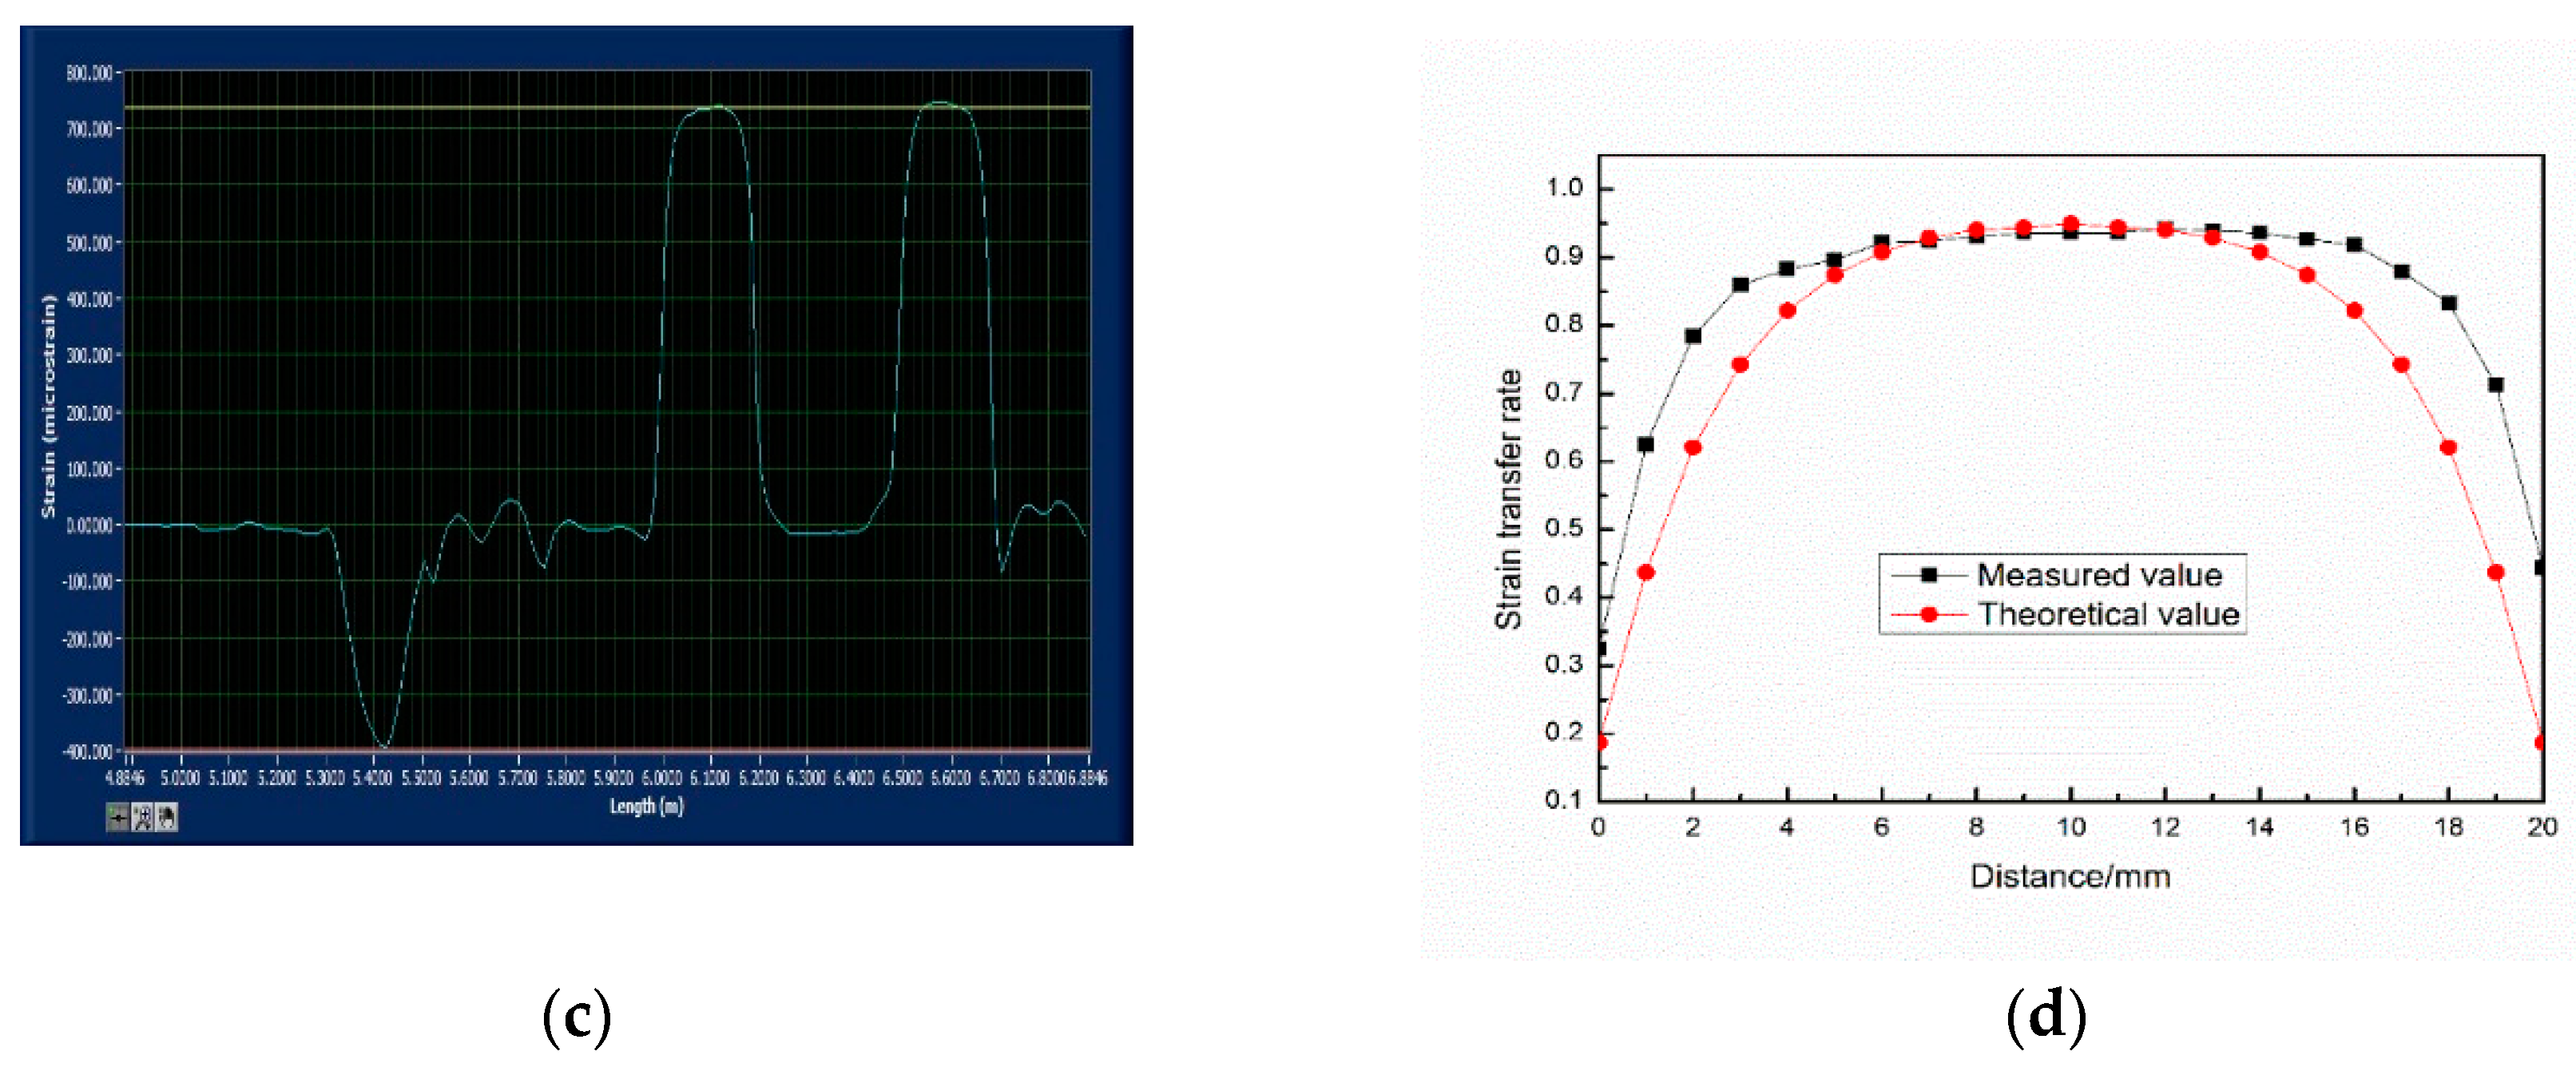
Figure 4.
The cross section of the surface bonded bare Polyimide FBG.
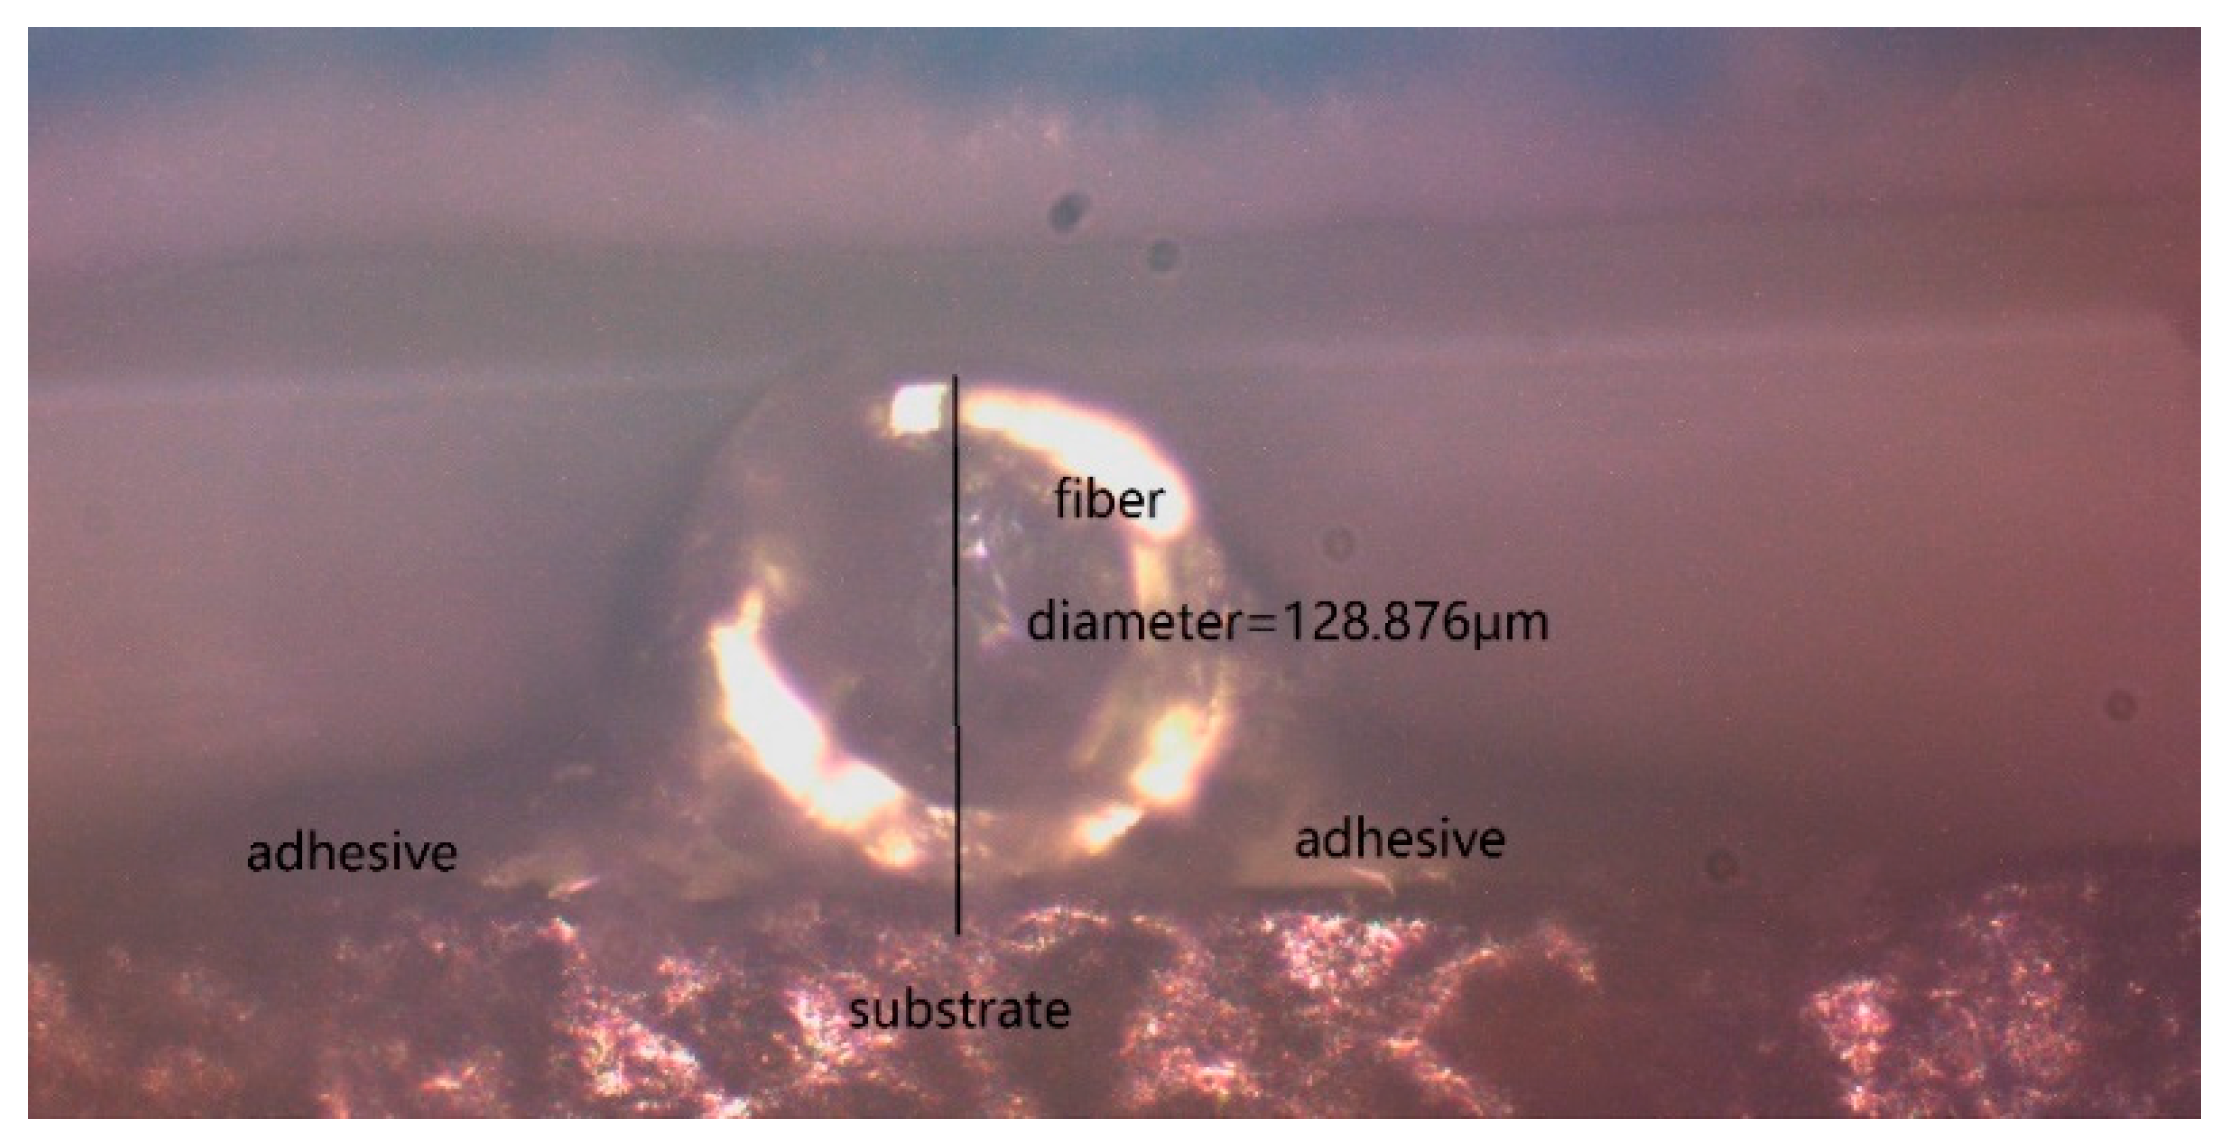
Figure 5.
The model of the surface-bonded fiber.

Figure 6.
The structure of surface-bonded fiber.
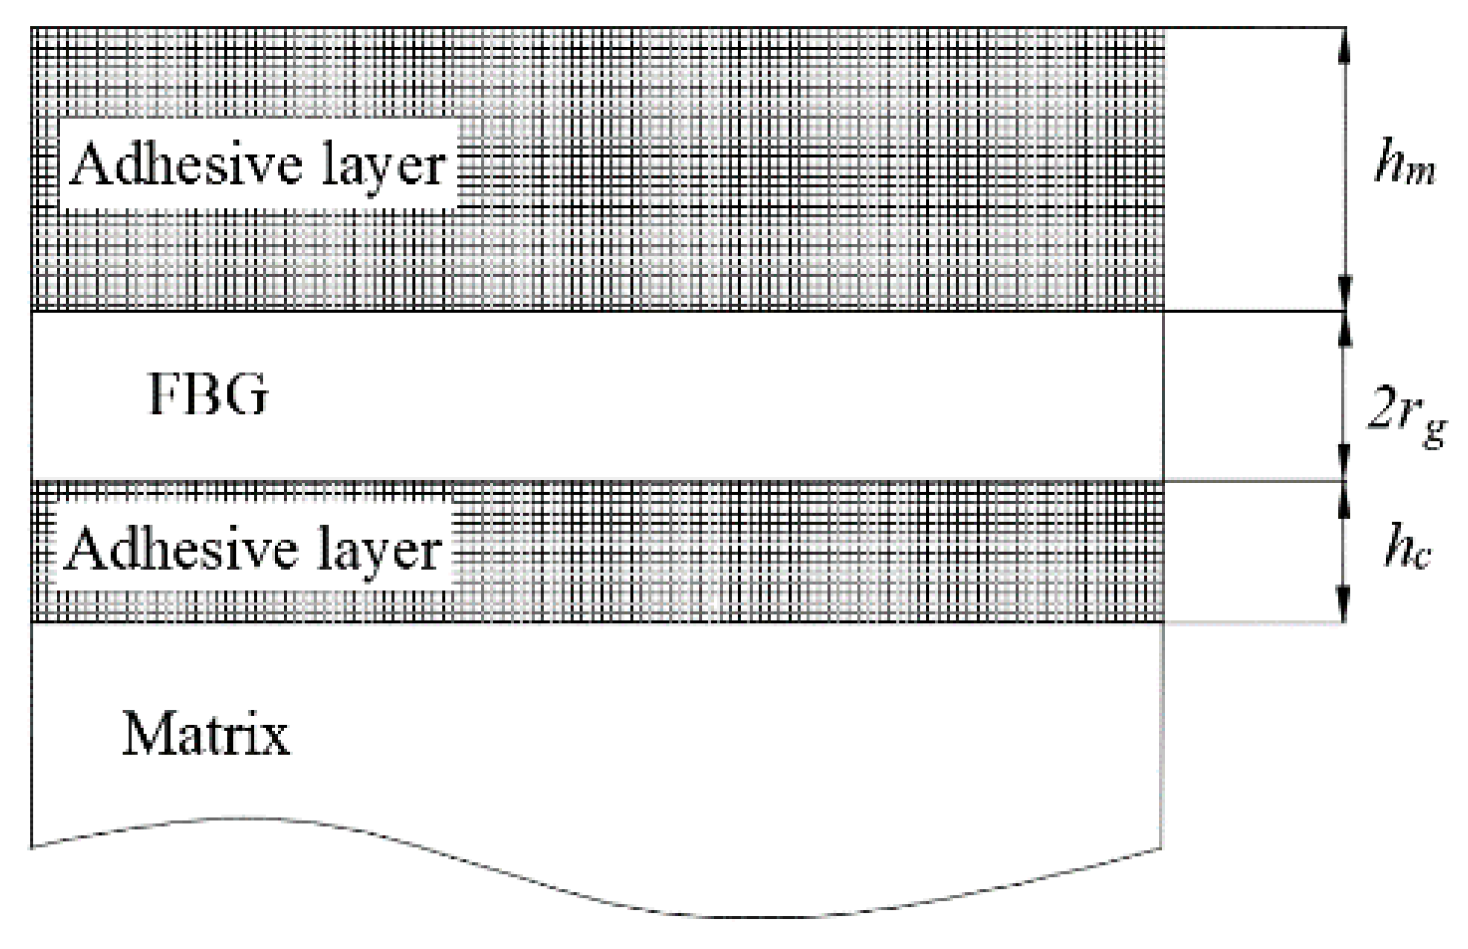
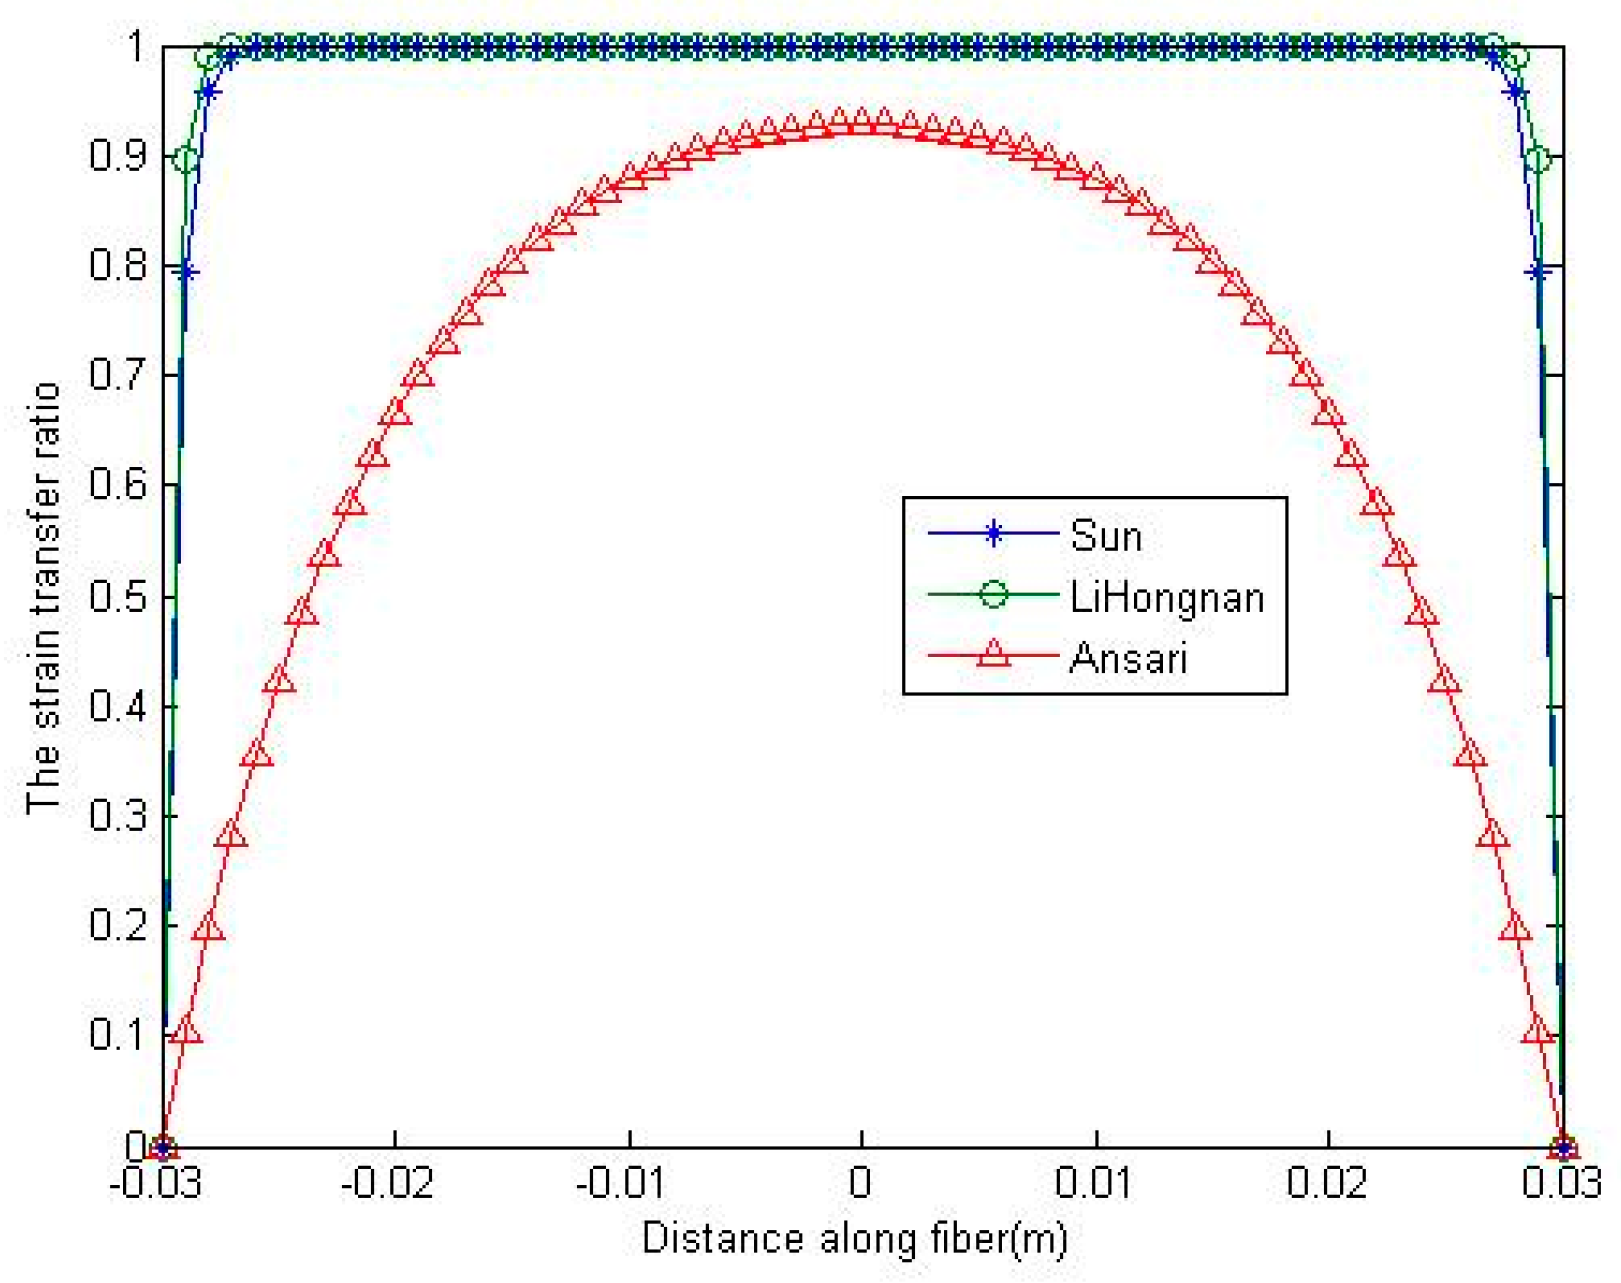
Figure 7.
Strain transfer ratio along the gauge length of FBGs of different models.

Figure 8.
Average strain transfer ratios of different models.

Figure 9.
The average strain transfer ratio changed with the shear modulus.
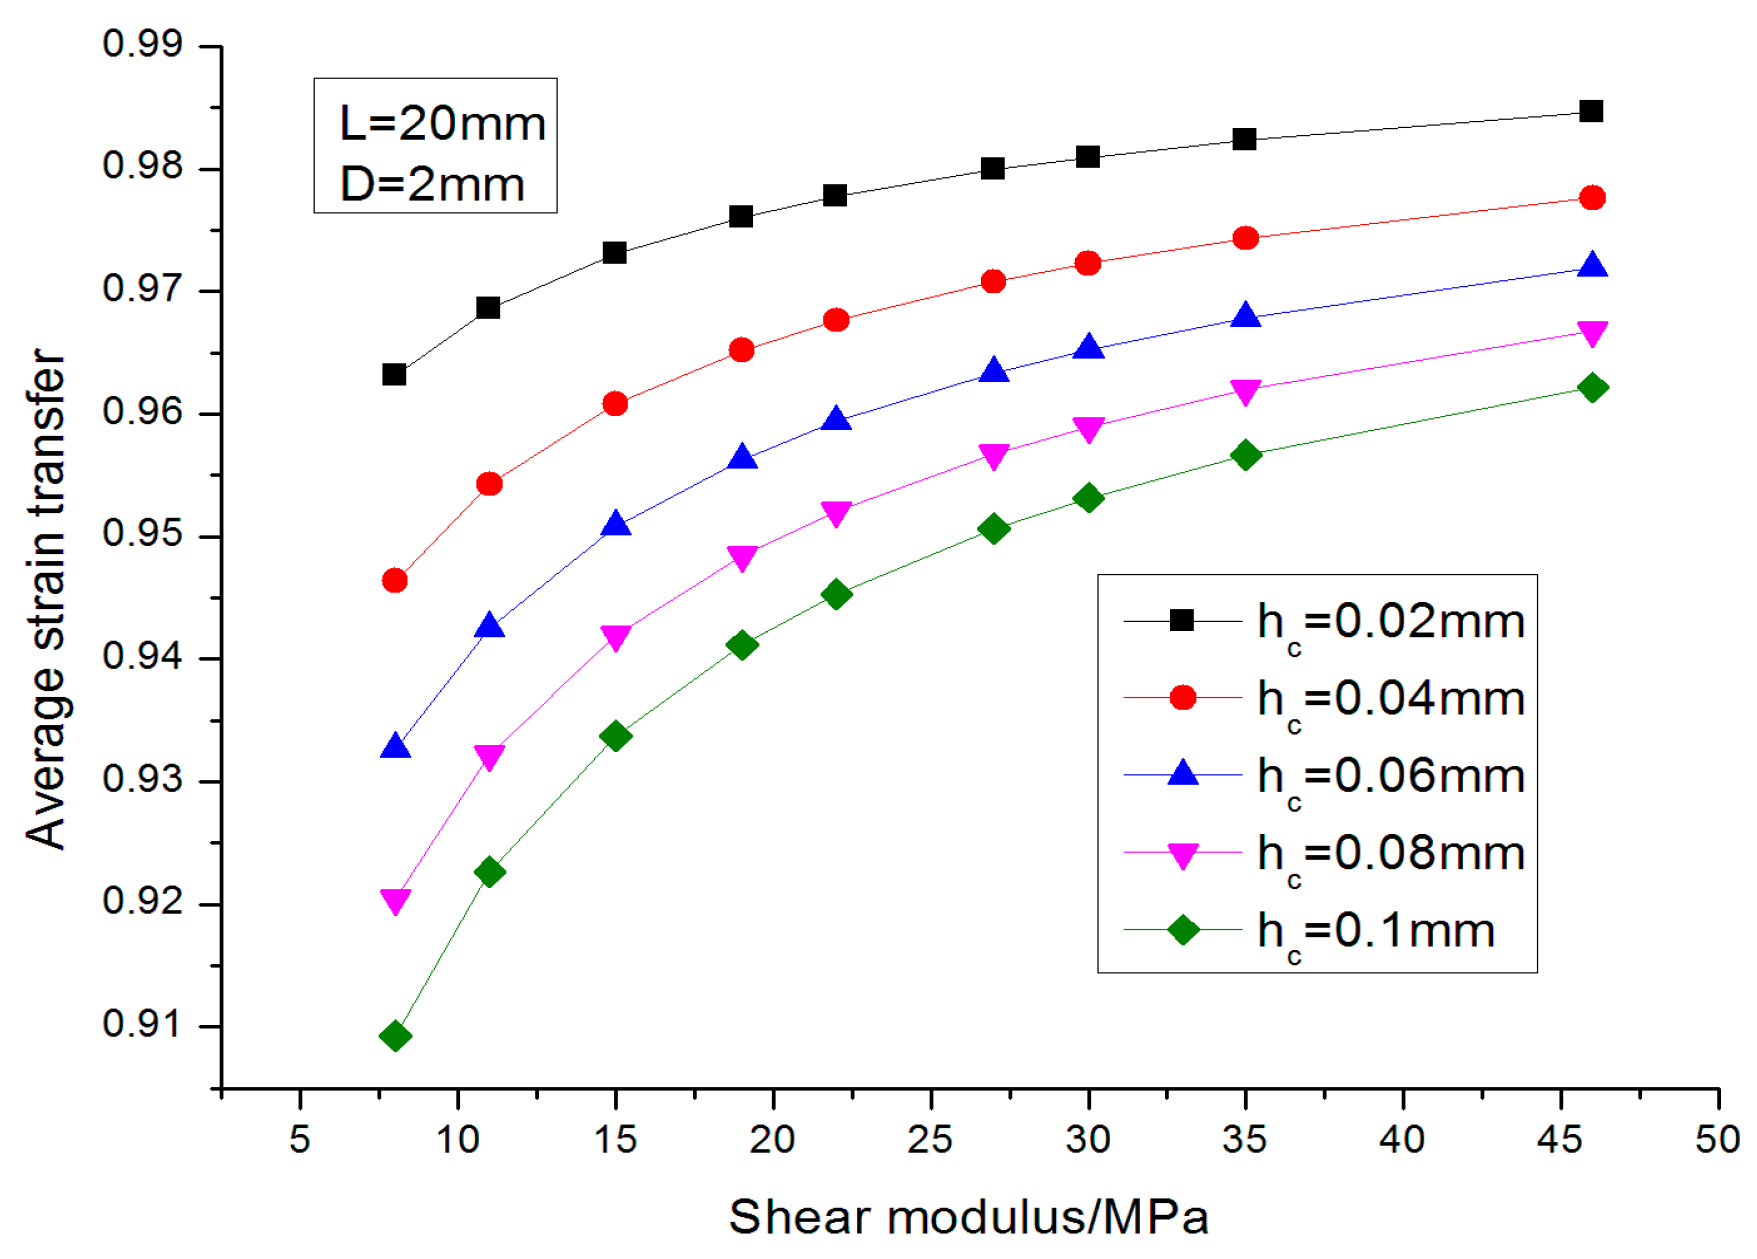
Figure 10.
The average strain transfer rate changed with the thickness of the bond.

Figure 11.
The average strain transfer rate changed with the length of bonded.
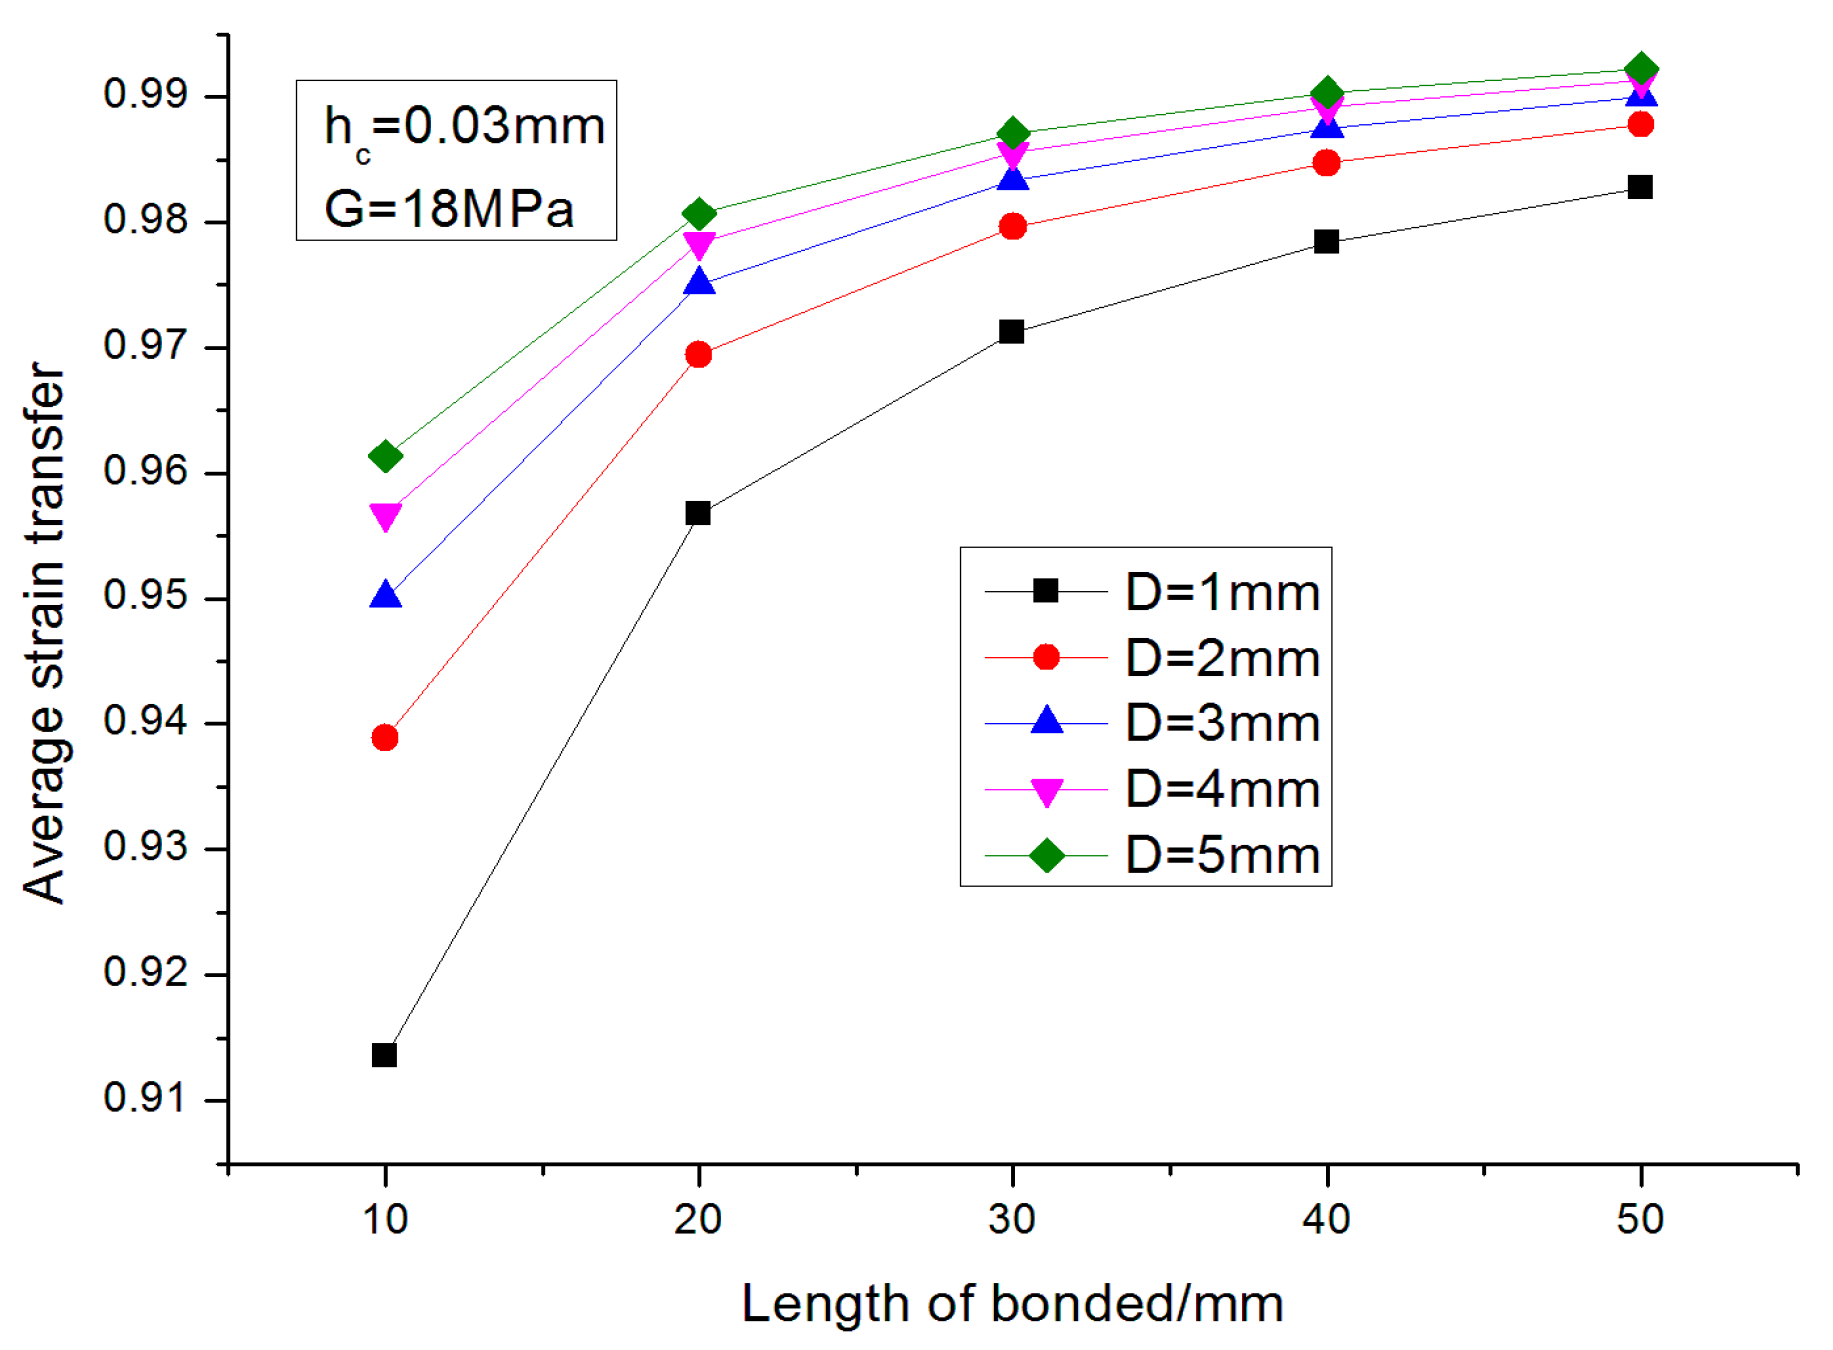
Figure 12.
The average strain transfer rate changed with adhesive above the fiber.
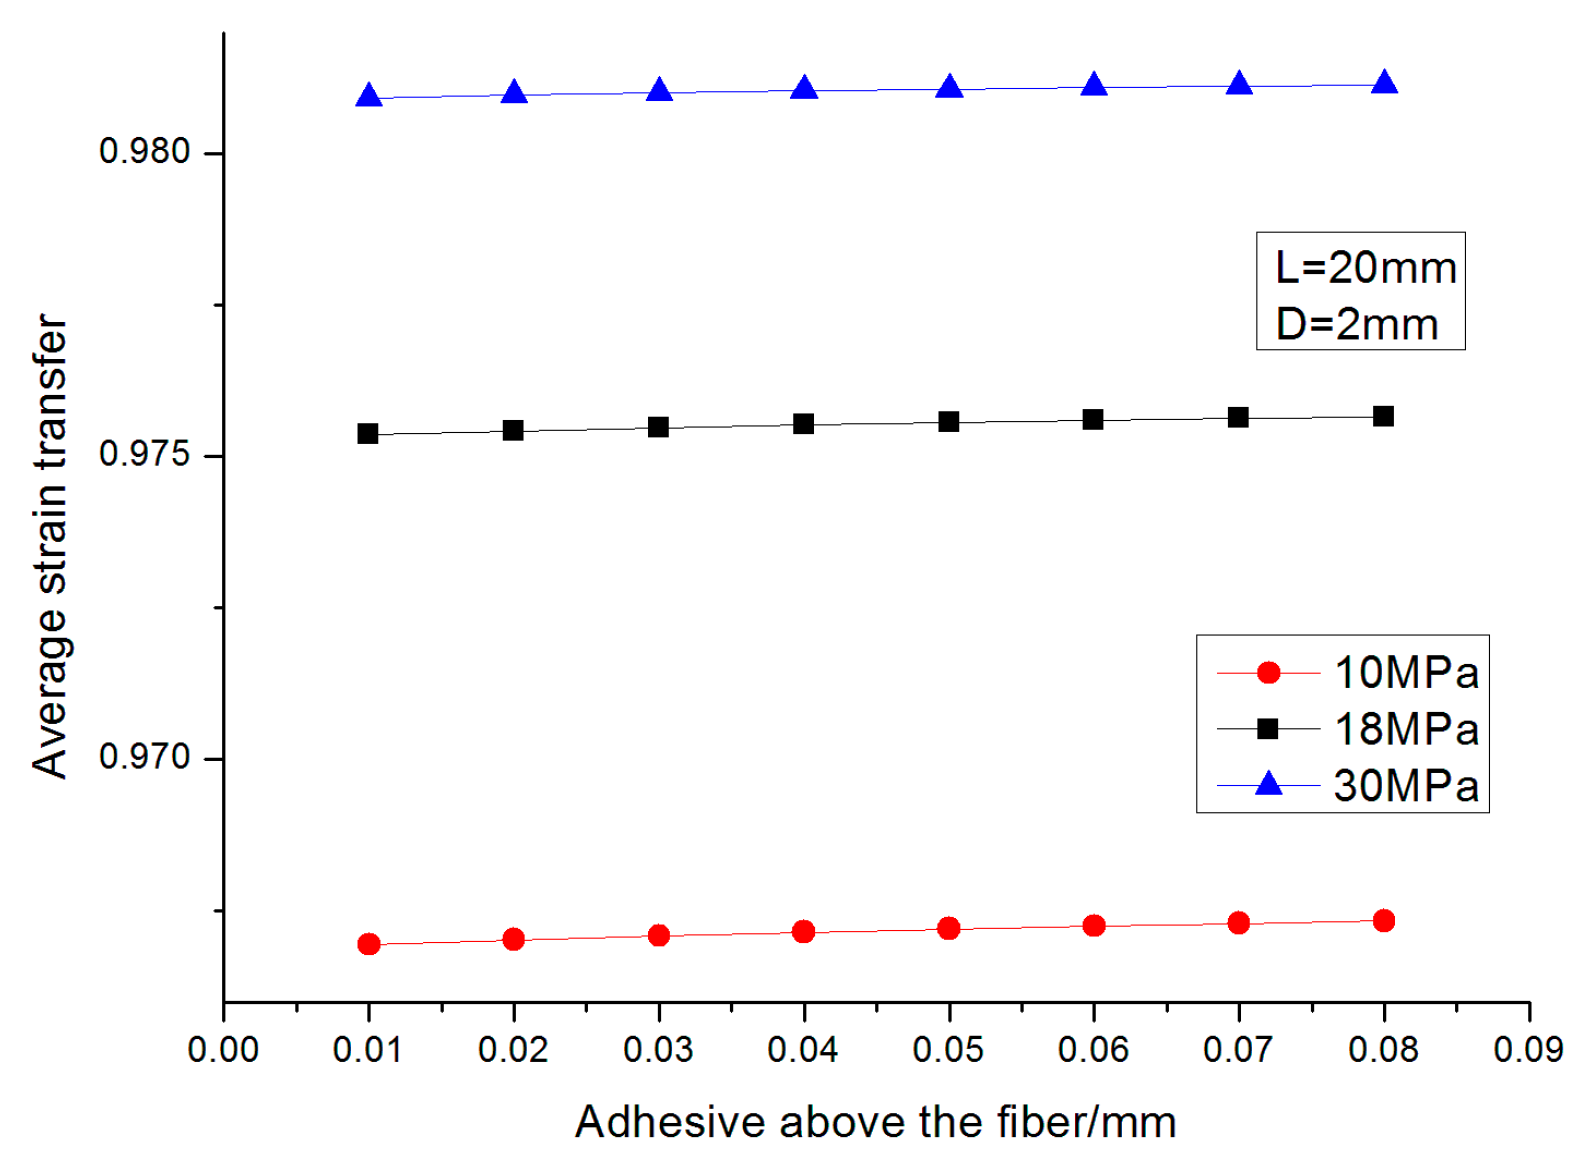
Figure 13.
Bonding method. (a) Loctite 401 and E-120HP; (b) Bare polyimide FBG was bonded to the CFRP (Carbon Fiber Reinforced Polymer) plate by Loctite 401; (c) Bare polyimide FBGs were bonded to the CFRP textile by Loctite 401 first and then covered by E-120HP; (d) Bare polyimide FBGs were bonded to the concrete specimen by Loctite 401 first and were then covered by E-120HP.
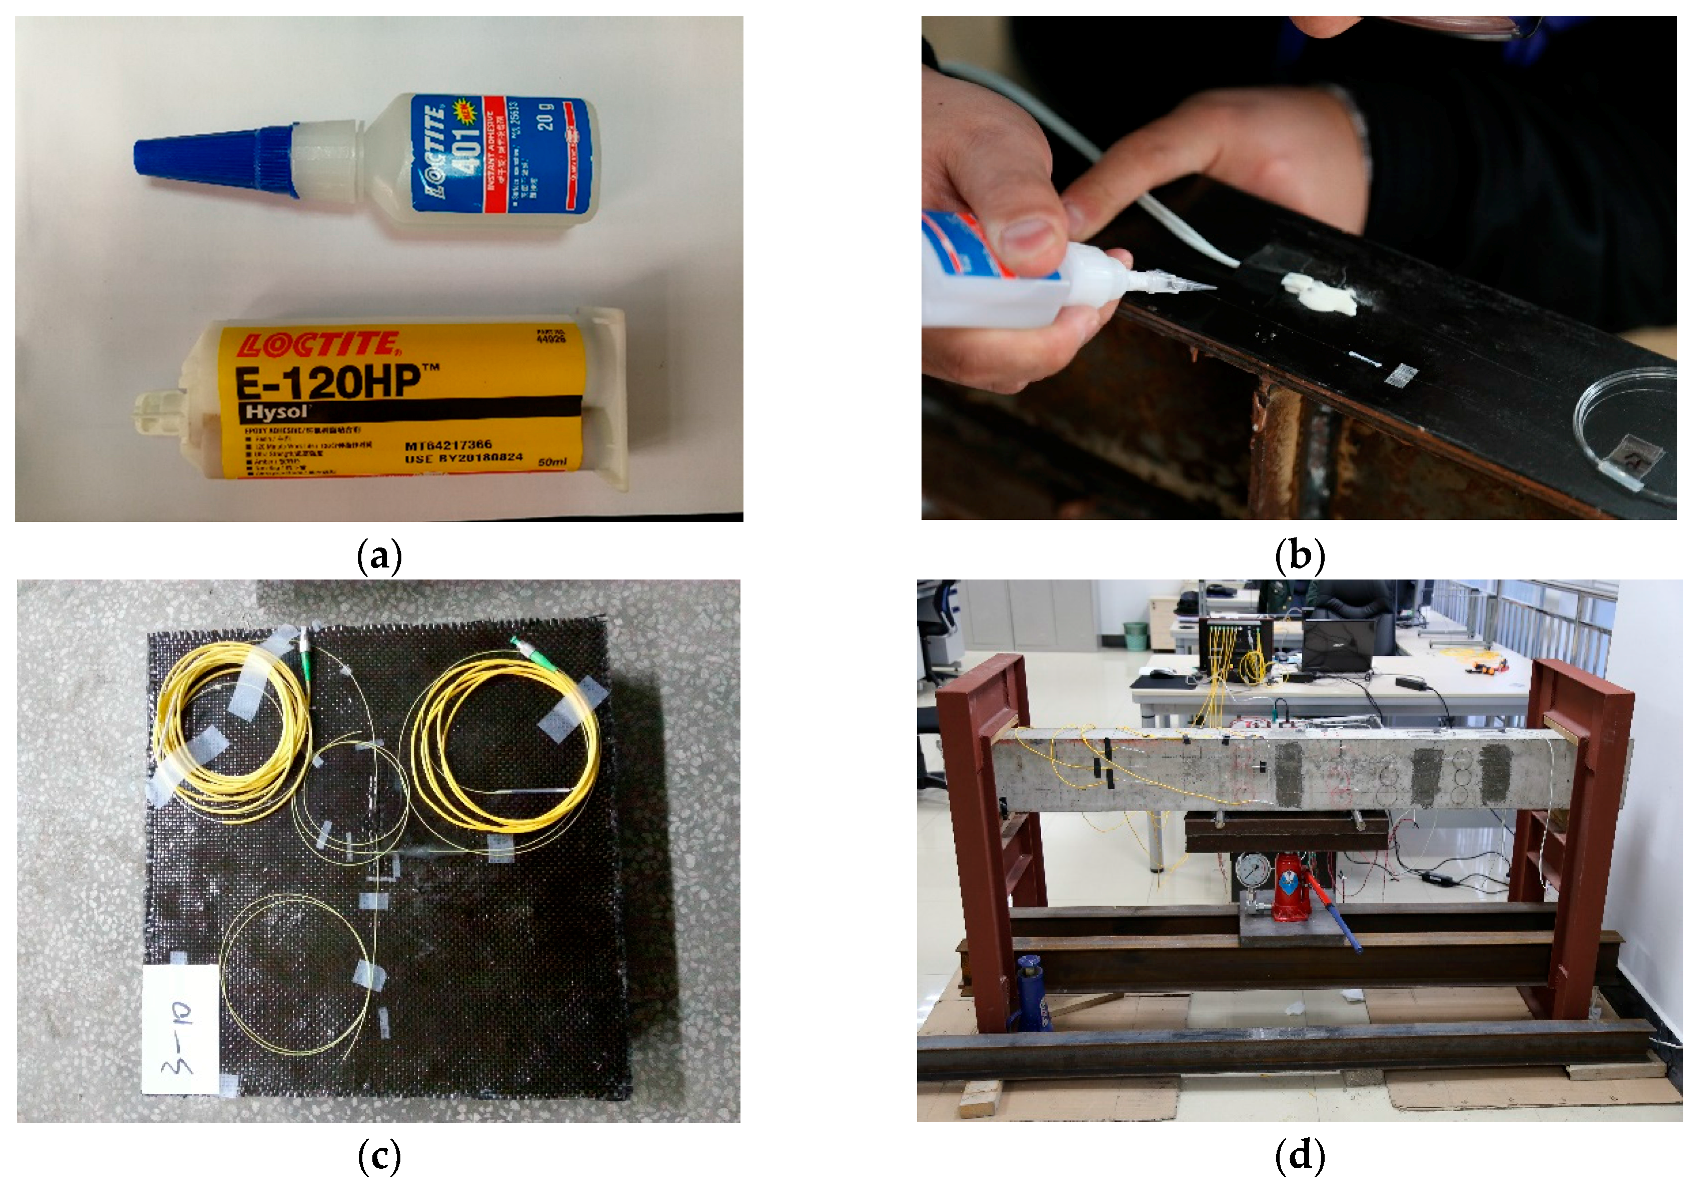
Figure 14.
The strain transfer system.
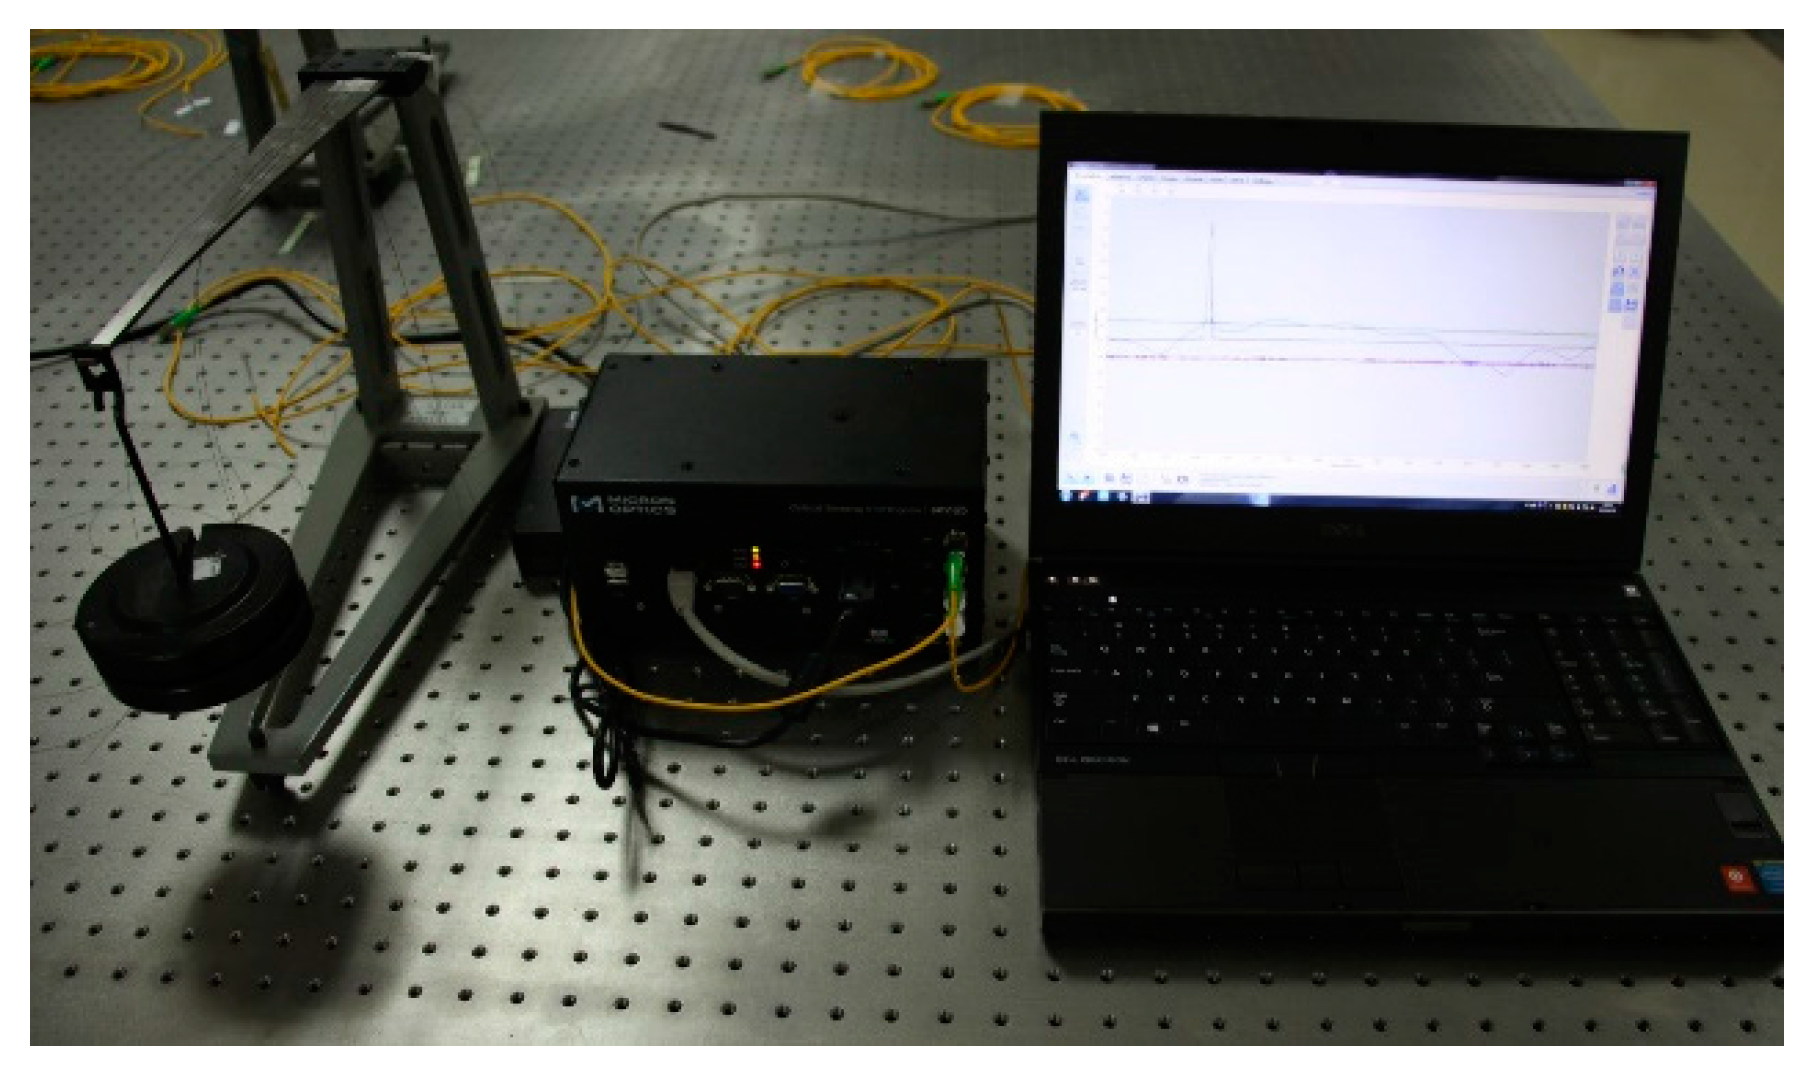
Figure 15.
Diagram of the FBG pasted on the cantilever beam.
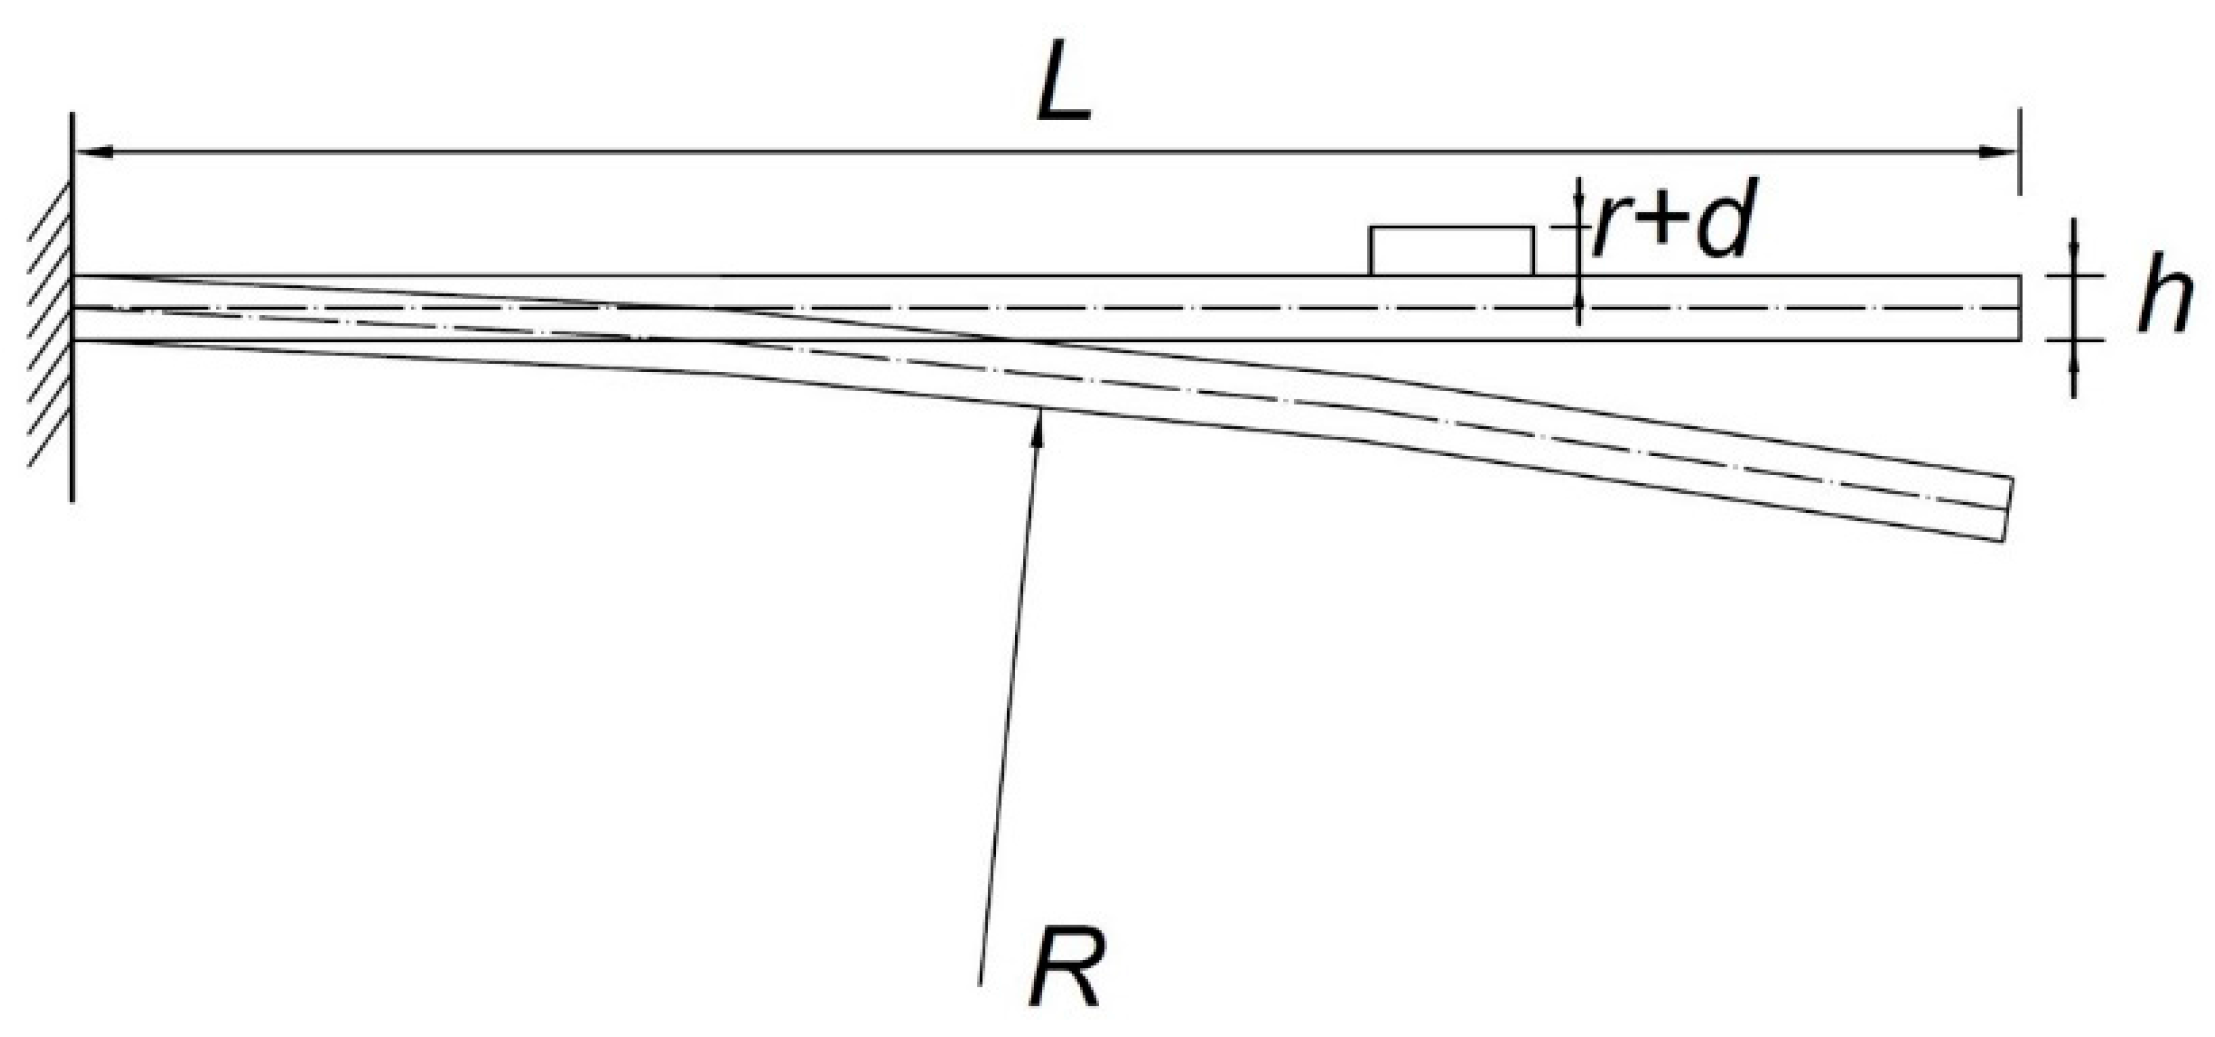
Figure 16.
The unrevised average strain transfer rate of the FBG (1570 nm).
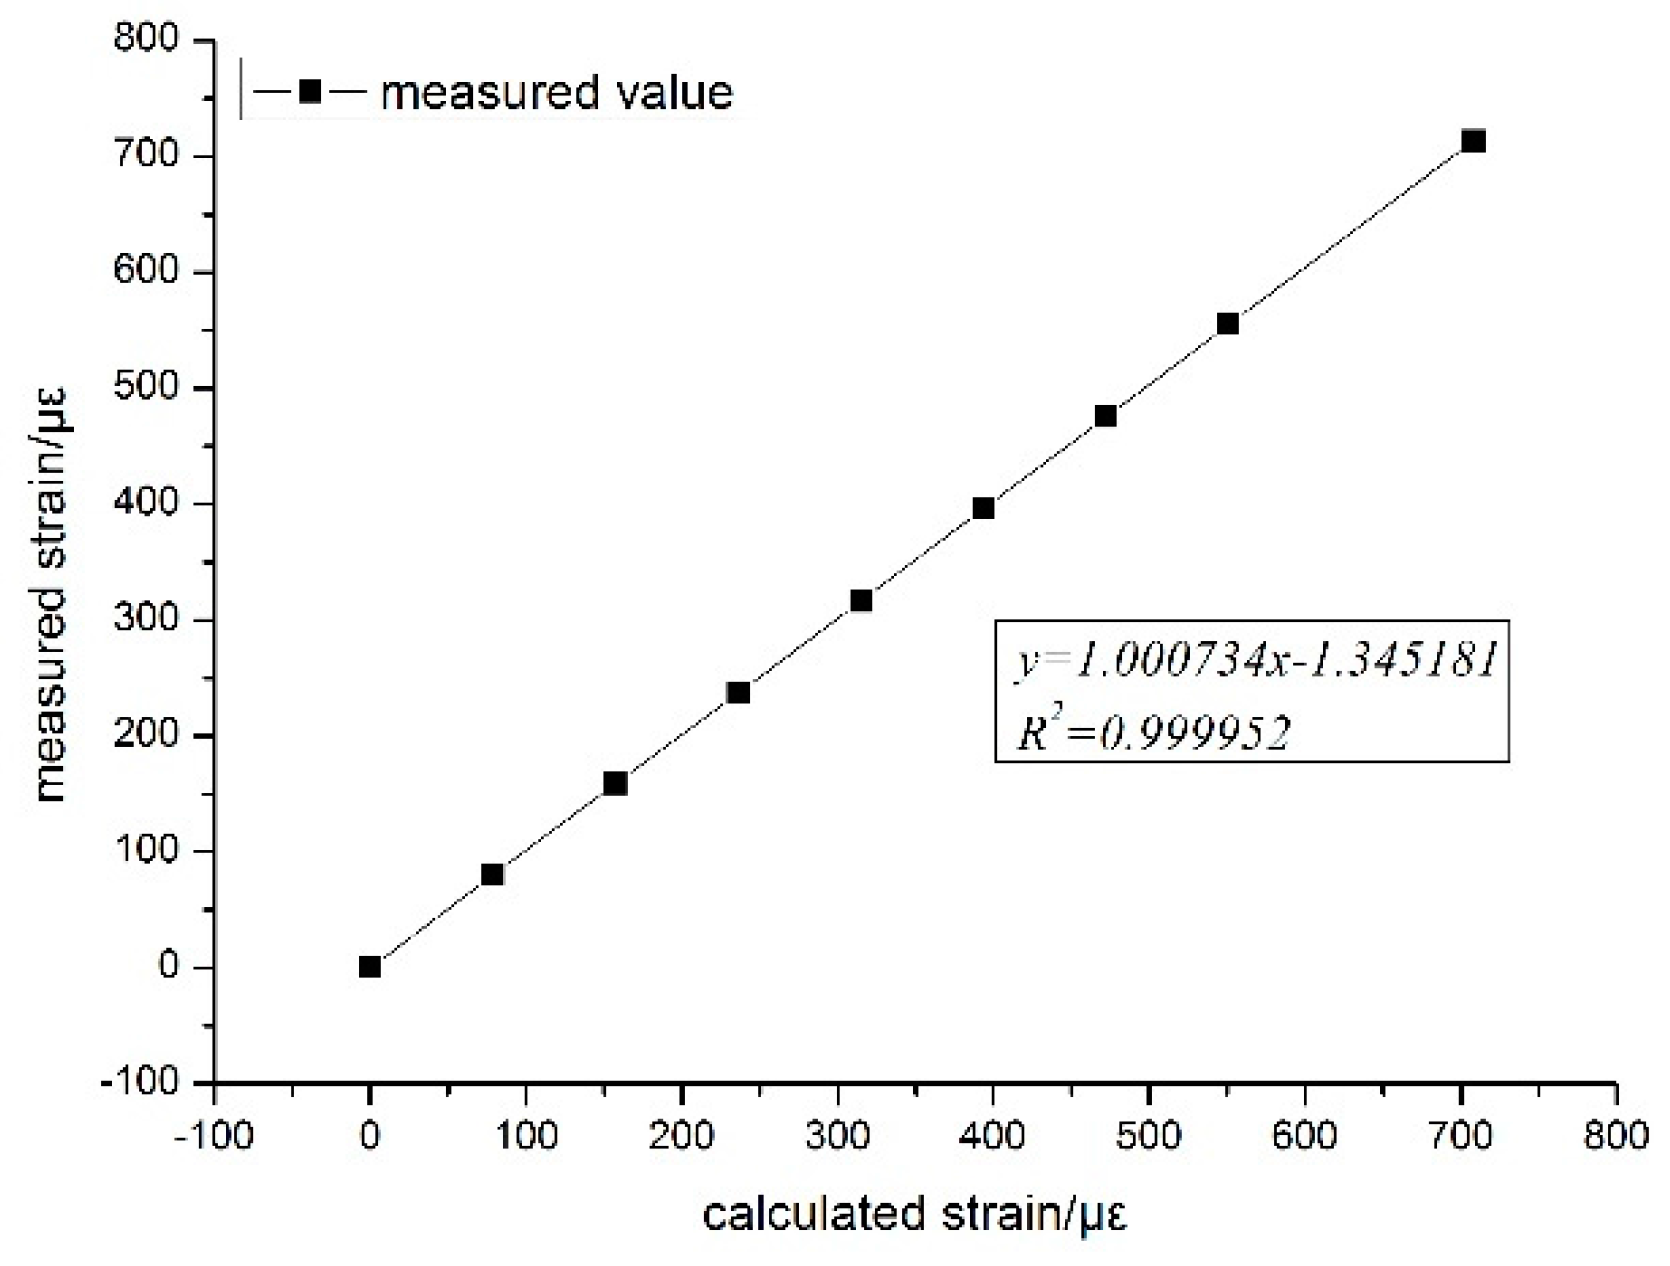
Figure 17.
The unrevised average strain transfer rate of the FBG (1525 nm).
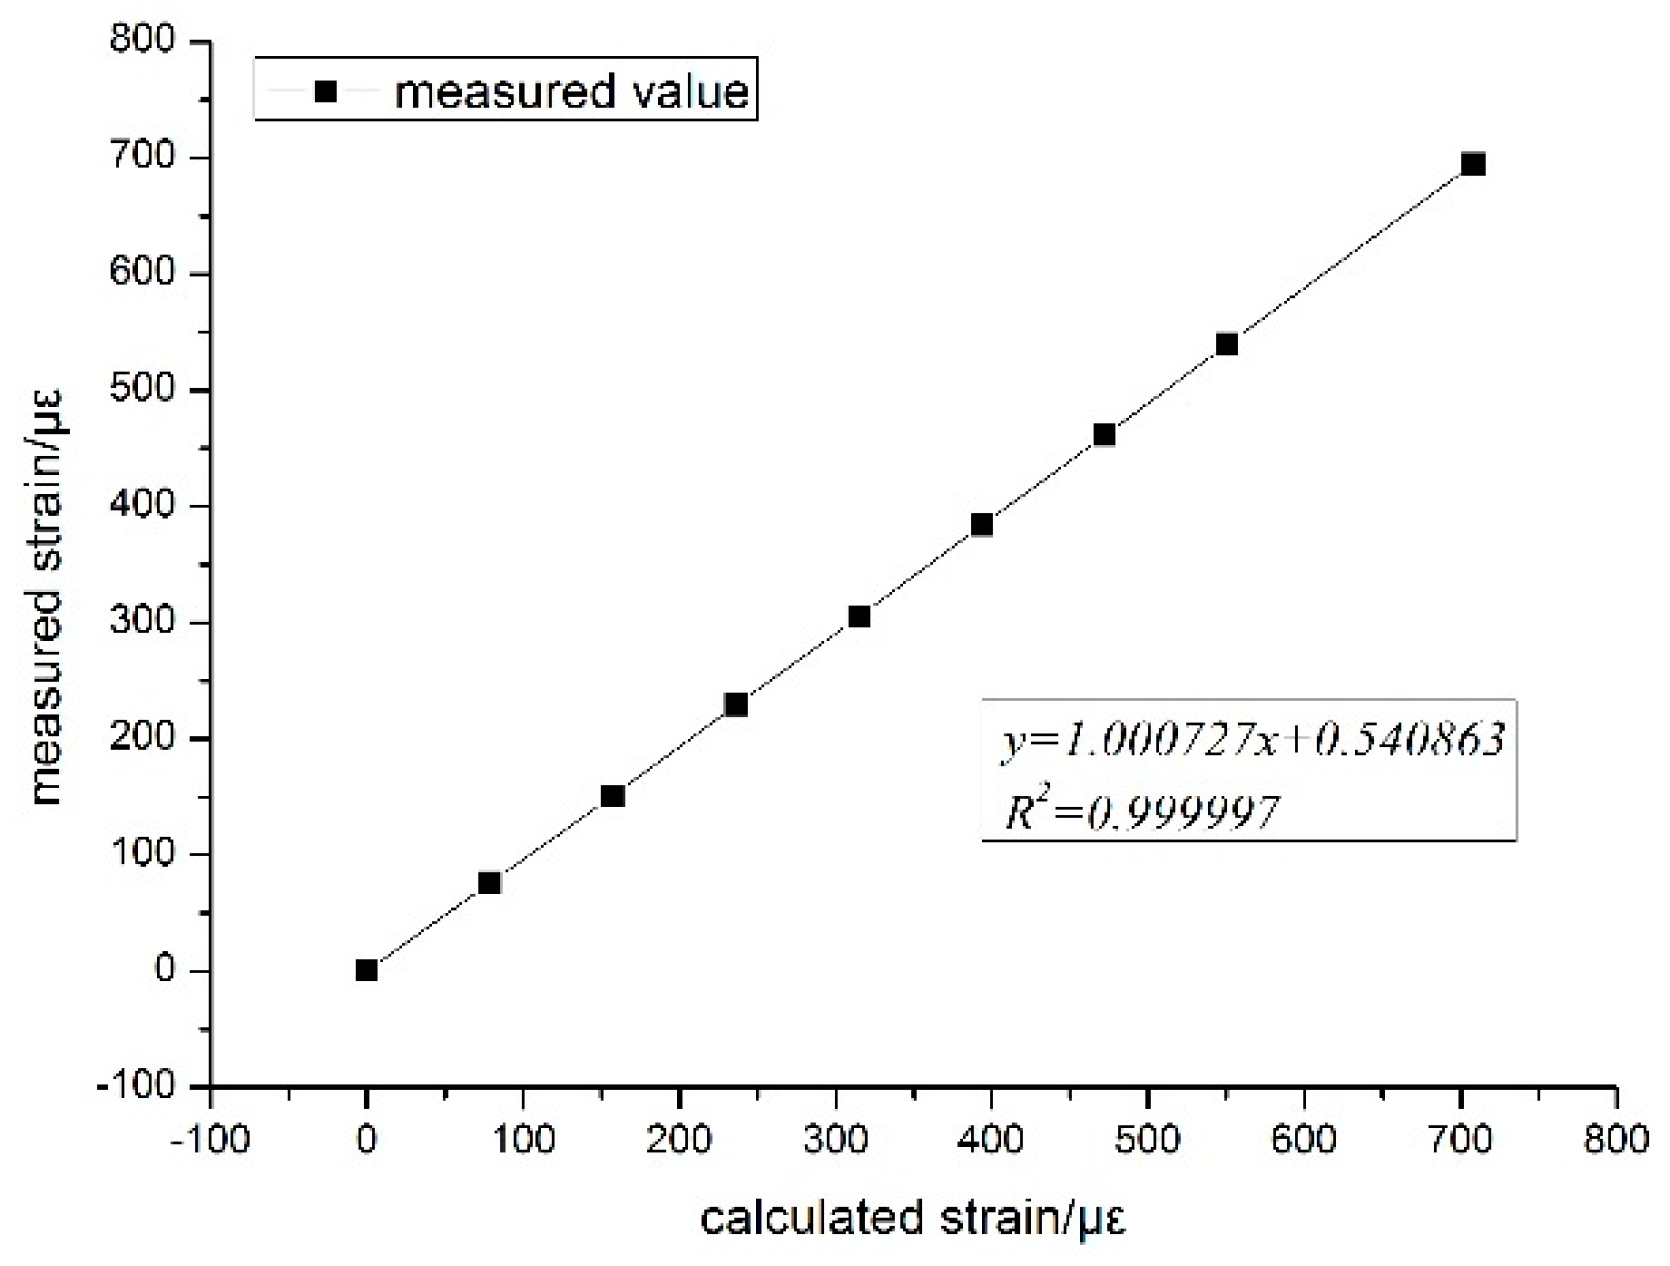
Figure 18.
The unrevised average strain transfer rate of the FBG (1520 nm).
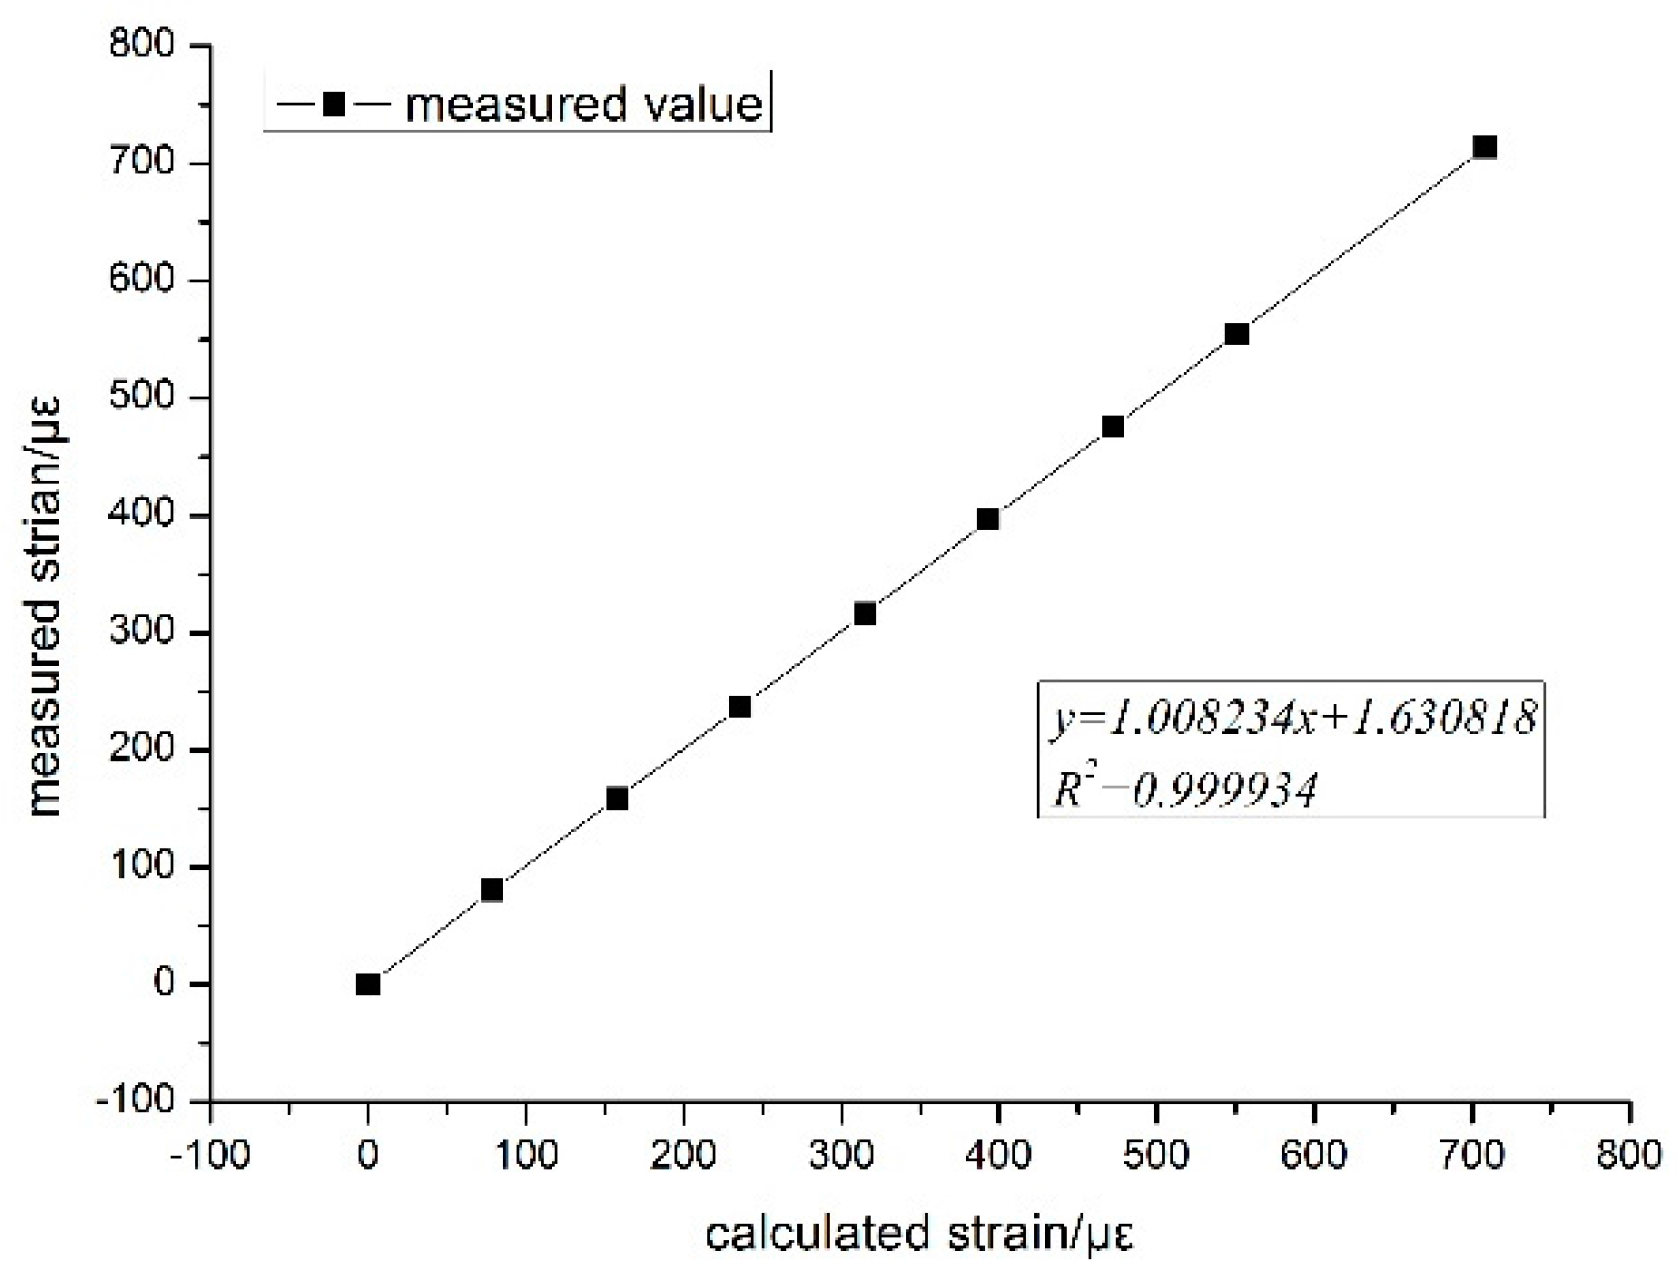
Figure 19.
Dynamic measurement test system.

Figure 20.
Cantilever beam and bonding diagram.
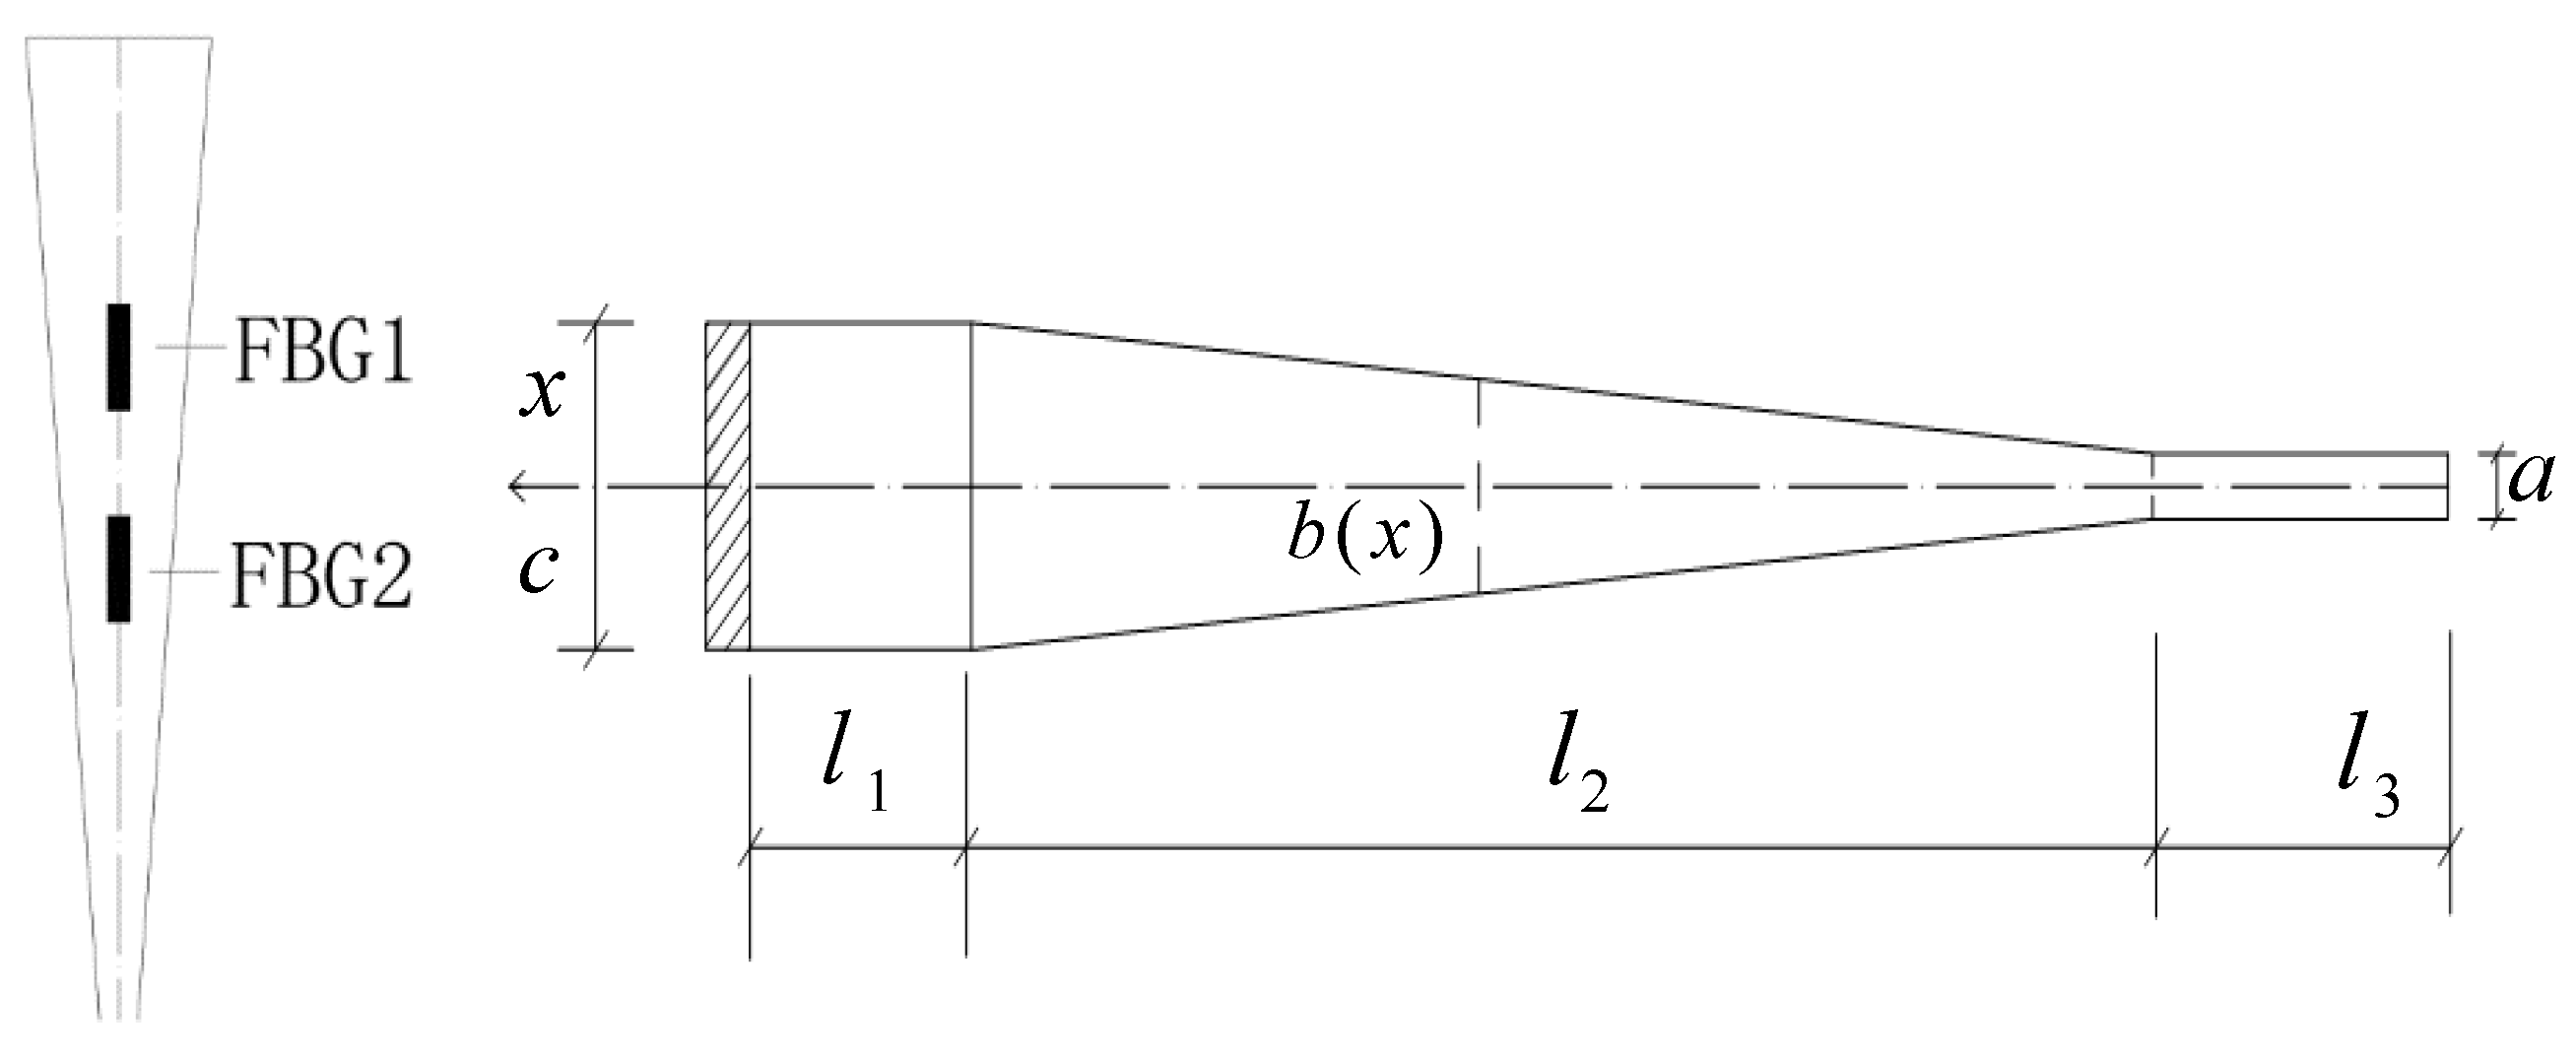
Figure 21.
Strain of the cantilever beam measured by FBGs.
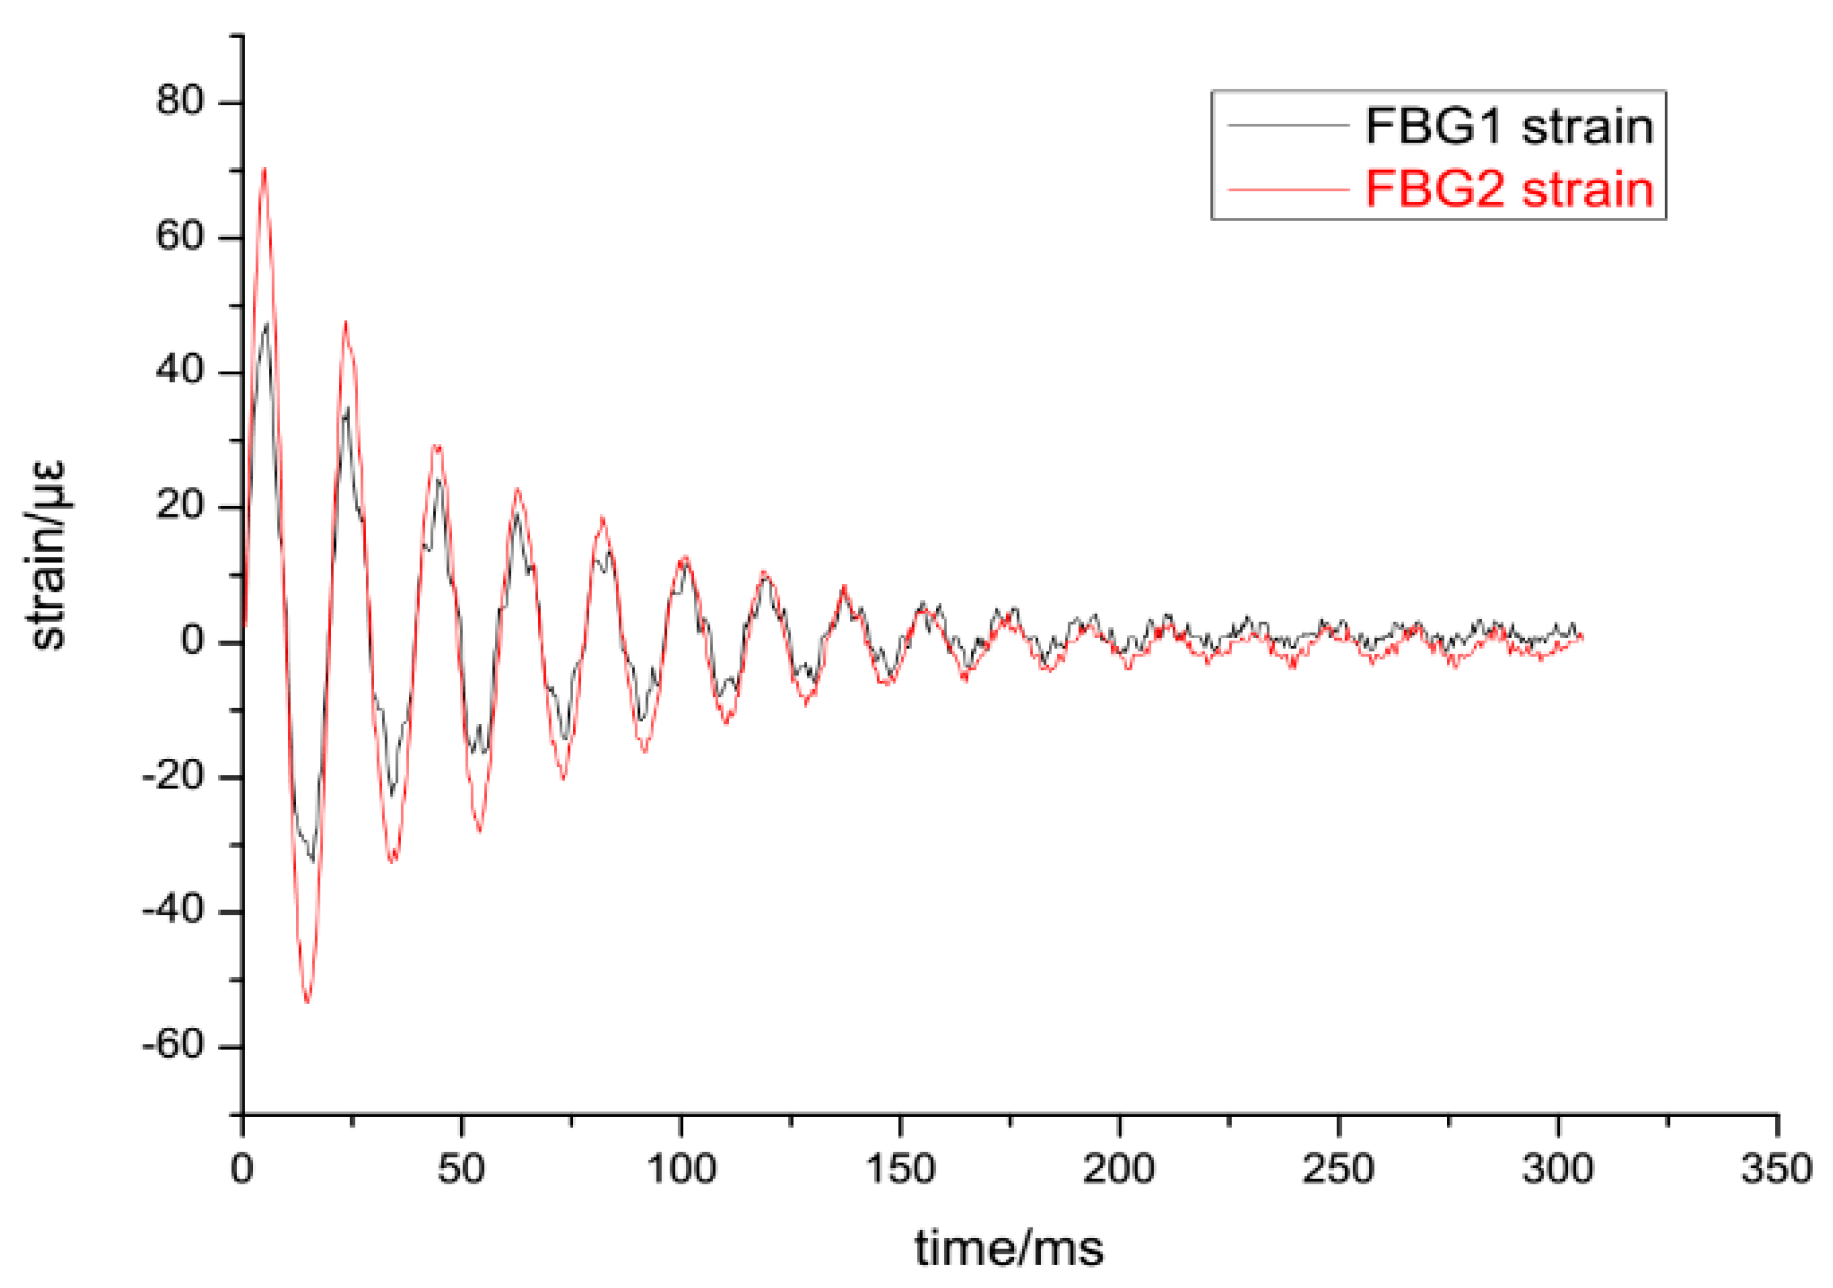
Figure 22.
Reinforced concrete specimen with FBGs without coating and other FBG sensors.
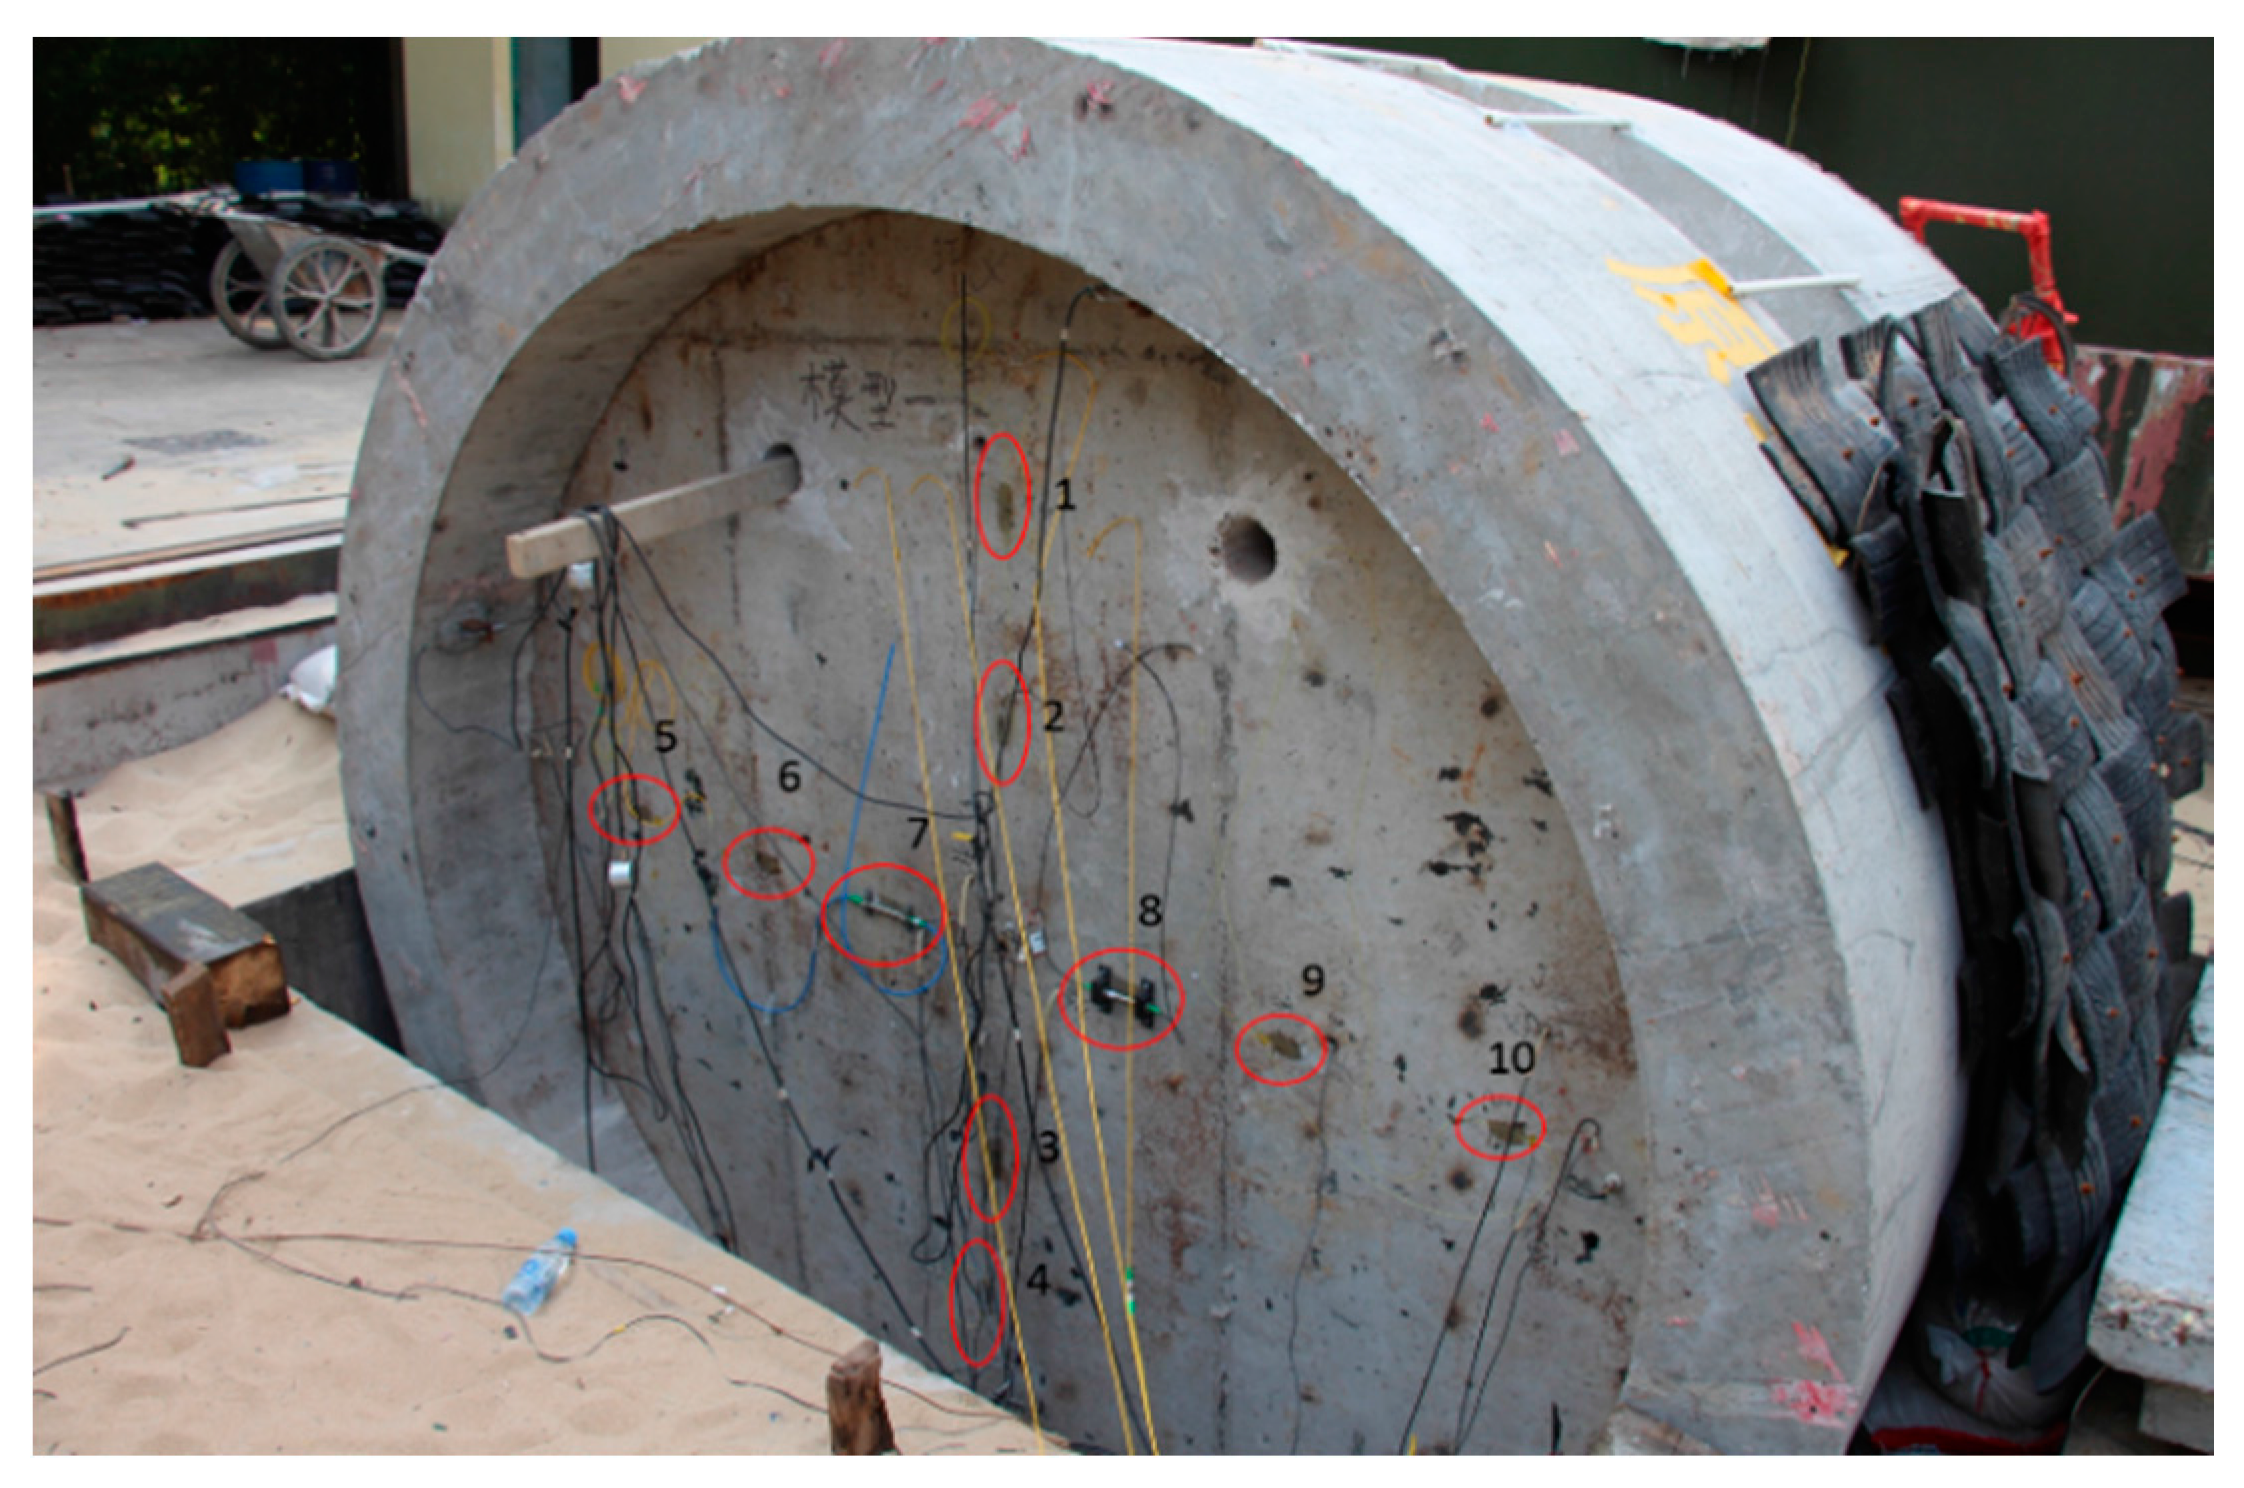
Figure 23.
Photos of bare polyimide FBGs.
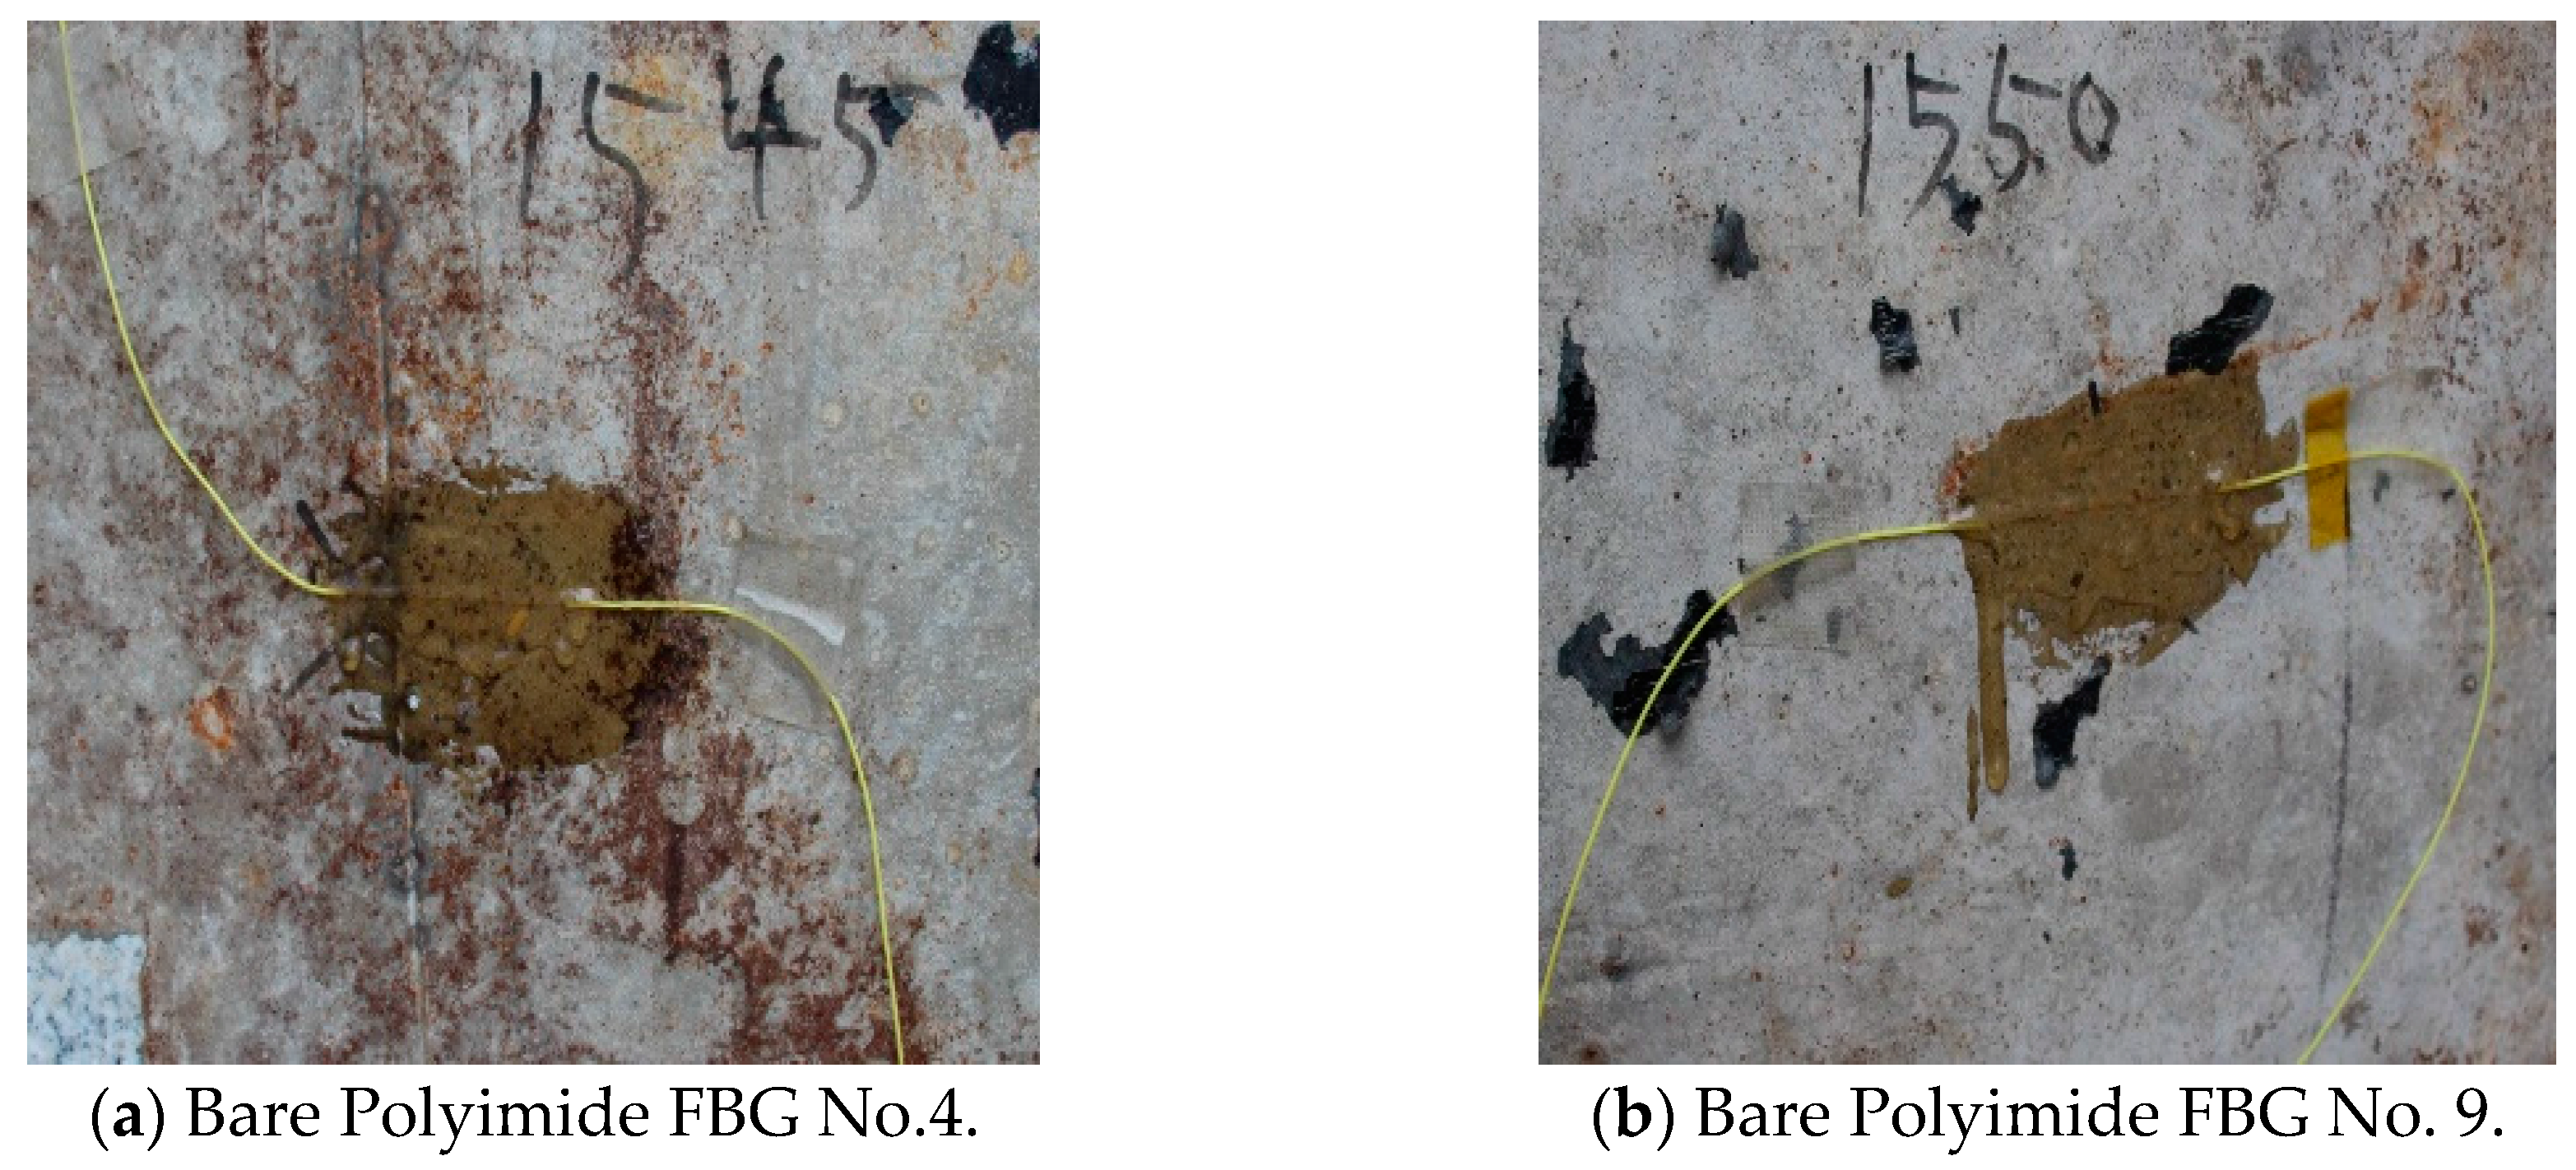
Figure 24.
Photos of os-3200 non-metallic and JPFBGS-200 optical strain gauges.
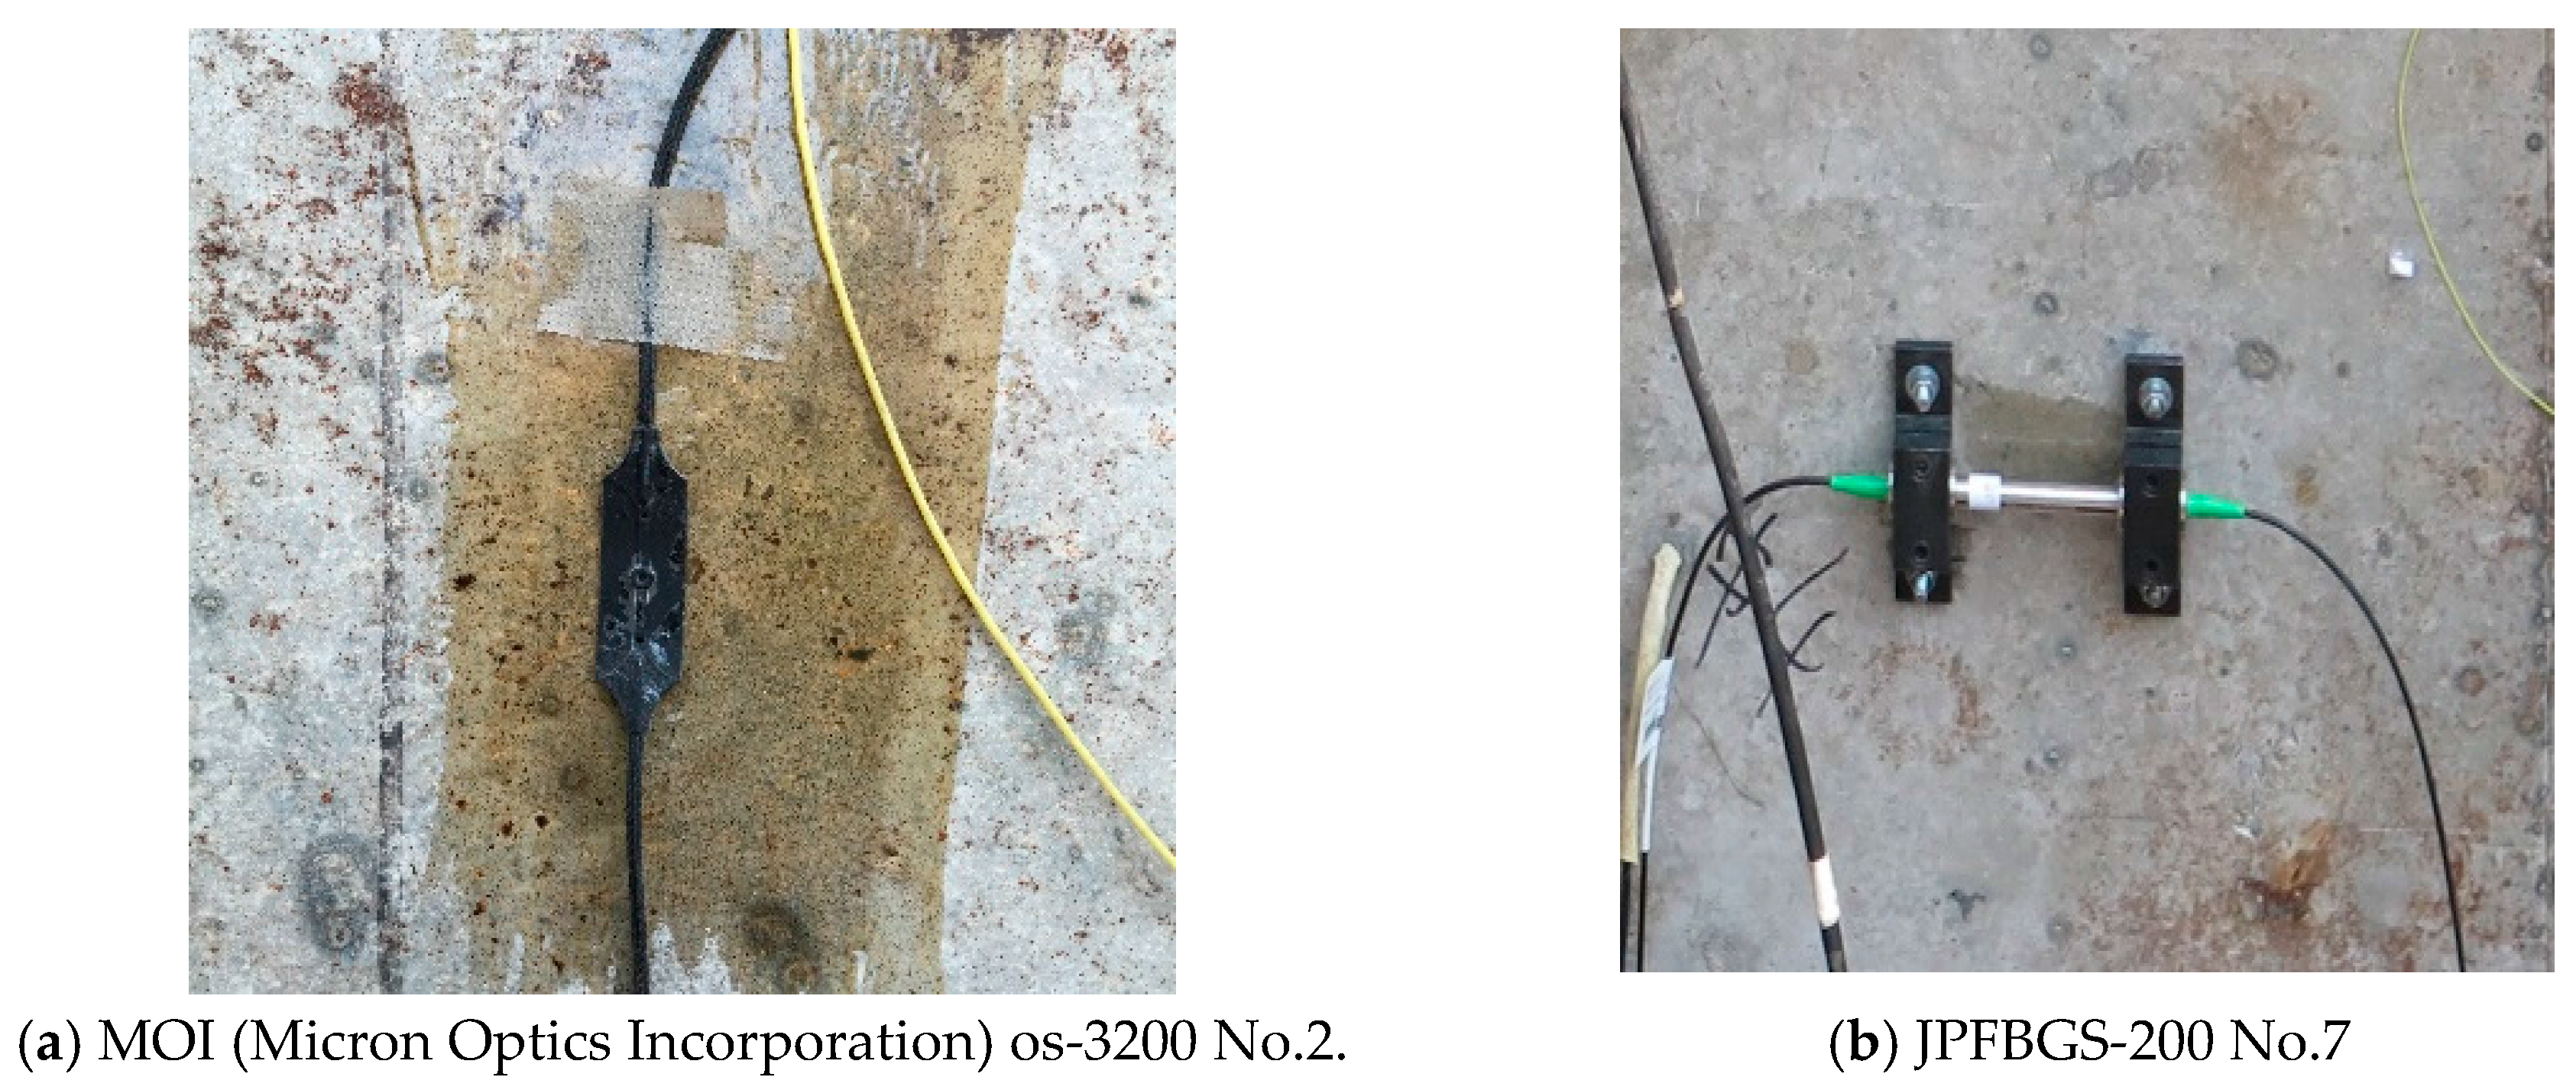
Figure 25.
Data from bare polyimide FBG No. 9.
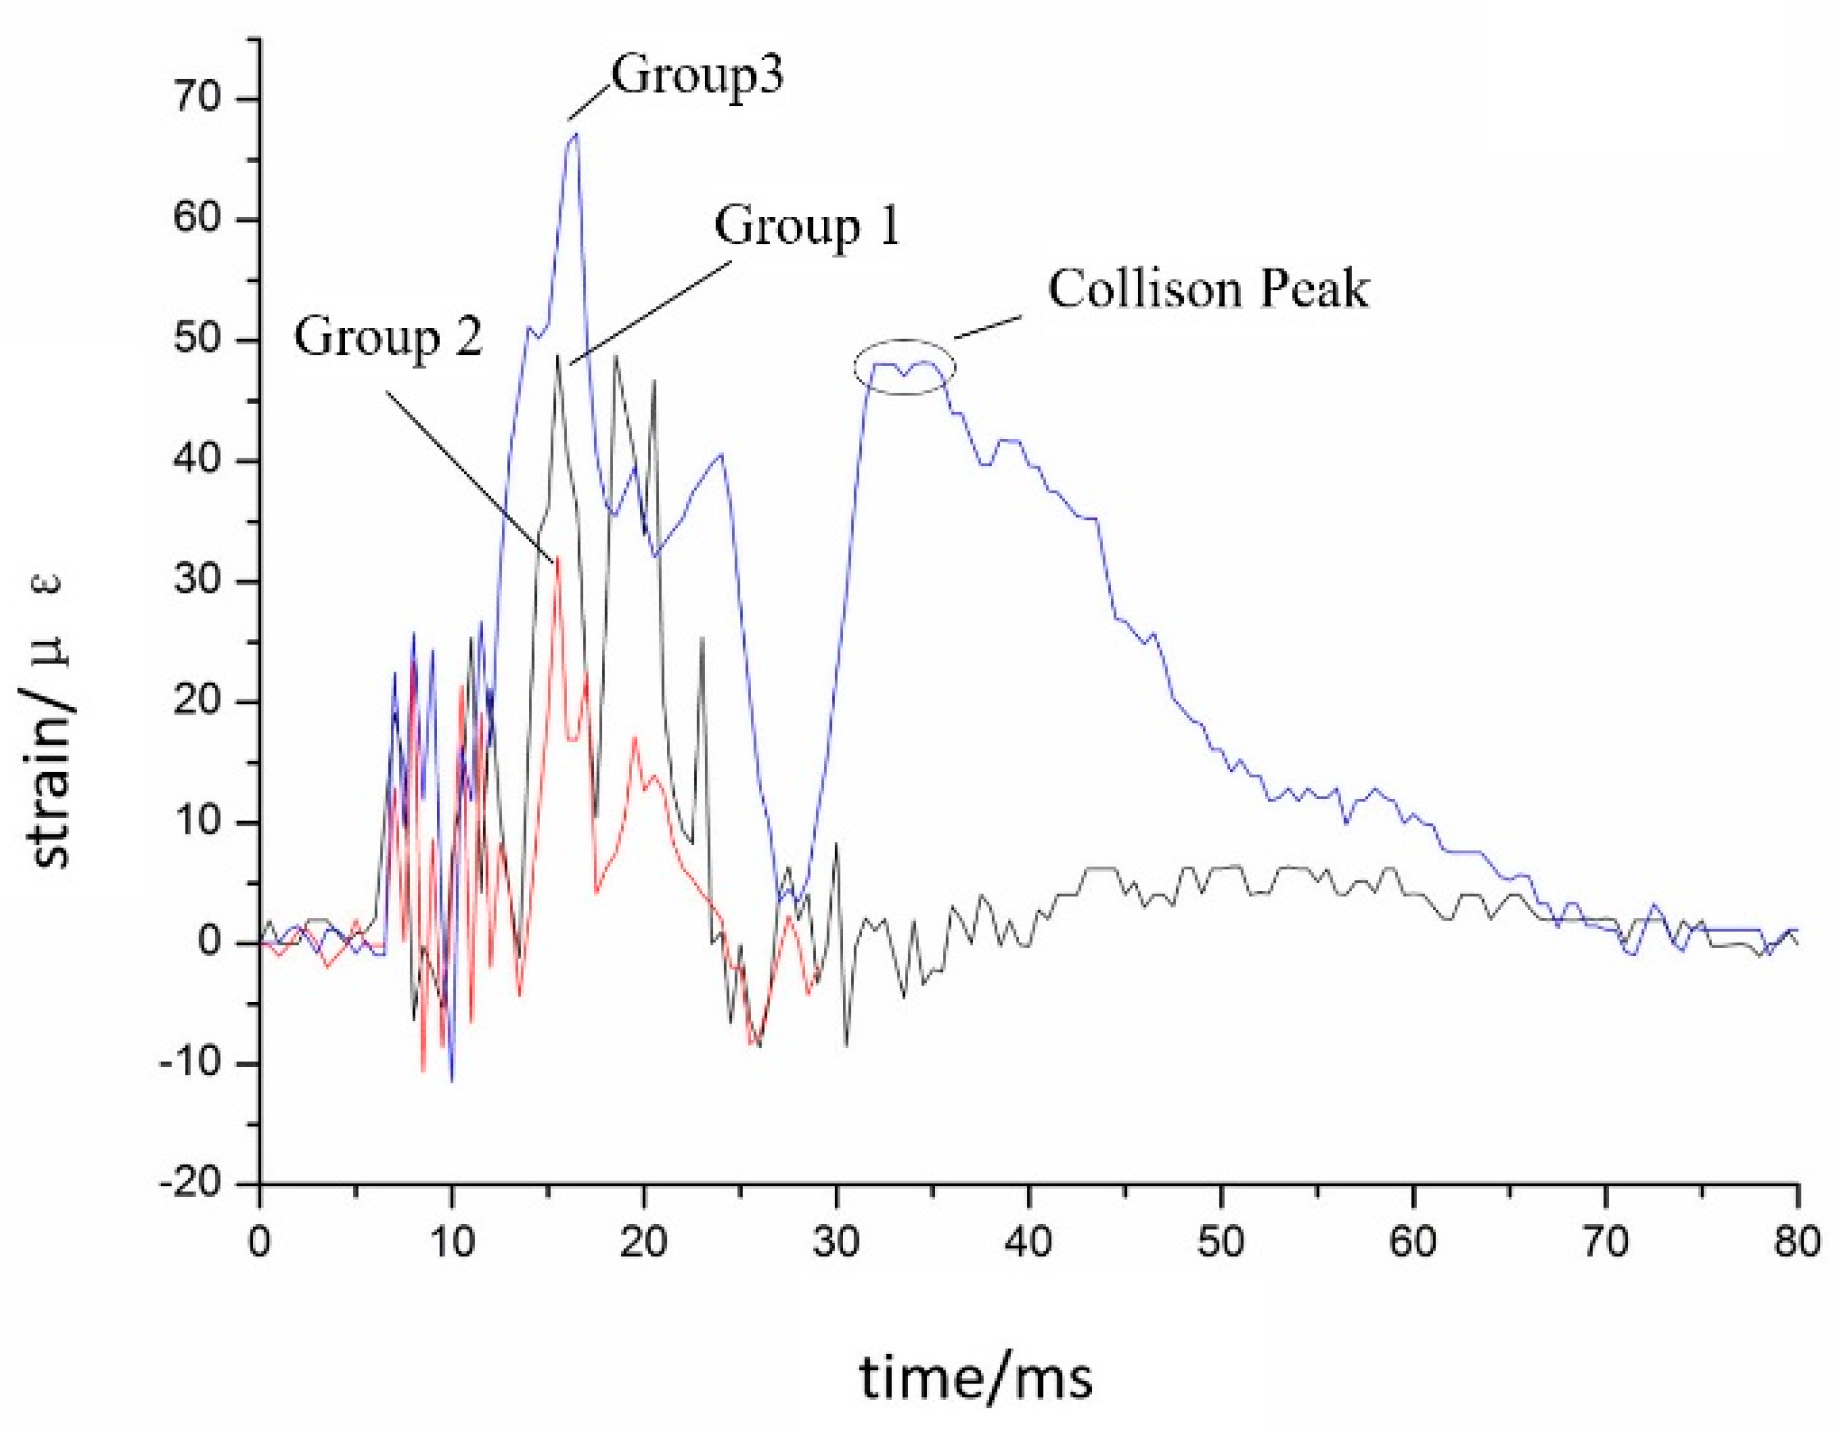
Figure 26.
Data from bare polyimide FBG No. 4.

Figure 27.
Data from os-3200 non-metallic optical strain gauges (position No. 2).

Figure 28.
Data from JFBGS-200 concrete surface strain gauges (position No. 7).

Table 1.
Results of strain transfer.
| FBG Wavelength | Measured Average Strain Transfer Rate | Theoretical Average Strain Transfer Rate | Relative Error |
|---|---|---|---|
| 1520 nm | 96.28% | 93.72% | 0.9% |
| 1525 nm | 96.18% | 93.72% | 0.8% |
| 1570 nm | 96.18% | 93.72% | 0.8% |
© 2017 by the authors. Licensee MDPI, Basel, Switzerland. This article is an open access article distributed under the terms and conditions of the Creative Commons Attribution (CC BY) license (http://creativecommons.org/licenses/by/4.0/).
Share and Cite
MDPI and ACS Style
Sun, Y.; Liu, J.; Wang, Y.; Zhang, Q.; Duan, J.; Zhang, Z.; Huang, X.; You, Z. Principles and Application of Polyimide Fiber Bragg Gratings for Surface Strain Measurement. Appl. Sci. 2017, 7, 995. https://doi.org/10.3390/app7100995
AMA Style
Sun Y, Liu J, Wang Y, Zhang Q, Duan J, Zhang Z, Huang X, You Z. Principles and Application of Polyimide Fiber Bragg Gratings for Surface Strain Measurement. Applied Sciences. 2017; 7(10):995. https://doi.org/10.3390/app7100995
Chicago/Turabian StyleSun, Yangyang, Jianyong Liu, Yuan Wang, Qinghua Zhang, Jianli Duan, Zhenglin Zhang, Xiaodi Huang, and Zewei You. 2017. "Principles and Application of Polyimide Fiber Bragg Gratings for Surface Strain Measurement" Applied Sciences 7, no. 10: 995. https://doi.org/10.3390/app7100995
Note that from the first issue of 2016, this journal uses article numbers instead of page numbers. See further details here.