Qualitative and Quantitative Changes of Carbonate Rocks Exposed to SC CO2 (Basque-Cantabrian Basin, Northern Spain)


1
Instituto Geológico y Minero de España (IGME), C/Matemático Pedrayes 25, 33005 Oviedo, Spain
2
Freelance Consultant, C/La Estrecha, 46, 16Q 4º Izq, 33011 Oviedo, Spain
3
Hydrosciences Montpellier, CNRS, 300 Avenue du Pr. Emile Jeanbrau CC57, 34090 Montpellier, France
*
Authors to whom correspondence should be addressed.
Appl. Sci. 2017, 7(11), 1124; https://doi.org/10.3390/app7111124
Submission received: 30 September 2017
/
Accepted: 27 October 2017
/
Published: 1 November 2017
(This article belongs to the Special Issue The Applications of Supercritical Carbon Dioxide)
Abstract
:This study aims at the qualitative and quantitative determination of porosity, mineralogical and textural changes in carbonate rock samples after injection of (i) supercritical CO2-rich brine and (ii) dry supercritical CO2, under similar experimental conditions (P ≈ 75 bar, T ≈ 35 °C, 970 h exposure time and no CO2 flow). The studied rocks were sampled in the western Basque-Cantabrian Basin, North Spain, and consist of vuggy carbonates (“Carniolas”) of the Puerto de la Palombera formation (Hettangian). Mineralogical and pore space characterization is completed using optical microscopy, scanning electron microscopy and optical image analysis. In addition, X-ray fluorescence analyses are performed to refine the mineralogical information and to obtain whole rock geochemical data and the brine composition is analysed before and after the experiment. Mineralogical and chemical results indicate that the carbonate rocks exposed to supercritical CO2 in dry conditions do not suffer significant changes. However, the injection of supercritical CO2-rich brine induces chemical and physical changes in the rock due to the high reactivity of calcite at the low pH conditions produced by the acidified brine. Numerical modelling validates the experimental observations. These results can be used to characterize the behaviour of carbonate rocks under conditions similar to the vicinity of a CO2 injection well. The results should be considered only at the scale of the studied samples and not at reservoir scale.
1. Introduction and Objectives
Reduction of greenhouse gas concentration in the atmosphere has been in the focus of scientific research over the last decades. One of the possible approaches is to capture CO2 from large industrial sources and to storage it in deep geological formations [1,2,3,4]. During this process, the CO2 is injected into a formation of high porosity and permeability (reservoir), which is overlaid by an impermeable formation (seal).
Sedimentary rocks—both of siliciclastic and carbonate composition—are especially suitable reservoirs due to their textural and mineralogical characteristics. The high porosity and permeability of many sedimentary formations are decisive factors to consider for the feasibility of CO2 injection on a large scale [5]. The CO2 injection is intended in a dense phase or in supercritical conditions (SC CO2: P > 73.8 bar, T > 31.7 °C), which results in a significant volume reduction of the gas [1,6]. These conditions occur naturally in reservoirs under 800 m depth.
Injecting CO2 into geological formations provokes a series of physical and chemical changes, which can significantly modify the reservoir properties [7]. Geochemical changes arise from the interaction of the minerals of the host rock, the fluids that occupy the pore space of the rock and the injected fluid (i.e., SC CO2). A first step of this interaction is the acidification of the pore water due to the dissolution of CO2, after which a series of precipitation and dissolution events may take place in the rock-brine-CO2 system depending principally on the mineralogical composition of the rock [8,9,10]. In carbonates, the acidified brine tends to dissolve calcite (CaCO3). This dissolution increases the Ca ion concentration in the brine, which creates favourable conditions for the precipitation of other solid phases. For example, if the brine contains relevant concentrations of sulphate ions, precipitation of gypsum (Ca SO4) could be possible [11]. This is a plausible situation as high salinity of the brine is one of the requirements for CO2 storage [1], being this condition an indicator of a confined reservoir structure. A large number of laboratory experiments (both static and dynamic) have addressed the described rock-brine-SC CO2 interaction [4,12,13,14,15]. These studies concluded that the rock porosity and permeability increase after CO2 injection due to the dissolution of carbonate minerals (e.g., CaCO3). Notwithstanding, in other studies [15,16,17,18,19,20], the porosity-permeability of the rock was decreased by the precipitation of new mineral phases (e.g., MgCO3, CaSO4) even though carbonate dissolution also took place. A recent review paper [21] concluded that often contradictory results were published in the literature and that the “uncertainty regarding injectivity alteration caused by salt precipitation is very high”.
According to [7], the dissolution-precipitation ratio is controlled by the SC CO2 dissolution in the brine, in other words by the saturation ranges of liquid (brine) versus gas (CO2) phases. CO2-rock interactions in dry or near dry conditions have also been studied [3,22,23]. These conditions are likely to occur during the injection phase in the close vicinity of the injection point (i.e., well), where the SC CO2 displaces the brine and fills the rock pore space. Theoretical and experimental studies of rock—CO2 interactions in dry conditions [3,20,24] indicate the absence of chemical reactions and, consequently, negligible textural-mineralogical-chemical changes. During CO2 injection into a geological formation, zones of different saturation ranges of liquid and gas phases are formed in function of the distance to the injection point. Laboratory experimentation coupled with geochemical modelling of rock-brine-CO2 interactions is a suitable method to explore and understand the mechanisms and processes of CO2 injection and storage [25].
In the present research, laboratory-scale experimental SC CO2 injection is studied in carbonate rocks under conditions also applied by [26,27,28]. The rock type was selected due to its importance as potential CO2 reservoir in Spain. The lithological characteristics and the structural position of the studied “Marine Jurassic” sequence provide favourable conditions for CO2 storage [29]. The pressure (P) and temperature (T) conditions and the exposure time (t) were selected to model possible conditions in the near-well zone of a theoretical CO2 injection well [7], more precisely, (i) at the CO2—brine interphase and (ii) in the dry zone where the CO2 displaced the brine. The aim of the research was (i) to study the possible mineralogical-textural changes of the rock after the rock-brine-CO2 and the rock-CO2 interactions, respectively, by means of optical microscopy (OpM), scanning electron microscopy (SEM), and optical image analysis (OIA); and (ii) to study the chemical—compositional evolution of the brine and whole rock by comparative analyses before and after the experiment. Finally, mass balance calculation was compared with numerical geochemical computation in order to validate and interpret the laboratory results. This approach has been successfully applied in several studies (e.g., [11]).
This study focuses exclusively on the textural-mineralogical changes produced by chemical interactions by X-ray fluorescence (XRF), disregarding physical alterations that may appear under dynamic conditions due to the flow of CO2 and brine through the rock (e.g., particle entrainment, induced fracturing, etc.).
2. Geological Setting
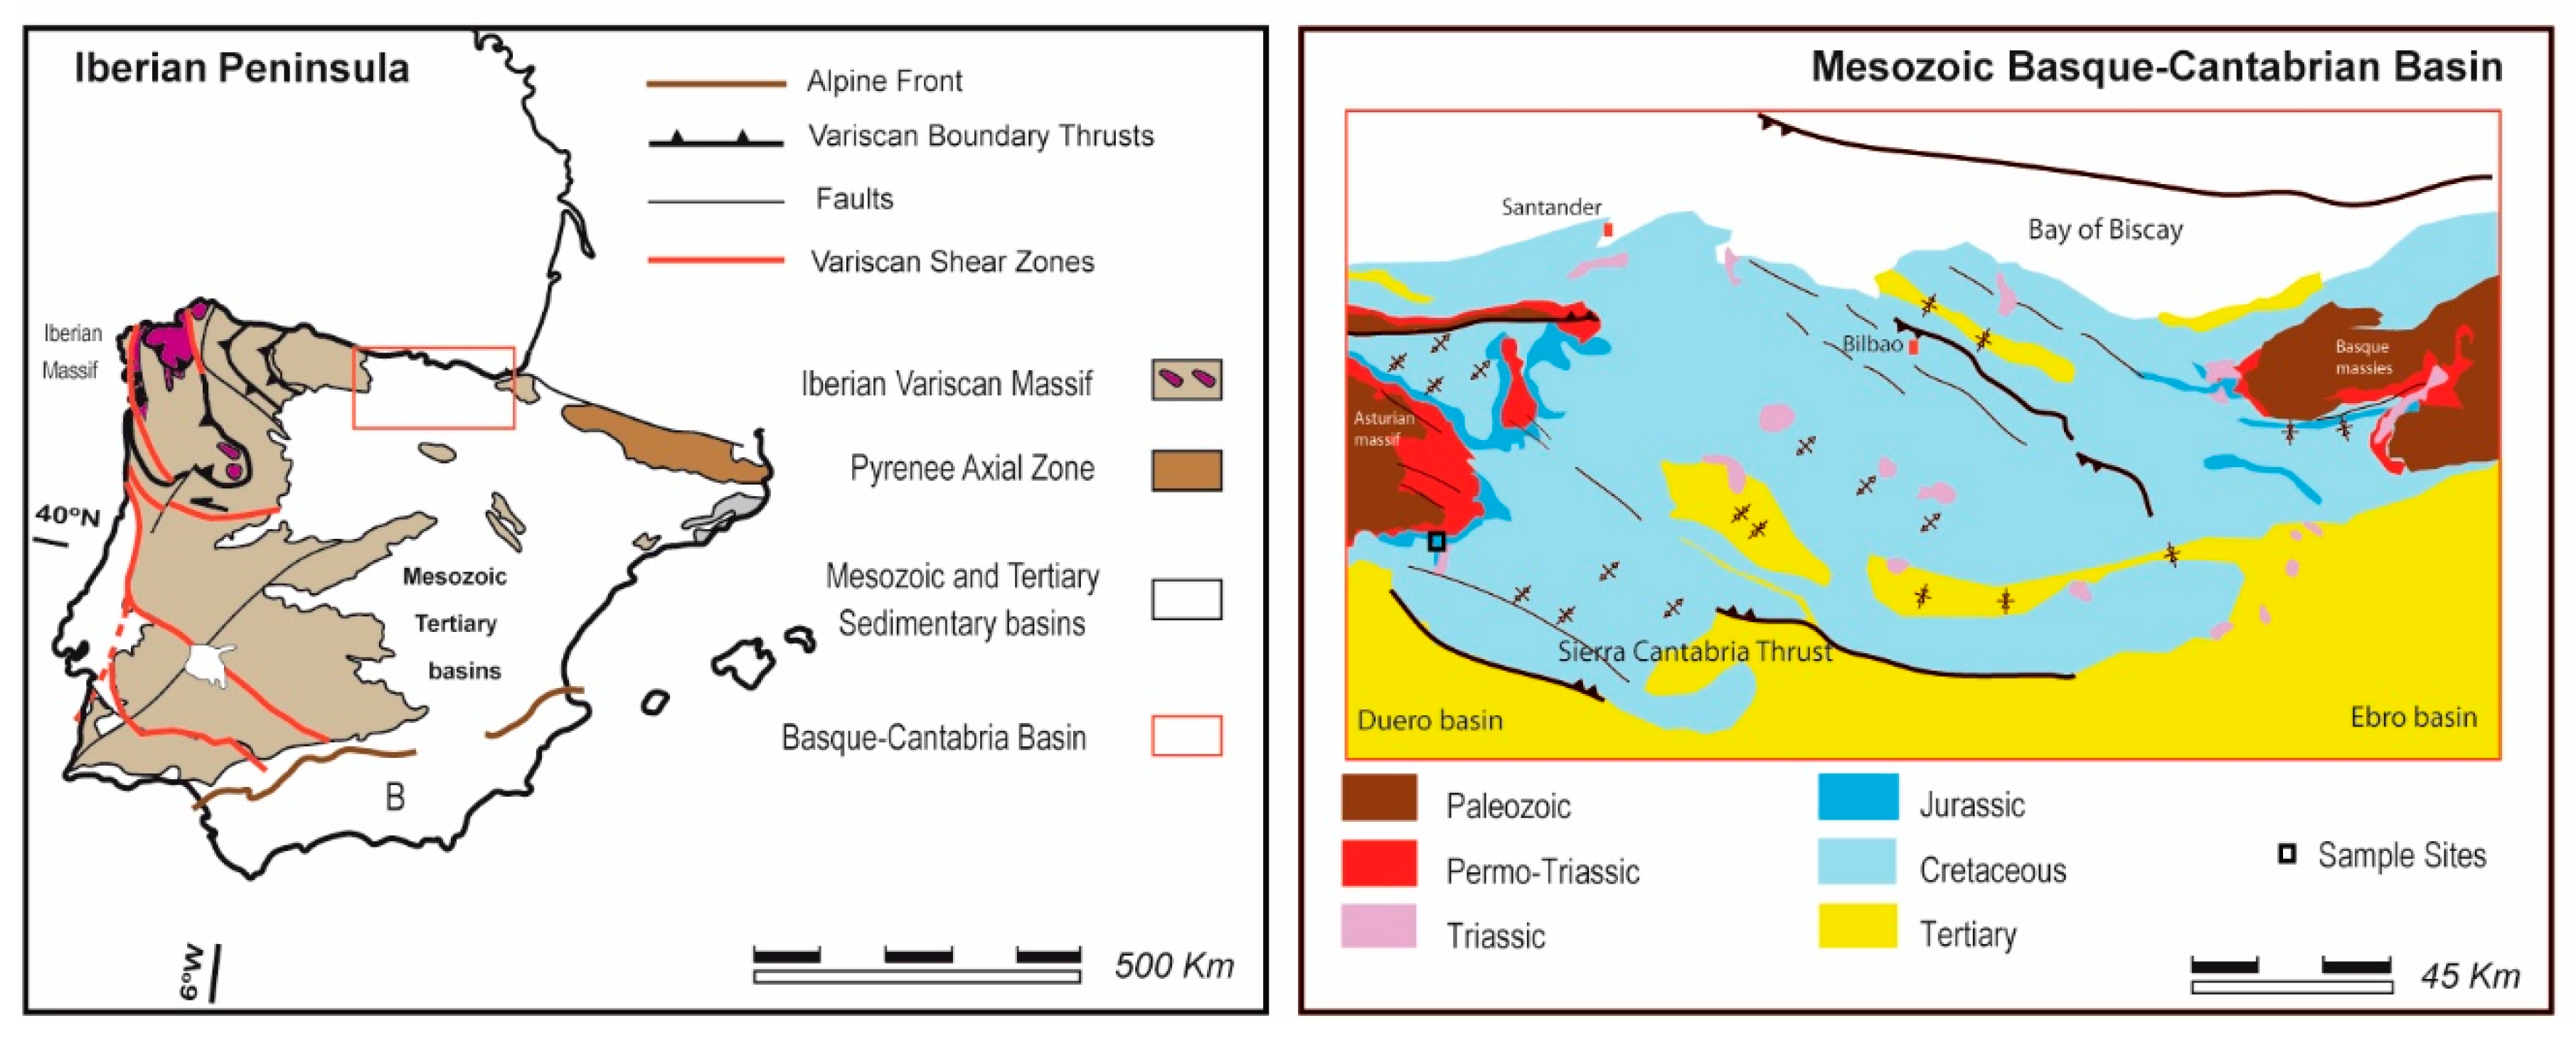
The main criterion for the site selection of this study was to sample sedimentary formations with real potential to be used as CO2 reservoirs (formations with suitable depth, permeability and with a demonstrated seal formation). The Basque-Cantabrian basin (northern Spain) (Figure 1) was selected according to the results of the research conducted by the Geological Survey of Spain (IGME) in CO2 geological storage [29] and of previous studies concerning hydrocarbon exploration in the same areas [30]. The selection was further refined to the Hontomín structure area [31,32], which has been widely studied and proved to have potentiality for geological storage due to the presence of early structural traps.
The study focuses on the carbonate deposits of the Jurassic (Lias and Dogger) marine sequence of the western part of the Basque-Cantabrian basin [33,34,35,36]; more precisely, on the evaporitic-stromatolithic facies belts of the shallow carbonate ramp, which have suitable porosity and permeability for CO2 storage [37,38]. In this area, the following sequence of facies belts has been described: (i) sabkha facies characterized by dolomites, marls and interbedded anhydrites, forming collapse breccias (“carniolas”) on the surface due to the dissolution of the evaporitic components (Puerto de Palombera Fm., Hettnanigian); (ii) peritidal facies formed by stromatolites at the base and oolitic grainstones at the top (Villanueva de Puerta Fm, Lower Sinemurian); (iii) open ramp facies characterized by cycles of mudstone to grainstone sequences (Sopeña Fm., Lower Sinemurian); and finally, (iv) fluvial to shallow marine mixed carbonate and siliciclastic deposits (Río Polla Fm., late Lower Sinemurian) [35]. The materials of the shallow carbonate ramp are overlaid unconformably by alternations of marls, marly limestones and shales of a deeper (100–400 m) hemipelagic ramp [36]. The studied rocks were sampled in the south-western part of the Basque-Cantabrian basin and consisted of vuggy carbonates (“Carniolas”) of the Puerto de la Palombera formation.
3. Methodology
The overall methodology to study the mineralogical and geochemical changes of carbonate rocks when exposed to SC CO2 rich brine consisted of the following steps:
- Selection of a study area with real potential for CO2 geological storage (Figure 1).
- Identification of reservoir rocks in this area and their sampling for laboratory experimentation (Figure 1).
- Preparation of rock samples for laboratory experiments providing sample pairs in order to conduct comparative studies before and after SC CO2 exposure. The sample pairs are prepared to have one matching surface as close to each other in the original block as possible (Figure 2).
- Mineralogical and chemical characterization of rock samples and definition of brine composition before the experiment.
- Rock sample exposure to SC CO2 in a hyperbaric chamber simulating conditions of CO2 injection in a geological reservoir (P ≈ 75 bar, T ≈ 35 °C, 970 h exposure time and no CO2 flow) (Figure 2).
- Mineralogical and chemical characterization of rock samples and analysis of brine composition after the experiment.
- Comparison of analytical results obtained in the two stages of the experimentation (before and after SC CO2 exposure).Mass balance calculation and numerical modelling for validation of obtained results.
3.1. Experimental Setup (Sample Preparation and SC CO2 Injection)
Sample preparation plays a crucial role in experimental studies especially when the analytical procedure is based on a comparative study of samples. In order to minimize the effect of rock heterogeneity, the mineralogical (OpM-SEM) and geochemical (XRF) characterization of the samples before and after CO2 exposure was conducted on neighbouring areas of various blocks of 27 cm3. Although the thin sections and the SEM specimens of before-after samples obviously could not be prepared of exactly the same sample area, they were taken from surfaces as close to each other as possible (a few millimetres of distance). For the geochemical comparative analyses neighbouring blocks were used. The sample blocks selected for CO2 exposure were saturated with brine in cycles of 72 h under atmospheric conditions.
The experiment was conducted in a static Autoclave chamber (without CO2 flow during the test) at 7.5 MPa pressure, 35 °C temperature, during 970 h. The configuration of the experimental setup (chamber, pumps, CO2 cylinders, connections, etc.) was based on other systems described by [15,20,26,28]. In general terms, two cylinders of commercial CO2 of 99.8% purity were connected via 5 mm stainless steel tubes to (i) the chamber of 3 dm3 where the samples were placed and (ii) to a piston pump also connected to the chamber. The first cylinder, directly connected to the chamber, makes it possible to fill the chamber with CO2 at atmospheric temperature and 4.5 MPa pressure. The second cylinder allows the user to pressurize the chamber applying a controlled gas flow until the desired pressure value (i.e., 7.5 MPa). The inside material of the chamber is Hastelloy C276 alloy. The temperature inside the chamber (35 °C during the experiment) is controlled by a temperature regulator. All of the elements and sensors (of pressure and temperature) of the system are connected to a central computer which controls and regulates the system setup by the Hel 5.1 software (HEL Ltd., Borehamwood, UK).
Six previously saturated rock samples were placed into the chamber and covered with 0.3 dm3 of brine. For the dry experiment the samples were not saturated and no brine was introduced into the system. In both wet and dry configurations, the test consisted of three distinct phases: (i) the fill-in phase, filling the chamber with CO2 until reaching supercritical conditions (3 h); (ii) the experimental phase, during which the supercritical pressure and temperature values are maintained steady; and (iii) the evacuation phase, during which the system is de-pressurized and the fluid and solid samples are collected (3 h). All the experimental runs for this study were carried out in the Laboratories of the IGME in Tres Cantos, Madrid, Spain.
3.2. Applied Techniques and Methods
A detailed petrographic description was the first step of the study using optical microscopy (OpM) (Leica DM 6000, 20×, 10×, Wetzlar, Germany). This study was repeated after the SC CO2 exposure. In order to obtain more detailed qualitative data about the rock petrography, Scanning Electron Microscopy was also applied (JEOL 6100 SEM, using W-Filament, acceleration voltage of 20 kV and Inca Energy-200 software (Inca Energy, Abingdon, UK)). By means of optical image analysis (OIA) the main parameters of optical porosity were quantified using ImageJ software on OpM images acquired by a Charge-Coupled Device (CCD) camera (ProgRes 5.0, Jena, Germany). The chemical composition of the brine was determined by the combination of ion chromatography, inductively coupled plasma optical emission spectrometry (ICP-OES), pH and conductivity measurements, both before and after the experiment. Similarly, the whole rock chemical composition was also measured twice (before and after SC CO2 exposure) by XRF. These studies were developed in the facilities of the IGME and the University of Oviedo (UNIOVI). The mineral composition of the initial rock sample used in this study was determined from the XRF analyses performed at the IGME laboratory. To do so, we used Excel solver in order to determine the optimal mineral composition corresponding to the XRF analyses and the rock description. This mineral composition as well as the injected water solution were used as input for the mass balance calculation and the numerical modelling.
The geochemical modelling was performed using the CrunchFlow code [39]. The CrunchFlow code solves numerically the mass balance of solutes solving the reactive transport equation. This code has been validated by several studies focused on CO2 storage [40,41,42,43]. The total reaction rate Ri is given by (1):
where Rm is the rate of precipitation (Rm > 0) or dissolution (Rm < 0) of mineral m in mol m−3 rock s−1 , and νim is the number of the moles of i in mineral m. The reaction rate laws used in the calculations are of the form (2):
where Am is the mineral surface area in m2 m−3 rock, km,T is the kinetic rate in mol m−2 s−1, is the term describing the effect of pH on the rate, is the term describing a catalytic/inhibitory effect on the rate by other species, ∆Gr is the Gibbs free energy of the reaction (J mol−1), IAP is the ionic activity product of the solution with respect to the mineral, Keq is the equilibrium constant for that mineral reaction (ionic activity product at equilibrium) and m1 and m2 exponents allow for nonlinear dependencies on the affinity term and are normally taken from experimental studies. The summation term indicates that several parallel rate laws may be used to describe the dependence of the rate on pH or on other species. The kinetic rate at temperature T (K) is calculated from (3):
where km,25 is the kinetic rate at 25 °C, Ea is the apparent activation energy of the overall reaction (J mol−1) and R is the gas constant (J mol−1 K−1). Change in mineral surface area Am (m2 mineral m−3 rock) is calculated assuming that area is proportional to the volume fraction of the mineral to the power 2/3.
The numerical model developed to reproduce the experimental conditions (“batch” simulation) considered (a) the mineralogical composition of the rock according to the measured values by XRF and (b) the rate laws for the reacting minerals showed in the literature [44,45,46,47].
The best fit of the model to the experimental data (aqueous Ca, S, Mg, K, Si, Al concentrations) was performed by adjusting the values of the effective reactive surface areas of each mineral, which is a parameter that is highly difficult to evaluate and was treated here as a simple dummy fitting parameter to account for unmodelled mass transfer processes. Regarding the secondary minerals, the value of the initial surface area was set to 1000 m2/m3 for initiating the precipitation.
Preliminary simulations were done for determining the secondary minerals that are effectively precipitating among those given in the thermodynamic data base. The water inlet in the model is the same as the one used in the laboratory experiment. The calculated initial pH is 3.32. All the equilibrium constants (log K at 25, 40 and 60 °C) and stoichiometric coefficients were taken from the EQ3/6 database [48]. Activity coefficients were calculated using the extended Debye-Hückel formulation (b-dot model) with parameters listed in the database. The equilibrium constants for the mineral reactions were also taken from the EQ3/6 database.
4. Results
4.1. Petrographic and Chemical Characterization of Carbonate Rocks before SC CO2 Injection
The Puerto de Palombera Formation mainly consists of a heterogeneous, recrystallized carbonate breccia that presents a high percentage of macroporosity (≈30%) in surface outcrops due to the dissolution of evaporate minerals. The partial recrystallization resulted in a matrix of highly varying grain size from micrite up to crystals of 200 μm. The angular-subangular clasts are composed of sparite and could be intra-, extra- or bioclasts. Their size varies between 0.1 mm and >2 mm (Figure 3a). The high calcite/dolomite ratio and the textural features suggest a dolomitization, followed by a posterior de-dolomitization process (Figure 3b). Calcite filled veins and pores are frequently observed and open fractures and intercrystalline porosity affect both fragments and matrix (Figure 3c). Geode type open pores are also present (Figure 3d). The optical porosity measured by optical image analysis (OIA) on thin sections is ≈4.1 ± 0.15% and the average pore size is (≈20 um).
The major element composition of the samples before CO2 exposure was determined by XRF (Table 1 Rock before CO2 column). Table 1 shows the values in weight % and their uncertainty range.
The optimal mineral composition corresponding to the XRF analyses and the rock description was obtained applying numerical correction. The initial mineral composition of the studied rock was 92.8 wt % calcite, 4.49 wt % dolomite, 1.33 wt % quartz, 1.21 wt % illite, 0.17 wt % pyrite and some trace of gypsum.
4.2. Petrographic and Chemical Characterization of Carbonate Rocks after SC CO2 Injection
4.2.1. Dry SC CO2
On the thin section scale, no changes (either dissolution or precipitation) could be detected by OpM and OIA on the carbonate samples after their exposure to dry CO2. The optical properties of the rock forming minerals did not present any kind of alteration, neither was the value of the optical porosity modified by the experiment. We can confirm thus that, at least at the scale of the microscopic observations, the mineralogical and textural configuration of the rock remained intact and none of the possible processes (e.g., pore filling by precipitations, increased surface roughness by dissolution, recrystallization, etc.) took place. Observations carried out with SEM also showed a lack of evidence of dissolution or precipitation of the main mineral components. The Cal/Dol ratio remained the same as in the original samples and the qualitative assessment of the calcite and dolomite grain morphology did not show any evident shape changes provoked by the CO2 exposure. The analysis of the chemical composition of samples after dry CO2 exposure (Table 1 “Rock after dry CO2” column) provided values within the uncertainty ranges of the original values, which again confirms the non-existence of reactions between the rock forming minerals and the dry SC CO2.
4.2.2. SC CO2 Rich-Brine
The composition of the brine was analysed using a combination of techniques before the experiment (Table 2 “Pure Brine” column). The brine that was used in the experiment was recovered immediately after the end of the test for a comparative chemical analysis. The results are given in Table 2 (“Brine post-test” column). The comparative analysis revealed chemical changes that surpass the uncertainty range of the applied methods. The Mg2+, Ca2+, HCO3−, NO3−, SiO2 and conductivity values increased significantly, while the pH decreased. The rest of the analysed parameters (Na+, K+, SO42−, Cl−, CO3) do not present significant alterations.
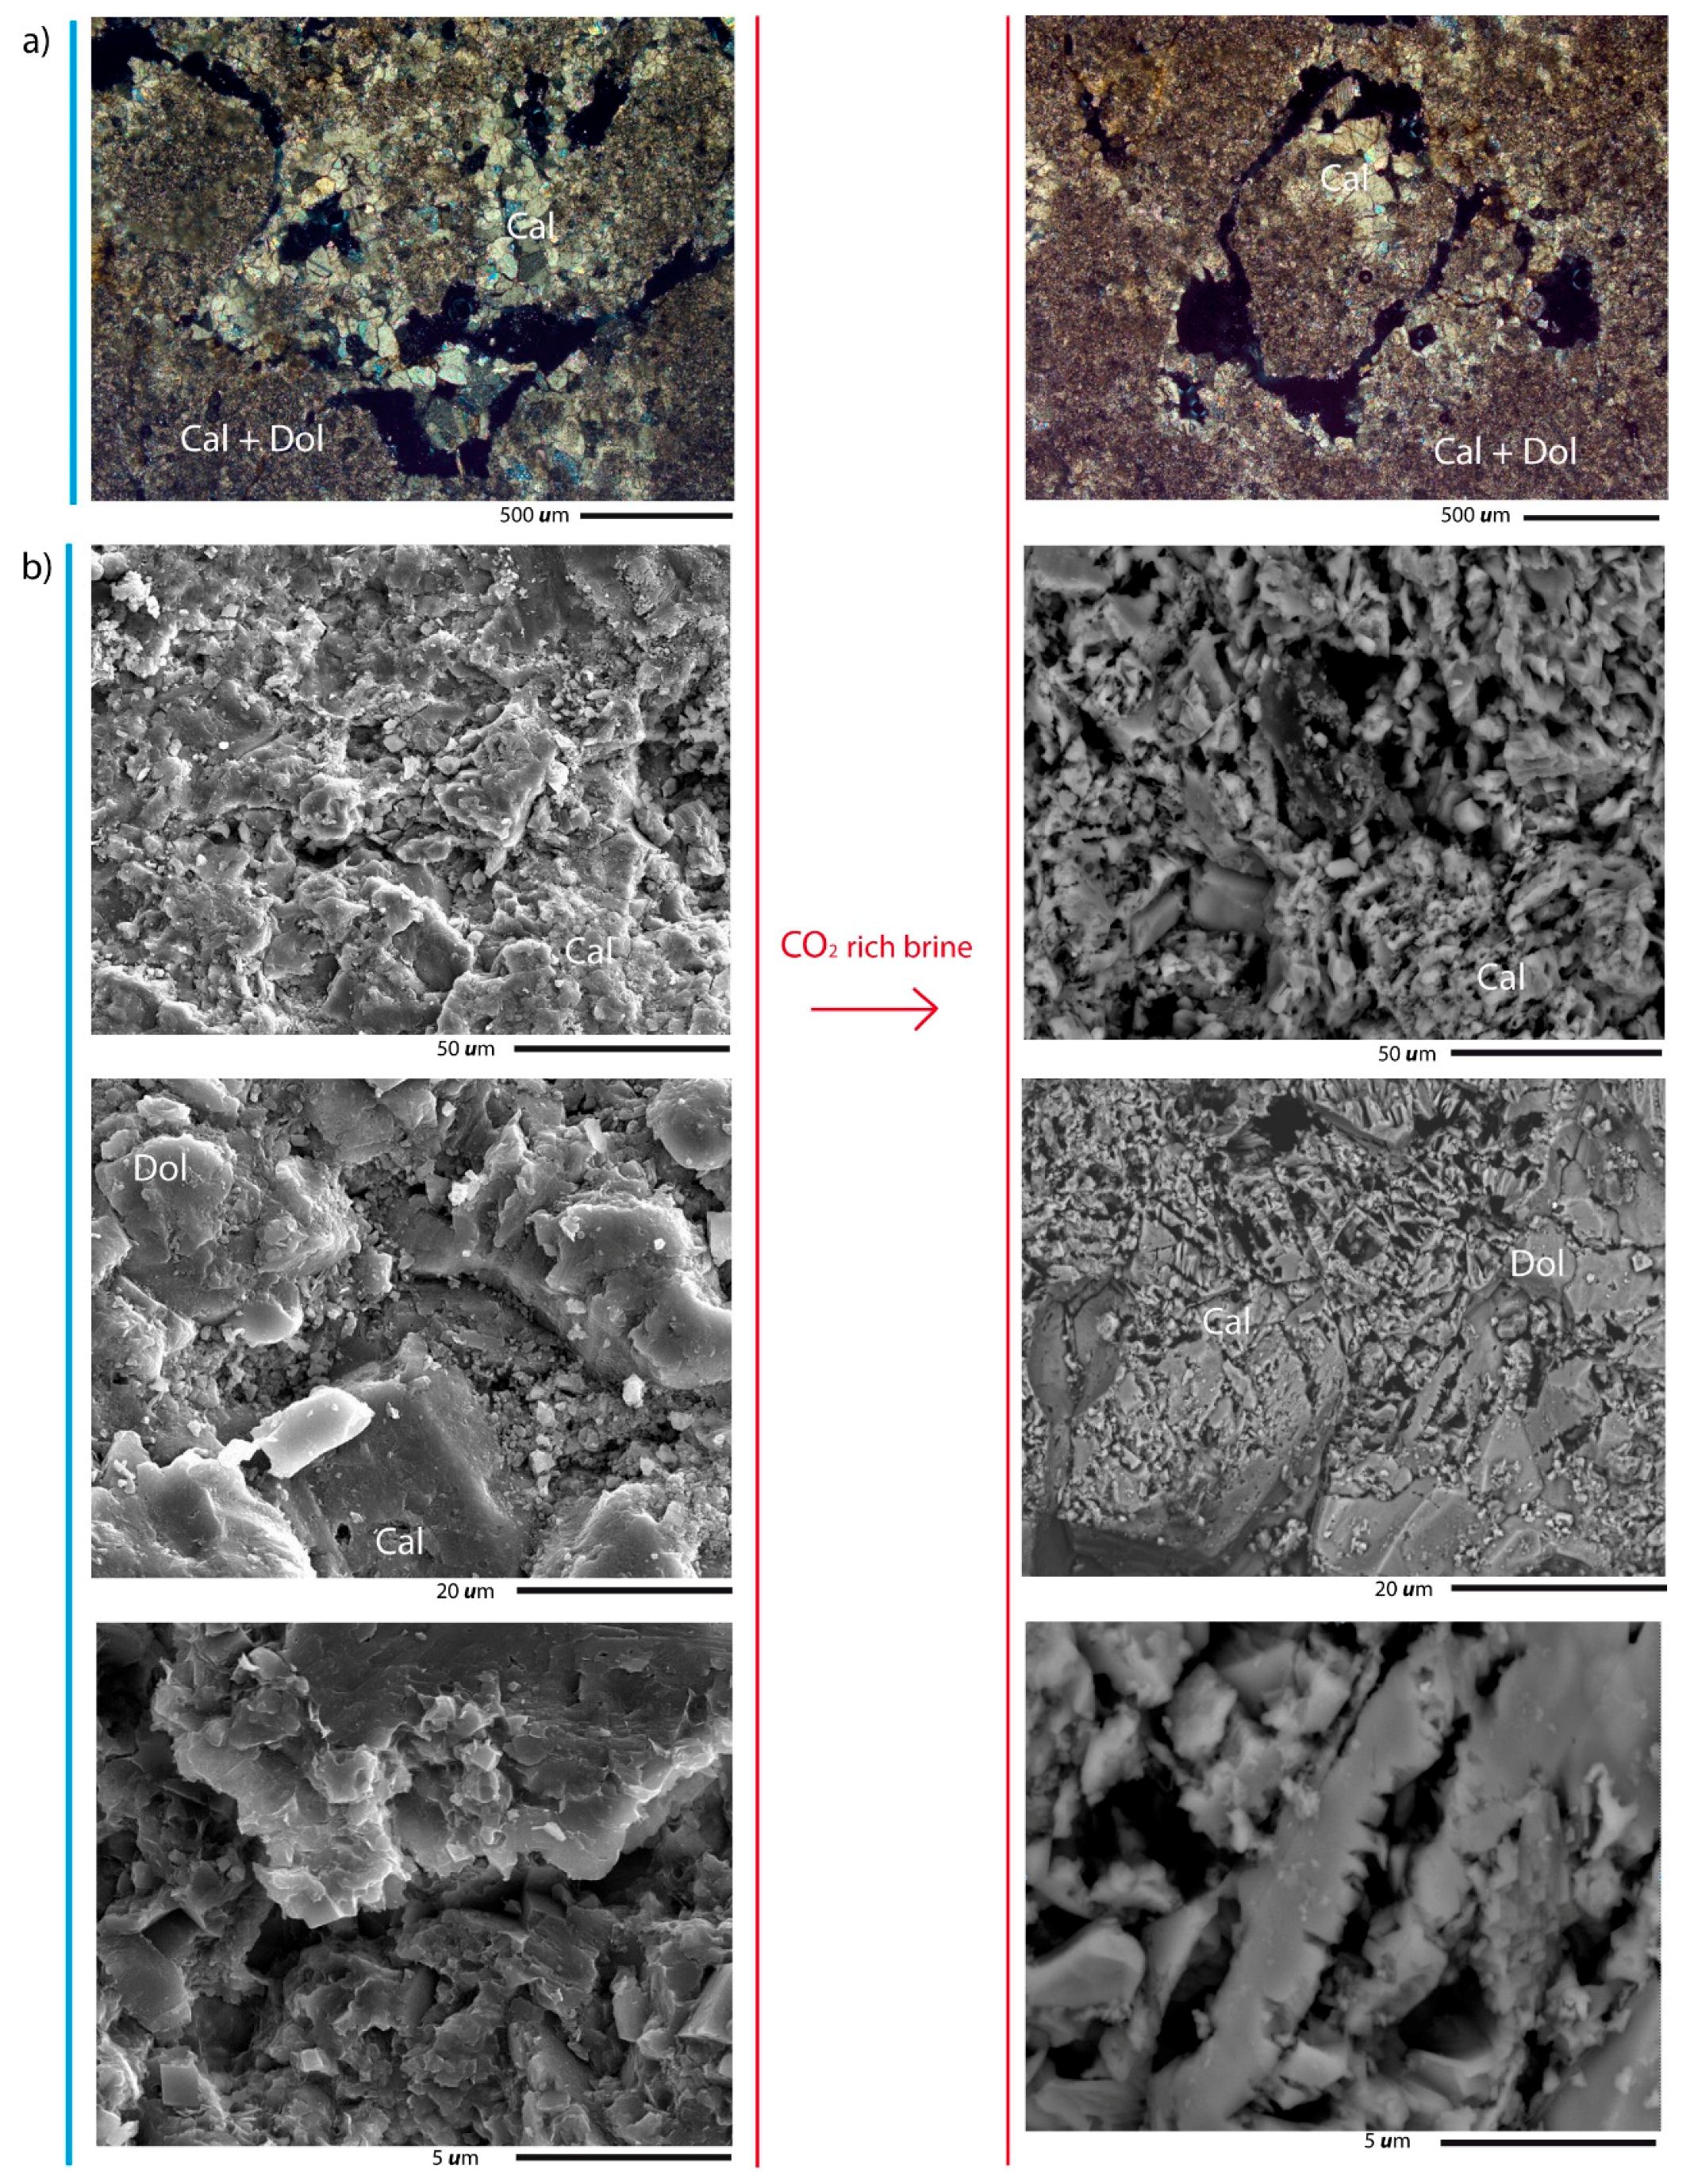
The optical observations carried out by OpM and SEM (Figure 4) demonstrate obvious changes in the calcite mineral grains as compared to the natural sample. In particular, dissolution textures can be observed including (i) the apparition of secondary pores on the surface of calcite minerals and (ii) a relatively rough surface after CO2-brine-rock interaction (Figure 4b). Quantification of the optical pore parameters by OIA revealed an increase in number of pores (12.26%) and in total pore area (4.12% to 4.44%) due to the formation of new pores and the increase in size of the existing ones. Pore morphology was also affected as shown by the increased aspect ratio and the decrease in the roundness parameter (Table 3). The XRF analysis however did not reveal significant changes in the whole rock composition after the experiment (Table 1 “Rock after CO2 and brine” column).
4.3. Mass Balance Calculation and Numerical Modelling
The mass balance calculation indicates dissolution of calcite, dolomite, quartz and pyrite and precipitation of illite and gypsum. The total amount of dissolved and precipitated minerals as well as the final mineral composition is presented in Table 4.
The mass balance has been done assuming that changes of Mg concentration in the fluid are due to dolomite dissolution only and no Mg-rich mineral precipitated. The mass of dissolved pyrite is calculated using the Fe concentration and the gypsum amount is evaluated by sulphate concentration changes after the pyrite calculation. Quartz dissolution is calculated using the Si concentration changes while the amount of illite is evaluated using the amount of K concentration. No precipitations of other clay minerals such as kaolinite are considered here, even if in other recent studies kaolinite precipitation has been considered the most favourable secondary alteration mineral [49,50,51]. Here, we stipulate that without alumino-silicate in the initial rock sample such as albite or microcline, kaolinite precipitation is not expected. Moreover, illite is initially identified in the rock sample composition which can accelerate the nucleation step.
Regarding the results of the numerical modelling, we can observe in Table 4 that the simulated results are similar to those obtained by the mass balance calculation. The main reaction is calcite dissolution even if the saturation index for calcite was not as low as for dolomite (Figure 5). This difference is explained by the calcite dissolution rate (kinetics and reactive surface area). Illite precipitation is also predicted by the model as calculated from the mass balance. Actually, the saturation index for illite remains quite high at the end of the simulation indicated that equilibrium is not yet reached and more illite precipitation may occur. In the simulation results, we can observe that calcite and gypsum have reached equilibrium at the end of the experiment, while dolomite is still under-saturated with respect to the fluid. The secondary minerals that were finally used in the calculations are given in Table 4 and are in agreement with the ones supposed for the mass balance calculation. The kinetics data presented in Table 4 and used in this study are in agreement with other studies performed in similar temperature and pressure conditions [27,43,50,51,52].
5. Discussion
SC CO2 injection into a carbonate reservoir rock was studied experimentally in two distinct situations. The dry experiment did not produce any changes that could be detected by the applied methodology. This is in agreement with the preliminary expectations based on theoretical models and results of similar experiments [3,20,24]. The absence of available pore water precludes the development of a low pH environment and the consequent carbonate dissolution; while other processes possibly provoked by dry CO2 injection, such as drying of clay minerals or particle movement, were not expected in this case due to the high carbonate content of the rock and the static nature of the experimental setup. Dry or almost dry conditions are possible to evolve in near-well situations where the injected CO2 displaces most of the pore water and the high CO2-brine ratio results in the dissolution of the remaining (e.g., capillary) water [7]. Under these conditions the chemical reactions are not really relevant and any changes induced in the pore configuration will be due to other processes.
On the other hand, with increasing distance from the injection point, the amount of pore water increases [7] and the chemical reactivity of the system becomes a dominant factor. Our experiment modelling water saturated conditions produced obvious chemical and physical changes in the reservoir rock.
According to [17,53], CO2 dissolution in the brine plays a crucial role in various storage processes (i.e., solubility trapping and mineral trapping). This dissolution produces carbonic acid (Equation (4)), which, in its turn, reacts with the highly soluble carbonates following the equations described by [54] (Equations (5)–(7)).
CO2 + H2O → H2CO3 → H+ + HCO3−
CaCO3 + H+ → Ca2+ + HCO3−
CaCO3 + H2CO3 → Ca2++ 2HCO3−
CaCO3 + H2O → Ca2+ + HCO3− + OH−
Therefore, calcite dissolution is usually expected under these acidic conditions. Nevertheless, the analysis of whole rock composition by XRF (Table 1) did not indicate any dissolution or precipitation reactions in this case. This is probably due to the sample scale of the analysis. The dissolution effects are expected to be rather superficial while for the XRF measurement a 27 cm3 block was used. The total amount of dissolved minerals is 271.5 mm3 (Table 4), which is 0.25% of the initial volume of rock (4 blocks of 27 cm3). This quantity is very low and validates the results of the XRF acquired on the full rock blocks. Moreover, the high value of CaO in the rock composition also entails a high uncertainty range (~3.5%), which makes it difficult to evince small changes in the calcite composition by this technique. Nevertheless, the dissolution reactions are probably localized at the block surfaces.
On the other hand, the changes of water composition clearly indicate dissolution reactions (see Table 2). The obtained data demonstrates the chemical instability of calcite and the relative stability of dolomite. Comparative studies on dissolution rates of different carbonates under similar conditions has shown higher dissolution rates for calcite and higher quantities of dissolved Ca2+ than Mg2+ in dolomites [55,56], which is in agreement with our findings.
Additionally, physical changes were observed in the pore network configuration by microscopic techniques including an increase in porosity and changes in pore morphology (Figure 4). Dissolution surfaces and newly formed pores were observed on calcite grains but not on dolomite, although the scarcity of dolomite crystals in the rock makes it difficult to carry out thorough observations. The quantification of pore parameters (optical porosity, aspect, roundness) by means of OIA did not reveal highly significant changes. It is important to point out, however, that while the qualitative observations were conducted both at thin section (OpM) and SEM scales, the quantification was only carried out on thin sections. Evidences of dissolution processes were mostly found by SEM observations so the measurements carried out by OpM clearly provide lower values of porosity and pore morphology changes than the reality. The obtained values should be considered keeping in mind this deviation.
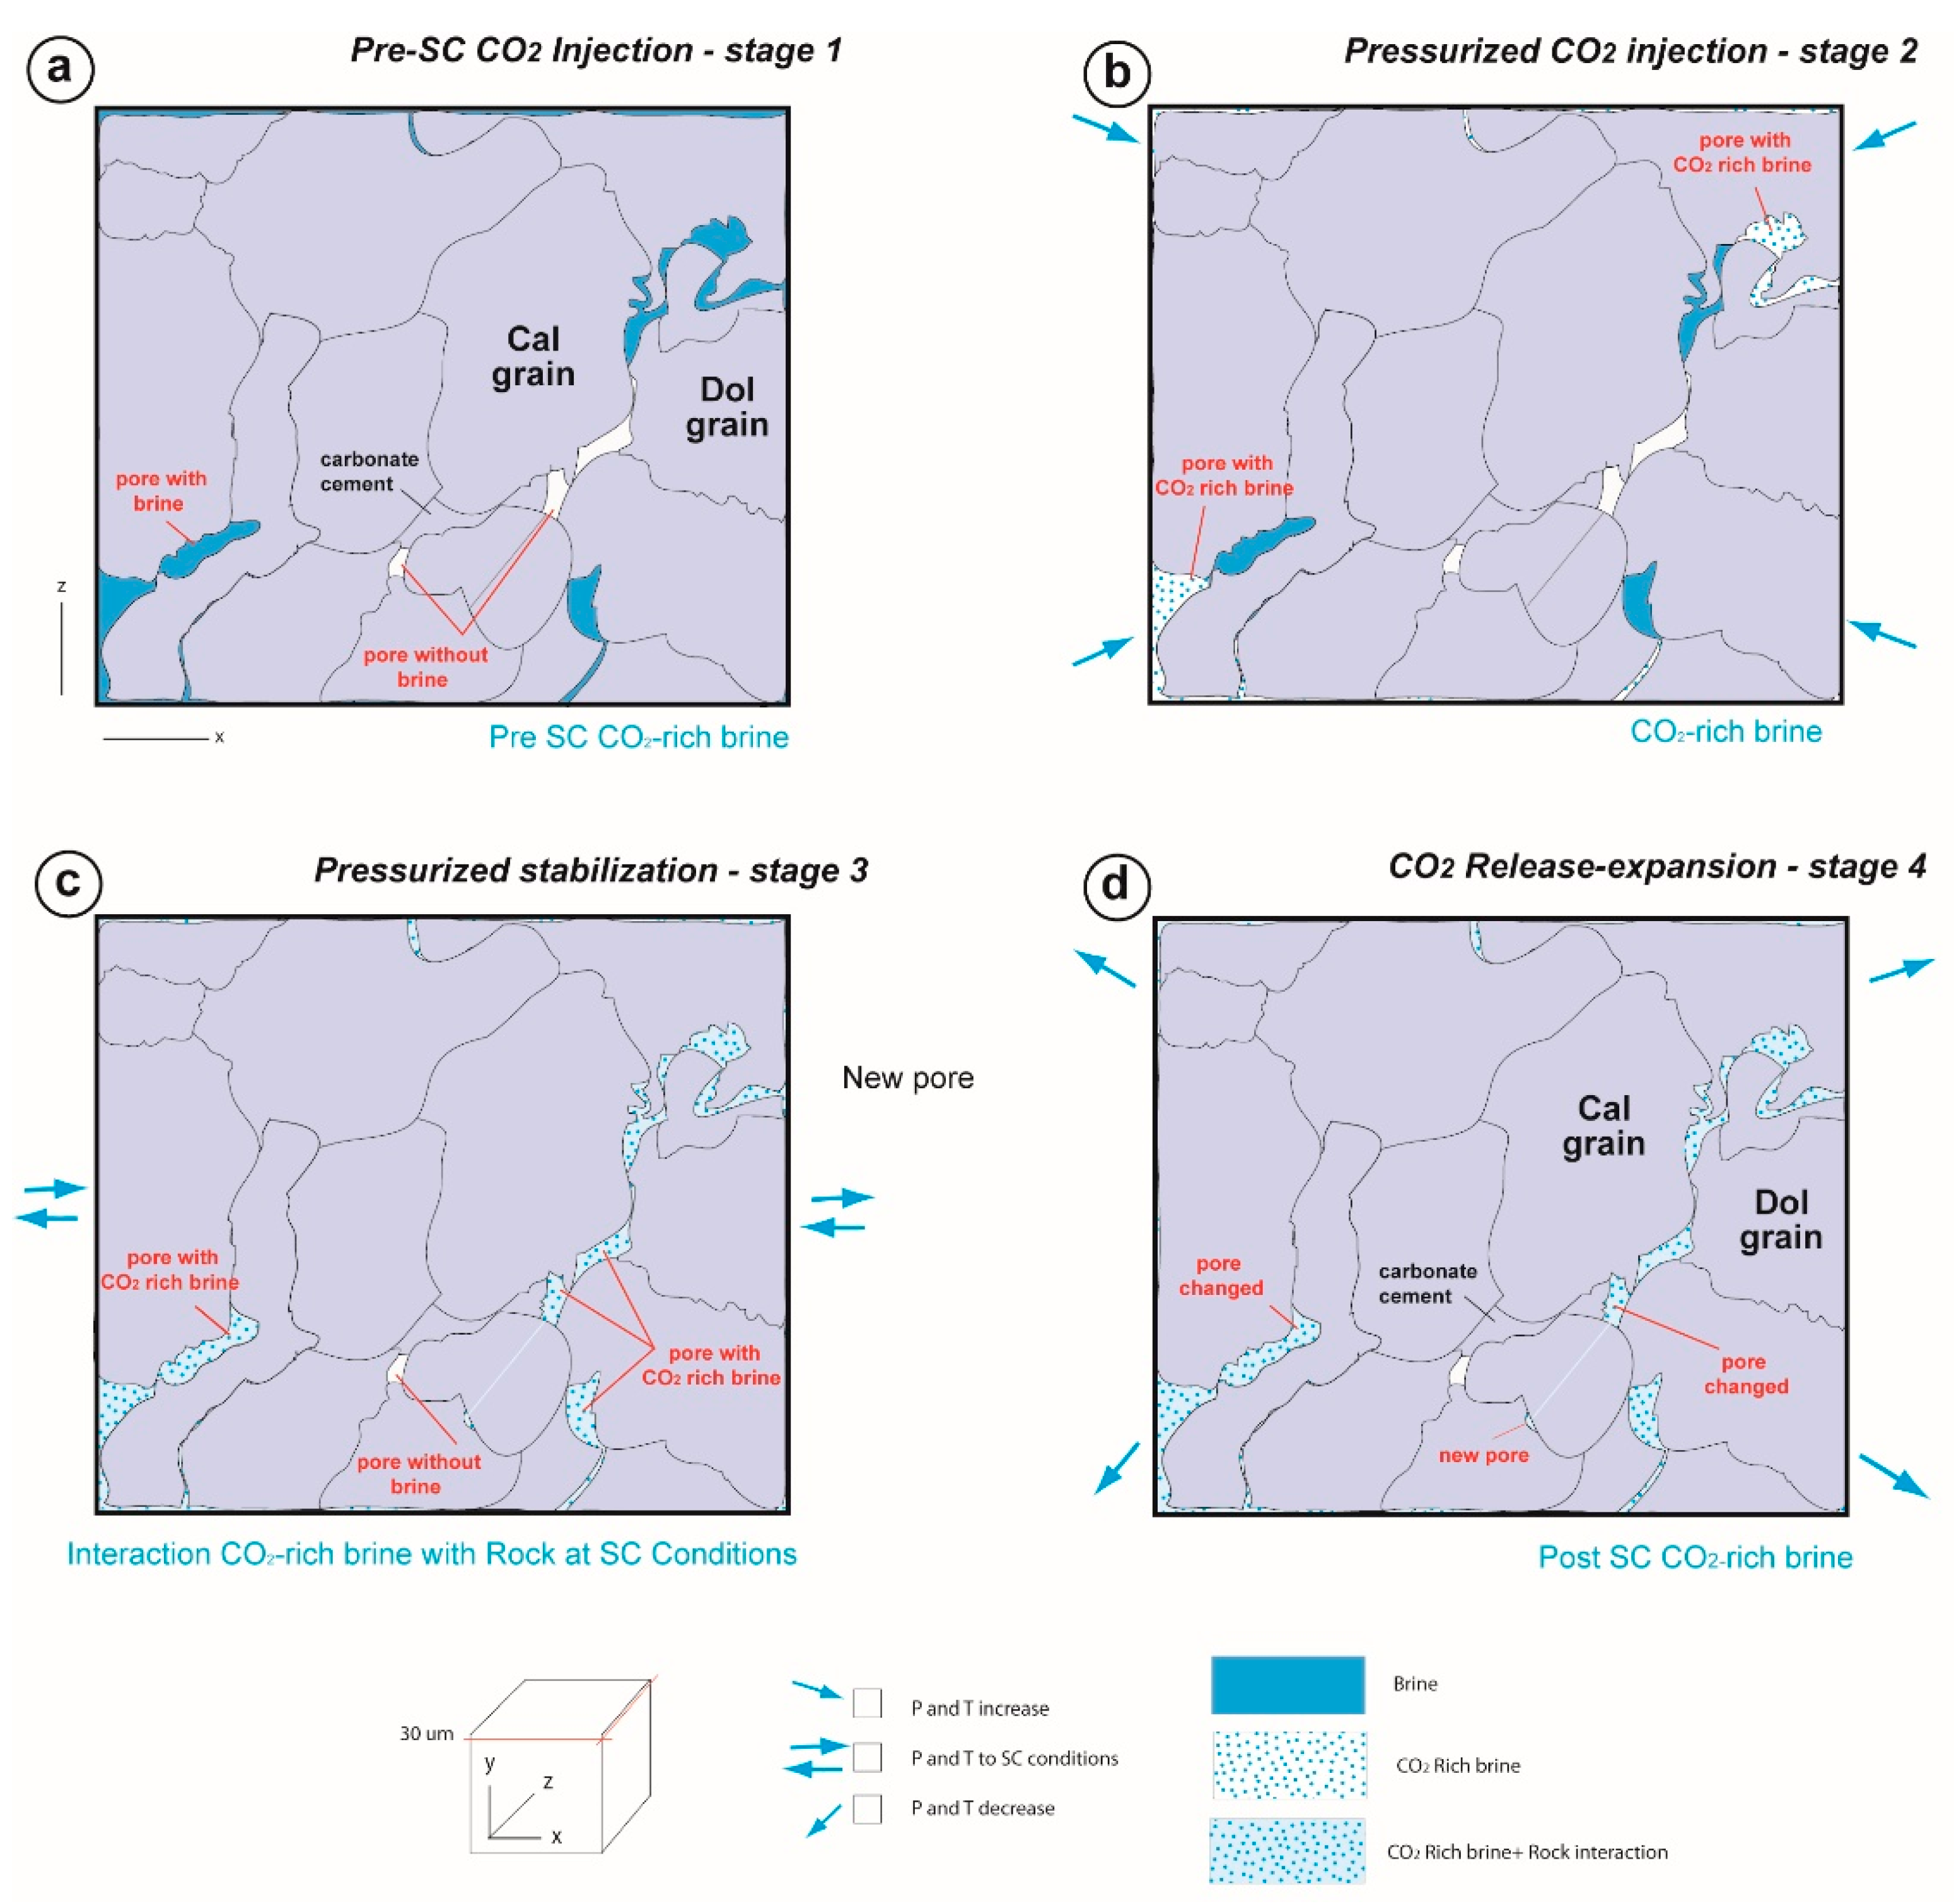
The described changes could be illustrated by the following simplified conceptual model (Figure 6a–d). The CO2-rich brine reacts with the sample producing chemical and physical changes on the external surface of the carbonate blocks. These effects are a result of partial carbonate dissolution affecting calcite grains and carbonate cement.
In order to validate the obtained results and the conceptual model, mass balance calculation and numerical modelling was applied. Using the initial mineral composition of the rock sample determined by the XRF measurement and the water chemistry, we evaluated the quantity of dissolved and precipitated minerals and identified the dissolution and precipitation reactions that occurred during the 970 h of CO2 rich water exposure. The numerical results are in agreement with the XRF data and water chemistry analysis. Both indicate calcite and dolomite dissolution coupled with secondary gypsum and illite precipitation.
The described study is limited to two specific situations within the extremely complex system of CO2 storage in geological structures. The time and space scales, the variability of conditions and the number of components of a laboratory experiment are very far from the real-life conditions. The discussed reactions may trigger a whole set of additional processes including the precipitation of new mineral phases due to the increased ion concentration of the brine [25,57], the adjustments in brine mobility due to changes in the capillary network [21] or the alteration of mechanical properties of the rock provoked by the changes in the pore network [58,59], to name just a few. Nevertheless, our results provide some insight into the physico-chemical processes that may play a role in a CO2 reservoir. It is important to take into account that the results obtained in this research must be interpreted within the context and scale of the described work (i.e., laboratory test). The study of a significantly larger number of samples together with the modelling data following the presented approach would make it possible to gain a clearer view of the precipitation and dissolution processes at a larger (i.e., reservoir) scale. This would also provide important information about the potential of the study area for geological CO2 storage. Flow-through experiments might also be an alternative option to characterize the chemical reaction during CO2 injection taking into account the transport effect. Finally, numerical modelling at reservoir scale integrating these experimental results could predict the potential CO2 sequestration in this reservoir.
The real importance of the encountered mineralogical and porosity changes is in their influence on the functionality and integrity of a storage site. Slight textural changes in the reservoir or seal rock might lead to significant modifications in the storage capacity, injection rate, geomechanical resistance, confining capacity, etc. of the whole system. To study these overall processes on more realistic time and space scales, numerical modelling has been successfully applied [4,7,12,13,14,15] adjusting the models with experimental data such as those provided by this work.
Migration of fine particles induced by either chemical or physical forces has also been described in various fields of geological reservoir use. In general, the processes and the overall effect of particle migration on the hydrodynamic properties of the rock vary depending on characteristics of the rock and the circumstances. Some authors [60,61,62,63,64] have studied the importance of fine particle migration in CO2 storage and during brine disposal demonstrating its significance on flow pathways and engineered water injection. For more detailed studies, migration of fine particles should be considered.
6. Conclusions
Experimental CO2 injection into carbonates with real CO2 storage potential was used to simulate possible interactions in the rock-gas system in dry and in water saturated conditions. Both of these conditions can evolve in the vicinity of the injection well during the first phases of injection. The experiments carried out in a hyperbaric chamber provide valuable insight about the processes although they were limited to specific cases. The tests presented here (approximately 1000 h) demonstrate that in the absence of available pore water chemical reactions do not take place in the SC CO2—carbonate system. On the other hand, under water saturated conditions, significant mineralogical and physical changes were observed in the rock at thin section scale (OpM, OIA and SEM) and in the brine, even though they were not confirmed by whole rock chemical analysis. In particular, the exposure of carbonate rocks to SC CO2 rich brine under static conditions resulted in:
- (i)
- The dissolution of CO2 in the brine, which created an acidified environment (HCO3− increase in brine: 1400%; pH decrease).
- (ii)
- Calcite dissolution in the low pH brine (Ca2+ increase in brine: 290%), producing dissolution phenomena observable by microscopic techniques (OpM and SEM).
- (iii)
- Increased porosity (absolute porosity variation: 0.32%) and modified pore morphology due to the calcite dissolution (Ro decrease: 2.40%; As increase: 2.26%; and increase of pore number: 12.26%).
- (iv)
- Dolomite crystals also present in the rock were found to be less reactive than the calcite.
- (v)
- Illite and gypsum precipitation was evaluated by both mass balance calculation from the water chemistry and numerical modelling.
The laboratory experiment and numerical modelling performed in this study indicate that calcite dissolution is the main reaction. One of the most important results is that equilibrium between the fluid and calcite is reached in around 50 h. This dissolution reaction induces a slight increase of porosity which favours CO2 storage capacity. Nevertheless, in this typical rock composition, numerical modelling performed in this study indicates precipitation of clay. At the end of the simulation (almost 1000 h) the saturation index for illite is still positive which indicates that illite precipitation may continue after this period. This precipitation reaction can be an important issue in term of CO2 injectivity as previous studies have demonstrated that clay precipitation usually reduces the sample permeability [15,65].
Acknowledgments
The authors would like to thank the funding provided through the ALGECO2-IRMC Project (Instituto Geológico y Minero de España: 2294-2013), CO2-Pore Project (Plan Nacional de España: 2009-10934, FEDER-UE). Thanks are due to José Luis García Lobón, Roberto Martínez Orio and Pilar Mata for providing help in sample collection and application of SEM techniques. We also would like to thank the editorial office for the editorial handling and two anonymous reviewers for their constructive comments and corrections.
Author Contributions
Edgar Berrezueta collected the rock samples, studied hand samples and completed the geological setting of area studied; Edgar Berrezueta and Timea Kovacs conceived, designed and performed the experiments by Optical microscopy, SEM, Optical image analysis and XRF analysis; Linda Luquot contributed analysis tools, analysed the data of XRF measures and performed numerical modelling; all authors wrote the paper and participated in discussion and conclusion of this research article.
Conflicts of Interest
The authors declare no conflict of interest.
Abbreviations
The following abbreviations are used in this manuscript:
| SC | Supercritical Conditions |
| OpM | Optical Microscopy |
| SEM | Scanning Electron Microscopy |
| OIA | Optical Image Analysis |
| XRF | X-ray fluorescence |
| IGME | Geological Survey of Spain |
| UNIOVI | University of Oviedo |
| ICP-EOS | Inductively coupled plasma optical emission spectrometry |
| Cal | Calcite |
| Dol | Dolomite |
References
- Bachu, S. Sequestration of CO2 in geological media: Criteria and approach for site selection in response to climate change. Energy Convers. Manag. 2000, 41, 953–970. [Google Scholar] [CrossRef]
- Benson, S.M.; Cole, D.R. CO2 sequestration in deep sedimentary formations. Elements 2008, 4, 325–331. [Google Scholar] [CrossRef]
- Gaus, I. Role and impact of CO2-rock interactions during CO2 storage in sedimentary rocks. Int. J. Greenh. Gas Control 2010, 4, 73–89. [Google Scholar] [CrossRef]
- Izgec, O.; Demiral, B.; Bertin, H.J.; Akin, S. CO2 injection into saline carbonate aquifer formations I: Laboratory investigation. Transp. Porous Media 2008, 72, 1–24. [Google Scholar] [CrossRef]
- Bacci, G.; Korr, A.; Durucan, S. Experimental investigation into salt precipitation during CO2 injection in saline aquifers. Energy Procedia 2011, 4, 4450–4456. [Google Scholar] [CrossRef]
- Intergovernmental Panel on Climate Change (IPCC). Carbon Dioxide Capture and Storage. In IPCC 2005; Metz, B., Davidson, O., de Coninck, H.C., Loos, M., Meyer, L.A., Eds.; Cambridge University Press: Cambridge, UK; New York, NY, USA, 2005; p. 442. [Google Scholar]
- André, L.; Audigane, P.; Azaroual, M.; Menjoz, A. Numerical modelling of fluid-rock chemical interactions at the supercritical CO2-liquid interface during CO2 injection into a carbonate reservoir, the Dogger aquifer (Paris Basin, France). Energy Convers. Manag. 2007, 48, 1782–1797. [Google Scholar] [CrossRef]
- Ross, G.D.; Todd, A.C.; Tweedie, J.A.; Will, A.G.S. The Dissolution effects of CO2-brine systems on the permeability of UK and North Sea calcareous sandstones. Presented at the SPE/DOE Symposium on Enhanced Oil Recovery, Tulsa, OK, USA, 4–7 April 1982. [Google Scholar]
- Saeedi, A.; Rezaee, R.; Evans, B.; Clennell, B. Multiphase flow behaviour during CO2 geo-sequestration: Emphasis on the effect of cyclic CO2-brine flooding. J. Petrol. Sci. Eng. 2011, 79, 65–85. [Google Scholar] [CrossRef]
- Sayegh, S.G.; Krause, F.F.; Girard, M.; DeBree, C. Rock/fluid interactions of carbonated brines in a sandstone reservoir: Pembina Cardium, Alberta, Canada. SPE Form. Eval. 1990, 5, 399–405. [Google Scholar] [CrossRef]
- Garcia-Rios, M.; Luquot, L.; Soler, J.M.; Cama, J. Influence of the flow rate on dissolution and precipitation features during percolation of CO2 rich sulphate solutions through fractured limestone samples. Chem. Geol. 2015, 414, 95–108. [Google Scholar] [CrossRef]
- Egermann, P.; Bazin, B.; Vizika, O. An experimental investigation of reaction-transport phenomena during CO2 injection. In Proceedings of the SPE Middle East Oil and Gas Show and Conference, Manama, Bahrain, 12–15 March 2005. [Google Scholar]
- Gunter, W.D.; Bachu, S.; Benson, S. The Role of Hydrogeological and Geochemical Trapping in Sedimentary Basins for Secure Geological Storage of Carbon Dioxide. In Geological Storage of Carbon Dioxide; Special Publication; Baines, S.J., Worden, R.H., Eds.; Geological Society: London, UK, 2004; Volume 233, pp. 129–145. [Google Scholar]
- Izgec, Ö.; Demiral, B.; Bertin, H.; Akın, S. Experimental and numerical investigation of carbon sequestration in deep saline aquifers. In Proceedings of the SPE/EPA/DOE Exploration and Production Environmental Conference, Galveston, TX, USA, 7–9 March 2005. [Google Scholar]
- Luquot, L.; Gouze, P. Experimental determination of porosity and permeability changes induced by injection of CO2 into carbonate Rocks. Chem. Geol. 2009, 265, 148–159. [Google Scholar] [CrossRef]
- Cailly, B.; Le Thiez, P.; Egermann, P.; Audibert, A.; Vidal-Gilbert, S.; Longaygue, X. Geological storage of CO2: A state of the art of injection processes and technologies. Oil Gas Sci. Technol. 2005, 60, 517–525. [Google Scholar] [CrossRef]
- Kaszuba, J.P.; Janecky, D.R.; Snow, M.G. Carbon dioxide reaction processes in a model brine aquifer at 200 °C and 200 bars: Implications for geologic sequestration of carbon. Appl. Geochem. 2003, 18, 1065–1080. [Google Scholar] [CrossRef]
- Kaszuba, J.P.; Janecky, D.R.; Snow, M.G. Experimental evaluation of mixed fluid reactions between supercritical carbon dioxide and NaCl brine: Relevance to the integrity of a geologic carbon repository. Chem. Geol. 2005, 217, 277–293. [Google Scholar] [CrossRef]
- Mito, S.; Xue, Z.; Ohsumi Mito, S.; Xue, Z.; Ohsumi, T. Case study of geochemical reactions at the Nagaoka CO2 injection site, Japan. Int. J. Greenh. Gas Control 2008, 2, 309–318. [Google Scholar] [CrossRef]
- Sterpenich, J.; Sausse, J.; Pironon, J.; Géhin, A.; Hubert, G.; Perfetti, E.; Grgic, D. Experimental ageing of oolitic limestones under CO2 storage conditions. Petrographical and chemical evidence. Chem. Geol. 2009, 265, 99–112. [Google Scholar] [CrossRef]
- Miri, R.; Hellevang, H. Salt precipitation during CO2 storage—A review. Int. J. Greenh. Gas Control 2016, 51, 136–147. [Google Scholar] [CrossRef]
- Burton, M.; Kumar, K.; Bryant, S.L. Time-dependent injectivity during CO2 storage in aquifers. In Proceedings of the SPE Symposium on Improved Oil Recovery, Tulsa, OK, USA, 20–23 April 2008. [Google Scholar]
- Vickerd, M.A.; Thring, R.W.; Arocena, J.M.; Li, J.B. Changes in porosity due to acid gas injection as determined by X-ray computed tomography. J. Can. Pet. Technol. 2006, 45, 17–22. [Google Scholar] [CrossRef]
- Gaus, I.; Audigane, P.; Andre, L.; Lions, J.; Jacquement, N.; Durst, P.; Czernichowski, I.; Azaroual, M. Geochemical and solute transport modelling for CO2 storage, what to expect from it? Int. J. Greenh. Gas Control 2008, 2, 605–625. [Google Scholar] [CrossRef]
- Ketzer, J.M.; Iglesias, R.; Einloft, S.; Dullius, J.; Ligabue, R.; De Lima, V. Water-rock-CO2 interactions in saline aquifers aimed for carbon dioxide storage: Experimental and numerical modelling studies of the Rio Bonito Formation (Permian), Southern Brazil. Appl. Geochem. 2009, 24, 760–767. [Google Scholar] [CrossRef]
- Berrezueta, E.; González-Menéndez, L.; Breitner, D.; Luquot, L. Pore system changes during experimental CO2 injection into detritic rocks: Studies of potential storage rocks from some sedimentary basins of Spain. Int. J. Greenh. Gas Control 2013, 17, 411–422. [Google Scholar] [CrossRef]
- Fischer, S.; Liebscher, A.; De Lucia, M.; Hecht, L. Reactivity of sandstone and siltstone samples from the Ketzin pilot CO2 storage site-Laboratory experiments and reactive geochemical modelling. Environ. Earth Sci. 2013, 70, 3687–3708. [Google Scholar] [CrossRef]
- Tarkowski, R.; Wdowin, M. Petrophysical and mineralogical research on the influence of CO2 injection on Mesozoic reservoir and caprocks from the polish lowlands. Oil Gas Sci. Technol. 2011, 66, 137–150. [Google Scholar] [CrossRef]
- García-Lobón, J.L.; Reguera-García, M.I.; Martín-León, J.; Rey-Moral, C.; Berrezueta, E. Plan de Selección y Caracterización de Áreas y Estructuras Favorables Para el Almacenamiento Geológico de CO2 en España. Resumen Ejecutivo; Instituto Geológico y Minero de España (IGME): Madrid, Spain, 2010. [Google Scholar]
- Quesada, S.; Robles, S.; Pujalte, V. El «Jurásico Marino» del margen suroccidental de la Cuenca Vascocantábrica y su relación con la exploración de hidrocarburos. Geogaceta 1993, 13, 92–96. [Google Scholar]
- Álvarez, C. Hydrocarbons in Spain—Exploration and production. First Break 1994, 12, 43–46. [Google Scholar] [CrossRef]
- Merten, R. Petroleum exploration and production in Spain. Z. Dtsch. Ges. Geowiss. 2006, 157, 717–732. [Google Scholar] [CrossRef]
- Ambrose, T.; Carballeira, J.; López-Rico, J.; Wagner, R.H. Mapa Geológico de España E, 1:50.000, Hoja Núm. 107 (Baruelo de Santullan), Segunda Serie, Primera Edición; Instituto Geológico y Minero de España (IGME): Madrid, Spain, 1978. [Google Scholar]
- Aurell, M.; Meléndez, G.; Oloriz, F.; Bádenas, B.; Caracuel, J.E.; García-Ramos, J.C.; Gay, A.; Linares, A.; Quesada, S.; Robles, S.; et al. Jurassic. In The Geology of Spain, 1st ed.; Gibbons, W., Moreno, T., Eds.; Geological Society: London, UK, 2002; pp. 213–253. [Google Scholar]
- Quesada, S.; Robles, S.; Pujalte, V. Depositional architecture and transgressive regressive cycles within Liassic backstepping carbonate ramps in the Basque-Cantabrian basin, Northern Spain. J. Geol. Soc. Lond. 2005, 162, 531–548. [Google Scholar] [CrossRef]
- Robles, S.; Aramburu, A.; Apraiz, A. The Basque-Cantabrian basin: Birth and tectonosedimentary evolution. Enseñanza de las Ciencias de la Tierra 2014, 22.2, 99–114. [Google Scholar]
- Alcalde, L.; Martí, D.; Juhlin, C.; Malehmir, A.; Sopher Saura, E.; Marzán, I.; Ayarza, P.; Calahorrano, A.; Perez-Estaún, A.; Carbonell, R. 3-D reflection seismic imaging of the Hontomín structure in the Basque–Cantabrian Basin (Spain). Solid Earth 2013, 4, 481–496. [Google Scholar] [CrossRef] [Green Version]
- Ogaya, X.; Ledo, J.; Queralt, P.; Marcuello, A.; Quintà, A. First geoelectrical image of the subsurface of the Hontomín site (Spain) for CO2 geological storage: A magnetotelluric 2D characterization. Int. J. Greenh. Gas Control 2013, 13, 168–179. [Google Scholar] [CrossRef]
- Steefel, C.I.; Appelo, C.A.J.; Arora, B.; Jacques, D.; Kalbacher, T.; Kolditz, O.; Lagneau, V.; Lichner, P.C.; Mayer, K.U.; Meeussen, J.C.L.; et al. Reactive transport codes for subsurface environmental simulation. Comput. Geosci. 2015, 19, 445–478. [Google Scholar] [CrossRef]
- Davila, G.; Cama, J.; Luquoy, L.; Soler, J.; Ayora, C. Experimental and modelling study of the interaction between a crushed marl caprock and CO2-rich solutions under different pressure and temperature conditions. Chem. Geol. 2016. [Google Scholar] [CrossRef]
- Deng, H.; Molins, S.; Steefel, C.; Depaolo, D.; Voltolini, M.; Yang, L.; Ajo-Franklin, J. A 2.5D reactive transport model for fracture alteration simulation. Environ. Sci. Technol. 2016, 50, 7564. [Google Scholar] [CrossRef] [PubMed]
- Garcia-Rios, M.; Luquot, L.; Soler, J.M.; Cama, J. The role of mineral heterogeneity on the hydrogeochemical response of two fractured reservoir rocks in contact with dissolved CO2. Appl. Geochem. 2017, 84, 202–217. [Google Scholar] [CrossRef]
- Luquot, L.; Gouze, P.; Niemi, A.; Bensabat, J.; Carrera, J. CO2-rich brine percolation experiments through Heletz reservoir rock samples (Israel): Role of the flow rate and brine composition. Int. J. Greenh. Gas Control 2016, 48, 44–58. [Google Scholar] [CrossRef]
- Bibi, I.; Singh, B.; Silvester, E. Dissolution of illite in saline acidic solutions at 25 °C. Geochim. Cosmochim. Acta 2011, 75, 3237–3249. [Google Scholar] [CrossRef]
- Domènech, C.; Ayora, C.; De Pablo, J. Oxidative dissolution of pyritic sludge from the Aznalcóllar mine (SW Spain). Chem. Geol. 2002, 190, 339–353. [Google Scholar] [CrossRef]
- Nourtier-Mazauric, E.; Guy, B.; Fritz, B.; Brosse, E.; Garcia, D.; Clément, A. Modelling the Dissolution/Precipitation of Ideal Solid Solutions. Oil Gas Sci. Technol. Rev. IFP 2005, 60, 401–415. [Google Scholar] [CrossRef]
- Palandri, J.L.; Kharaha, Y.K. A Compilation of Rate Parameters of Water-Mineral Interaction Kinetics for Application to Geochemical Modelling; Open File Report 2004-1068; U.S. Geological Survey: Denver, CO, USA, 2004.
- Wolery, T.J.; Jackson, K.J.; Bourcier, W.L.; Bruton, C.J.; Viani, B.E.; Knauss, K.G.; Delany, J.M. Current status of the EQ3/6 software package for geochemical modelling. ACS Symp. Ser. 1990, 416, 104–116. [Google Scholar]
- Luquot, L.; Andreani, M.; Gouze, P.; Camps, P. CO2 percolation experiment through chlorite/zeolite-rich sandstone (Pretty Hill Formation—Otway Basin—Australia). Chem. Geol. 2012, 294–295, 75–88. [Google Scholar] [CrossRef]
- Tutolo, B.; Luhmann, A.; Kong, X.Z.; Saar, M.; Seyfried, W.E., Jr.; William, E. CO2 sequestration in feldspar-rich sandstone: Coupled evolution of fluid chemistry, mineral reaction rates, and hydrogeochemical properties. Geochim. Cosmochim. Acta 2015, 160, 132–154. [Google Scholar] [CrossRef]
- Carroll, S.; McNab, W.; Dai, Z.; Torres, S. Reactivity of Mt. Simon sandstone and the Eau Claire shale under CO2 storage conditions. Environ. Sci. Technol. 2013, 47, 252–261. [Google Scholar] [CrossRef] [PubMed]
- Zhang, L.; Soong, Y.; Dilmore, R.; Lopano, C. Numerical simulation of porosity and permeability evolution of Mount Simon sandstone under geological carbon sequestration conditions. Chem. Geol. 2015, 403, 1–12. [Google Scholar] [CrossRef]
- Gledhill, D.K.; Morse, J.W. Calcite dissolution kinetics in Na-Ca-Mg-Cl brines. Geochim. Cosmochim. Acta 2006, 70, 5802–5813. [Google Scholar] [CrossRef]
- Plummer, L.N.; Wigley, T.M.L.; Parkhurst, D.L. The kinetics of calcite dissolution in CO2-water systems at 5 degrees to 60 degrees C and 0.0 to 1.0 atm CO2. Am. J. Sci. 1978, 278, 179–216. [Google Scholar] [CrossRef]
- Pokrovsky, O.S.; Golubev, S.V.; Schott, J.; Castillo, A. Calcite, dolomite and magnesite dissolution kinetics in aqueous solutions at acid to circumneutral pH, 25 to 150 °C and 1 to 55 atm pCO2: New constraints on CO2 sequestration in sedimentary basins. Chem. Geol. 2009, 265, 20–32. [Google Scholar] [CrossRef]
- Guo, H.; Wang, Y.B.; Ni, X.M.; Tao, C.Q.; Han, W.L. Chemical kinetics of Ca/Mg elements from calcite/dolomite in carbonic acid solution. J. China Coal Soc. 2016, 41, 1806–1812. [Google Scholar]
- Gunter, W.; Wiwehar, B.; Perkins, E. Aquifer disposal of CO2-rich greenhouse gases: Extension of the time scale of experiment for CO2-sequestering reactions by geochemical modelling. Mineral. Petrol. 1997, 59, 121–140. [Google Scholar] [CrossRef]
- Hangs, S.; van der Linden, A.; Marcelis, F.; Bauer, A. The effect of CO2 on the mechanical properties of the Captain Sandstone: Geological storage of CO2 at the Goldeneye field (UK). Int. J. Greenh. Gas Control 2013, 19, 609–619. [Google Scholar] [CrossRef]
- Lyu, Q.; Gamage-Ranjith, P.; Long, X.; Ji, B. Experimental Investigation of Mechanical Properties of Black Shales after CO2-Water-Rock Interaction. Materials 2016, 9, 663. [Google Scholar] [CrossRef] [PubMed]
- Al-Shalabi, E.W.; Sepehmoori, K. A comprehensive review of low salinity/engineered water injections and their applications in sandstone and carbonate rocks. J. Pet. Sci. Eng. 2016, 139, 137–161. [Google Scholar] [CrossRef]
- Lebedev, M.; Zhang, Y.; Sarmadivaleh, M.; Barifcani, A.; Al-Khdheeawi, E.; Iglauer, S. Carbon geosequestration in limestone: Pore-scale dissolution and geomechanical weakening. Int. J. Greenh. Gas Control 2017, 66, 106–119. [Google Scholar] [CrossRef]
- Luquot, L.; Roetting, T.S.; Carrera, J. Characterization of flow parameters and evidence of pore clogging during limestone dissolution experiments. Water Resour. Res. 2014, 50, 6305–6321. [Google Scholar] [CrossRef]
- Qajar, J.; Francois, N.; Arns, C.H. Micro-Tomographic Characterization of Dissolution-Induced Local Porosity Changes Including Fines Migration in Carbonate Rock, Presented at the 2012 SPE EOR Conference at Oil and Gas West Asia(OGWA), Muscat, Oman, 16–18 April 2012; EOR: Building Towards Sustainable Growth; Society of Petroleum Engineers: London, UK, 2012; Volume 1, pp. 117–134. [Google Scholar]
- Wdowin, M.; Tarkowski, R.; Franus, W. Determination of changes in the reservoir and cap rocks of the Chabowo Anticline caused by CO2-brine-rock interactions. Int. J. Coal Geol. 2014, 130, 79–88. [Google Scholar] [CrossRef]
- Yu, Z.; Liu, L.; Yang, S.; Li, S.; Yang, Y. An experimental study of CO2–brine–rock interaction at in situ pressure—Temperature reservoir conditions. Chem. Geol. 2012, 326–327, 88–101. [Google Scholar] [CrossRef]
Figure 1.
Location of study area with basic geological information. Modified after [33].
Figure 1.
Location of study area with basic geological information. Modified after [33].

Figure 2.
Process of sampling (a) and sample preparation (b) for mineralogical and geochemical analyses before and after SC CO2 exposure (c).
Figure 2.
Process of sampling (a) and sample preparation (b) for mineralogical and geochemical analyses before and after SC CO2 exposure (c).
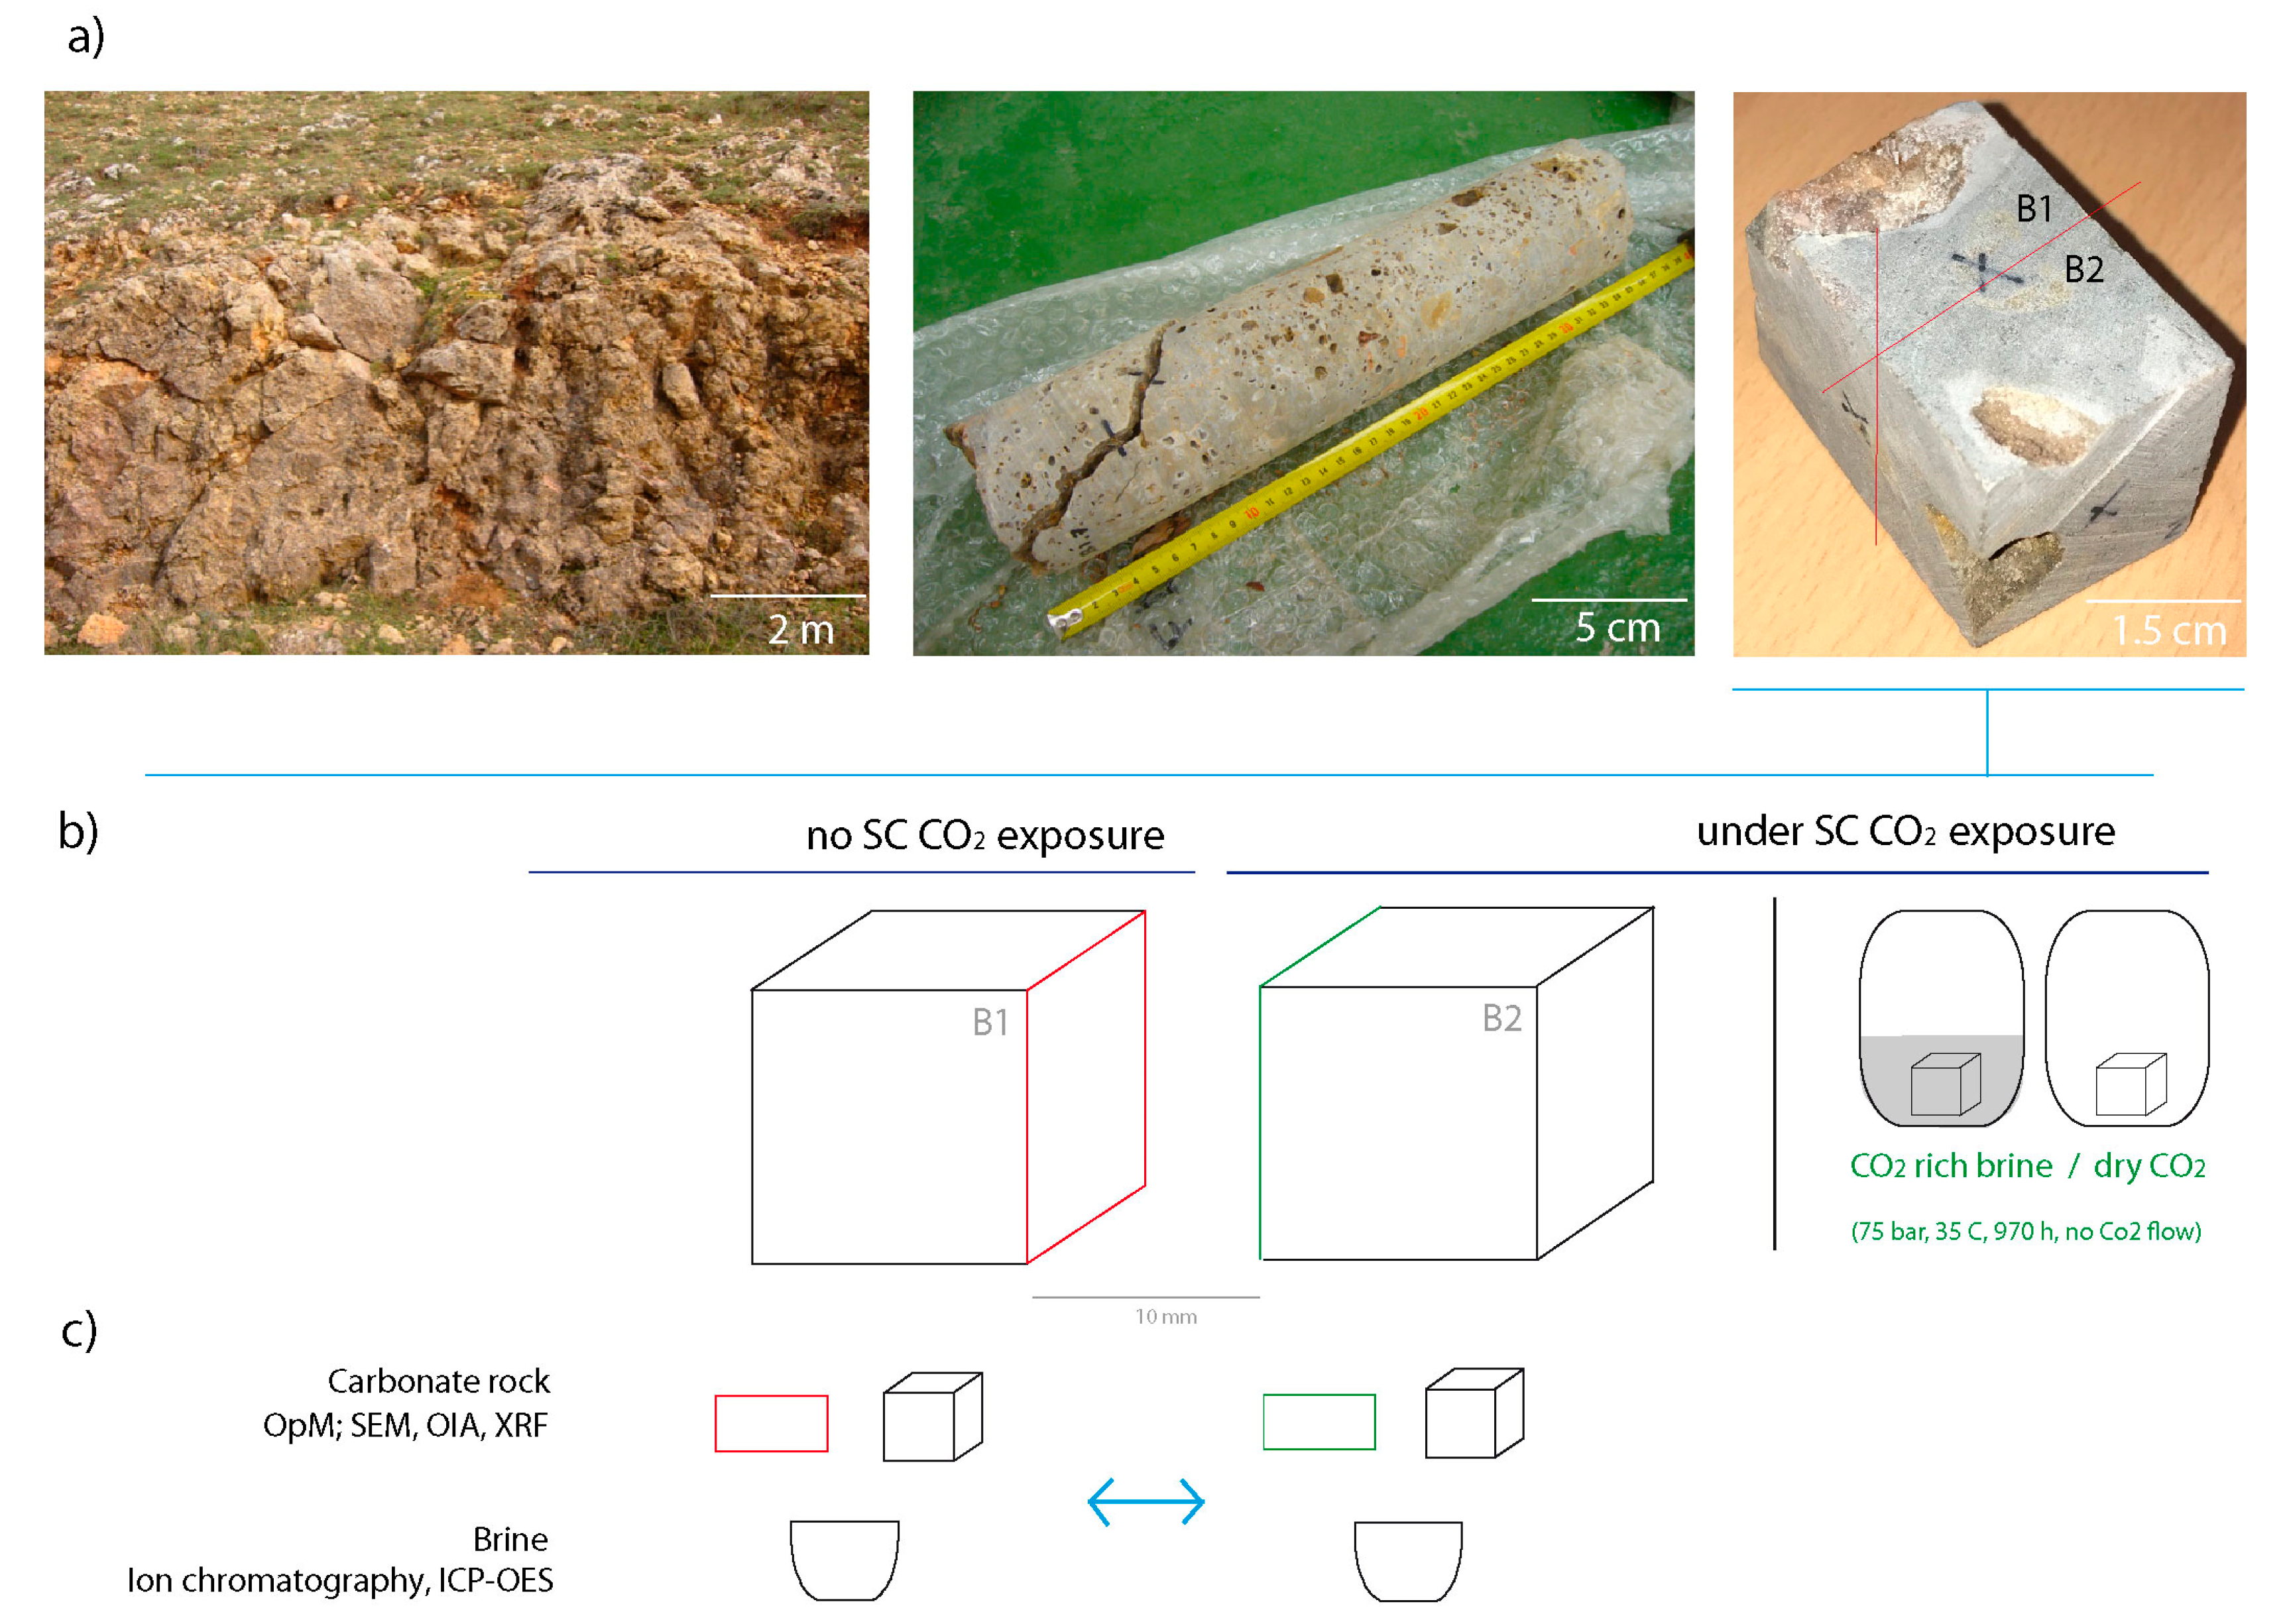
Figure 3.
Characteristic textural features of the vuggy carbonates observed by OpM (a,d) and SEM (b,c).
Figure 3.
Characteristic textural features of the vuggy carbonates observed by OpM (a,d) and SEM (b,c).
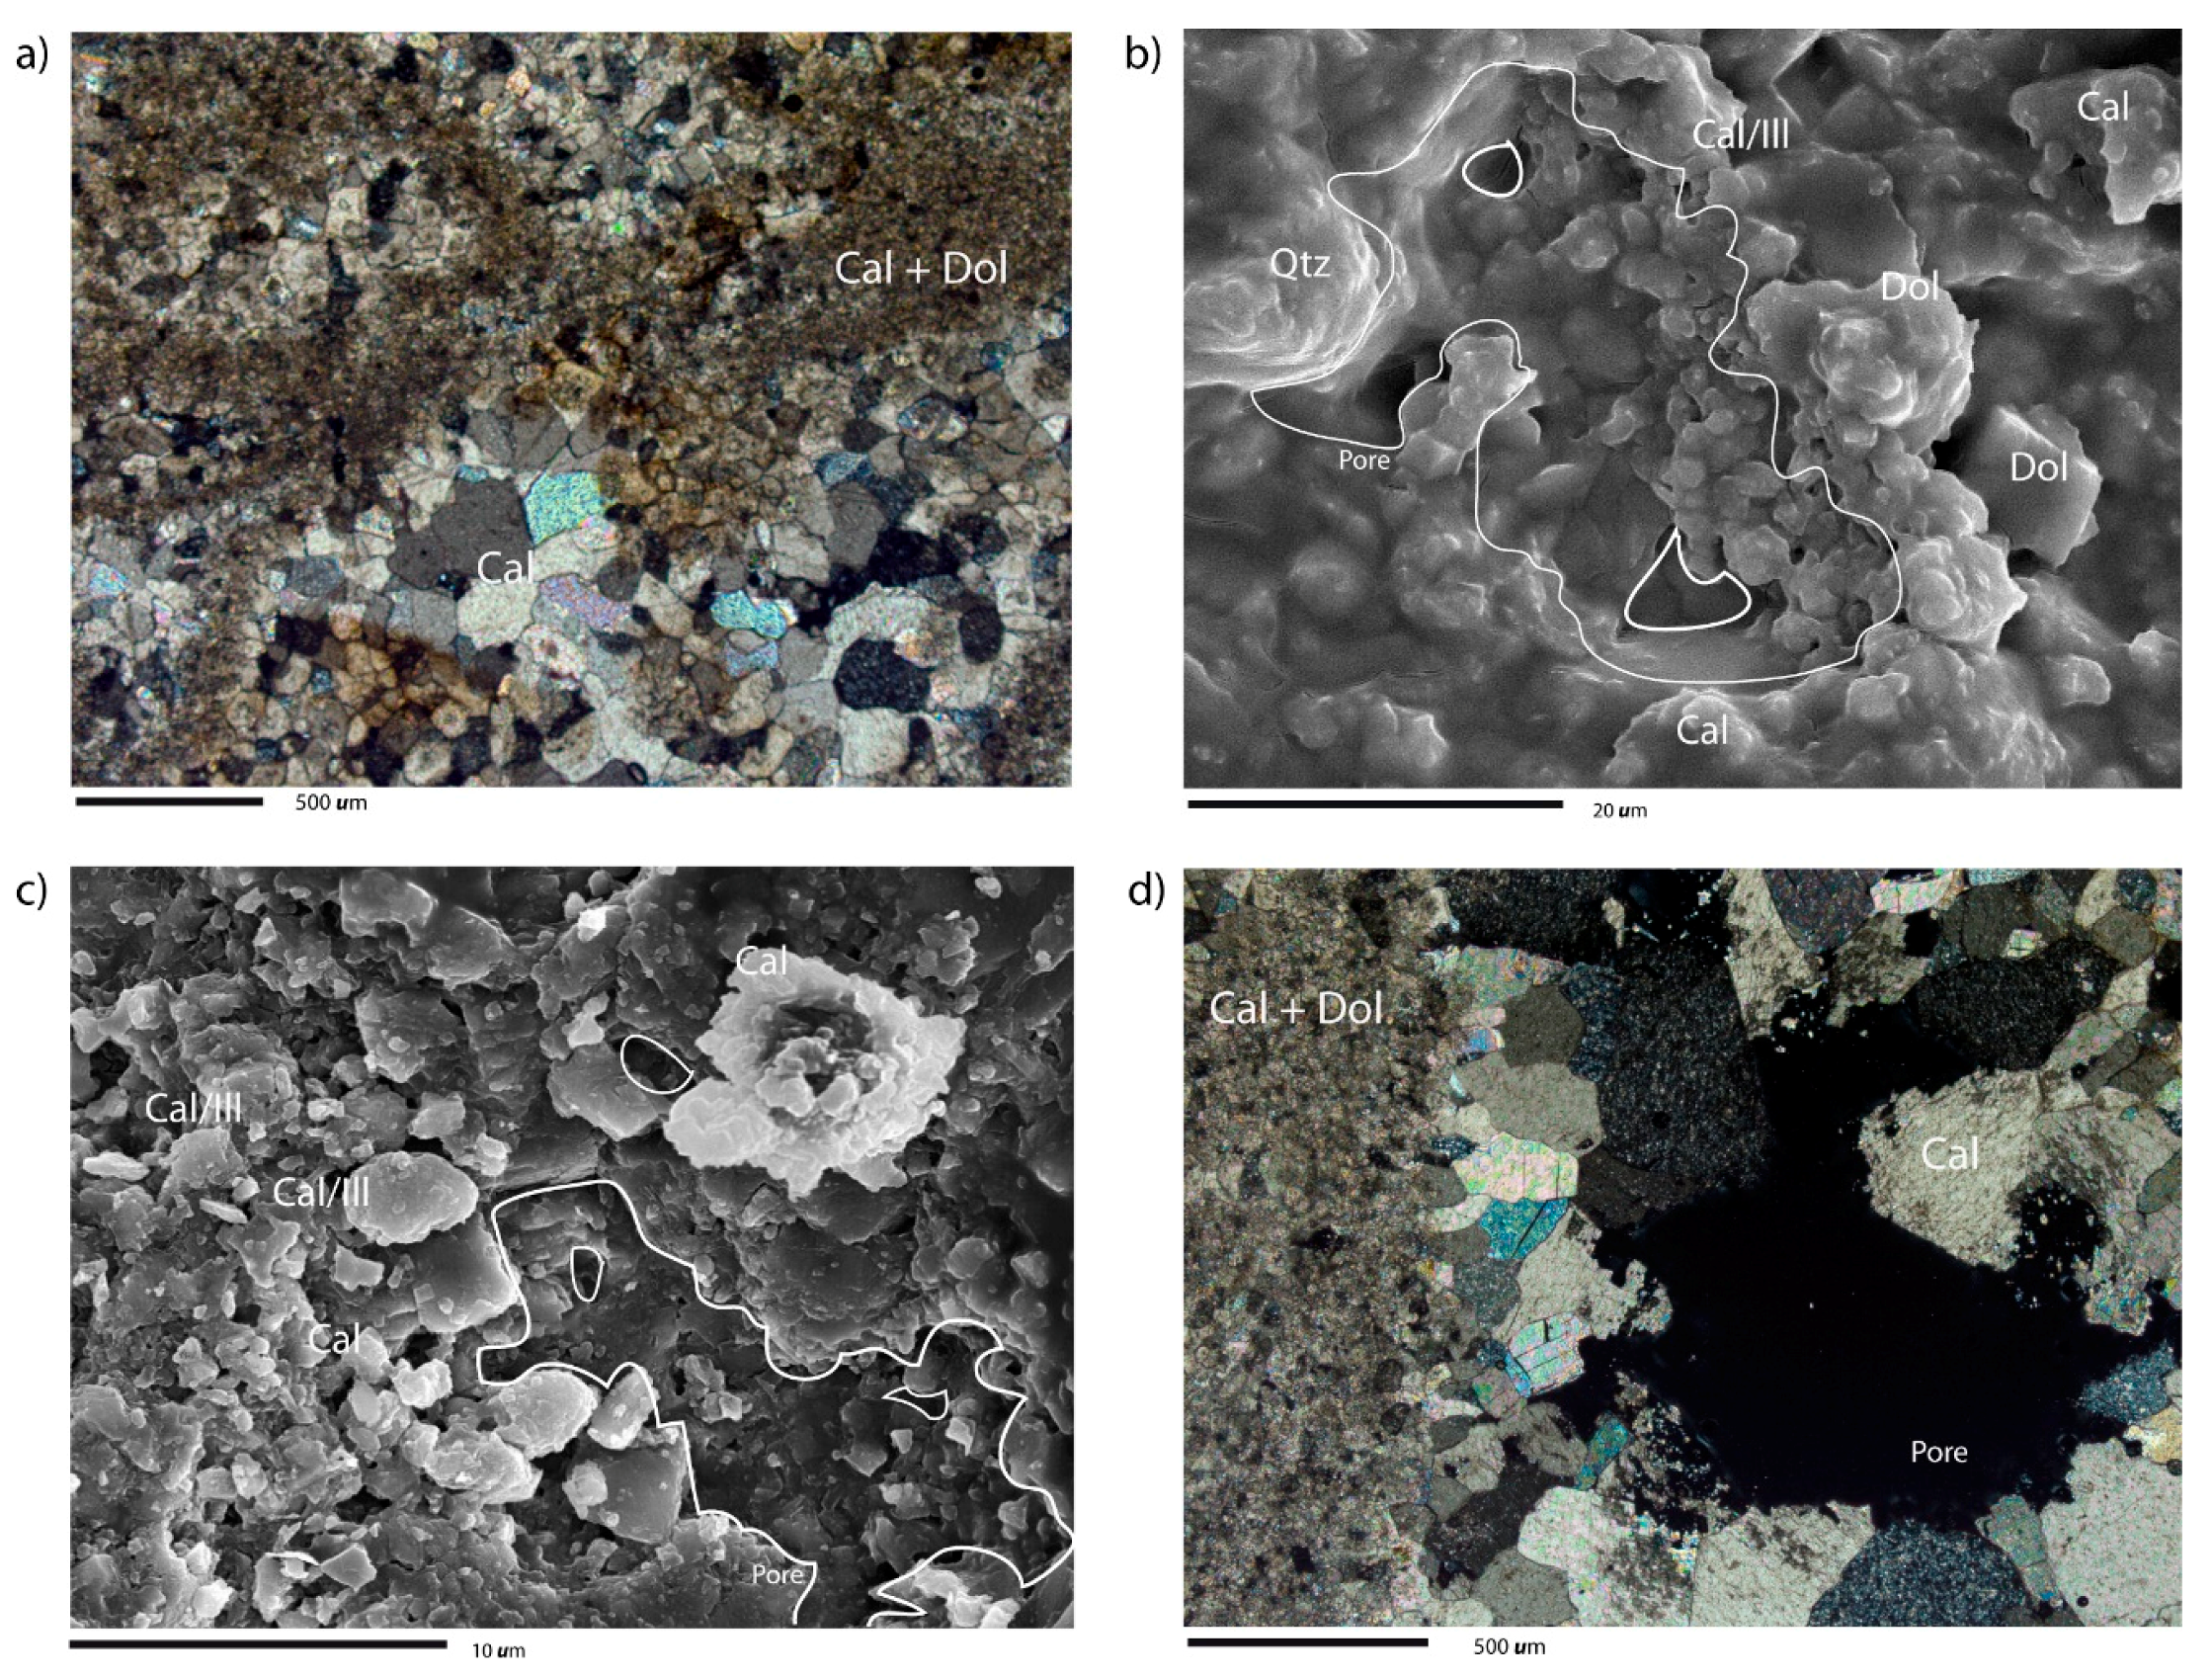
Figure 4.
Changes in the pore network configuration of the limestone after SC CO2 rich brine exposure. (a) Before (left) and after (right) images obtained by OpM showing an increased connectivity between pores after the experiment; (b) Before (left) and after (right) images obtained by SEM showing an increased surface roughness of calcite crystals due to dissolution at three different scales.

Figure 5.
Evolution of the saturation index for the different minerals over the batch experiment time obtained by the numerical simulation performed on CrunchFlow.
Figure 5.
Evolution of the saturation index for the different minerals over the batch experiment time obtained by the numerical simulation performed on CrunchFlow.
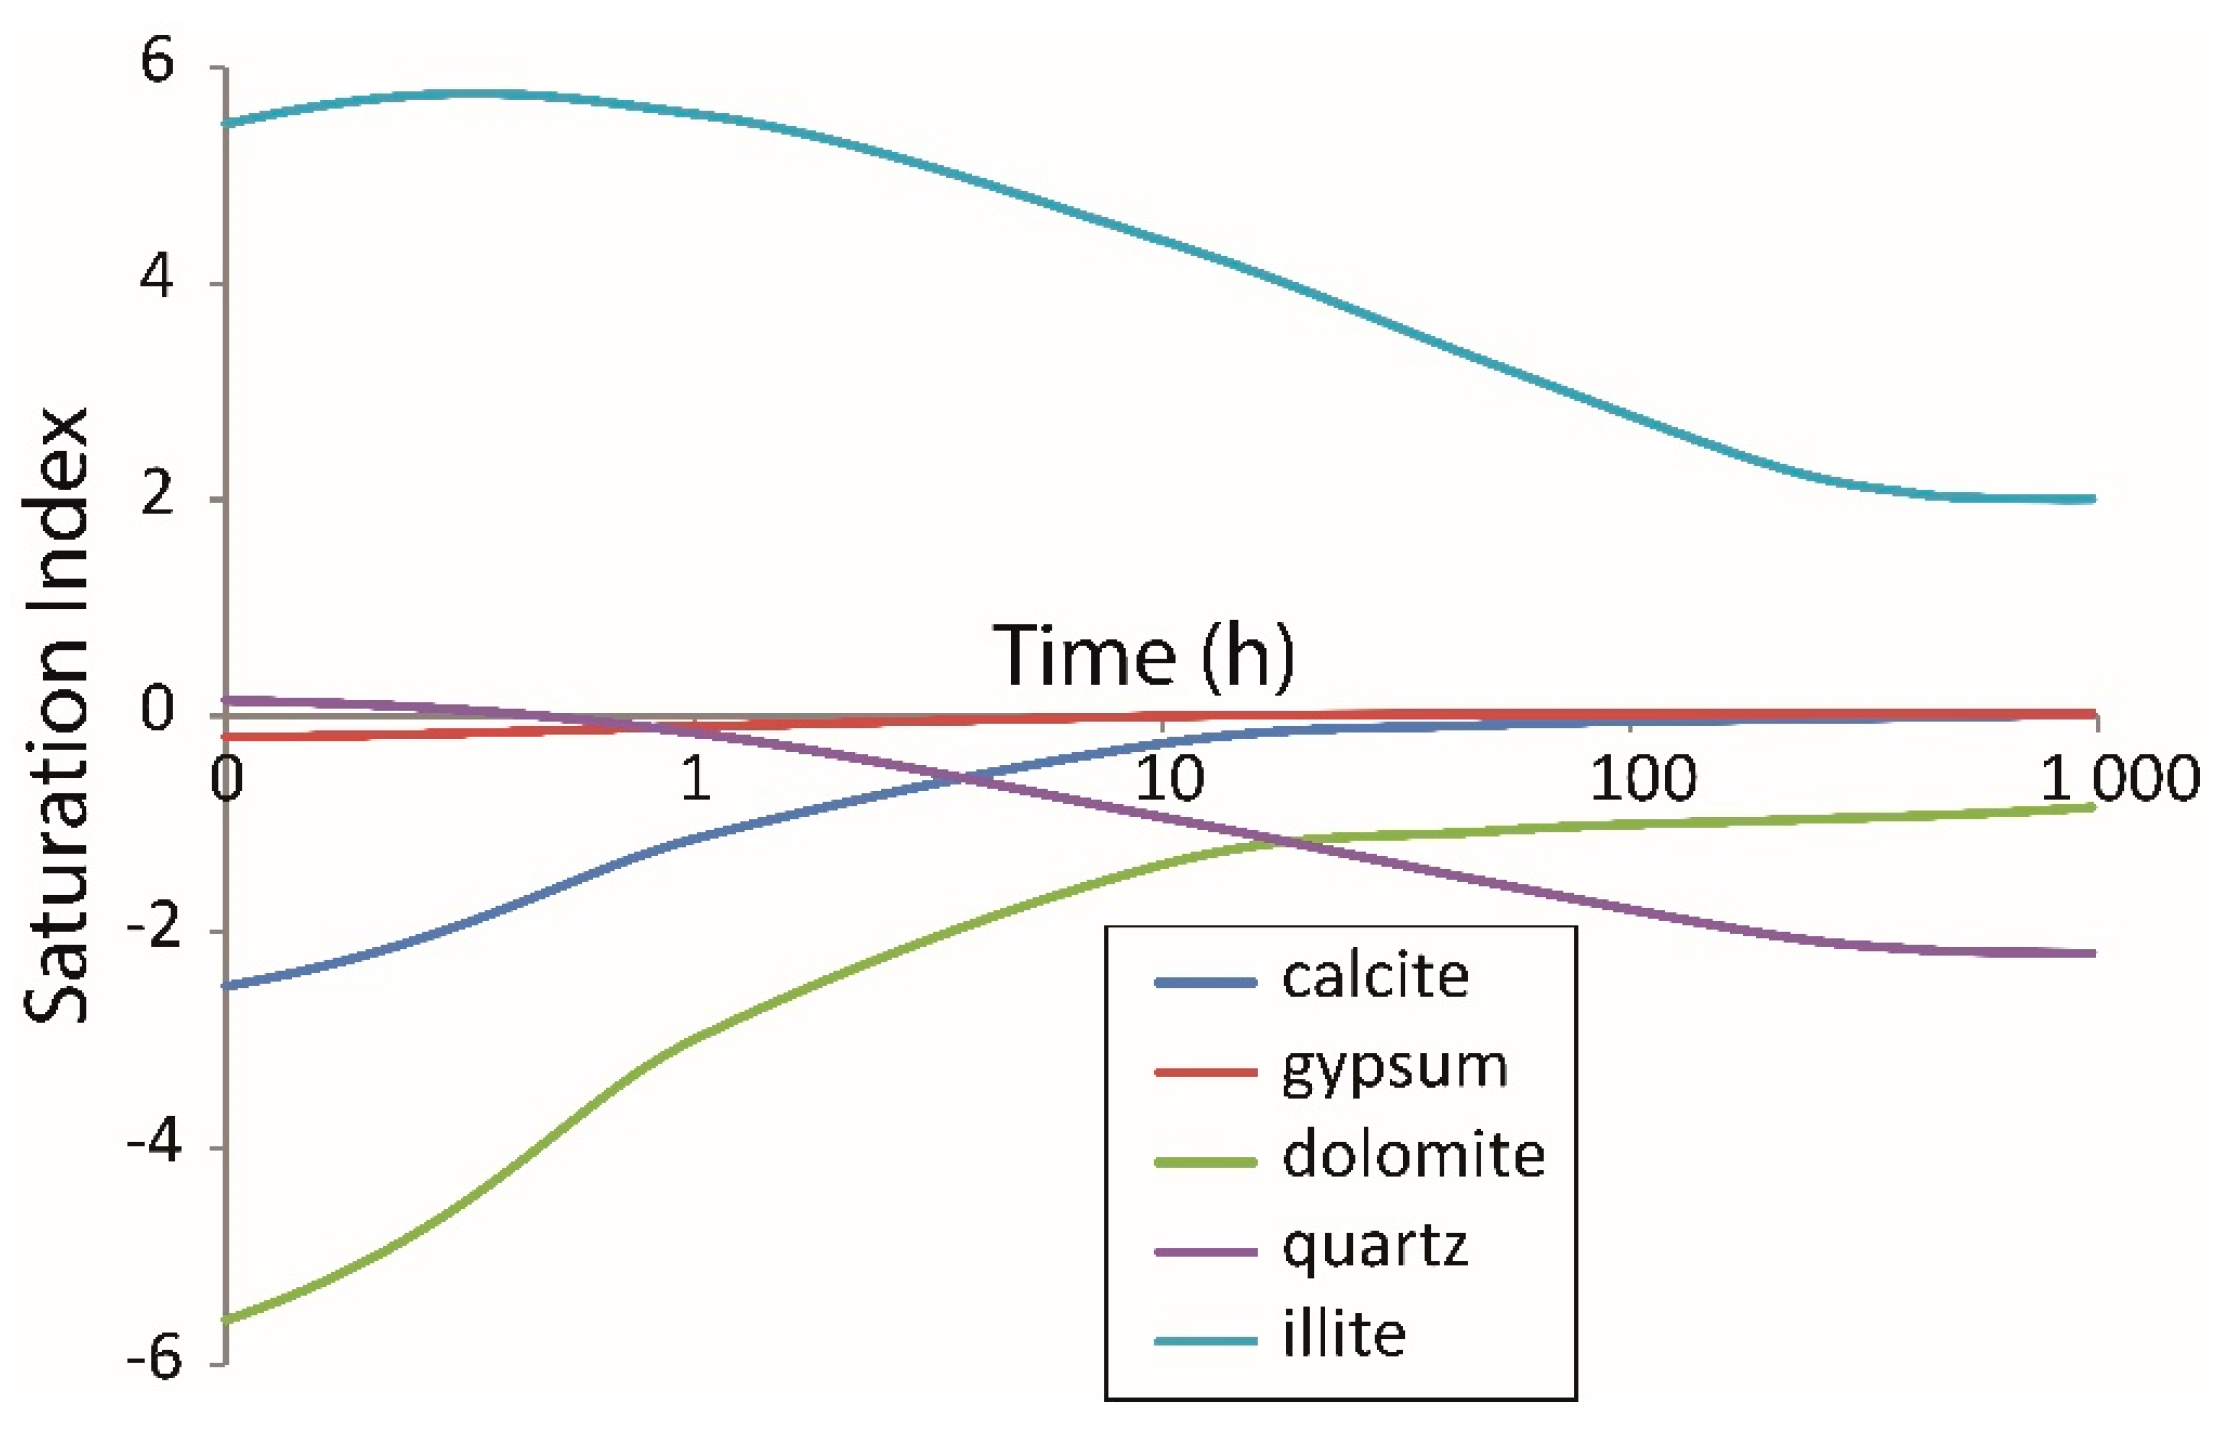
Figure 6.
Simplified model developed from the observed mineralogical/textural changes after the SC CO2 injection in the vuggy carbonates. (a) Initial mineralogy and texture of the rock samples: calcite and dolomite composition and brine filling connected pore space; (b) Pressurized SC CO2 injection begins, which dissolves in the brine (CO2-rich brine); (c) During supercritical experimental stage, the pressurized CO2-rich brine reacts with the rock forming minerals producing carbonate dissolution; (d) Pressure is released at the end of the experiment and a modified pore network remains.

Table 1.
Chemical composition of whole rock (vuggy carbonates) before (1: initial conditions) and after the experiment (2: dry CO2 conditions and 3: wet CO2 conditions). Uncertainty given by IGME Laboratory (SiO2 8.20%; Al2O3 11.57%; Fe2O3 9.55%; MnO 9.31%; MgO 7.96%; CaO 6.80%; Na2O 8.20%; K2O 19.94%; TiO 2 8.37%; P2O5 12%).
| Component | Rock before CO2 (%) (1) | Rock after Dry CO2 (%) (2) | Interpretation (1) to (2) | Rock after CO2 and Brine (%) (3) | Interpretation (1) to (3) |
|---|---|---|---|---|---|
| SiO2 | 2.080 ± 0.170 | 2.150 ± 0.176 | 2.510 ± 0.206 | ||
| Al2O3 | 0.620 ± 0.072 | 0.630 ± 0.073 | 0.720 ± 0.083 | ||
| Fe2O3 | 0.250 ± 0.024 | 0.240 ± 0.023 | 0.400 ± 0.38 | ||
| MnO | 0.200 ± 0.001 | 0.150 ± 0.014 | 0.050 ± 0.005 | ||
| MgO | 0.980 ± 0.078 | 0.860 ± 0.068 | 1.13 ± 0.900 | ||
| CaO | 52.810 ± 3.590 | 54.150 ± 3.682 | No relevant | 52.200 ± 3.545 | No relevant |
| Na2O | 0.070 ± 0.005 | 0.080 ± 0.007 | changes | 0.065 ± 0.005 | changes |
| K2O | 0.320 ± 0.064 | 0.410 ± 0.082 | 0.340 ± 0.068 | ||
| TiO2 | 0.040 ± 0.003 | 0.040 ± 0.003 | 0.100 ± 0.010 | ||
| P2O5 | 0.010 ± 0.001 | 0.010 ± 0.001 | 0.045 ± 0-005 | ||
| LOI | 42.580 ± 5.111 | 40.720 ± 4.886 | 41.5 ± 4.980 | ||
| Total | 99.810 | 99.830 | 99.60 |
Table 2.
Chemical analysis of pure brine and brine taken from the reaction chambers. Uncertainty (10%) given by IGME Laboratory.
Table 2.
Chemical analysis of pure brine and brine taken from the reaction chambers. Uncertainty (10%) given by IGME Laboratory.
| Component | Pure Brine (mg/L) | Brine Post Test (mg/L) | Interpretation |
|---|---|---|---|
| Na+ | 982 ± 98.2 | 1000 ± 100 | No change |
| K+ | 94 ± 9.4 | 92 ± 9.2 | No change |
| Mg2+ | 84 ± 8.4 | 106 ± 10.6 | Increase (26%). Dissolution of Dolomite |
| Ca2+ | 266 ± 26.6 | 1040 ± 104 | Increase (290%). Dissolution of Calcite |
| SO42− | 223 ± 22.3 | 240 ± 24 | No change |
| Cl− | 2180 ± 218 | 2180 ± 218 | No change |
| HCO−3 | 17 ± 1.7 | 2400 ± 240 | Increase (1400%) |
| CO3 | 0 | 0 | No change |
| NO−3 | 1 ± 0.1 | 7 ± 0.7 | Increase (600%) |
| SiO2 | 13 ± 1.3 | 17 ± 1.7 | Increase (31%) |
| pH | 7.4 (pH) | 6.4 (pH) | Decrease (13%) |
| Conductivity | 6450 (mS/cm) | 13650 (mS/cm) | Increase (112%) |
Table 3.
Number of pores, optical porosity, roundness (Ro) and aspect ratio (As) measured by OIA of carbonate thin sections before and after SC CO2 exposure. (Δ: relative variation; * absolute variation; ** uncertainly 1.26% given by Oviedo-IGME OIA Laboratory).
Table 3.
Number of pores, optical porosity, roundness (Ro) and aspect ratio (As) measured by OIA of carbonate thin sections before and after SC CO2 exposure. (Δ: relative variation; * absolute variation; ** uncertainly 1.26% given by Oviedo-IGME OIA Laboratory).
| Number of Pores | Δ Number of Pores | Porosity (%) | Δ Porosity | Ro | ΔRo | As | ΔAs | |
|---|---|---|---|---|---|---|---|---|
| Before | 11.17 × 10⁴ | 12.26 | 4.12 ± 0.15 ** | 7.77 (0.32) * | 0.625 | −2.40 | 2.207 | 2.26 |
| After | 12.54 × 10⁴ | 4.44 ± 0.17 ** | 0.610 | 2.257 |
Table 4.
Mineral composition before and after the batch experiment obtained from mass balance calculation and numerical modelling. The geochemical (thermodynamical and kinetics) parameters used in the CrunchFlow simulation are also indicated as well as the references.
Table 4.
Mineral composition before and after the batch experiment obtained from mass balance calculation and numerical modelling. The geochemical (thermodynamical and kinetics) parameters used in the CrunchFlow simulation are also indicated as well as the references.
| Mineral and Chemical Composition | Initial (mg) | Final (Mass Balance, mg) | Final (Numerical Model, mg) | Reactive Surface Area (m2/m3) | km,25 (mol m−2 s−1) | n H+ | n O2 | Ea (Kcal mol−1) | References |
|---|---|---|---|---|---|---|---|---|---|
| Calcite CaCO3 | 259.051 | 258.492 | 257.803 | 100 | 5.01 × 10⁻³ | 0.5 | 11 | [46] | |
| Dolomite CaMg(CO3)2 | 12.536 | 12.484 | 12.472 | 0.1 | 6.46 × 10⁻⁴ | 0.5 | 8.63 | [47] | |
| Quartz SiO2 | 3.719 | 3.717 | 3.706 | 10 | 3.98 × 10⁻¹⁴ | −0.3 | 21.72 | [47] | |
| Illite (K, H3O)Al2Si3AlO10(OH)2 | 3.387 | 3.389 | 3.390 | 10,000 | 6.31 × 10⁻¹⁴ | 13 | [44] | ||
| Pyrite FeS2 | 0.465 | 0.233 | 0.185 | 1000 | 6.46 × 10⁻⁹ | −0.11 | 0.5 | 13.61 | [45] |
| Gypsum CaSO4 2H2O | 0.002 | 0.265 | 0.033 | 0.1 | 1.62 × 10⁻³ | 0 | [47] |
© 2017 by the authors. Licensee MDPI, Basel, Switzerland. This article is an open access article distributed under the terms and conditions of the Creative Commons Attribution (CC BY) license (http://creativecommons.org/licenses/by/4.0/).
Share and Cite
MDPI and ACS Style
Berrezueta, E.; Kovacs, T.; Luquot, L. Qualitative and Quantitative Changes of Carbonate Rocks Exposed to SC CO2 (Basque-Cantabrian Basin, Northern Spain). Appl. Sci. 2017, 7, 1124. https://doi.org/10.3390/app7111124
AMA Style
Berrezueta E, Kovacs T, Luquot L. Qualitative and Quantitative Changes of Carbonate Rocks Exposed to SC CO2 (Basque-Cantabrian Basin, Northern Spain). Applied Sciences. 2017; 7(11):1124. https://doi.org/10.3390/app7111124
Chicago/Turabian StyleBerrezueta, Edgar, Timea Kovacs, and Linda Luquot. 2017. "Qualitative and Quantitative Changes of Carbonate Rocks Exposed to SC CO2 (Basque-Cantabrian Basin, Northern Spain)" Applied Sciences 7, no. 11: 1124. https://doi.org/10.3390/app7111124
Note that from the first issue of 2016, this journal uses article numbers instead of page numbers. See further details here.