ABS-SOCI: An Agent-Based Simulator of Student Sociograms


1
Department of Computer Science and Engineering of Systems, University of Zaragoza, 44003 Teruel, Spain
2
Instituto de Investigación Sanitaria Aragón, University of Zaragoza, 50009 Zaragoza, Spain
3
Department of Psychology and Sociology, University of Zaragoza, 44003 Teruel, Spain
4
Department of Electronics Engineering and Communications, University of Zaragoza, 44003 Teruel, Spain
*
Author to whom correspondence should be addressed.
Appl. Sci. 2017, 7(11), 1126; https://doi.org/10.3390/app7111126
Submission received: 22 September 2017
/
Revised: 15 October 2017
/
Accepted: 27 October 2017
/
Published: 1 November 2017
(This article belongs to the Special Issue Multi-Agent Systems)
Abstract
:Sociograms can represent the social relations between students. Some kinds of sociograms are more suitable than others for achieving a high academic performance of students. However, for now, at the beginning of an educative period, it is not possible to know for sure how the sociogram of a group of students will be or evolve during a semester or an academic year. In this context, the current approach presents an Agent-Based Simulator (ABS) that predicts the sociogram of a group of students taking into consideration their psychological profiles, by evolving an initial sociogram through time. This simulator is referred to as ABS-SOCI (ABS for SOCIograms). For instance, this can be useful for organizing class groups for some subjects of engineering grades, anticipating additional learning assistance or testing some teaching strategies. As experimentation, ABS-SOCI has been executed 100 times for each one of four real scenarios. The results show that ABS-SOCI produces sociograms similar to the real ones considering certain sociometrics. This similarity has been corroborated by statistical binomial tests that check whether there are significant differences between the simulations and the real cases. This experimentation also includes cross-validation and an analysis of sensitivity. ABS-SOCI is free and open-source to (1) ensure the reproducibility of the experiments; (2) to allow practitioners to run simulations; and (3) to allow developers to adapt the simulator for different environments.

1. Introduction
Instructors should take several aspects into account in order to obtain a high quality level of education customized for a particular group of students. One of the most relevant ones is the proper adaption of the lectures to the academic level of students. Another factor is to consider the social relations among the students, as these can condition their academic performance. For instance, isolated students may have a lower academic performance. Instructors can mitigate the isolation of certain students by making teamwork activities assuring that the potential isolated students are well integrated in their teams [1]. For achieving this purpose, it is essential that teachers have the appropriate tools for estimating the relations among students. This is the reason why a simulator of student sociograms can be helpful for teachers in order to personalize the education regarding the social statuses of students.
The current work presents an agent-based simulator (ABS) called ABS-SOCI for predicting sociograms of students classified by their activity roles.
ABS-SOCI assists teachers in ameliorating the isolation of students. It can also allow teachers to anticipate potential cases of bullied students. Notice that bullying has been considered as one of the most worrying problems in education [2], which, in the worst cases, can imply dramatic outcomes such as suicides.
ABS-SOCI has some advantages over the application of general-purpose ABS tools such as NetLogo [3] and Repast [4]. For instance, ABS-SOCI can directly use a customized representation of sociograms, so that ABS researchers do not need to deal with the implementation of their graphical representations. The graphical sociogram representation of ABS-SOCI includes different kinds of arrows (representing respectively selection and rejection relations) with different intensities (represented with different widths), and the individuals are represented in a circled layout as commonly done in sociograms [5]. In addition, ABS-SOCI simulates the evolution of social relations from a matrix of affinities between student activity roles, considering aspects such as the duration of the relations, their trends, and the common reciprocity. The implementation of these aspects are not straightforward in general-purpose ABS tools, to the best of the authors’ knowledge.
The current research focuses on validating that the simulator forecasts sociograms are similar to the real ones. For this purpose, we have assessed the current approach by comparisons in (1) three different real scenarios taken from the literature and (2) another scenario from the experience of one of the current authors. ABS-SOCI has provided the base for the simulation of teaching strategies [6] and the clustering of students from their features for later simulating their social relations [7].
2. Background
Sociograms graphically represent the social relations among individuals. Sociograms can analyze several kinds of relations, such as selections and rejections. Selection relations can be obtained by asking for example “Who would you choose as a workmate?”, while rejection relations can be obtained with questions such as “Who would you avoid to work with?” Sociograms [8] have proven to be especially useful for analyzing group dynamics, performing comparisons between groups, and studying the repercussion of the moderator (or instructor) technique.
Several works associated the analysis of social networks with the group performance. For instance, Grund [9] presented a detailed analysis of the different network structures and their relation with the team performance. The results of a league of soccer teams were used as experimental basis to measure the performance, and this was compared with the known measures of network structures such as network intensity (passes per minute) and network centralization. Furthermore, the work of Lin and Lai [10] not only related the network with the performance, but also increased the performance based on the network. In particular, this work presented a tool-supported technique for improving academic performance of students being aware of social networks through the analysis of sociograms. In online formative assessments, their system recommended students with low results to strengthen their social connections and academically collaborate with their closest peers. Their study showed that their system improved academic performance. However, none of these works allowed practitioners to simulate the evolution of these sociograms through time in a realistic way so that some possible sociogram structures could be forecasted given certain students with certain profiles.
There are different ways of analyzing sociograms. In particular, sociometrics are useful for performing this analysis. For instance, Sweet and Zheng [11] proposed a metric for measuring subgroup insularity or segregation, in order to quantify the separation between subgroups. In addition, Barrasa and Gil [12] proposed a software application that measured a wide range of sociometrics in sociograms. They proposed sociometrics that measured (a) different factors of the social status of each individual as well as (b) group properties such as cohesion and dissociation. The current approach used some of these metrics for measuring the simulation outcomes.
Several works have used sociograms in education. For example, Roberts [5] extracted sociograms from a group of students to analyze the influence of the teacher when encouraging student interaction. She performed their analysis in the nursing education, and she analyzed the activity roles of student. She provided some hints about how to encourage student interaction from her experience. In addition, Dombrovskis et al. [13] used the sociograms for analyzing the interpersonal relations of young students in sport lessons. Their goal was to promote cooperation skills among children in order to evoke positive attitude towards learning and avoiding negative emotions in isolated ones. The current work shares some of the goals with these works, and its innovation is the proposal of a simulator tool for predicting sociograms of students beforehand.
Moreover, some works have studied the influence of grouping in education. For example, Yu et al. [14] performed a study in a large city in China, and showed how the low academic-level students increased their performance when they were included in heterogeneous academic-level groups. Furthermore, Chen et al. [15] applied a Genetic Algorithm (GA) to group partners based on the analysis of a social network, considering sociometrics for assessing the social statuses of students. They applied the GA to optimize the grouping satisfying certain constraints related to the diversity of grades, social status and genders. They compared the results of the GA with the solutions from Branch and Bound (B&B), which obtain optimal solutions. They showed that the GA worked properly as it frequently obtained optimal solutions or nearly optimal. These works provided alternative solutions for one of the applications of the sociogram simulations, which is the grouping of students based on their profiles. However, they did not provide solutions for other applications of sociogram simulations, such as the estimation about the need of teamwork activities.
There are some ABSs and agent-based models (ABMs) for simulating sociograms. For instance, Arentze et al. [16] presented an ABM for generating social networks. Their approach was based on the formation of friendships considering aspects such as geographic proximity and similarity between individuals. They used the random-utility-maximizing (RUM) framework, and they found that the simulations regularly obtained similar results to the real ones in the Swiss context. In addition, Hassan et al. [17] presented an ABM for simulating friendship relations by means of fuzzy logic. They modeled the mental states of people and simulated their changes of mind. They also simulated the relationships in social networks considering the similarity between individuals among other aspects. Furthermore, Dobson et al. [18] presented an interactive ABS with virtual reality for training teams. This simulator provided sociograms that represented the relations among agents. They simulated emergency situations related respectively with railways and nuclear power generators. Nevertheless, none of these works focused on the simulation of sociograms from the student roles about their activity in lectures and learning exercises.
Although most simulations of sociograms are performed with ABSs, there are also very few works that apply different approaches for this purpose. For example, McHardy and Vershinina [19] defined a simulation model inspired by micro-biology for simulating sociograms that represented networks of learners in industry. They simulated the transfer of knowledge based on the principles of autocatalysis, in order to explain the collective generation of promising ideas. Nevertheless, the current approach adheres to the major trend of using ABSs for simulating sociograms.
3. ABS-SOCI
ABS-SOCI is useful for estimating social structures from the student activity roles. This simulator can assist teachers in knowing which groups of students are more probable to have inconvenient social structures. In these cases, teachers can design collaborative learning activities for (a) mitigating the isolation of some students and (b) facilitating the social structures that imply a higher academic performance.
ABS-SOCI is able to simulate sociograms of student groups that consider the two relation kinds of selections and rejections, in which each relation can have a different intensity. Some inputs are the numbers of students associated with each activity role (quiet, participant, students that drive discussions to tangent topics, students that frequently make jokes, obstructive, and occasionally participant). Other main inputs are the number of lectures (represented as iterations) and the initial sociogram if known at the beginning of the course. ABS-SOCI simulates the evolution of the sociogram showing a visual animation. The main output of ABS-SOCI is the final state of the sociogram.
Researchers can calibrate the internal parameters of the simulator to obtain different kinds of simulation evolutions. They can change the internal parameters about (a) the coherence of relations in terms of reciprocity; (b) the frequency in which relations can change their trends; (c) the speed for evolving the intensity of selection and rejection relations; (d) the time from which the simulator starts reducing the alterations in order to achieve stability. Researchers can also calibrate the affinities and antipathies between every pair of student activity roles.
These internal parameters can be trained given certain known input conditions and certain real resulting sociograms following ATABS (a technique for Automatically Training ABSs) [20].
In a research data repository, our public dataset of ABS-SOCI [21] freely provides the executable file of this tool, its open source, its HTML documentations, and an example of initial sociogram. This section describes the different inner facets of this ABS. It also explains the main decisions and their advantages over other possible alternatives.
3.1. Applied Theoretical Bases
The interpersonal relationships depend on the student profiles according the previous findings in Ref. [22]. Hence, the current system simulates these relation establishments based on student profiles. In particular, the current work uses a classification of students inspired by the work of Roberts [5]. This classification has been selected as that work analyzed the corresponding student profiles in relation with the social relations between students. In addition, it was also useful to match the student profiles detected in other works about sociograms.
There are different grades of relationships, and, consequently, ABS-SOCI represents these grades. Specifically, the variations of the grades of relationships usually follow some trends as demonstrated by Leinhardt [23], although these trends vary sometimes. Hence, ABS-SOCI incorporates the concept of relation trends, considering positive, neutral or negative ones. The grades of relationships normally evolve following these trends with smooth transitions. The system simulates some eventual changes of trends.
The changes of relation trends depend on some aspects such as the durations of relationships. In particular, long-term relationships change less frequently their trends than the short-term relationships [24]. In the current simulator, the decisions of changing relation trends are simulated in a nondeterministic way considering the relation duration among other aspects.
The conformation of some relationships between the different profiles depends on the group size according to Ref. [5]. The presented system simulates this fact by using different probability values for simulating the social decisions regarding the group size.
The relationships are independently represented in the two directions between each pair of individuals. However, it is well known that a high proportion of relationships are reciprocal [25]. More specifically, Davis [26] proved that a person referred to as X is more likely to choose a person denoted as Y when Y chooses X. In order to properly simulate this fact, when an individual changes their relation trend towards another individual, the former corresponding agent communicates it to the latter. In this manner, the receiver agent decides whether to follow back this relation, it being possible to indirectly adjust the proportion of relations that are reciprocal.
3.2. User Interface of the Tool
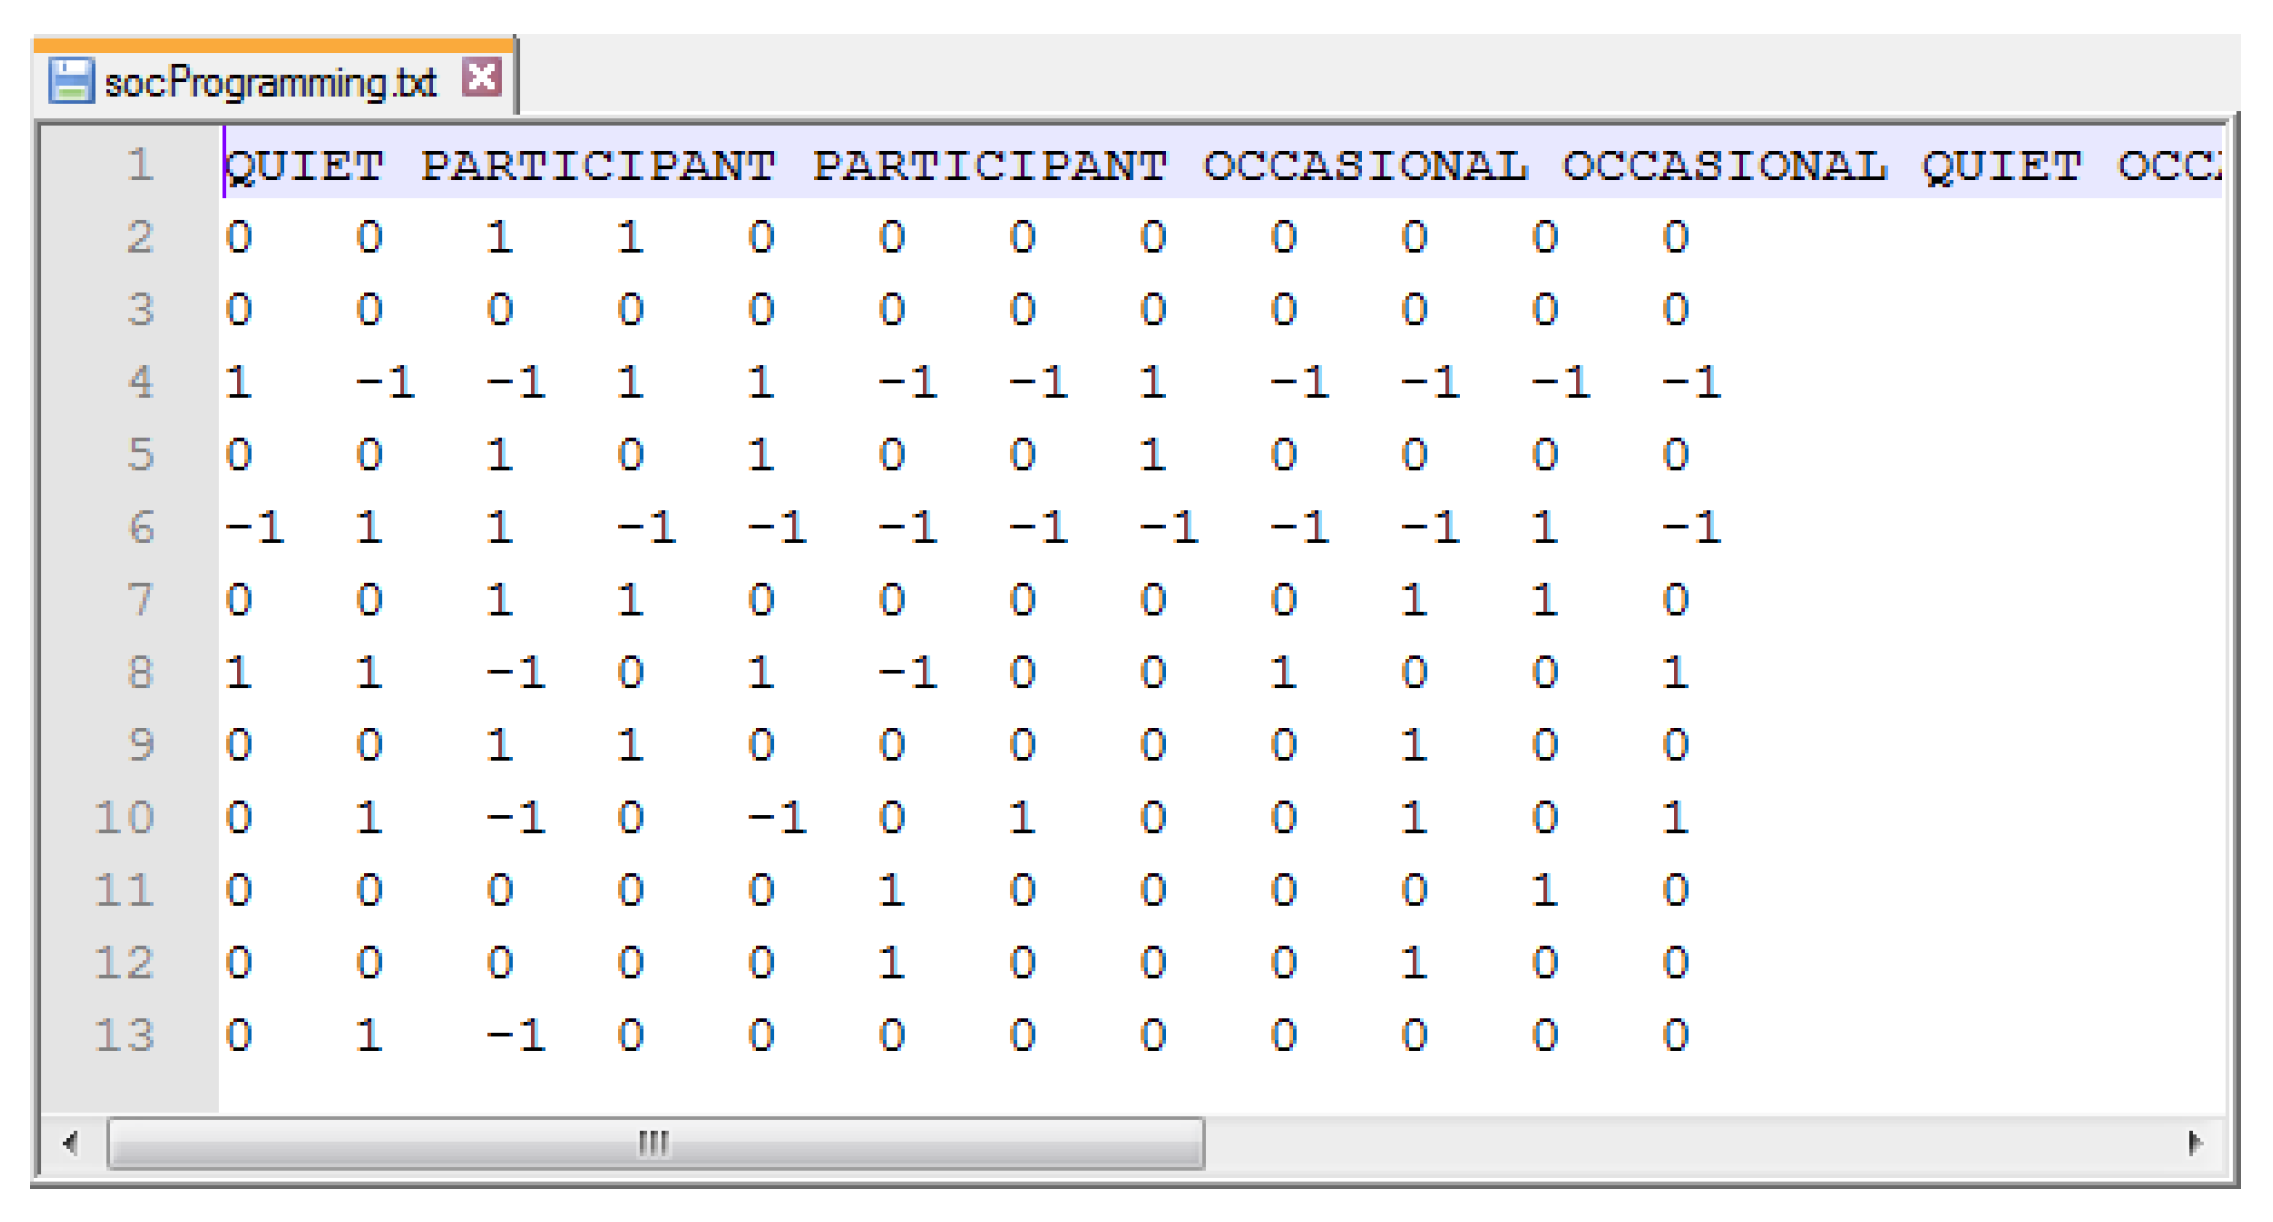
Figure 1 shows the main frame of the user interface (UI) of ABS-SOCI. In this frame, users can introduce the input parameters of simulations. Each simulation can start either from (a) a neutral sociogram (i.e., with only neutral relationships) or from (b) an existing sociogram with specific selection, neutral and rejection relations. In the former case, users introduce the number of students of each role. In the latter case, users determine this sociogram with a text file (see an example in Figure 2).
The number of iterations represents the number of teaching hours. Users can also select the animation speed (i.e., number of iterations per second), which does not have any repercussion in the actual simulation. Users can either observe all the steps and analyze these with a slow simulation, or go through the whole simulation quickly to obtain the final results. Users can repeat simulations with the same input parameters, by indicating the corresponding number of simulations.
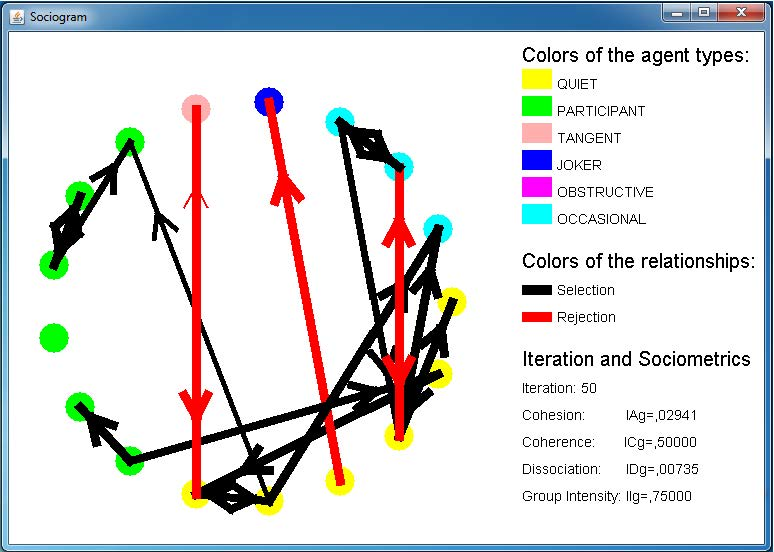
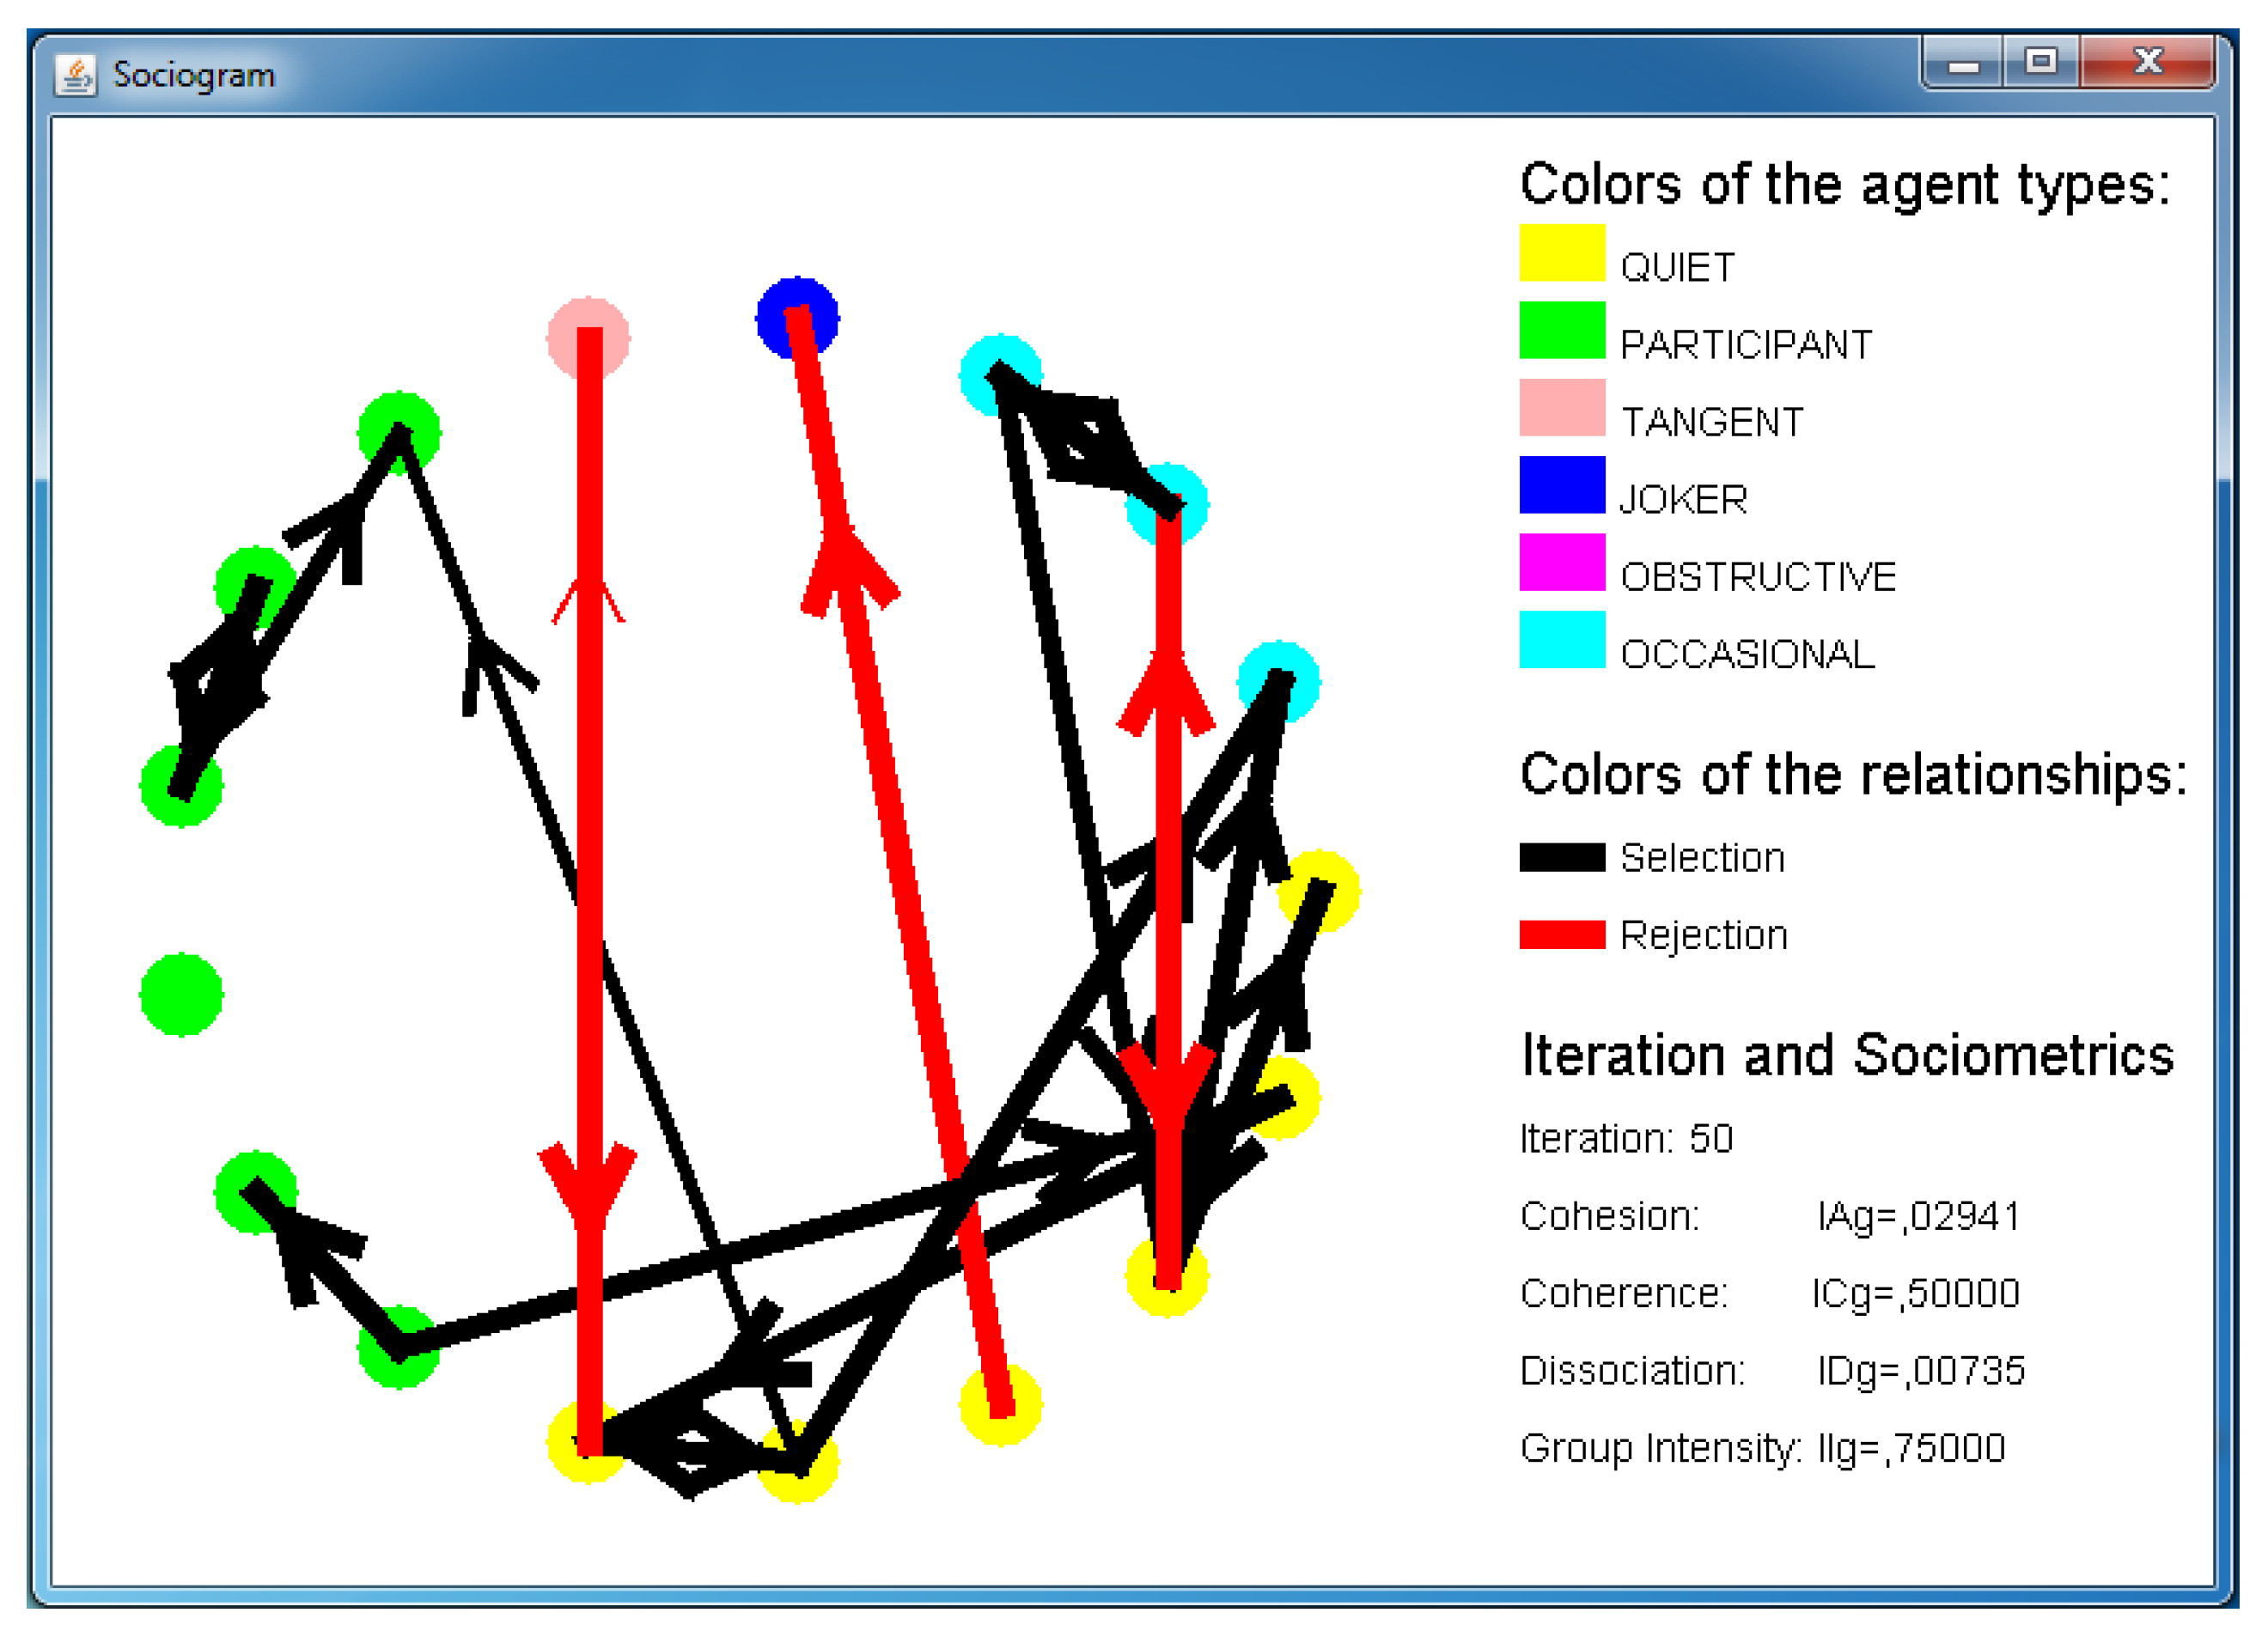
Once a user has initiated the simulations, a new frame pops up as the one in Figure 3. For each simulation, this frame sequentially presents the evolution of the sociogram showing the results of all the iterations from the first one to the last one. The sociogram is presented by situating all the individuals in a circle, and connecting these with arrows when there is either a relationship of selection or rejection. This representation is common in the works about sociograms. The relationships have directions, and these directions are indicated with the corresponding arrowheads. The relationships have grades of intensity, and these are graphically represented with the thicknesses of the corresponding arrows.
In the right side, there is a legend for presenting some color notations. Each individual is represented as a small filled circle with the color that represents its student agent types. The selection and rejection relationships are respectively specified with black and red. The bottom right side of the frame indicates the number of the iteration and the measurement values of certain sociometrics.
The sociometric results of all the simulations are presented on the right side of the main frame with their averages and standard deviations (SD). The results can be saved into a text file by pressing the corresponding button.
The results of ABS-SOCI are measured with some of the sociometrics introduced by Barrasa and Gil [12] that are related to features of the group. The Index of Association of a group (IAg) measures the cohesion of the group. The Index of Dissociation of a group (IDg) measures the dislike between members of the group. The Index of Coherence of a group (ICg) measures the number of selections that are reciprocally divided by all the actual selections (either reciprocal or not). The Index of Intensity of a group (IIg) measures the grade of the emission of selections and rejections by the members of the group.
3.3. Architecture
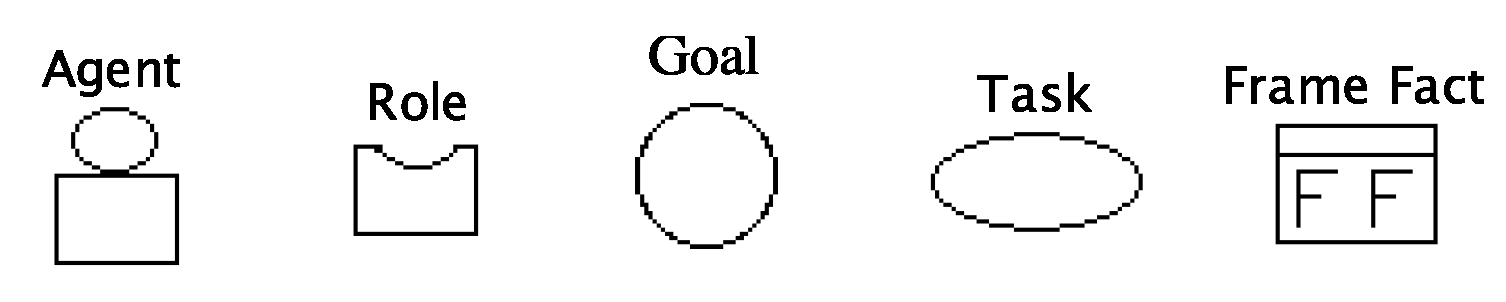
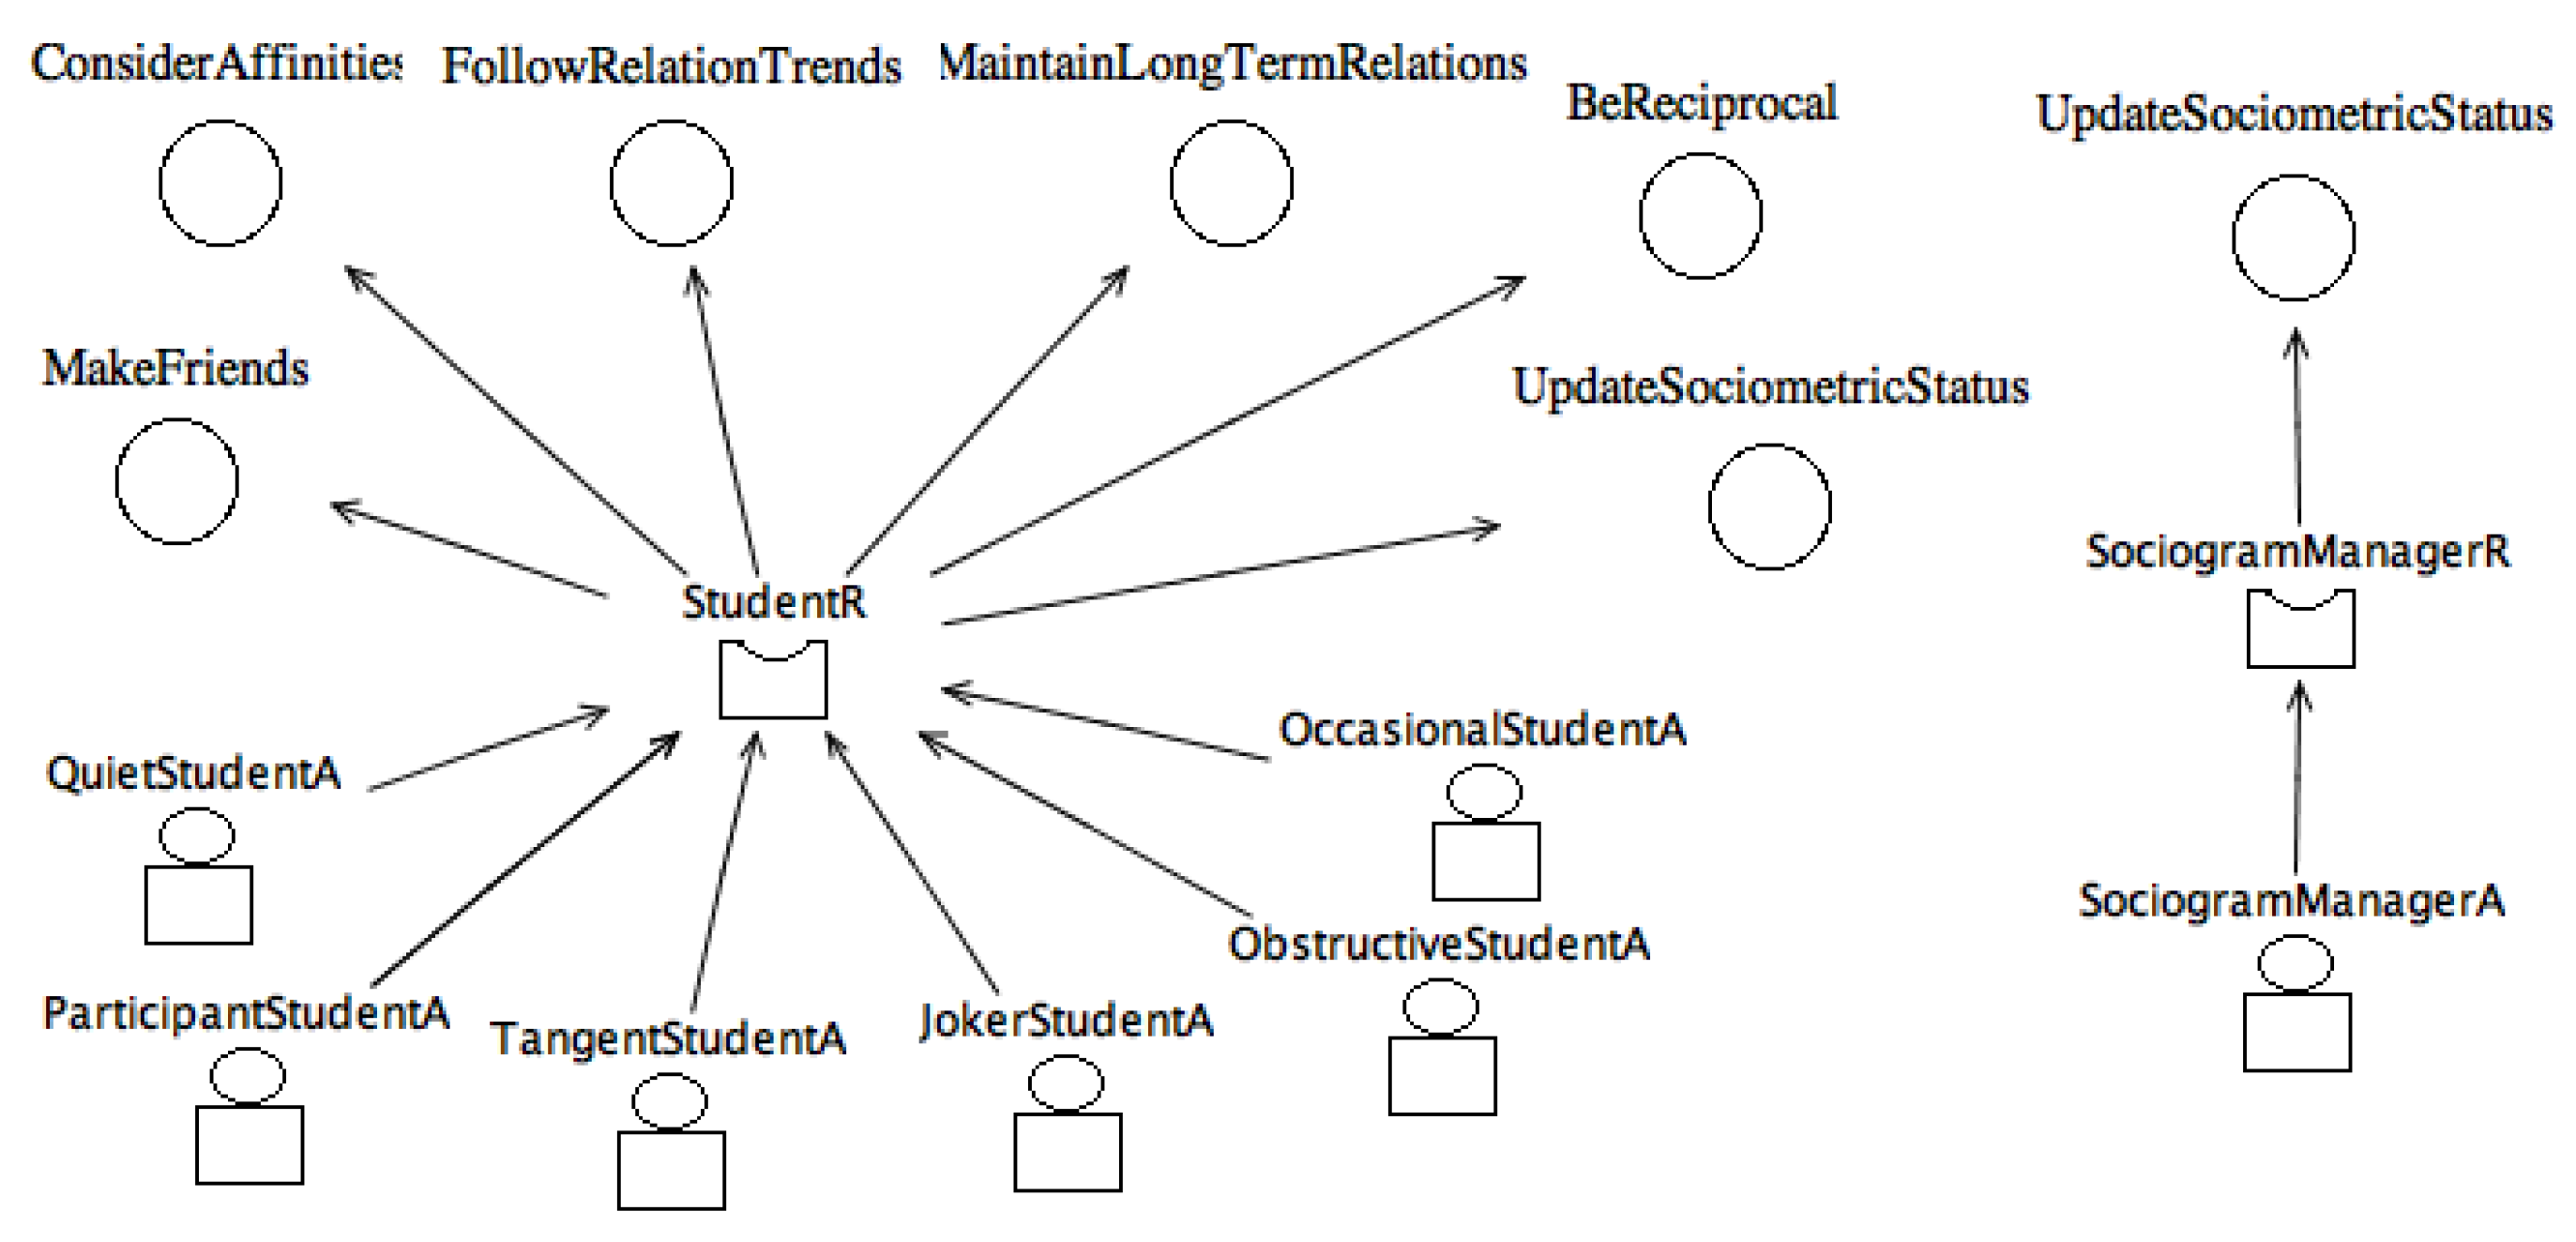
The architecture of ABS-SOCI is presented using the Ingenias language [27], since this simulator has been modeled and developed as a multi-agent system (MAS). Figure 4 shows the main symbols of the Ingenias notation, so that readers can understand the next figures.
The simulator was developed with the Process for Developing Efficient Agent-based Simulators (PEABS) [28] that uses the Ingenias language. Figure 5 defines the following agent roles of ABS-SOCI:
- Student role: This role impersonates the social behaviors of students. Its main goals are (1) to make friends; (2) to consider the affinities between the different types of students; (3) to follow the trends of their social relations in most cases; (4) to notice the duration of the relations for making it less probable that long-term relations change; (5) to maintain coherence in the ratio of relations that are reciprocal. The student activity roles have been obtained by analyzing the education literature [5] and selecting the following set of common student types based on the way of participating in lectures:
- -
- Quiet Student agent: This student is usually quiet and does not participate in group discussions during learning activities.
- -
- Participant Student agent: This student usually participates in class.
- -
- Tangent Student agent: This student usually drives the class discussions to tangent topics that are not relevant.
- -
- Joker Student agent: It usually makes jokes in class discussions.
- -
- Obstructive Student agent: It frequently mentions the disadvantages of the learning activities.
- -
- Occasional Student agent: This student occasionally participates in class.
- Sociogram Manager role: This person is responsible for properly updating the sociometric status of the agents playing the student role. This role graphically presents the sociometric statuses with sociograms. It can save the relevant information into a text file.
3.4. Internal Functioning of the ABS
The presentation of the internal functioning of ABS-SOCI has been divided into (a) the introduction of the student agents and their data structures in Section 3.4.1; (b) the presentation of the sociogram representation in Section 3.4.2; and (c) the description of the evolution rules that are applied during the simulation in Section 3.4.3.
3.4.1. Student Agents
Some student types are more suitable with certain student types than others. For instance, participant students usually get on well with other participant students, and joker students (who like to make jokes in classes) usually get on with tangent students (who tend to derive the class to an irrelevant subject). However, other student types are frequently unsuitable with some student types. For example, participant students usually reject obstructive students.
Moreover, the size of the group influences the probability that an individual selects another as a friend. In general, for larger groups, the probability that two specific individuals are friends is usually less, as they have higher numbers of people they can choose as friends. However, some specific roles as jokers may be the opposite as two jokers may have more probabilities to be friends when they share more students in the group that listen to their jokes. For this reason, this simulator defines different size levels determined with specific intervals, and some matrices and constants are separately defined for each size level.
For representing all these scenarios, ABS-SOCI has the following vector and matrices:
- “Size levels” vector: It defines the interval for each size level.
- “Suitable” matrix: For each pair of student types t1 and t2 in a particular size level, it contains the probability that a student of t1 type establishes a positive relation trend towards a student of t2 type.
- “Unsuitable” matrix: For each pair of student types t1 and t2 in a specific size level, it contains the probability that a student of t1 type establishes a negative relation trend towards a student of t2 type.
The two matrices referred as Suitable and Unsuitable have the restriction that, for each pair of types t1 and t2 in a particular size level, the sum of the corresponding values in the two matrices must be less or equal to one. The probability of setting a neutral trend is implicitly obtained as the subtraction of Suitable and Unsuitable matrices values from one for each pair of type and size level.
3.4.2. Sociogram Representation
A sociogram is implemented similarly to a weighted and directed graph with an adjacency matrix. The weight between each pair of individuals i1 and i2 is a real number in the [−1, 1] interval where −1 is the maximum level that i1 can reject i2 as a friend, and +1 is the maximum level that i1 can select i2 as a friend. As an alternative, we considered to have two different values for selection and rejection in two different adjacency matrices. However, this representation had the disadvantage that it would allow an individual i1 to select i2 as a friend and at the same time to reject i2 as a friend, which is not consistent. For this reason, we decided to use the first representation with a unique value within the [−1, 1] interval.
We used the thresholds of 0.5 for counting selections and −0.5 for rejections, when applying the sociometrics of Barrasa and Gil [12]. The other values were considered as neutral.
At the beginning of each simulation, the adjacency matrix can be either imported from a file or set to neutral values, depending on whether some individuals knew each before the simulation.
3.4.3. Simulation Evolution Rules
In each iteration, ABS-SOCI considers the following aspects to update the relationship of selection/rejection between each pair of students i1 and i2:
- Affinity of the type of i1 with the type of i2 in the particular size level. This is represented within the student agent implementation with the Suitable and Unsuitable matrices.
- The trend of the relationship. For instance, if the value of a relationship was increasing, it is more likely that it continues increasing, and similarly for decreasing trends.
- The duration of the relationship. The long-term relationships between students are less probable to change their trend than short-term relationships.
- The possibility of being a reciprocal relationship. Most relationships are reciprocal. In other words, when an individual i1 selects i2 as a friend, i2 usually selects back i1 as a friend.
The simulation of sociogram evolutions use the following additional data structures:
- “Trend” matrix: This matrix is defined for determining the trends of the relationships for every pair of individuals. The values of this matrix are restricted to the [−1, 1] interval. For instance, matrix +1 indicates that the value of the adjacency matrix of the corresponding pair of individuals is increasing, while –1 indicates the opposite. Zero indicates that the value of the adjacency matrix remains with the same value.
- “Change” matrix: This matrix determines the probabilities of changing trends between student types. In particular, each value of this matrix represents the probability that two individuals of the corresponding student types change their trend in an iteration.
The relationships between individuals are updated in each iteration in two phases: (1) updating the trends; (2) updating the relationships according to the trends.
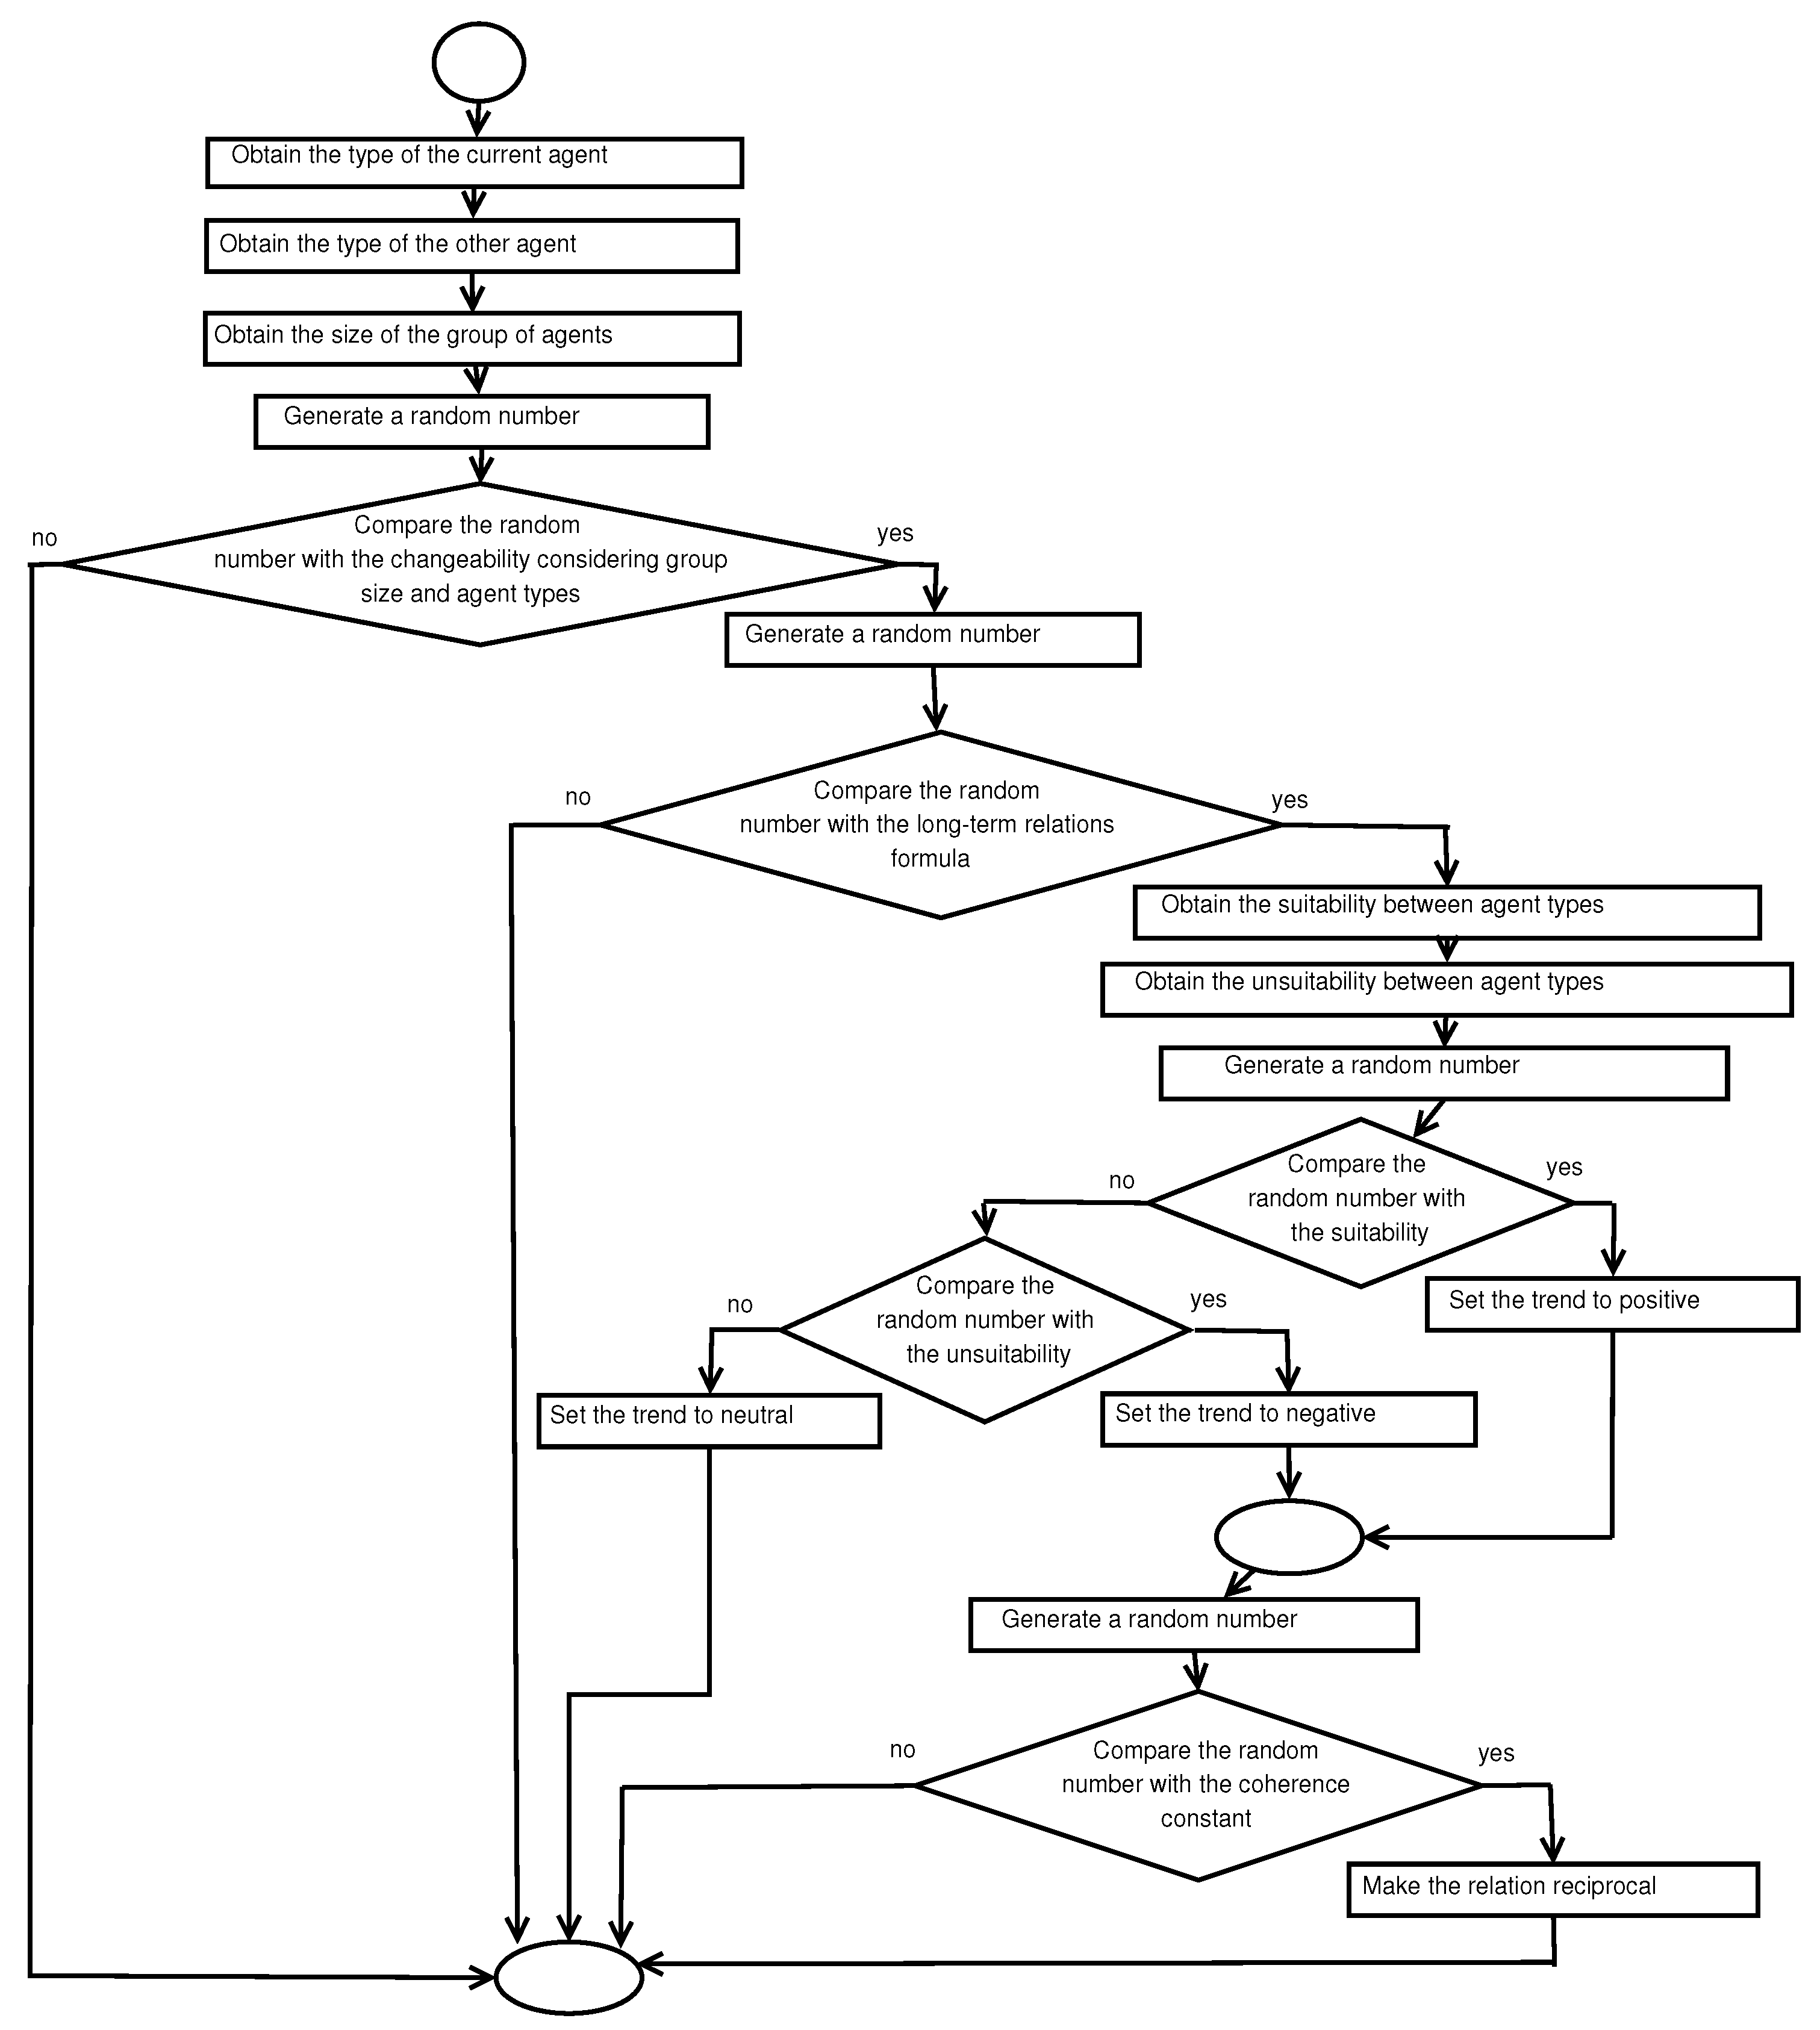
The algorithm for updating the trends is represented with the dataflow diagram of Figure 6. This diagram uses “less than” comparisons. This diagram mainly receives input from the current student agent and another one. It also uses the matrices and constants previously defined. In this dataflow, the previous trend of the relationship is considered. If any of the first two conditional bifurcations goes to the negative branch, then the trend is not changed, and consequently the relationship continues with the same trend (either decreasing, neutral or increasing). More concretely, the first bifurcation considers the probability of changing the trend of the corresponding agent types.
The second bifurcation is included to reduce the probability that long-term relationships change in comparison to short-term relationships. For this purpose, ABS-SOCI uses the relative position of the iteration in the simulation, represented with the “iteration” variable that goes from one to the total number of iterations. The probability of changing the relation trend is determined with Equation (1). The probability is lower in later iterations, since it uses an inverse function of the iteration variable:
The constant is applied to properly weight the effect of distinguishing different relation durations. This constant determines from which iteration the probability starts decreasing. The min function makes the outputted probability be one when the iteration position is lower than this constant. For example, assuming a common value of this constant like ten, for the first ten iterations, the probability of changing the trend according to relation duration will be the same (i.e., one). From this iteration forward, the change probability decreases.
Several alternatives were compared before choosing Equation (1) for considering the duration of relations. For instance, an alternative was to decrease the probability of changing trends in a linear way such as the one indicated in Equation (2):
represents an alternative constant that modulates the impact of simulation durations on the simulations. However, its values should be much lower than one, and can be obtained by dividing one by the number of iterations that is considered a long relation. This equation was discarded because the probability of change would become absolutely zero in a certain number of iterations. This does not represent the reality and did not satisfy our goals.
The goal was to reduce the probability, and not to make the change impossible with a probability of zero.
Going back to the dataflow of Figure 6, in the cases that go through the previous bifurcations in the positive branches, the trend is reestablished considering probabilities of the suitability and unsuitability matrices following the formulas for nondeterministic decisions of TABSAOND (the Technique for developing ABS Apps and Online tools with Nondeterministic Decisions) [29].
If the trend is established to a non-zero value, the trend can become a reciprocal relationship (either positive or negative). In these cases, the constant is used as the probability for simulating the establishment of reciprocal relations.
It is worth mentioning that both constants and are actually vectors, since these have different values for each level of group size.
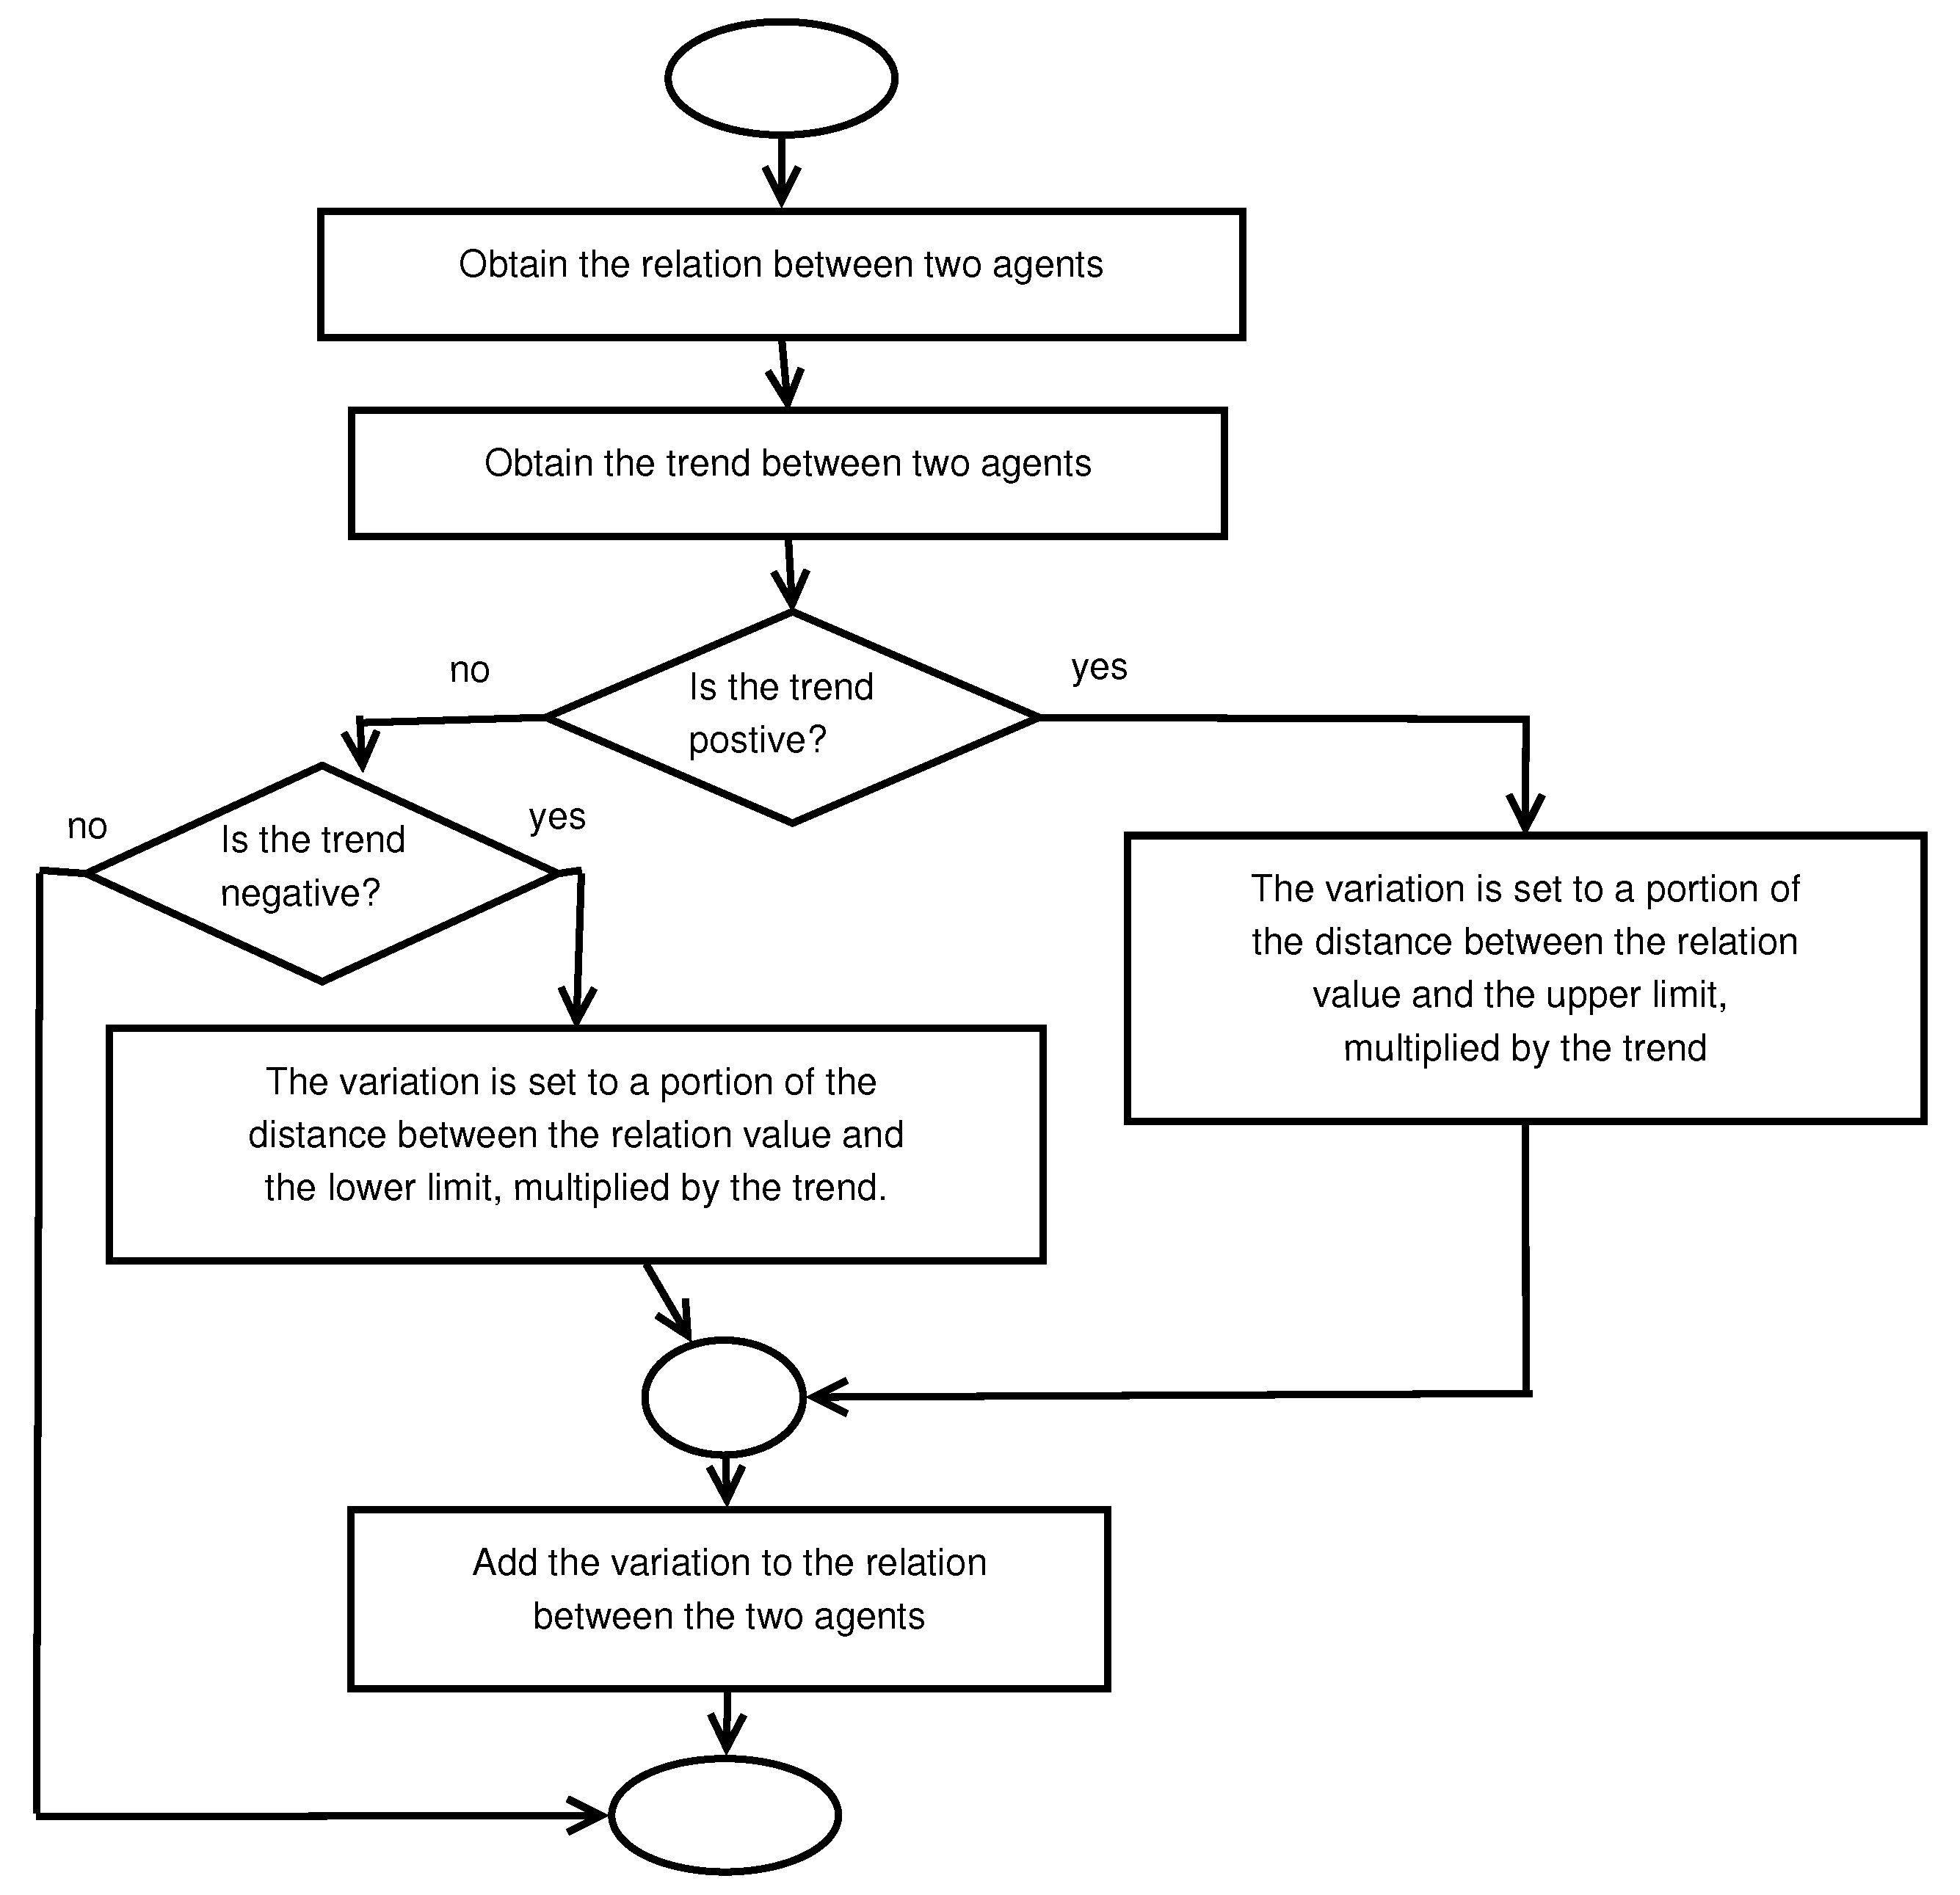
Once the phase about trend selection has finished, the relation between the two corresponding individuals is updated according to the trend following the dataflow of Figure 7. The variation of the relationship value is calculated as a portion of the distance to the approaching limit, and this portion is represented with the value. is set to 0.15 since this value allows the relationship values to surpass the selection and rejection thresholds from the initial zero value in a few iterations (i.e., five iterations), or go from a selection to a rejection or vice versa in a non-excessive number of iterations (i.e., seven to nine iterations). These numbers of iterations allow smooth transitions and can take place in simulations of common subject durations (i.e., from 20 to 90 class hours).
4. Experimentation
The current approach has been evaluated with several scenarios related to groups of students. These scenarios were extracted from both (a) external works reported in [5,12,30] and (b) an experiment of one of the current authors in a Programming Course in the University of Zaragoza. The simulations have been tested starting from both (1) initial sociograms with only neutral relations (in the scenarios from the external works); and (2) an initial existing sociogram where people already knew each other and there were different kinds of relations (in the Programming Course scenario). The current approach has been evaluated in both online education [30] and face-to-face education (in the other scenarios).
The goal of the scenarios extracted from the literature was to assess the prediction capability of the ABS-SOCI tool. In these scenarios, ABS-SOCI could have been used for estimating potential students in risk of isolation and the possible group cohesion in order to reinforce the courses with collaborative activities. In the experiment of the Programming Course, ABS-SOCI was actually used to estimate the cohesion of the group and the social structures represented as sociograms. The teacher added some collaborative exercises in his teaching schedule in order to reinforce collaboration among students and ameliorate the potential isolation cases.
Firstly, ABS-SOCI has been calibrated with two real sociogram cases, which are the ones presented in the work of Barrasa and Gil [12] and the work of Roberts [5]. These sociograms are different in terms of sample size, and some constants and matrix values have been adjusted to obtain similar results. This calibration of constants and matrix values has been performed following the White Box Calibration method proposed by Fehler et al. [31]. According to this calibration method, the current approach determines their main influence of these internal values in the simulation results. In particular, this approach considers the direct influence of the Suitable matrix on (1) the selection relations between individuals of certain types and on (2) the cohesion sociometric in general. It also considers the opposite influence of the Unsuitable matrix in these two aspects. It takes into account the influence of the Change matrix and the value in the evolution of sociometrics for a specific number of iterations. Finally, it adjusts the value considering its repercussion in the coherence sociometric. This calibration phase can also be considered as a training phase.
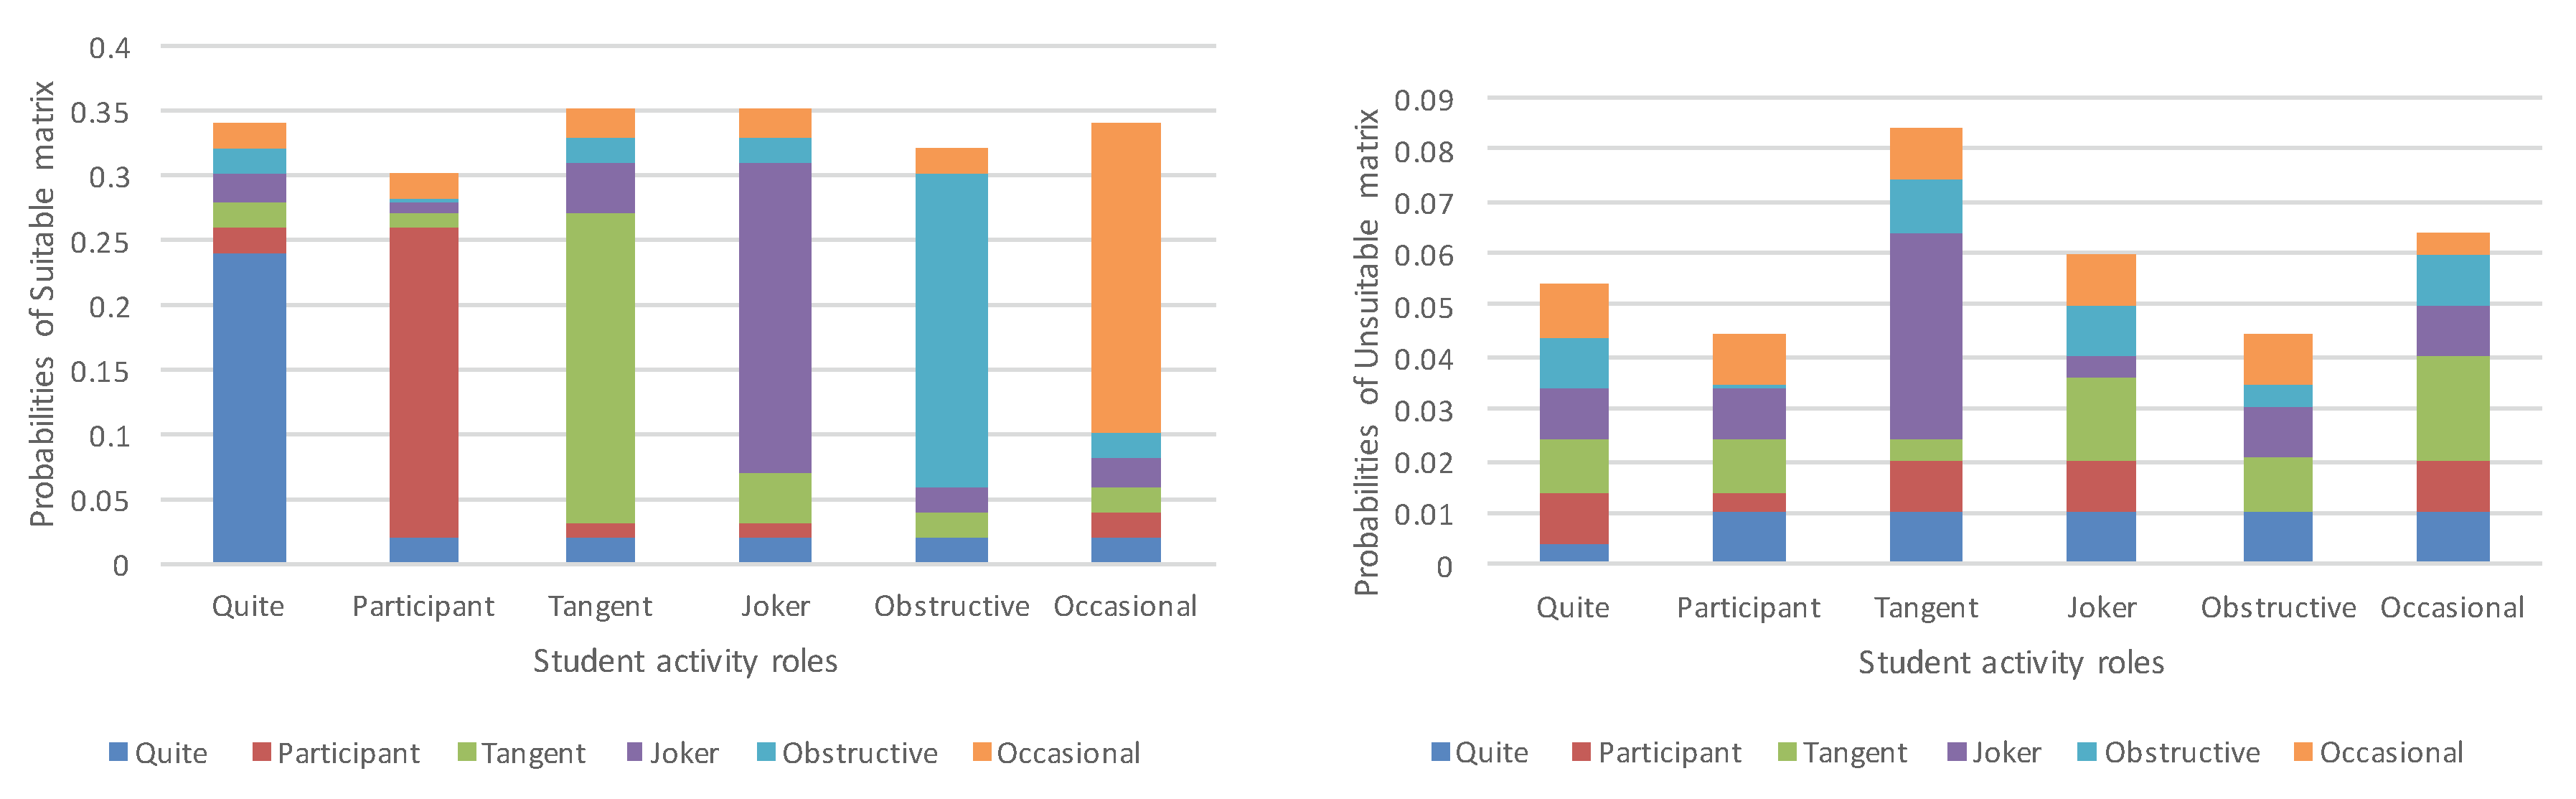
Table 1 determines these internal constant values depending on the sample size after this calibration phase. As an example, Figure 8 visually shows the values of Suitable and Unsuitable matrices for the large groups (i.e., size ≥9) after the calibration phase. All of these values were the results of the calibration phase, and were used as the setting of the simulator for running the next simulations.
After the calibration, ABS-SOCI was run and validated with the new scenario introduced by Dawson [30], besides the aforementioned works. There were 100 executions for each case for obtaining a representative set of results.
Table 2 presents the input parameters of the scenarios of these experiments and the remaining ones. The number of iterations was 50 representing 50 h of teaching activities in all of the scenarios except one. The number of iterations from the first three scenarios correspond to the common number of teaching hours of these subjects in the corresponding academic level and countries reported by the original sources. In particular, the subjects belonged to either higher education or university education, from either Spain or United Kingdom.
For each simulation, the IAg and ICg sociometric indexes were estimated. The other metrics (IDg and IIg) are not presented as the analyzed works did not include information about rejections, which are necessary for calculating these metrics. To determine if the estimations of IAg and ICg sociometrics provided by ABS-SOCI were statistically different from those obtained by the published works, a binomial test was carried out with a nominal significance level of 0.05 because these sociometrics represent proportions. Reported alpha levels were adjusted using the Bonferroni procedure to control for family-wise error rate, considering all simulations within the same index a family of tests.
In order to obtain an effect size for simulations, the difference of arcsine transformation of proportions was calculated, as it is described by Cohen [32]. This effect size was interpreted according to the mentioned work. That is, values of 0.2, 0.5 and 0.8 were interpreted as small, medium and large, respectively.
Since a non-significant effect could be attributed to a lack of statistical power, a sensitivity analysis was performed using G*Power 3 [33]. This analysis calculated the minimum effect size to which the test was able to detect with a power (1 − ) of 0.80, a significance level () of 0.05, and the sample size (n) of the used scenarios. The software offers a Hedges’ g effect size, which was also interpreted according to the guidelines offered by Cohen [32]. Specifically, its interpretation is similar to the effect size based on the arcsine transformation of difference of proportions.
To summarize the results obtained on the analysis, the current work calculated the percentages of non-significant simulations. It also calculated the percentages of simulations with small, medium and large effect sizes. Table 3 presents all these percentages, along with the true value, the mean estimated value, standard deviation of estimated values, and Hedges’ g obtained in the sensitivity analysis.
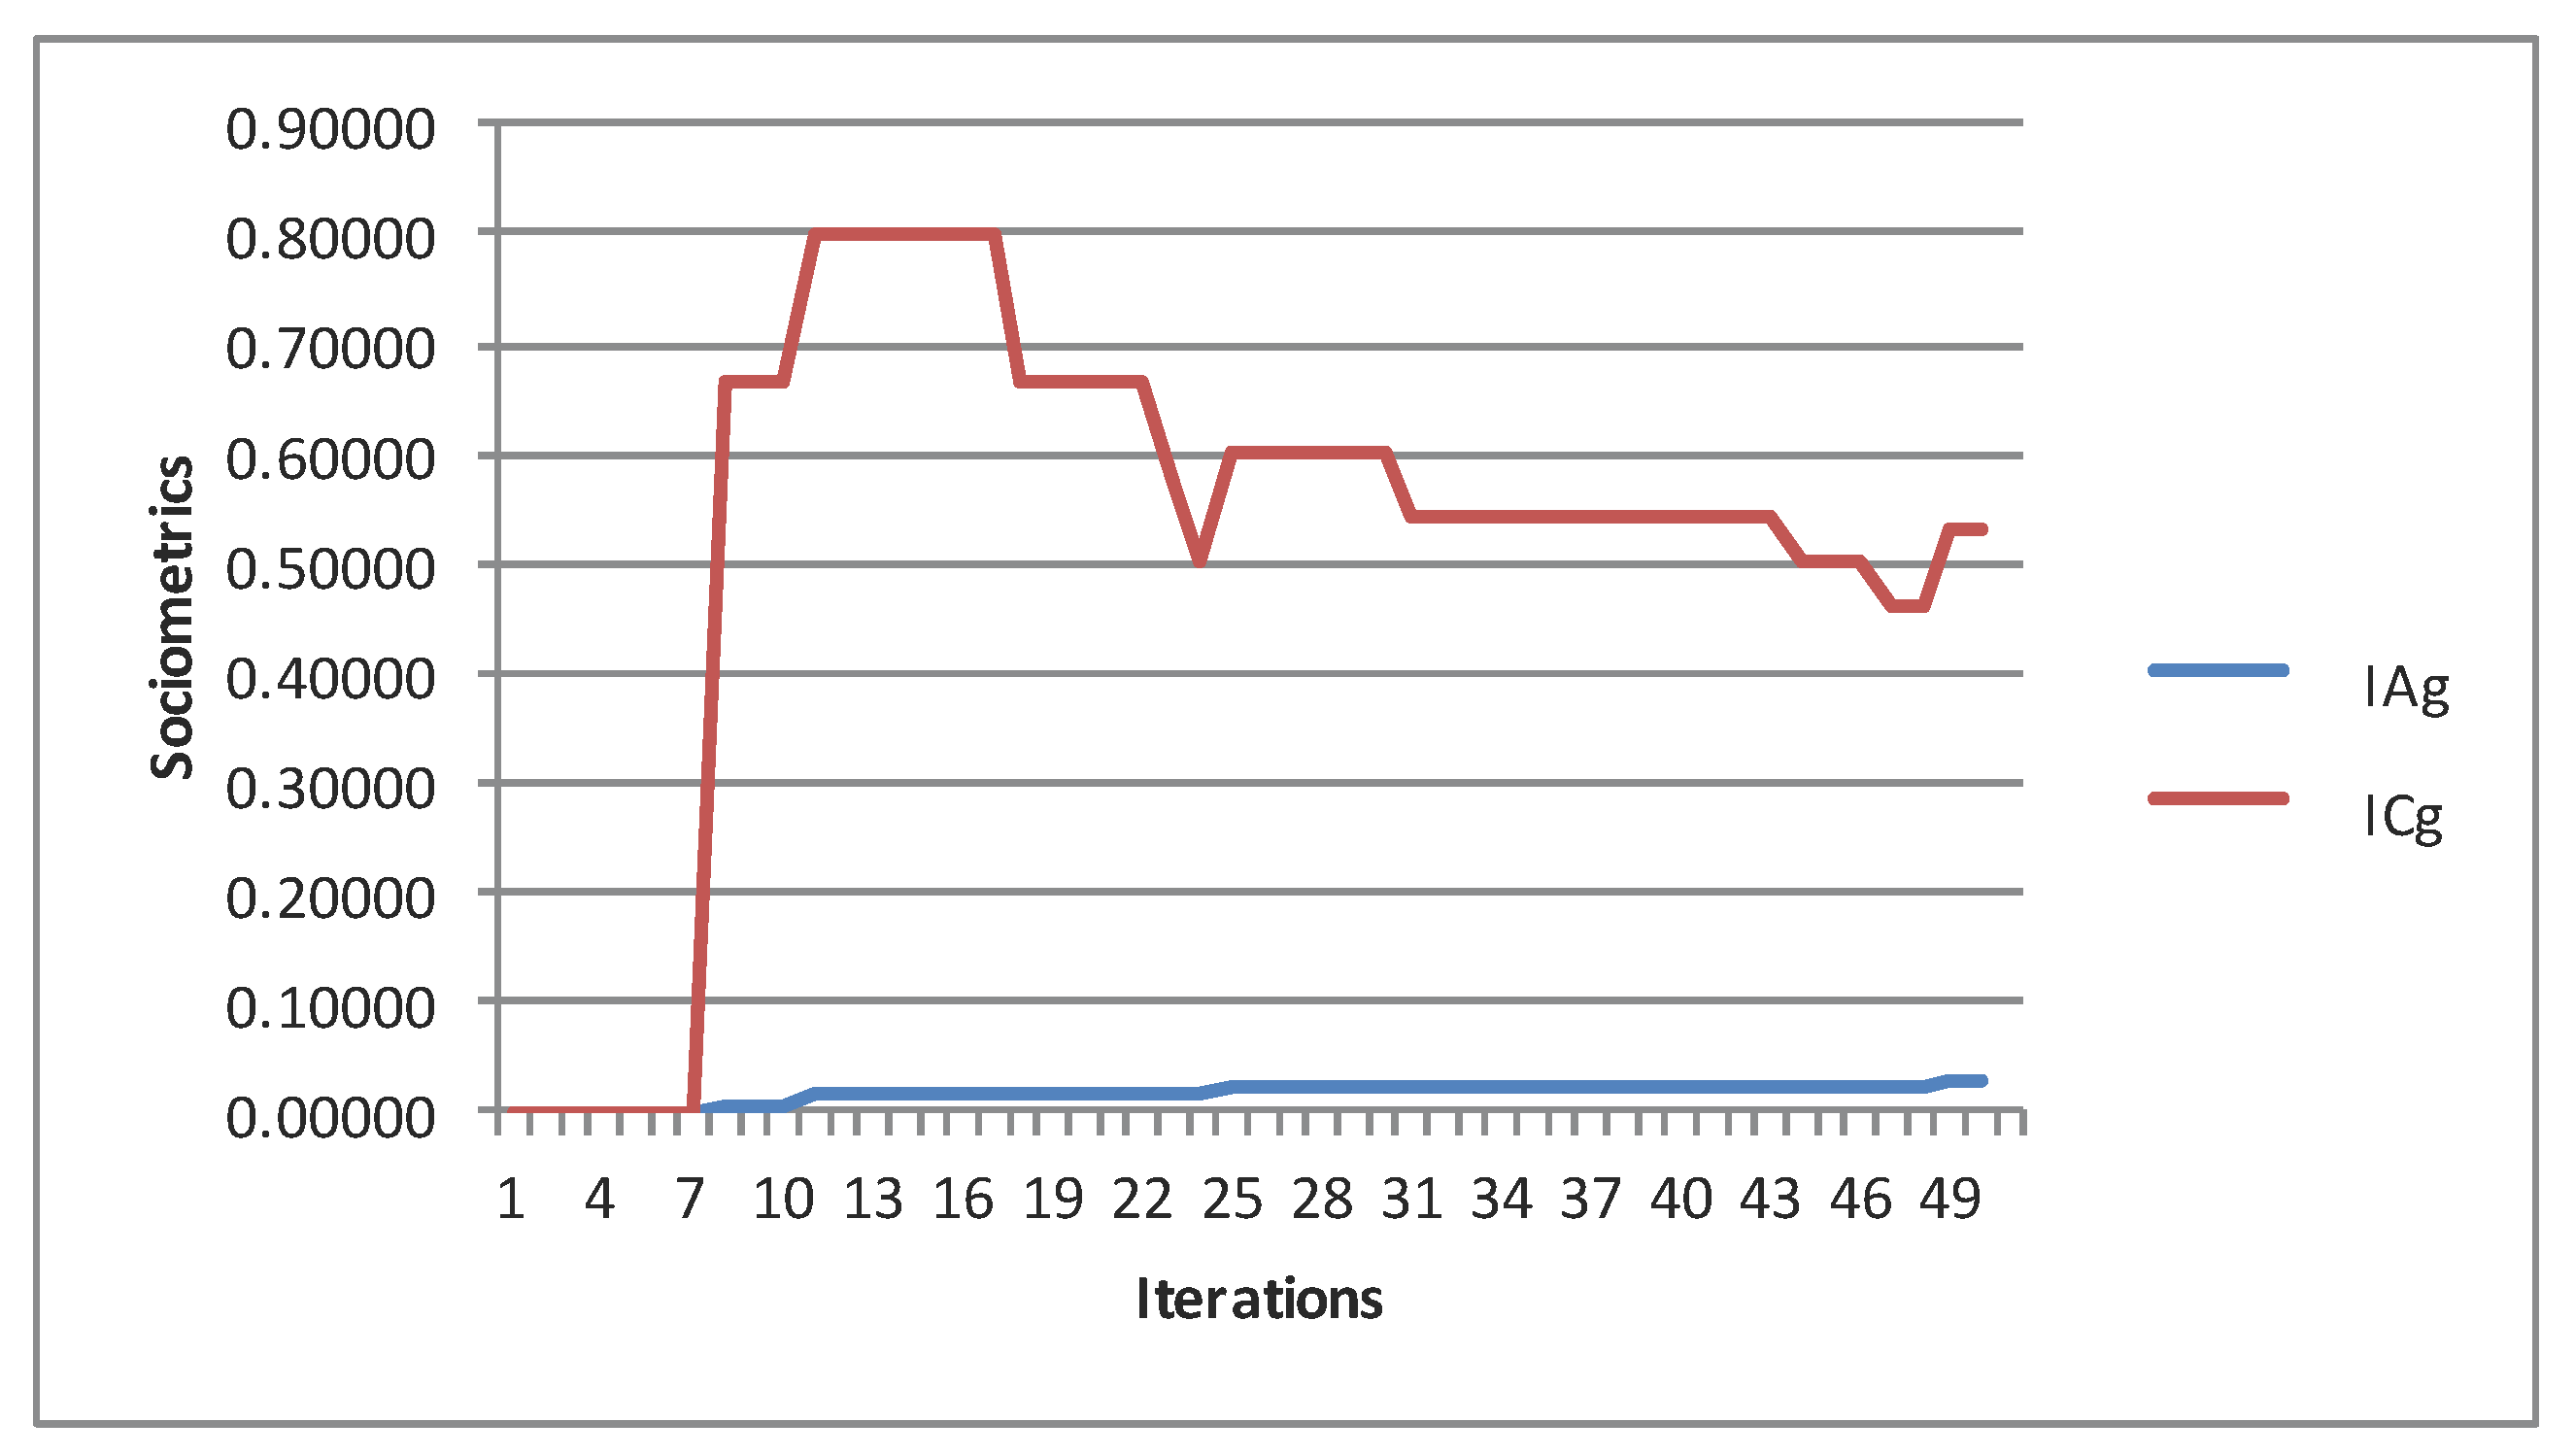
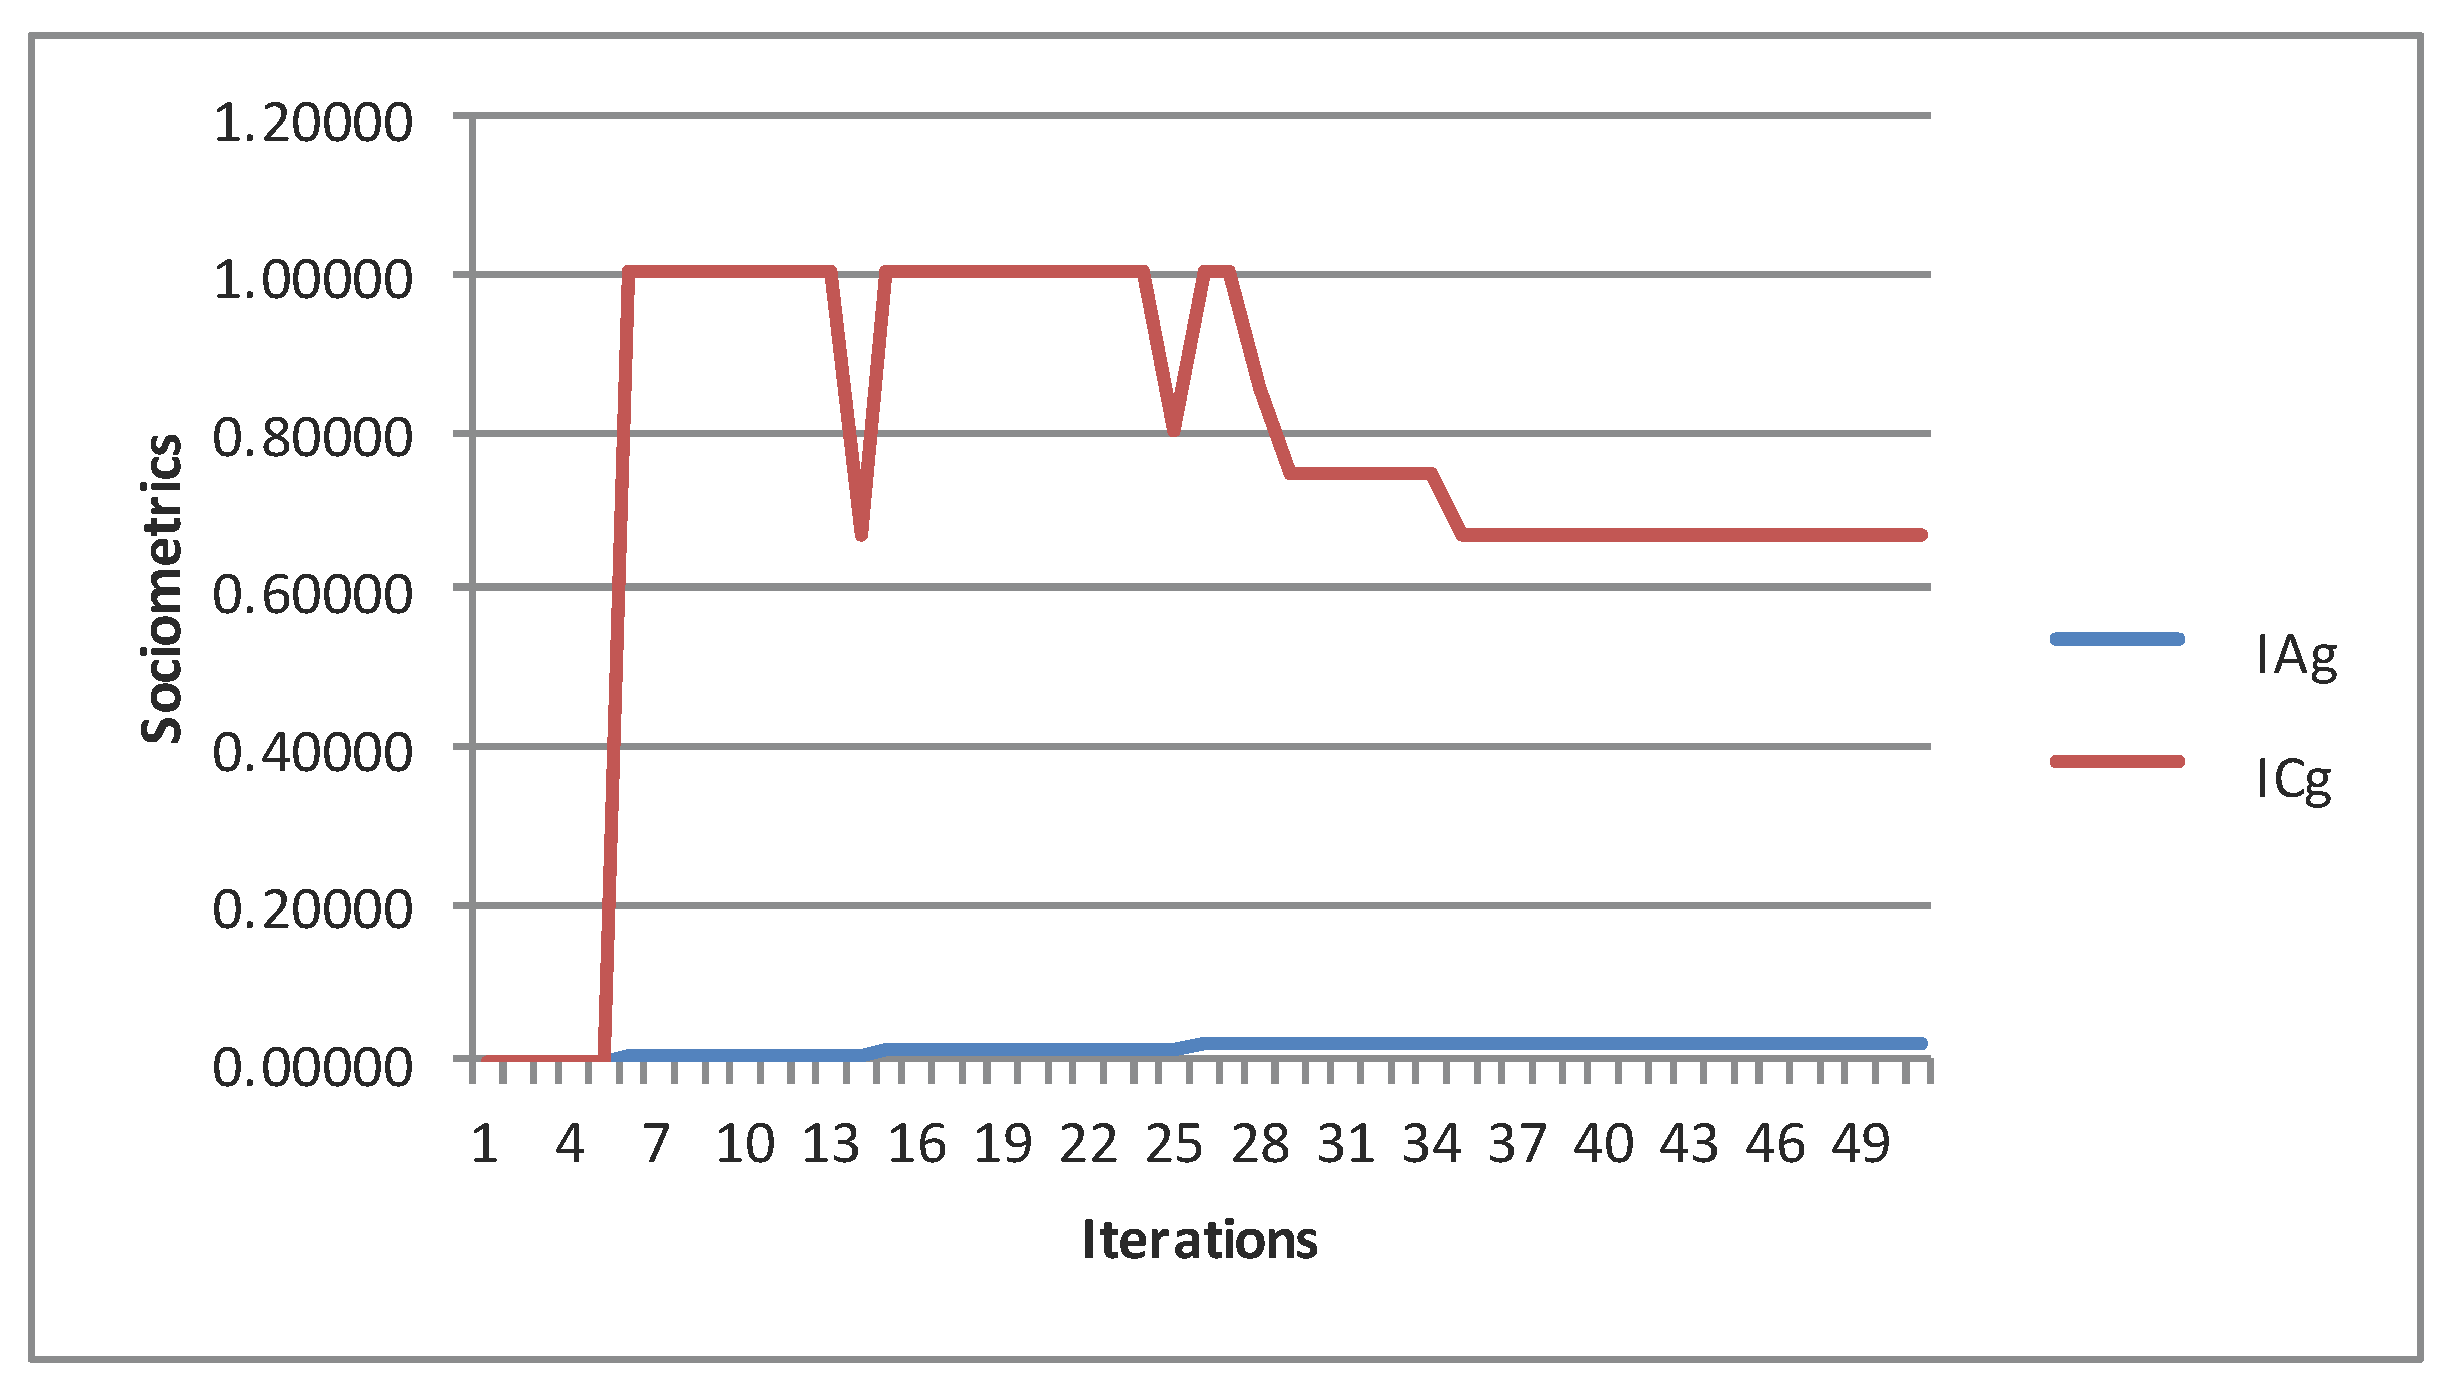
As an illustrative example of the temporal evolution of the sociometric status, Figure 9 contains the temporal evolution of IAg and ICg sociometrics of one of the executions for simulating the scenario of Barrasa and Gil. Figure 10 shows the temporal evolution of the sociometrics for a simulation in the scenario of Roberts. Figure 11 introduces the temporal evolution in the validation for the case of Dawson. As one can observe, the sociometrics relatively stabilized around certain values after some iterations.
In order to obtain a second validation, calibration and validation cases were interchanged. In this second phase of experimentation, ABS-SOCI was calibrated with the case of Barrasa and Gil and the case of Dawson, changing its constant values and matrices. Then, ABS-SOCI was executed and compared with the case of Roberts, which was not used in the calibration of this second experimental phase. The case of Roberts was selected for this validation instead of Barrasa and Gil because the results were more representative due to its larger number of students. In addition, the current work discarded the possibility of performing a validation with the scenario of Barrasa and Gil due to its small sample size, which yields a low sensitivity as shown in Table 3. Figure 12 shows the temporal evolution of sociometrics in one of the simulation executions in the validation of Roberts’ scenario.
ABS-SOCI was further assessed in a third experimental phase. The main difference of this experimentation from the previous ones is that the simulator departed from an existing sociogram that is not neutral. In particular, the initial sociogram had a cohesion of and a coherence of . The initial sociogram was extracted from a group of students of a Programming Course in the University of Zaragoza. This experimentation used the same calibration as in the previous experimental phase. The simulated outcomes were compared with the real outcomes after 20 class hours (represented with 20 simulation iterations).
Results of experimentation showed that the difference between the real value and the mean estimated values for all simulations ranged from 0.001 to 0.14. In addition to that, percentage of non-significant simulations, on both calibration and validation phases, were high (ranging from 87% to 100%). The sensitivity of analysis on IAg was low in the scenario of Barrasa and Gil, since the minimum effect size able to detect was large, probably due to the small sample size of this work. However, the sensitivity analysis was adequate in (1) the remaining indexes and scenarios of the calibration phases and (2) in the validation phases. This is so because the Hedges’ gs obtained on sensitivity analyses were small or medium. In addition, estimations obtained by ABS-SOCI appear to be relatively efficient, since, in both calibration and validation phases, a high percentage (ranging from 73% to 100%) of simulations had small or medium effect sizes. Thus, although it cannot be discarded, the possibility that the high percentage of non-significant analyses on the work of Barrasa and Gil was due to lack of statistical power, the high percentage of simulations with small or medium effect sizes provided evidence of a good performance. The performance was also good on the validation phases. This is supported by a high percentage of non-significant simulations, which cannot be attributed to a lack of statistical power, and a high percentage of simulations with small or medium effect sizes. The good performance found on validation phases was especially relevant because it discarded the possibility of over-fitting by performing simulations on a different sample in which the calibration was conducted. Furthermore, the experiments showed that the simulator obtained a high performance departing from both (a) neutral sociograms representing groups of students that did not know each other, and (b) an existing sociogram with different kinds of relations representing a group of students who already knew each other.
5. Conclusions
ABS-SOCI is a novel ABS that simulates the temporal evolution of sociograms of students starting from either a neutral state or an existing sociogram. The user has to determine the number of students in each category (quiet, participant, etc.) or to load the initial sociogram. ABS-SOCI considers the different affinities between types of students, the trends of the relationships among each pair of individuals in each specific time frame, and the duration of the relationships distinguishing between short-term and long-term ones. It also takes into account different levels of group sizes, and the coherence in relation to reciprocal relationships. The behaviors of the individual agents impersonating students rely on certain algorithms, constants and matrices. The emergent behavior has been tested with four real scenarios taken from either the literature or the experience of the authors. There were three experimental phases, in each of which the system was calibrated with some cases and was validated with a different one. In all of the experimental phases, the simulations of ABS-SOCI produced sociograms similar to the real ones according to the binomial tests. The sensitivity of the validations of these phases was adequate according to the Hedges’ g and the guidelines of Cohen.
As future work, it is planned to improve the current version of ABS-SOCI by evaluating an enlarged dataset of sociograms. This dataset will include new sociograms from higher education in the grades of (a) computer science engineering; (b) electronics and automation engineering; and (c) psychology. In the same group of students, the sociograms will be extracted in different stages of the academic course, in order to assess whether the simulated evolution is similar to the actual one considering more states than only the final one.
Moreover, the simulator can be extended to consider more specific features of students such as (1) their gender; (2) whether they need a job to pay their studies; (3) their missing knowledge; (4) their religious or sexual orientation; and (5) other psychological profiles. The simulator will sequentially incorporate these features, experiencing and analyzing the repercussion of each one independently. In this way, the future research will determine the utility of incorporating each feature in the current approach.
ABS-SOCI is also planned to be extended considering groups of students with a high ratio of international students. This simulator extension will represent information such as the mother-tongue language of each student and the language of the lessons. It will also distinguish between national and international students.
Acknowledgments
This work acknowledges the research project “Desarrollo Colaborativo de Soluciones AAL” with reference TIN2014-57028-R funded by the Spanish Ministry of Economy and Competitiveness. This work has been supported by the program “Estancias de movilidad en el extranjero José Castillejo para jóvenes doctores” funded by the Spanish Ministry of Education, Culture and Sport with reference CAS17/00005. We also acknowledge support from “Universidad de Zaragoza”, “Fundación Bancaria Ibercaja” and “Fundación CAI” in the “Programa Ibercaja-CAI de Estancias de Investigación” with reference IT24/16. It has also been supported by “Organismo Autónomo Programas Educativos Europeos” with reference 2013-1-CZ1-GRU06-14277. We also aknowledge support from project “Sensores vestibles y tecnología móvil como apoyo en la formación y práctica de mindfulness: prototipo previo aplicado a bienestar” funded by University of Zaragoza with grant number UZ2017-TEC-02. Furthermore, we acknowledge the “Fondo Social Europeo” and the “Departamento de Tecnología y Universidad del Gobierno de Aragón” for their joint support with grant number Ref-T81.
Author Contributions
All of the authors conceived and designed the experiments; all the authors proposed ideas for developing the simulator; Iván García-Magariño programmed the simulator; all the authors contributed in the analysis and interpretation of the data; and all the authors collaboratively wrote the paper coordinated by Iván García-Magariño. In addition, Inmaculada Plaza especially contributed in the definition of students’ behaviors. Andrés S. Lombas specially contributed in the statistical analysis and the inclusion of the theory and metrics about sociograms. Carlos Medrano specially contributed in the design of the experiments in several calibration-validation phases. Iván García-Magariño specially contributed in the agent-based modeling of the system and its implementation.
Conflicts of Interest
The authors declare no conflict of interest.
References
- Santos, S.J.D.; Hardman, C.M.; Barros, S.S.H.; Santos, C.D.F.B.F.; Barros, M.V.G.D. Association between physical activity, participation in Physical Education classes, and social isolation in adolescents. J. Pediatr. 2015, 91, 543–550. [Google Scholar]
- Nikolaou, D. Do anti-bullying policies deter in-school bullying victimization? Int. Rev. Law Econ. 2017, 50, 1–6. [Google Scholar] [CrossRef]
- Thiele, J.C.; Grimm, V. NetLogo meets R: Linking agent-based models with a toolbox for their analysis. Environ. Model. Softw. 2010, 25, 972–974. [Google Scholar] [CrossRef]
- Cicirelli, F.; Furfaro, A.; Giordano, A.; Nigro, L. HLA_ACTOR_REPAST: An approach to distributing RePast models for high-performance simulations. Simul. Model. Pract. Theory 2011, 19, 283–300. [Google Scholar] [CrossRef]
- Roberts, S. Using practitioner research to investigate the role of the teacher in encouraging student interaction within group work. Nurse Educ. Today 2008, 28, 85–92. [Google Scholar] [CrossRef] [PubMed]
- García-Magariño, I.; Plaza, I. FTS-SOCI: An agent-based framework for simulating teaching strategies with evolutions of sociograms. Simul. Model. Pract. Theory 2015, 57, 161–178. [Google Scholar] [CrossRef]
- García-Magariño, I.; Medrano, C.; Lombas, A.S.; Barrasa, A. A hybrid approach with agent-based simulation and clustering for sociograms. Inf. Sci. 2016, 345, 81–95. [Google Scholar] [CrossRef]
- Drahota, A.; Dewey, A. The sociogram: A useful tool in the analysis of focus groups. Nurs. Res. 2008, 57, 293–297. [Google Scholar] [CrossRef] [PubMed]
- Grund, T.U. Network structure and team performance: The case of English Premier League soccer teams. Soc. Netw. 2012, 34, 682–690. [Google Scholar] [CrossRef]
- Lin, J.W.; Lai, Y.C. Online formative assessments with social network awareness. Comput. Educ. 2013, 66, 40–53. [Google Scholar] [CrossRef]
- Sweet, T.M.; Zheng, Q. A mixed membership model-based measure for subgroup integration in social networks. Soc. Netw. 2017, 48, 169–180. [Google Scholar] [CrossRef]
- Barrasa, A.; Gil, F. A software application for the calculus and representation of sociometric indexes and values (In Spanish Un programa informático para el cálculo y la representación de índices y valores sociométricos). Psicothema 2004, 16, 329–335. [Google Scholar]
- Dombrovskis, V.; Guseva, S.; Capulis, S. Cooperation and Learning Effectiveness of First Graders during Sports Lessons. Procedia Soc. Behav. Sci. 2014, 112, 124–132. [Google Scholar] [CrossRef]
- Yu, Z.; Dongsheng, C.; Wen, W. The heterogeneous effects of ability grouping on national college entrance exam performance—Evidence from a large city in China. Int. J. Educ. Dev. 2014, 39, 80–91. [Google Scholar] [CrossRef]
- Chen, R.C.; Chen, S.Y.; Fan, J.Y.; Chen, Y.T. Grouping Partners for Cooperative Learning Using Genetic Algorithm and Social Network Analysis. Procedia Eng. 2012, 29, 3888–3893. [Google Scholar] [CrossRef]
- Arentze, T.A.; Kowald, M.; Axhausen, K.W. An agent-based random-utility-maximization model to generate social networks with transitivity in geographic space. Soc. Netw. 2013, 35, 451–459. [Google Scholar] [CrossRef]
- Hassan, S.; Salgado, M.; Pavón, J. Friendship dynamics: Modelling social relationships through a fuzzy agent-based simulation. Discret. Dyn. Nat. Soc. 2011, 2, 118–124. [Google Scholar] [CrossRef]
- Dobson, M.; Pengelly, M.; Sime, J.A.; Albaladejo, S.; Garcia, E.; Gonzales, F.; Maseda, J. Situated learning with co-operative agent simulations in team training. Comput. Hum. Behav. 2001, 17, 547–573. [Google Scholar] [CrossRef]
- McHardy, P.; Vershinina, N.A. The role of autocatalysis in learner’s networks. Int. J. Manag. Educ. 2014, 12, 271–282. [Google Scholar] [CrossRef]
- García-Magariño, I.; Palacios-Navarro, G. ATABS: A technique for automatically training agent-based simulators. Simul. Model. Pract. Theory 2016, 66, 174–192. [Google Scholar] [CrossRef]
- García-Magariño, I.; Lombas, A.S.; Plaza, I.; Medrano, C. Source Code of the Agent-Based Simulator of Student Sociograms Called ABS-SOCI, version 1; Mendeley Data; Mendeley: London, UK, 2017; Available online: http://dx.doi.org/10.17632/ffy73gfkzc.1 (accessed on 20 September 2017).
- DeGenaro, J.J. Condensing the Student Profile. Acad. Ther. 1988, 23, 293–296. [Google Scholar] [CrossRef]
- Leinhardt, S. Developmental change in the sentiment structure of children’s groups. Am. Sociol. Rev. 1972, 37, 202–212. [Google Scholar] [CrossRef]
- Goldstone, S.; Boardman, W.K.; Lhamon, W.T.; Fason, F.L.; Jernigan, C. Sociometric status and apparent duration. J. Soc. Psychol. 1963, 61, 303–310. [Google Scholar] [CrossRef] [PubMed]
- Engel, A.; Coll, C.; Bustos, A. Distributed Teaching Presence and communicative patterns in asynchronous learning: Name versus reply networks. Comput. Educ. 2013, 60, 184–196. [Google Scholar] [CrossRef]
- Davis, J.A. Sociometric triads as multi-variate systems. J. Math. Soc. 1977, 5, 41–59. [Google Scholar] [CrossRef]
- Gomez-Sanz, J.J.; Fuentes, R.; Pavón, J.; García-Magariño, I. INGENIAS development kit: A visual multi-agent system development environment. In Proceedings of the 7th International Joint Conference on Autonomous Agents and Multiagent Systems: Demo Papers, Estoril, Portugal, 12–16 May 2008; International Foundation for Autonomous Agents and Multiagent Systems: Richland, DC, USA, 2008; pp. 1675–1676. [Google Scholar]
- García-Magariño, I.; Gómez-Rodríguez, A.; González-Moreno, J.C.; Palacios-Navarro, G. PEABS: A process for developing efficient agent-based simulators. Eng. Appl. Artif. Intell. 2015, 46, 104–112. [Google Scholar] [CrossRef]
- García-Magariño, I.; Palacios-Navarro, G.; Lacuesta, R. TABSAOND: A technique for developing agent-based simulation apps and online tools with nondeterministic decisions. Simul. Model. Pract. Theory 2017, 77, 84–107. [Google Scholar] [CrossRef]
- Dawson, S. ‘Seeing’ the learning community: An exploration of the development of a resource for monitoring online student networking. Br. J. Educ. Technol. 2010, 41, 736–752. [Google Scholar] [CrossRef]
- Fehler, M.; Klügl, F.; Puppe, F. Techniques for analysis and calibration of multi-agent simulations. In Engineering Societies in the Agents World V; Lecture Notes Computer Science; Springer: Berlin, Germany, 2005; Volume 3451, pp. 305–321. [Google Scholar]
- Cohen, J. Statistical Power Analysis for the Behavioral Sciences, 2nd ed.; Lawrence Erlbaum Associates: Hillsdale, NJ, USA, 1988. [Google Scholar]
- Faul, F.; Erdfelder, E.; Lang, A.G.; Buchner, A. G* Power 3: A flexible statistical power analysis program for the social, behavioral, and biomedical sciences. Behav. Res. Methods 2007, 39, 175–191. [Google Scholar] [CrossRef] [PubMed]
Figure 1.
Frame for showing the graphical evolution of sociograms.

Figure 2.
Main frame of the user interface (UI) of the Agent-Based Simulator of Student Sociograms (ABS-SOCI).
Figure 2.
Main frame of the user interface (UI) of the Agent-Based Simulator of Student Sociograms (ABS-SOCI).
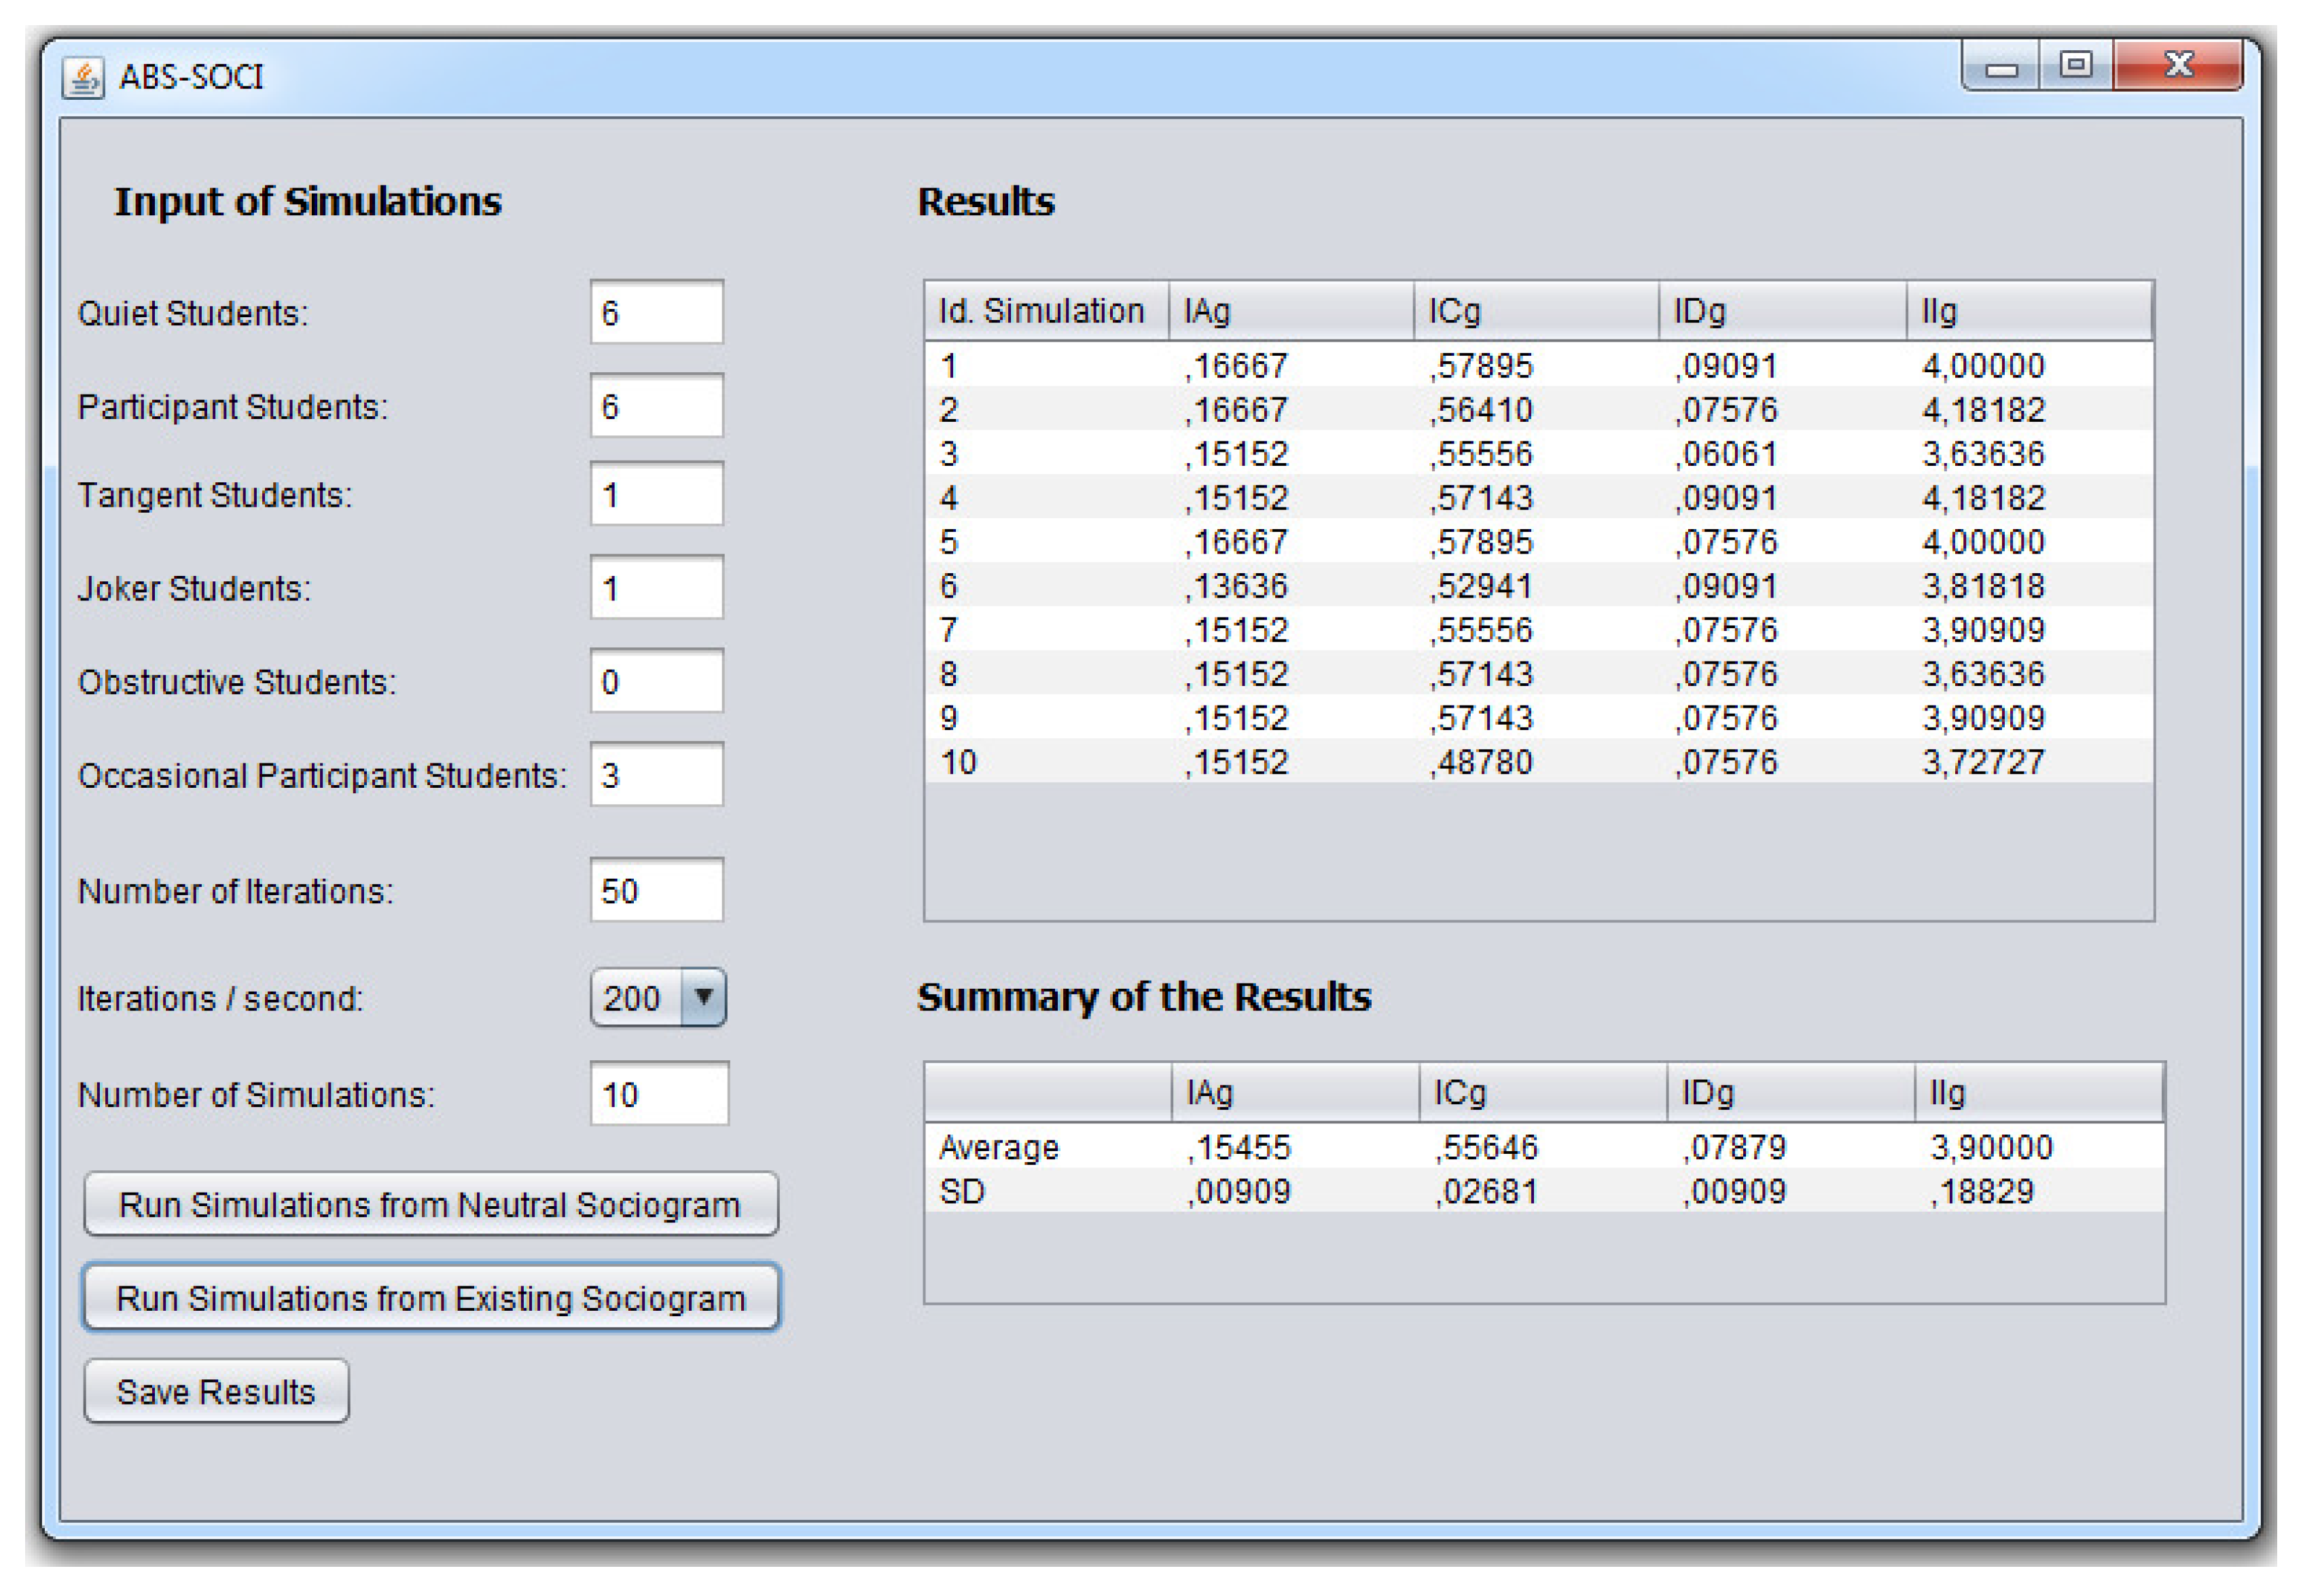
Figure 3.
Initial sociogram represented with a text file.

Figure 4.
Main symbols of the Ingenias notation.

Figure 5.
Definition of the roles and agents of ABS-SOCI.

Figure 6.
Dataflow diagram for updating the trend.

Figure 7.
Dataflow diagram for updating the relationships according to their trends.

Figure 8.
Charts about Suitable (in the left) and Unsuitable (in the right) matrices for large groups (i.e., size ≥9).
Figure 8.
Charts about Suitable (in the left) and Unsuitable (in the right) matrices for large groups (i.e., size ≥9).

Figure 9.
Temporal evolution of the Index of Association of a group (IAg) and the Index of Coherence of a group (ICg) sociometrics in a simulation execution for the scenario of Barrasa and Gil [12].
Figure 9.
Temporal evolution of the Index of Association of a group (IAg) and the Index of Coherence of a group (ICg) sociometrics in a simulation execution for the scenario of Barrasa and Gil [12].
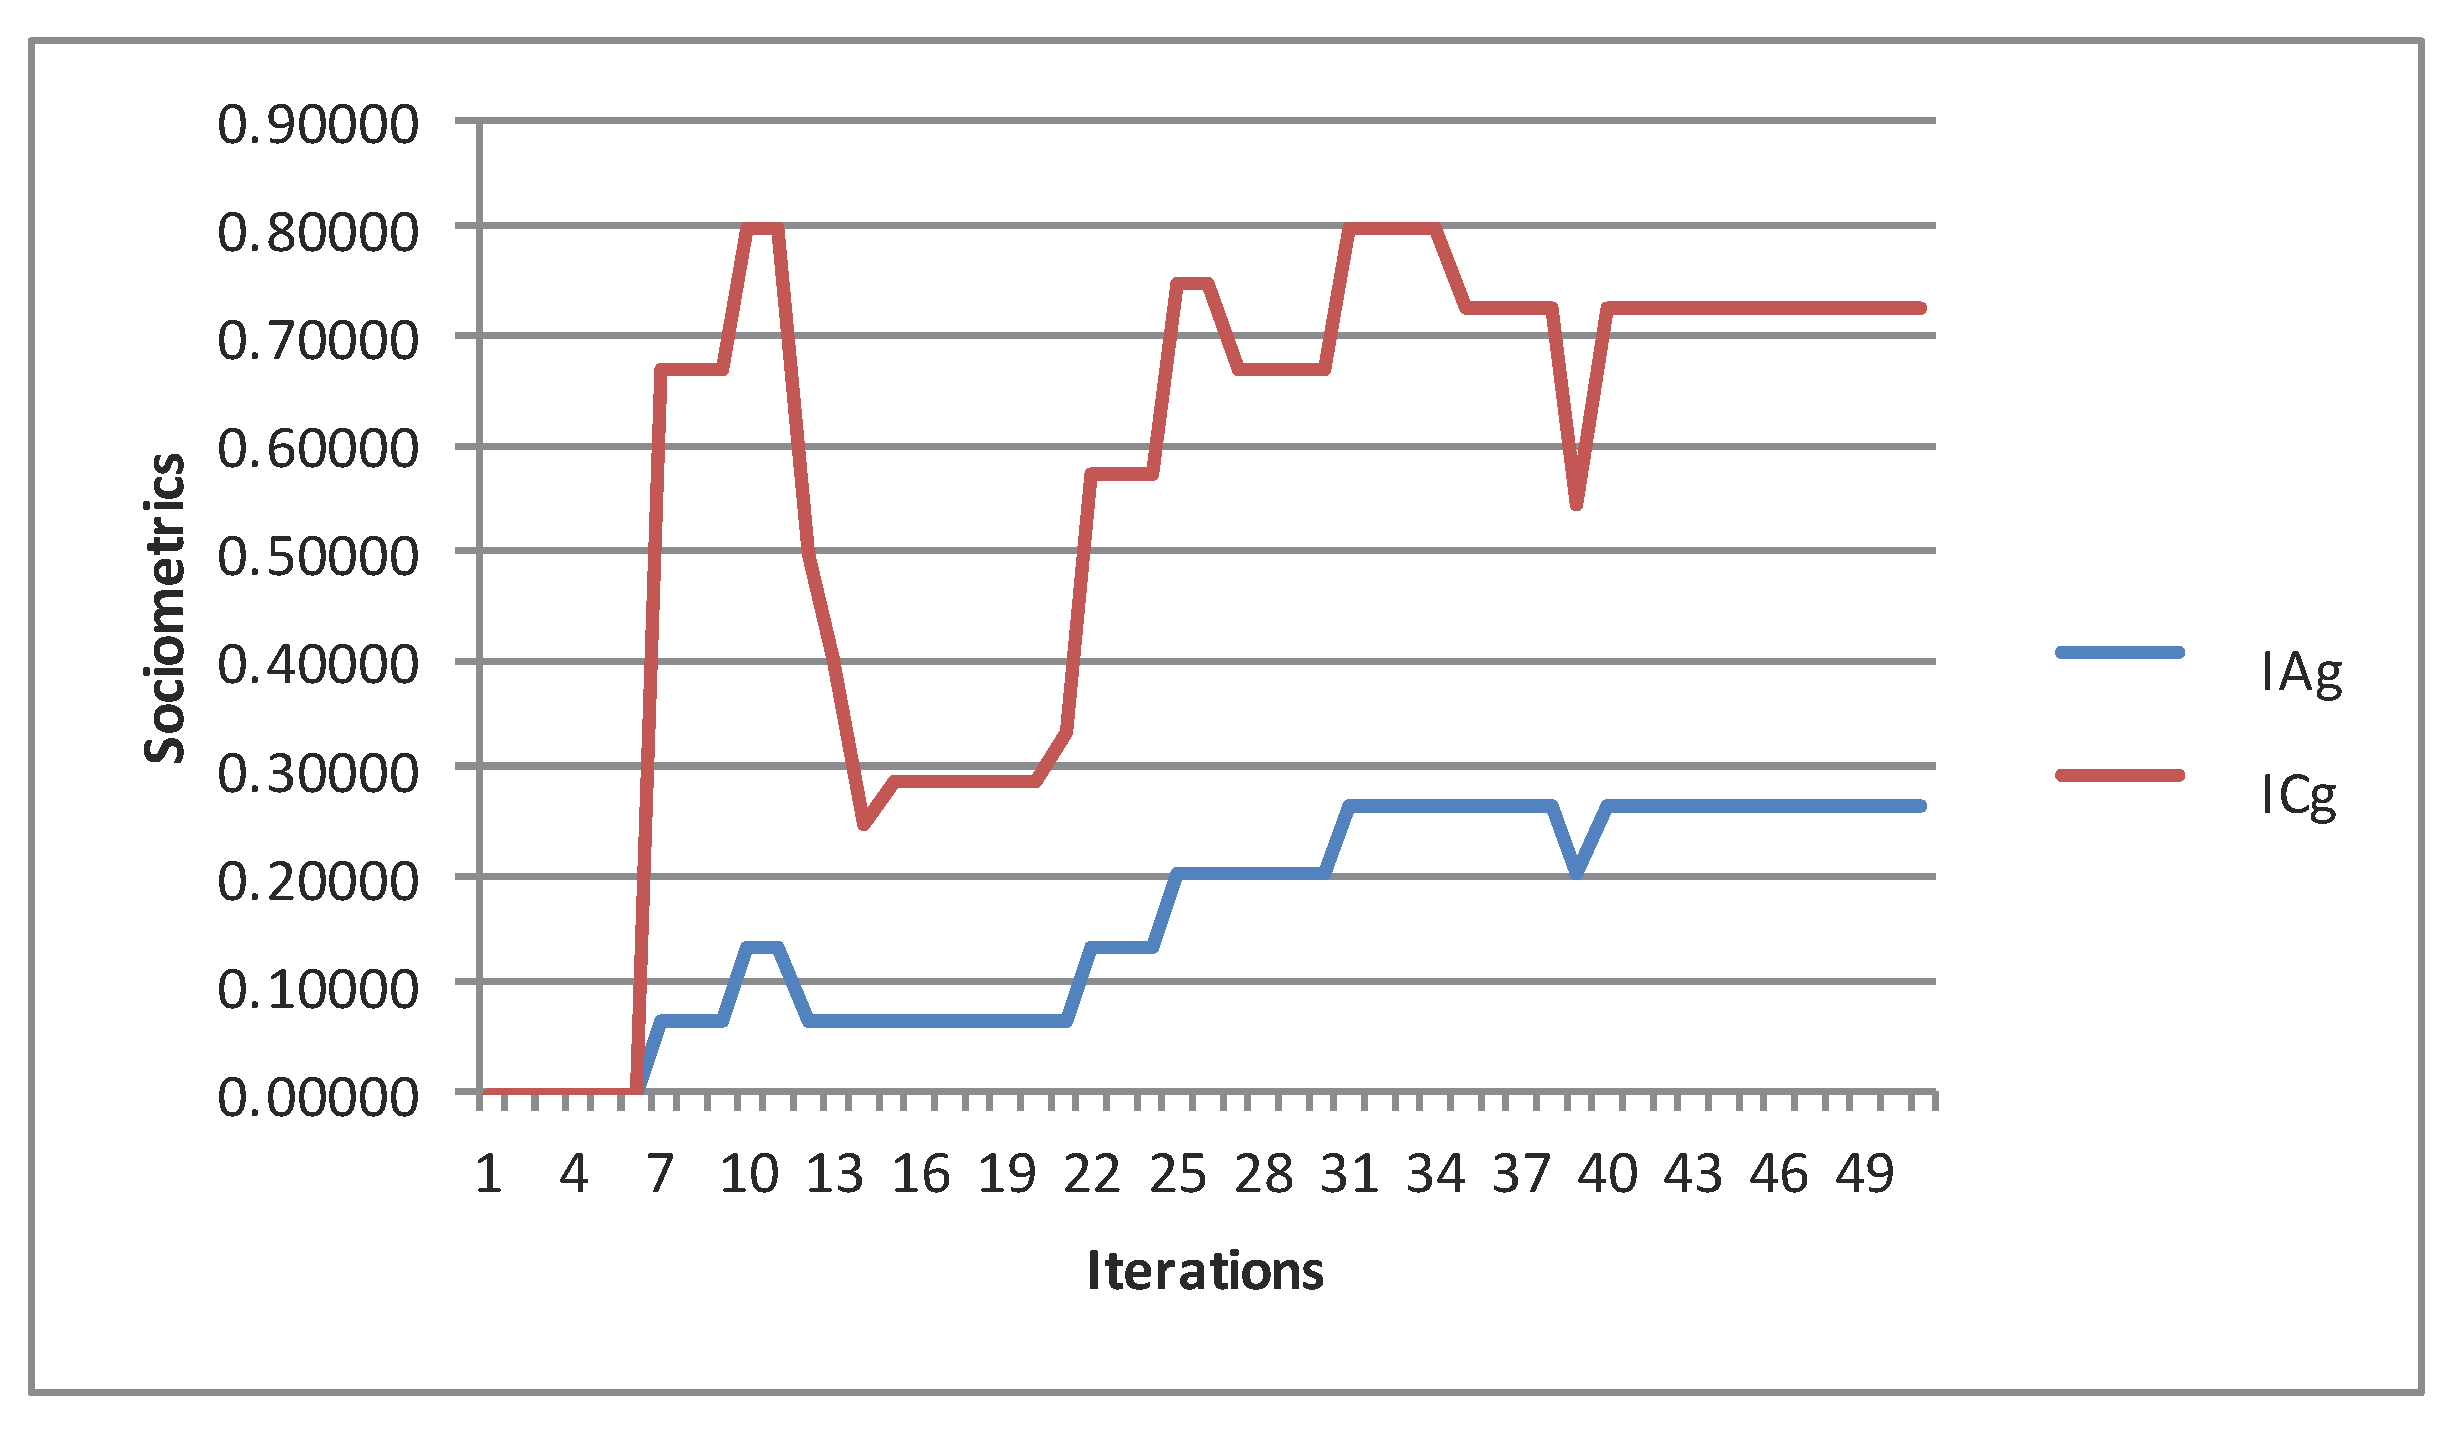
Figure 10.
Temporal evolution of IAg and ICg sociometrics in a simulation execution for the scenario of Roberts [5].
Figure 10.
Temporal evolution of IAg and ICg sociometrics in a simulation execution for the scenario of Roberts [5].

Figure 11.
Temporal evolution of IAg and ICg sociometrics in a simulation execution for the scenario of Dawson [30].
Figure 11.
Temporal evolution of IAg and ICg sociometrics in a simulation execution for the scenario of Dawson [30].
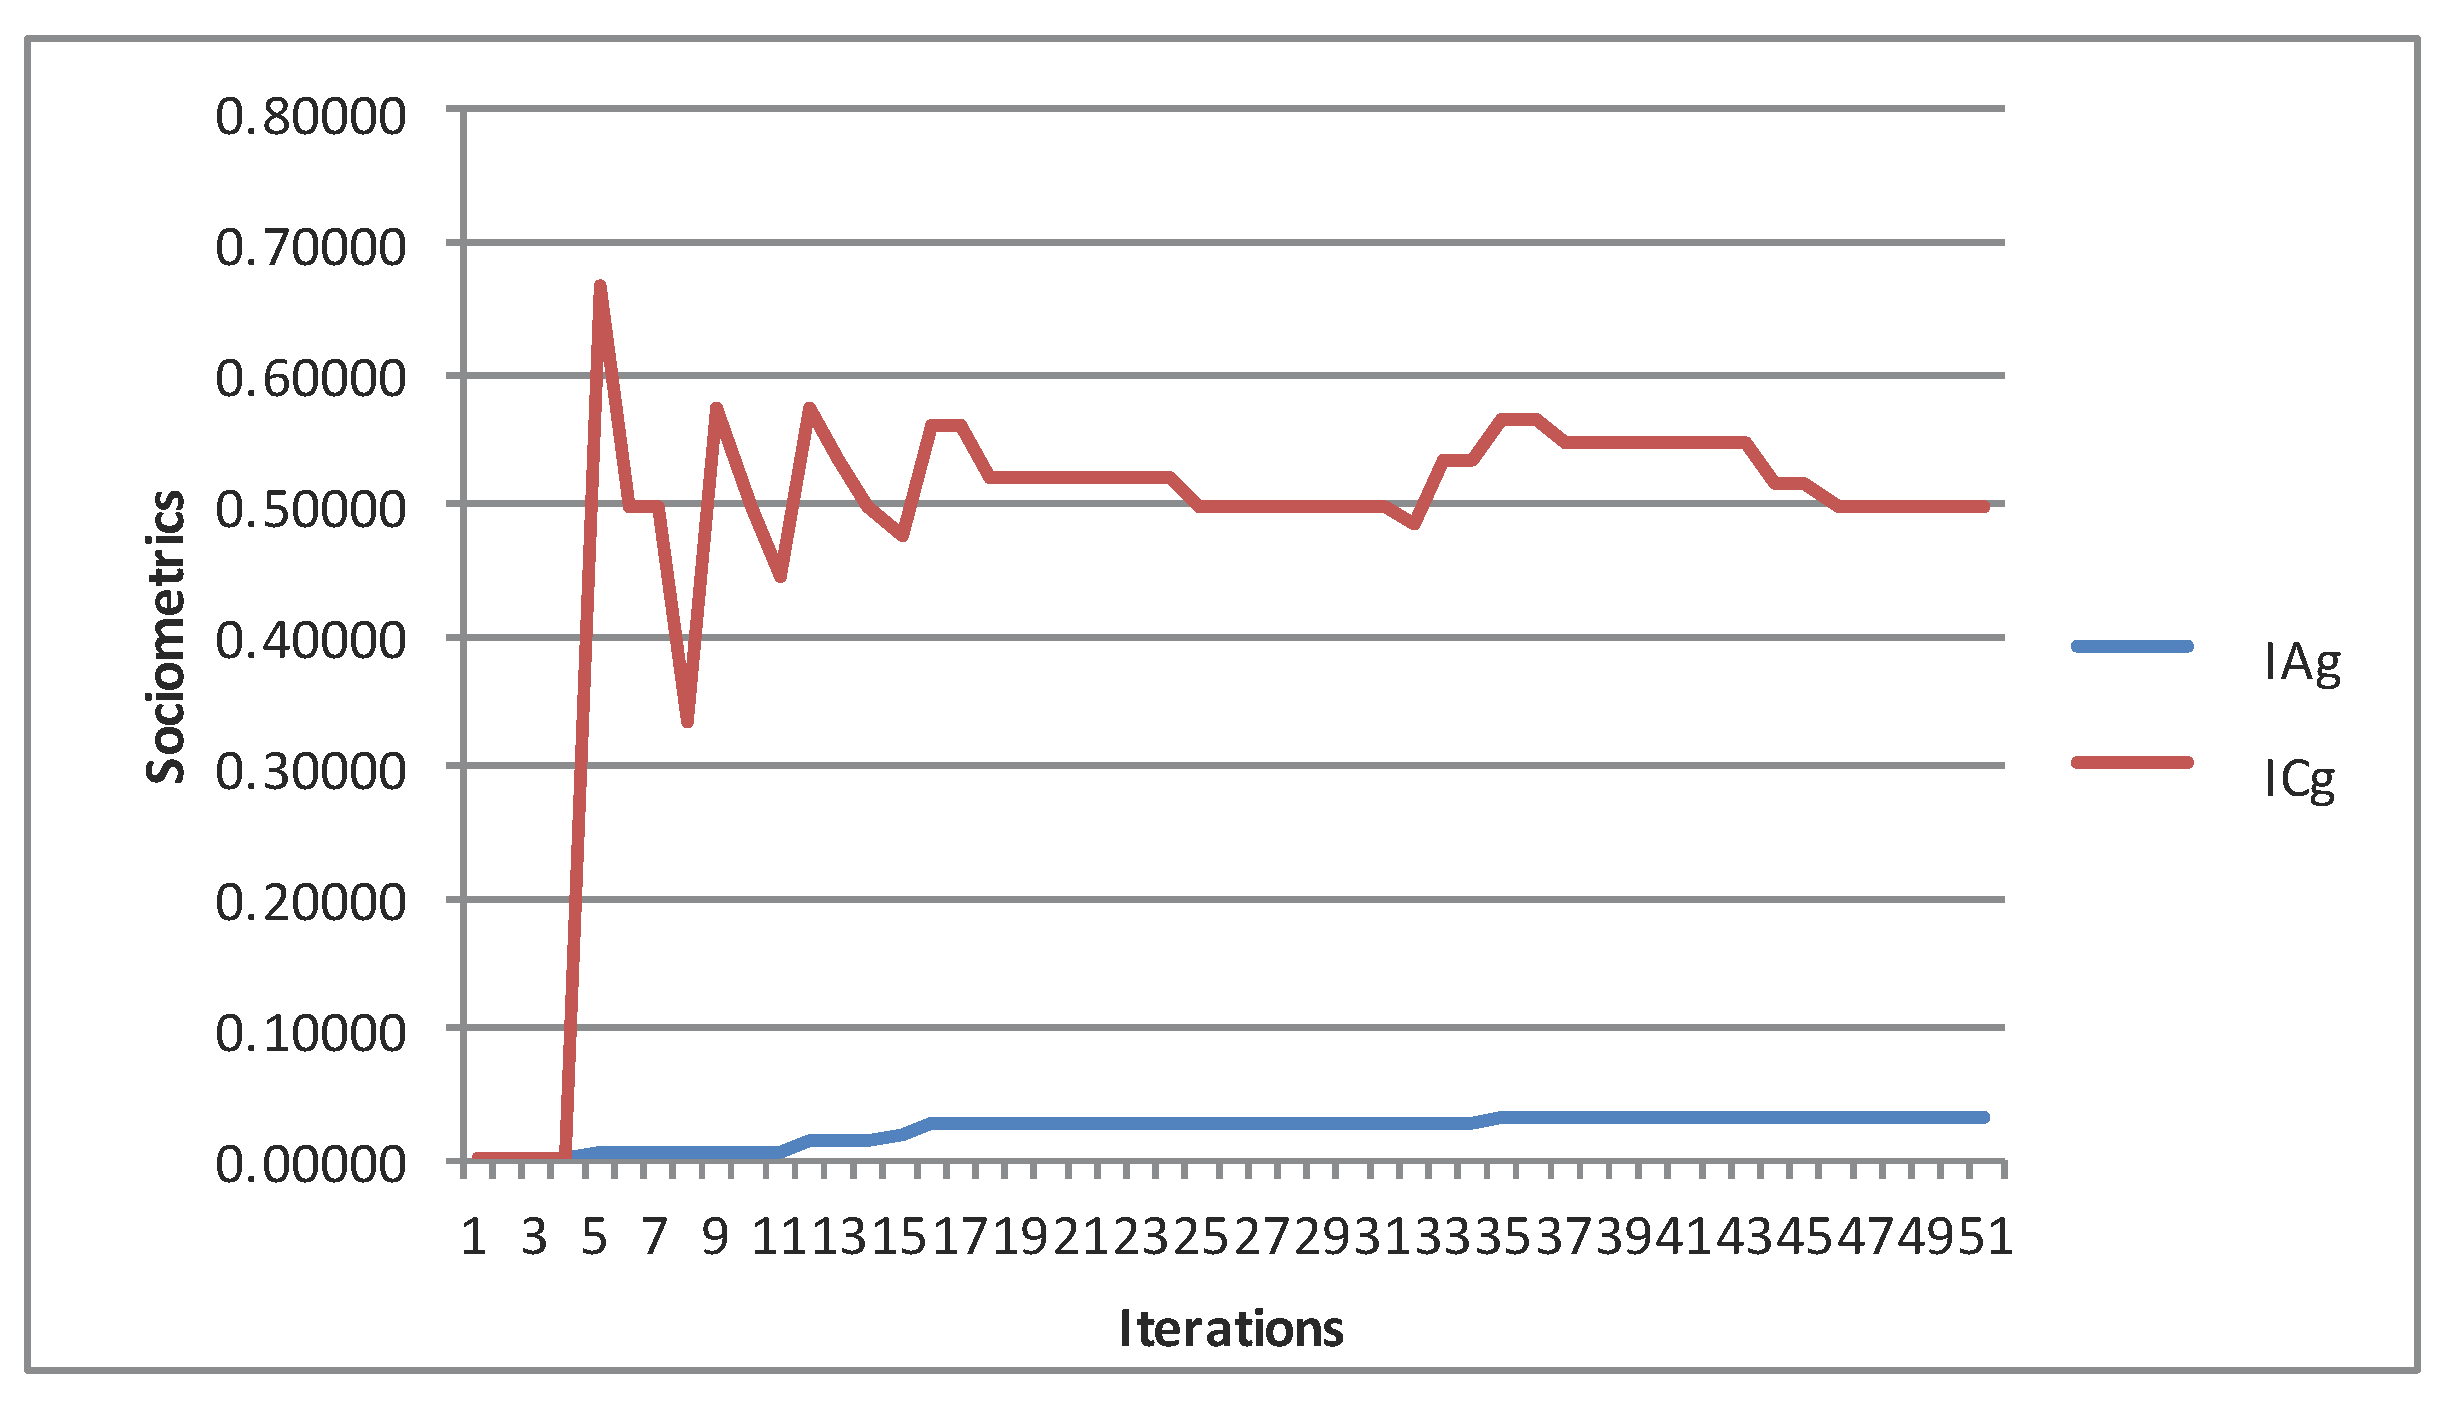
Figure 12.
Temporal evolution of sociometrics in the scenario of Roberts [5] in the second validation experimentation, in which this scenario was not used in the training process.
Figure 12.
Temporal evolution of sociometrics in the scenario of Roberts [5] in the second validation experimentation, in which this scenario was not used in the training process.

Table 1.
Values of constants after the calibration process.
| Size ≤8 | Size ≥9 | |
|---|---|---|
| 10.0 | 10.0 | |
| 0.50 | 0.33 |
Table 2.
Input parameters of the simulator for the different scenarios.
| Barrasa and Gil [12] | Roberts [5] | Dawson [30] | Programming Course | |
|---|---|---|---|---|
| Initial Sociogram | Neutral | Neutral | Neutral | Existing |
| Total Number of Students | 6 | 15 | 24 | 12 |
| Quiet Students | 1 | 6 | 0 | 3 |
| Participant Students | 1 | 6 | 24 | 3 |
| Tangent Students | 1 | 1 | 0 | 0 |
| Joker Students | 1 | 1 | 0 | 1 |
| Obstructive Students | 1 | 0 | 0 | 0 |
| Occasional Students | 1 | 3 | 0 | 5 |
| Number of Iterations | 50 | 50 | 50 | 20 |
Table 3.
Real and simulated values, percentages of non-significant simulations and of simulations with small, medium and large effect size, and Hedges’ g obtained in sensitivity analysis for the Index of Association of a group (IAg) and the Index of Coherence of a group (ICg) in calibration and validation studies. Note: n = sample size of calibration and validation studies.
| Index | n | Real Value | Mean of Simulated Values (SD) | Non-Significant Simulations Based on Binomial Test (%) | Hedges’ g Obtained in Sensitivity Analysis | Effect Size of Simulation | ||
|---|---|---|---|---|---|---|---|---|
| Small (%) | Medium (%) | Large (%) | ||||||
| First experimental phase | ||||||||
| Calibration with Barrasa and Gil [12] | ||||||||
| IAg | 6 | 0.2667 | 0.2353 (0.1099) | 100 | 0.73 | 57 | 33 | 10 |
| ICg | 6 | 0.6667 | 0.6346 (0.1872) | 100 | 0.33 | 44 | 38 | 18 |
| Calibration with Roberts [5] | ||||||||
| IAg | 17 | 0.0368 | 0.0196 (0.0101) | 100 | 0.39 | 82 | 18 | 0 |
| ICg | 17 | 0.5556 | 0.4840 (0.2168) | 87 | 0.43 | 35 | 38 | 27 |
| Validation with Dawson [30] | ||||||||
| IAg | 24 | 0.0688 | 0.0372 (0.0114) | 100 | 0.33 | 84 | 16 | 0 |
| ICg | 24 | 0.6441 | 0.5016 (0.1055) | 93 | 0.35 | 29 | 61 | 10 |
| Second experimental phase | ||||||||
| Calibration with Barrasa and Gil [12] | ||||||||
| IAg | 6 | 0.2667 | 0.2273 (0.1003) | 100 | 0.73 | 58 | 28 | 14 |
| ICg | 6 | 0.6667 | 0.6009 (0.1818) | 96 | 0.33 | 65 | 28 | 7 |
| Calibration with Dawson [30] | ||||||||
| IAg | 24 | 0.0688 | 0.0705 (0.0157) | 100 | 0.33 | 99 | 1 | 0 |
| ICg | 24 | 0.6441 | 0.5882 (0.0725) | 99 | 0.35 | 77 | 22 | 1 |
| Validation with Roberts [5] | ||||||||
| IAg | 17 | 0.0368 | 0.0276 (0.0126) | 90 | 0.39 | 90 | 10 | 0 |
| ICg | 17 | 0.5556 | 0.5585 (0.1691) | 99 | 0.43 | 49 | 33 | 18 |
| Third experimental phase (with the same calibration as in the previous phase) | ||||||||
| Validation with the Programming Course | ||||||||
| IAg | 12 | 0.1667 | 0.1461 (0.0118) | 100 | 0.41 | 99 | 1 | 0 |
| ICg | 12 | 0.6111 | 0.5539 (0.0324) | 99 | 0.32 | 96 | 4 | 0 |
© 2017 by the authors. Licensee MDPI, Basel, Switzerland. This article is an open access article distributed under the terms and conditions of the Creative Commons Attribution (CC BY) license (http://creativecommons.org/licenses/by/4.0/).
Share and Cite
MDPI and ACS Style
García-Magariño, I.; Lombas, A.S.; Plaza, I.; Medrano, C. ABS-SOCI: An Agent-Based Simulator of Student Sociograms. Appl. Sci. 2017, 7, 1126. https://doi.org/10.3390/app7111126
AMA Style
García-Magariño I, Lombas AS, Plaza I, Medrano C. ABS-SOCI: An Agent-Based Simulator of Student Sociograms. Applied Sciences. 2017; 7(11):1126. https://doi.org/10.3390/app7111126
Chicago/Turabian StyleGarcía-Magariño, Iván, Andrés S. Lombas, Inmaculada Plaza, and Carlos Medrano. 2017. "ABS-SOCI: An Agent-Based Simulator of Student Sociograms" Applied Sciences 7, no. 11: 1126. https://doi.org/10.3390/app7111126
Note that from the first issue of 2016, this journal uses article numbers instead of page numbers. See further details here.