Article

Polyvinyl Alcohol/Lithospermum Erythrorhizon Nanofibrous Membrane: Characterizations, In Vitro Drug Release, and Cell Viability

1
Innovation Platform of Intelligent and Energy-Saving Textiles, School of Textiles, Tianjin Polytechnic University, Tianjin 300387, China
2
Graduate Institute of Biotechnology and Biomedical Engineering, Central Taiwan University of Science and Technology, Taichung 40601, Taiwan
3
Department of Chemistry and Chemical Engineering, Minjiang University, Fuzhou 350108, China
4
Laboratory of Fiber Application and Manufacturing, Department of Fiber and Composite Materials, Feng Chia University, Taichung 40768, Taiwan
5
Department of Biomedical Imaging and Radiological Science, China Medical University, Taichung 40402, Taiwan
6
School of Chinese Medicine, China Medical University, Taichung 40402, Taiwan
7
Department of Fashion Design, Asia University, Taichung 41354, Taiwan
*
Author to whom correspondence should be addressed.
Appl. Sci. 2017, 7(11), 1143; https://doi.org/10.3390/app7111143
Submission received: 6 October 2017 / Accepted: 2 November 2017 / Published: 6 November 2017
(This article belongs to the Section Chemical and Molecular Sciences)

Abstract

:
This study proposes an optimization process of the Lithospermum erythrorhizon (LE) extraction with a higher purity of shikonin (SK). The influence of extraction temperature on the concentration of SK is examined, and an in vitro cell viability assay is used to examine the optimal concentration of SK. Afterwards, polyvinyl alcohol (PVA)/LE solutions at ratios of 90/10, 80/20, and 70/30 w/w are electrospun into LE electrospun nanofibrous membranes (LENMs). The optimal manufacture parameters of LENMs are evaluated based on the test results of in vitro drug release test and cell viability assay. The optimal concentration occurs when the extraction temperature is −10 °C. The purity of the LE extract reaches 53.8% and the concentration of SK is 1.07 mg/mL. Moreover, the cell viability of nanofibrous membranes significantly increases to 136.8% when 0.7 μM SK is used. The diameter of nanofibers of LENM is decreased by 43.9% when the ratio of PVA solution to LE extract is 70/30 (w/w). 80/20 (w/w) LENM has the maximum amount of drug release of 79% for a continuous period of 48 h. In particular, 90/10 (w/w) LENM can create the maximum cell proliferation of 157.5% in a 24-h in vitro cell viability assay. This suggests that LENM has great potential to be used in facilitating tissue regeneration and wound healing.

Graphical Abstract

1. Introduction

Natural products have been paid much attention and studied in medicine due to their good biological properties, good pharmacological activities, and low toxicity. Shikonin (SK) is an effectively component obtained by constituently purifying the roots of a Chinese medicinal herb, Lithospermum erythrorhixon (LE) [1]. As the roots of LE have hard tissue, extracting useful natural products from them is difficult. The extraction of LE at a high temperature for a long time helps to increase the penetrability and solubility of the solvent, and thus obtains a high yield of effective extract [2,3]. However, it is inevitable for this process to trigger chemical changes or undermine the biological activity of the extract of plants with a low heat tolerance. In addition, high heat also requires a greater consumption of energy and has a low economical efficacy [4]. This study aims to optimize the LE extraction process, since the pharmacological activity of the extract depends on the concentration of SK. SK and its derivatives are helpful in tissue regeneration and wound healing [5], as well as antitumor [6], anti-inflammatory [7], anti-allergic [8], and antibacterial activities [9]. Due to these good intrinsic properties, SK has been commonly used in treatments for internal and external wounds [2,5]. However, SK has a low water solubility of 0.00002 M [10], which inhibits its efficacy by oral or internal administration. In addition, the direct use of SK to the wound site may easily be removed or lose drug activity. Drug carriers at the nanoscale offer the possibility of improving the therapeutic index of drug molecules by diminishing their toxicity against physiological tissues and achieving controlled therapeutic levels of the drug for a prolonged time. Incorporating SK with a drug-delivery nano-system compensates for the poor solubility of SK while strengthening the stability of candidate drugs and improving their absorption, biodistribution, metabolism, and excretion [11,12].
Electrostatic spinning has increasingly gained attention from different fields. It can transform multiple polymer solutions into nanofiber mats using an electrostatic force. Moreover, electrostatic spinning also can be combined with new fields to create new applications, such as filtration [13], electrical and optical applications [14], sensors [15], and drug-delivery systems [16]. This study first evaluates the effect of extraction temperature (60, 50, 25, 10 and −10 °C) on the content of shikonin. A shikonin (SK) content test is used to examine the optimal parameters, and a cell viability test is used to examine the optimal concentration of SK. Moreover, the nanofiber morphology is observed and evaluated in terms of polyvinyl alcohol (PVA) electrospinning parameters. The PVA solution is electrospun with a specified PVA concentration and a specified collection distance of 10 cm, under different voltages and flux speeds. SEM is used to observe the morphology and average diameter of the nanofibers, thereby determining the optimal electrospinning parameters. Finally, PVA solution and SK extracts are blended at ratios of 90/10, 80/20, and 70/30 w/w, and the blends are formed into nanofibers, determining the optimal parameter for the preparation of drug-loaded LE electrospun nanofibrous membranes (LENMs). The drug release curve and in vitro cell viability of LENM with different formations are finally evaluated.

2. Materials and Methods

2.1. Materials

PVA (Sigma-Aldrich, St. Louis, MO, USA) has a molecular weight between 89,000 and 98,000 and is 99+% hydrolyzed. Lithospermum erythrorhizon was purchased from Xin Long Taichung, Taiwan. Shikonin (≥98% HPLC, S7576), phosphate-buffered saline (PBS), and Tween-80 were purchased from Sigma-Aldrich, St. Louis, MO, USA. Ethanol (Union Chemical Works Ltd., Taipei, Taiwan) has a purity of 95%. [3-(4,5-Dimethylthiazol-2-yl)-2,5-diphenyltetrazolium bromide] (MTT) reagent and dimethyl sulfoxide (DMSO) were purchased from Protech Technology Enterprise Co., Ltd., Taipei, Taiwan.

2.2. Preparation of Lithospermum Erythrorhizon Extract

The LE extraction was improved based on our previous study [2]. After sifting (mesh opening 0.59 mm), 30.0 g of LE were blended with 240 mL of a 95% ethanol in order to yield the solid–liquid rates of 1:8. LE was infused into an Erlenmeyer flask, and the extraction was conducted by two methods. One involved placing the flask in a thermostatic shaking water bath at 60, 50, or 25 °C for 24 h. The other involved storing the flask in a freezer for extraction at 10 or −10 °C for seven days. The medicinal liquids were filtered with filter paper (pore size: 5 μm, Advantec No. 2, Tokyo, Japan), and then kept in a freezer at −20 °C. The optimal extract was determined by using the shikonin content test.

2.3. Preparation of PVA Electrospun Nanofibrous Membranes (PENM)

PVA powder and deionized water were formulated into a 14 wt % PVA solution. The PVA solution was separately electrospun with voltages of 15, 20, and 25 kV, a collection distance between the jet and the collector plate of 10 cm, and a flow rate of 0.5, 0.75 and 1.0 mL/h, thus forming PVA electrospun nanofibrous membranes (PENMs). SEM was used to observe the morphology and fiber diameter, examining the optimal parameters for subsequent discussions. According to the nine combinations of voltage and flow rate, samples are denoted as PENM1–PENM9.

2.4. Preparation of Lithospermum Erythrorhizon Electrospun Nanofibrous Membranes

PVA solution (14 wt %) and optimal LE extract were blended at 90/10, 80/20 and 70/30 w/w. The mixtures were electrospun with a voltage of 15 kV, a collection distance between the jet and the collector plate of 10 cm, and a velocity of 1.0 mL/h, thus forming Lithospermum erythrorhizon electrospun nanofibrous membranes (LENMs). LENMs are denoted as LENM-1, LENM-2, and LENM-3 based on the content of LE extracts being 10, 20 and 30 wt %.

2.5. Shikonin Content Test of LENMs

Using an ethanol as a solvent, the shikonin solutions (≥98% HPLC, S7576, Sigma-Aldrich, St. Louis, MO, USA) were formed with five different concentrations: 0.0625, 0.0125, 0.025, 0.05, and 0.1 mg/mL. The absorbance of these solutions was measured at 518 nm using a UV-vis spectrophotometer (GENESYS 10S, Thermo Fisher Scientific Inc., Waltham, MA, USA),and then drawn into a calibration curve. The calibration curve was employed to determine the drug concentration.
SK   concentration   ( mg / mL ) = 0.037883 ×   absorbance 0.001292   ( R 2 = 0.9996   )
Afterward, LE extracts were extracted using different temperatures under reduced pressure to form solid LE extracts. An ethanol solution was used as a solvent to dissolve a specified amount of solid LE extract. The LE extracts were diluted 20 times and then poured into the extract concentration apparatus for the following process. The water bath was heated to 40 °C, a water pump was used to reduce the pressure, and a rotary evaporator was used to condense the liquids in order to obtain the concentration (mg/mL) of the active component (SK) in the LE extract. The absorbance of the LE extract was measured as 518 nm, and Equation (1) was used to compute the SK content while Equation (2) was used to compute the concentration of SK purity.
Purity   of   SK   ( % )   =   total   amount   of   shikonin   in   extract   ( mg ) total   weight   of   extract   ( mg ) × 100 %

2.6. Encapsulation Efficiency and Drug-Loading Content of LENMs

LENM of 3–5 mg is mixed then dissolved in dimethyl sulfoxide (DMSO) in order to dismantle the fibrous structure of LENM and the SK component can be released to DMSO. The mixture is processed using a centrifuge at a rate of 3000 rpm for five minutes, after which the supernatant is collected and measured for the absorbance at 518 nm using a UV–vis spectrophotometer. The data is computed for the SK component in the nanofibrous membranes using the calibration Equation (3), which verifies the encapsulation efficiency (EE) and drug-loading content (DLC) of SK component within the membranes. All experiments are carried out in triplicate according to Equations (4) and (5).
SK   concentration   ( mg / mL ) = 0.104056 ×   absorbance 0.000312   ( R 2 = 0.9998   )
EE   ( % ) =   total   amount   of   SK   nanofibrous   membranes initial   total   amount   of   LE   extract × 100 %
DLC   ( % ) = total   amount   of   SK   in   nanofibrous   membranes total   weight   of   nanofibrous   membranes × 100 %

2.7. In Vitro Drug Release of PENMs

Using PBS that contained 1% Tween 80 as a solvent, the absorbance of SK solutions with five concentrations (0.00078, 0.00156, 0.00313, 0.00625 and 0.025 mg/mL) at 518 nm was measured using a UV–vis spectrophotometer (GENESYS 10S Series, Thermo Scientific, Waltham, MA, USA), the results of which were graphed to establish a calibration curve.
SK   concentration   ( mg / mL ) = 0.038565 ×   absorbance 0.000046   ( R 2 = 0.9999   )
Subsequently, 50 mL PBS that contained 1% Tween 80 served as a drug release medium to measure the drug release curve of different LENMs. Then, 40–50 g of different LENMs were placed in a thermostatic shaking water bath at 37 °C. Five milliliters of medium was removed at 0.5, 1, 2, 3, 4, 8, 10, 12, 16, 20, 24 and 48 h and new medium was supplied, the process of which continued for 48 h. A UV–vis spectrophotometer was used to measure the mediums, and Equation (6) was used to compute the drug release at different timepoints. The cumulative percentage of drug release was then made into diagrams.

2.8. Scanning Electron Microscopy (SEM) Observation of PENMs and LENMs

PENMs and LENMs were coated with gold to a thickness of approximately 300 Å in a vacuum conditioner, and then photographed at a voltage of 12 kV, using SEM (S3000N, Hitachi, Japan) for further observation. The photographs were then analyzed using Image-Pro® Plus Version 6.2 in order to measure the fiber diameter of the PENMs and LENMs.

2.9. Cell Viability Assay

Minimum essential medium (MEM) with 0.1% DMSO as a solvent, which served as the control group. The solid LE extract was dissolved in the solvent to form 0.7, 1.4, 2.1, 2.8 and 3.5 μM SK solutions, which were immersed in a cell suspension with a cell number of 5 × 10³ cells/well in a 96-well plate to co-culture for 24 h, after which the medium was removed and samples were rinsed with PBS. After the addition of MTT reagent, samples were kept in darkness for 4 h, and then the MTT reagent was drained. Next, 70 μL of DMSO solution was added to each well, and then an ELISA reader (Multiskan GO, Thermo Fisher Scientific Inc, Waltham, MA, USA) was used to measure the absorbance of the samples to examine the cell viability and proliferation. The number of samples was 3.
On the other hand, LENM-1, LENM-2 and LENM-3 were immersed in 2 mL MEM and placed in an incubator at 37 °C for 48 h. The LENM solutions were then used. On day 1, 100 μL of the L929 fibroblast suspension with a concentration of 5 × 10³ cells/mL was infused into a 96-well cell culture plate, and then placed in an incubator at 37 °C for 1 day of culture. On day 2, 100 μL of the LENMs extract was placed into a 96-well cell culture plate, then placed in an incubator at 37 °C for 1 day of culture. On day 3, the medium of 96-well cell culture plate was removed, after which the MTT reagent was added. The measurement procedure is as detailed in the aforementioned paragraph.
Cell   Viability   ( % ) =   A 1 A 0 × 100 %
where A1 means the absorbance of the samples and A0 means the absorbance of the control group.

2.10. Statistical Analysis

SPSS 17.0 was used for statistical analyses. Data are presented as the mean ± standard deviation (SD). Statistical analysis of all data was performed using one-way ANOVA where p values < 0.05 are considered statistically significant (n = 3).

3. Results and Discussion

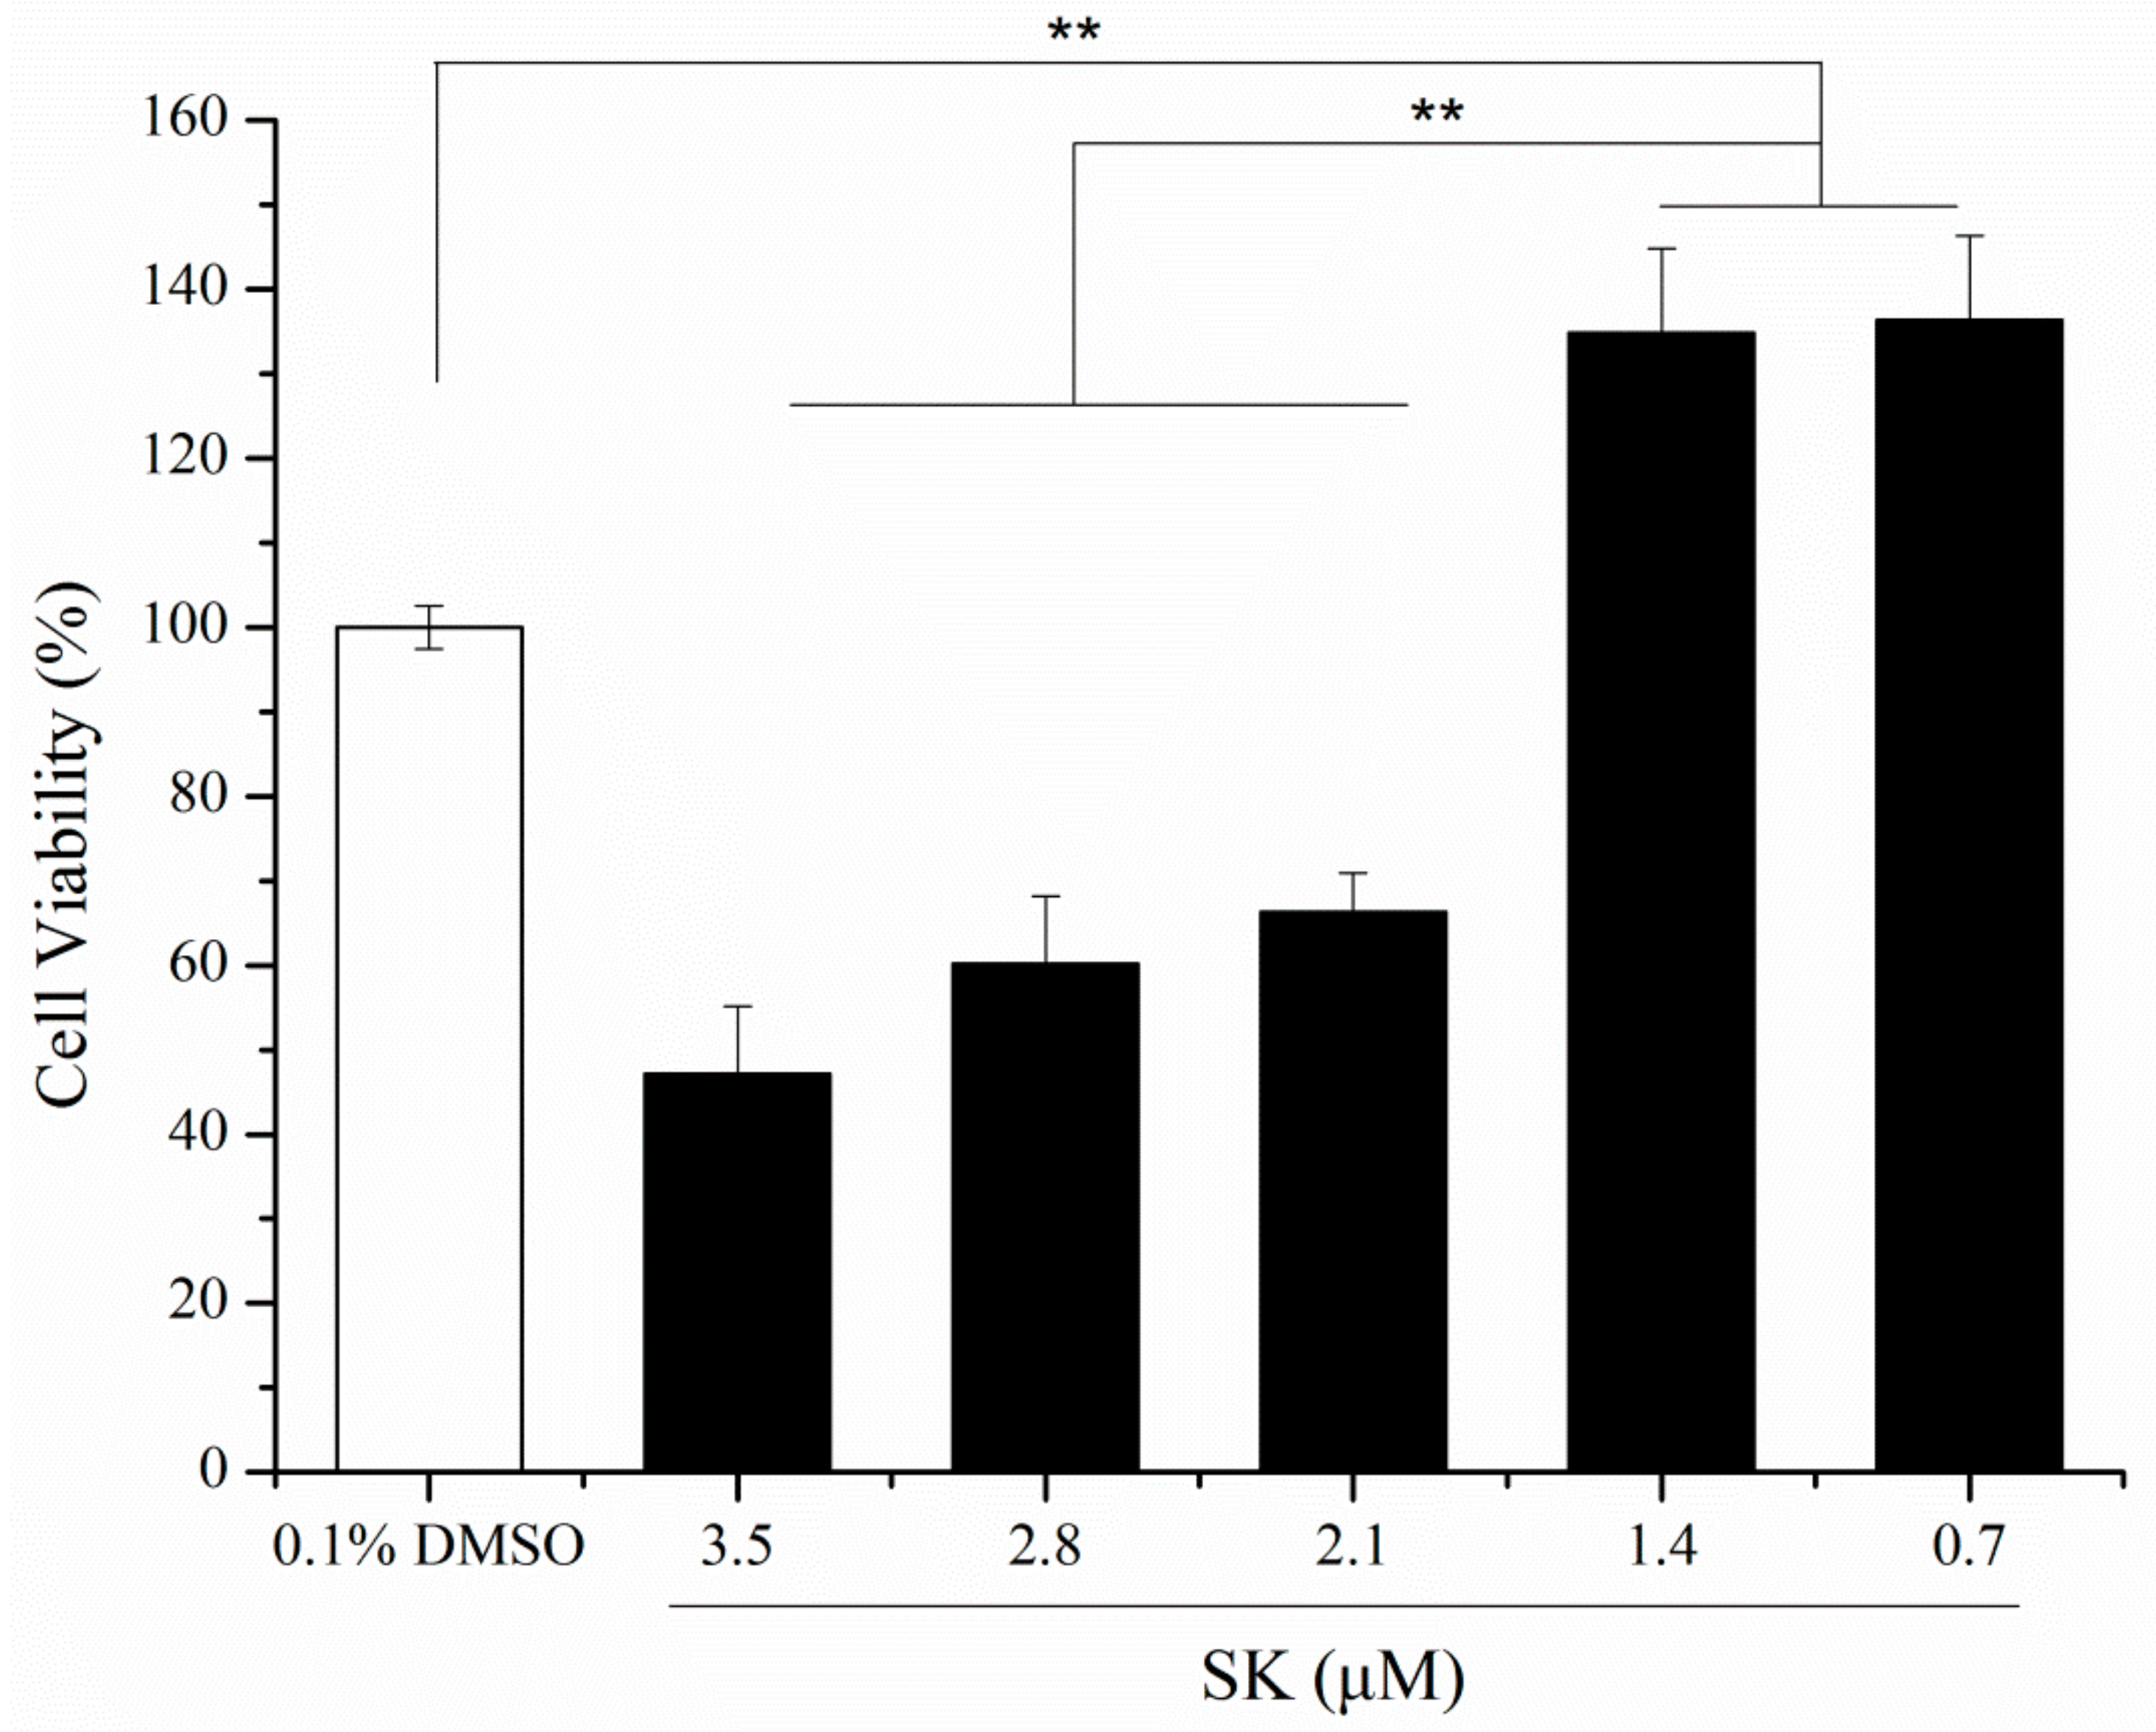
3.1. Purity and In Vitro Cell Viability of SK

The SK component can be characterized with three ultraviolet-visible absorption peaks, which are approximately at 485, 518 and 574 nm [17,18]. In this study, the absorbance at 518 nm and the corresponding calibration curve were used to measure the content of SK. Table 1 shows the LE extraction results as related to the extraction temperature and extraction time. When the extraction temperature was 60, 50 and 25 °C and the extraction time was 24 h, the extraction concentration was 6.24, 3.30 and 1.93 mg/mL, and the SK content was 2.17, 1.15 and 0.78 mg/mL, respectively. The content of SK increased as a result of increasing the extraction temperature, but the opposite was true for the purity of the extract. Based on our previous study, in order to avoid damaging the activity of SK within a safe extraction temperature, the extraction percentage should be proportional to the extraction temperature. Moreover, this shortens the time it takes for the solvent to reach a saturation concentration [2]. However, a high extraction temperature increases the presence of impurities, decreasing the purity of the extraction. Therefore, in order to prove that a low extraction temperature can decrease the content of impurities to obtain a greater extraction purity, and in order to overcome the fact that the solvent cannot reach to a saturation concentration in a short extraction time, the other batch in the experiment was prepared using the extraction time of seven days and extraction temperatures of 10 °C and −10 °C.
Table 1 shows the test results for a low-temperature extraction. Compared to the results of an extraction temperature of 25 °C, the SK content increases by 33.8% for 10 °C and 37.9% for −10°C. In particular, the optimal purity of extraction is 53.8%, and the optimal SK content is 1.07 mg/mL (p < 0.01) when the extraction temperature is −10 °C. LE is composed of shikonin and its derivatives, the former being the primary effective component. Therefore, a low extraction temperature is proven to effectively increase the SK content.
Figure 1 shows the effect of SK concentration on the cell viability of fibroblasts. The test results show that SK with a concentration that is lower than 1.4 μM does not have a negative influence on the cell viability of fibroblasts. Comparing to the control group, SK with a concentration between 1.4 and 0.7 μM significantly facilitates the cell viablity by 134.2 and 136.8% (p < 0.01), while SK with a concentration between 2.1 and 3.5 μM significantly suppresses the cell viablity by 66.3%, 60.1% and 47.1% (p < 0.01).
Previous studies also showed that SK with a concentration of 1–10 μM facilitated cell proliferation. Yan et al. found that 1 μM of SK accelerated the growth of human dermal fibroblasts, and 10 μM of SK stimulated human keratinocyte growth [19]. Andujar et.al found that 1 μM of SK significantly improved intestinal wound healing without preventing the growth of intestinal epithelial cells (IEC-18) [20]. Low-dose water extracts of gromwell (1 μg/mL) enhanced the migration of both cultured human keratinocytes and fibroblasts with increased lipid synthesis in an in vitro wound scratch model [21]. Therefore, a maximum concentration of 1.4 μM of SK was used for following evaluations and discussions.

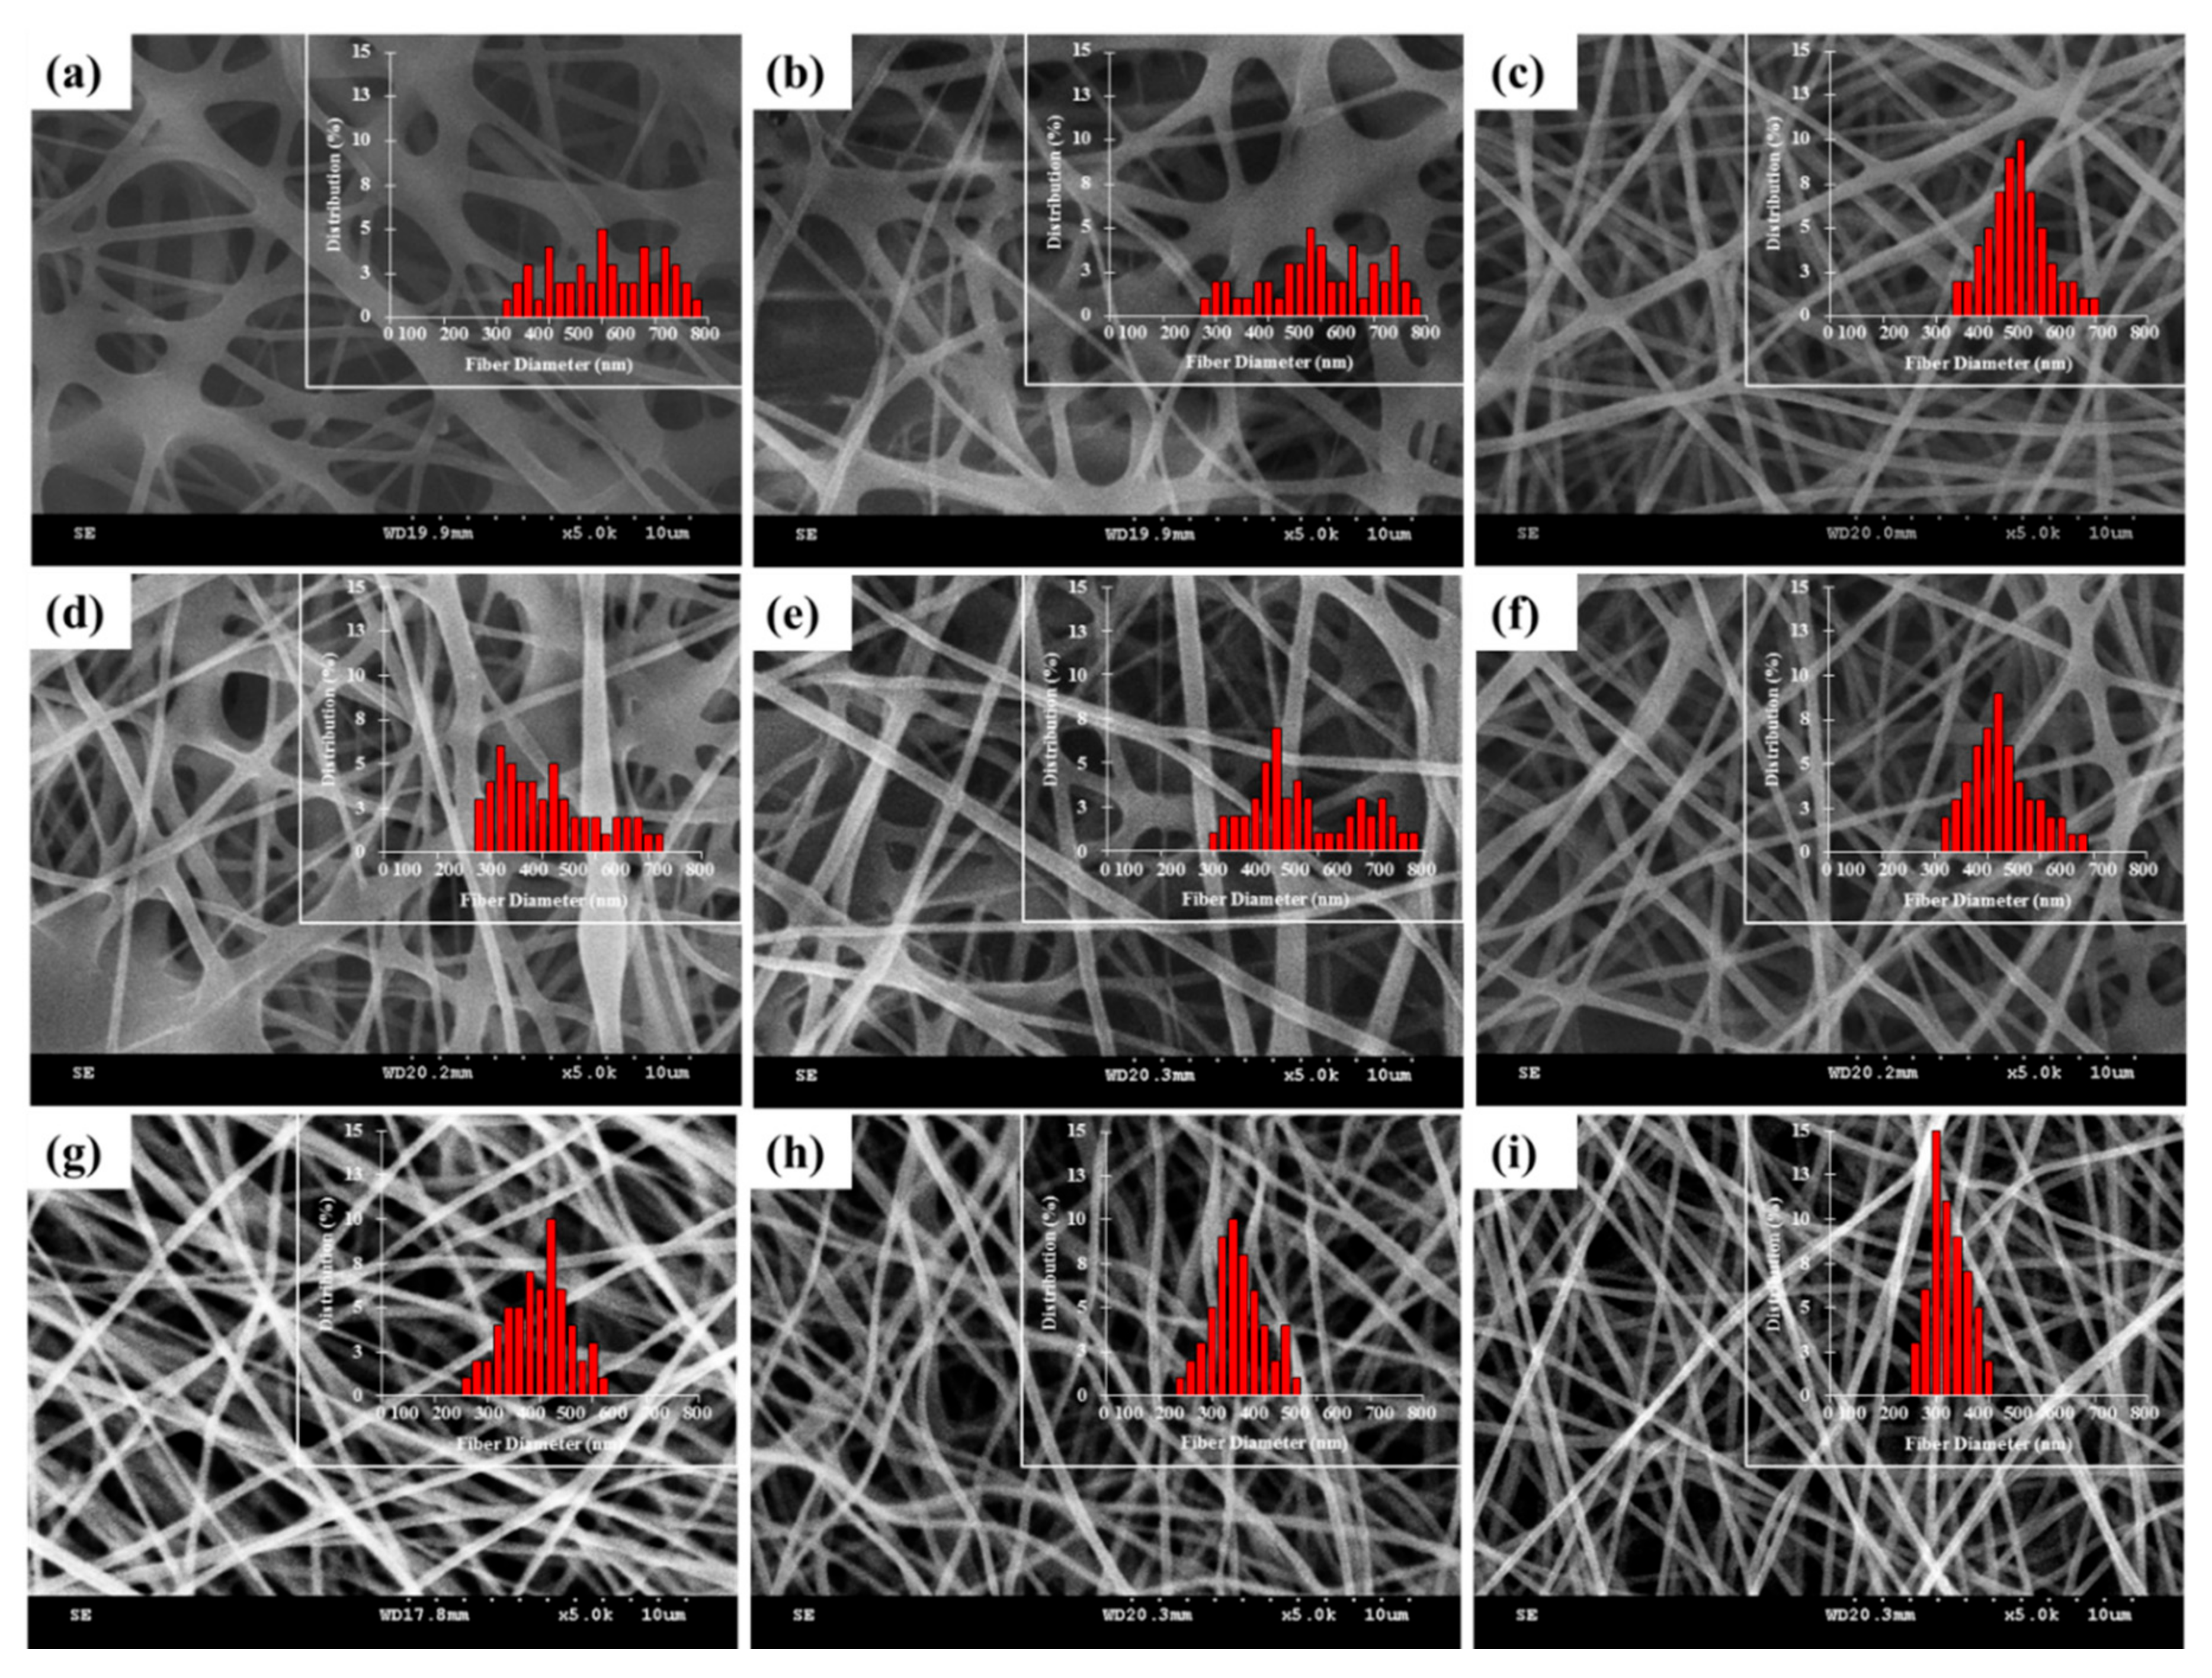
3.2. Characterizations of PENMs

Figure 2 and Table 2 show that when the electric field decreases from 2.5 to 1.5 kV/cm, and when the flow rate increases from 0.5 to 1.0 mL/h, PENMs have good morphology and are composed of bead-free nanofibers. Specifically, with the combination of an electric field of 1.5 kV/cm and a flow rate of 1.0 mL/h, PENM-9 has the smallest diameter distribution of nanofibers of 240–390 nm, as well as good formation of nanofibers. Moreover, PENM-9 also has the finest average diameter of 316 nm (p < 0.01) among all PENMs studied. The properties of polymer represent a key factor influencing the electrospun nanofibers. In this section, a constant concentration of PVA was used, making manufacture parameters the only variables that would affect the morphology of nanofibers. Tayloe (1964) found that a voltage that exceeded 6 kV created Taylor cones, facilitating the electrospun nanofibers. In addition, different electric fields required different corresponding suitable flow rates. An electric field that exceeded the range employed to create stabilized Taylor cones had a greater pull force than the flow rate, resulting in a concave Taylor cone and unstable jets. As a result, there was a greater proportion of the presence of bead-shaped, flatten, or flaw nanofibers, as seen in Figure 2a,b,d,e. Conversely, under an electric field that is less powerful than that required for Taylor cone formation, the jets became drops and are unable to reach the collect board. As the electric fields used in this study are higher than those required for Taylor cone formation, all the aforementioned flaws are absent. The optimal PENM-9, which was made with the combination of an electric field of 1.5 kV/cm and a flow rate of 1.0 mL/h, was further used for the following disucssions.

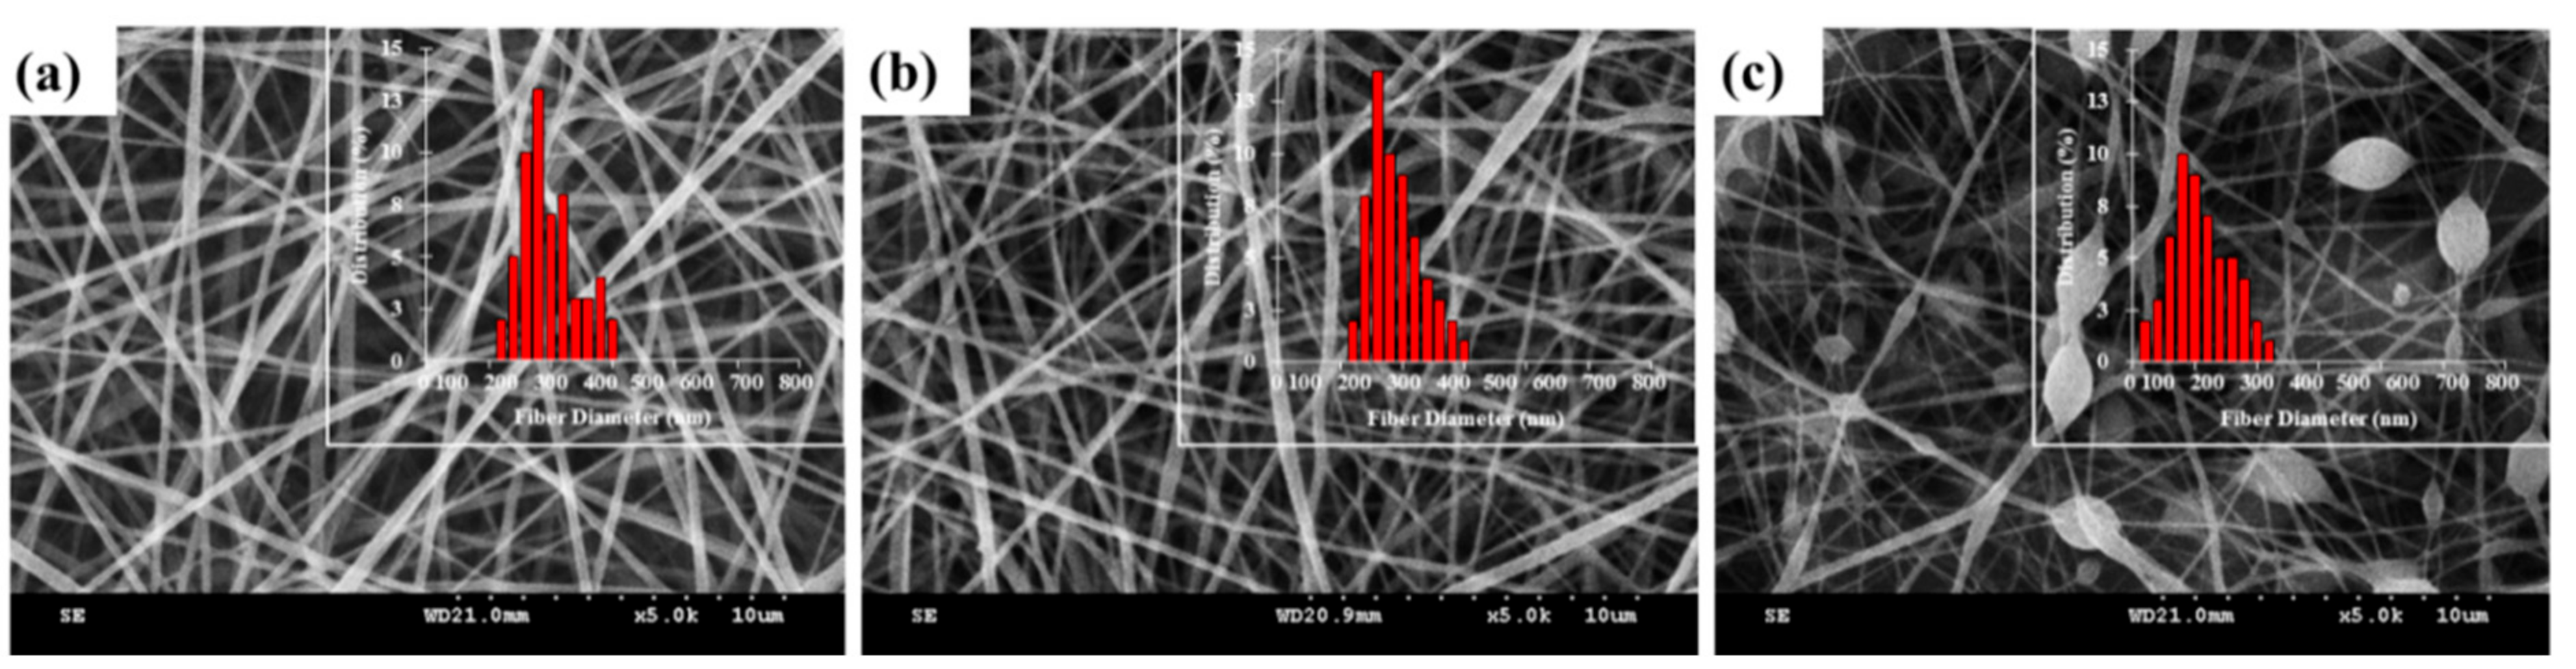
3.3. Morphology of LENMs

Figure 3 and Table 3 show the morphology of nanofibers of LENM-1, LENM-2, and LENM-3. LENM-1 and LENM-2 exhibited good morphology with an average fiber diameter of 279 ± 52 nm and 272 ± 51 nm, respectively. However, LENM-3, which was made with 30 wt % of LE extract, was composed of beaded-fibers and had an average diameter of 177 ± 45 (p < 0.01). The presence of beaded fibers is ascribed to the viscosity and electrical conduction of electrospinning solution, and PENM-9 had a viscosity of 1562 ± 31 cP, electrical conduction of 551 µS/cm, and an average diameter of 316 nm. For LENM-3, the blending ratio of PVA to LE was 70/30 w/w, the viscosity was 760 ± 71 cP, the electrical conductivity was 177 µS/cm, and the average diameter was 177 nm. Namely, viscosity, electrical conductivity, and fiber diameter decreased by 70.5%, 60.6%, and 43.9%, respectively. The variations in the properties of electrospinning solution are ascribed to the increasing amount of LE extract. LE extract has ethanol solution as its solvent, and ethanol is almost electrically insulating and has a low viscosity of 1 cP, which have a negative influence on LENM-3. Moreover, the concentration of polymer is a key factor in the electrospinning process, as well as in relation to the viscosity [22]. The preparation and formation of nanofibers are dependent on the viscosity of the polymer solution. When the viscosity is lower than the critical value of entanglement, applying a voltage to it may cause sprays or bead-shaped nanofibers [23,24]. When the concentration of the polymer solution is higher than the critical value of entanglement, the amount and size of the bead-shaped fibers decrease, eventually leading to the presence of bead-free fibers [25]. However, an excessive viscosity of the polymer solution fails to create evenly formed nanofibers [26]. When the electrospinning solution composed of an LE solution is over 30 wt %, a low viscosity and a low electrical conductivity prevents the entanglement of low concentration polymers. As a result, electrospinning is not performed continuously, and the interrupted electrospinning solution results in a great amount of beads and bead-shaped nanofibers. The optimal blending ratio was determined to be 80/20 (LENM-2) and is thus used for the following discussion.

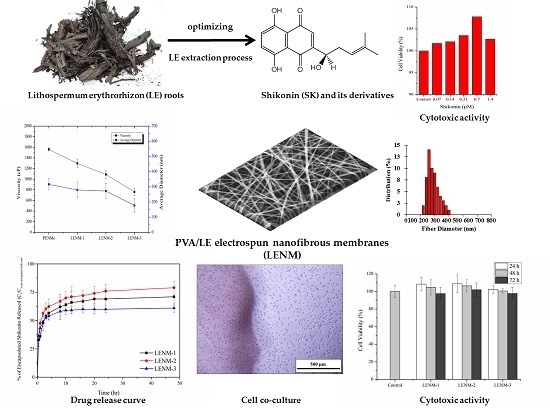
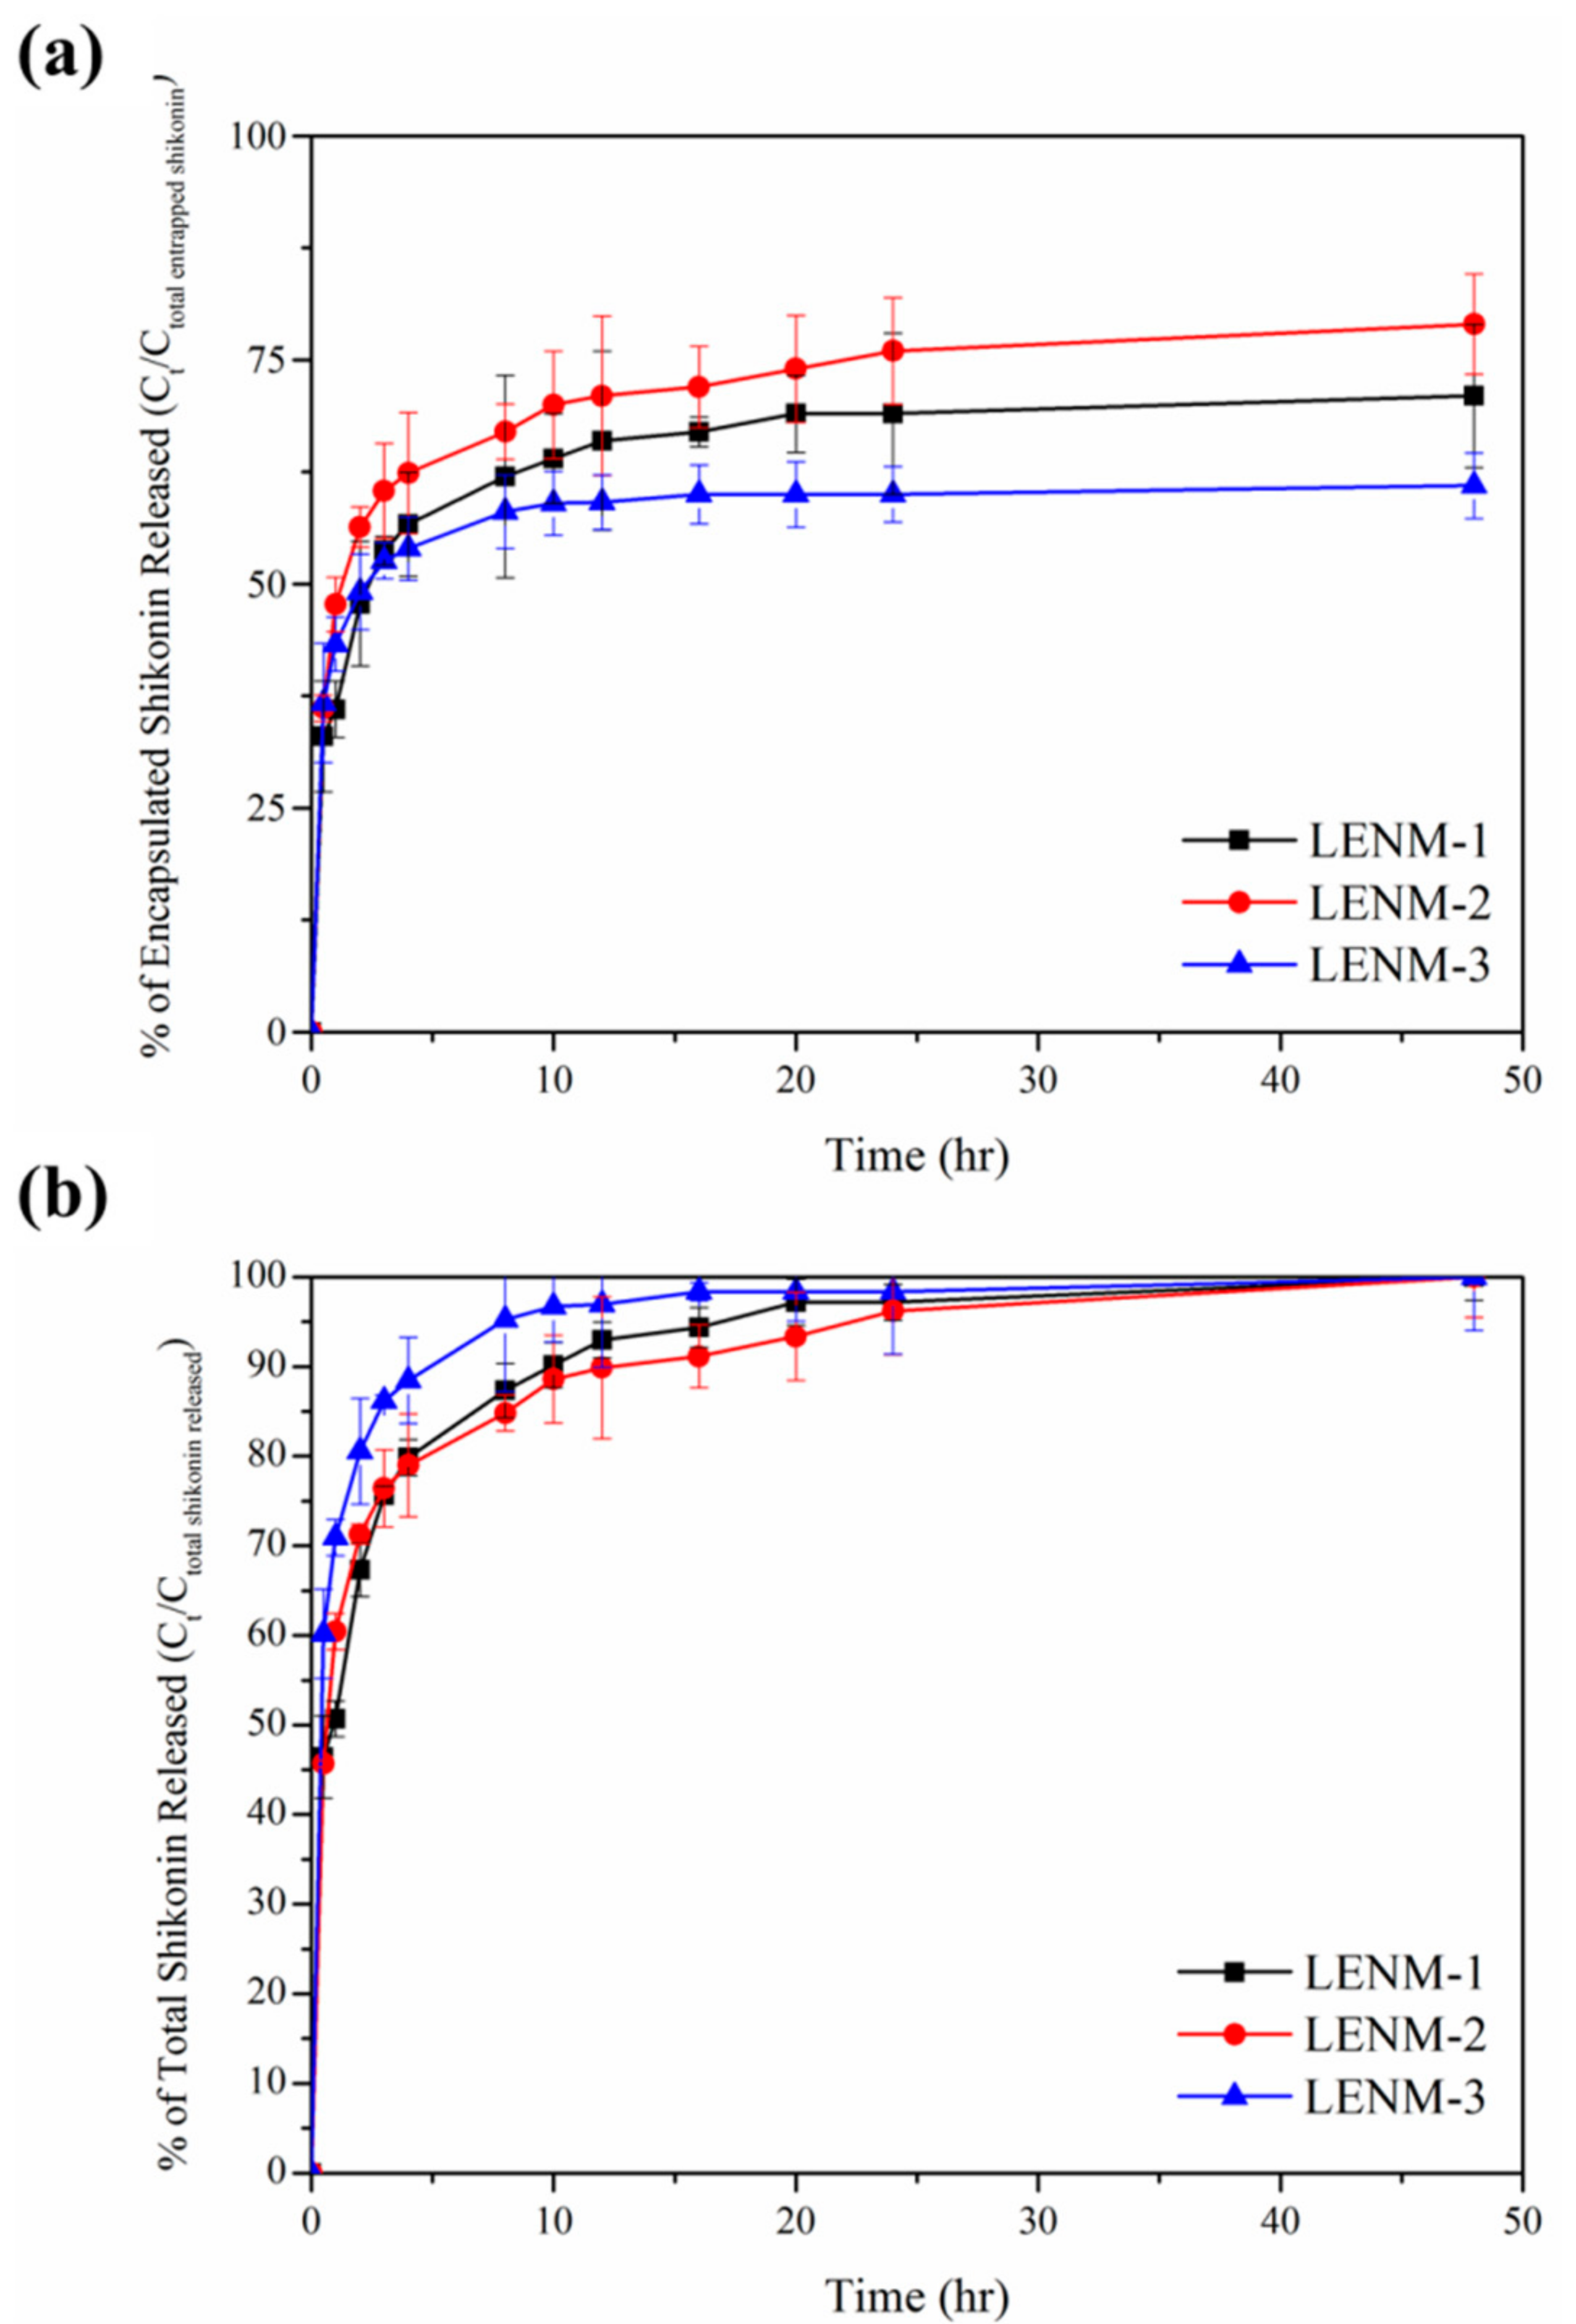
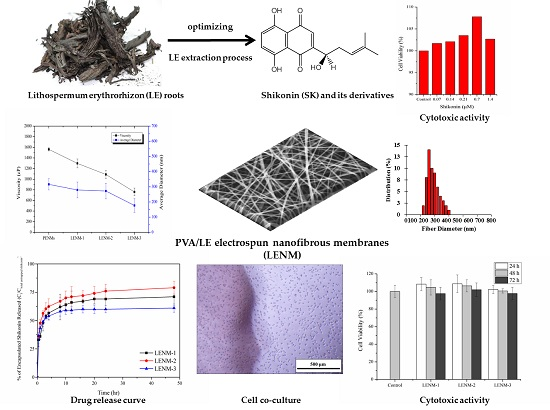
3.4. In Vitro Release of Shikonin

Evaluations in terms of encapsulation efficiency (EE), drug-loading content (DLC) and the release profiles of LENMs are important for clinical applications. For the evaluations of the release file, there are two factors, including the total amount of the drug released as well as the rate of the release profile versus time. The method used in this study refers to Kontogiannopoulos, K. N. et al. Results are expressed as the percentage of shikonin released in regard to the total entrapped drug (Ct/Ctotal entrapped shikonin) versus time, and as the % release of shikonin (Ct/Ctotal shikonin released) versus time (Figure 4) [11].
Figure 4 and Table 4 show that LENM-1, LENM-2, and LENM-3 can release 36%–47% of SK in the first hour. Figure 4a shows that using a nanofibrous membrane as drug carrier can have a high specific surface area, which benefits the diffusion of SK from the surface and the highly porous structure. In comparison, Kontogiannopoulos et al. also indicated that an initial rapid release of the drug is followed by a second stage of a slower release until reaching a plateau at 48 h [18]. In particular, LENM-2 exhibited the maximum drug release amount in 48 h, and the total release amount in the 48th hour was 79 ± 5.5% (p < 0.05), followed by LENM-1 (71 ± 7.9% in the 48th hour) and then LENM-3. LENM-3 showed an SK release amount of 58 ± 4.0% in the eighth hour, and SK almost stopped releasing and reached an amount of 61 ± 3.6% in the 48th hour. LENM-1 and LENM-2 both showed continuous drug release for 48 h; moreover, LENM-2 showed a greater release amount per unit time and the longest time for drug release.
Table 4 shows the encapsulation efficiency (EE) and drug-loading content (DLC) of the three LENMs. The test results show that the blending ratio PVA solution to LE extract has a direct influence on the EE and DLC of LENMs. LENM-1 has the maximum EE of 92.5 ± 9.5%, followed by LENM-2 (89.2 ± 2.2%), while LENM-3 has the maximum DLC of 0.22 ± 0.01%. Figure 3 and Table 4 show that increasing the LE solution changes the viscosity of the electrospinning solution and increases the DLC of LENM. Meanwhile, it also causes flaws, beaded-shape nanofibers, and unnecessary consumption, eventually leading to a significant decrease in EE. In sum, LENM-1 was chosed to be used in the next discussion, as it has good fiber formation, small average diameter, as well as optimal EE and DLC.

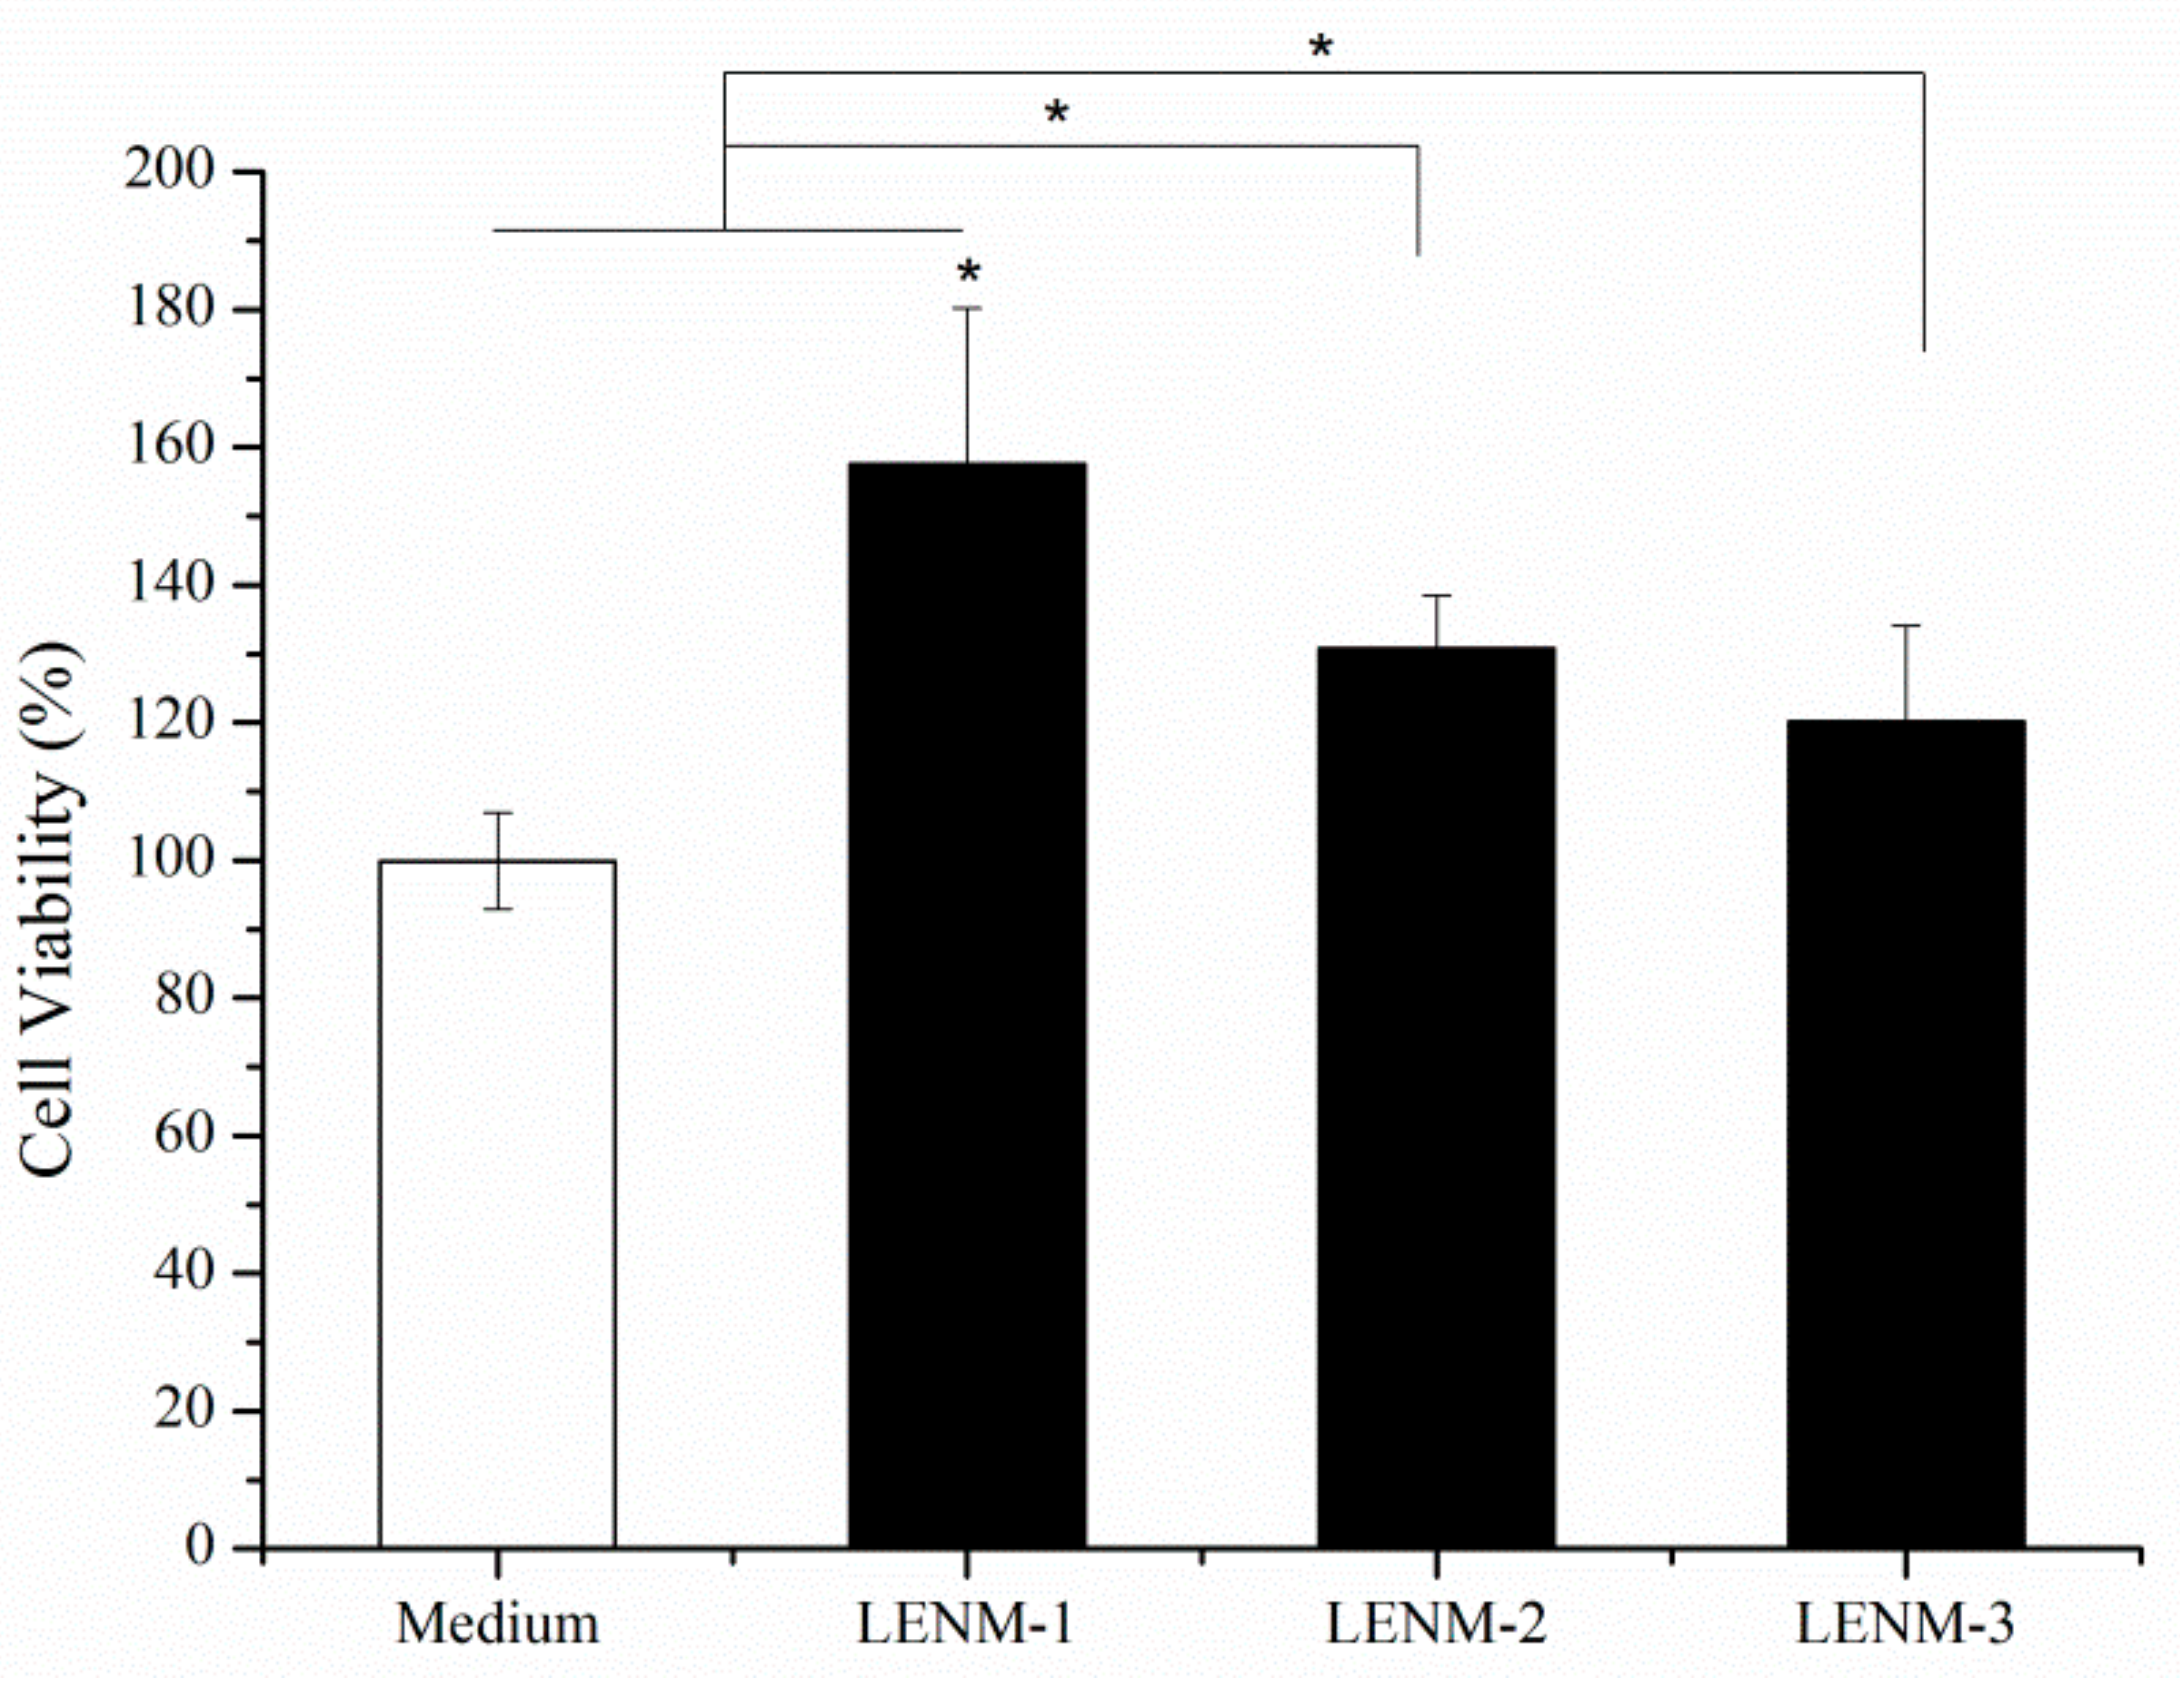
3.5. In Vitro Cell Viability

In Figure 5, LENM-1, LENM-2, and LENM-3 are immersed in MEM for 48 h in order to obtain LENM extracts. The extracts and cells were culture and examined using a 24-h incubation short-term assay evaluating the influence of the maximum release amount on the cell viability of fibroblasts (L929). Figure 5 shows that the viability of fibroblasts increased by 157.5% for LENM-1, 130.7% for LENM-2, and 120.2% for LENM-3 when p < 0.05. The test results show that the drug concentration that all three groups released and accumulated is suitable for cell growth. The difference in cell viability among LENM-1, -2, and -3 is ascribed to their different EEs, DLCs, and drug release curves. An appropriate drug concentration to a certain level is helpful with cell viability, but excessive concentrations would suppress cell growth, as seen in Figure 1.

4. Conclusions

This study proposes the production of PVA/Lithospermum erythrorhizon extract nanofibers membranes (LENMs), and successfully optimizes the LE extraction process. The optimal extraction concentration of 53.8% and optimal amount of 1.07 mg/mL are presented when the extraction temperature is −10 °C. The test results of a cell viability assay show that 0.7 μM SK significantly improves the viability of fibroblasts to 136.8%. PENM-9 is the optimal product, and the optimal electrospinning parameters were found to be an electric field of 1.5 kV/cm and a flow rate of 1.0 mL/h. Moreover, the average diameter of LENM-2 is smaller than that of PENM-9 by 13.9%. Based on the results of in vitro drug release measurement, LENM-2 also has the maximum drug release amount of 79%, lasting 48 h. Finally, the results of the cell viability assay show that LENM-1, LENM-2, and LENM-3 all significantly enhance the viability of fibroblasts, and the optimal viability of fibroblasts reaches up to 157.5% in LENM-1. LENMs were considered and proven to have the potential to effectively accelerate wound healing and tissue regeneration for future clinical use.

Acknowledgments

The authors would especially like to thank the Ministry of Science and Technology of Taiwan for financially supporting this research under Contract MOST 105-2221-E-166-006. Jia-Horng Lin and Yueh-Sheng Chen contributed equally to this work.

Author Contributions

In this study, the concepts and designs for the experiment, all required materials, as well as processing and assessment instruments were provided by Ching-Wen Lou and Jia-Horng Lin. Data were analyzed, and experimental results were examined by Mong-Chuan Lee and Yueh-Sheng Chen. The experiment was conducted and the text was composed by Zong-Han Wu.

Conflicts of Interest

The authors declare no conflict of interest.

References

  1. Yang, Q.; Li, S.Y.; Fu, Z.Z.; Lin, B.H.; Zhou, Z.F.; Wang, Z.Y.; Hua, Y.Q.; Cai, Z.D. Shikonin promotes adriamycin-induced apoptosis by upregulating caspase-3 and caspase-8 in osteosarcoma. Mol. Med. Rep. 2017, 16, 1347–1352. [Google Scholar] [CrossRef] [PubMed]
  2. Lou, C.W.; Chang, C.Y.; Wu, Z.H.; Lin, J.H. The optimal extracting process, manufacturing technique and biological evaluation of Lithospermum erythrorhizon microcapsules. Mater. Sci. Eng. C Mater. 2015, 48, 165–171. [Google Scholar] [CrossRef] [PubMed]
  3. Kim, J.S.; Seo, Y.C.; No, R.H.; Lee, H.Y. Improved cosmetic activity by optimizing the Lithospermum erythrorhizon extraction process. Cytotechnology 2015, 67, 51–65. [Google Scholar] [CrossRef] [PubMed]
  4. Zhang, S.Q.; Chen, R.Z.; Wang, C.Z. Experiment study on ultrahigh pressure extraction of ginsenosides. J. Food Eng. 2007, 79, 1–5. [Google Scholar]
  5. Papageorgiou, V.P.; Assimopoulou, A.N.; Ballis, A.C. Alkannins and Shikonins: A New Class of Wound Healing Agents. Curr. Med. Chem. 2008, 15, 3248–3267. [Google Scholar] [CrossRef] [PubMed]
  6. Yang, H.J.; Zhou, P.; Huang, H.B.; Chen, D.; Ma, N.F.; Cui, Q.Z.C.; Shen, S.X.; Dong, W.H.; Zhang, X.Y.; Lian, W.; et al. Shikonin exerts antitumor activity via proteasome inhibition and cell death induction in vitro and in vivo. Int. J. Cancer 2009, 124, 2450–2459. [Google Scholar] [CrossRef] [PubMed]
  7. Staniforth, V.; Wang, S.Y.; Shyur, L.F.; Yang, N.S. Shikonins, phytocompounds from Lithospermum erythrorhizon, inhibit the transcriptional activation of human tumor necrosis factor alpha promoter in vivo. J. Biol. Chem. 2004, 279, 5877–5885. [Google Scholar] [CrossRef] [PubMed]
  8. Wang, X.; Hayashi, S.; Umezaki, M.; Yamamoto, T.; Kageyama-Yahara, N.; Kondo, T.; Kadowaki, M. Shikonin, a constituent of Lithospermum erythrorhizon exhibits anti-allergic effects by suppressing orphan nuclear receptor Nr4a family gene expression as a new prototype of calcineurin inhibitors in mast cells. Chem. Biol. Interact. 2014, 224, 117–127. [Google Scholar] [CrossRef] [PubMed]
  9. Lee, Y.S.; Lee, D.Y.; Kim, Y.B.; Lee, S.W.; Cha, S.W.; Park, H.W.; Kim, G.S.; Kwon, D.Y.; Lee, M.H.; Han, S.H. The Mechanism Underlying the Antibacterial Activity of Shikonin against Methicillin-Resistant Staphylococcus aureus. Evid. Based Complement. Altern. 2015, 2015, 520578. [Google Scholar]
  10. He, J. Complex of shikonin and beta-cyclodextrins by using supercritical carbon dioxide. J. Incl. Phenom. Macrocycl. Chem. 2009, 63, 249–255. [Google Scholar] [CrossRef]
  11. Kontogiannopoulos, K.N.; Assimopoulou, A.N.; Dimas, K.; Papageorgiou, V.P. Shikonin-loaded liposomes as a new drug delivery system: Physicochemical characterization and in vitro cytotoxicity. Eur. J. Lipid Sci. Technol. 2011, 113, 1113–1123. [Google Scholar] [CrossRef]
  12. Alexis, F.; Rhee, J.W.; Richie, J.P.; Radovic-Moreno, A.F.; Langer, R.; Farokhzad, O.C. New frontiers in nanotechnology for cancer treatment. Urol. Oncol. Semin. Orig. Investig. 2008, 26, 74–85. [Google Scholar] [CrossRef] [PubMed]
  13. Shabafrooz, V.; Mozafari, M.; Vashaee, D.; Tayebi, L. Electrospun Nanofibers: From Filtration Membranes to Highly Specialized Tissue Engineering Scaffolds. J. Nanosci. Nanotechnol. 2014, 14, 522–534. [Google Scholar] [CrossRef] [PubMed]
  14. Gokceoren, A.T. Optical and Electrical Investigation of the Electrospun Poly(N-vinyl carbazole) Fibers. Fiber Polym. 2015, 16, 86–94. [Google Scholar] [CrossRef]
  15. Marega, C.; Maculan, J.; Rizzi, G.A.; Saini, R.; Cavaliere, E.; Gavioli, L.; Cattelan, M.; Giallongo, G.; Marigo, A.; Granozzi, G. Polyvinyl alcohol electrospun nanofibers containing Ag nanoparticles used as sensors for the detection of biogenic amines. Nanotechnology 2015, 26, 075501. [Google Scholar] [CrossRef] [PubMed]
  16. Lee, J.W.; Lee, H.Y.; Park, S.H.; Park, J.H.; Kim, J.H.; Min, B.H.; Kim, M.S. Preparation and Evaluation of Dexamethasone-Loaded Electrospun Nanofiber Sheets as a Sustained Drug Delivery System. Materials 2016, 9, 175. [Google Scholar] [CrossRef] [PubMed]
  17. Weng, X.C.; Xiang, G.Q.; Jiang, A.L.; Liu, Y.P.; Wu, L.L.; Dong, X.W.; Duan, S. Antioxidant properties of components extracted from puccoon (Lithospermum erythrorhizon Sieb. et Zucc.). Food Chem. 2000, 69, 143–146. [Google Scholar] [CrossRef]
  18. Kontogiannopoulos, K.N.; Assimopoulou, A.N.; Tsivintzelis, I.; Panayiotou, C.; Papageorgiou, V.P. Electrospun fiber mats containing shikonin and derivatives with potential biomedical applications. Int. J. Pharm. 2011, 409, 216–228. [Google Scholar] [CrossRef] [PubMed]
  19. Yan, Y.; Furumura, M.; Gouya, T.; Iwanaga, A.; Teye, K.; Numata, S.; Karashima, T.; Li, X.G.; Hashimoto, T. Shikonin Promotes Skin Cell Proliferation and Inhibits Nuclear Factor-kappa B Translocation via Proteasome Inhibition In Vitro. Chin. Med. J. Peking 2015, 128, 2228–2233. [Google Scholar]
  20. Andujar, I.; Rios, J.L.; Giner, R.M.; Recio, M.C. Shikonin promotes intestinal wound healing in vitro via induction of TGF-beta release in IEC-18 cells. Eur. J. Pharm. Sci. 2013, 49, 637–641. [Google Scholar] [CrossRef] [PubMed]
  21. Kim, H.; Kim, J.; Park, J.; Kim, S.H.; Uchida, Y.; Holleran, W.M.; Cho, Y. Water Extract of Gromwell (Lithospermum erythrorhizon) Enhances Migration of Human Keratinocytes and Dermal Fibroblasts with Increased Lipid Synthesis in an In Vitro Wound Scratch Model. Skin Pharmacol. Phys. 2012, 25, 57–64. [Google Scholar] [CrossRef] [PubMed]
  22. Lee, K.H.; Kim, H.Y.; Bang, H.J.; Jung, Y.H.; Lee, S.G. The change of bead morphology formed on electrospun polystyrene fibers. Polymer 2003, 44, 4029–4034. [Google Scholar] [CrossRef]
  23. Fong, H.; Chun, I.; Reneker, D.H. Beaded nanofibers formed during electrospinning. Polymer 1999, 40, 4585–4592. [Google Scholar] [CrossRef]
  24. Hsu, C.M.; Shivkumar, S. Nano-sized beads and porous fiber constructs of poly(epsilon-caprolactone) produced by electrospinning. J. Mater. Sci. 2004, 39, 3003–3013. [Google Scholar] [CrossRef]
  25. Liu, Y.; He, J.H.; Yu, J.Y.; Zeng, H.M. Controlling numbers and sizes of beads in electrospun nanofibers. Polym. Int. 2008, 57, 632–636. [Google Scholar] [CrossRef]
  26. Shenoy, S.L.; Bates, W.D.; Frisch, H.L.; Wnek, G.E. Role of chain entanglements on fiber formation during electrospinning of polymer solutions: Good solvent, non-specific polymer-polymer interaction limit. Polymer 2005, 46, 3372–3384. [Google Scholar] [CrossRef]
Figure 1. Cell viability of shikonin component. ** p < 0.01 compared with the control group.
Applsci 07 01143 g001
Figure 2. Scanning electron microscope (SEM) nanofibers of (a) PENM-1; (b) PENM-2; (c) PENM-3; (d) PENM-4; (e) PENM-5; (f) PENM-6; (g) PENM-7; (h) PENM-8 and (i) PENM-9.
Applsci 07 01143 g002
Figure 3. SEM images (5000×) of (a) LENM-1; (b) LENM-2; and (c) LENM-3.
Applsci 07 01143 g003
Figure 4. Drug release curve of LENMs representing (a) the percentage of shikonin released in regard to the total entrapped drug versus time, (b) the percentage of shikonin released in regard to the total released drug versus time. Release medium: phosphate buffered saline (PBS, pH 7.4) + 1% dimethyl sulfoxide at 37 °C for 48 h; Ct, amount of shikonin released at a given time; Ctotal entrapped shikonin, total amount of shikonin entrapped in the LENM; and Ctotal shikonin released, total amount of shikonin released from the LENM. Each value represents the mean ± SD; n = 3.
Applsci 07 01143 g004
Figure 5. The cell viability of LENMs. * p < 0.05 compared with the control group.
Applsci 07 01143 g005
Table 1. Effects of extraction temperature on the concentration of shikonin (SK).
ExtractionTemperature (°C)60402510−10
Time (days)11177
Lithospermum erythrorhizon extract (mg/mL)6.24 ± 0.853.30 ± 0.321.93 ± 0.132.6 ± 0.112.00 ± 0.04 *
SK (mg/mL)2.171.150.781.041.07 **
Purity of SK (%)34.834.940.440.253.8
Note: Data shown as mean ± standard deviation (SD) (n = 3). * p < 0.05, ** p < 0.01.
Table 2. The average diameter of the polyvinyl alcohol electrospun nanofibrous membranes (PENM).
SampleField Strength (kV/cm)Flow Rate (mL/h)Fiber Diameter (nm)Average Diameter (nm)
PENM-12.50.5400–1000683±196
PENM-22.50.75300–980585±157
PENM-32.51.0360–620481±60
PENM-42.00.5250–660418±111
PENM-52.00.75320–960544±156
PENM-62.01.0320–620443±73
PENM-71.50.5230–570411±70
PENM-81.50.75250–490350±58
PENM-91.51.0240–390316±37 **
Note: Data shown as mean ± SD. ** p < 0.01 vs. PENM group (excluding PENM-8).
Table 3. Properties of Lithospermum erythrorhizon electrospun nanofibrous membranes (LENMs).
SamplesAmount of Water Based PVA Solution (%)Amount of Ethanol Based LE Solution (%)Viscosity (cP)Electrical Conductivity (µS/cm)Average Diameter (nm)
PENM-910001562 ± 31551316 ± 37
LENM-190101297 ± 83403279 ± 52
LENM-280201088 ± 72288272 ± 51
LENM-37030760 ± 71217177 ± 45 **
Note: Data shown as mean ± SD. ** p < 0.01 vs. all. ** p < 0.01 vs. LENMs group (sample: LENM-I, LENM-II and LENM-III; solvent concentration: 90:10, 80:20 and 70:30).
Table 4. Summary of encapsulation efficiency (EE) and drug-loading content (DLC) of LENMs.
SampleShikoninTotal Released SK (48 h, %)Drug Release at 60 min (%)
EE %DLC %
LENM-192.5 ± 9.50.15 ± 0.0271 ± 7.936 ± 3.1
LENM-289.2 ± 2.20.21 ± 0.0179 ± 5.5 *47 ± 3.4
LENM-366.0 ± 3.50.22 ± 0.0161 ± 3.6 *43 ± 3.1
Note: Data shown as mean ± SD. * p < 0.05 vs. LENMs group.

