Analysis of the Macroscopic Behavior of Server Systems in the Internet Environment


1
Graduate School of Information Sciences, Tohoku University, Sendai 9808579, Japan
2
Research Institute of Electrical Communication, Tohoku University, Sendai 9808577, Japan
*
Author to whom correspondence should be addressed.
Appl. Sci. 2017, 7(11), 1145; https://doi.org/10.3390/app7111145
Submission received: 23 September 2017
/
Revised: 19 October 2017
/
Accepted: 3 November 2017
/
Published: 6 November 2017
Abstract
:Elasticity is one of the key features of cloud-hosted services built on virtualization technology. To utilize the elasticity of cloud environments, administrators should accurately capture the operational status of server systems, which changes constantly according to service requests incoming irregularly. However, it is difficult to detect and avoid in advance that operating services are falling into an undesirable state. In this paper, we focus on the management of server systems that include cloud systems, and propose a new method for detecting the sign of undesirable scenarios before the system becomes overloaded as a result of various causes. In this method, a measure that utilizes the fluctuation of the macroscopic operational state observed in the server system is introduced. The proposed measure has the property of drastically increasing before the server system is in an undesirable state. Using the proposed measure, we realize a function to detect that the server system is falling into an overload scenario, and we demonstrate its effectiveness through experiments.
1. Introduction
The maturation of the recent cloud-computing paradigm has enabled the construction of flexible network services that are not bound to hardware construction. Elasticity is one of the key features of cloud-hosted services built on virtualization technology. Elasticity is the ability to change the size of network services flexibly as necessary. The control methods of cloud-hosted services and services that have elasticity are referred to as elastic services or elastic resource management [1,2,3]. To utilize the elasticity of cloud environments, administrators should accurately capture the operational status of server systems, which changes constantly according to service requests incoming irregularly. Currently, various studies are being conducted in many domains, from the analysis of the theoretical model to the observation and control of the operating characteristics of the actual system. However, there are no useful methods or functions to know that the behavior properties of server systems have changed to abnormal ones, before the operational status of server system that administrators observe, changes drastically. For example, quality of service (QoS) measures, such as throughput and response time, are widely used to capture the operational status of a running server system. When the degradation of the QoS of operating services is detected, it can be assumed that the system is overloaded, and a control operation for resolving the fault should be applied. However, such changes in the QoS are detected only after a scenario in which a problem in the server system has already occurred, such as overload, resource exhaustion, or failure. Therefore, it is difficult to detect and avoid in advance that operating services are falling into such an undesirable state. Hence, to realize stable and continuous service operation, new approaches for detecting that the system is falling into an undesirable state are required based on the observation of the operational states of server systems. In this paper, we focus on the management of server systems that include cloud systems, and propose a new method for detecting the sign of undesirable situations before the system becomes overloaded as a result of various causes. In this method, a measure that utilizes the fluctuation of the macroscopic operational state observed in the server system is introduced. The proposed measure has the property of drastically increasing before the server system is in an undesirable state, that is, before server performance declines. Accordingly, using the proposed measure, we realize the function to detect that the server system is falling into an overload scenario, and we demonstrate the effectiveness of the proposed measure through evaluation experiments.
The main contribution of this paper is to propose the method that solves the problem related to the acquisition of the fluctuating operational state of server systems which provide various services over the distributed computing environment such as cloud-hosted services. The proposed measure aims to provide a simple and easy-to-use facility for detecting abnormal states of server systems.
In Section 2, we describe the background of this paper and the problems of interest. In Section 3, based on a theoretical analysis of the operation of a general server system that includes a cloud system, we propose a new observation measure, which is, the variance of the fluctuation of the macroscopic operating state of the system. Then, in Section 4, we demonstrate the effectiveness of the proposed measure through an evaluation experiment using an experimental server system. In Section 5, we present the conclusions and future work.
2. Problem of Observing the Dynamics of Server Systems
When operating a server system that utilizes the elasticity of the cloud environment, to maintain the service stably, it is important to scale the service by controlling the amount of computing resources given to the server system according to fluctuating user demand. The demand of the service user and the amount of computing resources given to the server system is in a trade-off relation, as shown in Figure 1. In the scenario of under-provisioning, in which the amount of computing resources is insufficient for service demand, the service becomes overloaded. By contrast, the scenario of over-provisioning, in which the amount of computing resources becomes excessive, is undesirable from the viewpoint of cost and power consumption because computing resources allocated to the service are wasted. The administrator must recognize the operational state of the service and execute scaling at the right time; however, it is difficult to properly capture the timing. This is because the operational characteristics of the server system change irregularly according to the fluctuating operational state of the service.
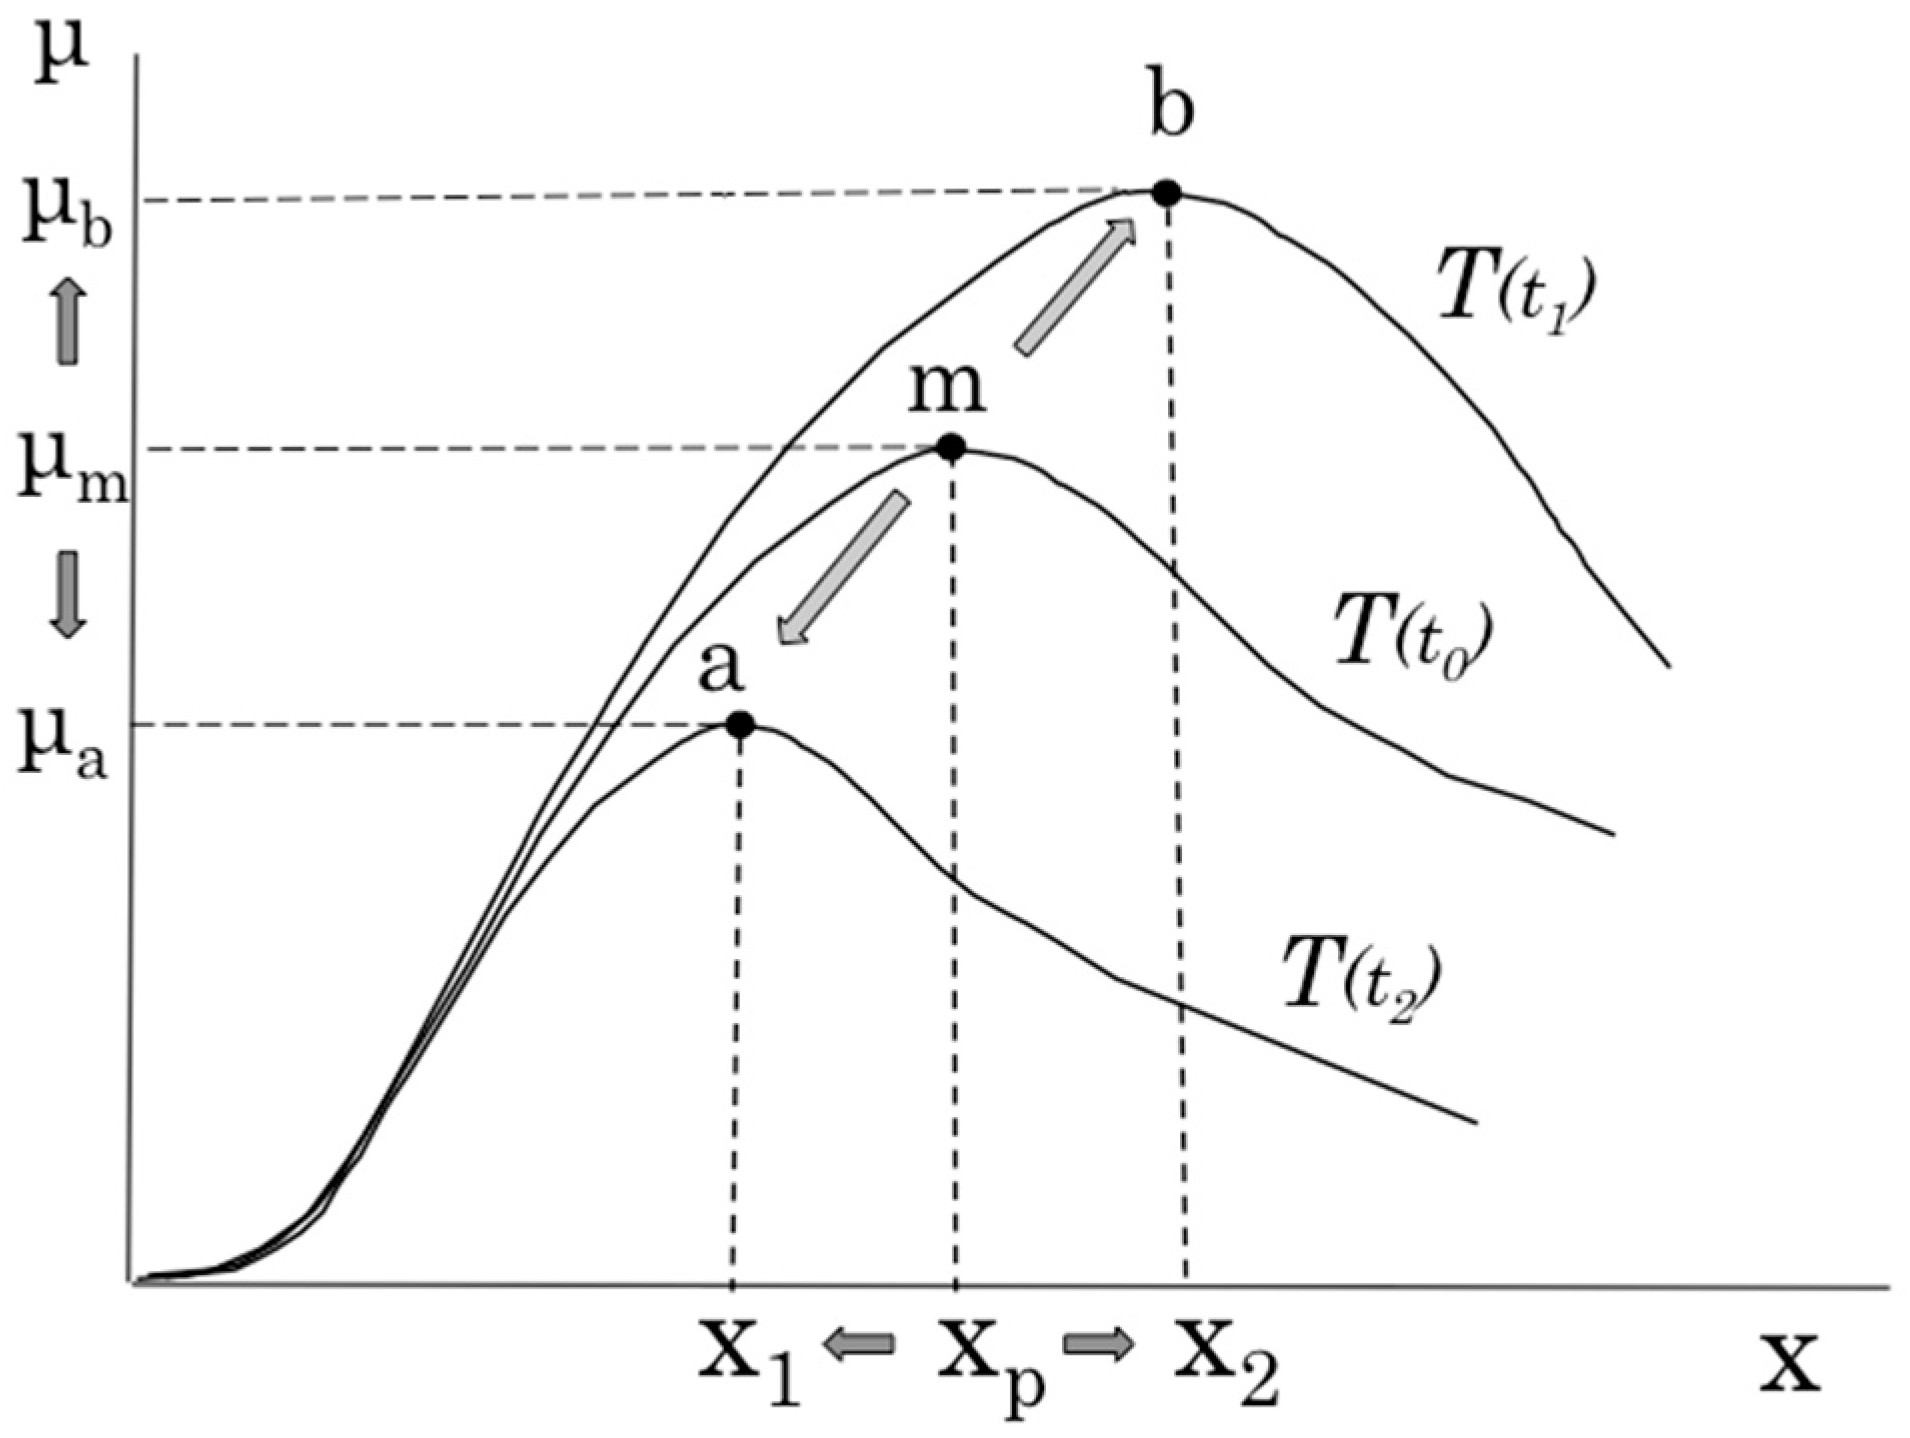
Figure 2 shows the relation between the degree of activity of the server system (x) and amount of processing data (μ), that is, the system characteristic called throughput (T), which represents the processing capabilities of the server system. Theoretically, this graph has a monotonically increasing and saturated shape like Tideal. However, in actual operation, this demonstrates dome-shaped characteristics like Treal. In the overloaded state, in which throughput exceeds the limit state at which throughput is maximized, throughput degrades even if the degree of activity of the server system increases. Generally, it is not easy to specify where the state of the running server system is on Treal. For example, it is impossible to assess that the system operating near state a is approaching the limit state m, or that the system is now operating in overloaded state b and exceeding limit state m. Therefore, prior to the operation of the server system, the throughput characteristic in a predetermined scenario is captured using model analysis, and at the time of actual system operation, the system operating state is estimated using the characteristic and measured values of x and μ. Then, for example, when it is assumed that the system is shifting from state a to state m, to maintain the degree of activity of the system, the amount of processing data is adjusted or the scaling operation is performed. Although the function or configuration of the system changes because of such a scaling operation, the throughput characteristics also change, as shown in Figure 3. If the scaling operation changes the throughput characteristics from T(t0) to T(t1), the system performance limit also changes from state m to state b. However, in the case in which the changed characteristic T(t1) is unidentified, it becomes very difficult to recognize the operational state of the server system, which also hinders the operation of the system. For example, if it cannot be recognized that the system is in the state that exceeds the limit state x2, the system falls into an undesirable state.
To make full use of the elasticity of the cloud-hosted service that has the characteristics mentioned above, there have been various efforts related to system operation and control. One problem common to these methods is providing an effective method for precisely observing and capturing the system operational status that changes constantly according to irregularly incoming service requests.
In the actual operation and management of the server system, methods to determine the timing of scaling based on the utilization rate of computing resources are widely used. These are methods for monitoring the utilization rate of computing resources, such as CPU, memory, and storage allocated to virtual machines (VMs), and applying the scaling operation based on a preset resource utilization threshold [4,5,6]. In this method, because the scaling operation is performed when the utilization rate of the computing resources allocated to VMs increases, it is possible to prevent the service from being overloaded. When applying this method to an actual server system, it is necessary to consider the overhead that accompanies capturing the state of the service, and researchers have highlighted that it is difficult to accurately measure the utilization rate of a computing resource in a virtual environment [7].
Additionally, research on a scaling method that considers QoS, which is an index of the operational status and performance of services provided by the system, has been proposed [8,9,10]. Considering the actual state of services, it is possible to incorporate specific operational targets, such as a service level agreement (SLA) and service level objective (SLO), as a guide for scaling. In commercial systems, QoS-based approaches are adopted that solve optimization problems to maximize QoS while minimizing operational costs according to policy of each service provider [11,12,13]. Operational costs include QoS violation penalties, power consumption and time to migrate/replicate VMs as well as pricing of computing resources. Although scaling policy varies depending on the organization, it is essential in common that administrators accurately capture QoS as they can and the operational status of server systems changing dynamically. When scaling is executed based on the observation of the QoS, it is necessary to capture the relation between the amount of computing resources allocated to VMs and QoS, that is, the operational characteristics of the server system, in advance. Existing scaling methods have highlighted practical issues, such as restricting elasticity, which is an advantage of the cloud environment in terms of requiring prior knowledge or the offline profiling of specific services [8]. QoS is widely used in various systems as a means to capture the status of running systems. By contrast, in the actual operation of a server system, it is empirically known that the system has nonlinear dynamics and its QoS degrades catastrophically under overloaded conditions, and this has also been confirmed in experiments concerning the performance management of a server system [2,3,14,15,16]. To summarize, QoS decline occurs because of the property that it can only be observed after an event, such as overload or resource depletion, has already occurred. Therefore, it cannot be detected beforehand that the server system falls into an undesirable state only by observing the QoS.
Various benchmark tools, such as httperf [17], S-Client [18], JMeter [19], and Tsung [20], have been proposed and used to measure the operational characteristics of a server system. Using these benchmark tools, administrators can capture the operational characteristics of the server system, that is, the relation between the load on the server system and its QoS. Based on an analysis of the operational characteristics obtained using benchmark tools, it is possible to estimate the performance limit and maximum permissible load of the server system, and to apply the results of the analysis to the actual control of the server system.
Furthermore, many studies have been conducted on analytical models to theoretically consider the dynamics of a server system [21,22,23,24]. These studies have attempted to model the behavior of the server system based on queuing theory or other approaches to analyze and infer the operational characteristics of the server system. One of the aims of such research is to acquire the operational characteristics of the server system while omitting the actual measurement using benchmark tools as much as possible, and this is expected to alleviate the burden on administrators by reducing the overhead associated with the actual measurement. However, as mentioned above, there is the problem of managing changes in the fluctuating operational characteristics of server systems caused by the scaling of services.
There has been a number of studies on capacity planning of cloud systems. One of the objectives of capacity planning is to accurately estimate the amount of computing resources necessary for the stable operation of services. In [25], Tsakalozos et al. proposed a method based on a microeconomic-inspired approach to determine the number of VMs allocated to each user. In [26], Maguluri et al. proposed algorithms for load balancing and for scheduling VM configurations based on stochastic models from the viewpoint of cloud providers. In [11], Hwang et al. proposed predictive-based resource provisioning plans focusing the customer-centric view, which took into account various pricing options of cloud providers. These studies proposed various models or strategies for demand prediction of capacity estimation, but any methods or functions for capturing dynamics of server systems at the run-time have not been provided. In general, it is necessary to judge whether the amount of computing resources assigned to server systems is sufficient or not, in accordance with the change of behavior characteristics of server systems at the run-time. In this sense, the estimation-based approaches are effective and useful in the specific system environment where prior knowledge on behavior characteristics of server systems has already been given. Contrary to above studies, we aim to establish new techniques, which do not use a lot of prior knowledge on the control of server systems. Hence, in this paper, as the first step of our study, we focus on the development of an easy-to-use method for monitoring dynamics of the run-time systems.
As can be seen from the research and development related to the operation and management of the server system mentioned above, the establishment of a method for accurately capturing the operational status of the server system is a common challenge, in particular, a method to prevent the system from falling into an undesirable scenario. Furthermore, when the system configuration changes as a result of scaling occurring frequently, it is also necessary to consider the influence of the change in the operational characteristics of the server system. This is because it is necessary to acquire the throughput characteristics again; thus, a large overhead occurs in terms of capturing the changed operating state of the system. Therefore, to establish a new method for observing the state of the server system, it is necessary to devise a method that does not depend on fluctuating system characteristics, such as throughput.
In this paper, we consider a new observation method to capture the sudden change of the operational characteristics of the server system in advance. Specifically, based on the knowledge obtained in a previous study on the observation of the operational characteristics of a system [27], we focus on the fluctuation included in the observed throughput (OT), which is an observable value for capturing the operational characteristics of the server system. We conduct a theoretical analysis of the fluctuation characteristics using a behavior model of the server system, and propose “variance of the fluctuation of the OT” as a new observation measure. When the processing load of the server system suddenly increases as a result of some cause, such as increased service demand and system failure, and the performance capability of the system is declining, it is impossible to detect this scenario only by observing the operational characteristics of the server system. This is because the degradation of the OT can be observed only after the server system falls into an overloaded state. The proposed measure has the property of rapidly increasing before the system falls into a completely undesirable state, that is, before the degradation of the OT becomes apparent. Furthermore, the proposed measure has the advantage that it can be observed by a simple method independent of a specific service or system environment. By applying various countermeasure operations when an increase in the proposed measure is observed, it is possible to prevent the system from falling into an overloaded state, and achieve the continuous and stable operation of the server system.
3. Analysis of the Macroscopic Behavior of Server Systems in the Internet Environment
3.1. Macroscopic Behavior Model
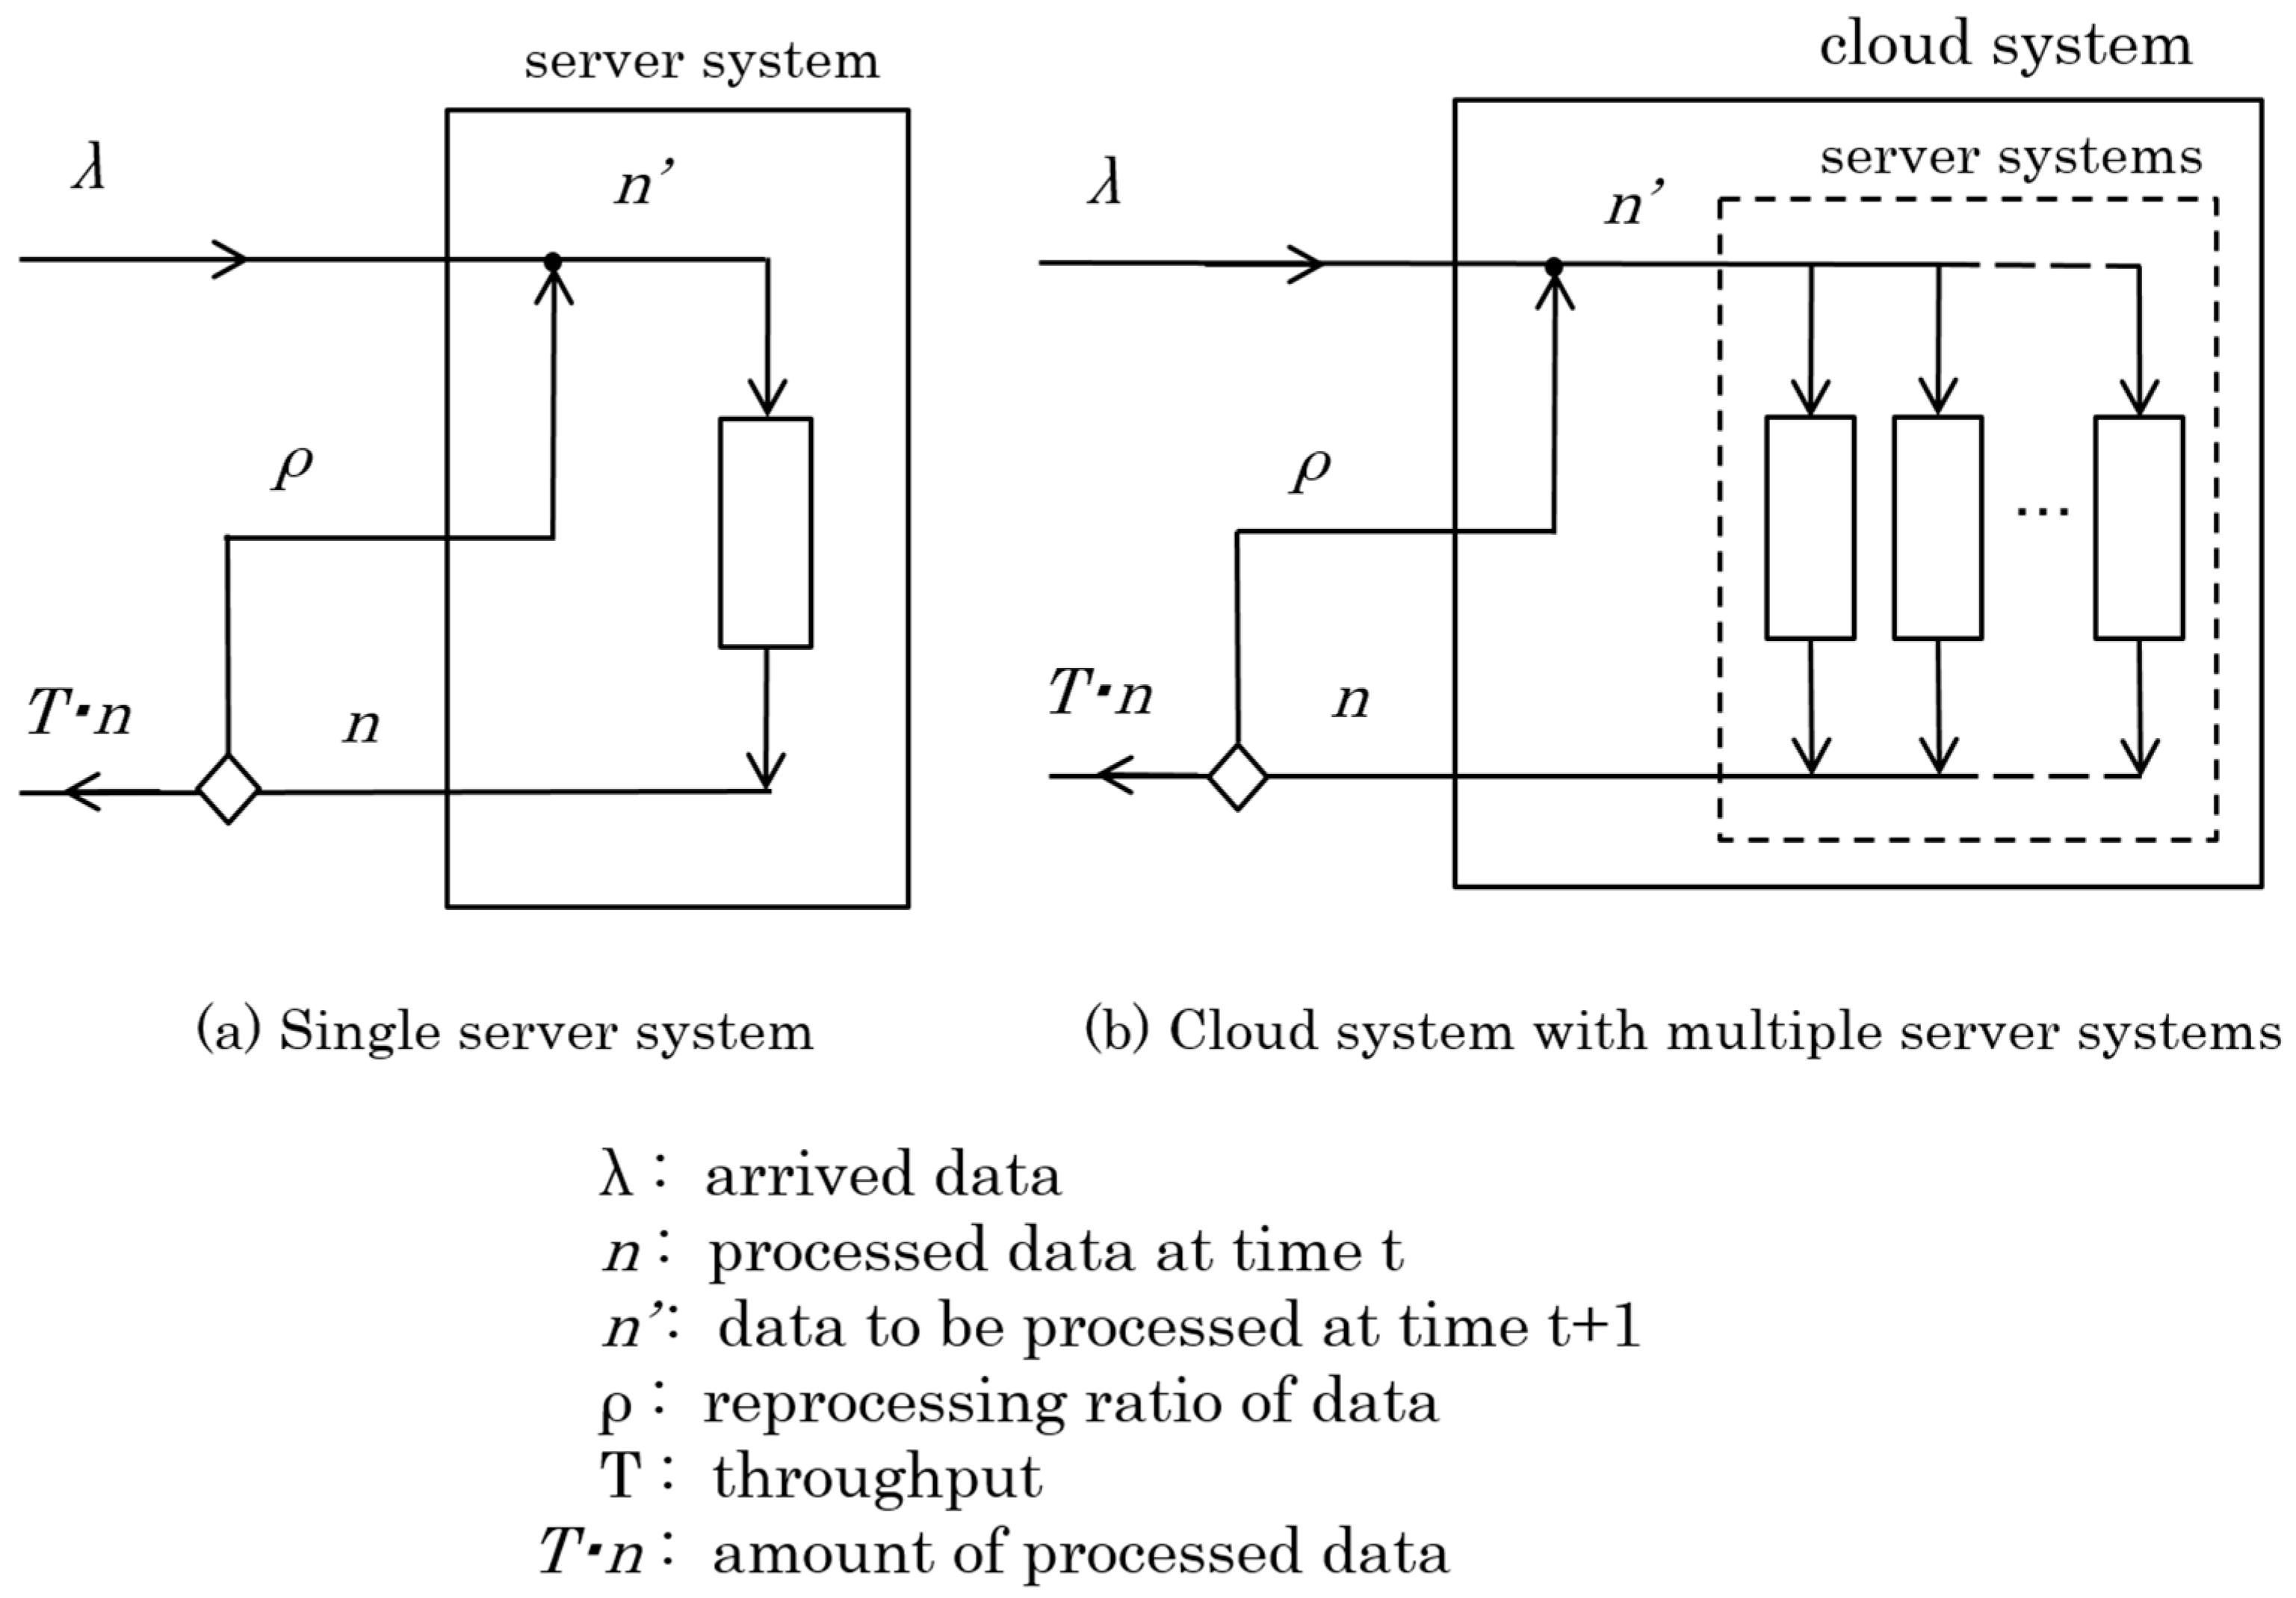
There are many studies on the analysis of various server systems run in the Internet environment. In these studies, generally, a single queuing system model is adopted as a model of a server system [16,28]. Hence, in this paper, we define a model to analyze the macroscopic behavior of a server system based on a single queuing system model, as shown in Figure 4a. This model can also be applied to a cloud system that consists of multiple server systems, as shown in Figure 4b.
The behavior of data processing for the server system of Figure 1 is modeled as
where is the arrived data, is the processed data at time t, is data processed at time t + 1, is the reprocessing ratio, and T is the throughput at time t. Then, the ratio of data processing at time t, , is defined as
Let be the probability density of finding state at time t. Then, the change of at time t is defined as
The first term of Equation (4) represents the effects that state n changes to states n + 1 and n − 1 at time t. By contrast, the second and third terms represent the effect that states n + 1 and n − 1 change to n at time t.
Next, considering the following relations:
where N is the maximum amount of data to be processed and x is the activity factor of the system, Equation (4) is rewritten as
Using a well-known procedure [29], stochastic Equation (5) is transformed into the Fokker–Plank equation with respect to fluctuation of activity factor (see Appendix A):
where is the steady state of activity factor x and fluctuation is defined as
Furthermore, the evolution of is given as (see Appendix A)
3.2. Predict Changes of the Behavioral Property Using the Variance of the Fluctuation of the Activity Factor
The variance of the fluctuation of the activity factor, is defined as
Using the Fokker–Plank Equation (6) formalized in the previous section, Equation (9) is rewritten as follows (see Appendix B):
Next, the behavioral properties of the steady states of the activity factor are analyzed. In the steady state of the system, , the condition
is satisfied. In this scenario, the system’s behavior is stable and the system works smoothly. Using Equations (8) and (10), and are calculated as
According to changes of data to be processed in the system at runtime, that is, changes of the system’s data processing load, the system’s throughput property changes occasionally. As explained in the previous section, to manage the growth of the processing load, the server system, for instance, may change its data processing capability by tuning the system configuration, such as the number of servers and resources, and the throughput property is changed dynamically. When the amount of data exceeds the level of available processing capability, the system’s throughput degrades and never recovers. To manage and control the system’s configuration suitably and maintain the server system’s characteristics, we have to know when the system’s data processing capability exceeds its limit and the throughput starts to degrade. However, it is difficult to capture various changes of the throughput property in advance. To address this problem, a method is proposed to predict the undesirable degradation of throughput by observing unusual changes of the variance of the fluctuation of the macroscopic activity factor.
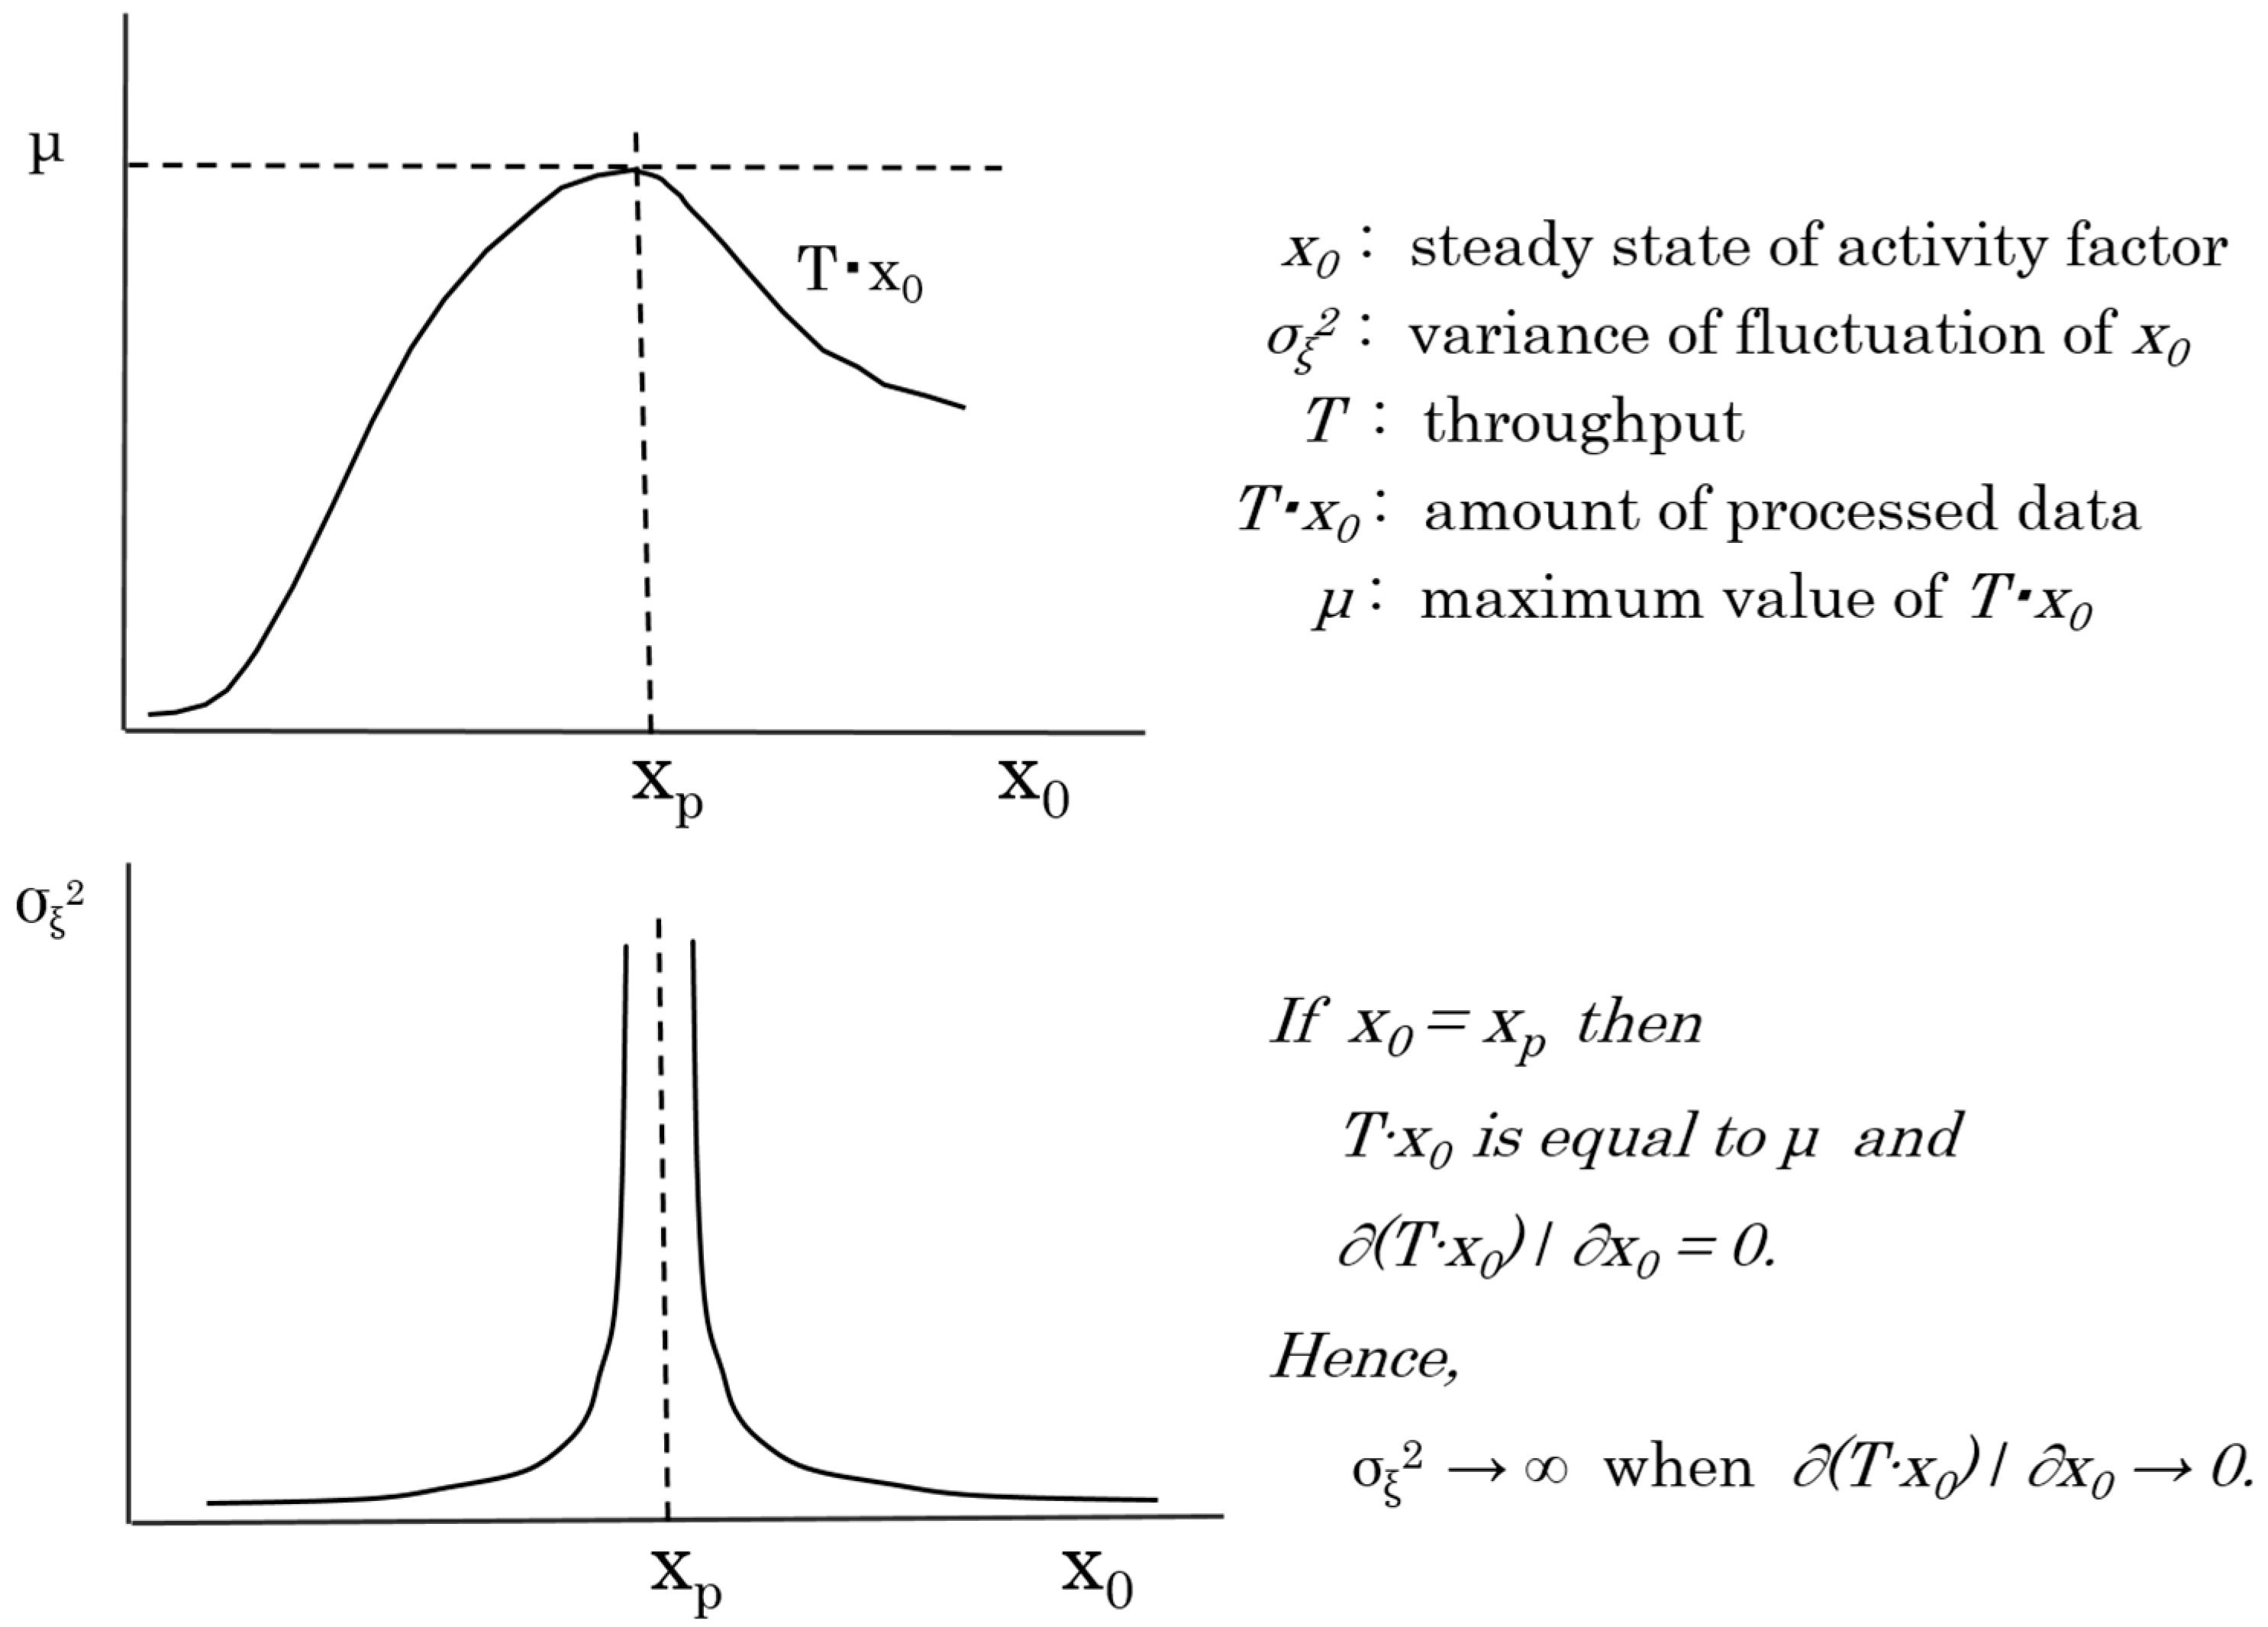
As shown in Figure 5, the variance of the fluctuation of the activity factor, , is divergent at the peak point, where the amount of processed data is equal to the maximum value . From Equations (11) and (12), it is obvious that when . Hence, it is possible to assess whether the system’s capability exceeds the limit by observing the unusual increase of at runtime for the system, and the variance of the fluctuation of the activity factor can be used to predict changes of the server system’s processing capability.
4. Experiments and Evaluation
4.1. Setting of Experiments
The proposed measure, the variance of the fluctuation of the OT of the server system, has the property of rapidly increasing before the system falls into a completely undesirable state, that is, before the degradation of the OT becomes apparent. In this Section, experiments are conducted to confirm that the proposed measure has the same behavioral characteristics as the analysis result described in Figure 5. We evaluate properties of the proposed measure by experiment using an actual server system, and verify its effectiveness as an observation measure of the server system.
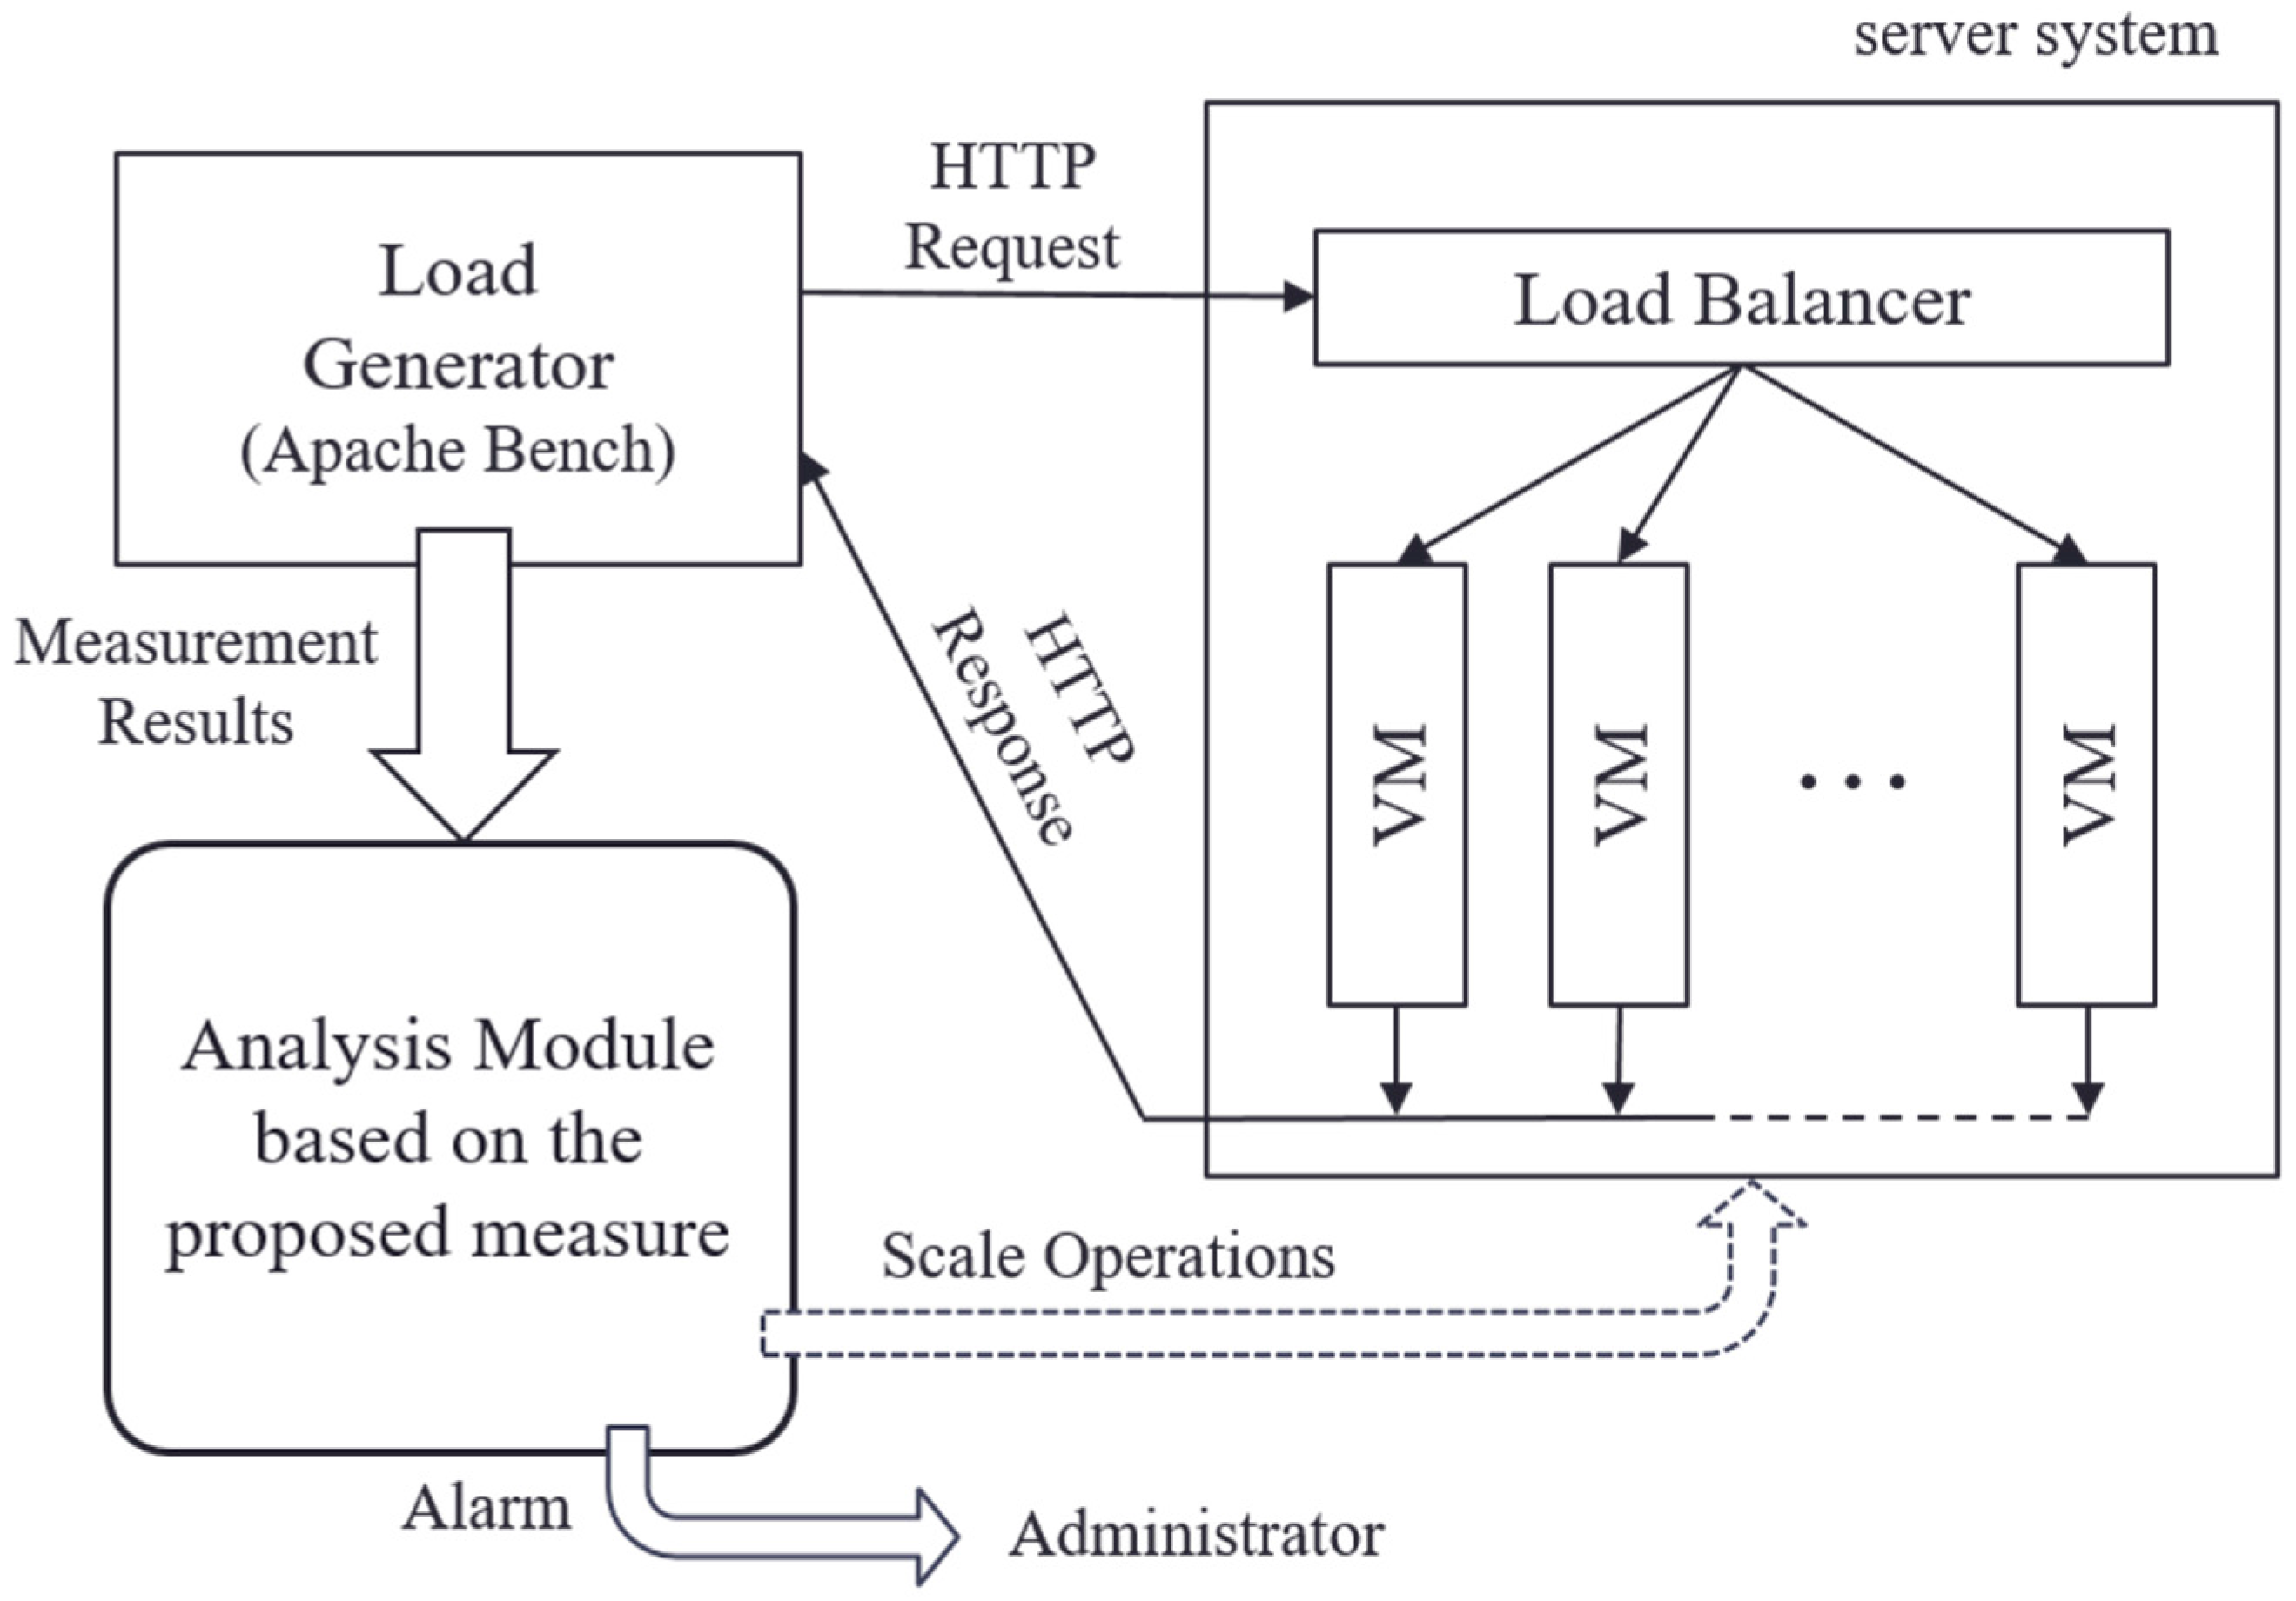
Figure 6 shows the configuration of the experimental system. In this experiment, we built a server system on the cloud computing virtualization platform VMware vSphere [4]. As a service running on the server system, we prepared a web application that dynamically generated web pages that cooperated with the database system. In the initial state, the server system was composed of a single VM (CPU: 1.795 GHz 4 core, memory: 4.0 GB), and the scaling operation was performed as necessary. As a scaling technique, we used horizontal scaling, which connected replicated VMs in parallel via a load balancer. HTTP requests to this web service were distributed to VMs via the load balancer. The allocation of requests was performed based on the weighted round robin that corresponded to the number of CPU cores of VMs so that the load of each VM was equalized.
To observe the temporal transition of the variance of the fluctuation of the activity factor of the server system based on the method formulated in Section 3, we used Apache Bench [30] as an observation tool of the operational status of the server system. Apache Bench is a standard and simple HTTP load generator. We prepared scripts to control the load generator under practical scenarios. The processing load on the server system was controlled by the number of HTTP requests per unit time arriving at the server system. To imitate realistic workloads, the number of HTTP requests was randomly determined and shifted based on the average value specified in experimental scenarios. The activity factor of the server system was observed by the transfer rate that indicated the number of requests processed per unit time. These observations were values that could be acquired by Apache Bench. Then, based on the following procedure, variance var(t) of the fluctuation of the transfer rate at time t was calculated every interval ΔT seconds.
Procedure for calculating the variance of the fluctuation of the activity factor at time t.
- Calculate fluctuation of the transfer rate at time t and obtain the smoothed value :
- Variance of the fluctuation of the transfer rate at time t is calculated by
In this experiment, we set ΔT = 1 for the measurement interval, L = 10, M = 10 for the moving average data point, and N = 10 for the number of data points for the calculation of the variance.
To verify the working hypothesis described in the previous section, three experiments were conducted. In order to understand essential features of the proposed measure, the experiments had been done under the following three conditions, i.e., , and , in the experiments, respectively:
Experiment 1.
For comparison with the results of Experiments 2 and 3, to be shown later, the transfer rate in the normal state of the server system was measured and the variance of the fluctuation was calculated. By setting the load to the range not exceeding the performance limit of the server system and measuring the transfer rate, the behavior of the server system in the normal state was observed. As shown in Figure 5, when the load on the server system is small, specifically, in the scenario where , the calculated variance of the fluctuation of the OT should be close to zero.
Experiment 2.
By increasing the load on the server system over time, the server system falls into an overloaded state. We measured the transfer rate in this scenario and checked how the variance of the fluctuation of the OT changed. As shown in Figure 5, it was expected that the variance of the OT would abnormally increase near the performance limit of the server system, that is, in the vicinity of . Furthermore, in the case of , where the load exceeds the performance limit, the variance of OT fluctuation is considered to be close to zero, as in the case of .
Experiment 3.
Opposite Experiment 2, we measured the transfer rate and calculated the variance of the fluctuation of the OT when the server system returned from the overloaded state to the normal state. As shown in Figure 5, when the server system is in an overloaded or normal state, that is, in the scenario where or , the variance of the fluctuation of the OT is expected to be close to zero. Moreover, even when the server system returns from the overloaded state to the normal state, it is expected that the variance of the fluctuation of the OT will abnormally increase in the vicinity of .
Furthermore, by utilizing the characteristics of the proposed observation measure verified in the above experiments, we implemented a prototype function to detect a state in which the server system falls into an overloaded state. Then, a fourth experiment was conducted using the experimental server system, in which the prototyped function was embedded. We verified that the proposed measure can detect the scenario in which the server system is falling into an overloaded state, and that the scaling operation can be executed before the OT of the server system completely degrades. We showed that the overload is avoided by applying scaling with the precise timing using the prototype function embedded in the proposed measure and the fact that the OT of the server system can be maintained continuously and stably.
4.2. Experiment 1
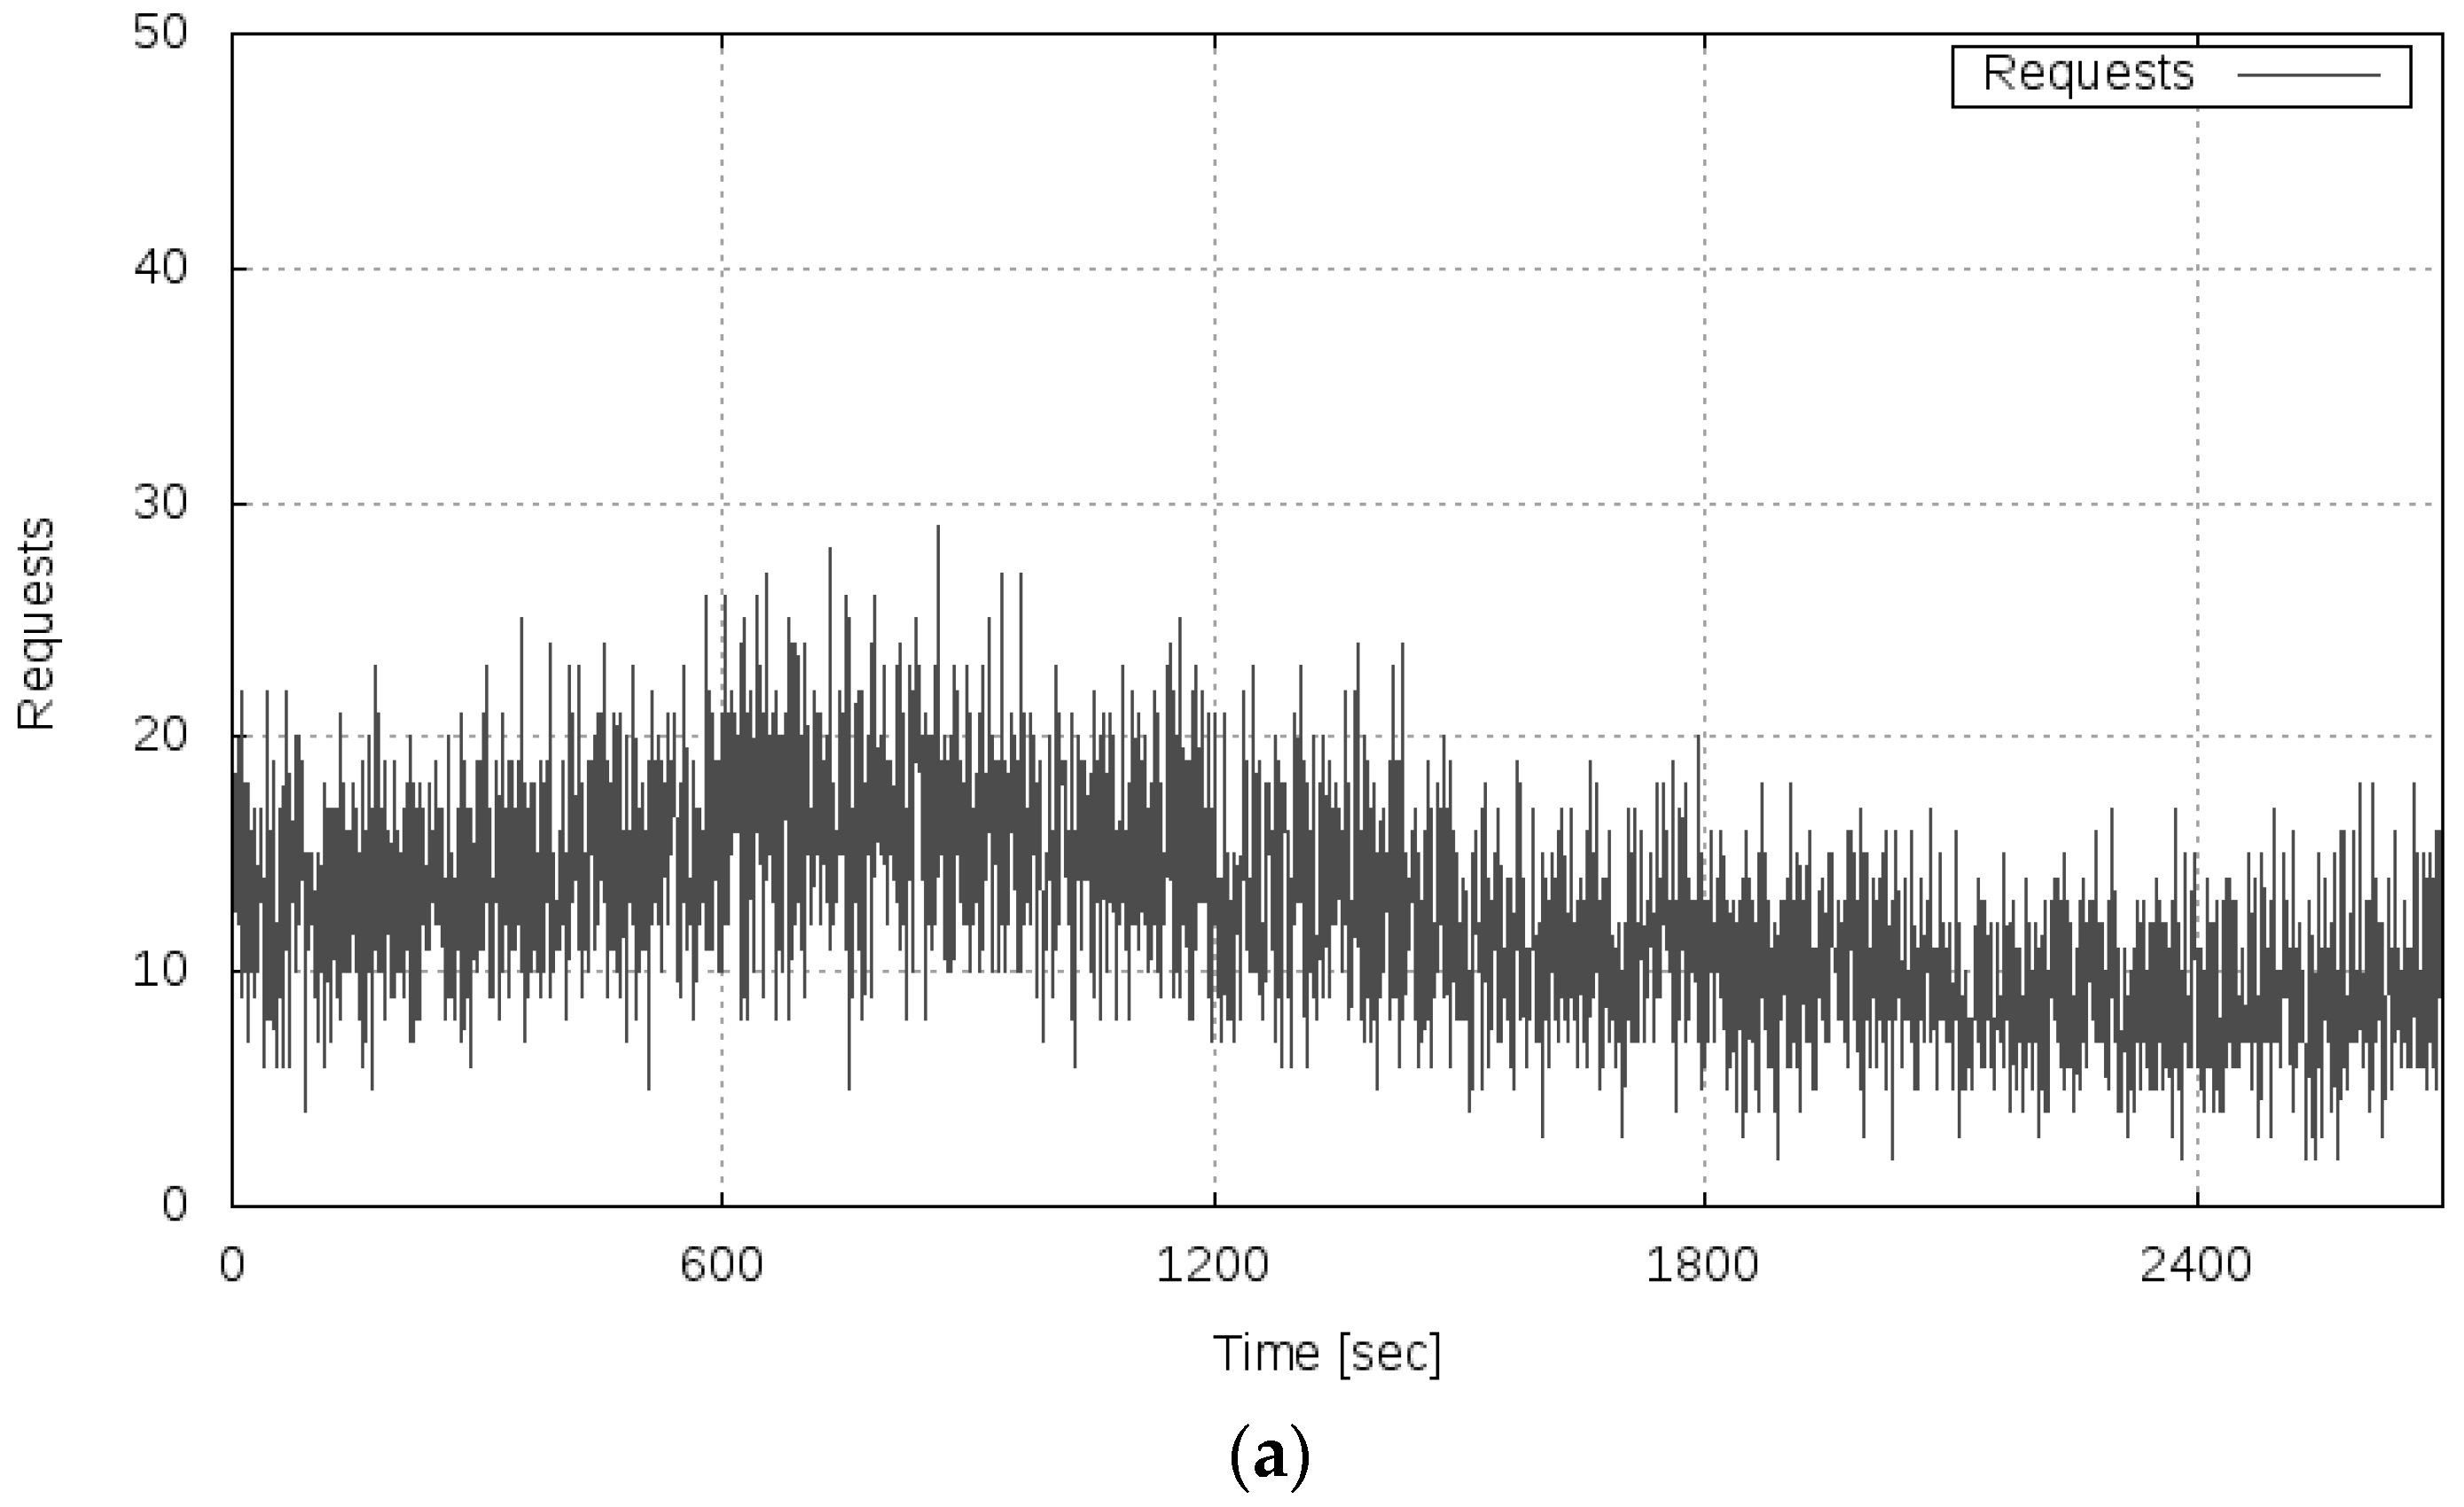
In Experiment 1, the transfer rate was measured, and the average load on the server system was set within the range that did not exceed the performance limit of the server system, specifically, an average of 11 requests per second.
Figure 7 shows the results of Experiment 1. Figure 7a shows the transition of the server load (the number of requests), Figure 7b shows the transition of the observed transfer rate, and Figure 7c shows the behavior of the variance of the fluctuation of the observed transfer rate. As can be seen from Figure 7b, under the conditions of this experiment, the server system ran stably, that is, it did not fall into an overloaded state. Additionally, as shown in Figure 7c, the variance of the fluctuation of the transfer rate remained almost zero. From this result, it is confirmed that the variance of the fluctuation of the OT of the server system did not increase when the amount of computing resources of the server system was sufficient for the server load, as the analysis result described in Section 3.
4.3. Experiment 2
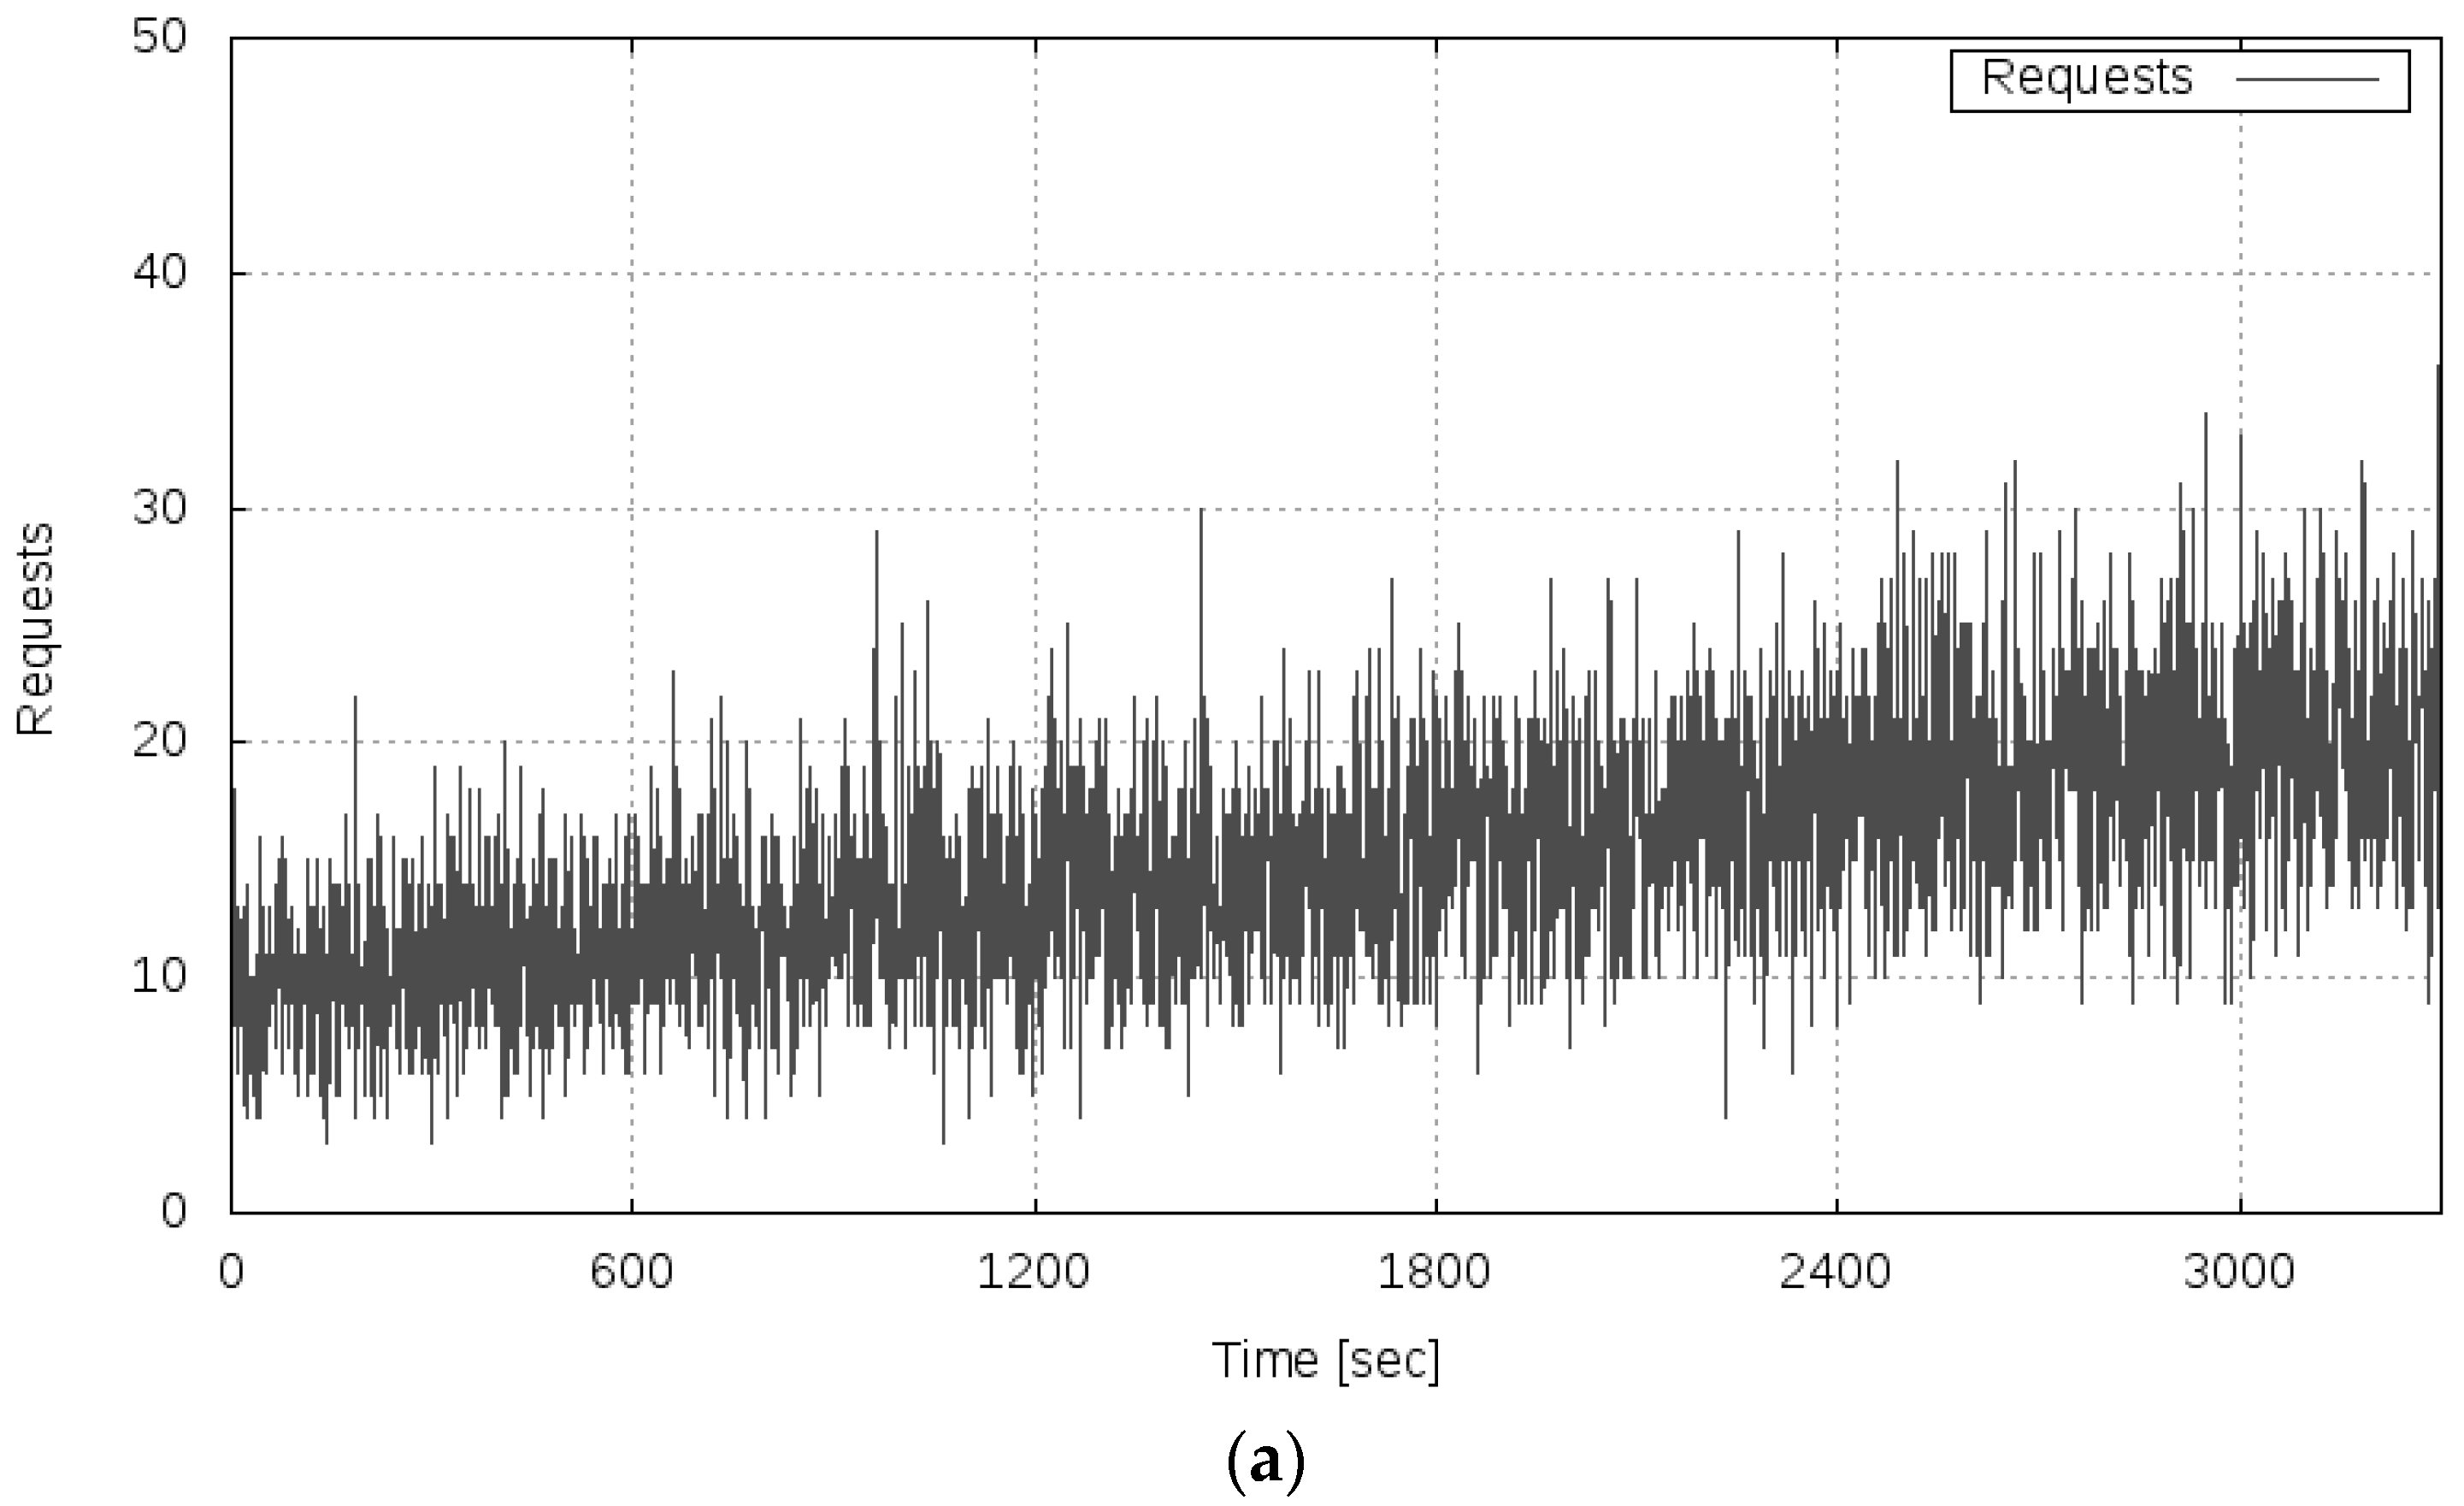
In Experiment 2, the server load (the number of requests) was gradually increased, and the server system fell into an overloaded state. From the result of the theoretical analysis described in Section 3, it was expected that the variance of the fluctuation of the transfer rate would drastically increase immediately before the server system fell into an overloaded state because of the increase in load. Furthermore, after the server system was in a completely overloaded state, the variance of the fluctuation of transfer rate was expected to decrease again. In this experiment, the server load was set to an average of 10 requests per second, which was considered to cause the server system to run stably at the start of the measurement. Then, the average number of requests was incremented by 1 every 300 s. At the time point of 3000 s, the server load achieved an average of 20 requests per second.
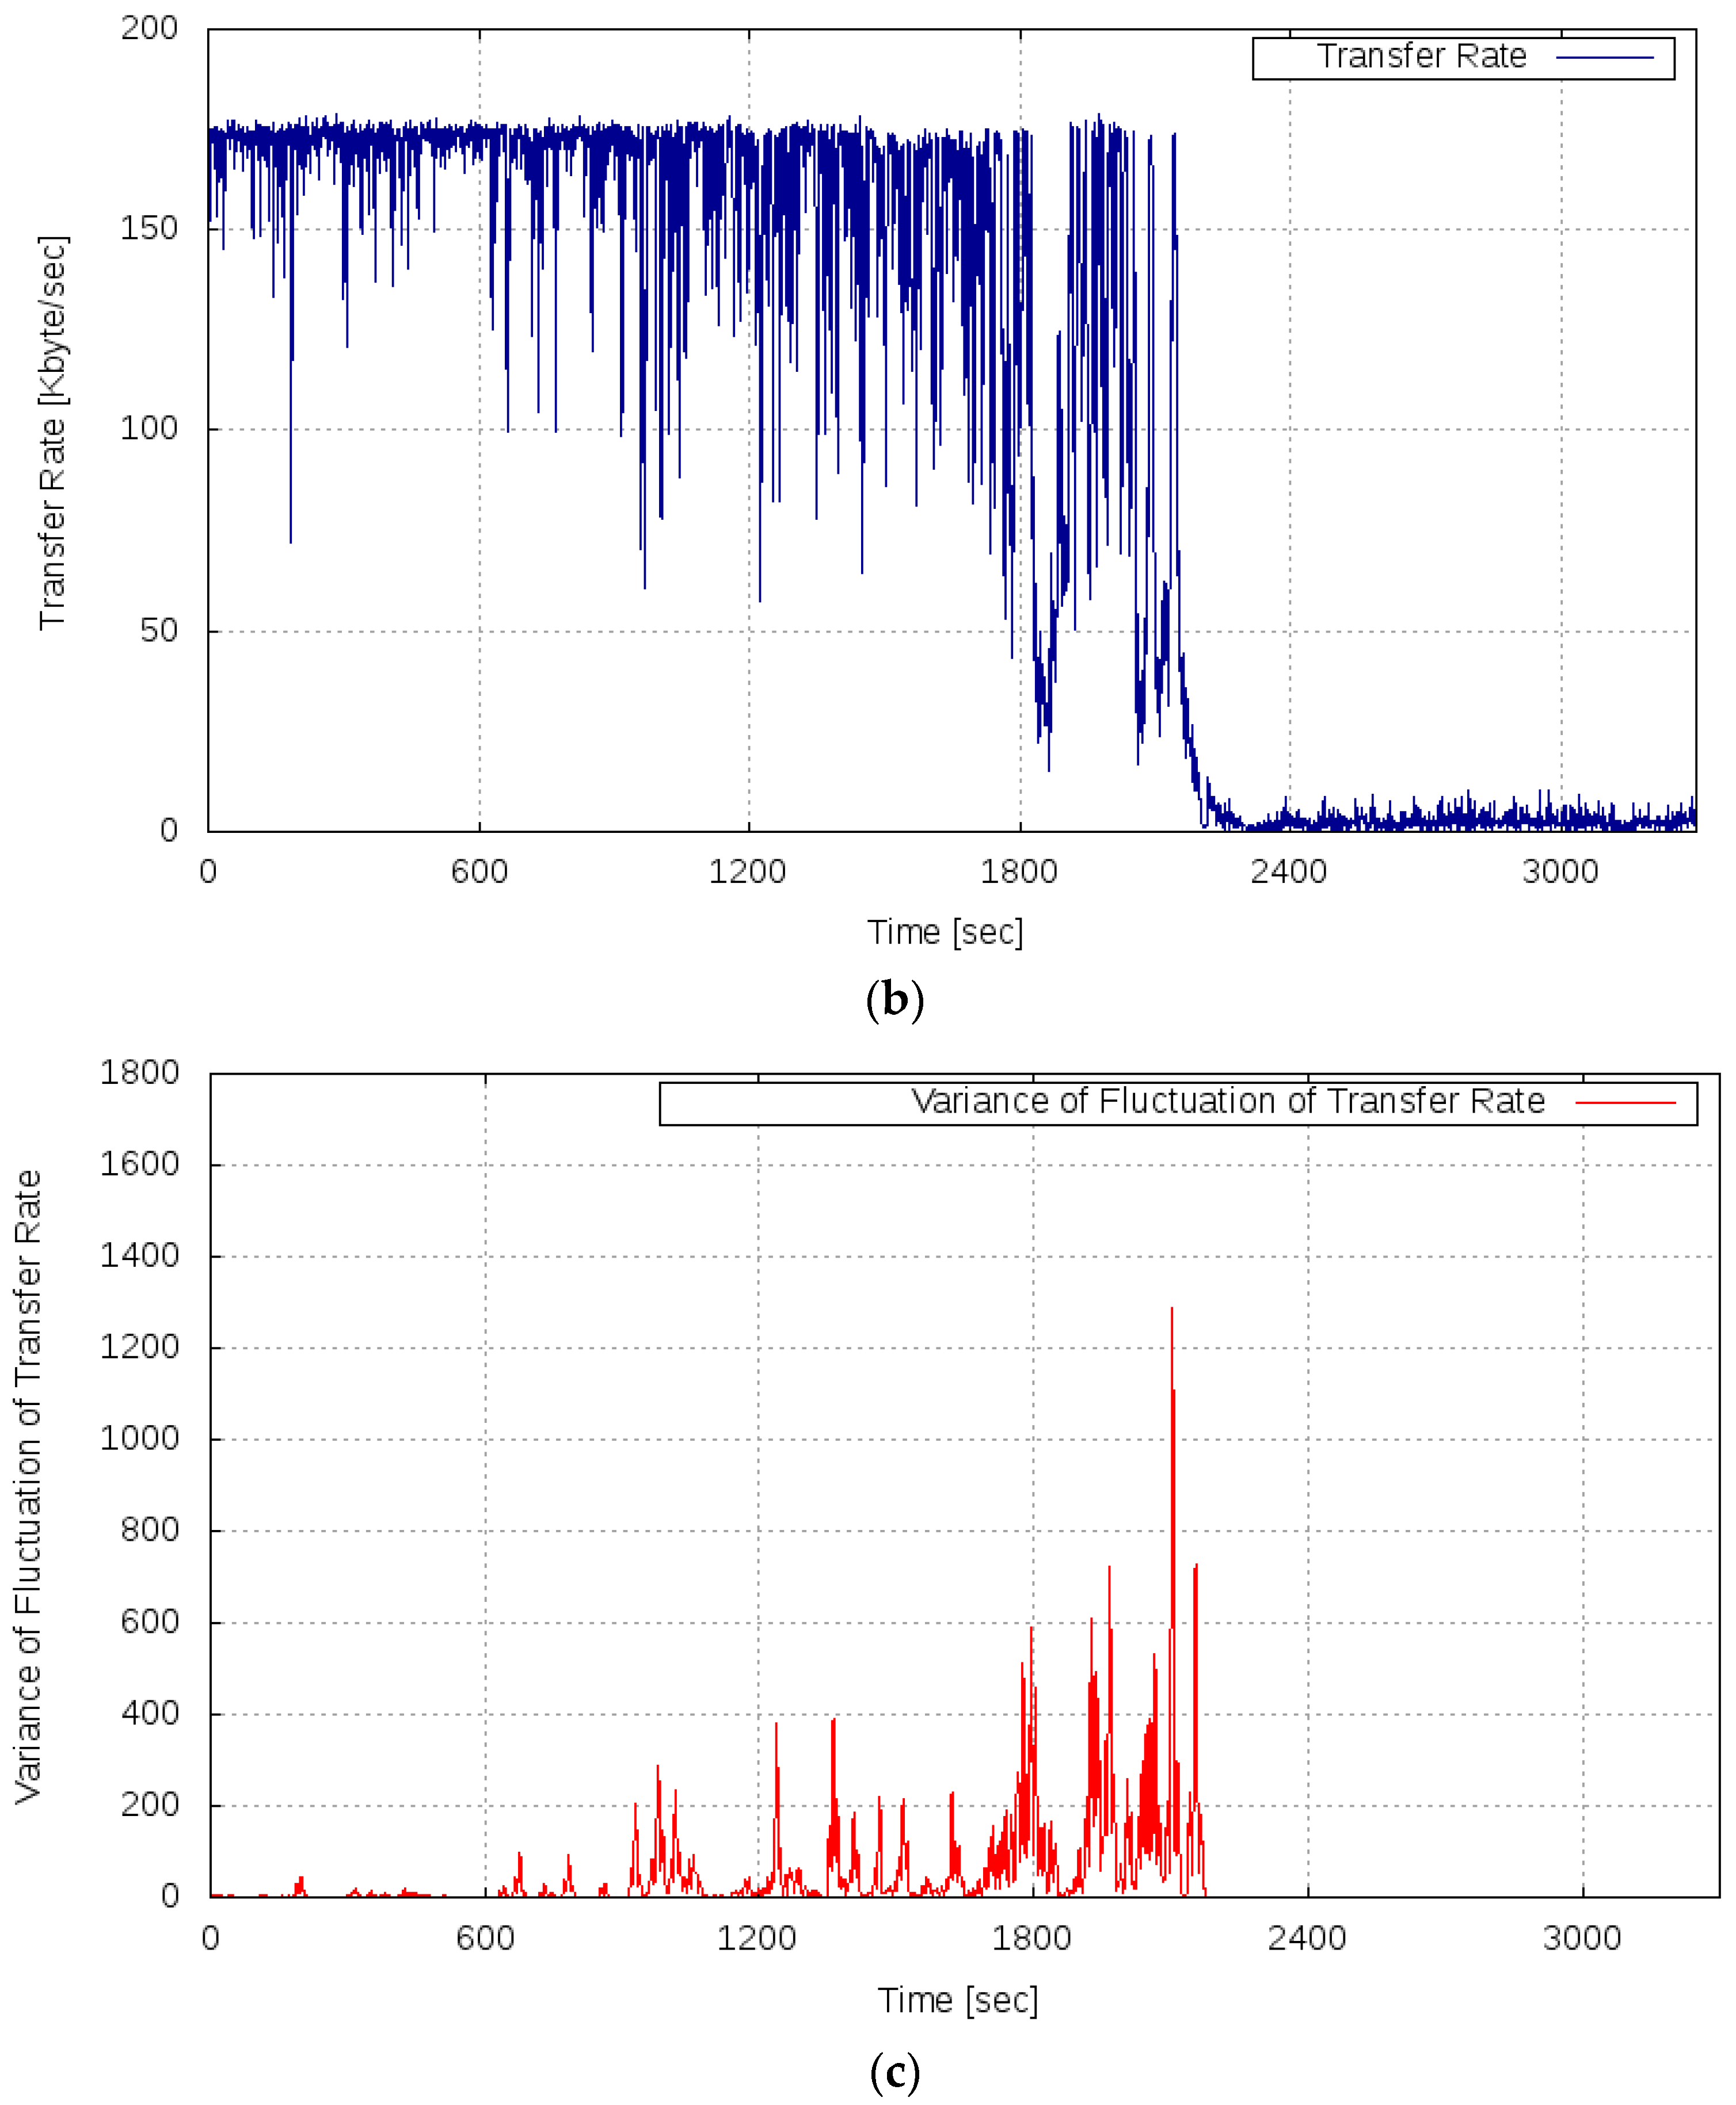
Figure 8 shows the results of Experiment 2. Figure 8a shows the transition of the server load, Figure 8b shows the measured transfer rate, and Figure 8c shows the variance of the fluctuation of the transfer rate.
As seen in Figure 8b, in the period of 0–1799 s, the server system maintained the transfer rate of approximately 175 Kbyte/s, similar to the result of Experiment 1. Furthermore, a phenomenon was confirmed such that the transfer rate’s sharp decrease occurred in the period of 1800–2099 s, when the load increased and reached 16 requests per second on average. Then after 2100 s, it can be confirmed that the transfer rate dropped to nearly zero and the server system became overloaded. These results show that the degradation of the OT could be observed only after the server system shifted to the overloaded state because of the nonlinear dynamics of the server system under a high load.
As shown in Figure 8c, it can be confirmed that the variance of the fluctuation of the OT increased in the period of 900–1799 s before the server system fell into the overloaded state. In the period of 1800–2099 s, that is, immediately before the server system was completely overloaded, the increase in the variance of the fluctuation of the OT could be confirmed more notably. In the period after 2400 s, when the server system was completely overloaded, the variance of the fluctuation converged to almost zero again. From these results, it is confirmed that the variance of the fluctuation of the transfer rate drastically increased immediately before the server system fell into the overloaded state, and the variance of the fluctuation of the transfer rate decreased to almost zero when the server system was in the overloaded state.
4.4. Experiment 3
In Experiment 3, the OT of the server system when recovering from the overloaded state to the normal state was measured and the variance of the fluctuation of the OT was calculated. Then, we verified the behavioral property of the variance of the fluctuation of the transfer rate when the load decreased and the server system recovered from the overloaded state to the normal state. According to the analysis result, it was expected that the variance of the fluctuation of the transfer rate would rapidly increase just before the server system returned to the normal state. In this experiment, the overloaded state was caused by gradually increasing the server load, and then the load was gradually decreased to restore it to the normal state again. Table 1 shows the setting of the temporal transition of the server load (the number of requests) in this experiment. The server load was an average of 13 requests per second at the start of the measurement, and thereafter every 300 s, the average number of requests per second was increased by two. Then, the number of requests was decreased from time 900 s, when it was assumed that the server system was in an overloaded state.
Figure 9 shows the results of Experiment 3. Figure 9a shows the transition of the server load, Figure 9b shows the measured transfer rate, and Figure 9c shows the variance of the fluctuation of the transfer rate.
As shown in Figure 9b, it can be confirmed that the server system catastrophically became overloaded in the period of 600–899 s because of the increase in server load. Then, as the load decreased, the server system began to recover in the period of 1200–1499 s, and after 1500 s, the normal state was restored.
By contrast, it can be seen that the variance of the fluctuation of the transfer rate shown in Figure 9c increased in the period of 0–599 s. This phenomenon, by which the variance of the fluctuation of the transfer rate increased as a sign of the overload condition, is equal to the result of Experiment 2. In the period of 600–1199 s, while the server system was in the overloaded state, the variance of the fluctuation of the OT was in the vicinity of zero. It can be confirmed that the variance of the fluctuation increased again in the period of 1200–1499 s. After 1500 s, the variance of the fluctuation converged to almost zero as the server system recovered to the normal state. From these results, it was confirmed that the variance of the fluctuation of the transfer rate increased immediately before the server system returned from the overloaded state to the normal state. Therefore, we confirmed the behavioral property as suggested in the proposed method concerning the variance of the fluctuation of the server system.
From the results of Experiments 1–3 using the experimental server system, it is confirmed that the proposed measure, that is, “variance of the fluctuation of OT,” has the same behavioral characteristics as the analysis result described in Section 3. In Experiment 1, it was confirmed that the variance of the fluctuation of the transfer rate took a value close to zero when the server system was in a normal state (). In Experiment 2, it was confirmed that the variance of the fluctuation of the transfer rate rapidly increased immediately before the processing capability of the server system began to decrease because of an increase in the load (), and the proposed measure converged to almost zero after the server system was in an overloaded state (). Furthermore, in Experiment 3, it was confirmed that even when the server system returned from the overloaded state to the normal state because of a decrease in server load, the variance of the fluctuation of the transfer rate rapidly increased in the vicinity in which . From these results, it is confirmed that the proposed measure formulated based on a macroscopic analysis of the operational state of the server system, that is, the variance of the fluctuation of the OT of the server system, can be used to detect the sign of the overloaded state of the service.
4.5. Service Scaling Based on the Proposed Measure
Based on the results of previous experiments, to confirm the applicability of the proposed measure in the actual server system, we prototyped a function to detect a scenario in which the server system is falling into an overloaded state using the proposed measure. Specifically, a function to generate an alarm when the variance of the fluctuation of the OT of the server system is rapidly increasing was implemented and embedded into the experimental server system. In the experiment described in this section, it is verified whether the overloaded state of the service can be avoided by executing the scaling operation based on the alarm issued by the prototype system.
The simple procedure of alarm generation used in this experiment is shown below.
[Alarm generation procedure at discrete time point p]
- -
- At discrete time point p, the result of an observation is given by a time series of observed values; that is, {}, where .
- -
- The interval of the adjoining observed values, , is given by .
- -
- H (H ≥ 0) and C (C ≥ 0) are predefined thresholds.
- -
- Window size W (W ≥ 0) is a predefined value.
- -
- The score at time point p, , is calculated in this procedure.
- -
- At initial time point and .
- -
- ifthenelse {if andthen {if then “Generate Alarm”}else }}
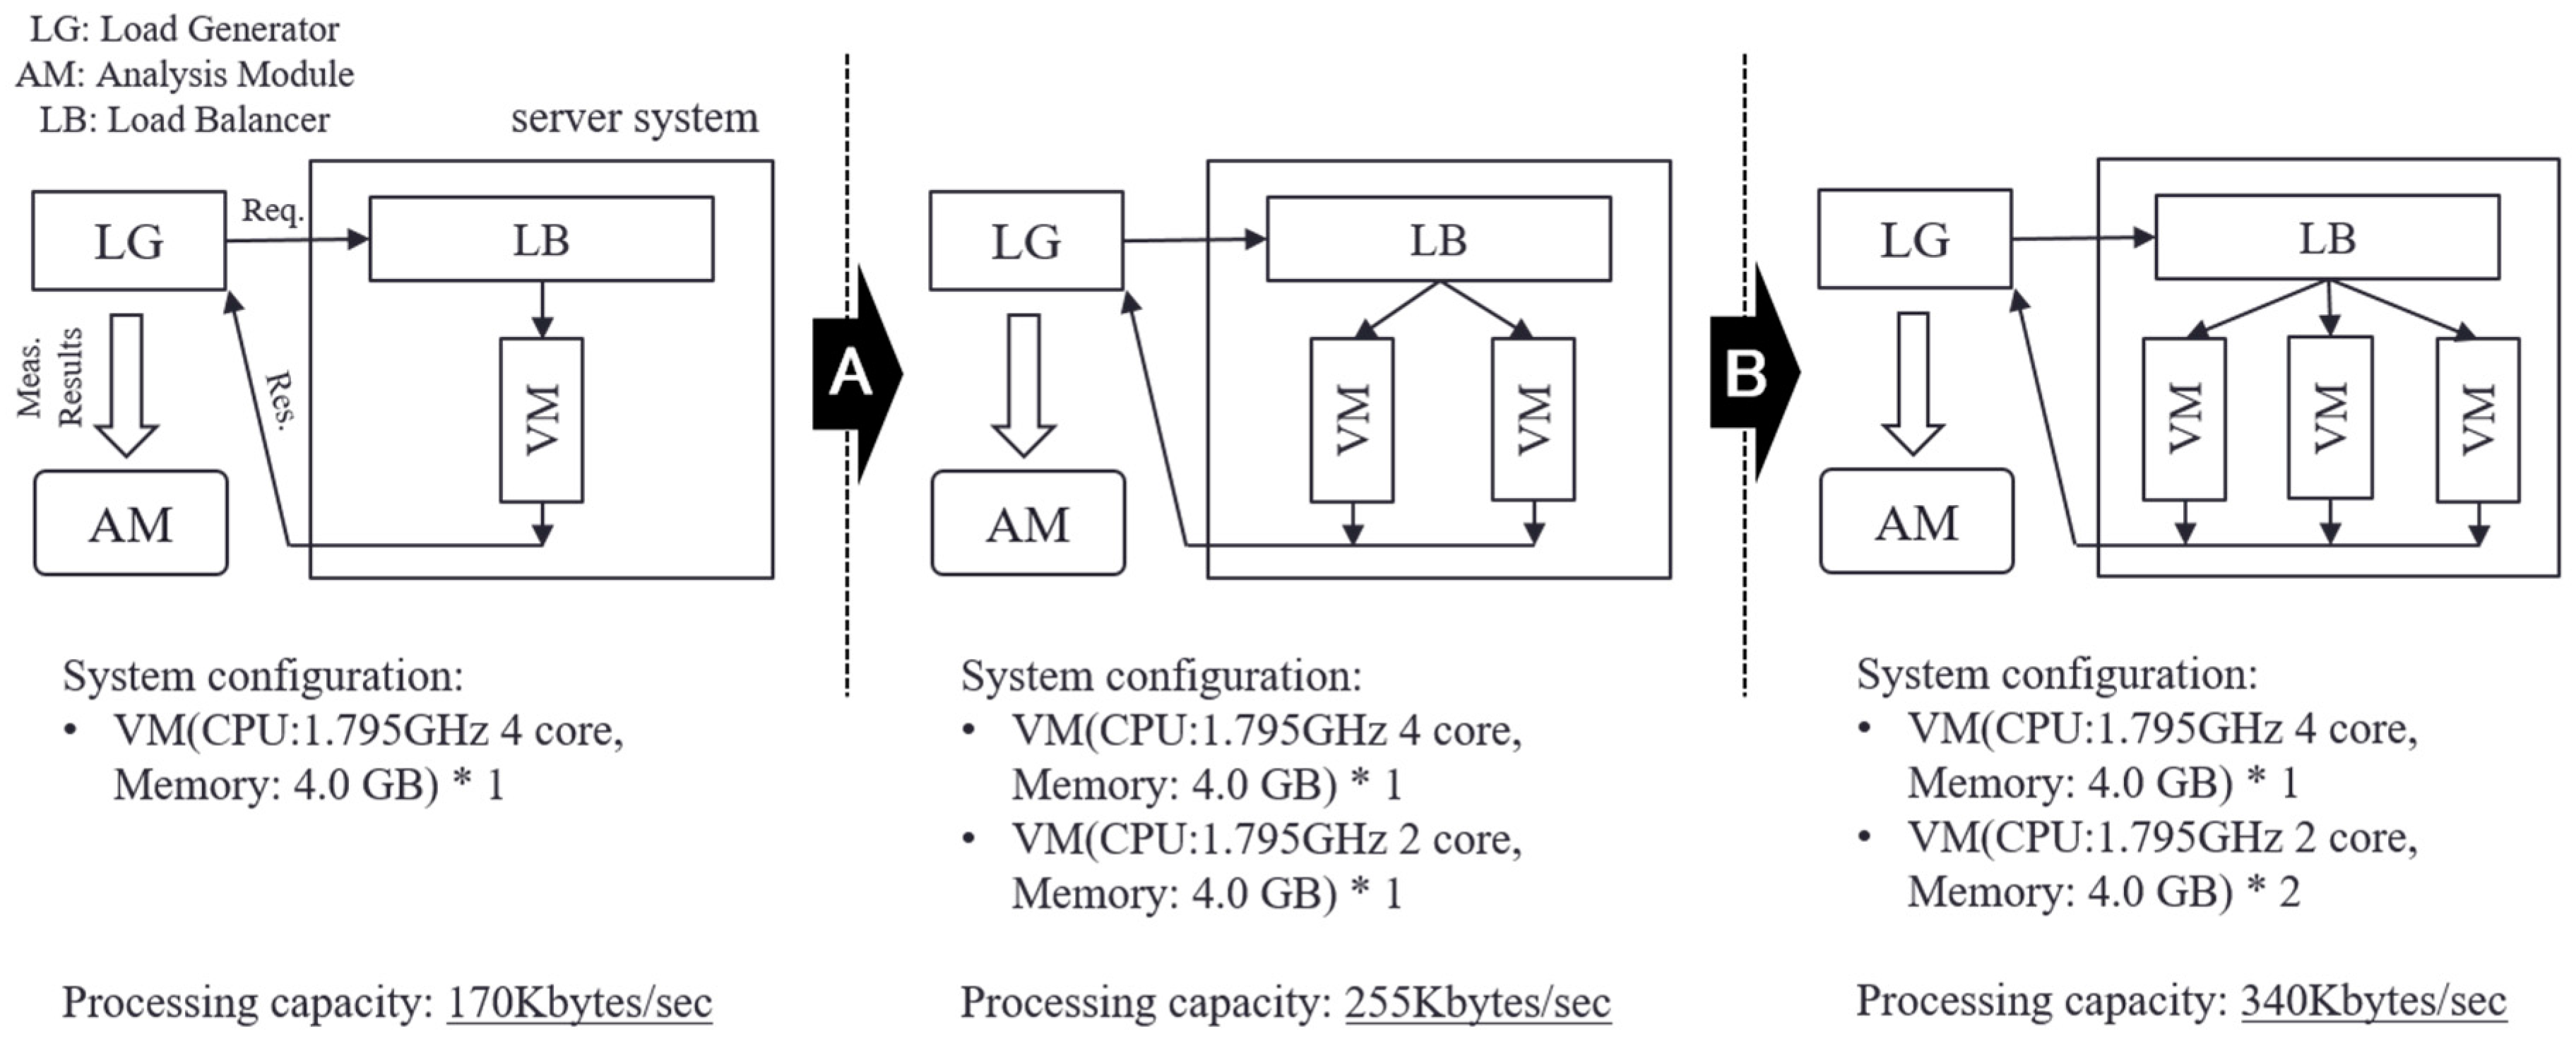
In this experiment, we set H = 200, C = 3, and W = 180. This is a setting to generate an alarm when a peak exceeding 200 is observed three times or more in the period of 180 s. When an alarm was generated, the service was scaled by connecting in parallel the replicated VM (CPU: 1.795 GHz 2 core, memory: 4.0 GB) via the load balancer. The server load was an average of 10 requests per second at the start time (0 s), and increased by one every 300 s. This is same as the setting for Experiment 2.
Figure 10 shows the results of this experiment. Figure 10a shows the transition of the server load, Figure 10b shows the measured transfer rate, and Figure 10c shows the variance of the fluctuation of the transfer rate and the alert log.
As shown in Figure 10b, even when the server load increased, the phenomenon that catastrophically decreased the transfer rate did not occur in this experiment. It can be seen that the transfer rate improved at the time points of approximately 1600 s and 3600 s, which is because the processing capability of the server system was reinforced by the scaling of the service.
From Figure 10c, it can be confirmed that alerts were issued at the time point of approximately 1600 s (time point A) and 3600 s (time point B). By scaling the service based on the alert, the server system became stable and the variance of the fluctuation of the OT decreased. Figure 11 shows changes in system configuration during this experiment. At time points A and B, the service was scaled by connecting VMs, and the processing capacity of the server system gradually improved. As mentioned above, the improvement of the processing capacity of the service can be confirmed from Figure 10b. In Experiment 2, conducted under the same condition regarding the server load, the transfer rate decreased in the period of 1800–2099 s. By contrast, in this experiment, the prototype system detected the sign of the overloaded state of the service based on the proposed measure and avoided the server system becoming overloaded by executing a scaling operation in advance. Therefore, using the alarm generation function prototyped based on the proposed method, it is shown that the scaling operation was performed at an accurate time, and the overloaded state of the service could be avoided.
Furthermore, from the experimental results, it can be confirmed that even after the operational characteristics of the server changed because of scaling, the sign of the overloaded state was detected again without adjusting the alarm-generating mechanism. In the case of predicting the overloaded state based on prior knowledge or the operational characteristic attained by benchmarking, for example, setting a threshold based on the number of requests per unit time, it was necessary to readjust the alarm generation function after the scaling operation. Because the readjustment of such a function requires knowledge and the operational characteristics of the server system after scaling, it limits the elasticity, which is an advantage of the cloud environment, as described in Section 2. In contrast, the proposed measure could detect the sign of the overloaded state without depending on the operational characteristics of the fluctuating server system and requiring knowledge of a specific environment. Therefore, the proposed measure based on the macroscopic viewpoint, the variance of the fluctuation of the OT of the server system, solves the problem related to the acquisition of the fluctuating operational state of the server system, and provides a useful approach for enabling the construction and operation of services that utilize the elasticity of the cloud environment.
5. Conclusions
In this paper, we focused on the management of server systems that include cloud systems and proposed a new method for detecting the sign of an undesirable state before the system becomes overloaded as a result of various causes. We focused on the fluctuation included in the OT, which is an observable value of the operational state of the server system. Based on a theoretical analysis of the characteristics of fluctuation using the behavior model of the server system, we proposed the variance of the fluctuation of the OT as a new observation measure. The proposed measure has the property of drastically increasing before the server system is in an undesirable state, that is, before server performance declines. Accordingly, using the measure, we realized the function to detect that the server system is falling into an overload scenario, and we demonstrated the effectiveness of the proposed measure through evaluation experiments. From the experimental results, we confirmed that the proposed measure behaves as shown in the theoretical analysis, even in an actual system. Using the proposed measure, it becomes possible to accurately assess the timing of executing the scaling operation, and it is shown that the overloaded state of the service can be avoided in advance. Furthermore, the proposed measure can detect the sign of the overloaded state without depending on the operational characteristics of the fluctuating server system and requiring knowledge of a specific environment. Therefore, using the proposed measure, it becomes possible to accurately capture the operational state of the changing server system, and it is also possible to achieve the continuous and stable operation of cloud-hosted services by fully utilizing elasticity.
In this paper, we examined the feasibility of the proposed measure for the degradation of the performance of the server system as a result of the increase of server load. Next, we will study the effectiveness of the proposed method by targeting the degradation of processing performance that results from different causes, for example, equipment failure of the server system. Our future work will focus on the remaining problems such as practical strategies and mechanisms of efficient assignment and control of computing resources utilizing the proposed measure.
Acknowledgments
This work was partially supported by a Grant-in-Aid for Scientific Research (C) No. 16K00292, from Japan Society for the Promotion of Science (JSPS).
Author Contributions
All authors extensively discussed the contents of this paper; Yusuke Tanimura and Tetsuo Kinoshita performed experiments and analyzed results; Yusuke Tanimura drafted the manuscript; Kazuto Sasai, Gen Kitagata and Tetsuo Kinoshita advised on manuscript revision.
Conflicts of Interest
The authors declare no conflict of interest.
Appendix A. Derivation of the Fokker–Plank Equation
Equation (5) is transformed using a Taylor expansion with respect to small :
Next, is the steady state of activity factor x, and fluctuation ξ is defined as
Then, the following relations are applied to Equation (6):
Equation (A1) is rewritten as
In Equation (A4), the terms of are derived for the cases of and ; and and :
Hence, the Fokker–Plank Equation (6) is derived.
Moreover, in Equation (A4), the terms of are derived for the case of and :
Hence, Equation (8) is derived.
Appendix B. Derivation of the Variance of the Fluctuation of the Activity Factor
Using the Fokker–Plank Equation (6) formalized in the previous appendix, the first and second terms of Equation (9) are rewritten as
Then,
Hence, Equation (10) is derived.
References
- Martin, P.; Brown, A.; Powley, W.; Vazquez-Poletti, J.L. Autonomic management of elastic services in the cloud. In Proceedings of the 2011 IEEE Symposium on Computers and Communications (ISCC), Kerkyra, Greece, 28 June–1 July 2011; pp. 135–140. [Google Scholar]
- Kirschnick, J.; Alcaraz Calero, J.M.; Goldsack, P.; Farrell, A.; Guijarro, J.; Loughran, S.; Edwards, N.; Wilcock, L. Towards an architecture for deploying elastic services in the cloud. Softw. Pract. Exp. 2012, 42, 395–408. [Google Scholar] [CrossRef]
- Kim, I.K.; Steele, J.; Qi, Y.; Humphrey, M. Comprehensive elastic resource management to ensure predictable performance for scientific applications on public IaaS clouds. In Proceedings of the 2014 IEEE/ACM 7th International Conference on Utility and Cloud Computing, London, UK, 8–11 December 2014; pp. 355–362. [Google Scholar] [CrossRef]
- Gulati, A.; Holler, A.; Ji, M. Vmware distributed resource management: Design, implementation, and lessons learned. VMware Tech. J. 2012, 1, 45–64. [Google Scholar]
- Barham, P.; Dragovic, B.; Fraser, K.; Hand, S.; Harris, T.; Ho, A.; Neugebauer, R.; Pratt, I.; Warfield, A. Xen and the art of virtualization. In Proceedings of the Nineteenth ACM Symposium on Operating Systems Principles—SOSP’03, Bolton Landing, NY, USA, 19–22 October 2003; ACM Press: New York, NY, USA, 2003; p. 164. [Google Scholar]
- Hyper-V. Available online: https://www.microsoft.com/en-us/cloud-platform/server-virtualization (accessed on 6 September 2017).
- Cockcroft, A. Utilization is virtually useless as a metric! In Proceedings of the Annual International Conference of the Computer Measurement Group 2006 (CMG2006), Reno, NV, USA, 3–8 December 2006; pp. 612–617. [Google Scholar]
- Hummaida, A.R.; Paton, N.W.; Sakellariou, R. Adaptation in cloud resource configuration: A survey. J. Cloud Comput. 2016, 5, 7. [Google Scholar] [CrossRef]
- Ferretti, S.; Ghini, V.; Panzieri, F.; Pellegrini, M.; Turrini, E. QoS-Aware Clouds. In Proceedings of the 2010 IEEE 3rd International Conference on Cloud Computing, Miami, FL, USA, 5–10 July 2010; pp. 321–328. [Google Scholar]
- Singh, S.; Chana, I. QoS-aware autonomic resource management in cloud computing. ACM Comput. Surv. 2015, 48, 1–46. [Google Scholar] [CrossRef]
- Hwang, R.; Lee, C.; Chen, Y.; Zhang-Jian, D.-J. Cost optimization of elasticity cloud resource subscription policy. IEEE Trans. Serv. Comput. 2014, 7, 561–574. [Google Scholar] [CrossRef]
- Dib, D.; Parlavantzas, N.; Morin, C. SLA-based profit optimization in cloud bursting PaaS. In Proceedings of the 2014 14th IEEE/ACM International Symposium on Cluster, Cloud and Grid Computing, Chicago, IL, USA, 26–29 May 2014; pp. 141–150. [Google Scholar]
- Li, Z.; Wu, G. Optimizing VM live migration strategy based on migration time cost modeling. In Proceedings of the 2016 Symposium on Architectures for Networking and Communications Systems—ANCS’16, Santa Clara, CA, USA, 17–18 March 2016; ACM Press: New York, NY, USA, 2016; pp. 99–109. [Google Scholar]
- Poellabauer, C.; Schwan, A.; West, R. Lightweight kernel/user communication for real-time and multimedia applications. In Proceedings of the 11th International Workshop on Network and Operating Systems Support for Digital Audio and Video—NOSSDAV’01, Port Jefferson, NY, USA, 25–26 June 2001; ACM Press: New York, NY, USA, 2001; pp. 145–154. [Google Scholar]
- Garroppo, R.G.; Giordano, S.; Spagna, S.; Niccolini, S. Queueing strategies for local overload control in SIP server. In Proceedings of the 2009 IEEE Global Telecommunications Conference, Honolulu, HI, USA, 30 Novmeber–4 December 2009; pp. 1–6. [Google Scholar]
- Elleithy, K.M.; Komaralingam, A. Using a queuing model to analyze the performance of web servers. In Proceedings of the International Conference on Advances in Infrastructure for Electronic Business, Education, Science, and Medicine on the Internet, L’Aquila, Italy, 29 July–4 August 2002. [Google Scholar]
- Mosberger, D.; Jin, T. httperf—A tool for measuring web server performance. ACM Sigmetrics Perform. Eval. Rev. 1998, 26, 31–37. [Google Scholar] [CrossRef]
- Banga, G.; Druschel, P. Measuring the capacity of a Web server under realistic loads. World Wide Web 1999, 2, 69–83. [Google Scholar] [CrossRef]
- Apache JMeter. Available online: http://jmeter.apache.org/ (accessed on 6 September 2017).
- Tsung. Available online: http://tsung.erlang-projects.org/ (accessed on 6 September 2017).
- Dilley, J.; Friedrich, R.; Jin, T.; Rolia, J. Web server performance measurement and modeling techniques. Perform. Eval. 1998, 33, 5–26. [Google Scholar] [CrossRef]
- Abdelzaher, T.F.; Lu, C.Y. Modeling and performance control of Internet servers. In Proceedings of the 39th IEEE Conference on Decision and Control (Cat. No.00CH37187), Sydney, Australia, 12–15 December 2000; Volume 3, pp. 2234–2239. [Google Scholar]
- Cao, J.; Andersson, M.; Nyberg, C.; Kihl, M. Web server performance modeling using an M/G/1/K*PS queue. In Proceedings of the 10th International Conference on Telecommunications, Papeete, French Polynesia, 23 February–1 March 2003; Volume 2, pp. 1501–1506. [Google Scholar]
- Stewart, C.; Shen, K. Performance modeling and system management for multi-component online services. In NSDI’05 Proceedings of the 2nd Conference on Symposium on Networked Systems Design and Implementation; USENIX Association: Berkeley, MA, USA, 2005; Volume 2, pp. 71–84. [Google Scholar]
- Tsakalozos, K.; Kllapi, H.; Sitaridi, E.; Roussopoulos, M.; Paparas, D.; Delis, A. Flexible use of cloud resources through profit maximization and price discrimination. In Proceedings of the 2011 IEEE 27th International Conference on Data Engineering, Hannover, Germany, 11–16 April 2011; pp. 75–86. [Google Scholar]
- Maguluri, S.T.; Srikant, R.; Ying, L. Stochastic models of load balancing and scheduling in cloud computing clusters. In Proceedings of the 2012 Proceedings IEEE INFOCOM, Orlando, FL, USA, 25–30 March 2012; pp. 702–710. [Google Scholar]
- Kinoshita, T. Basic Characteristics of a macroscopic measure for detecting abnormal changes in a multiagent system. Sensors 2015, 15, 9112–9135. [Google Scholar] [CrossRef] [PubMed]
- Moghal, M.R.; Hussain, N.; Mirza, M.S.; Jarral, M.W.; Choudry, M.S. Performance evaluation and modeling of web server systems. In Proceedings of the 8th WSEAS International Conference on Computers, Athens, Greece, 12–15 July 2004; pp. 9–11. [Google Scholar]
- Wang, M.C.; Uhlenbeck, G.E. On the theory of the brownian motion II. Rev. Mod. Phys. 1945, 17, 323–342. [Google Scholar] [CrossRef]
- ab—Apache HTTP Server Benchmarking Tool. Available online: https://httpd.apache.org/docs/2.4/programs/ab.html (accessed on 6 September 2017).
Figure 1.
Resource management of cloud-hosted services.
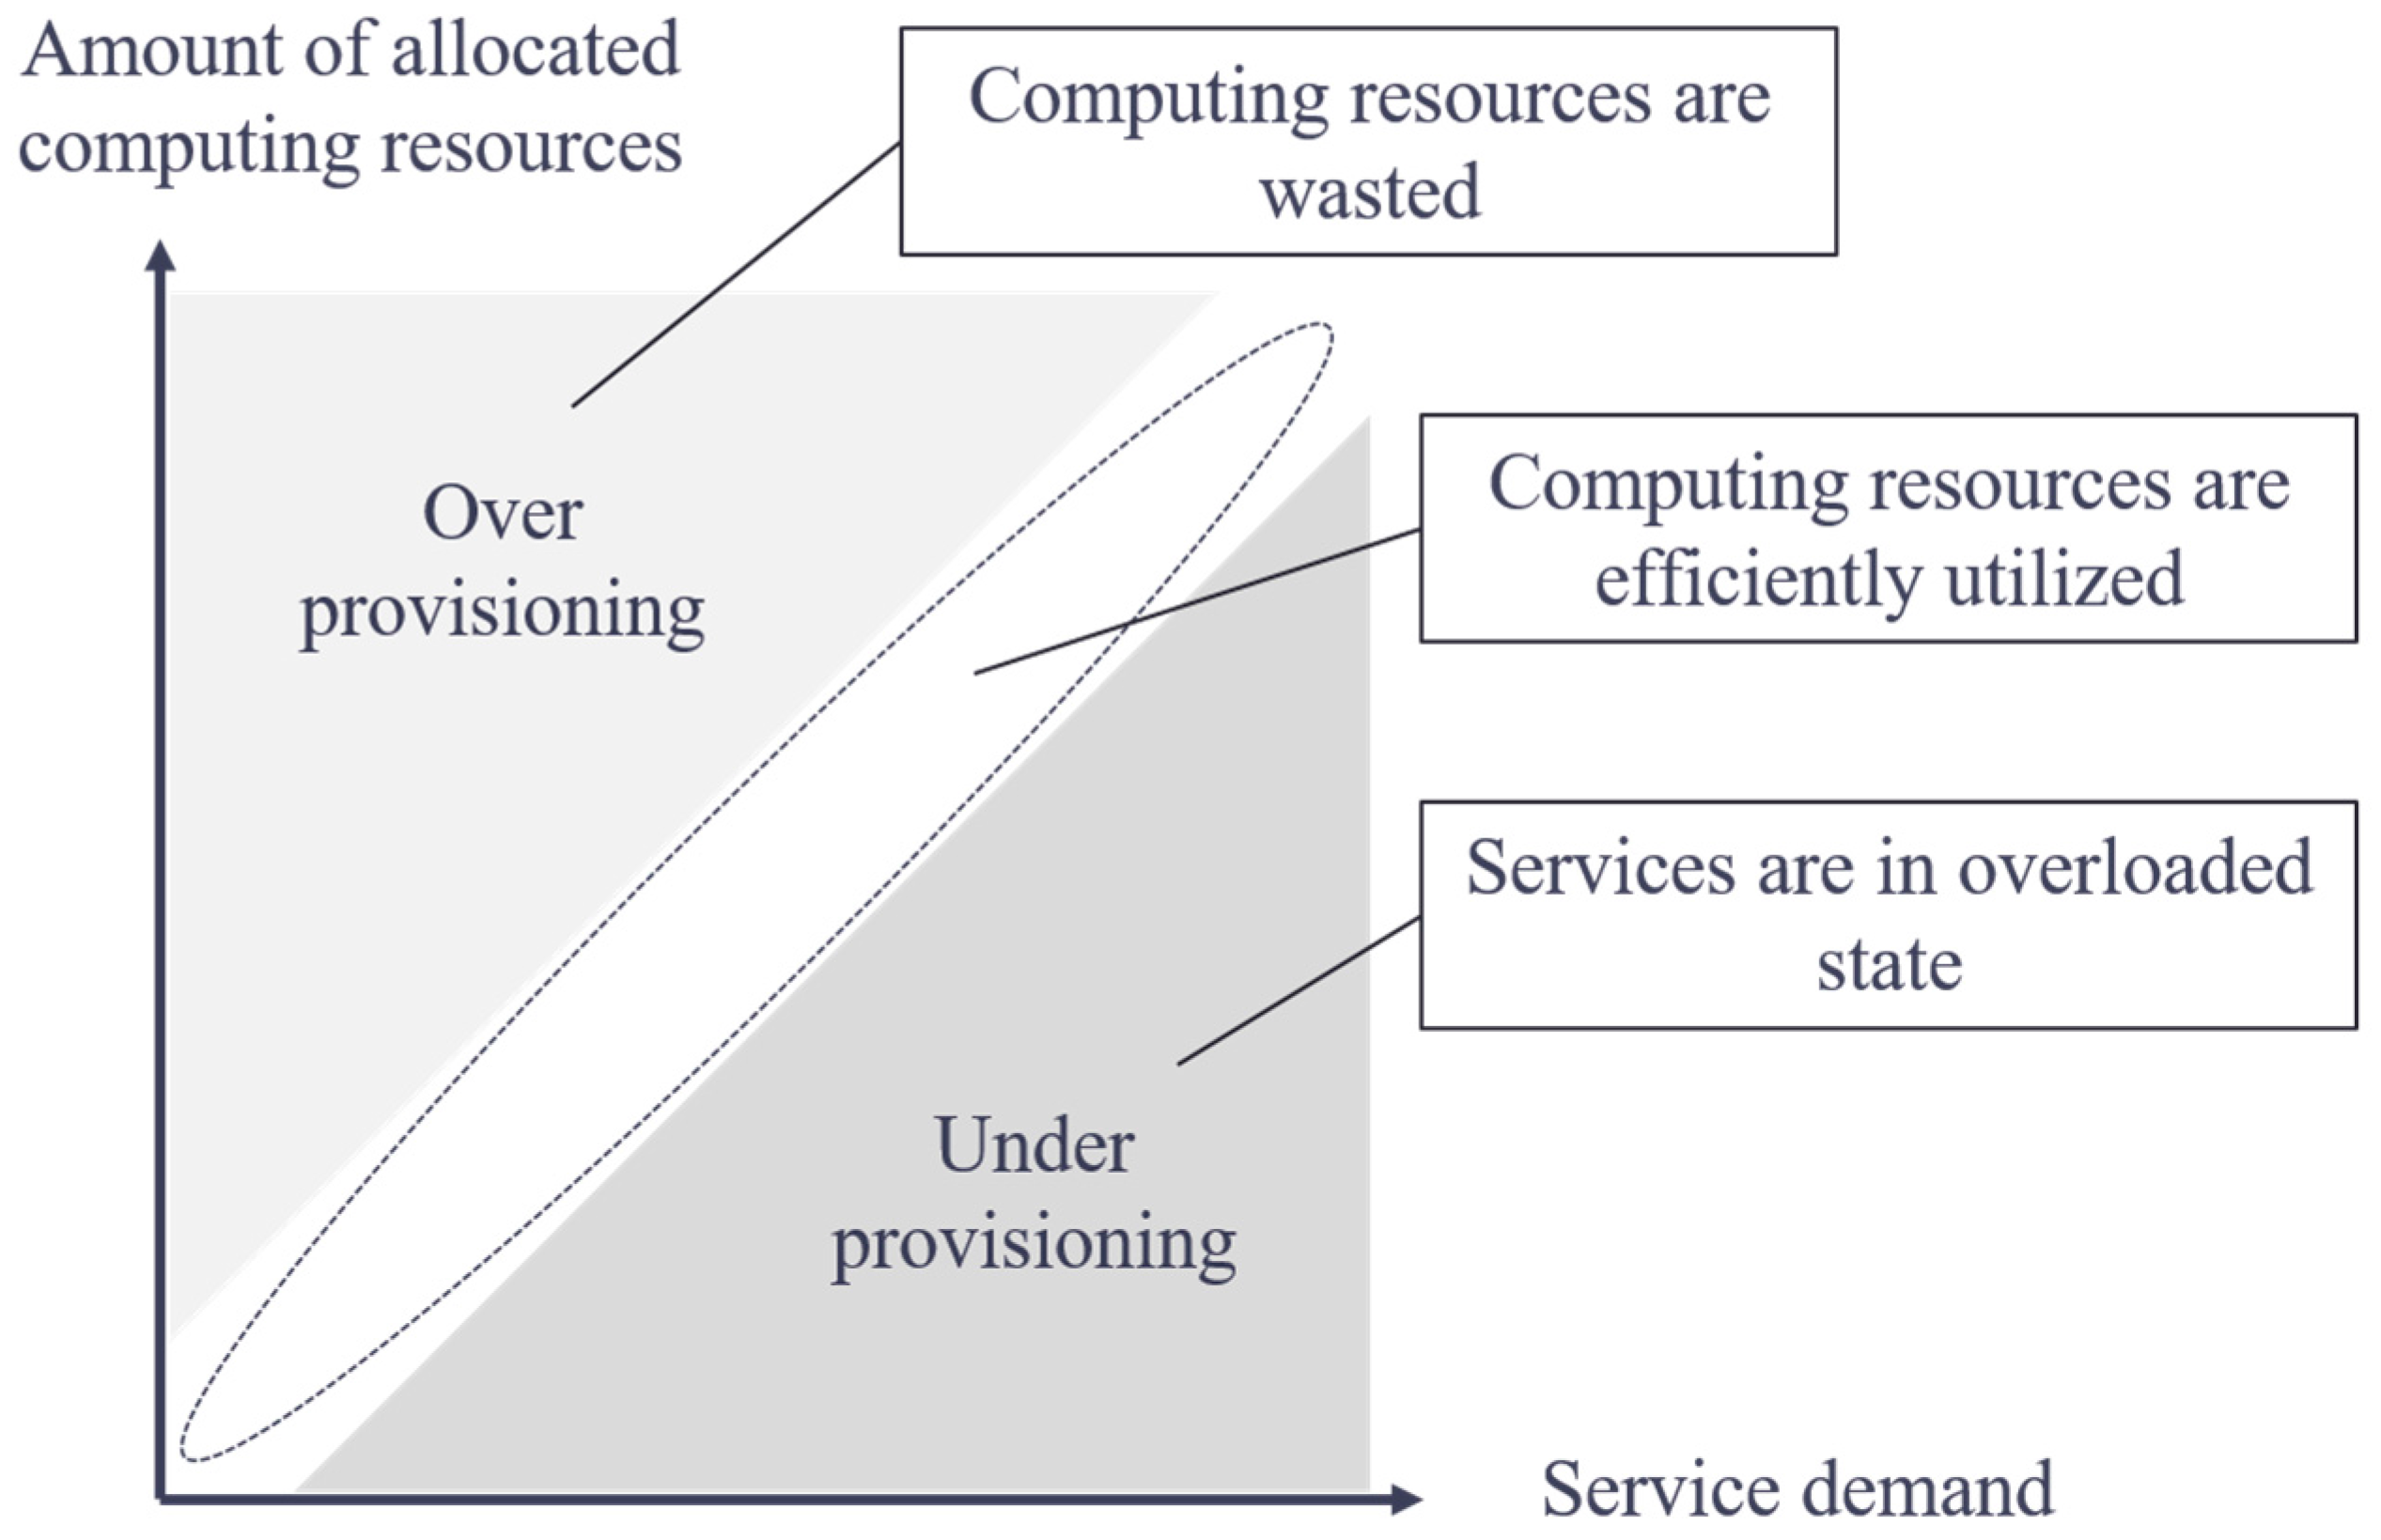
Figure 2.
Throughput characteristics of the server system.
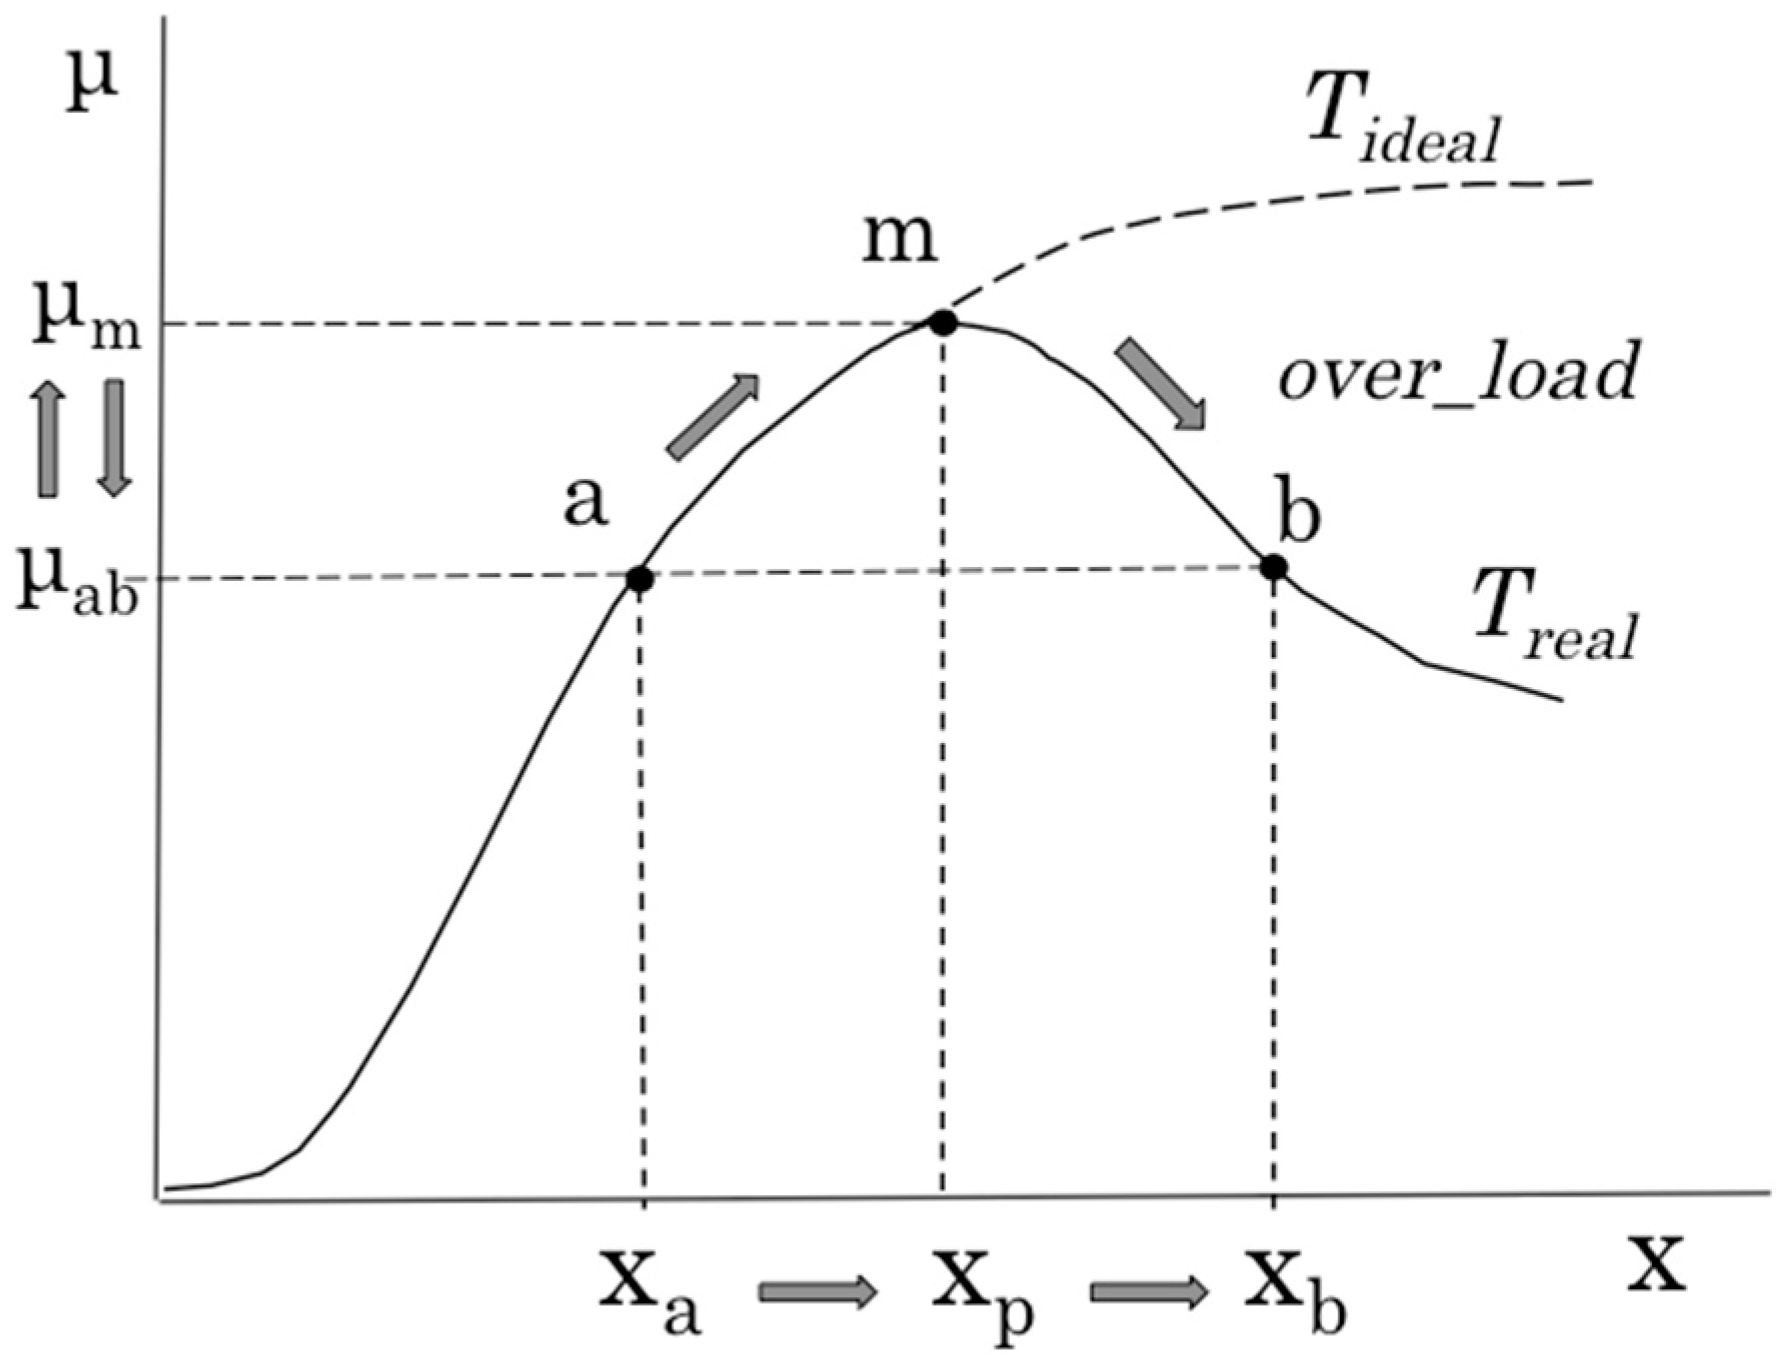
Figure 3.
Change in throughput characteristics using the scaling operation.

Figure 4.
System model in the internet environment.

Figure 5.
Image of the system’s behavior with respect to input transaction data.

Figure 6.
Configuration of the experimental environment.

Figure 7.
Results of measurements of the normal state of the test bed system; (a) server load (requests per second); (b) transfer rate; (c) variance of the fluctuation of the transfer rate.
Figure 7.
Results of measurements of the normal state of the test bed system; (a) server load (requests per second); (b) transfer rate; (c) variance of the fluctuation of the transfer rate.
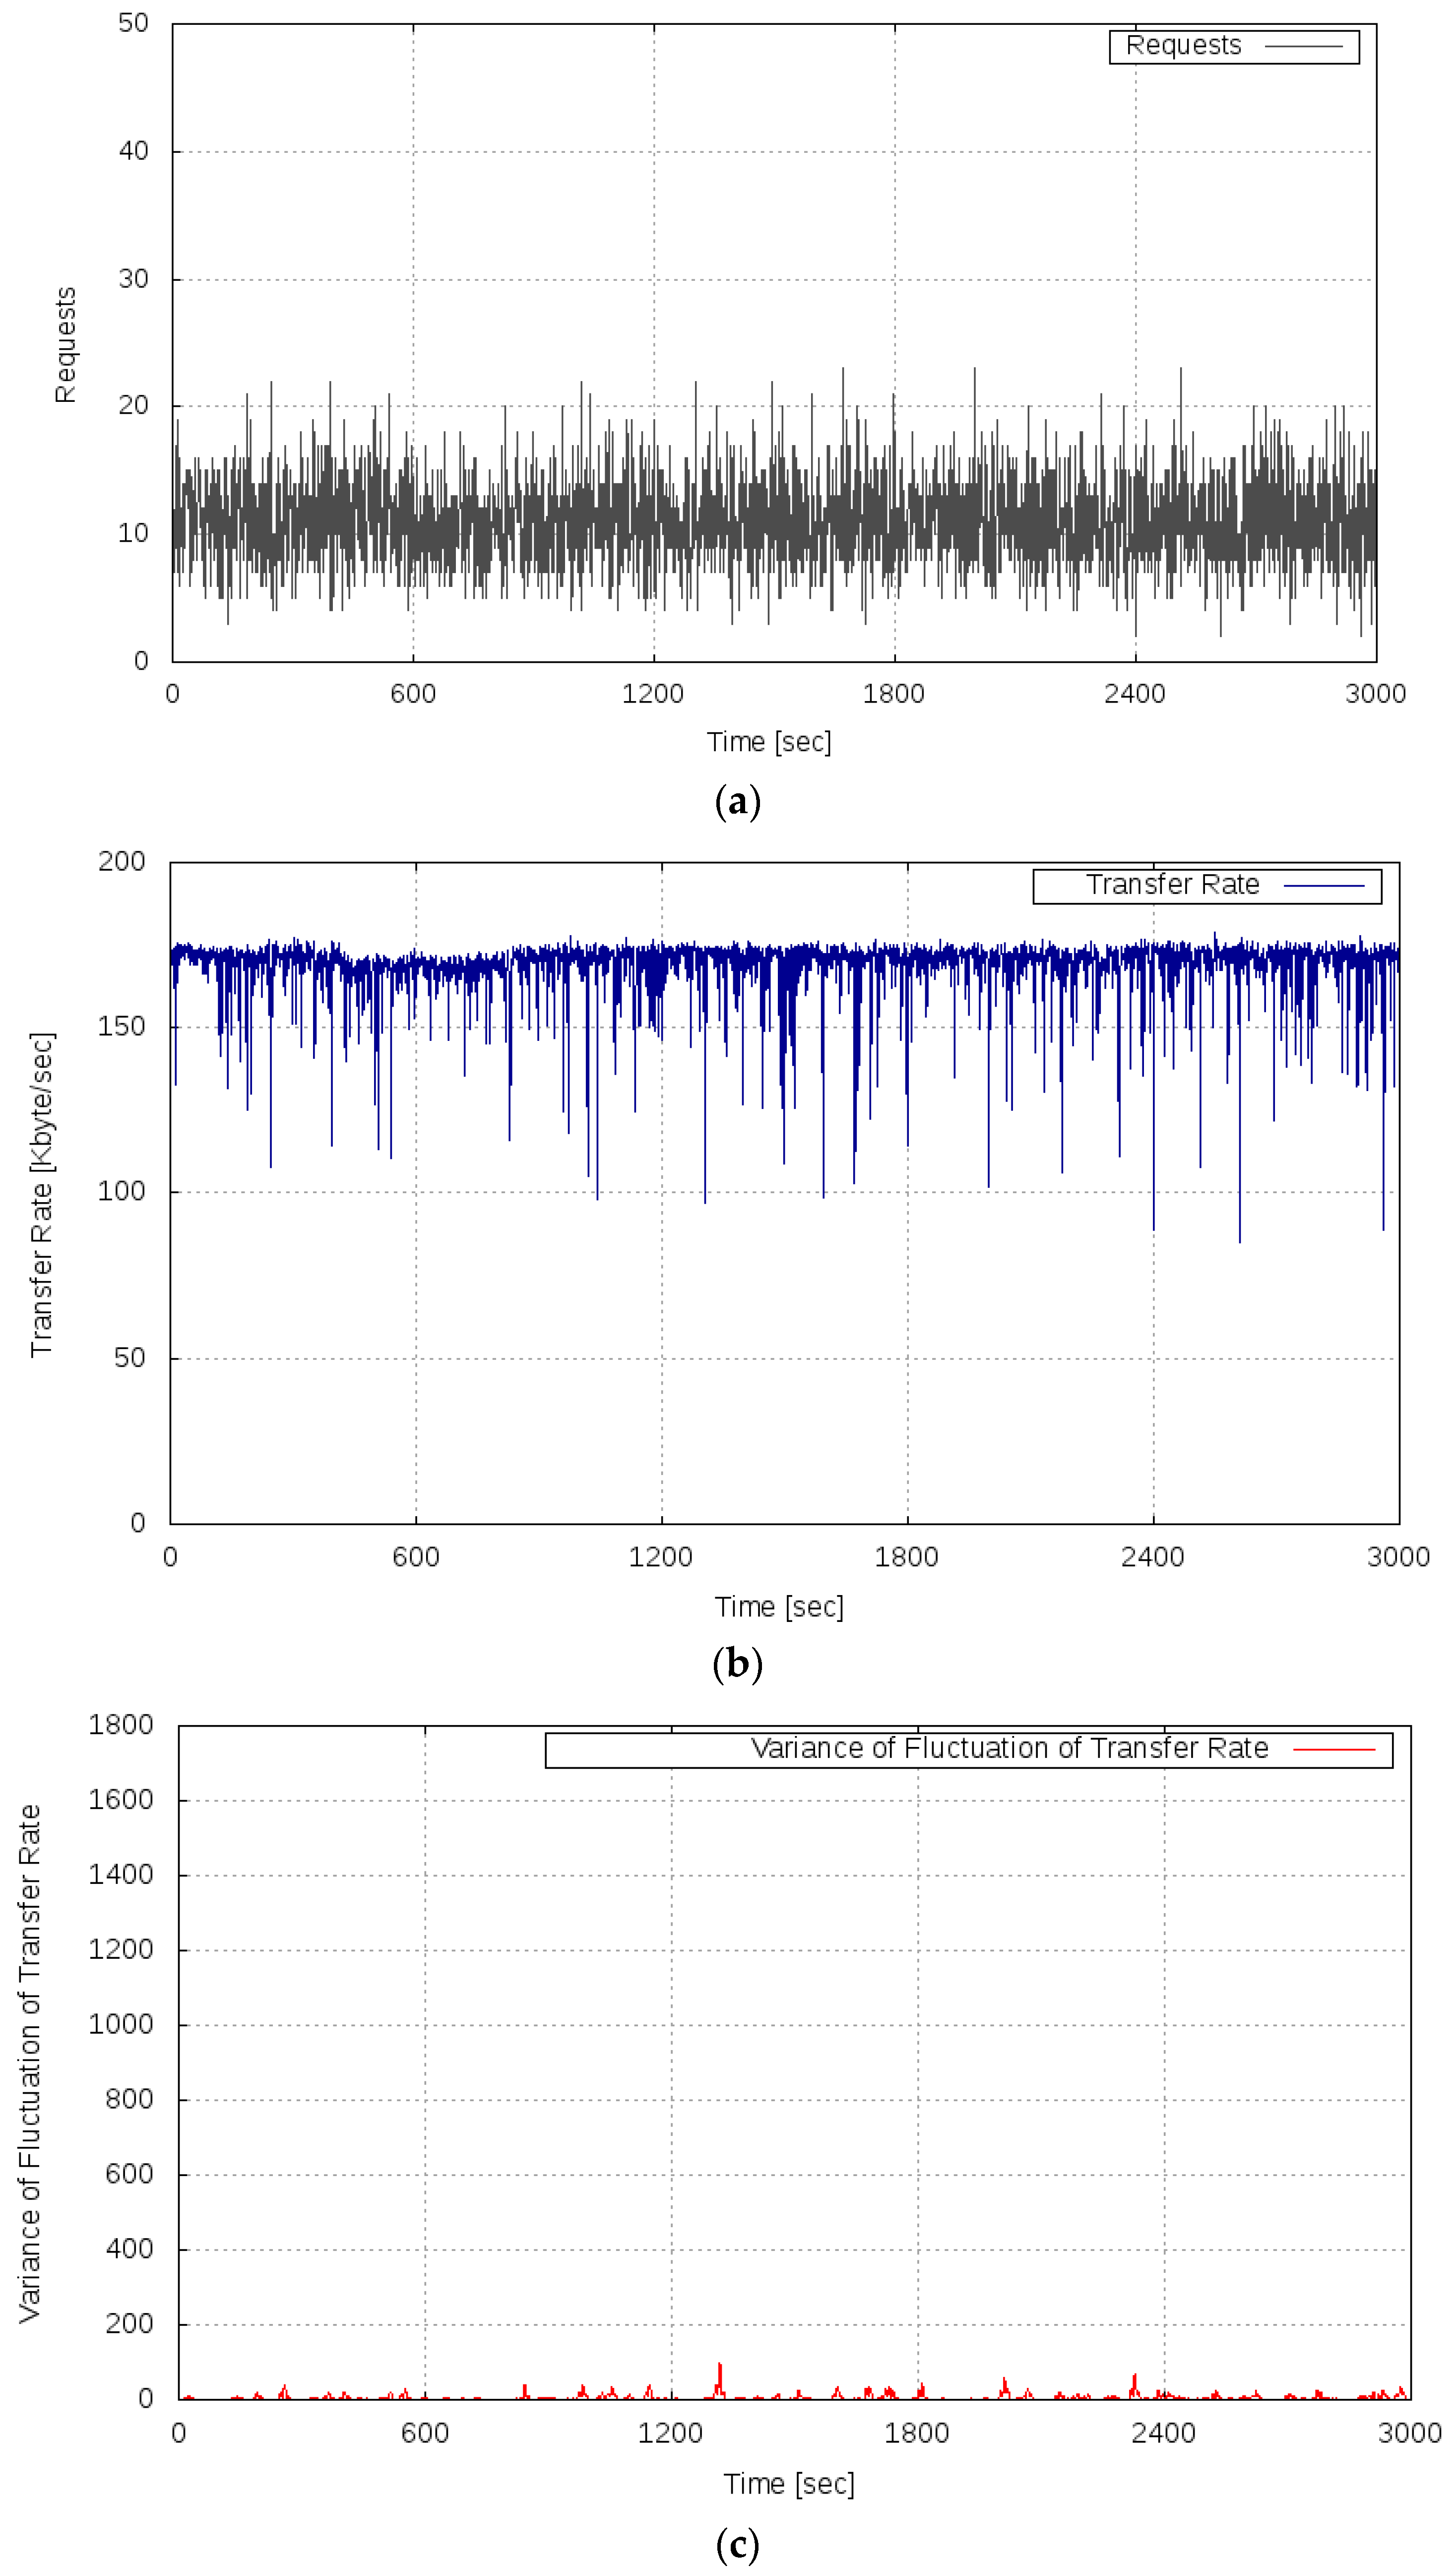
Figure 8.
Results of measurements of the changed test bed system (to the abnormal state); (a) Server load (requests per second); (b) transfer rate; (c) variance of the fluctuation of the transfer rate.
Figure 8.
Results of measurements of the changed test bed system (to the abnormal state); (a) Server load (requests per second); (b) transfer rate; (c) variance of the fluctuation of the transfer rate.


Figure 9.
Results of measurements of the changed test bed system (to the normal state); (a) server load (requests per second); (b) transfer rate; (c) variance of the fluctuation of the transfer rate.
Figure 9.
Results of measurements of the changed test bed system (to the normal state); (a) server load (requests per second); (b) transfer rate; (c) variance of the fluctuation of the transfer rate.

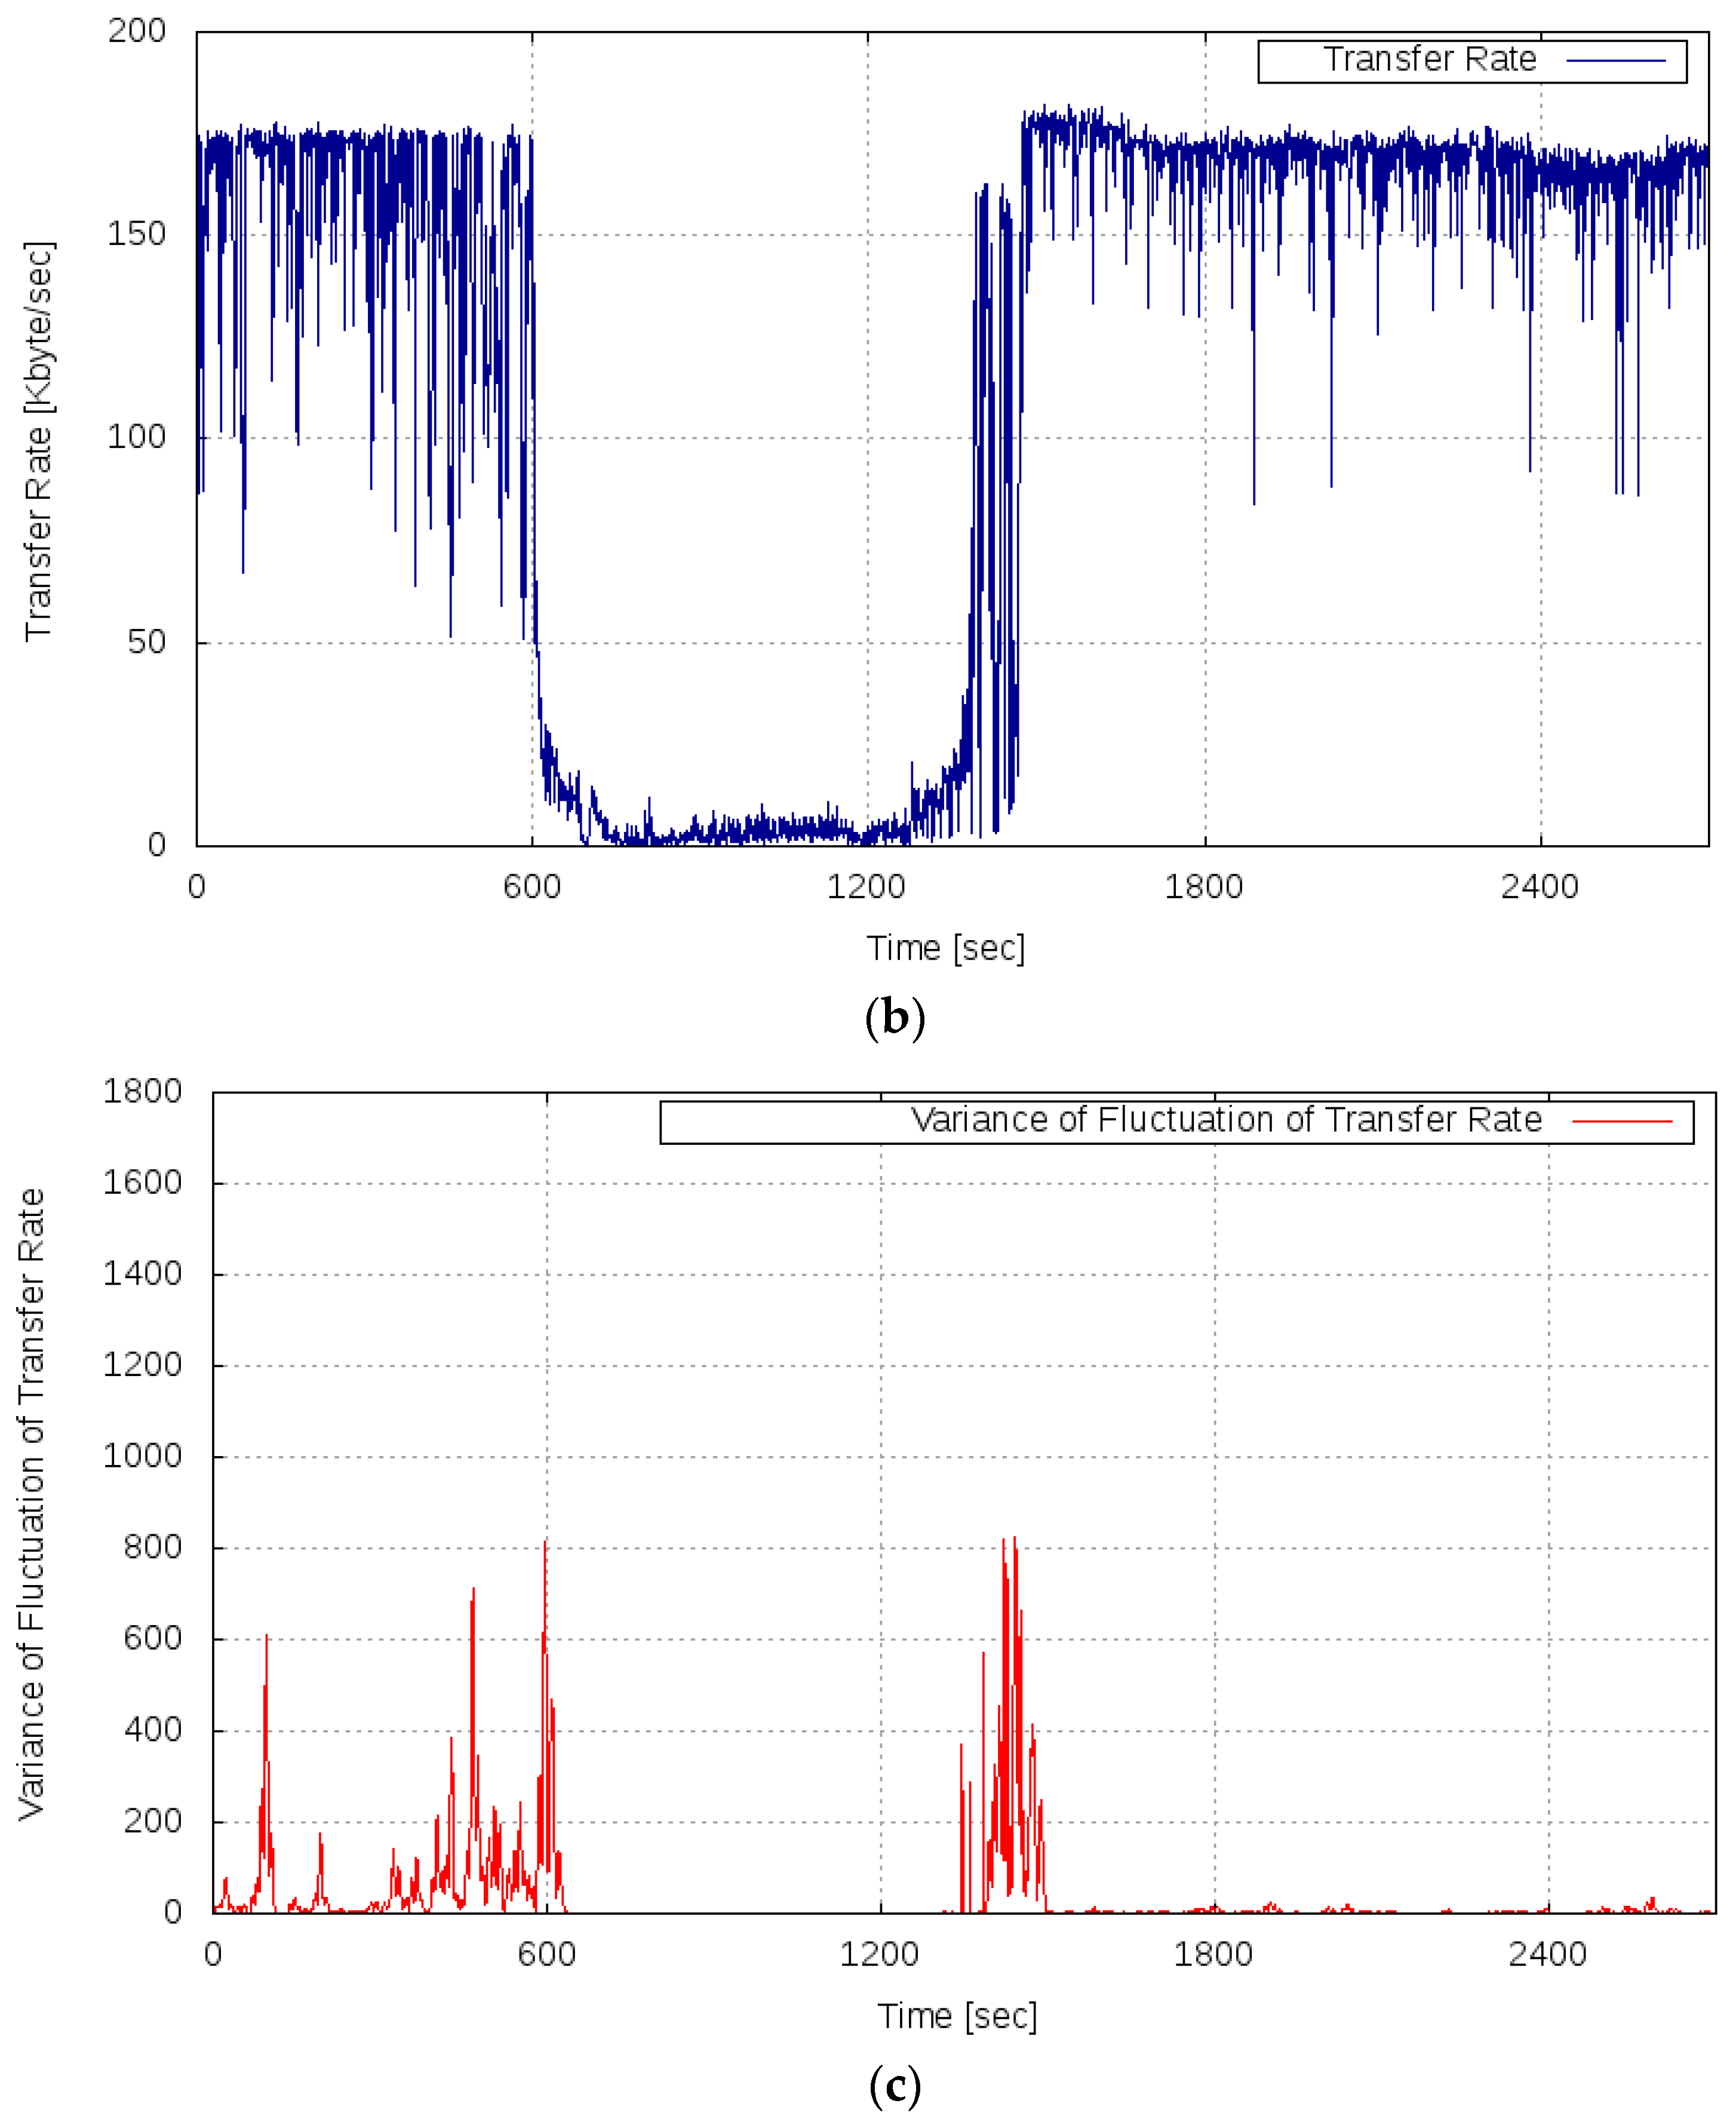
Figure 10.
Results of measurements of the test bed system and generated alert; (a) server load (requests per second); (b) transfer rate; (c) variance of the fluctuation of the transfer rate and alert.
Figure 10.
Results of measurements of the test bed system and generated alert; (a) server load (requests per second); (b) transfer rate; (c) variance of the fluctuation of the transfer rate and alert.

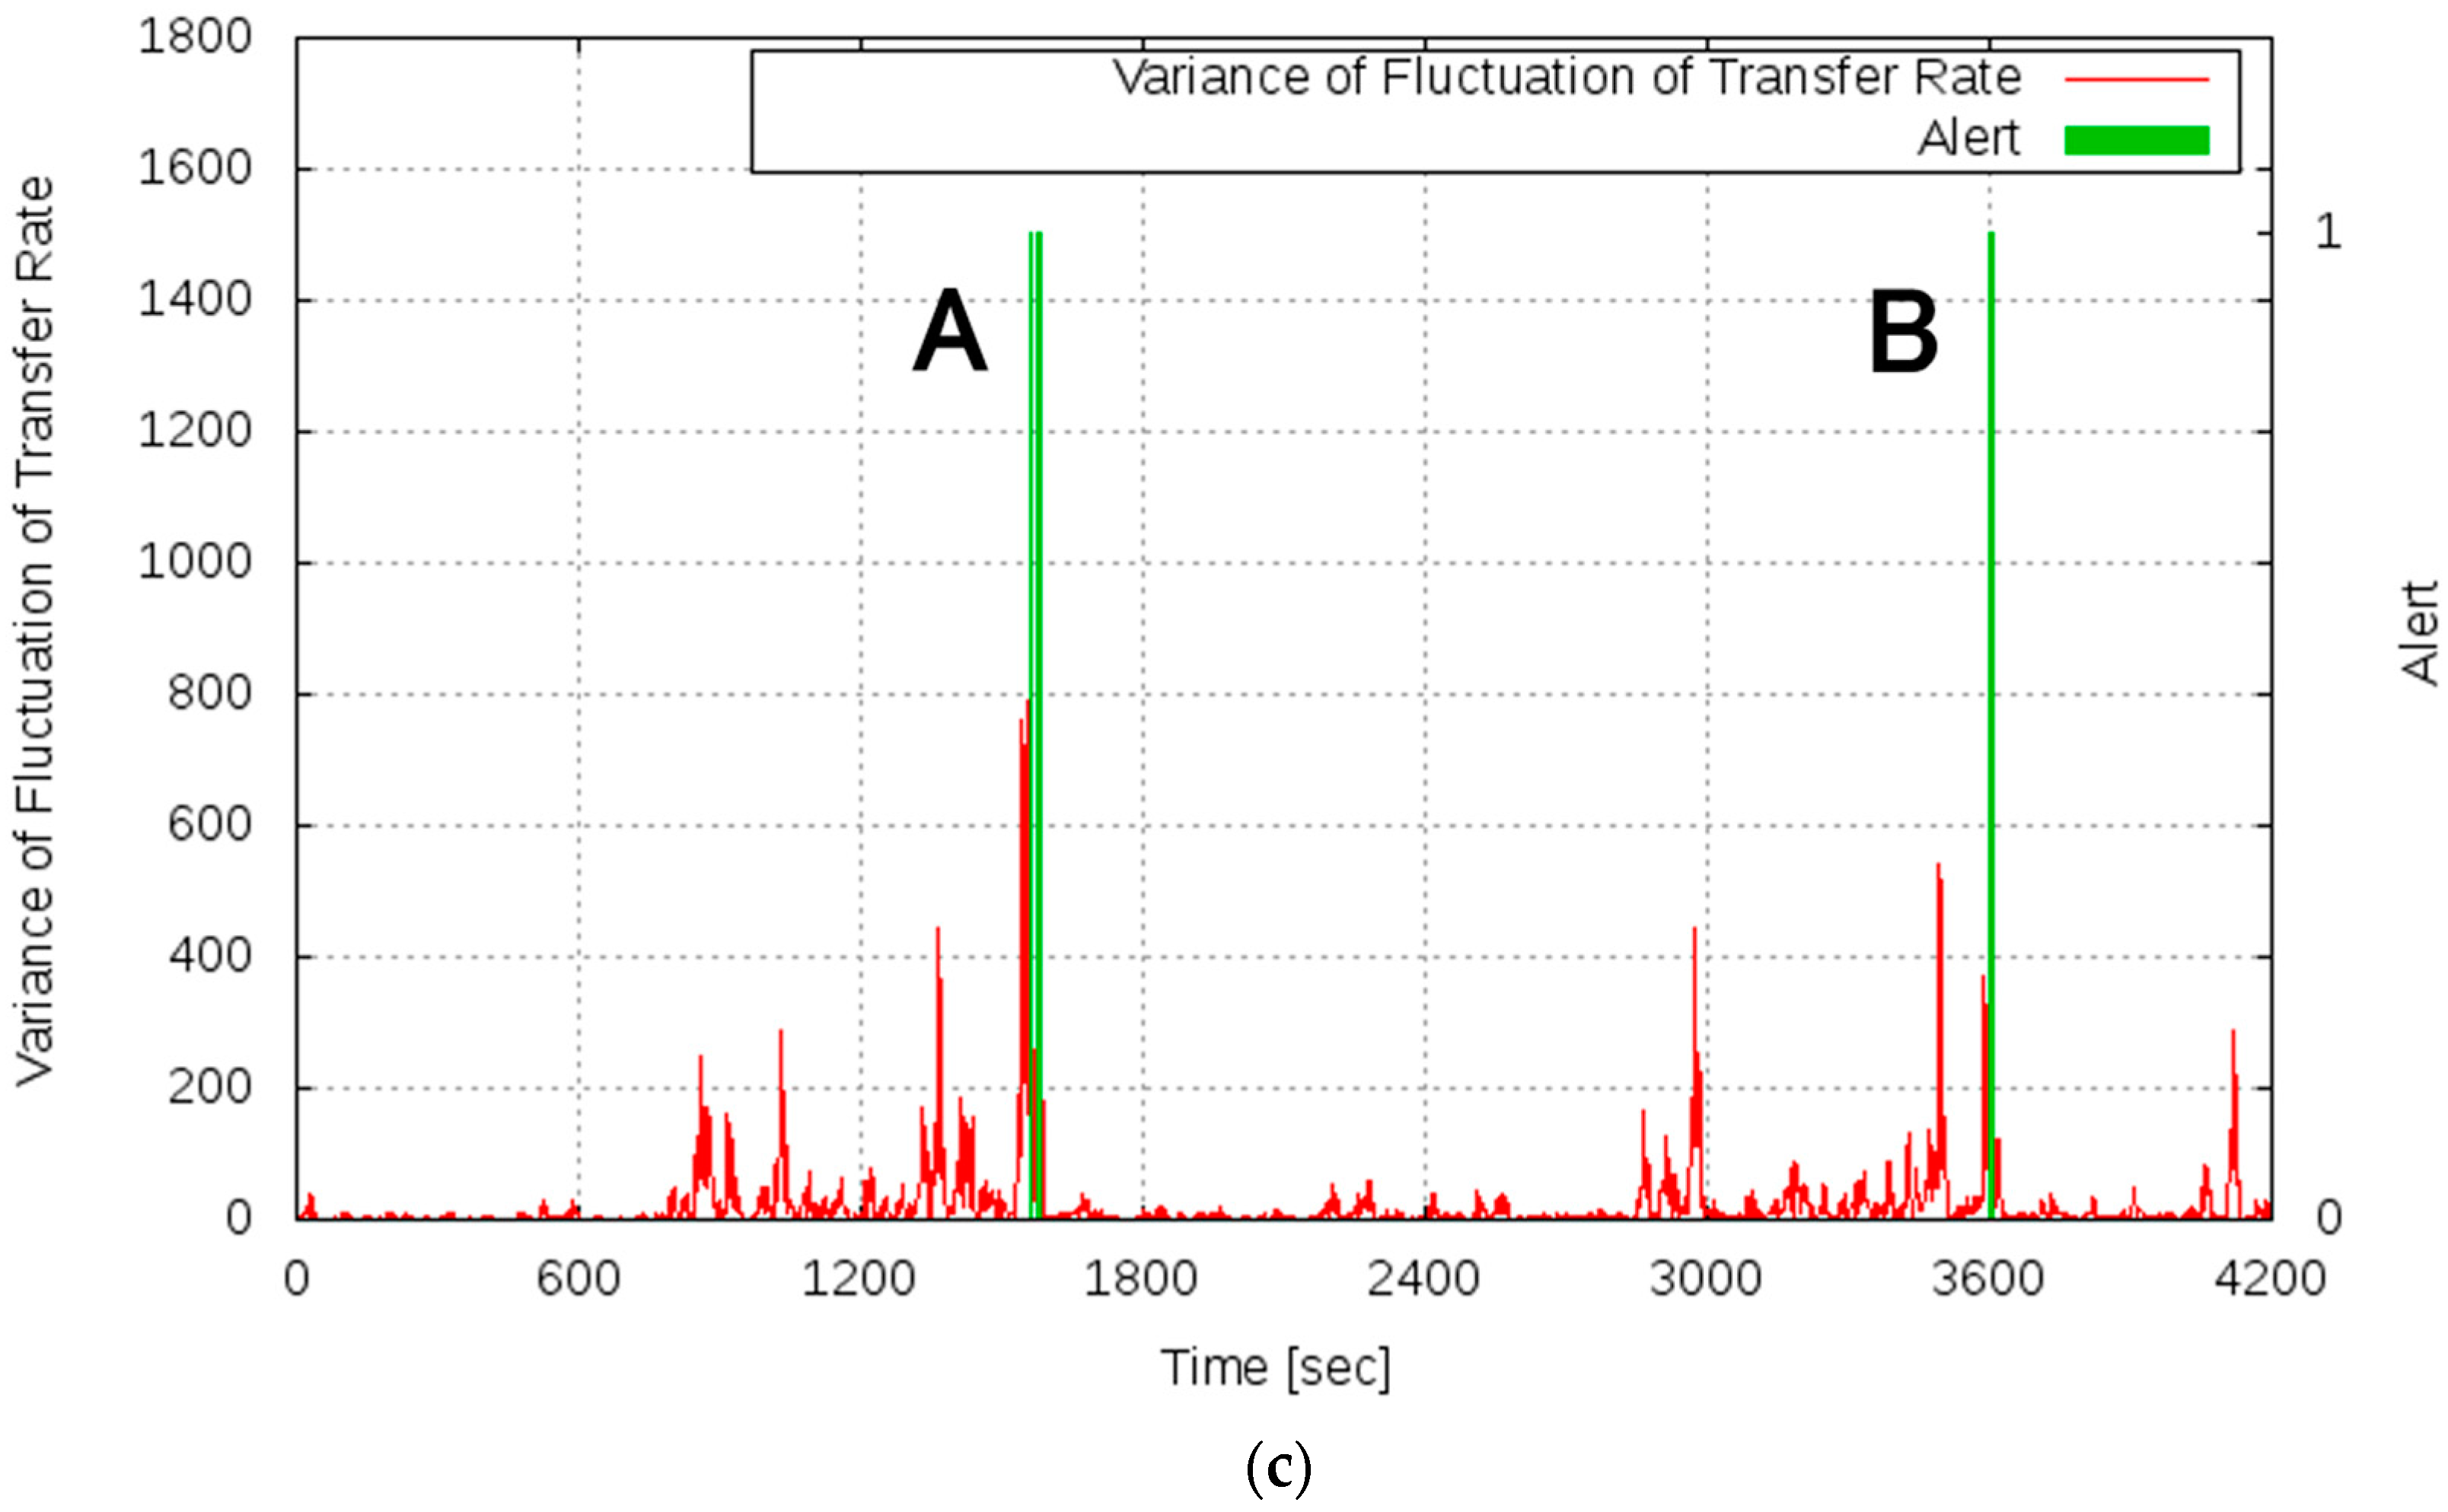
Figure 11.
Changes in system configuration.

Table 1.
Setting of the processing load of the test bed system.
| Time Period (s) | Number of Request (Req/s) |
|---|---|
| 0–299 | 13 |
| 300–599 | 15 |
| 600–899 | 17 |
| 900–1199 | 15 |
| 1200–1499 | 13 |
| 1500–1799 | 11 |
| 1800–2099 | 10 |
| 2100–2699 | 9 |
© 2017 by the authors. Licensee MDPI, Basel, Switzerland. This article is an open access article distributed under the terms and conditions of the Creative Commons Attribution (CC BY) license (http://creativecommons.org/licenses/by/4.0/).
Share and Cite
MDPI and ACS Style
Tanimura, Y.; Sasai, K.; Kitagata, G.; Kinoshita, T. Analysis of the Macroscopic Behavior of Server Systems in the Internet Environment. Appl. Sci. 2017, 7, 1145. https://doi.org/10.3390/app7111145
AMA Style
Tanimura Y, Sasai K, Kitagata G, Kinoshita T. Analysis of the Macroscopic Behavior of Server Systems in the Internet Environment. Applied Sciences. 2017; 7(11):1145. https://doi.org/10.3390/app7111145
Chicago/Turabian StyleTanimura, Yusuke, Kazuto Sasai, Gen Kitagata, and Tetsuo Kinoshita. 2017. "Analysis of the Macroscopic Behavior of Server Systems in the Internet Environment" Applied Sciences 7, no. 11: 1145. https://doi.org/10.3390/app7111145
Note that from the first issue of 2016, this journal uses article numbers instead of page numbers. See further details here.