On the Seismic Design of Structures with Tilting Located within a Seismic Region
by
 , ,
, ,
Federico Valenzuela-Beltrán
1,* ,
,
Sonia E. Ruiz
1 ,
,
Alfredo Reyes-Salazar
2 and
J. Ramón Gaxiola-Camacho
3 1
Instituto de Ingeniería, Universidad Nacional Autónoma de México, Coyoacán, 04510 Ciudad de Mexico, Mexico
2
Facultad de Ingeniería, Universidad Autónoma de Sinaloa, Culiacán Rosales, 80013 Sinaloa, Mexico
3
Department of Civil Engineering and Engineering Mechanics, University of Arizona, Tucson, AZ 85721, USA
*
Author to whom correspondence should be addressed.
Appl. Sci. 2017, 7(11), 1146; https://doi.org/10.3390/app7111146
Submission received: 13 September 2017
/
Revised: 27 October 2017
/
Accepted: 30 October 2017
/
Published: 7 November 2017
Abstract
:A reliability-based criterion to estimate strength amplification factors for buildings with asymmetric yielding located within a seismic region presenting different soil conditions is proposed and applied. The approach involves the calculation of the mean annual rate of exceedance of structural demands of systems with different levels of asymmetric yielding. Two simplified mathematical expressions are developed considering different soil conditions of the valley of Mexico. The mathematical expressions depend on the ductility of the structural systems, their level of asymmetric yielding, their fundamental vibration period and the dominant period of the soil. In addition, the proposed expressions are compared with that recommended by the current Mexico City Building Code (MCBC). Since the expressions are developed with the help of simplified structural systems, the validity of such expressions is corroborated by comparing the expected ductility demand of multi-degree of freedom (MDOF) structural systems with respect to that of their equivalent simplified systems. Both structural representations are associated with a given annual rate of exceedance value of an engineering demand parameter. The expressions proposed in this study will be incorporated in the new version of the MCBC.
1. Introduction
Structures built on intermediate or soft soils are those that commonly present structural problems. One of these complications is that buildings may suffer tilting due to differential settlements, leading to an uneven load-deformation behavior (hereinafter referred as asymmetric yielding behavior); this means that such structures exhibit different yield strength in opposite directions. Since symmetric (without asymmetric yielding) structures tend to oscillate around their un-deformed position, their plastic deformation demands tend to counteract each other. Otherwise, asymmetric yielding structures tend to accumulate the plastic deformation demands in the weaker direction (i.e., the direction of tilting) when they are excited by seismic loading. In other words, originally symmetric structures develop “strong” and “weak” directions due to tilting. There are several reasons why a structure exhibits different yield strength in opposite directions, for example: asymmetry in vertical loads, structures with sloping facades, the presence of mezzanines, tilting, etc. (see Figure 1a–c). This undesirable behavior may significantly affect the seismic performance of these kinds of structures, particularly, when they are subjected to long-duration seismic ground motions.
As discussed later in this paper, the effect of asymmetric yielding significantly reduces the seismic performance of structures, and this, combined with other factors such as constructive deficiencies, poor design procedures, among others, may cause the failure of such structures when subjected to intense seismic ground motions. Therefore, it is necessary to take action to counteract the effect of asymmetric yielding. There are different types of solutions to improve the performance of buildings with asymmetric yielding. The best solution will depend on the particular problem under consideration. These solutions could be geotechnical, structural or a combination between them. The present study is focused exclusively on structural solutions. Using the approach proposed in this paper, buildings with asymmetric yielding must be designed for a higher lateral strength than symmetric ones, requiring the development of strength amplification factors (AF) of the design pseudo-acceleration spectrum in order to take into account the detrimental effect of the yielding asymmetry.
On the other hand, future design codes must be oriented not only to guarantee a satisfactory seismic behavior, but also an adequate level of reliability, which will allow engineers to design for a certain pre-established risk associated with structures. Over recent years, the development of structural reliability methods has provided a more rational basis for the design of earthquake-resistant structures. Numerous reliability-based code calibrations have been formulated by several researchers [1,2] and have also been included in guidelines like MCBC [3], National Building Code of Canada (NBCC) [4], Federal Emergency Management Agency (FEMA 445) [5], FEMA P-58 [6], among others.
Hence, in the present study, a reliability-based methodology is proposed and applied to develop simplified mathematical expressions to estimate strength amplification factors for existing structures exhibiting asymmetric yielding produced by tilting. The structures are supposed to be distributed within a seismic region. It is important to emphasize that this methodology can be applied not only for existing buildings, but also for new structures with asymmetric yielding caused by other reasons, as illustrated in Figure 1.
The mathematical expressions proposed in this paper are based on the analysis of simplified one-story one-bay three-dimensional (3D) structural systems subjected to orthogonal seismic ground motions. The methodology is illustrated by applying it to develop strength amplification factors for the valley of Mexico. In addition, in order to verify the applicability of the mathematical expressions to multi-degree of freedom (MDOF) structural systems, ductility transformation factors (DTF) between MDOF asymmetric yielding structural systems and simplified (one-story one-bay) 3D asymmetric yielding systems, are estimated.
There are several studies in the literature in which modification factors of the seismic design spectrum are proposed. The factors are intended to reduce linear elastic design spectra due to different reasons. For example, different methods to calculate strength reduction factors that allow estimating inelastic strength demands from elastic strength demands for structures located in different soil conditions have been proposed [7,8,9]. Other authors have proposed factors to reduce elastic seismic design spectra due to damping [10,11,12,13,14,15]; however, none of the mentioned studies consider the influence of asymmetric yielding on the seismic structural response.
Although there are several studies related to strength modification factors of the seismic design spectra, there are only a few studies in the literature focused on proposing strength amplification factors of the design spectrum that consider the yielding asymmetry of structural systems. Most of them analyze asymmetric yielding structural systems located in Mexico City (this is mainly due to the particular characteristics of the soft soil in this region). Some of these studies are focused on estimating the increment of the seismic response of systems with asymmetric yielding with respect to that of symmetric systems, and in developing mathematical expressions for that purpose [16,17]. Other studies are addressed on identifying some of the characteristics of both the structure and the soil involved in the seismic response of asymmetric yielding structures [18].
There are studies that evaluate the seismic response of tilted structures subjected to different scenarios. Moon [19] studied the performance of tilted tall buildings designed with different structural systems such as braced tubes, diagrids, and outrigger systems, identifying several factors that affect the structural performance of tilted buildings. Carpinteri et al. [20] assessed the behavior of an eighth-century masonry tower called “Torre Sineo”, located in Italy. The tower has been damaged due to seismic events during the last few years and presents a deviation from verticality. The study deals with the possible scenario of an increase in the tilt mechanism of the tower and performs some numerical simulations to predict the possible damages. The results present a valuable picture of possible damage evolution and provide some advices for structural monitoring of the tower.
Recent studies regarding the asymmetric yielding behavior propose amplification factors for the lateral seismic design forces for either reinforcement or design of new structures. Teran-Gilmore and Arroyo-Espinoza [21] proposed mathematical expressions of strength amplification factors for structures with asymmetric yielding located on soft and firm soils of Mexico City. They analyzed single degree of freedom systems (SDOF) with different hysteretic behavior. The obtained expressions were similar for all the hysteretic rules considered. In general, these expressions came out to be more conservative than those recommended by the Mexico City Building Code (MCBC-2004) [3]. Valenzuela-Beltrán et al. [22] proposed a reliability-based methodology to estimate strength amplification factors for structures with asymmetric yielding by means of ductility uniform exceedance rate spectra corresponding to narrow-band seismic ground motions. They concluded that: (a) the ductility demand of systems with asymmetric yielding may be much higher than those corresponding to symmetric systems, particularly for structural systems with vibration periods close to the dominant period of the soil, (b) the effect of asymmetric yielding is more detrimental for systems with low lateral strength and with high ductility demand, and (c) the increment in the expected ductility demand of asymmetric yielding systems with respect to that of symmetric systems is independent of the chosen value of the mean annual rate of exceedance.
Despite the valuable contributions of the studies discussed above, most of them were limited to the analysis of single degree of freedom (SDOF) systems subjected to unidirectional analyses, and the asymmetric yielding was considered by means of an idealized SDOF model. In addition, several important factors were not incorporated as the explicit consideration of the tilting angle, the influence of two orthogonal components of the ground motions, and the implicit levels of reliability in the development of the strength amplification factors were not considered. Some of these issues are addressed in the present paper. Hence, the specific objectives of this research are: (1) to apply a reliability-based methodology to estimate the additional strength requirement of structures with asymmetric yielding, located in sites with different soil conditions, (2) to develop simplified mathematical expressions for this purpose, which can be applied to existing structures that exhibit asymmetric yielding located in a seismic region, considering the influence of two orthogonal horizontal seismic ground motions, and (3) to estimate ductility transformation factors between the expected ductility demand of MDOF asymmetric yielding structural systems with respect to that of their equivalent simplified 3D systems, both associated to a given annual probability of exceedance.
Buildings with Asymmetric Yielding Produced by Tilting in Mexico City
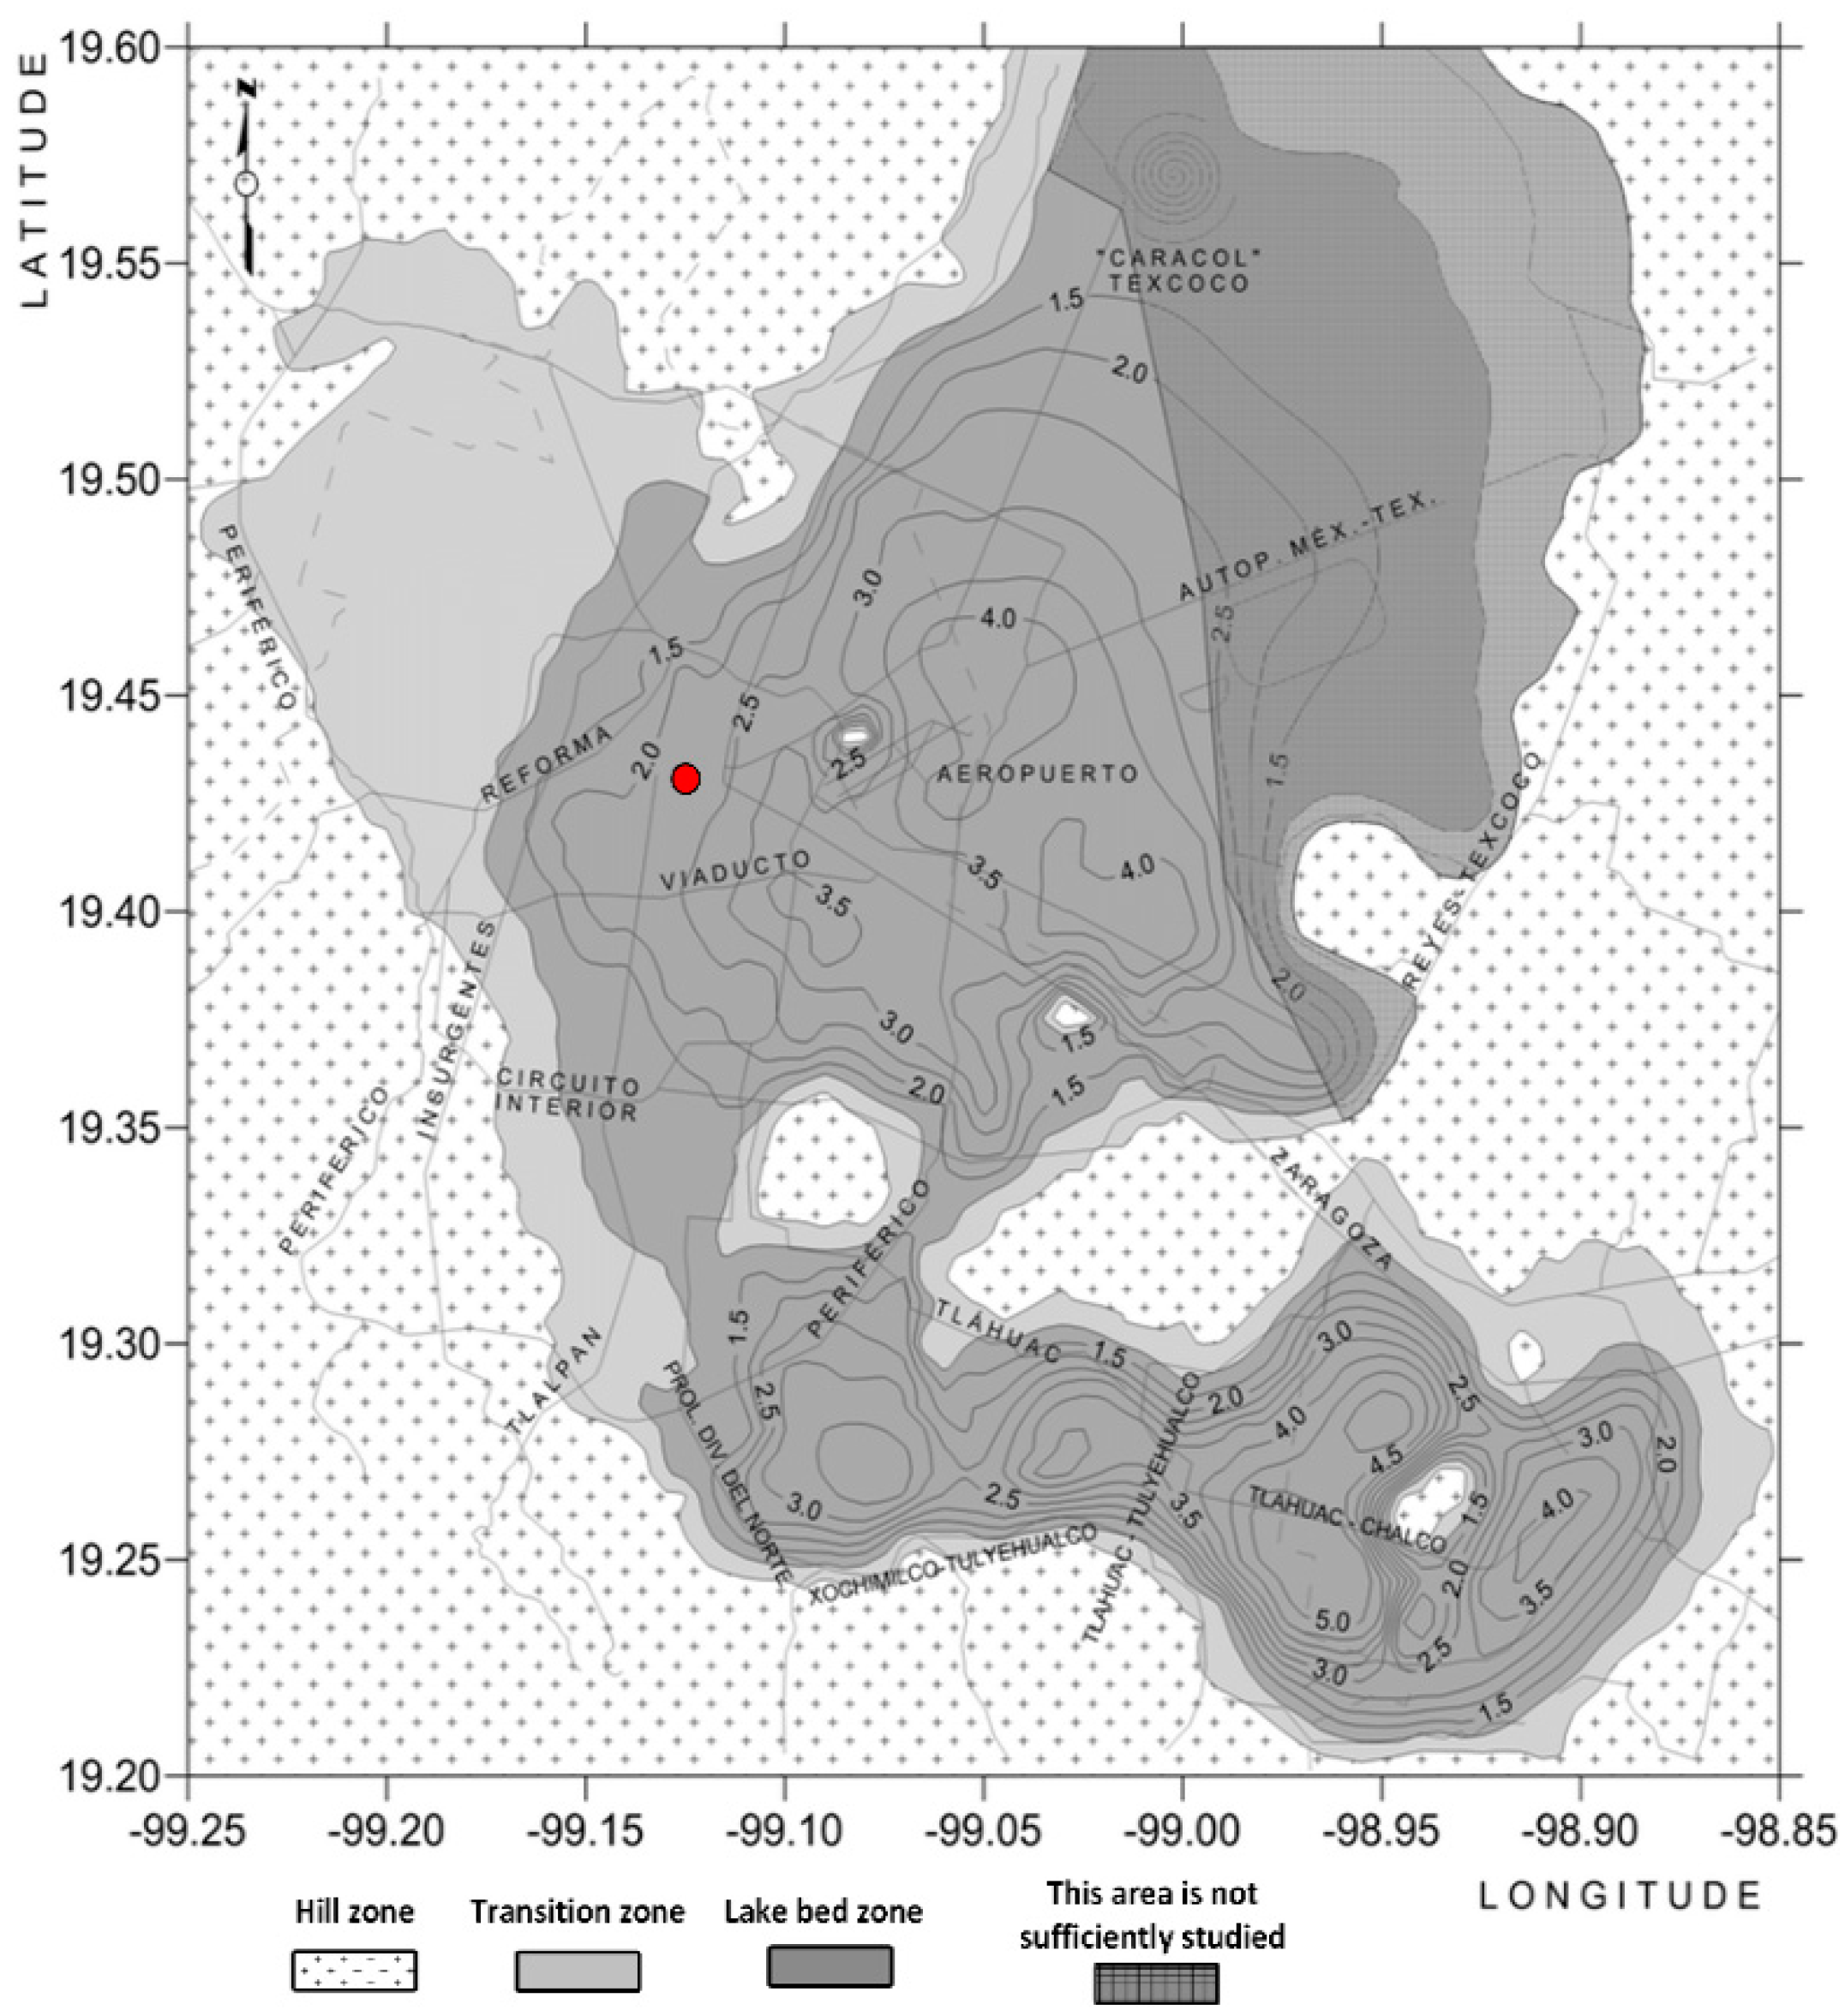
Many buildings located in Mexico City downtown, which is a very populated area, suffer tilting problems. The main reason associated to structural tilting in this zone is that a considerable part of the valley of Mexico is located over an ancient lake, this fact indicates that Mexico City downtown is built on soft and very soft soils. Figure 2 shows the classification of the soil in the valley of Mexico according to the dominant period, Ts [3]. The Ts values were computed from spectral amplification functions corresponding to more than 100 free-field strong motion stations complemented with around 500 micro-tremor measurements [23]. The contour map of soils with equal dominant periods (iso-periods) is shown in Figure 2. It was constructed by means of a Bayesian spatial interpolation technique [23]. The firm ground (commonly known as Hill zone) presents relatively small dominant periods (around 0.5 s); however, the soft soil (commonly known as Lake Bed zone) have large vibration periods, up to 4 s.
To illustrate the problem of buildings suffering tilting in the downtown of Mexico City, a small area (marked with a small red dot in Figure 2) was selected. The tilted buildings located in that area were classified as shown in Figure 3. The detection of these buildings was based on visual inspection. It was observed that the main cause of tilting in these buildings was that they are built on very soft soils, provoking differential settlements. However, there could also be cases in which tilting was due to the effect of previous intense earthquakes. It was found that exist over 50 buildings that present tilting problems in such a small area (approximately 1.5 km2). It indicates that there are hundreds of tilted buildings in the soft soil of the valley of Mexico. Most of the tilted buildings that were identified in this zone have 3 to 6 stories; however, there are some that have 8 or more stories. It is important to mention that most of the buildings presented in Figure 3 are old constructions, and probably, they do not comply with the current seismic regulations. For example, some of these buildings were designed for a considerably lower lateral strength than the suggested in the current MCBC, i.e., the recommended design spectra ordinates are higher nowadays than several years ago. Therefore, the fact that this kind of buildings present tilting problems and that probably do not comply with the current seismic regulations may lead to catastrophic seismic structural performance if a high intensity ground motion occurs in that area. For these reasons, it is important to propose seismic strength amplification factors for structures exhibiting asymmetric yielding produced by tilting and other reasons with the aim of incorporating the factors in future reliability-based seismic regulations. It is worth mentioning that the methodology used in this study can be applied to structural systems with similar problems, located worldwide.
In the present study, mathematical expressions are obtained for strength amplification factors corresponding to structures with asymmetric yielding produced by any of the aforementioned causes located in the whole area of the valley of Mexico. This area was divided in seven seismic zones (A, B, C, D, E, F and G) according to its dominant period. Their main characteristics and the ground motions used for each zone are described in Section 4. After obtaining the mathematical expressions for the estimation of the strength amplification factors, the authors had the concern about the applicability of the proposed expressions to actual MDOF buildings; so, it was decided to verify, by means of seismic risk analyses, that the expressions can be applied to R/C buildings with multiple bays and stories. Such verification is presented in the Section right before the Conclusions.
2. Simplified Structural Models
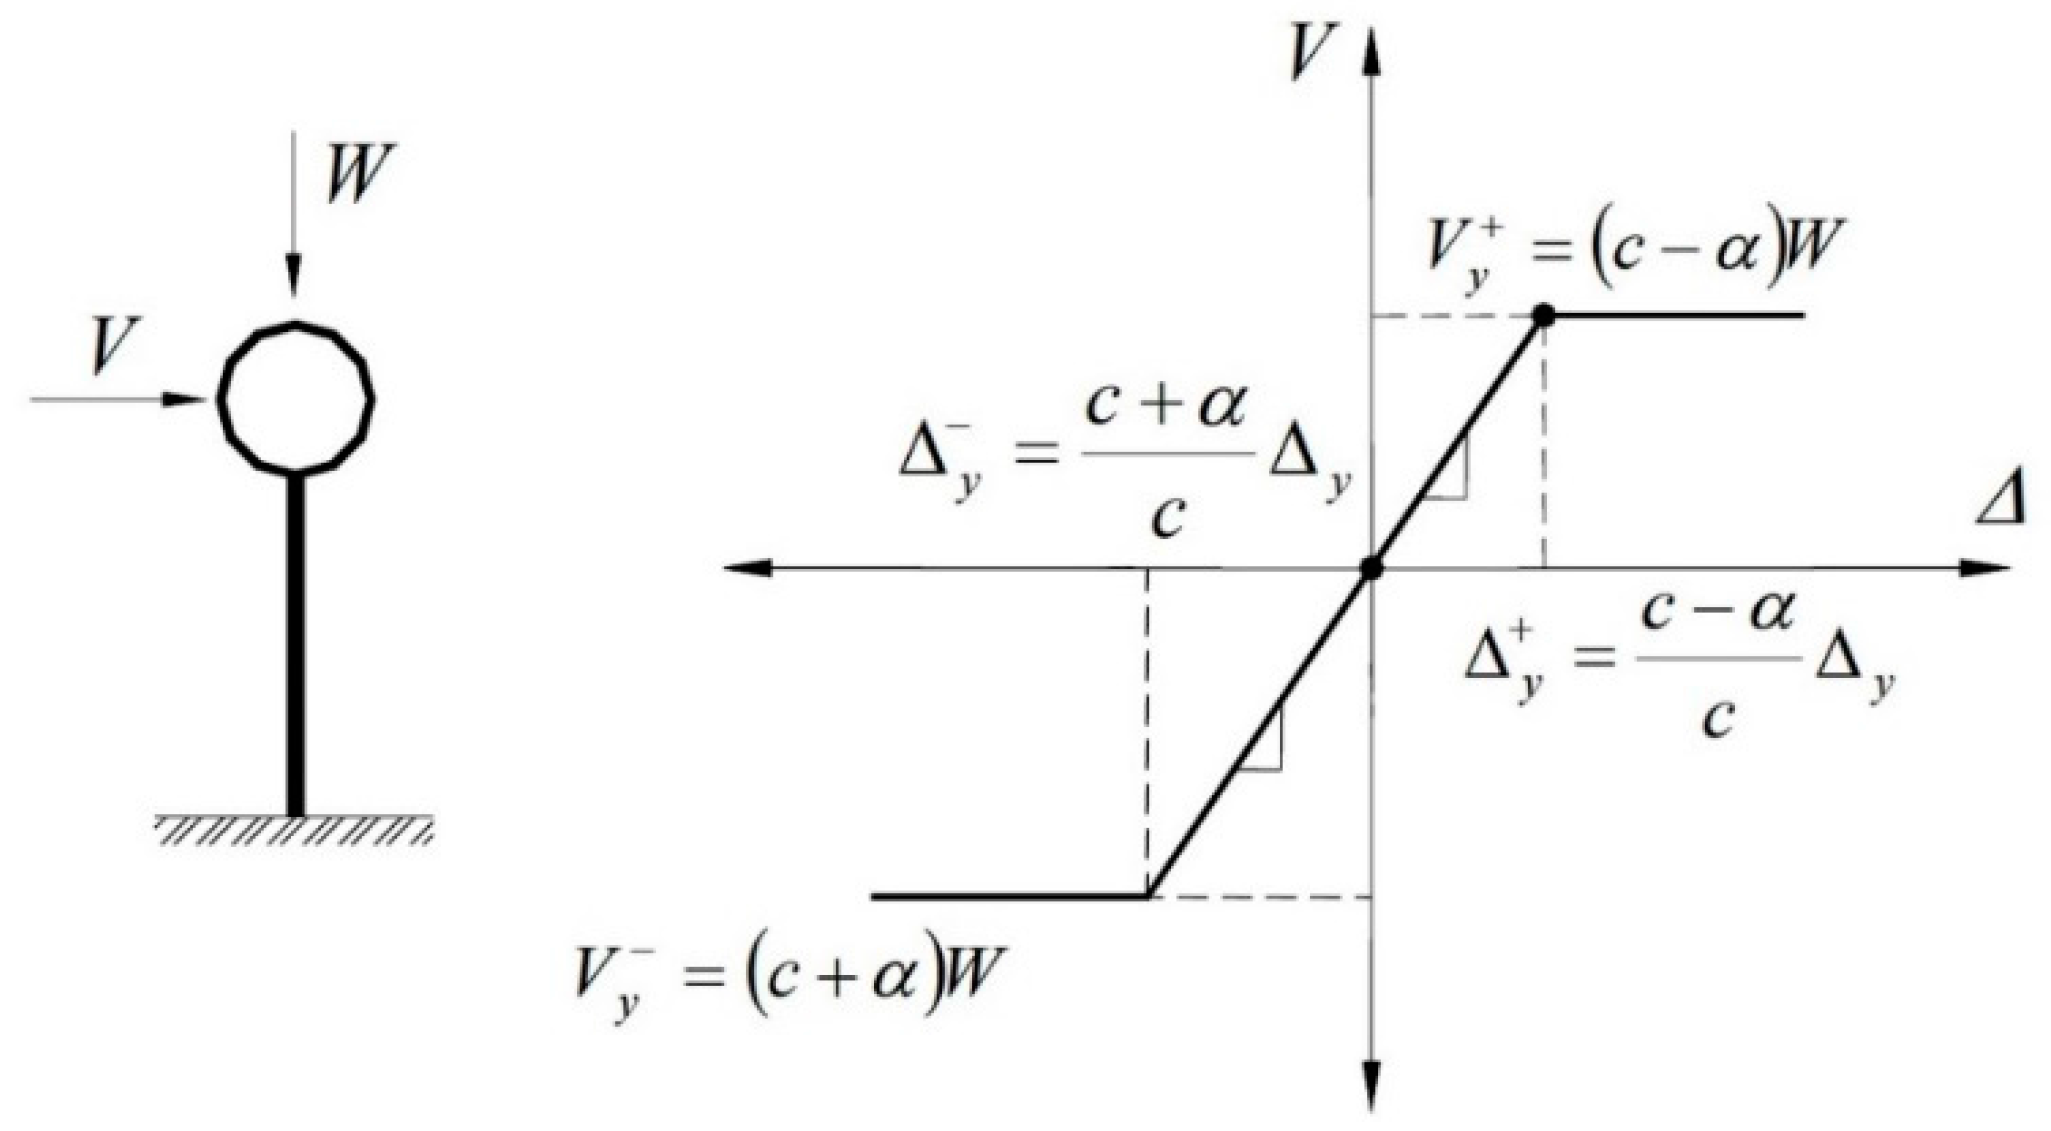
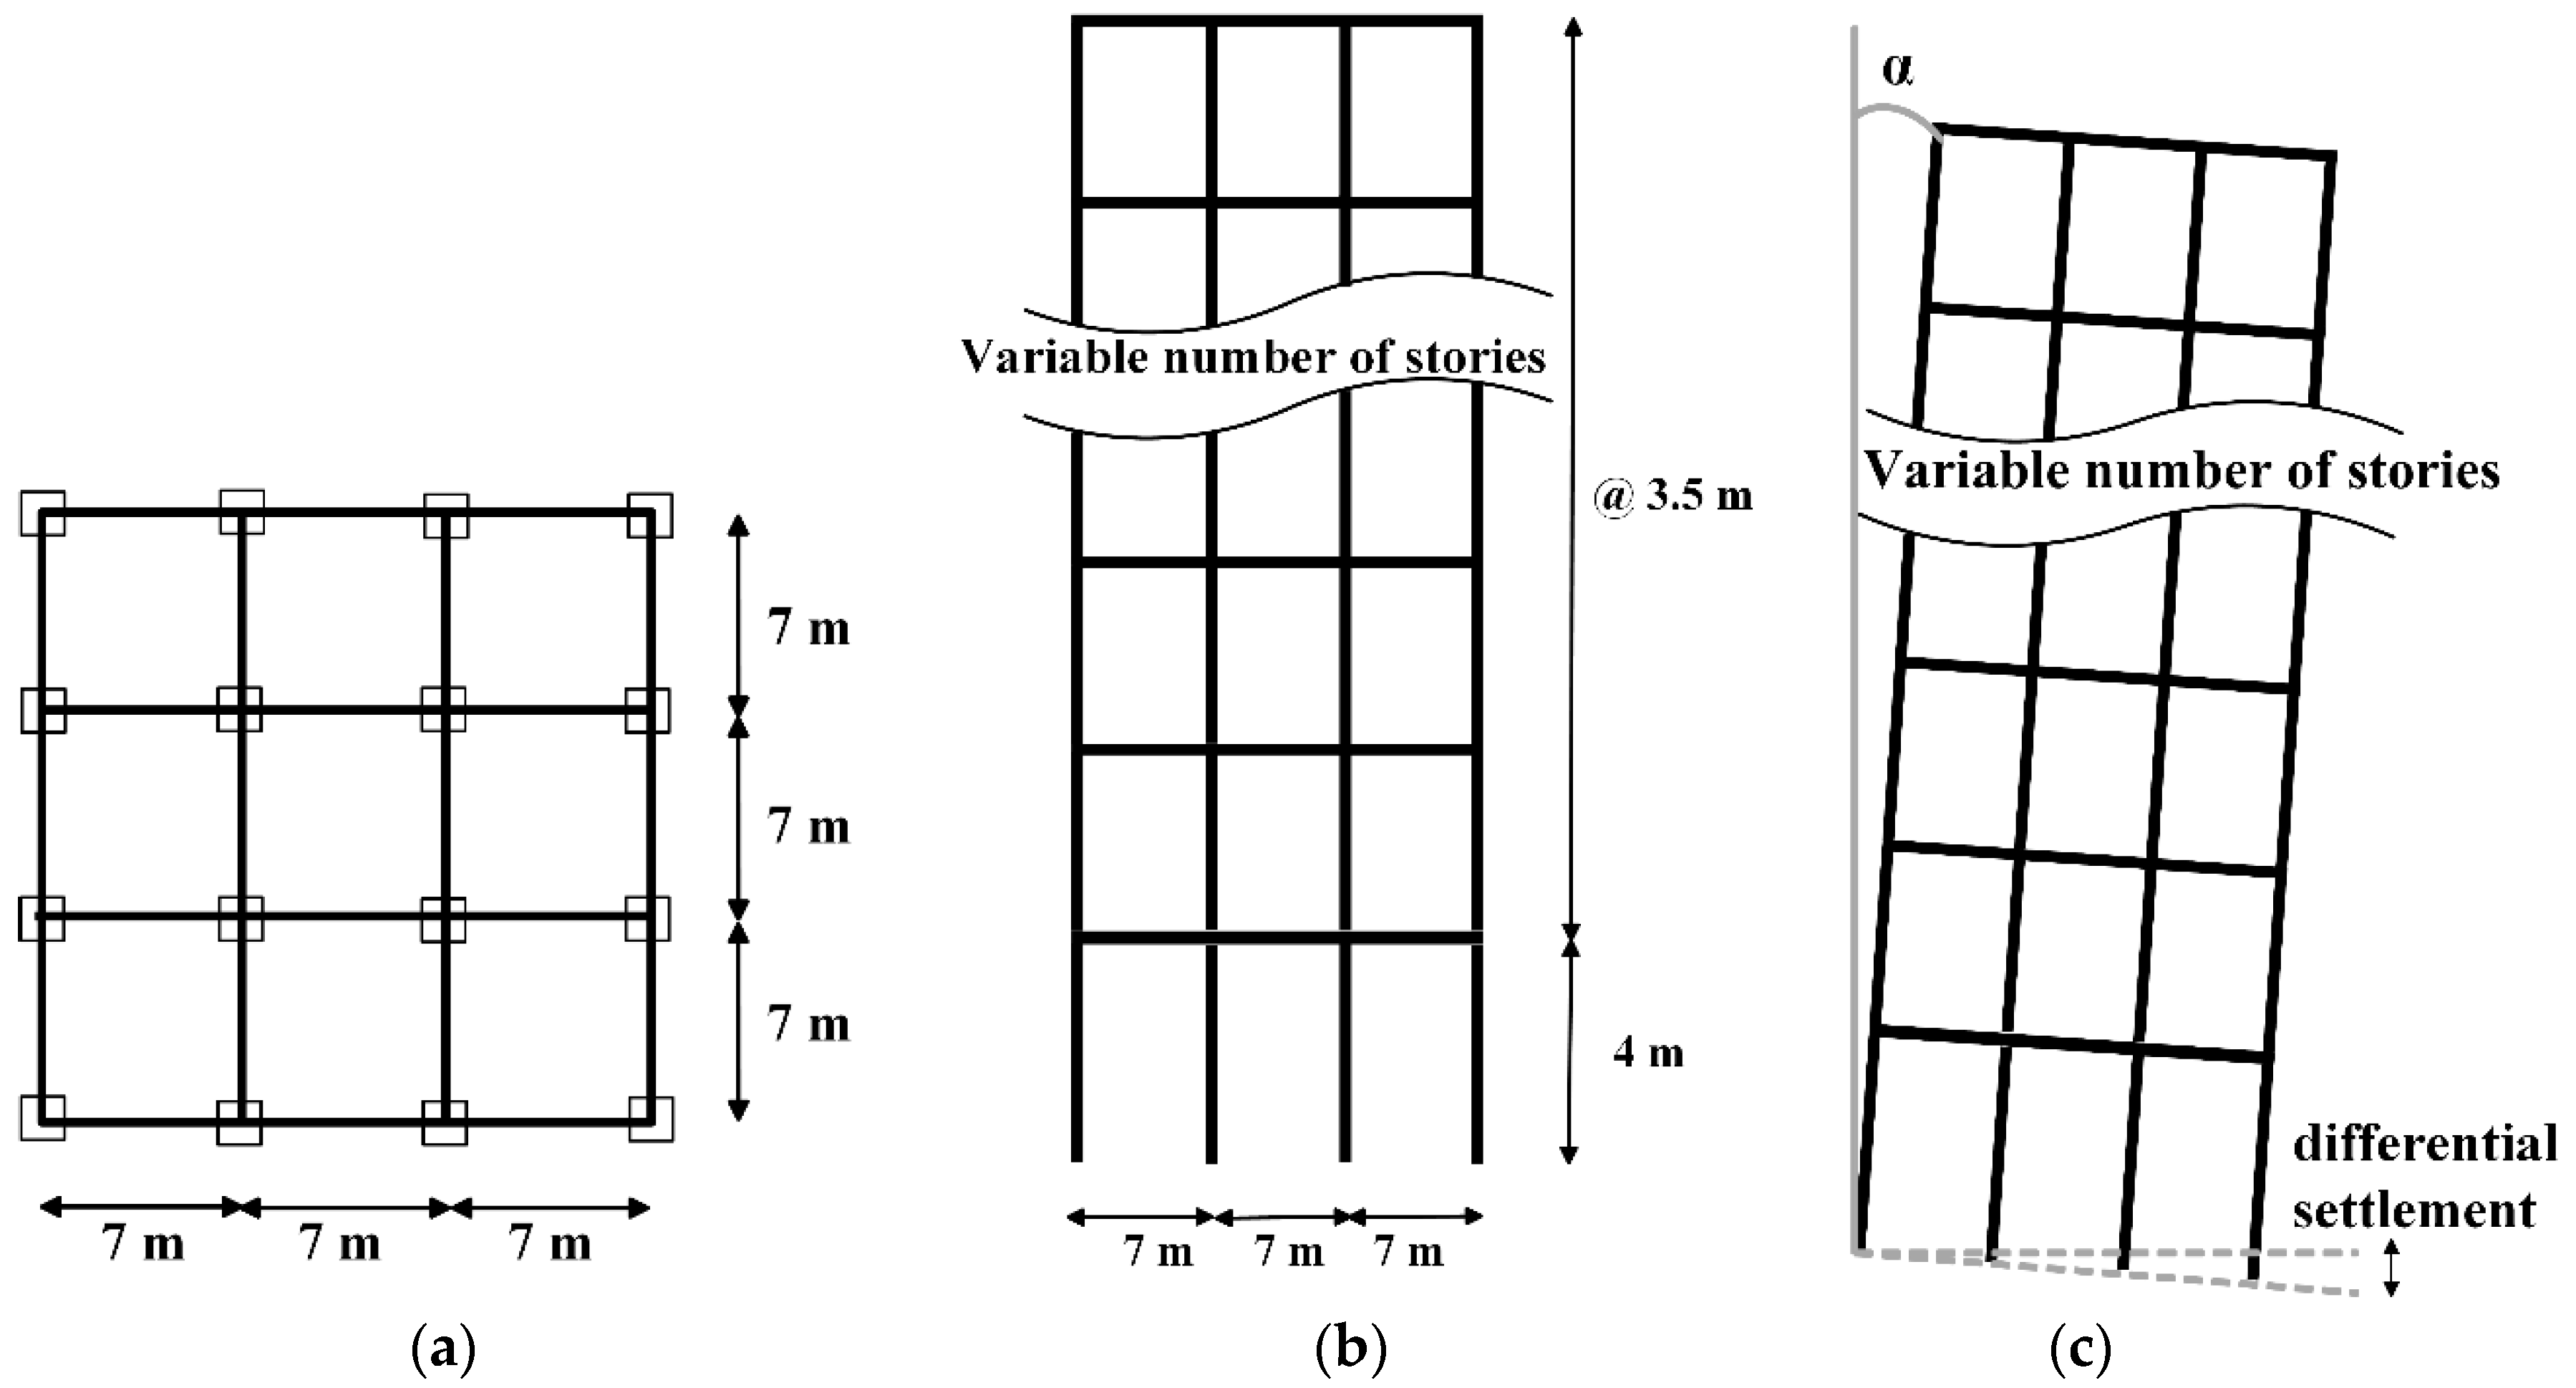
The simplified structural systems analyzed in this study are 3D models that present only one degree of freedom in each horizontal direction (E-W and N-S), and are symmetric in both strength and geometry, as shown in Figure 4a,b. The mass of the systems is lumped at the center of mass of the deck. It must be noted that the systems studied in this paper are not essentially SDOF systems since axial forces can be developed in columns under the seismic excitation. The asymmetric yielding of the structural systems is characterized by means of the parameter α, which in this case is taken as the tilting angle of the model, and resulting from the horizontal displacement (δ) of the system in one direction (produced by a differential settlement) divided by its height, L (see Figure 4b). The tilting angle is considered to occur by a differential settlement in only two columns (i.e., columns 2 and 4 in Figure 4a) producing tilting in only one direction (i.e., the model is tilted as rigid body and, consequently, there is no damage in the tilted model before the application of the seismic load; the tilting angle can be associated with a rigid rotation of the structure’s foundation). Because of this reason, the yield strength of the systems in the direction of tilting becomes smaller than that of the opposite direction, leading to an asymmetric yielding behavior of its structural members (see Figure 5).
Moreover, the parameter α that quantifies the level of asymmetric yielding in this study is equivalent to that defined in other studies [16,18]. Therefore, the results are valid for any reason that causes an asymmetric yielding behavior (see Figure 1).
When buildings are subjected to monotonically increasing lateral deformation, the strain hardening and the gradual yielding of its structural members produce a positive post-elastic slope when the second order effects (P-Δ) are neglected; however, when the analysis takes into account the secondary moments produced by the gravity loads, such effects tend to counteract the strain hardening and the gradual yielding, leading to a post-elastic slope close to zero for deformations in the range of interest [18]. For this reason, the second order effects in this study are implicitly considered by assigning a post-elastic slope close to zero in the hysteretic behavior of the structural members (i.e., the hysteretic behavior of the structural members was modeled as bi-linear with 1% of post-elastic slope). It is important to mention that this assumption is valid only for structures presenting moderate P-Δ effects. The study of structures with excessive P-Δ effects that may produce a negative post-elastic slope is out of the scope of this study. The hysteretic model used here does not consider strength or stiffness degradation; however, as reported by Teran-Gilmore et al. [18] and Terán-Gilmore and Arroyo-Espinoza [21] the results corresponding to a non- degrading bi-linear model (like those analyzed here) are more conservative than those corresponding to structures with structural degradation.
3. General Methodology
3.1. Evaluation of the Structural Reliability
One of the main objectives of Earthquake Engineering is to estimate the levels of reliability in structures by considering the possible seismic intensities that may occur at a specific site, during a given time interval. There are several methods in the literature to estimate the reliability of structures. For example: (a) the semi-probabilistic [24], (b) first order and second moments (FOSM) [25,26,27], (c) load and resistance factors design (LRFD) format [28,29], (d) those based on seismic hazard or risk analysis [30,31,32,33,34], and (e) those based on optimization [35,36,37,38]. In the present study, the structural reliability is evaluated by means of seismic hazard analysis. Using this format, the seismic reliability of structures can be estimated by combining the relationship between seismic ground motion intensity and structural response with ground motion hazard models [39,40,41]. To establish this relationship, it is common to use scalar intensity measures (IM), like the spectral acceleration at the fundamental vibration period of the structure (Sa(T1)) [42], and the average spectral acceleration over a range of vibration periods Saavg [43]. However, there are other approaches that have been proposed to estimate the structural reliability, which are not based on scalar quantities. Such approaches represent the IM as a vector [44,45], but they are out of the scope of this study.
The main objective of seismic risk analysis is to estimate conditional probabilities of exceeding a certain value of an Engineering Demand Parameter (EDP) given a certain value of IM. It is assumed that the EDP for a certain value of the IM, y, follow a lognormal distribution [2,42,46]. Next, the conditional probabilities of exceeding a certain value of EDP are combined with the seismic hazard curve (which is obtained by means of a seismic hazard analysis of the site) associated with the site and to the fundamental vibration period of the structural system with the objective of estimating the mean annual rate of exceedance (ν) of a particular EDP value, y, νEDP (y), using the following equation [39,40]:
where is the conditional probability that EDP > y, for an IM = im, is the absolute value of the derivative of the seismic hazard curve associated with the site where the structure is located, corresponding to its fundamental vibration period (T1). In the present study, the spectral acceleration at the fundamental vibration period as a fraction of gravity (Sa(g), T1) and the maximum ductility demand (µ) of the structures are selected as IM, and EDP, respectively.
3.2. Steps to Follow for the Proposed Methodology
In order to find expressions that allow us to estimate the strength amplification factors such that asymmetric yielding structures present a seismic reliability similar to that of symmetric yielding structures, steps (1) to (8) are followed:
- (1)
- Firstly, several nonlinear time history analyses are carried out for simplified structural systems with different characteristics of base shear coefficient (c), asymmetric level (α), and vibration period (T1). This is performed with the aim of obtaining the EDP as a function of seismic intensity. The maximum ductility demand of the systems (µ) is taken here as the EDP of interest. In order to calculate the maximum ductility demand of the systems, it is necessary to estimate first the ductility demand in both E-W and N-S directions (µx, µy) considering the simultaneous action of both horizontal components of the seismic ground motions; µx and µy are calculated by taking the maximum horizontal displacement of the center of mass of the structural systems in each direction (dX, dY) divided by their yield displacement, dy, which in turn is estimated by a nonlinear static analysis). Finally, the maximum ductility demand is defined in this study as the maximum of the ductility values estimated in each horizontal direction, as indicated in Equation (2).
- (2)
- Next, the median (D) and standard deviation (σlnD) of the ductility demand logarithms are calculated.
- (3)
- Fragility curves for several values of the maximum ductility demand are obtained using Equation (3):where all the variables were defined before, and Φ represents the Gaussian cumulative distribution function.
- (4)
- Ductility demand hazard curves (DDHC, Equation (1)) are obtained for symmetric yielding systems, and alternatively, for systems with different levels of asymmetric yielding.
- (5)
- Considering the ductility demand hazard curves corresponding to a wide variety of systems with different characteristics, ductility uniform exceedance rate spectra (µ-UERS) are obtained for several mean annual rate of exceedance values. To explicitly display the increment in the expected ductility demand of asymmetric yielding systems with respect to symmetric systems, ratios of µ-UERS corresponding to asymmetric yielding systems with respect to symmetric ones are calculated.
- (6)
- The next step is to obtain base shear coefficient spectra (BSCS) for symmetric as well as for asymmetric yielding systems employing a linear interpolation process. This procedure consists in selecting a value of the ductility demand and the associated values of T1 and c, corresponding to a given µ-UERS. The process is repeated several times in order to obtain a data set T1 vs c for each value of the ductility demand considered. More details about this process can be found in [22]. Ratios between BSCS of systems with different levels of asymmetric yielding with respect to symmetric systems, RBSCS, are calculated with the objective of quantifying the additional lateral strength requirement of systems with asymmetric yielding to achieve a seismic performance equivalent to their symmetric counterparts. These ratios can be expressed as:
- (7)
- A simplified mathematical expression is fitted to the ratios of the base shear coefficient spectra obtained in step 6. The proposed expression is a function of the asymmetry level (α) of the structural system, the ratio between the fundamental vibration period of the system and the dominant period of the soil, and the maximum ductility demand of the system.
- (8)
- Steps (1) to (7) are repeated for the seismic zones of interest (having different soil dominant periods, from firm ground to very soft soil). The resulting mathematical expressions for each zone will be compared between them to evaluate the influence of the dominant period of the soil on the strength amplification factors. Hence, general rules for the seismic region under study can be proposed.
Finally, the validity of the mathematical expressions proposed in this study is corroborated by estimating the expected ductility demand of actual MDOF systems and comparing it with that of the simplified systems associated to the same value of the mean annual rate of exceedance. In the end, ductility transformation factors will be calculated in order to consider the possible differences between the responses of the two structural configurations.
4. Seismic Zones Analyzed
With the aim of proposing simplified mathematical expressions for different soil conditions of the valley of Mexico, the area was divided into seven seismic zones according to its dominant period, Ts (see Table 1). To address this concern, several seismic ground motions recorded in different stations were selected, their main characteristics can be consulted in [15]. The seismic records correspond to subduction events with moment magnitude greater than or equal to 6.9 (M ≥ 6.9), and approximately similar epicentral distances. It can be observed in Table 1 that the dominant period of the selected seismic zones varies from approximately 0.5 s for Zone A (firm ground) to approximately 3.5–4 s for Zone G (very soft soil).
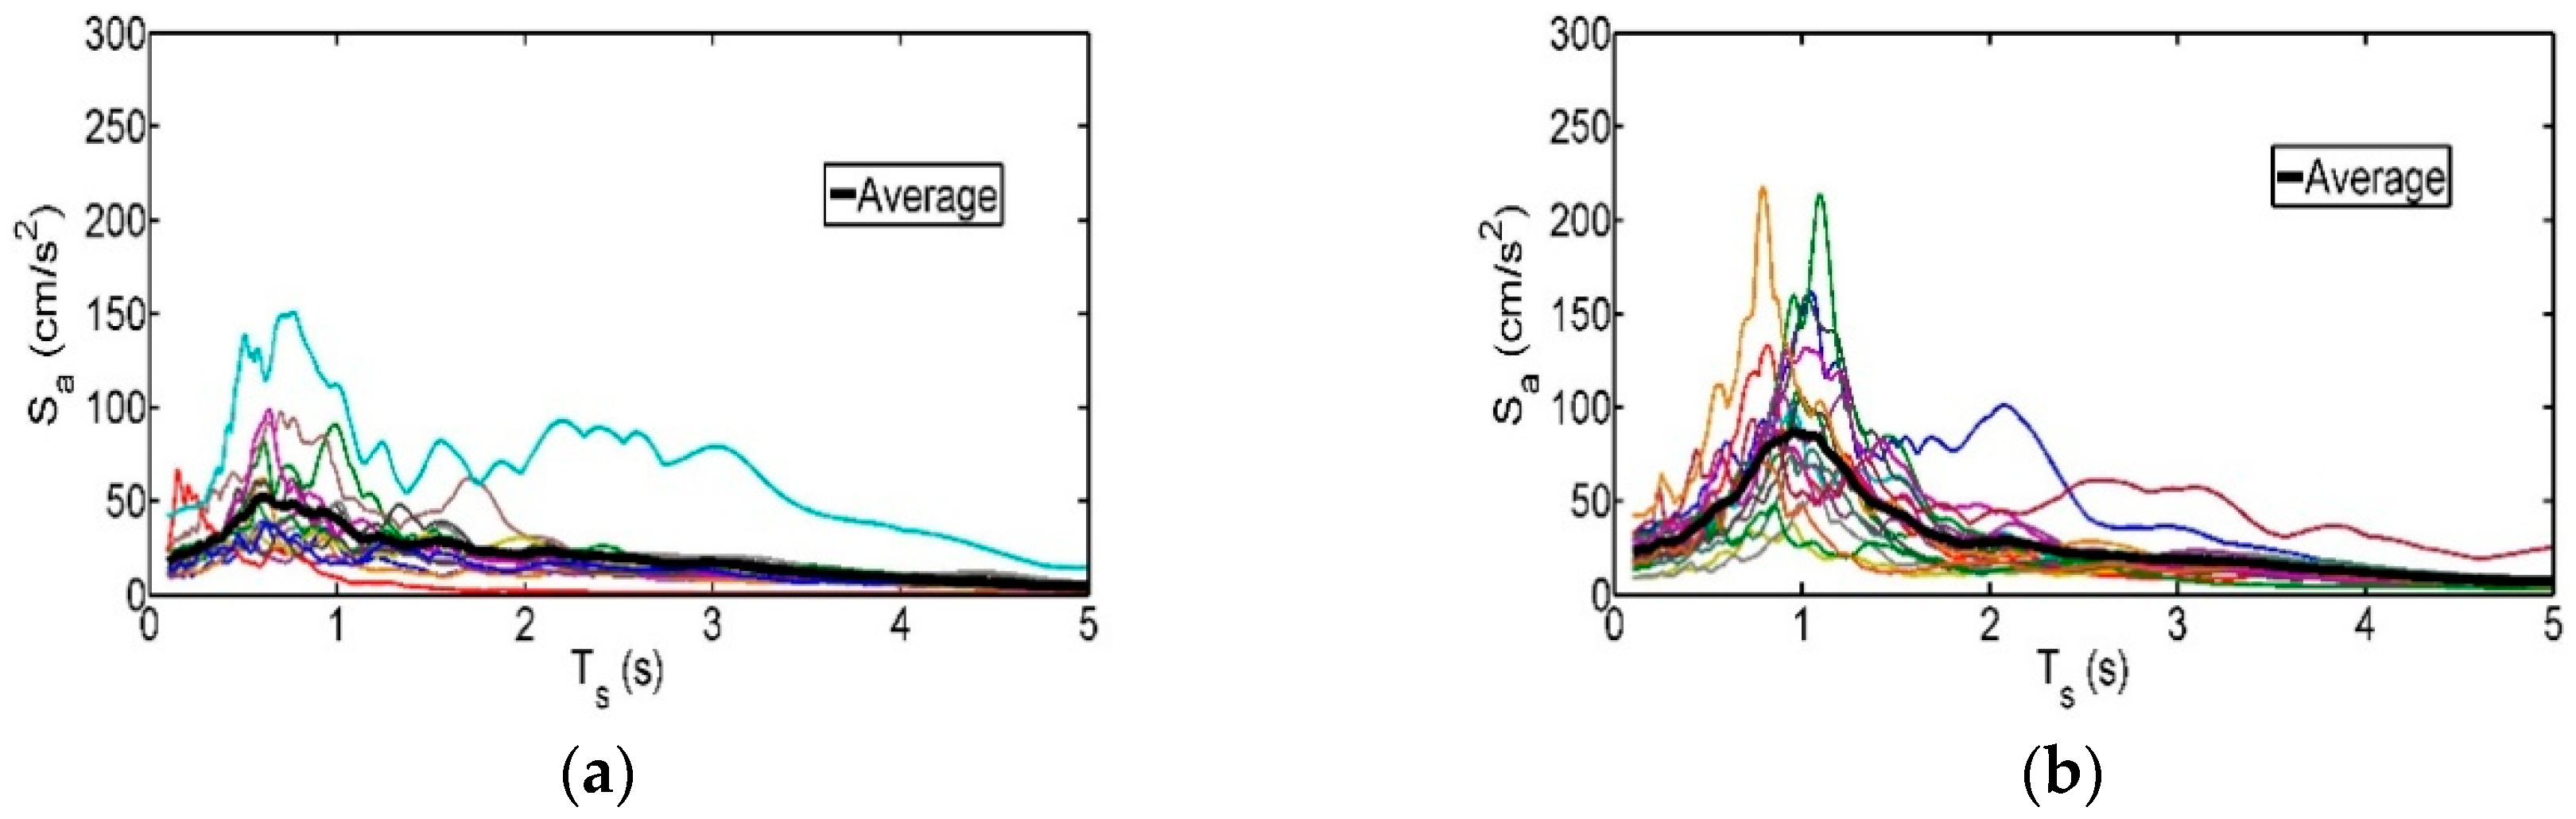
The dominant period of each seismic record is defined as the period where the pseudo-acceleration elastic response spectrum reaches its maximum value, and the dominant period of a given seismic zone is taken as the period where the arithmetic average spectrum reaches its maximum value. The dominant periods of the seven seismic zones are shown in the third column of Table 1. Here, both horizontal components of the seismic ground motions are scaled in terms of the pseudo-acceleration in the fundamental vibration period of the structure, using the quadratic mean format, as follows:
where SaEW and SaNS are the pseudo-acceleration elastic response spectra ordinates associated to the fundamental vibration period of the system under consideration, for 5% of critical damping, corresponding to E-W and N-S ground motions components, respectively. The seismic ground motions were scaled for Sa/g values from 0.1 to 1.4. The scaling of the seismic records consists of multiplying the ordinates of the accelerograms using some factors in order to achieve that all the records present the same value of Sa at the fundamental vibration period of the structure under consideration [42]. Figure 6 shows the pseudo-acceleration elastic response spectra for 5% of critical damping for the E-W component of the selected ground motions, along with their corresponding arithmetic average spectrum, which is represented by a bold black line.
It can be observed in Figure 6 that for the Zones A and B the spectral shapes are not clearly defined around a single vibration period; however, it is observed that for zones C to G, the spectral peaks are grouped around the dominant period of the soil. The change in the spectral shapes may be attributed to seismic source effects like magnitude and frequency content, as well as to the dominant period of the soil.
5. Mathematical Expressions of Strength Amplification Factors Corresponding to the Seismic Region of Interest
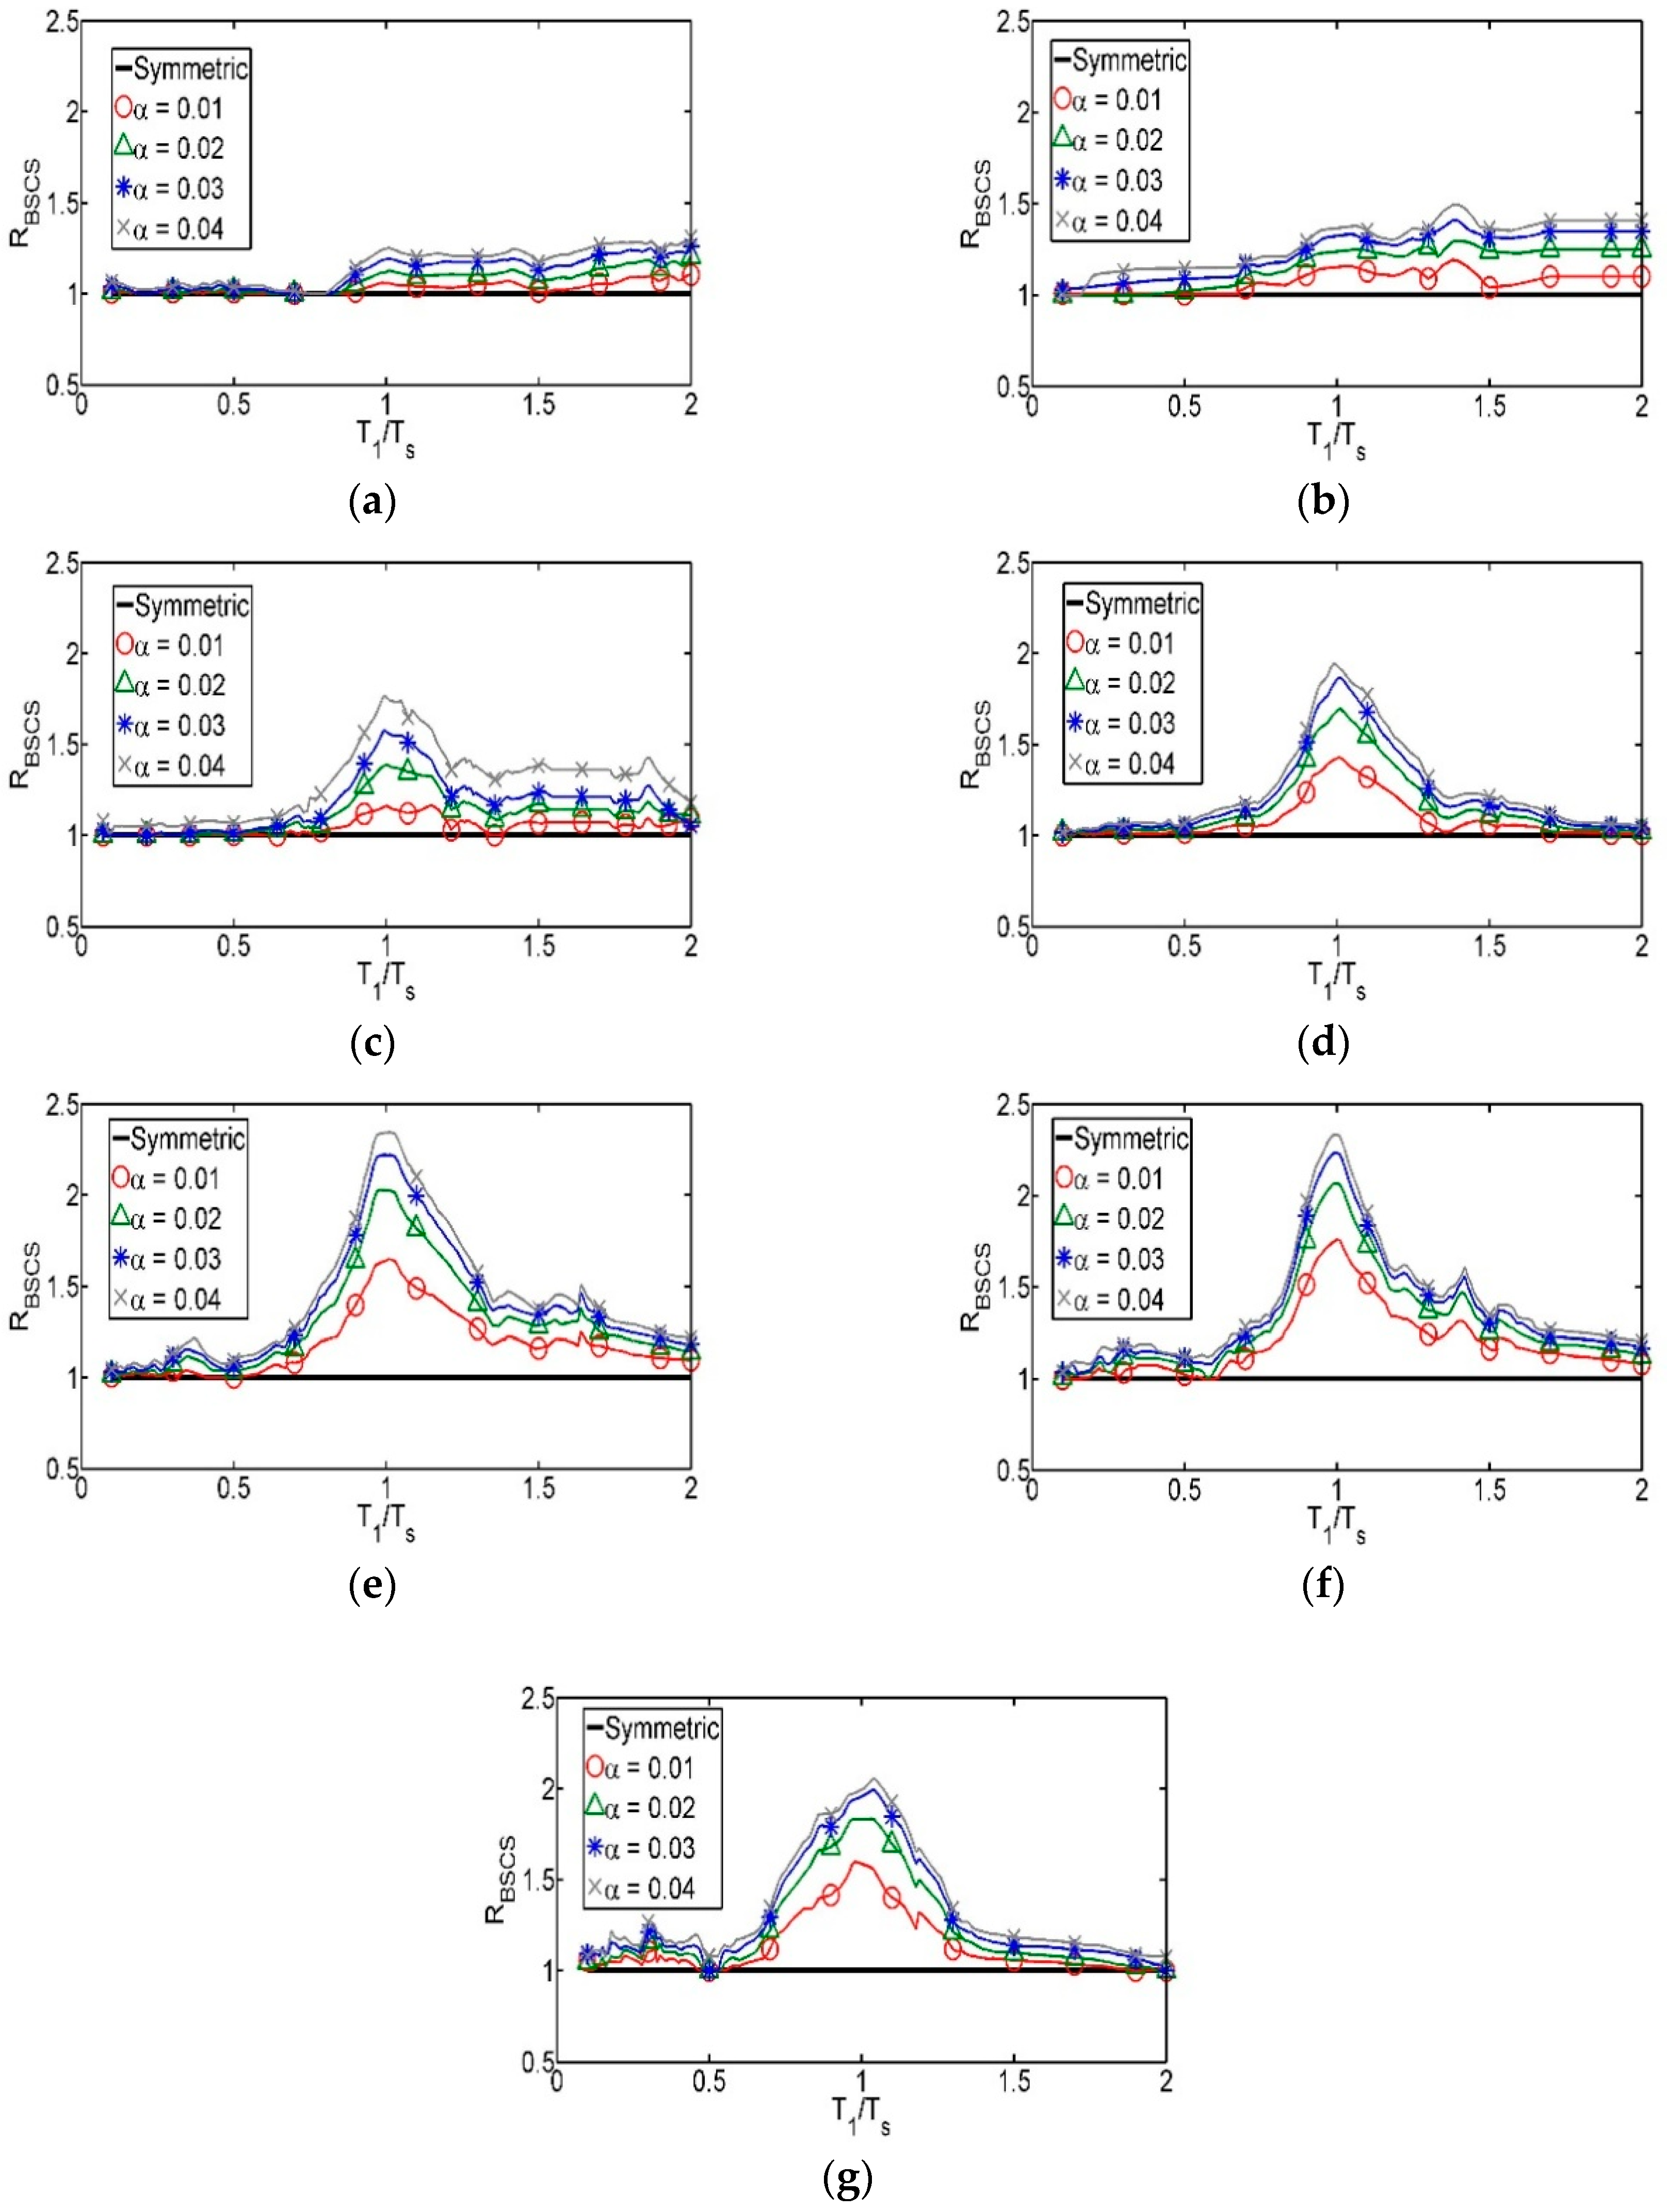
The methodology to estimate the strength amplification factors for structures with asymmetric yielding mentioned in Section 3.2 was applied here to the valley of Mexico. Figure 7a–g show the ratios RBSCS (defined in Equation (4)) for zones A to G corresponding to a ductility demand of 2 (μ = 2) and annual rate of exceedance ν = 0.008 (corresponding to a return period, Tr = 125 years). The horizontal axis represents the ratio of the fundamental vibration period of the structural systems to that of the dominant period of the soil corresponding to the seismic zone under consideration; while the vertical axis shows the parameter RBSCS which represents the additional strength required for asymmetric yielding systems to achieve a seismic performance and structural reliability, in terms of the ductility demand, equivalent to their symmetric yielding counterparts.
Even though the results are presented for a single value of ductility demand and mean annual rate of exceedance, the main observations are valid for all the ductility values considered in this study. Besides, as reported by [22], the increment in the ductility demand of asymmetric yielding systems with respect to symmetric systems is sensibly independent of the selected mean annual rate of exceedance (return period). It is worth mentioning that in Zones A and B (firm ground) there is no a dominant period of the soil; however, it is considered in the same way as the other zones with the objective of standardizing the results presented in this study.
It is observed in Figure 7 that the RBSCS parameter is smaller for firm ground (Zones A and B) than for intermediate and soft soils (Zones C, D, E, F, and G) in the zone where the effect of asymmetric yielding is more important (i.e., T1/Ts ≈ 1). This indicates that the detrimental effect of asymmetric yielding is, generally, higher on soft soil than on firm ground; however, this is not always true, particularly for T1/Ts ratios away from unity. In contrast, it is observed that for Zones A and B the shapes of the graphs are almost constant for T1/Ts greater than 1. However, for the other seismic zones, the strength requirement reaches its maximum where the vibration period of the system is close to the dominant period of the soil and decreases as the T1/Ts ratio moves away from unity. In summary, Figure 7 demonstrates that the effect of asymmetric yielding is more detrimental for structural systems located on soft soils and whose vibration period is close to the dominant period of the soil where is located.
Once the information was grouped into these seven categories, simplified mathematical expressions were fitted to the results using the least square method. It must be noticed that the shape of the graphs corresponding to firm ground is different from that associated with intermediate and soft soils (see Figure 7). The resulting expressions are in function of the parameters that influence the seismic performance of structures with asymmetric yielding such as: the level of asymmetric yielding (α), the ductility demand (µ), the fundamental vibration period of the structure (T1) and the dominant period of the soil (Ts). The general forms of the mathematical expressions proposed here are an extension of those proposed by Teran-Gilmore and Arroyo-Espinoza [21], which are based on a statistical analysis of the response of SDOF systems, under one-directional ground motions, where the SDOF systems are idealized with asymmetric force-deformation relationship (Figure 5), and in accordance with a constant damage criterion using the Park and Ang damage index [47]. On the other hand, the expressions proposed in this paper are based on a reliability analysis, which estimates mean annual rates of exceedance of an EDP for a given return period. In addition, the structural ductility demand and the level of asymmetric yielding are explicitly considered.
The mathematical expressions for the estimation of the strength amplification factors (AF) that were fitted to the RBSCS ratios (as those in Figure 7) are:
The values of a, b, c, and d are presented in Table 2 for the seven seismic zones in which the valley of Mexico was classified. Equations (6) and (7) were developed to be applied to structural systems with levels of asymmetric yielding up to 0.04 and ductility demands of 2, 3 and 4; they are not valid to estimate strength amplification factors for structures that exceed those values. However, most of the structures susceptible to present asymmetric yielding produced by tilting, fall into these ranges. It is noticed that a level of asymmetry larger than 0.03 has a very small probability to occur.
Figure 8 compares the results obtained with Equations (6) and (7) with those shown in Figure 7, corresponding to RBSCS associated with a ductility demand of 2. It can be seen in Figure 8 that Equations (6) and (7) fit appropriately to the RBSCS data.
It is important to mention that the values of the parameters presented in Table 2 do not correspond strictly to the least square method results, since their values could be more complex by introducing a larger number of parameters, and consequently, represent better the data obtained from the analyses; however, the authors consider that the proposed mathematical expressions (Equations (6) and (7)) can be used in a practical seismic design context, providing sufficiently accurate results.
Comparison of the Proposed Mathematical Expressions with that Recommended in the Current Mexico City Building Code
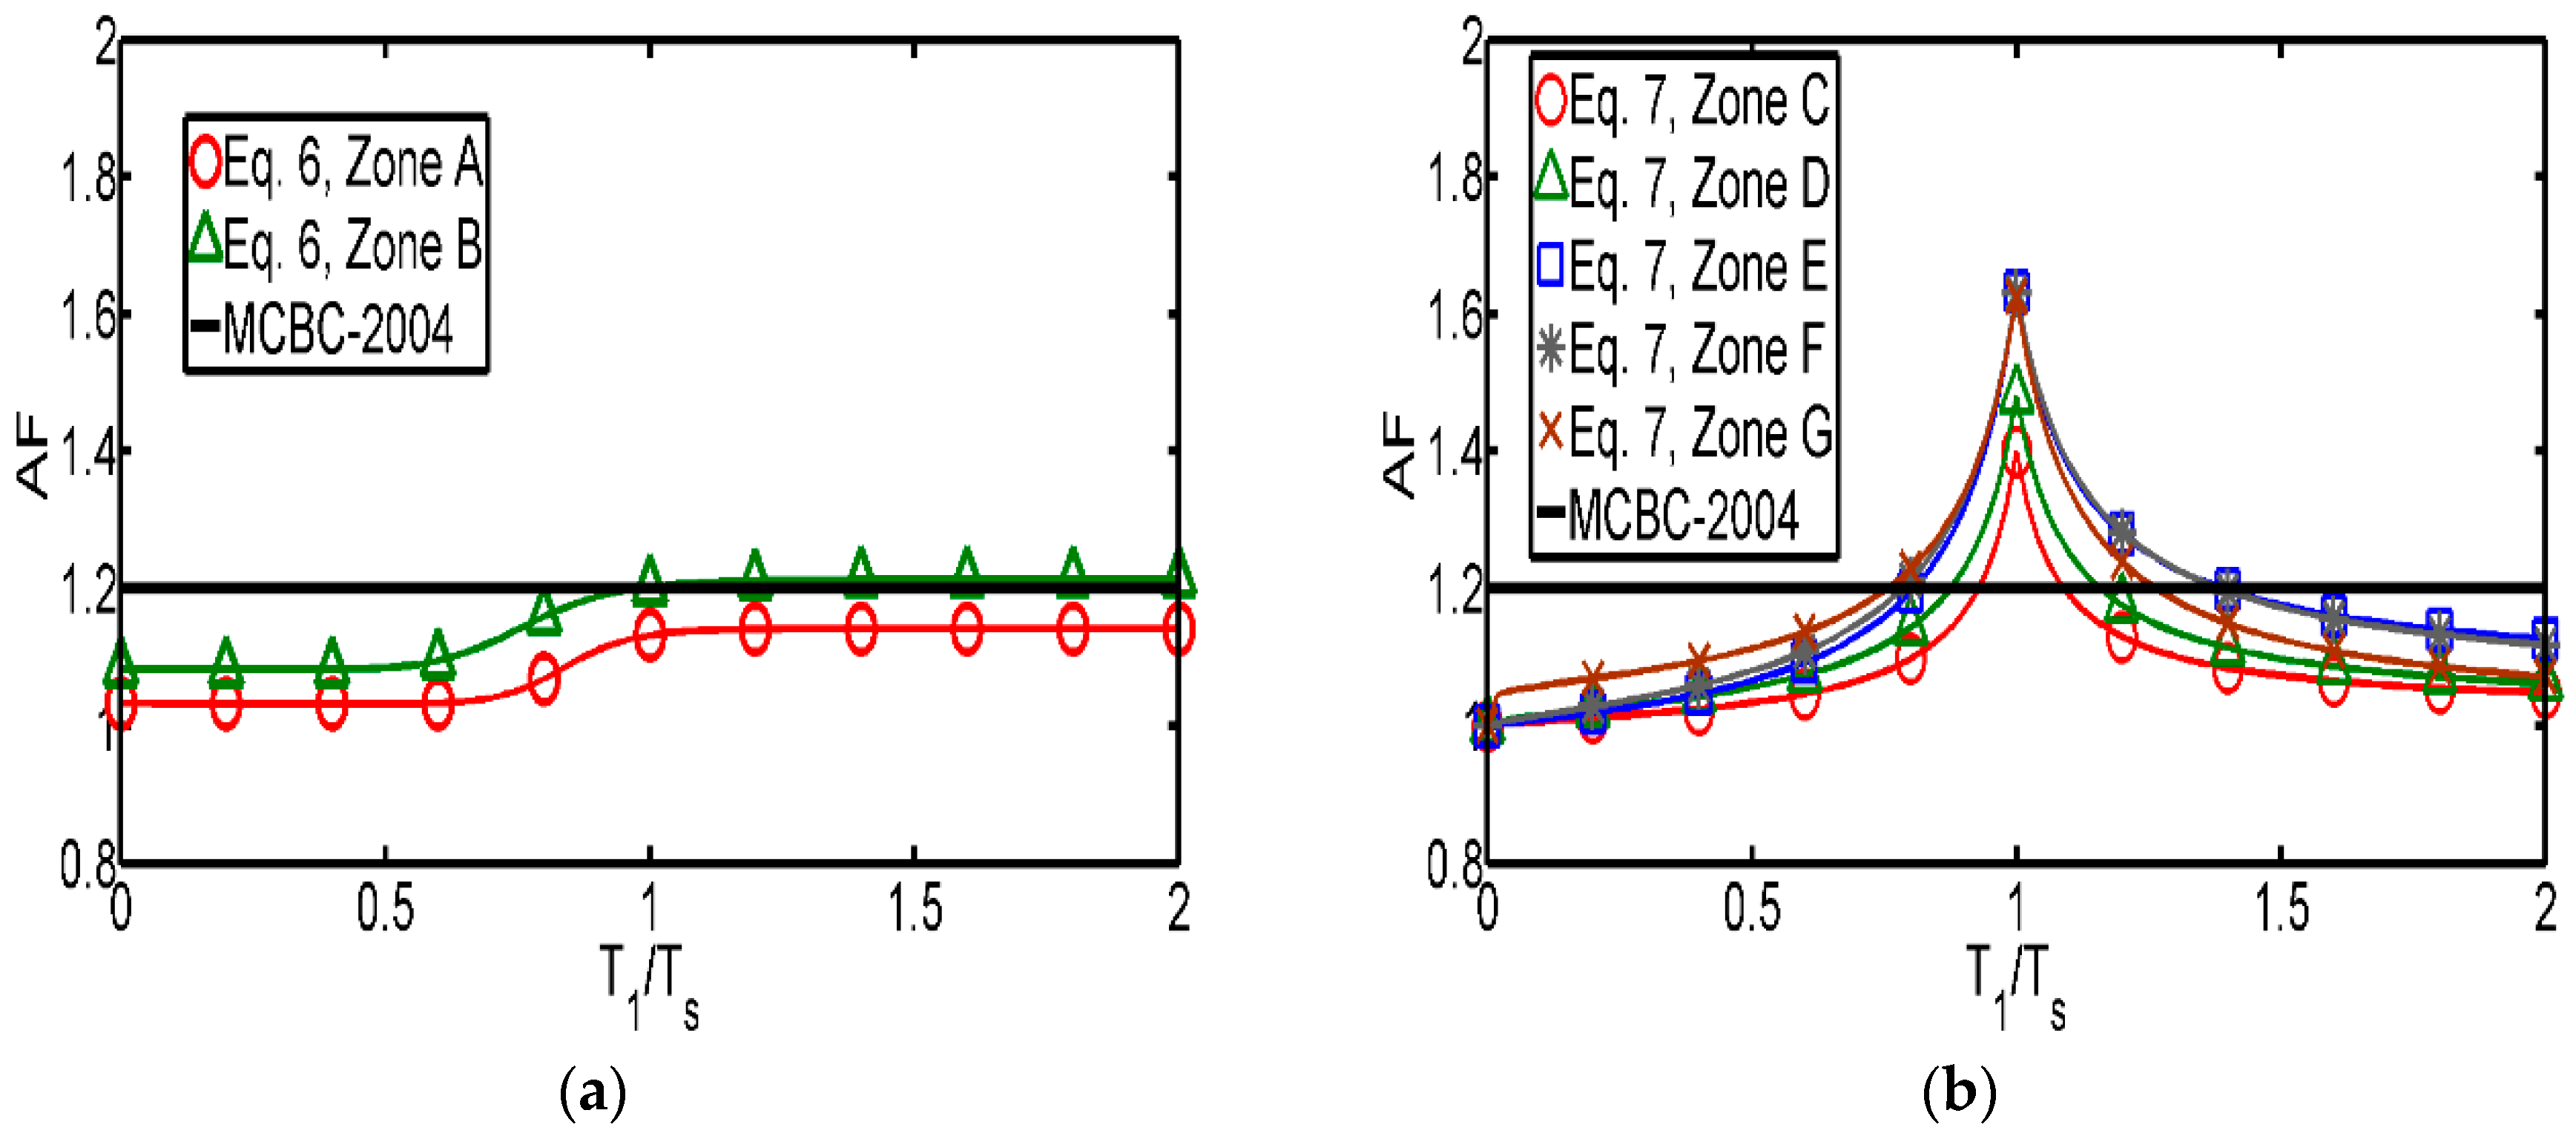
Figure 9a,b compare the strength amplification factors obtained according to the mathematical expressions proposed in this study (Equations (6) and (7), and Table 2) with those recommended by the MCBC-2004. The MCBC-2004 recommends amplifying the design base shear coefficient of structures that exhibit asymmetric yielding produced by tilting by the following factor:
where Q is the seismic behavior coefficient, that is related to the ductility of the structure, and f is the level of asymmetry of the structure (which is equivalent to the parameter α used in this study). The comparison is made for a ductility demand of 2 and considering a level of asymmetric yielding α = 0.02. The general observations made are valid for other values of μ and α. As shown in Figure 9a,b, for firm ground, the expression given by the MCBC-2004 is more conservative than the expressions proposed in this study for all the T1/Ts ratios considered. On the other hand, for intermediate and soft soils, the expression recommended by MCBC-2004 leads to conservative results only for T1/Ts ratios away from unity; nevertheless, there is an important underestimation of the strength amplification factors for structures whose fundamental vibration period is close to the dominant period of the soil (i.e., T1/Ts ≈ 1). Results indicate that this underestimation may be higher than 100% (depending on the level of asymmetric yielding and on the ductility value). It is noticed that the MCBC-2004 recommends factors that are constant for all T1/Ts values. This is an important limitation considering that the results presented in this study demonstrated that the effect of the effect of asymmetric yielding is more important for structural systems with vibration period close to the dominant period of the soil. The differences between the curves obtained in this study with respect to the MCBC-2004 are due to the fact that the former were obtained from a reliability-based analysis, while the latter were derived from a brief deterministic constant ductility criterion and engineering judgment.
6. Ductility Transformation Factors between Simplified and MDOF Systems
The above analyses regarding the estimation of the strength amplification factors for the design or reinforcement of structures with asymmetric yielding were performed considering simplified systems (SS); however, the ductility demand of asymmetric yielding MDOF structural systems may be different from that of its equivalent SS. Because of this reason, it is necessary to consider such difference by finding ductility transformation factors between the ductility demands of both structural systems (MDOF and SS).
There are some studies related to transformation factors of the dynamic response of conventional MDOF and SDOF structural systems. For example, Bojorquez et al. [48] proposed equations to obtain probabilistic response transformation factors for maximum ductility and inter-story drift using artificial neural networks; they concluded that an artificial neural network is a useful tool for reliability-based seismic design procedures of framed buildings. Similarly, Bojorquez et al. [49] estimated probabilistic and deterministic response transformation factors in order to evaluate the response in terms of maximum ductility and maximum interstory drifts of MDOF systems based on the response of equivalent SDOF systems. They analyzed five steel buildings designed in accordance with the MCBC-2004, and concluded that in both approaches, the structural demand of steel frames can be obtained with good accuracy by means of equivalent SDOF systems; however, the results documented in the above studies are not valid for asymmetric yielding reinforced concrete buildings. In the present study ductility transformation factors (DTF) for reinforced concrete structures exhibiting asymmetric yielding produced by tilting are calculated using Equation (9) as:
where represents the maximum ductility demand estimated for buildings modeled as MDOF systems associated to an annual rate of exceedance value (ν), and is the maximum ductility demand calculated for an equivalent simplified system associated with the same value of ν. To estimate the expected ductility demand of the structural systems, associated with an annual rate of exceedance value, the corresponding ductility demand hazard curves (DDHC) need to be obtained using Equation (1). Figure 10 illustrates schematically the calculation of the DTF from the ratio of DDHC corresponding to MDOF and to SS systems, associated with a given ν value.
DTF were estimated for five reinforced concrete structures (8-, 9-, 10-, 11-, and 12-story buildings designed according to MCBC-2004) and their corresponding equivalent simplified structural systems, considering several values of α (0.0–0.03). Regarding the number of buildings analyzed, it is worth mentioning that this study is based on the analysis of asymmetric yielding produced by differential settlements, which is more likely to occur in buildings built on soft soil and having shallow foundations, which are often used in medium-rise buildings. Conversely, taller buildings are usually supported on deep foundations, which reach the firm ground, and consequently, the tilting is not a common problem. To incorporate the influence of the annual rate of exceedance value in the results, DTF were calculated for ν values between 0.01 and 0.001 (which correspond to return intervals between 100 and 1000 years).
6.1. Characteristics of the Buildings Analyzed
The buildings analyzed in this study were designed in a conventional way, following the recommendations of the MCBC-2004. The plan and elevation of the buildings are illustrated in Figure 11. The occupancy of the buildings is considered to be residential. The nominal design compression stress is f’c = 29.4 MPa for concrete, and fy = 411.9 MPa in tension and compression for the reinforcing steel. The design of the buildings was carried out by using the software ETABS (2016, Computers and Structures Inc., Berkeley, CA, USA) [50]. The buildings are assumed to be located in a zone in the valley of Mexico with a soil dominant period Ts = 1.8 s (which falls in the intermediate zone as considered in the present study), with a seismic behavior coefficient, Q = 3 (which implies that the detailing requirements for their structural members are similar to those established by the Uniform Building Code [51] for reinforced concrete special moment-resisting frames). The design of the buildings was based on a modal spectral dynamic analysis. The lateral stiffness was selected so that the maximum inter-story drift does not exceed 0.030, which is the limit specified by MCBC-2004 for the design of ductile moment-resisting concrete frames.
The nonlinear idealization of the buildings was carried out with the Ruaumoko3D (2007, Athol Carr., Canterbury, Christchurch, New Zealand) [52] software. The modeling of the buildings includes the nonlinear behavior of their structural members. In this study, the modeling of the beams considers a plastic hinge length equal to half of their height, to estimate the rotational capacity. The yield moment in each of the principal axes of the beams is obtained from the corresponding moment-curvature diagram of the cross sections located at their ends, and it is associated with the smallest of the curvatures corresponding to: (1) fracture of the tension longitudinal steel, (2) buckling of the compression longitudinal steel, and (3) crushing of the compression concrete block. An interaction diagram is developed for each column. The rigid end-block lengths of the beams and columns are taken equal to half of the height of the members with which they intersect. Rigid diaphragms are considered in all building levels, and the corresponding mass of a given story is considered to be lumped in its center of mass. The Tangent Stiffness Rayleigh Damping model was used in the analysis. The hysteretic behavior of the structural members is idealized as bi-linear, with 1% of post-elastic stiffness (to be consistent with the results presented before for simplified models), and therefore, P-Δ effects are implicitly considered.
Table 3 summarizes the main dynamic characteristics of the buildings such as their fundamental vibration period (T1), the resistant base shear (Vb), the resistant base shear coefficient (c), the yield displacement (dy), and the ultimate displacement (du), the latter two were obtained through nonlinear static (pushover) analyses.
6.2. Ductility Transformation Factors (DTF)
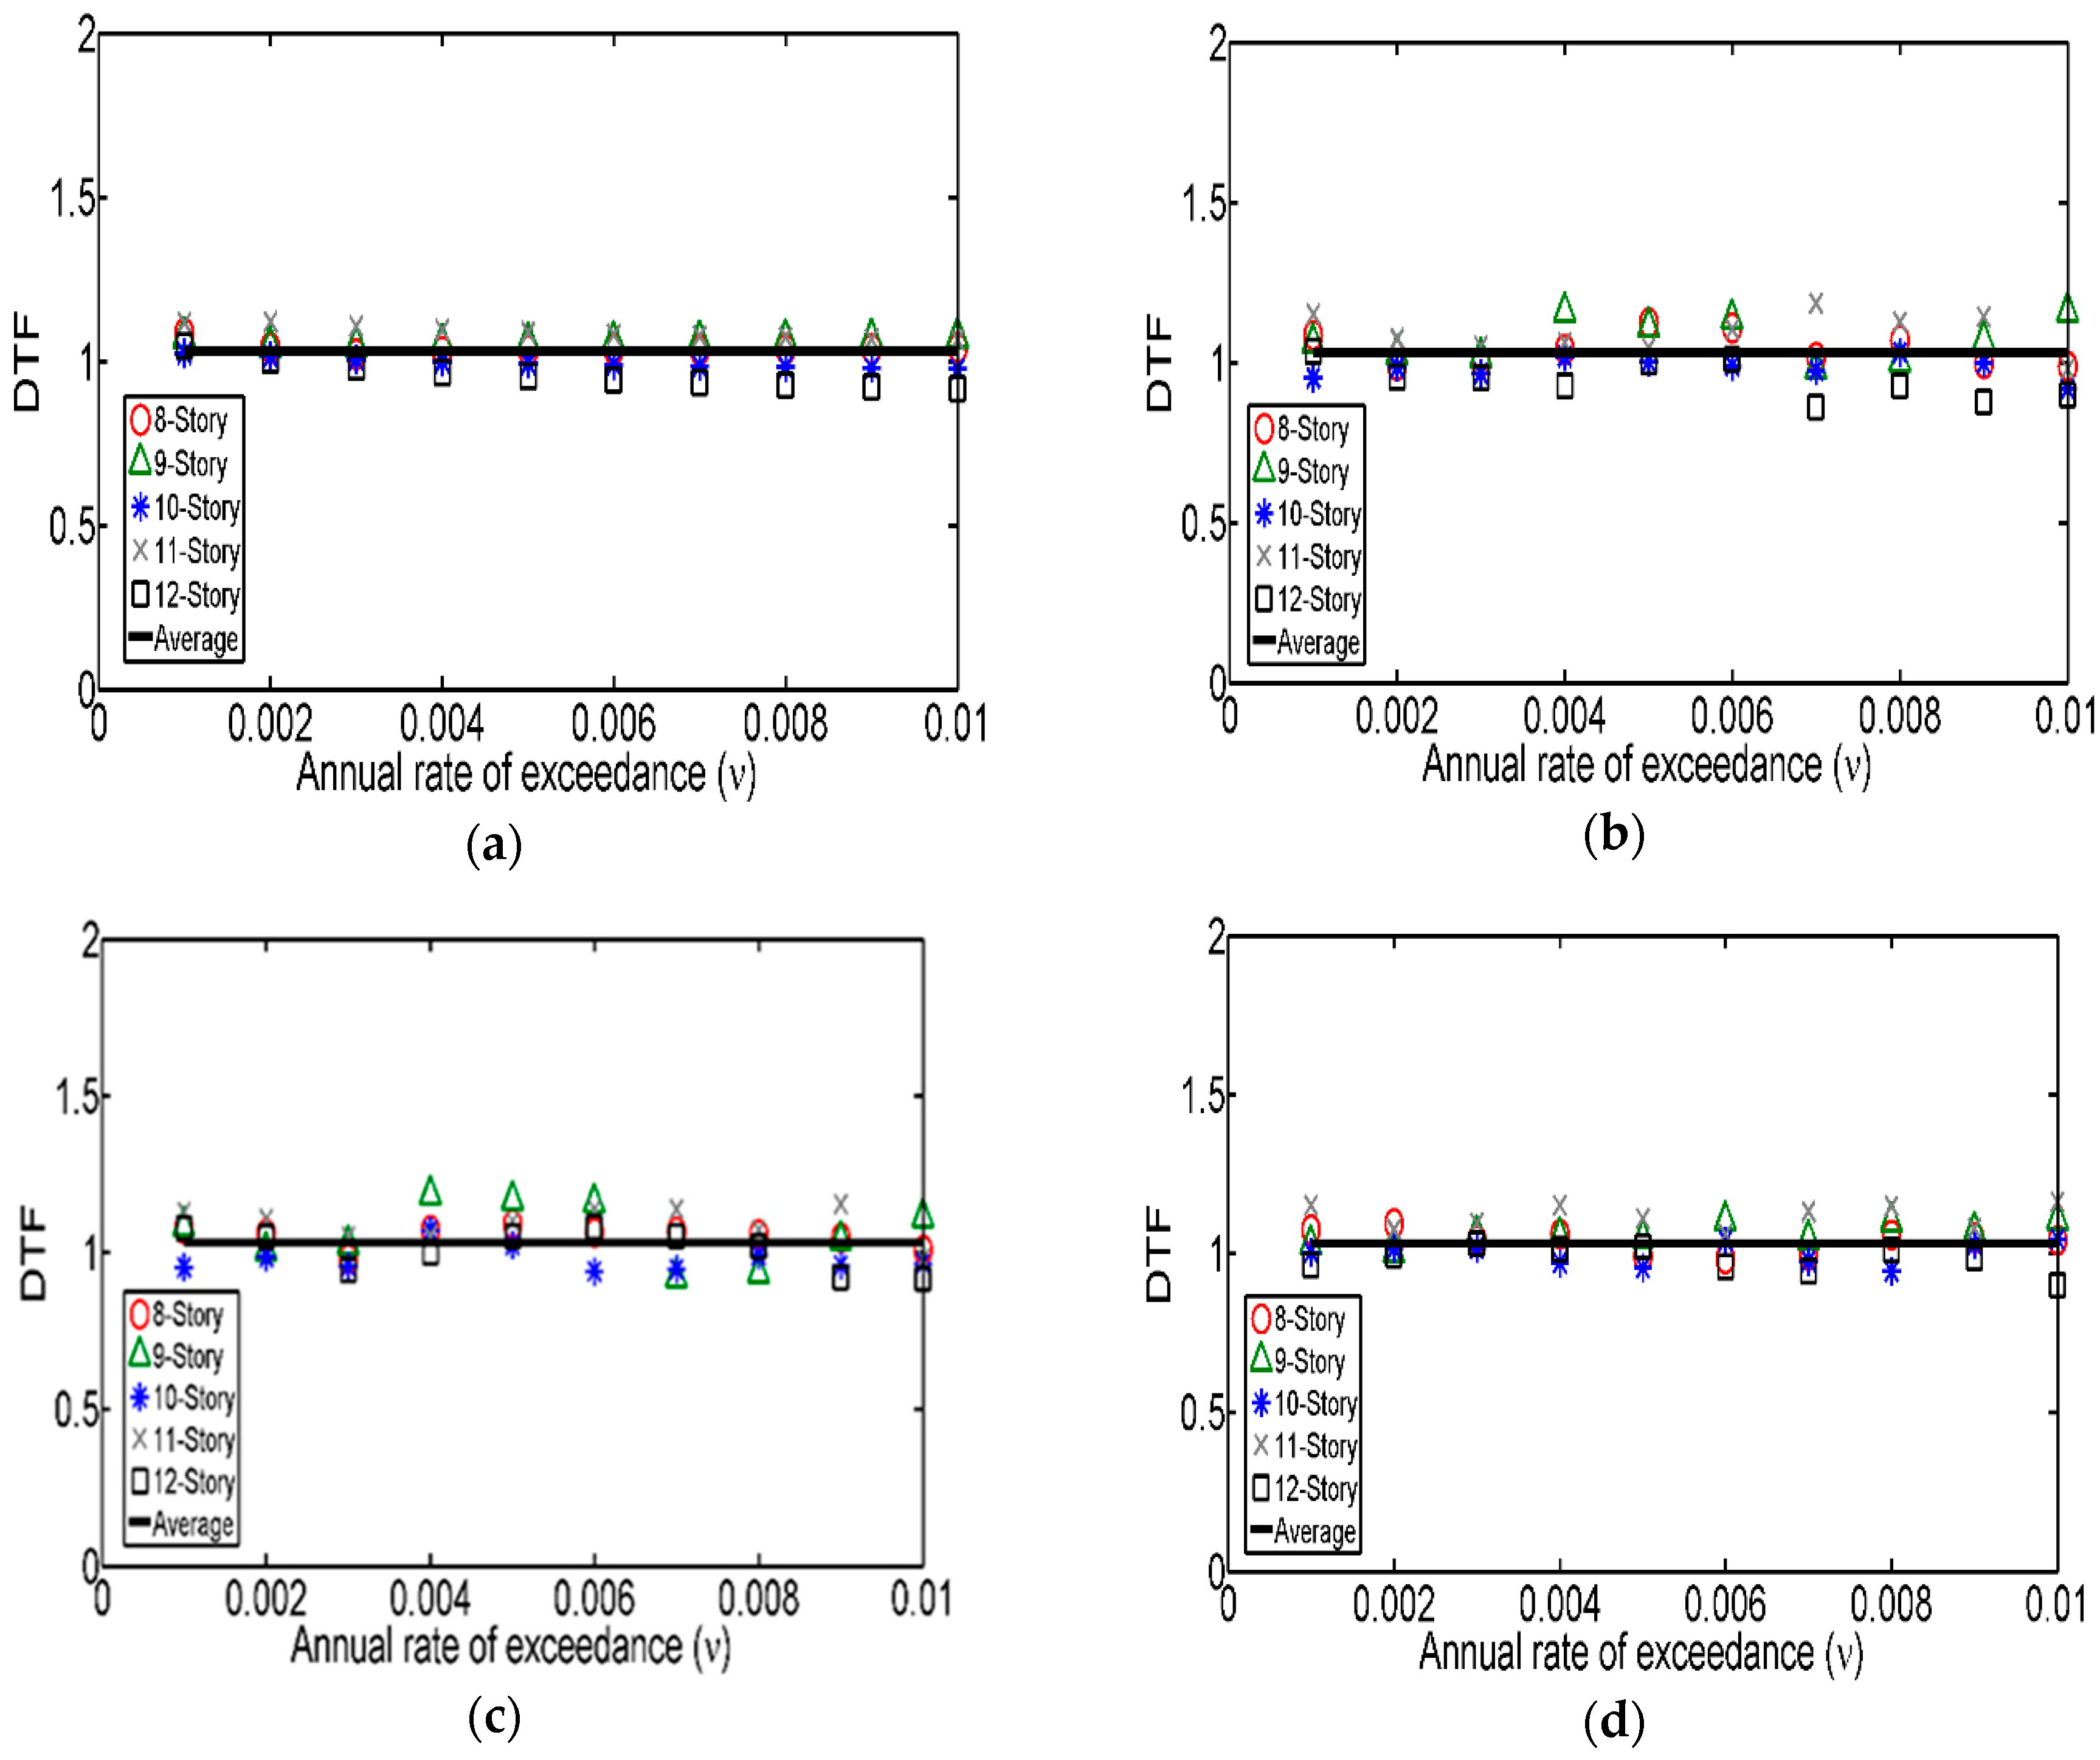
Figure 12 shows the DTF estimated for the five reinforced concrete buildings of interest (see Table 3) and their corresponding equivalent SS, corresponding to different values of asymmetric yielding (α). It can be observed that the DTF estimated for the five buildings are very close to unity. In addition, it is shown that the DTF do not present any trend regarding the annual rate of exceedance, the level of asymmetric yielding, nor the number of stories of the buildings.
The results were fitted to a linear function, and it is observed that the expected ductility demand of the SS is, on an average basis, only 4% higher than that of MDOF systems, for any value of the annual rate of exceedance. These results indicate that the use of simplified structural systems for the calculation of strength amplification factors for MDOF structures with asymmetric yielding is slightly conservative. Thus, the expressions proposed in Equations (6) and (7) may be considered as appropriated.
7. Conclusions
A reliability-based methodology to estimate the additional strength requirement for structures exhibiting asymmetric yielding caused by different reasons was proposed and properly applied. Simplified mathematical expressions to estimate strength amplification factors were obtained for different soil conditions, and the methodology was applied to the valley of Mexico; however, the proposed steps can be applied to structural systems located in other seismic regions. The objective of amplifying the lateral strength of structures with asymmetric yielding with the expressions proposed in this study is that they achieve a seismic performance, in terms of the expected ductility demand, equivalent to that of their symmetric yielding counterparts; that is, they have similar reliability levels. The resulting expressions were compared with that recommended in the current Mexico City Building Code (MCBC-2004) and their advantages and disadvantages were discussed. The main conclusions of this study are listed as follows:
- Results indicate that the additional lateral strength requirement of structures with asymmetric yielding is higher for those with fundamental vibration periods close to the dominant period of the soil where they are located; this requirement is even higher for structures located on soft soils.
- Simplified mathematical expressions were proposed for the estimation of strength amplification factors for structures with asymmetric yielding, considering different soil conditions. The expressions correspond to the valley of Mexico and depend on factors such as the ductility of the structure, the level of asymmetric yielding, and the ratio between the fundamental vibration period of the structure and that of the dominant period of the soil.
- The proposed mathematical expressions are more conservative than that recommended in the current Mexico City Building Code (MCBC-2004) for intermediate and soft soils, especially for structures whose vibration period is close to the dominant period of the soil where they are located. Although the expression proposed in the MCBC-2004 leads to conservative results for firm ground, results indicate that the effect of asymmetric yielding is much more detrimental on intermediate and soft soils than on firm ground. The expressions developed in this study have been approved by the Technical Committee for Seismic Design of the MCBC, and will be incorporated in the new version of the Mexico City Building Code.
- It was verified that the value of the expected ductility demand of asymmetric yielding MDOF systems, associated with a given return period, is almost equal to that corresponding to their equivalent simplified systems. The implication of this is that the use of simplified structural systems to estimate strength amplification factors for MDOF structures with asymmetric yielding is appropriate.
Acknowledgments
The authors thank the three anonymous reviewers whose comments improved the quality of this work. The valuable comments made by L. Esteva, A. Teran-Gilmore and J. L. Camba are greatly appreciated, as well as the support given by UNAM (under project PAPIIT-IN103517) and by Instituto para la Seguridad de las Construcciones en el Distrito Federal. The first author acknowledges the scholarship given by Consejo Nacional de Ciencia y Tecnología (CONACyT) for his Ph.D. studies. The seismic records used were obtained from the database of the Institute of Engineering, UNAM.
Author Contributions
Alfredo Reyes-Salazar and J. Ramón Gaxiola-Camacho performed the nonlinear time history analyses of the structural models and estimated the ductility transformation factors for actual MDOF structural systems; Federico Valenzuela-Beltrán and Sonia E. Ruiz performed the reliability analysis, fitted the mathematical expressions to the data and wrote the paper.
Conflicts of Interest
The authors declare no conflict of interest.
References
- Ellingwood, B.; MacGregor, J.G.; Galambos, T.V.; Cornell, C.A. Probability Based Load Criteria: Load Factors and Load Combinations. ASCE J. Struct. Div. 1982, 108, 978–997. [Google Scholar]
- Rosenblueth, E.; Esteva, L. Reliability basis for some Mexican codes. ACI Publ. SP-31 1972, 31, 1–41. [Google Scholar]
- Mexico City Building Code (MCBC). Complementary Technical Norms for Earthquake Resistant Design; MCBC: Mexico City, Mexico, 2004. [Google Scholar]
- National Research Council of Canada. National Building Code of Canada (NBCC); National Research Council of Canada: Ottawa, ON, Canada, 2005.
- FEMA. Next-Generation Performance-Based Seismic Design Guidelines, Prepared by the Applied Technology Council for the Federal Emergency Management Agency; Report No. FEMA 445; FEMA: Washington, DC, USA, 2006.
- FEMA. Next-Generation Methodology for Seismic Performance Assessment of Buildings, Prepared by the Applied Technology Council for the Federal Emergency Management Agency; Report No. FEMA P-58; FEMA: Washington, DC, USA, 2012.
- Rosenblueth, E. Seismic design requirements in a Mexican 1976 code. Earthq. Eng. Struct. Dyn. 1979, 7, 49–61. [Google Scholar] [CrossRef]
- Zhai, C.; Xie, L. The modification of strength reduction factors for MDOF effect. Adv. Struct. Eng. 2006, 9, 477–490. [Google Scholar] [CrossRef]
- Ruiz-García, J.; Miranda, E. Probabilistic estimation of maximum inelastic displacement demands for performance-based design. Earthq. Eng. Struct. Dyn. 2007, 36, 1235–1254. [Google Scholar] [CrossRef]
- Newmark, N.M.; Hall, W.J. Earthquake Spectra and Design; EERI Monograph Series; Earthquake Engineering: Oakland, CA, USA, 1982. [Google Scholar]
- Wu, J.P.; Hanson, R.D. Inelastic response spectra with high damping. J. Struct. Div. (ASCE) 1989, 115, 1412–1431. [Google Scholar] [CrossRef]
- Ramirez, O.M.; Constantinou, M.C.; Kircher, C.A.; Whittaker, A.S.; Johnson, M.W.; Gomez, J.D.; Chrysostomou, C.Z. Development and Evaluation of Simplified Procedures for Analysis and Design of Buildings with Passive Energy Dissipation Systems; Report No. MCEER-00-0010; Multidisciplinary Center for Earthquake Engineering Research (MCEER): New York, NY, USA, 2000. [Google Scholar]
- Arroyo-Espinoza, D.; Terán-Gilmore, A. Strength reduction factors for ductile structures with passive energy dissipating devices. J. Earthq. Eng. 2003, 7, 297–325. [Google Scholar] [CrossRef]
- Cameron, W.; Green, R. Damping correction factors for horizontal ground-motion response spectra. Bull. Seismol. Soc. Am. 2007, 97, 934–960. [Google Scholar] [CrossRef]
- Castillo, T.; Ruiz, S.E. Reduction factors for seismic design spectra for structures with viscous energy dampers. J. Earthq. Eng. 2014, 18, 323–349. [Google Scholar] [CrossRef]
- Ruiz, S.E.; Rosenblueth, E.; Diederich, R. The Mexico Earthquake of September 19, 1985—Seismic response of asymmetrically yielding structures. Earthq. Spectra 1989, 5, 103–111. [Google Scholar] [CrossRef]
- Ruiz, S.E. Influence of intensity of motion on the seismic response of structures with asymmetric force-deformation curves. Earthq. Eng. Struct. Dyn. 1991, 20, 1–9. [Google Scholar] [CrossRef]
- Terán-Gilmore, A.; Juarez, H.; Frausto, M. On the dynamic response of regular structures exhibiting tilt. Earthq. Eng. Struct. Dyn. 2000, 29, 1343–1374. [Google Scholar] [CrossRef]
- Moon, K.S. Comparative evaluation of structural systems for tilted tall buildings. Int. J. High-Rise Build. 2014, 3, 89–98. [Google Scholar]
- Carpinteri, A.; Invernizzi, S.; Lacidogna, G. In situ damage assessment and nonlinear modelling of an historical masonry tower. Eng. Struct. 2005, 27, 387–395. [Google Scholar] [CrossRef]
- Terán-Gilmore, A.; Arroyo-Espinoza, D. Planteamiento de factores de amplificación de resistencia para estructuras con asimetría en fluencia (Approach about resistance amplification factors for structures with asymmetric yielding). Revista de Ingeniería Sísmica 2005, 72, 81–106. [Google Scholar]
- Valenzuela-Beltrán, F.; Ruiz, S.E.; Reyes-Salazar, A.; Bojórquez, E. Reliability-based strength amplification factors for structures with asymmetric yielding. J. Earthq. Eng. 2016. [Google Scholar] [CrossRef]
- Avilés, J.; Pérez-Rocha, L.E. Regional subsidence of Mexico City and its effects on seismic response. Soil Dyn. Earthq. Eng. 2010, 30, 981–989. [Google Scholar] [CrossRef]
- Rosenblueth, E. Code specification of safety and serviceability. Conference Preprints Reports. In Proceedings of the International Conference on Planning and Design of Tall Buildings, Bethlehem, PA, USA, 21–26 August 1972; pp. 23–51. [Google Scholar]
- Cornell, C.A. A probability-based structural code. ACI J. 1969, 66, 974–985. [Google Scholar]
- Hao, G.; Liang, X.; Zhang, S. The new approximate calculation method for the first order reliability. Appl. Math. 2013, 4, 505–509. [Google Scholar] [CrossRef]
- Gaxiola-Camacho, J.R.; Azizsoltani, H.; Villegas-Mercado, F.J.; Haldar, A. A novel reliability technique for implementation of Performance-Based Seismic Design of structures. Eng. Struct. 2017, 142, 137–147. [Google Scholar] [CrossRef]
- Galambos, T.V.; Ravindra, M.K. Tentative Load and Resistance Factor Design Criteria for Steel Buildings; Research Report 18; Structural Division, Washington University: St. Louis, MO, USA, 1973. [Google Scholar]
- Basha, B.; Babu, G.L. Reliability-based load and resistance factor design approach for external seismic stability of reinforced soil walls. Soil Dyn. Earthq. Eng. 2014, 60, 8–21. [Google Scholar] [CrossRef]
- Cornell, C.A.; Jalayer, F.; Hamburger, R.O.; Foutch, D.A. The probabilistic basis for the 2000 SAC/FEMA steel moment frame guidelines. J. Struct. Eng. 2000, 128, 526–533. [Google Scholar] [CrossRef]
- Montiel, M.A.; Ruiz, S.E. Influence of structural capacity uncertainty on seismic reliability of building structures under narrow-band motions. Earthq. Eng. Struct. Dyn. 2007, 36, 1915–1934. [Google Scholar] [CrossRef]
- Baker, J.; Gupta, A. Bayesian treatment of induced seismicity in probabilistic seismic hazard analysis. Bull. Seismol. Soc. Am. 2016, 106, 860–870. [Google Scholar] [CrossRef]
- Bradley, B.; Burks, L.; Baker, J. Ground motion selection for simulation-based seismic hazard and structural reliability assessment. Earthq. Eng. Struct. Dyn. 2015, 44, 2321–2340. [Google Scholar] [CrossRef]
- Sfahani, M.G.; Guan, H.; Loo, Y. Seismic reliability and risk assessment of structures based on fragility analysis—A review. Adv. Struct. Eng. 2015, 18, 1653–1669. [Google Scholar] [CrossRef]
- Frangopol, D.M. Structural optimization using reliability concepts. J. Struct. Eng. 1985, 111, 2288–2301. [Google Scholar] [CrossRef]
- Esteva, L. Design general. In Design of Earthquake Resistant Structures; Rosenblueth, E., Ed.; Pentech Press: London, UK, 1980; Chapter 3. [Google Scholar]
- Kang, Z.; Luo, Y. Reliability-based structural optimization with probability and convex set hybrid models. Struct. Multidiscip. Optim. 2010, 42, 89–102. [Google Scholar] [CrossRef]
- Miller, M.; Baker, J. Ground-motion intensity and damage map selection for probabilistic infrastructure network risk assessment using optimization. Earthq. Eng. Struct. Dyn. 2015, 44, 1139–1156. [Google Scholar] [CrossRef]
- Cornell, C.A. Engineering seismic risk analysis. Bull. Seismol. Soc. Am. 1968, 58, 1583–1606. [Google Scholar]
- Esteva, L. Bases para la Formulación de Decisiones de Diseño Sísmico (Basis for the Formulation of Seismic Design Decisions. Ph.D. Thesis, Facultad de Ingeniería, Universidad Nacional Autónoma de México, Mexico City, Mexico, 1968. [Google Scholar]
- Cornell, C.A.; Krawinkler, H. Progress and challenges in seismic performance assessment. PEER Center News 2000, 3, 1–3. [Google Scholar]
- Shome, N.; Cornell, C.A. Probabilistic Seismic Demand Analysis of Nonlinear Structures; Report No. RMS-35; Department of Civil and Environmental Engineering, Stanford University: Stanford, CA, USA, 1999. [Google Scholar]
- Baker, J.W.; Cornell, C.A. Spectral shape, epsilon and record selection. Earthq. Eng. Struct. Dyn. 2006, 35, 1077–1095. [Google Scholar] [CrossRef]
- Jalayer, F.; Beck, J.L.; Porter, K.A. Effects of ground motion uncertainty on predicting the response of an existing RC frame structure. In Proceedings of the 13th World Conference on Earthquake Engineering, Vancouver, BC, Canada, 1–6 August 2004. [Google Scholar]
- Bojórquez, E.; Iervolino, I.; Reyes-Salazar, A.; Ruiz, S.E. Comparing vector-valued intensity measures for fragility analysis of steel frames for the case of narrow-band ground motions. Eng. Struct. 2012, 45, 472–480. [Google Scholar] [CrossRef]
- Brown, P.C.; Lowes, L.N. Fragility Functions for Modern Reinforced-Concrete Beam-Column Joints. Earthq. Spectra 2007, 23, 263–289. [Google Scholar] [CrossRef]
- Park, Y.J.; Ang, A.H. Mechanistic seismic damage model for reinforced concrete. J. Struct. Eng. 1985, 111, 740–757. [Google Scholar] [CrossRef]
- Bojórquez, J.; Ruiz, S.E.; Bojórquez, E.; Reyes-Salazar, A. Probabilistic seismic response transformation factors between SDOF and MDOF systems using Artificial Neural Networks. J. Vibroeng. 2016, 18, 2248–2262. [Google Scholar] [CrossRef]
- Bojórquez, E.; Bojórquez, J.; Ruiz, S.E.; Reyes-Salazar, A.; Velázquez-Dimas, J. Response transformation factors for deterministic-based and reliability-based seismic design. Struct. Eng. Mech. 2013, 46, 755–773. [Google Scholar] [CrossRef]
- Computers and Structures Inc.; ETABS. Analysis and Design of Buildings Software; Computers and Structures Inc.: Berkeley, CA, USA, 2016. [Google Scholar]
- Uniform Building Code. Structural Engineering Design Provisions Vol. 2. In Proceedings of the International Conference of Building Officials, Whittier, CA, USA, May 1994; Available online: http://digitalassets.lib.berkeley.edu/ubc/UBC_1994_v1.pdf (accessed on 22 August 2017).
- Carr, A.J. 3D RUAUMOKO: Inelastic Three-Dimensional Dynamic Analysis Program; Department of Civil Engineering, University of Canterbury: Christchurch, New Zealand, 2007. [Google Scholar]
Figure 1.
Some examples of structures with asymmetric yielding: (a) asymmetry in vertical loads; (b) structures with sloping facades; (c) tilting.
Figure 1.
Some examples of structures with asymmetric yielding: (a) asymmetry in vertical loads; (b) structures with sloping facades; (c) tilting.
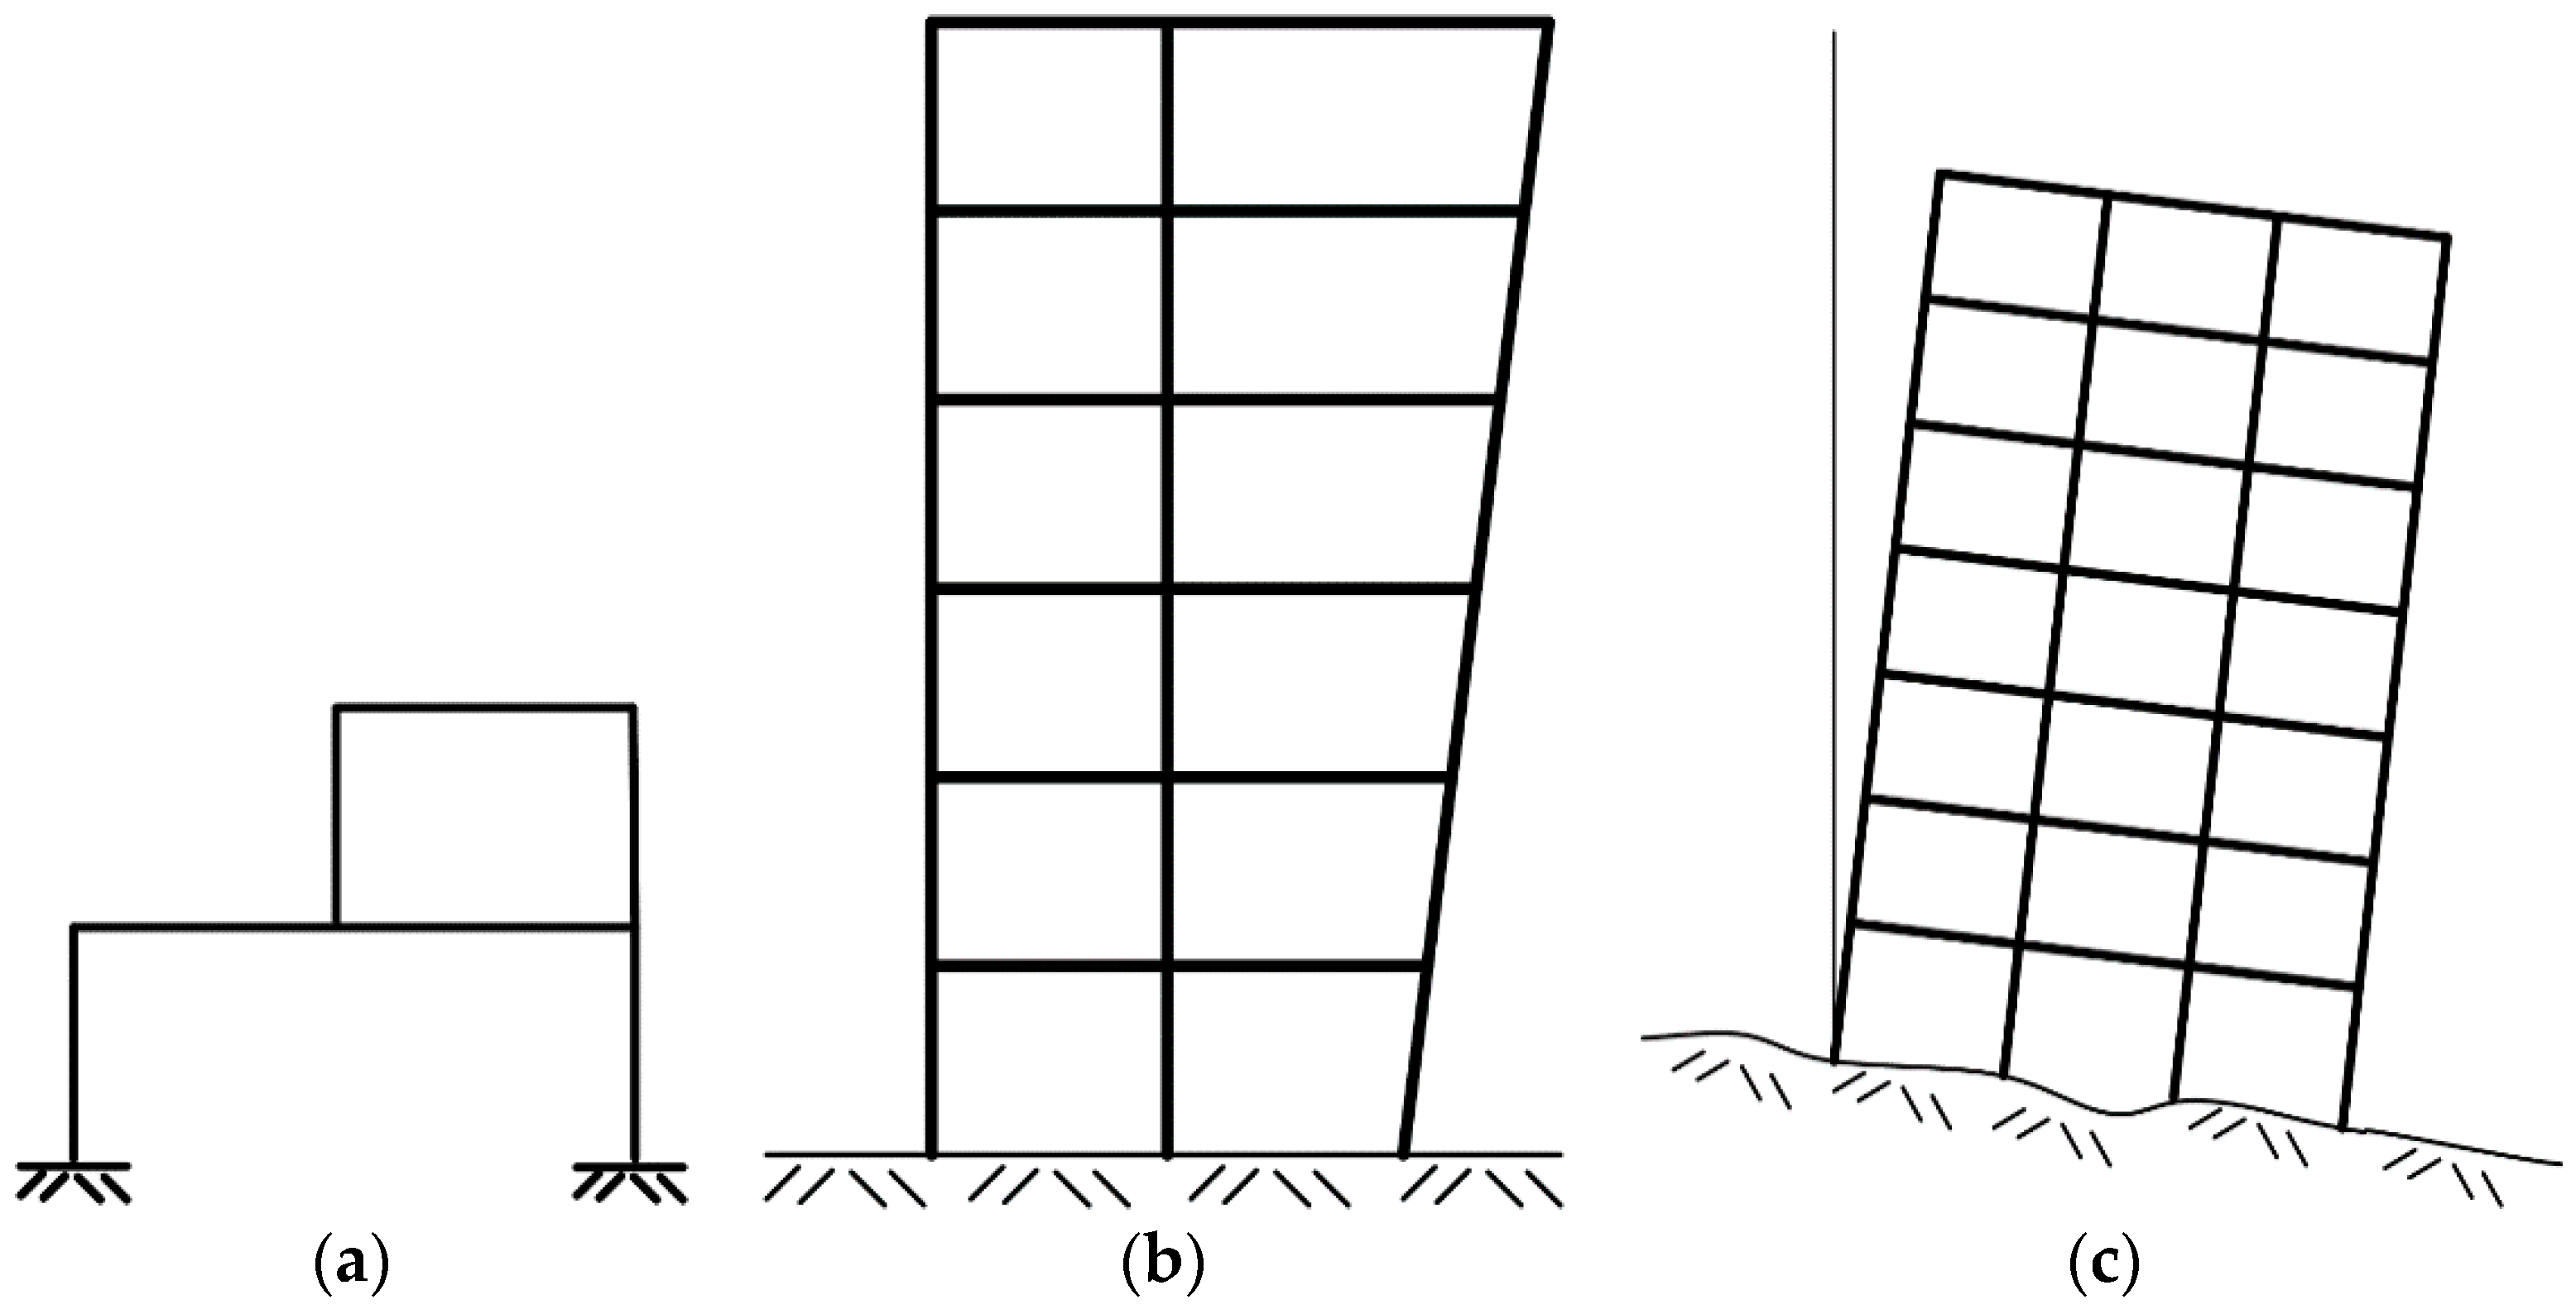
Figure 2.
Curves of the dominant soil periods in the valley of Mexico.

Figure 3.
Example of reinforced concrete tilted buildings located in the highlighted area of Figure 2.
Figure 3.
Example of reinforced concrete tilted buildings located in the highlighted area of Figure 2.
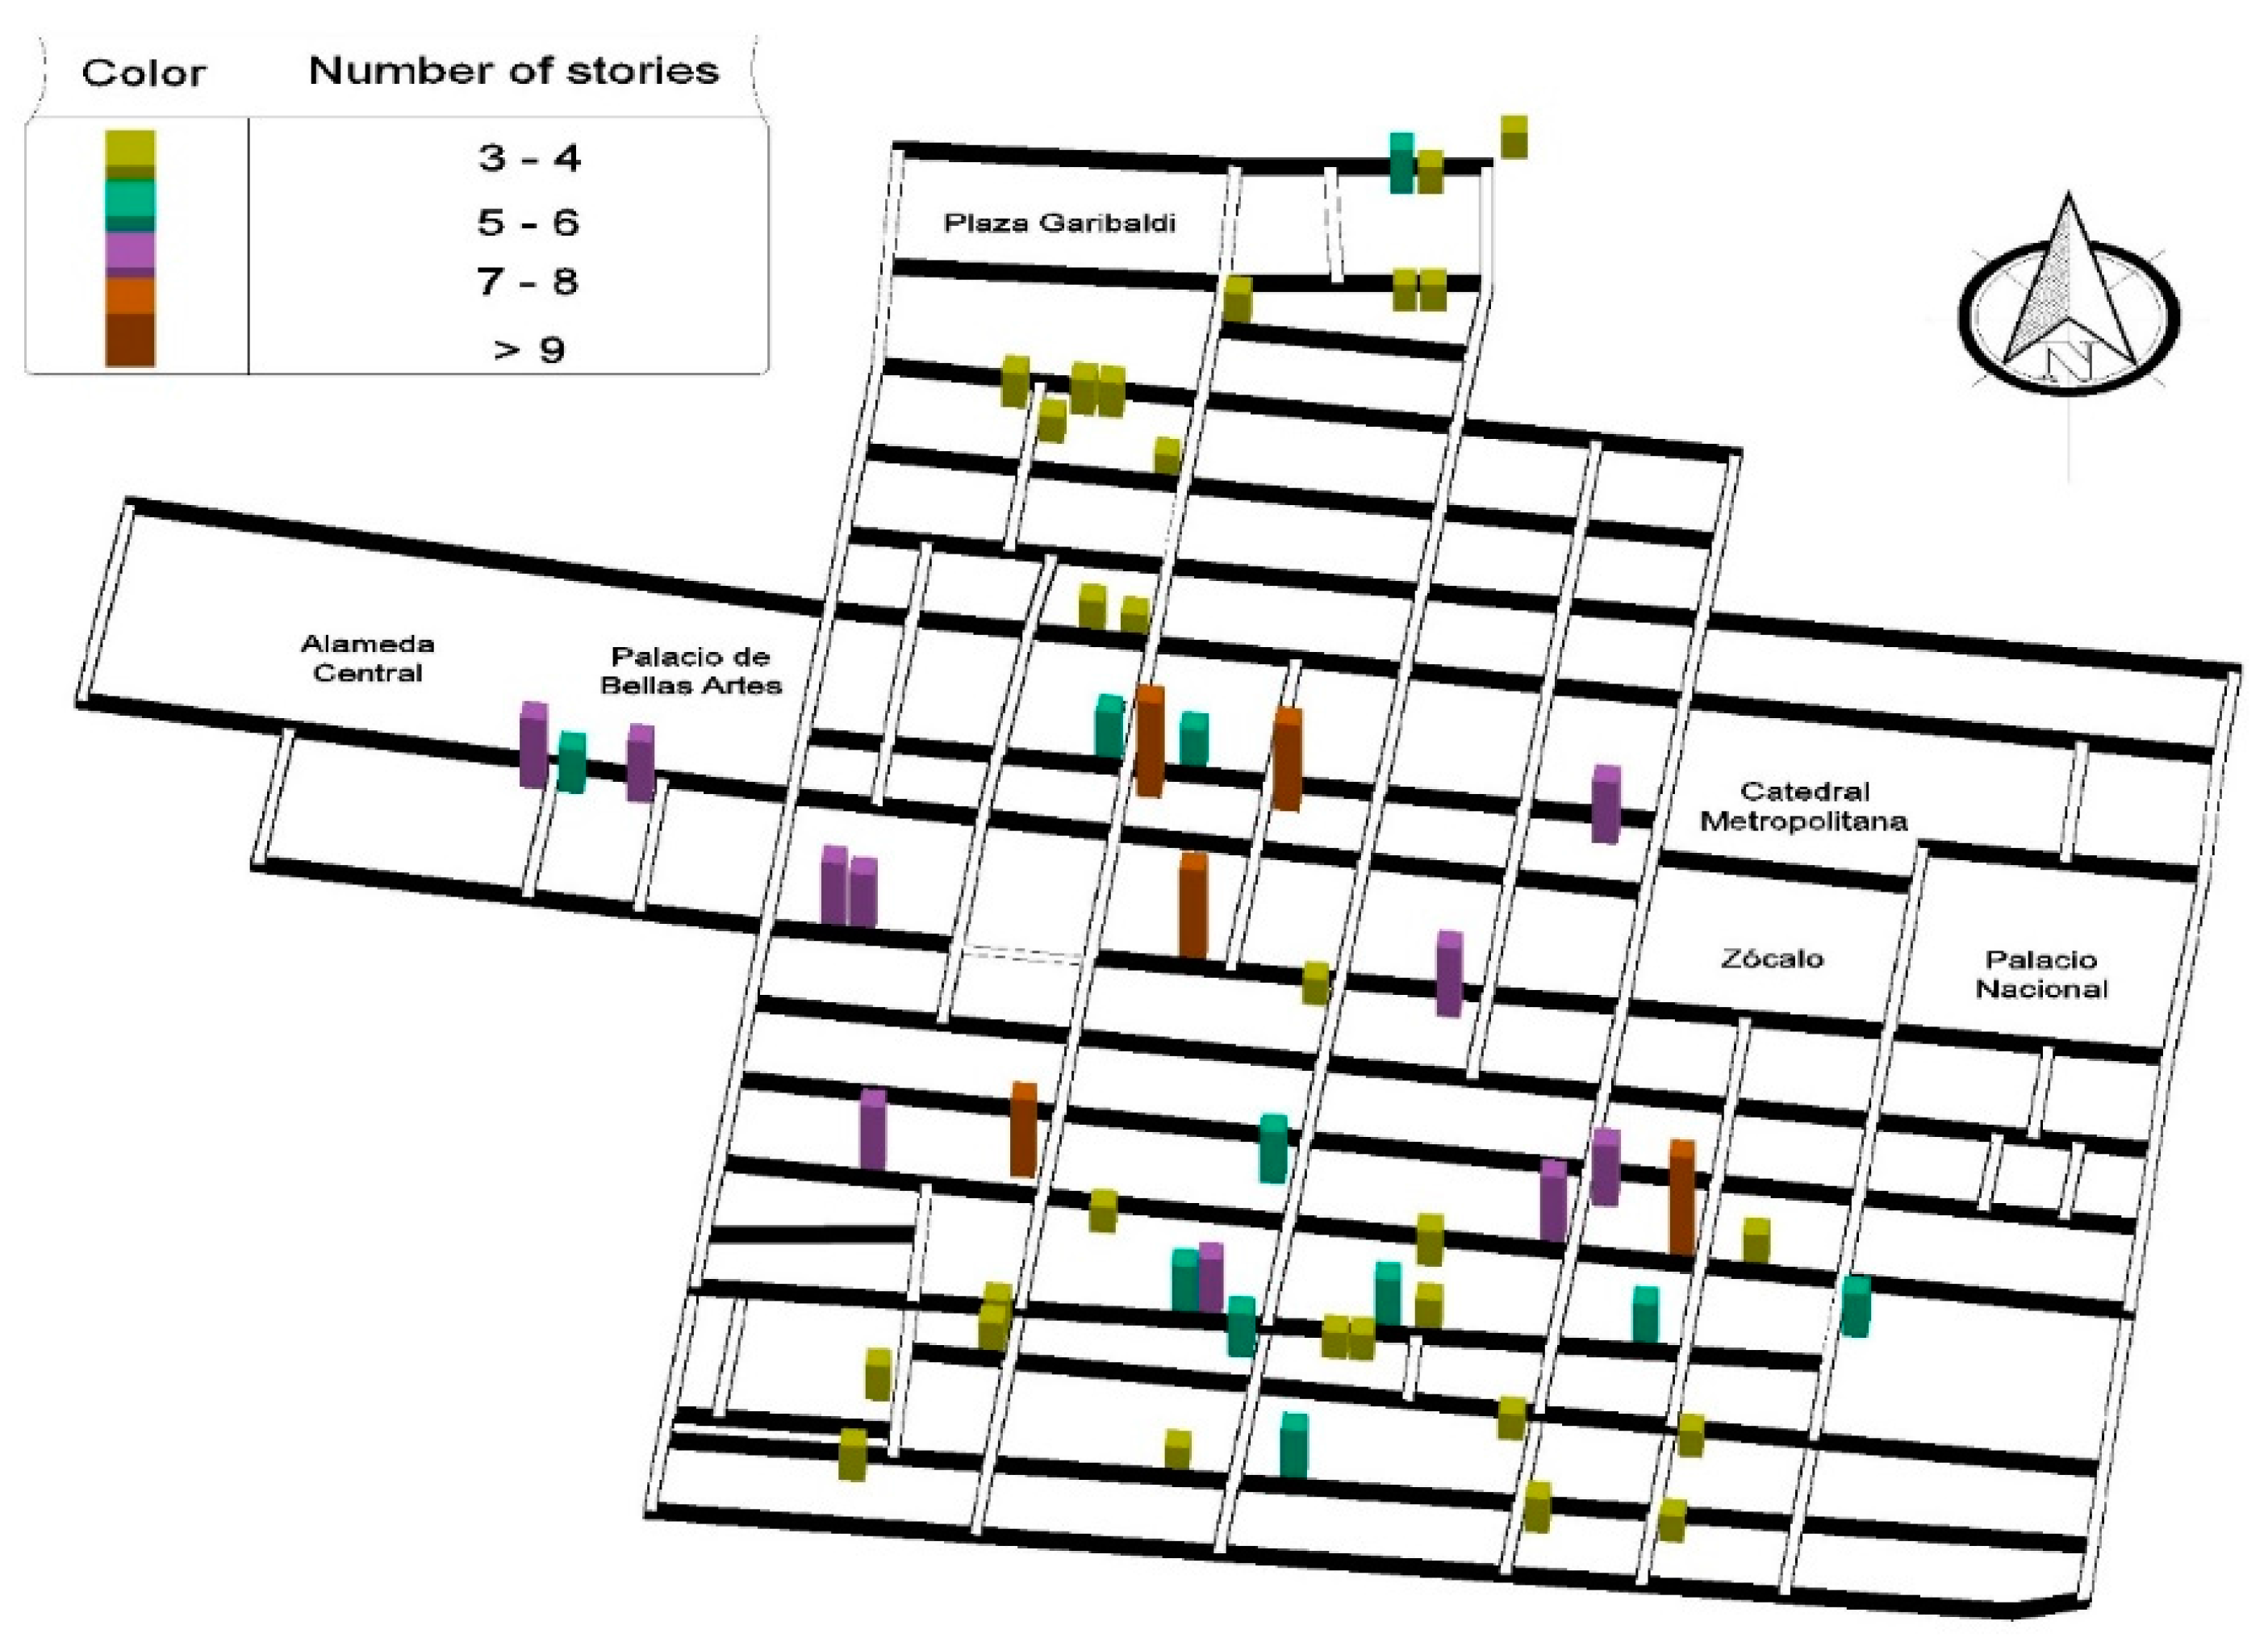
Figure 4.
(a) plan and elevation, and (b) definition of the parameter α of the simplified structural systems used in this study.
Figure 4.
(a) plan and elevation, and (b) definition of the parameter α of the simplified structural systems used in this study.
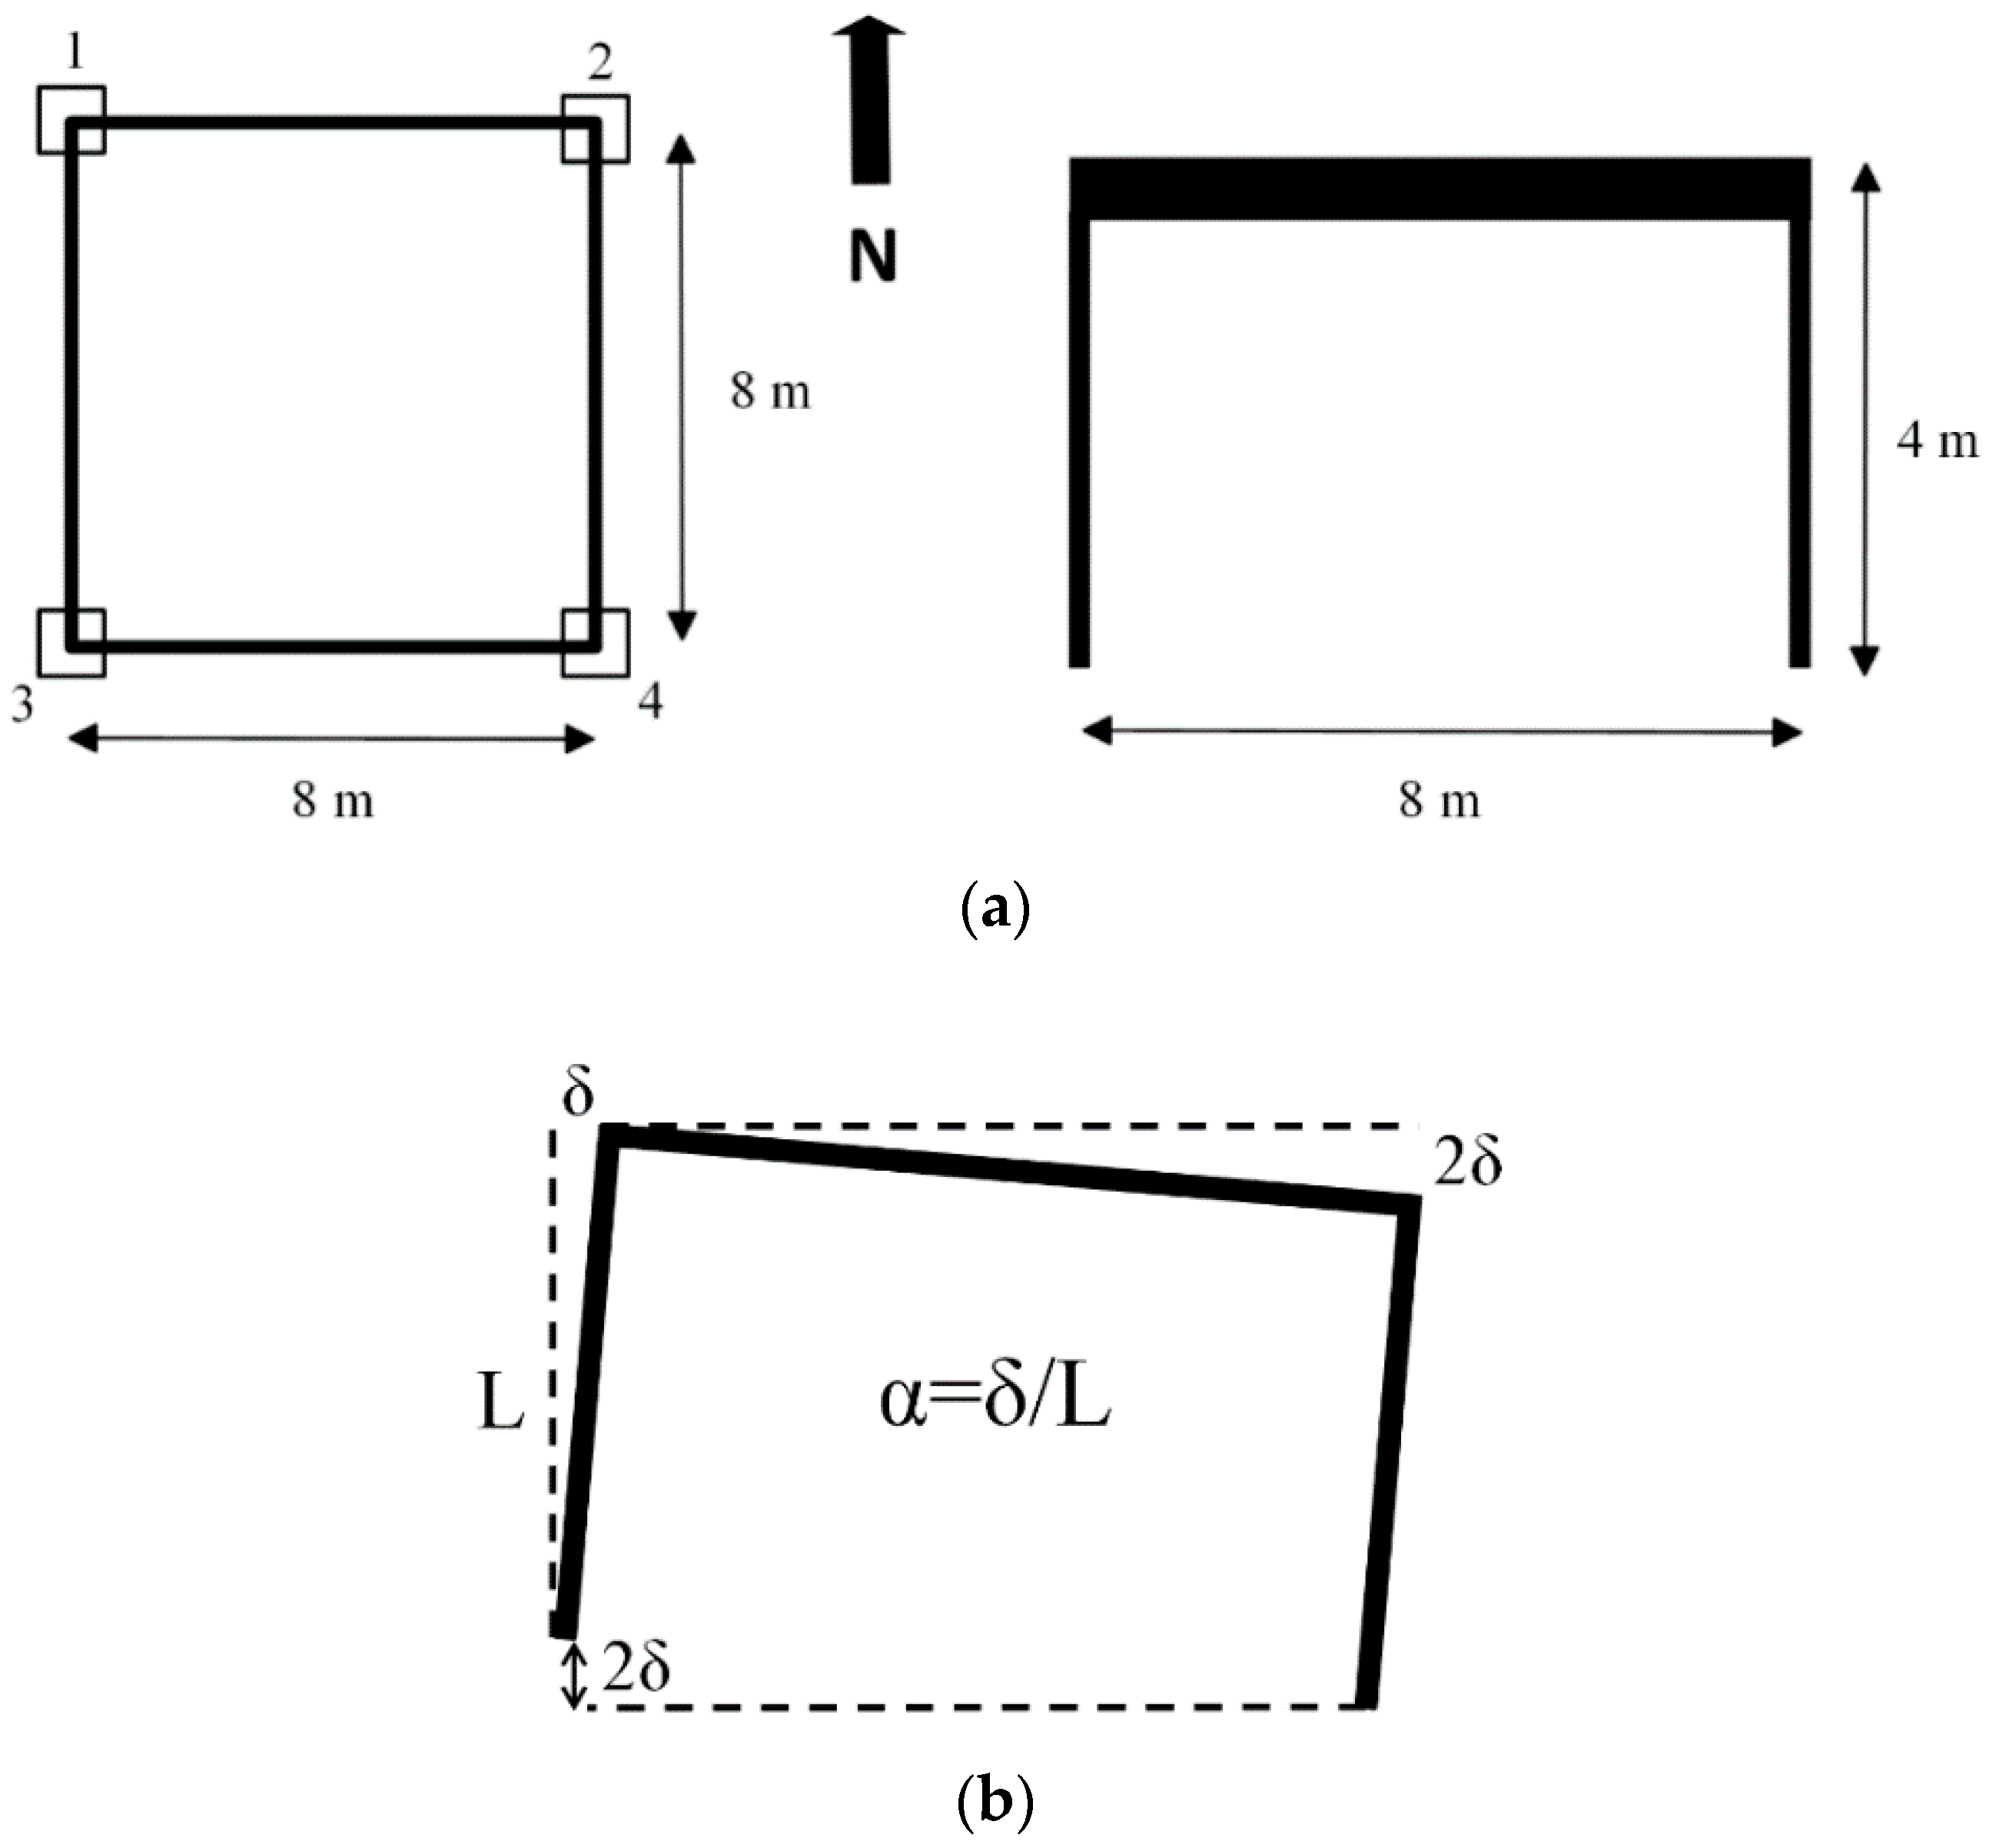
Figure 5.
Single degree of freedom (SDOF) system without tilting and with asymmetric yielding.

Figure 6.
Pseudo-acceleration response spectra for 5% of critical damping, corresponding to the seismic records selected in (a) Zone A, (b) Zone B, (c) Zone C, (d) Zone D, (e) Zone E, (f) Zone F and (g) Zone G of the valley of Mexico considered in this study (E-W Component).
Figure 6.
Pseudo-acceleration response spectra for 5% of critical damping, corresponding to the seismic records selected in (a) Zone A, (b) Zone B, (c) Zone C, (d) Zone D, (e) Zone E, (f) Zone F and (g) Zone G of the valley of Mexico considered in this study (E-W Component).

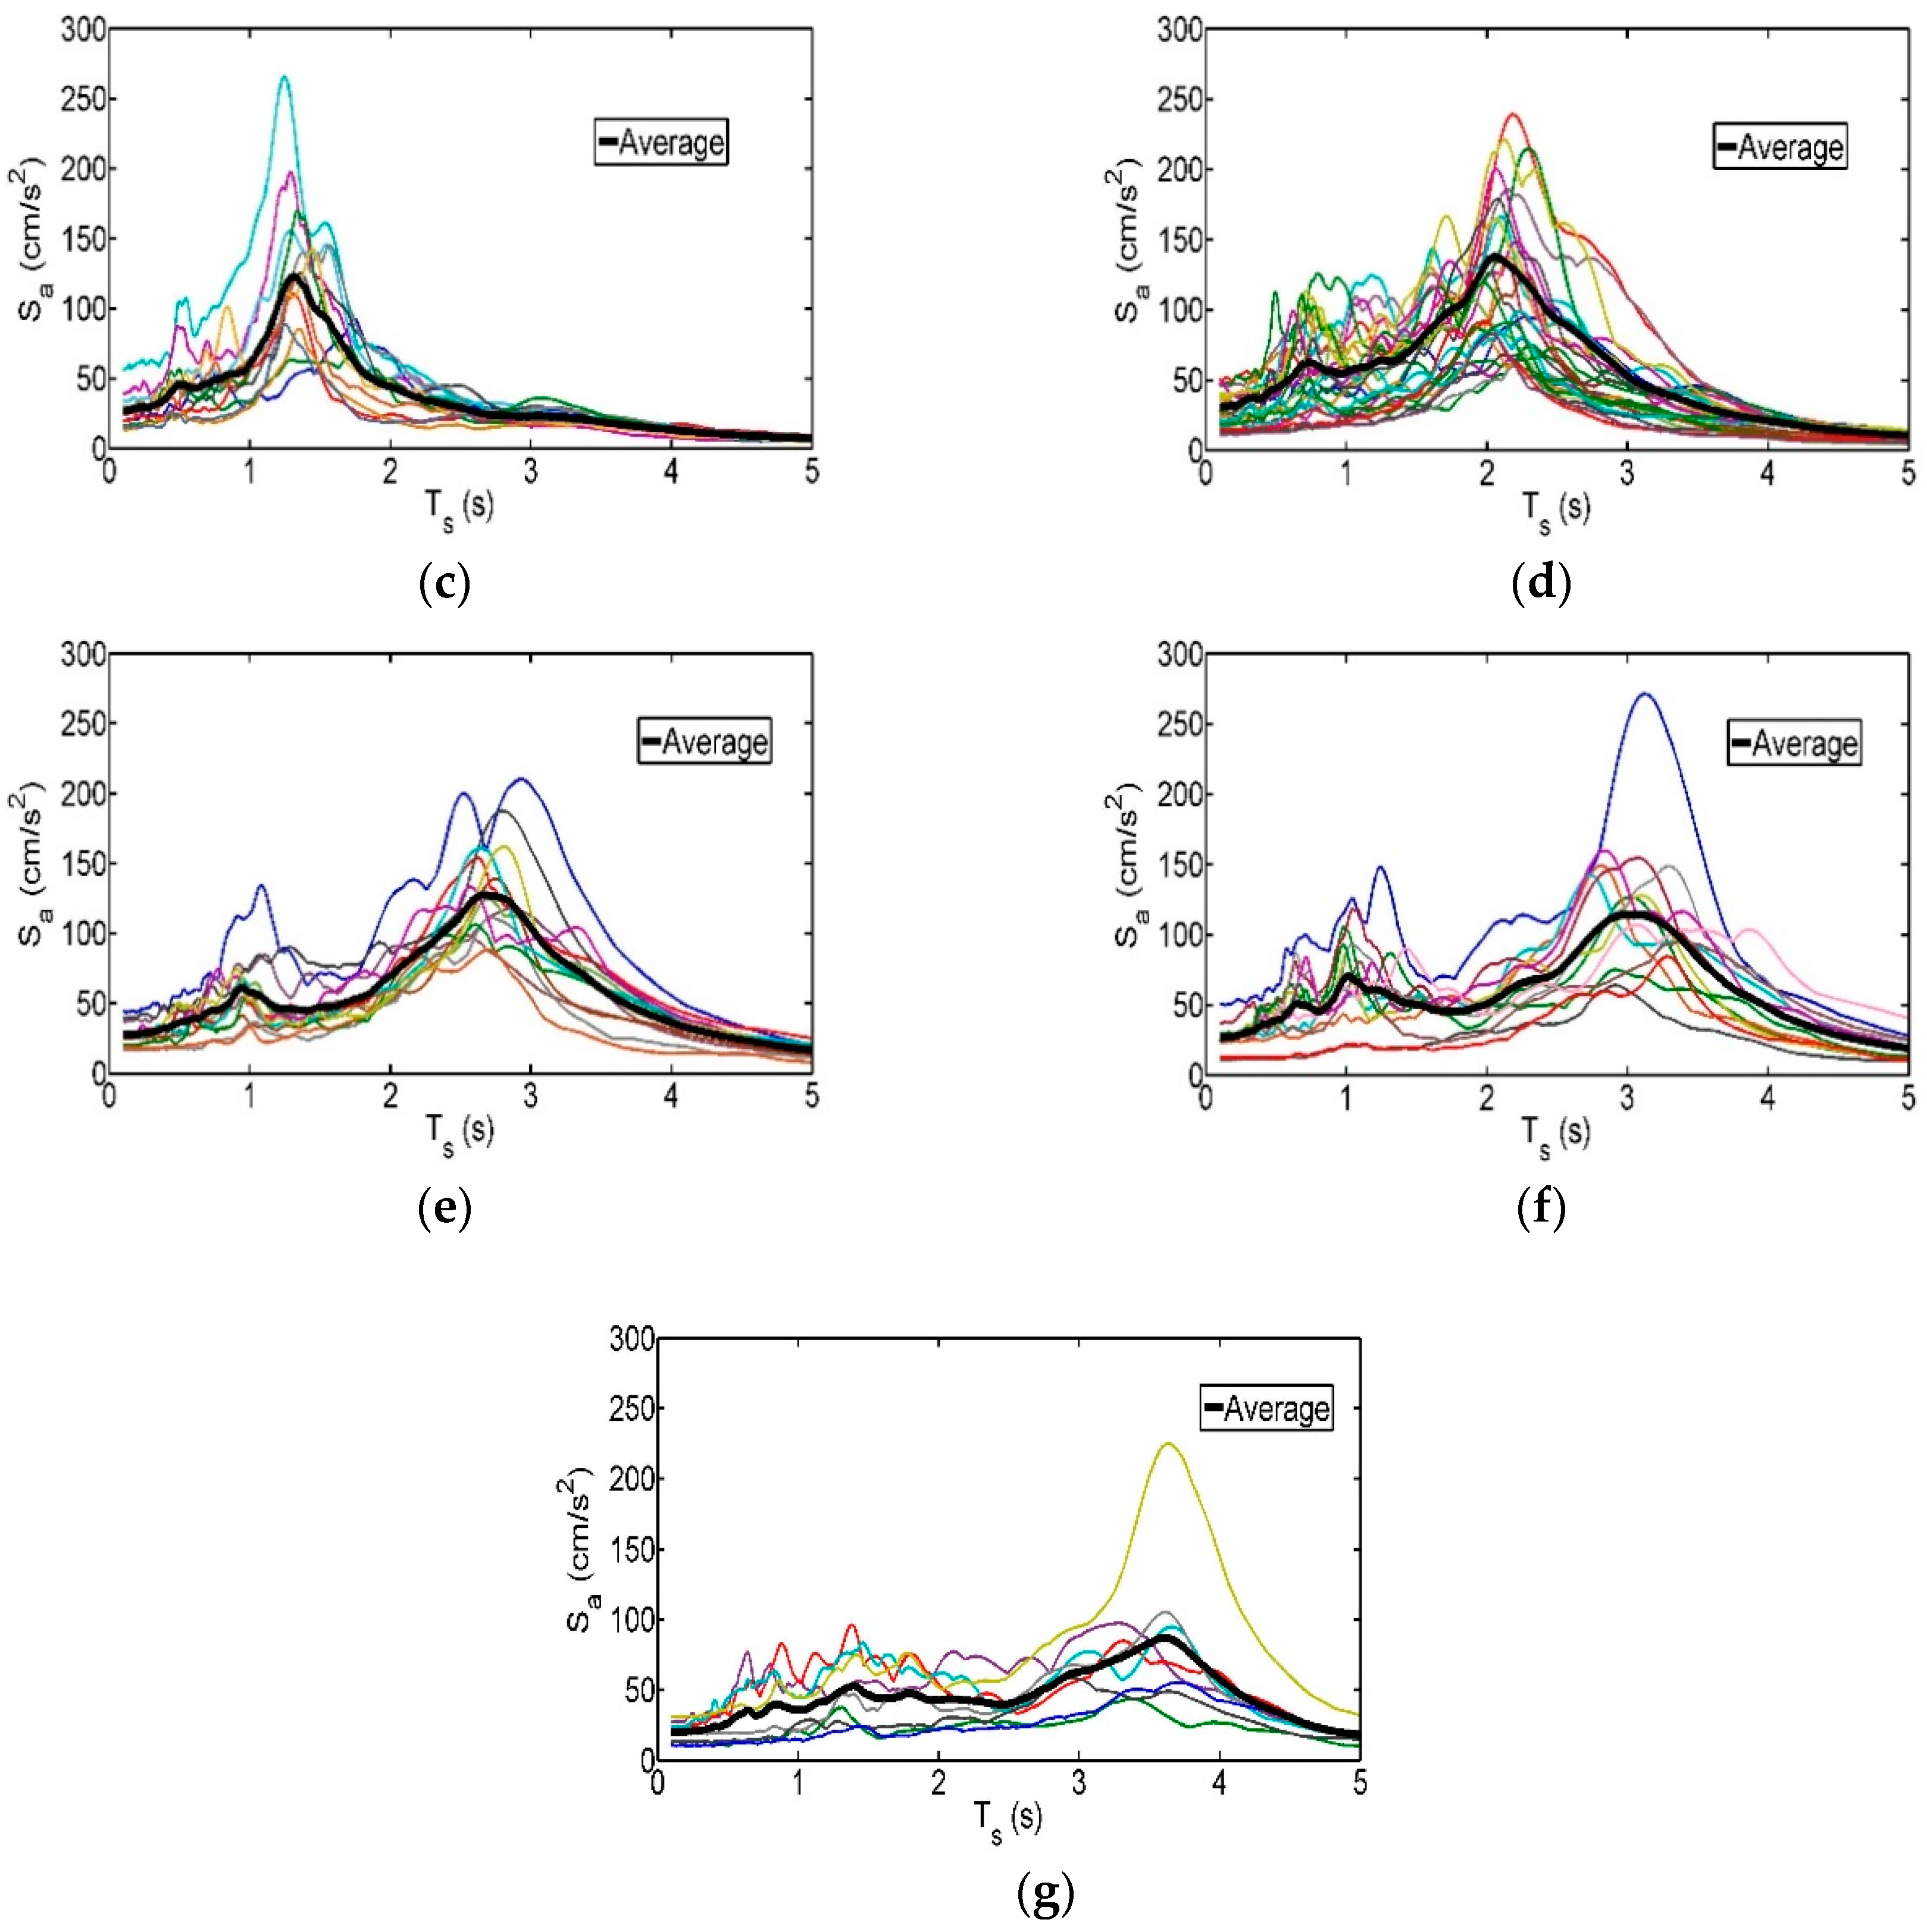
Figure 7.
Parameter RBSCS corresponding to (a) Zone A; (b) Zone B; (c) Zone C; (d) Zone D; (e) Zone E; (f) Zone F and (g) Zone G, for different values of α, and µ = 2.
Figure 7.
Parameter RBSCS corresponding to (a) Zone A; (b) Zone B; (c) Zone C; (d) Zone D; (e) Zone E; (f) Zone F and (g) Zone G, for different values of α, and µ = 2.

Figure 8.
Comparison of the strength amplification factors (AF) obtained with Equations (6) and (7) with those presented in Figure 7, corresponding to a ductility demand µ = 2. (a) Zone A; (b) Zone B; (c) Zone C; (d) Zone D; (e) Zone E; (f) Zone F; (g) Zone G.
Figure 8.
Comparison of the strength amplification factors (AF) obtained with Equations (6) and (7) with those presented in Figure 7, corresponding to a ductility demand µ = 2. (a) Zone A; (b) Zone B; (c) Zone C; (d) Zone D; (e) Zone E; (f) Zone F; (g) Zone G.
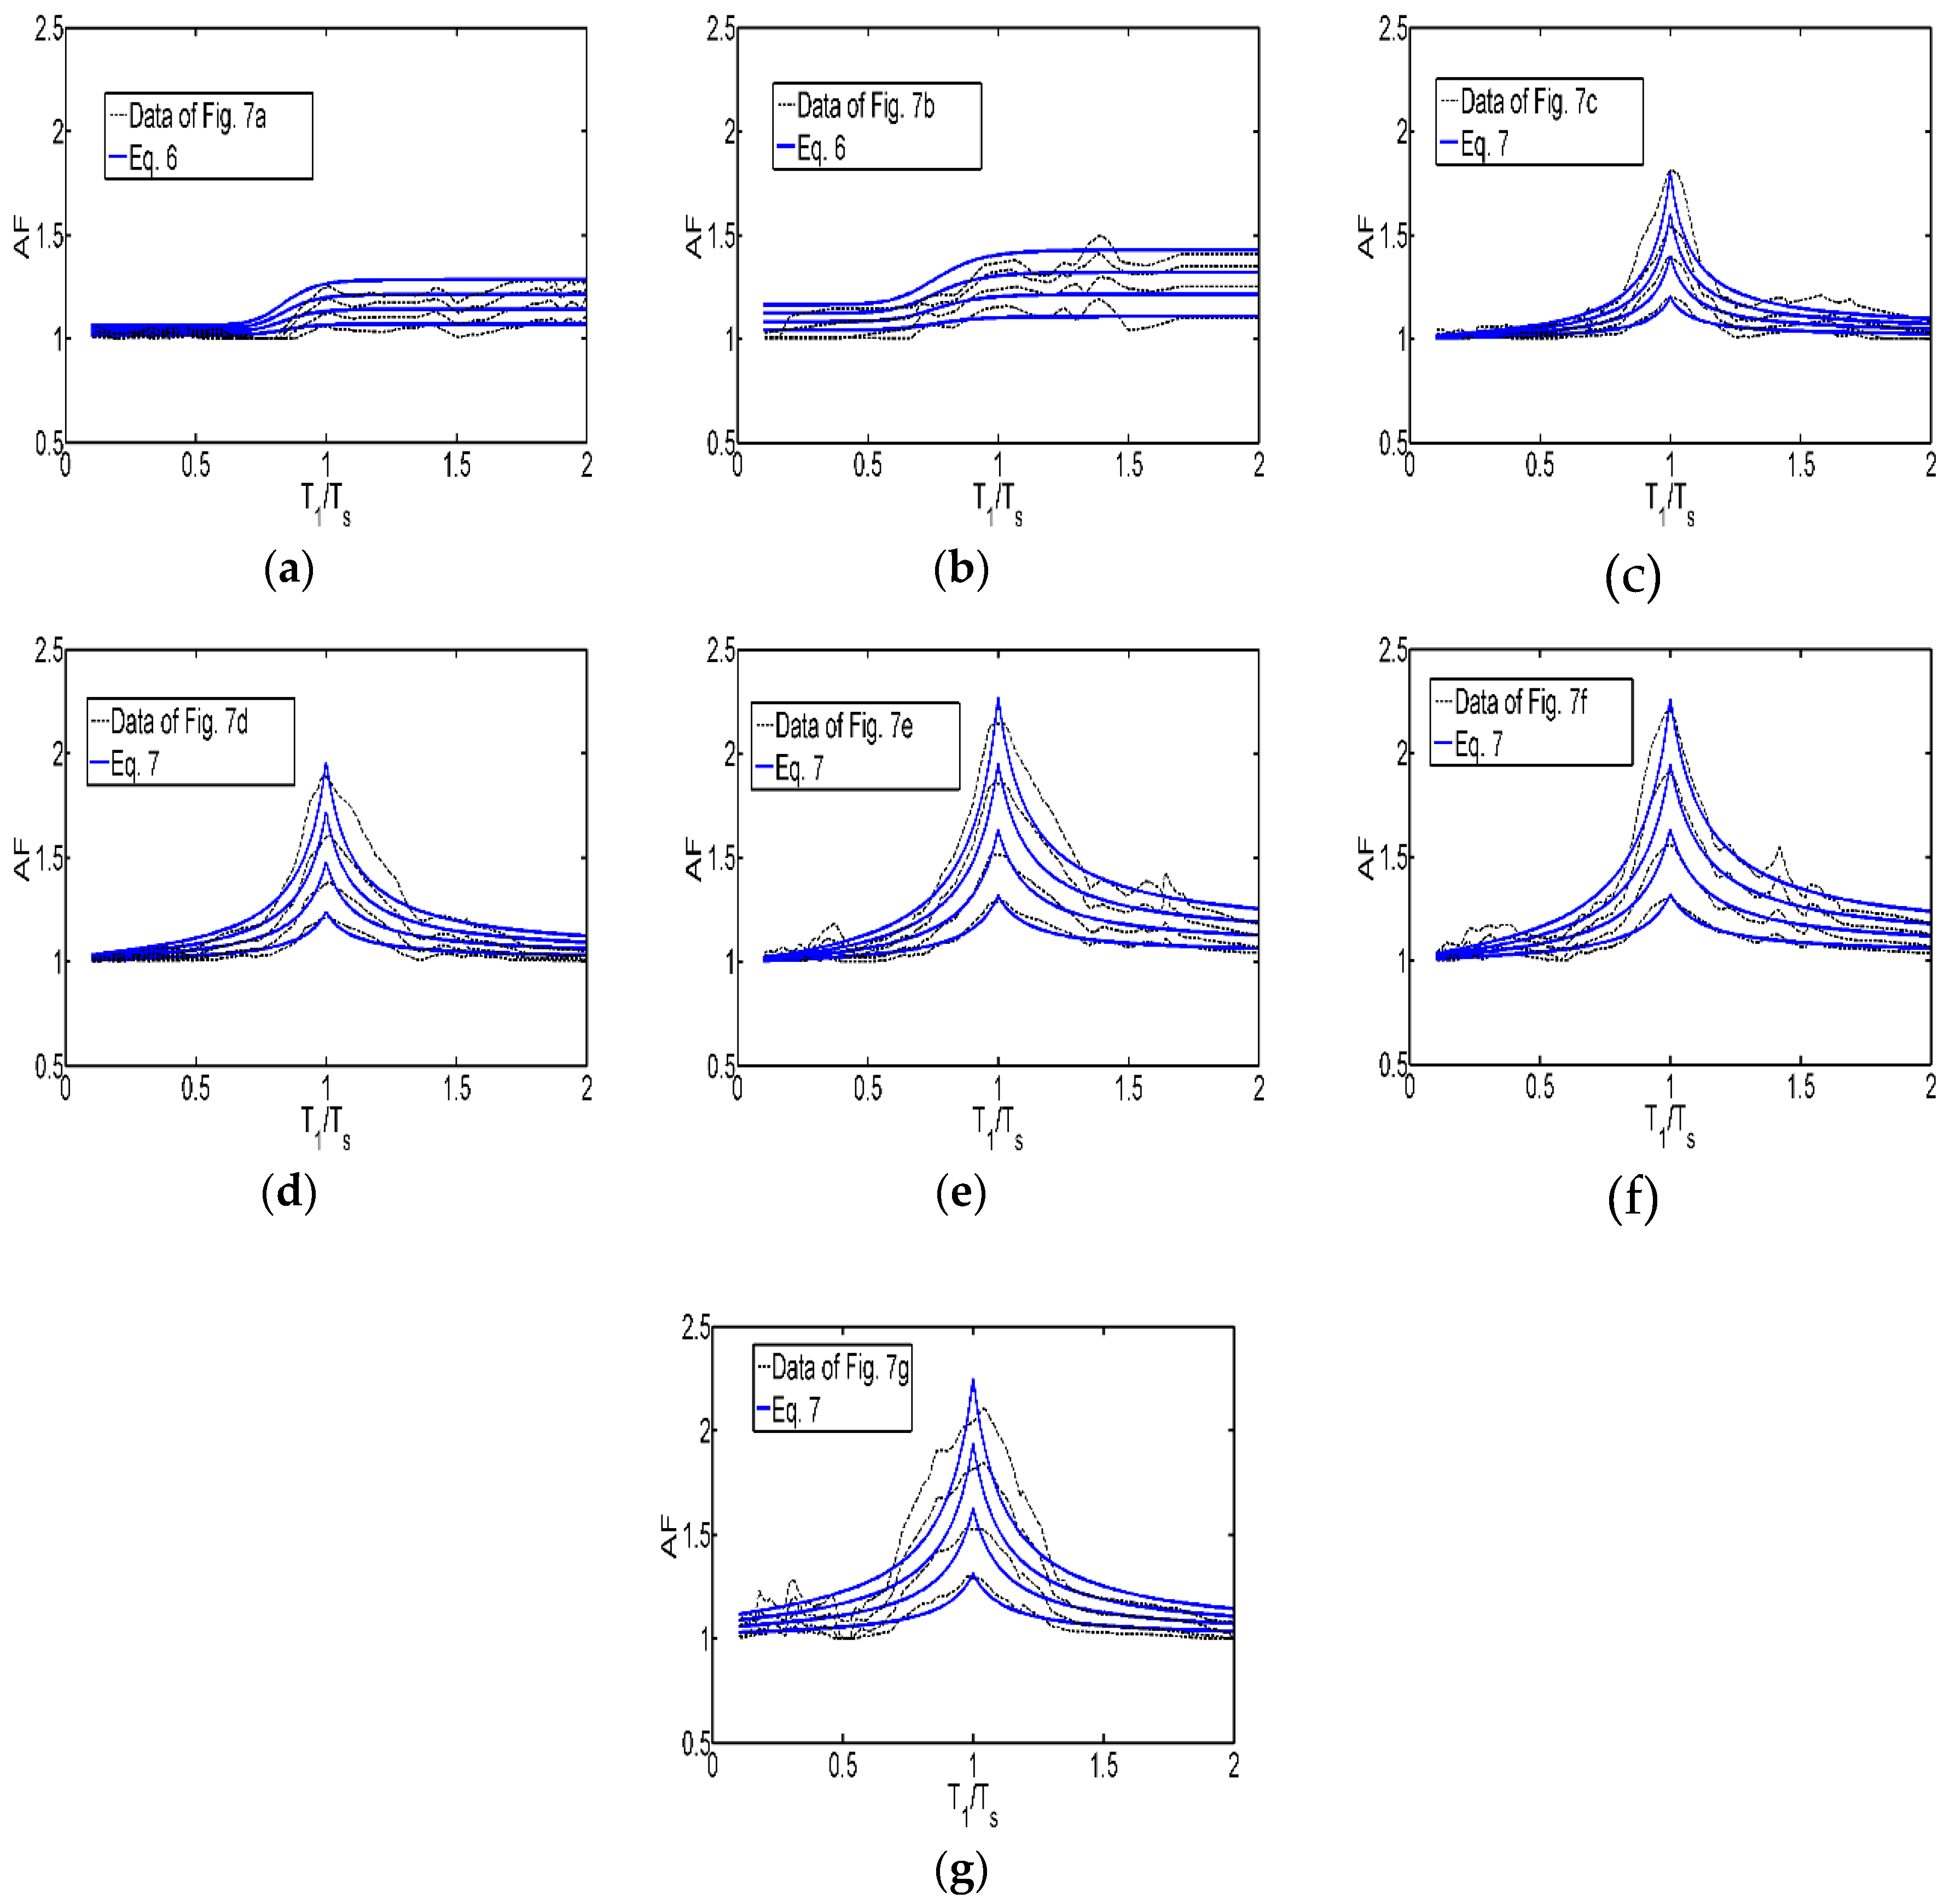
Figure 9.
Comparison of the strength amplification factors obtained with Equations (6) and (7) with those recommended by MCBC-2004, corresponding to µ = 2 and α = 0.02. (a) Firm ground; (b) Intermediate and soft soil.
Figure 9.
Comparison of the strength amplification factors obtained with Equations (6) and (7) with those recommended by MCBC-2004, corresponding to µ = 2 and α = 0.02. (a) Firm ground; (b) Intermediate and soft soil.

Figure 10.
Schematic representation related to the estimation of the ductility transformation factors (DTF).
Figure 10.
Schematic representation related to the estimation of the ductility transformation factors (DTF).
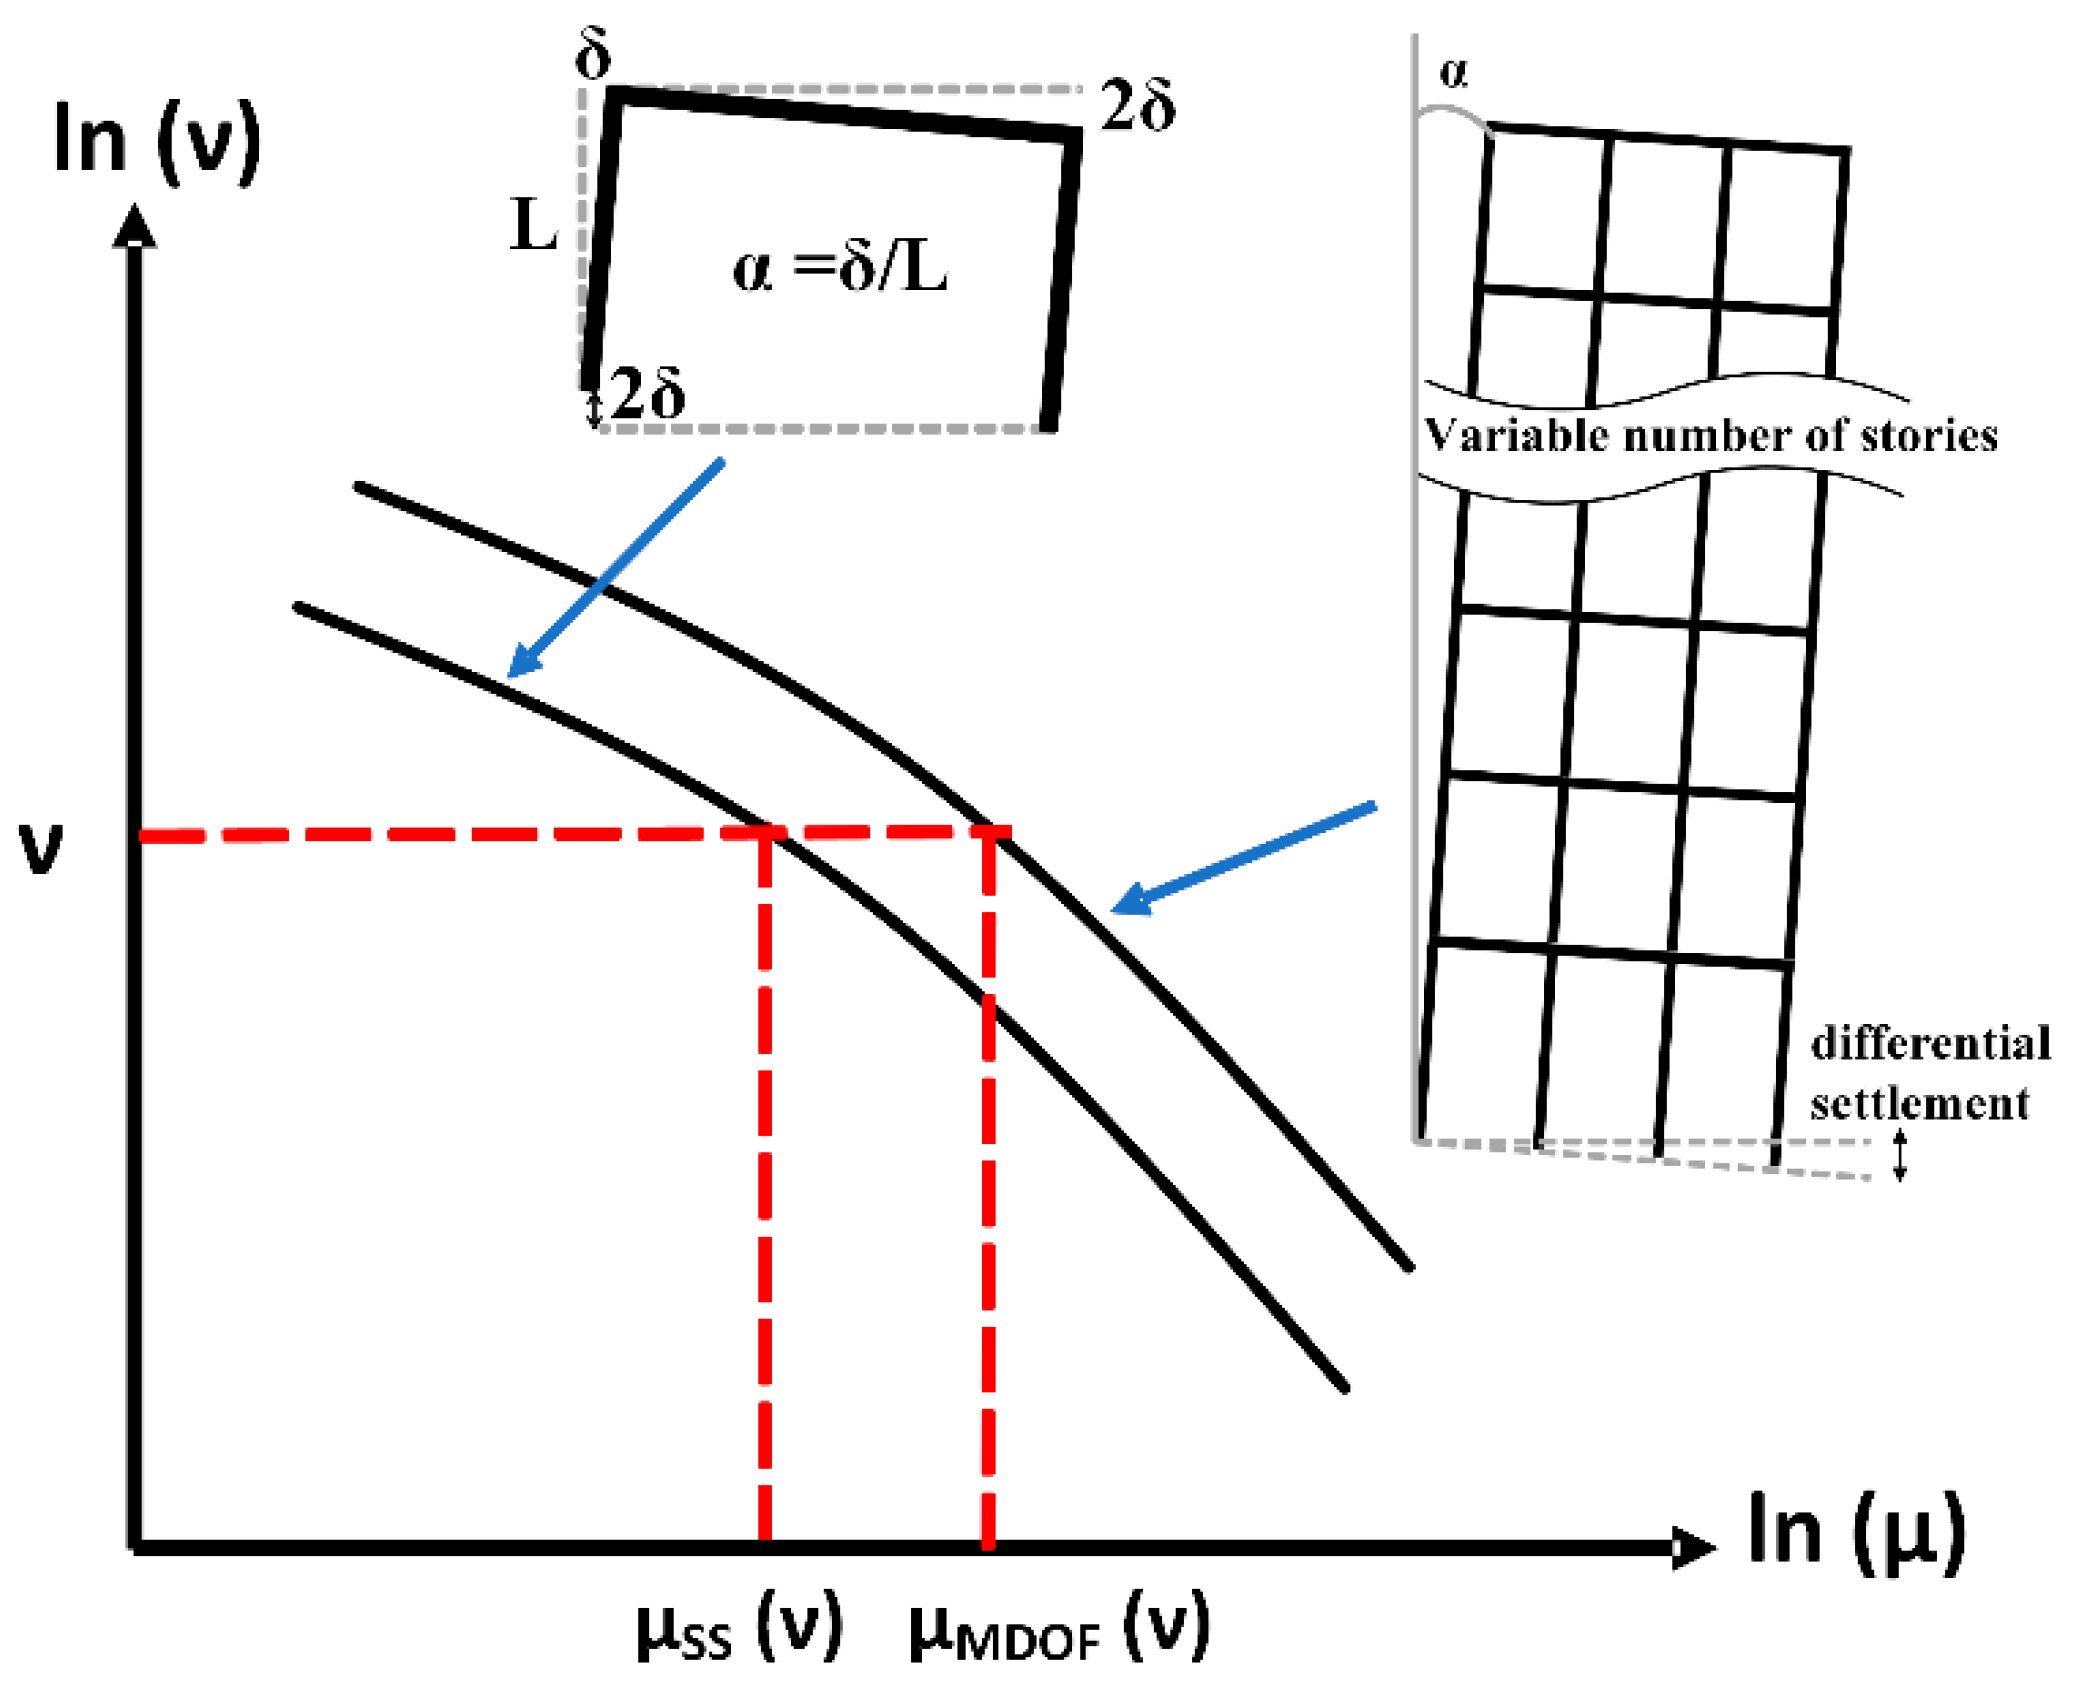
Figure 11.
Plan, elevation, and characterization of asymmetric yielding of the buildings. (a) plan; (b) elevation; (c) asymmetric yielding building.
Figure 11.
Plan, elevation, and characterization of asymmetric yielding of the buildings. (a) plan; (b) elevation; (c) asymmetric yielding building.

Figure 12.
Ductility transformation factors between simplified systems (SS) and multi-degree of freedom (MDOF) systems for different values of α. (a) Symmetric; (b) α = 0.01; (c) α = 0.02; (d) α = 0.03.
Figure 12.
Ductility transformation factors between simplified systems (SS) and multi-degree of freedom (MDOF) systems for different values of α. (a) Symmetric; (b) α = 0.01; (c) α = 0.02; (d) α = 0.03.


Table 1.
Characterization of the valley of Mexico according to the dominant period of the soil.
| Zone | Range of Period (s) | Average Dominant Period, Ts (s) |
|---|---|---|
| A | Ts ≤ 0.5 | 0.62 |
| B | 0.5 < Ts ≤ 1.0 | 0.96 |
| C | 1.0 < Ts ≤ 1.5 | 1.41 |
| D | 1.5 < Ts ≤ 2.0 | 1.98 |
| E | 2.0 < Ts ≤ 2.5 | 2.55 |
| F | 2.5 < Ts ≤ 3.0 | 3.03 |
| G | 3.0 < Ts ≤ 4.0 | 3.61 |
Table 2.
Parameters involved in Equations (6) and (7), corresponding to seismic zones A to G.
| Zone | Dominant Period (s) | a | b | c | d |
|---|---|---|---|---|---|
| A | Ts ≤ 0.5 | (3.5µ − 1.5) α | 13.4 | 0.1 | 1.6α + 1 |
| B | 0.5 < Ts ≤ 1.0 | (4.8µ − 3) α | 8.8 | 0.1 | 4.1α + 1 |
| C | 1.0 < Ts ≤ 1.5 | (1.5µ − 1.4) α | 0.7 | 0.08 | 1 |
| D | 1.5 < Ts ≤ 2.0 | (2µ − 1.6) α | 0.5 | 0.1 | 1 |
| E | 2.0 < Ts ≤ 2.5 | (1.5µ + 0.8) α | 0.9 | 0.12 | 1 |
| F | 2.5 < Ts ≤ 3.0 | (1.5µ + 1.1) α | 0.7 | 0.13 | 1 |
| G | 3.0 < Ts ≤ 4.0 | (1.9µ − 0.05) α | 0.1 | 0.12 | 1 |
Table 3.
Dynamic characteristics of the buildings analyzed.
| Building | T1 | Vb | W | c | dy | du |
|---|---|---|---|---|---|---|
| (s) | (Ton) | (Ton) | (m) | (m) | ||
| 8-story | 1.2 | 1332.45 | 3807 | 0.35 | 0.168 | 0.63 |
| 9-story | 1.22 | 1498.2 | 4540 | 0.33 | 0.181 | 0.65 |
| 10-story | 1.33 | 1563.02 | 5042 | 0.31 | 0.195 | 0.69 |
| 11-story | 1.4 | 1721.1 | 5737 | 0.3 | 0.223 | 0.74 |
| 12-story | 1.48 | 1772.68 | 6331 | 0.28 | 0.246 | 0.78 |
© 2017 by the authors. Licensee MDPI, Basel, Switzerland. This article is an open access article distributed under the terms and conditions of the Creative Commons Attribution (CC BY) license (http://creativecommons.org/licenses/by/4.0/).
Share and Cite
MDPI and ACS Style
Valenzuela-Beltrán, F.; Ruiz, S.E.; Reyes-Salazar, A.; Gaxiola-Camacho, J.R. On the Seismic Design of Structures with Tilting Located within a Seismic Region. Appl. Sci. 2017, 7, 1146. https://doi.org/10.3390/app7111146
AMA Style
Valenzuela-Beltrán F, Ruiz SE, Reyes-Salazar A, Gaxiola-Camacho JR. On the Seismic Design of Structures with Tilting Located within a Seismic Region. Applied Sciences. 2017; 7(11):1146. https://doi.org/10.3390/app7111146
Chicago/Turabian StyleValenzuela-Beltrán, Federico, Sonia E. Ruiz, Alfredo Reyes-Salazar, and J. Ramón Gaxiola-Camacho. 2017. "On the Seismic Design of Structures with Tilting Located within a Seismic Region" Applied Sciences 7, no. 11: 1146. https://doi.org/10.3390/app7111146
Note that from the first issue of 2016, this journal uses article numbers instead of page numbers. See further details here.