The Stability of New Single-Layer Combined Lattice Shell Based on Aluminum Alloy Honeycomb Panels

Key Laboratory of Concrete and Prestressed Concrete Structure, Ministry of Education, School of Civil Engineering, Southeast University, Nanjing 210096, China
*
Author to whom correspondence should be addressed.
Appl. Sci. 2017, 7(11), 1150; https://doi.org/10.3390/app7111150
Submission received: 16 October 2017
/
Revised: 31 October 2017
/
Accepted: 6 November 2017
/
Published: 9 November 2017
(This article belongs to the Special Issue Mechanical Behaviour of Aluminium Alloys)
Abstract
:This article proposes a new type of single-layer combined lattice shell (NSCLS); which is based on aluminum alloy honeycomb panels. Six models with initial geometric defect were designed and precision made using numerical control equipment. The stability of these models was tested. The results showed that the stable bearing capacity of NSCLS was approximately 16% higher than that of a lattice shell with the same span without a reinforcing plate. At the same time; the properties of the NSCLS were sensitive to defects. When defects were present; its stable bearing capacity was decreased by 12.3% when compared with the defect-free model. The model with random defects following a truncated Gaussian distribution could be used to simulate the distribution of defects in the NSCLS. The average difference between the results of the nonlinear analysis and the experimental results was 5.7%. By calculating and analyzing nearly 20,000 NSCLS; the suggested values of initial geometric defect were presented. The results of this paper could provide a theoretical basis for making and revising the design codes for this new combined lattice shell structure.
1. Introduction
A honeycomb sandwich structure is a typical lightweight and high-strength biomimetic structure [1,2,3,4]. Based on the characteristics of a lightweight beetle forewing structure [5,6], Chen et al. developed an integrated biomimetic honeycomb sandwich structure [7,8], which has advantages, such as cementing free, single cast forming, and excellent mechanical properties [6,9]. Currently, this plate is composed of reinforced basalt fibre epoxy resin composite material; the thickness of the honeycomb wall is approximately 2 mm [10]. By comparison, the thickness of the honeycomb core wall of the aluminium alloy honeycomb sandwich structure is approximately 0.05 mm, which is approximately 1/40 of the former. The latter is more suitable for a large span spatial structure, which is especially sensitive to dead weight [11,12,13]. To improve the overall stability and ultimate bearing capacity of single-layer aluminum alloy lattice shells, in this paper, the authors propose a new spatial structure system made from an aluminum alloy. The system consists of lightweight high-strength aluminum alloy honeycomb panels that are reliably connected to the single-layer aluminum alloy lattice shell by special connecting parts. This forms a new type of single-layer aluminum alloy combined lattice shell structure. In this structure, which is referred to as a new spatial combined lattice shell (NSCLS), the plates and rods support and reinforce each other [14]. Our previous studies [15,16,17] showed that the new spatial structure has characteristics, such as a large span, light dead weight, and high total rigidity. Because the honeycomb panels support and reinforce the structure, the overall stiffness and stable bearing capacity of the NSCLS structure are obviously higher than those of a single-layer aluminum alloy lattice shell structure with the same span. Under the same load conditions, the new system can sustain a structure with a larger span. For these reasons, it has good application prospects (Figure 1).
In the study of single-layer aluminum alloy lattice shells, Hongbo Liu et al. [18] analyzed with nonlinear finite method to clarify the stability performance of aluminum alloy single-layer latticed shell. The suggested values of rise/span ratio and initial imperfection were presented. The influencing coefficients of initial imperfection and material nonlinearity on stability bearing capacity were obtained. Sugizaki et al. [19] tested four single-layer aluminum alloy spherical lattices using reduced-scale models. They studied the effects of three factors (high span ratio, load distribution pattern, and grid form) on the steady bearing capacity. The bearing capacity of the lattice shell with a mixed quadrilateral and triangular mesh was close to that of the one with an entirely triangular mesh. The influence of the nodal domain was taken into account in the finite element analysis [20]. Xiaonong Guo et al. [21] devoted to investigate the resistance of aluminum alloy gusset joint plates. It was found that the main collapse modes of AAG joint plates include the block tearing of top plates and the local buckling of bottom plates. Zechao Zhang et al. [22] analyzed the performance of aluminum alloy single-layer latticed shell by considering the combination of dead loads, live loads, snow load, wind load, temperature effect, and other seismic dynamic loads. With the geometrical nonlinear finite element method, the stability coefficient and the weak parts of the structure were obtained when considering initial imperfections and material nonlinear. Gui Guoqing et al. [23] used a numerical simulation to analyze the geometric nonlinear stability of an aluminum alloy lattice shell. They discussed the influence of the vector-to-span ratio, the load distribution, and the supporting condition on the stable bearing capacity of the lattice shell.
In the study of the honeycomb structure’s stability, Attard and Hunt [24] considered the shear deformation of the panel and the core honeycomb layer. Using piecewise first-order beam theory, they analyzed the overall buckling of the honeycomb structure. Bourada M, Tounsi A et al. [11,12] studied the instability of a honeycomb core with a uniform wall thickness under uni- and bidirectional in-plane compression and out-of-plane compression. Using experimental studies and numerical simulations, A. Boudjemai, R. Amri et al. [25,26] studied the macroscopic deformation and plastic instability of a honeycomb structure with uniform wall thicknesses under unidirectional in-plane compression.
It is obvious that the existing studies focus on the aluminum alloy lattice shell structure or the honeycomb panel itself. Almost no studies of a combined aluminum alloy lattice shell structure, in which an aluminum alloy honeycomb panel reinforces the lattice shell have been conducted. There are some topics that should be addressed, such as the stability of these relatively lightweight and soft combined lattice shells and the difference between its unstable failure mode and that of ordinary single layer lattice shells that lack aluminum alloy. In this paper, the authors conducted experimental studies on the stability of this new structure to defects to investigate the structure’s destabilization failure mechanism and the effect of geometric imperfections on stability. The authors also verified the reliability of the finite element method. The results of this paper could provide a theoretical basis for making and revising the design codes for this new combined lattice shell structure.
2. Experimental Study on Stability of NSCLS
2.1. The Design and Fabrication of the Test Model
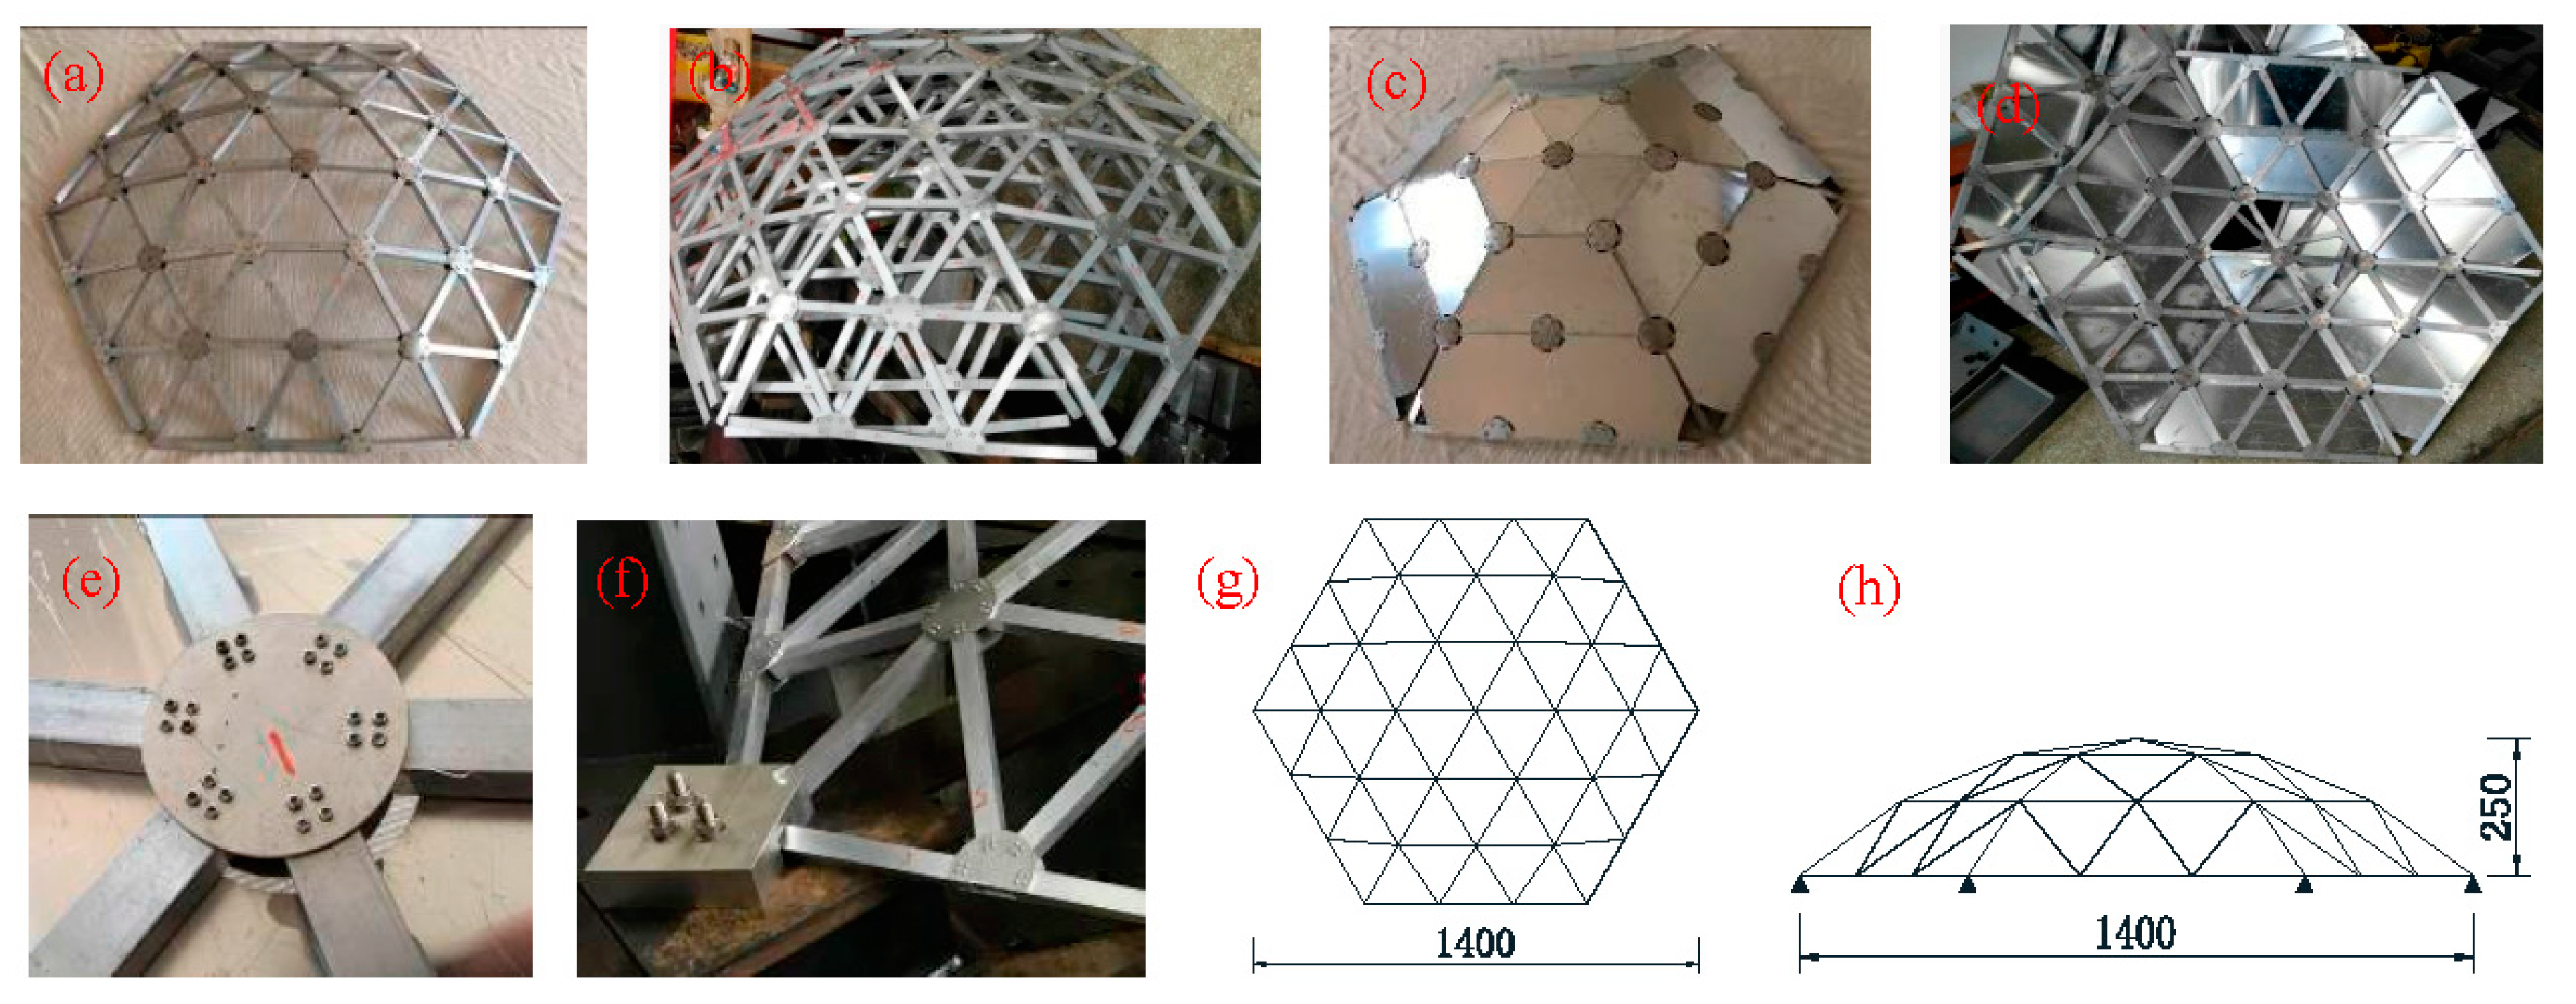
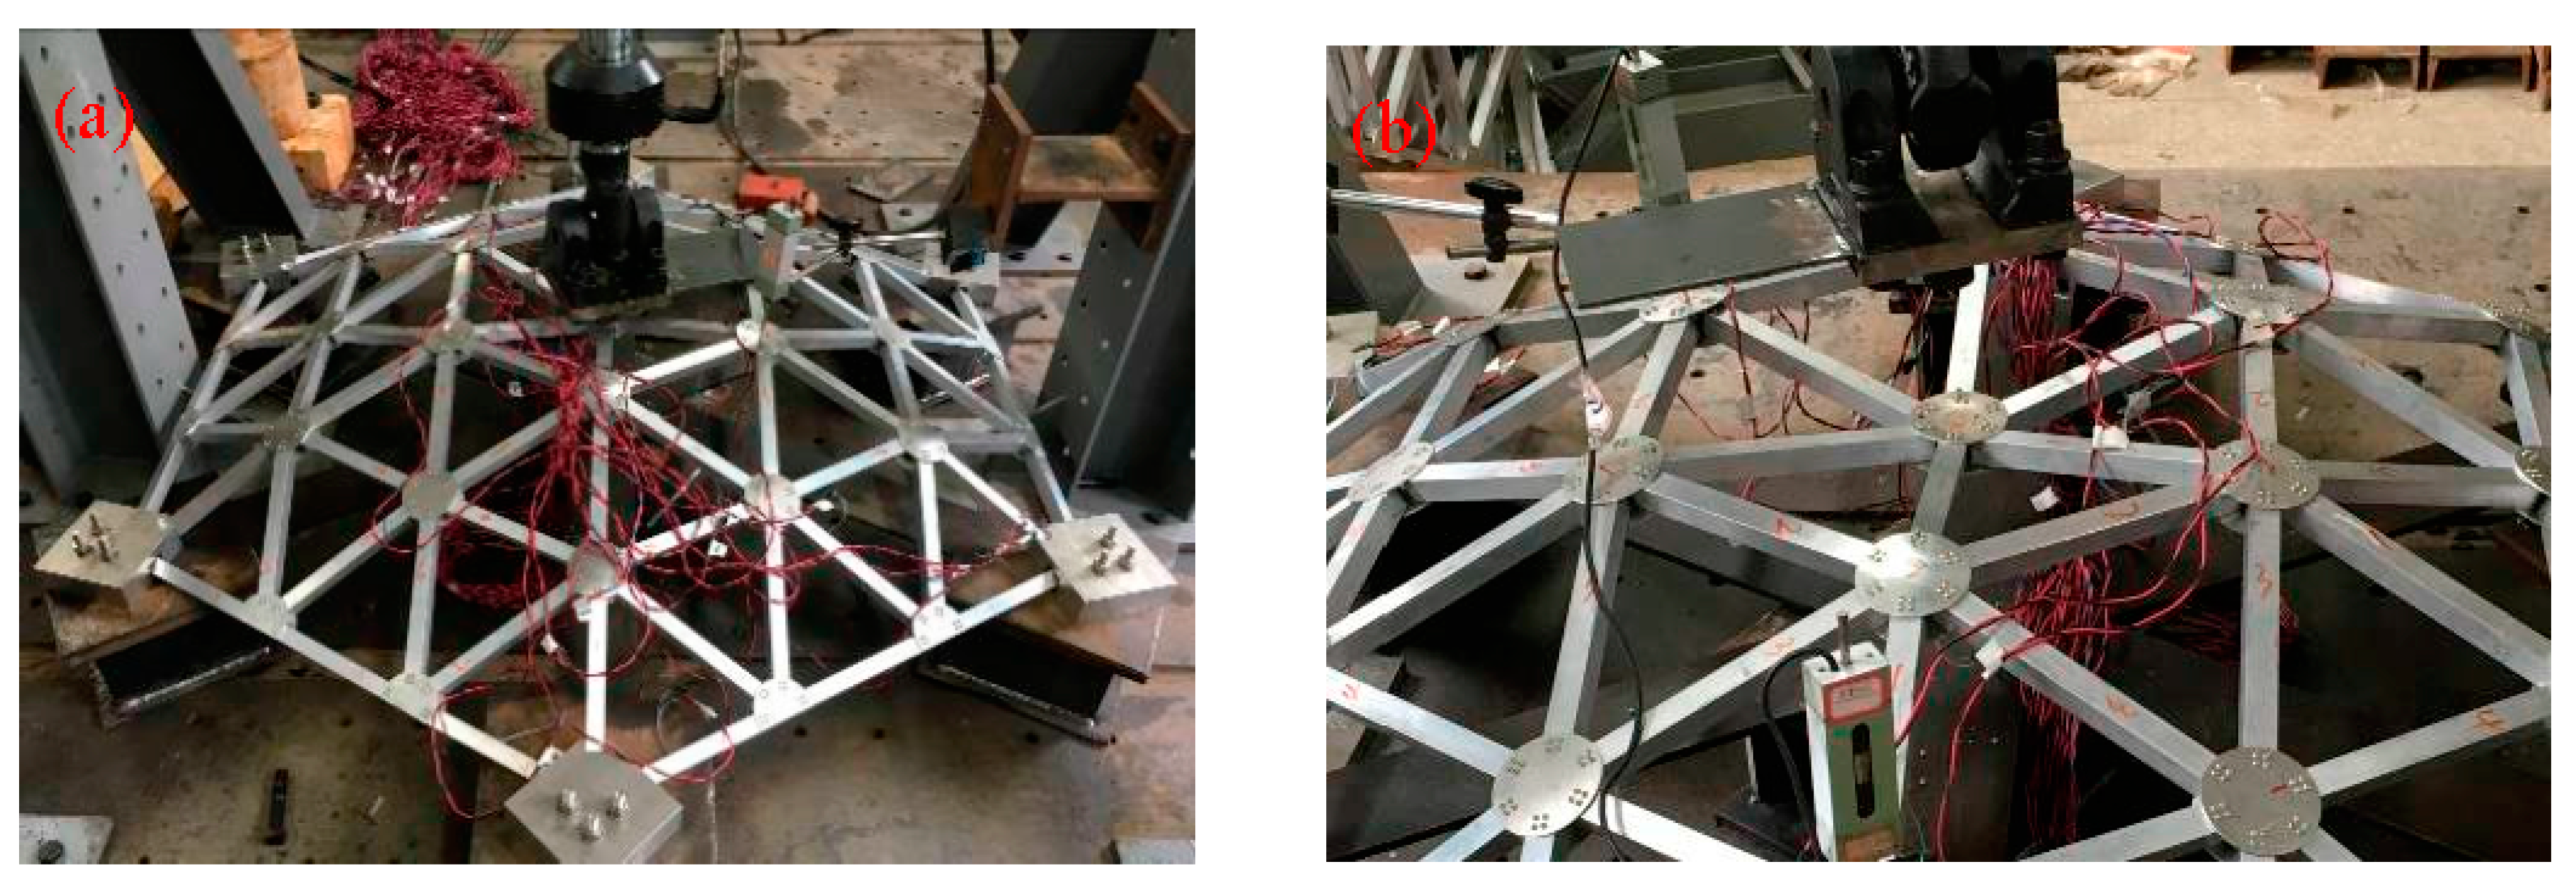
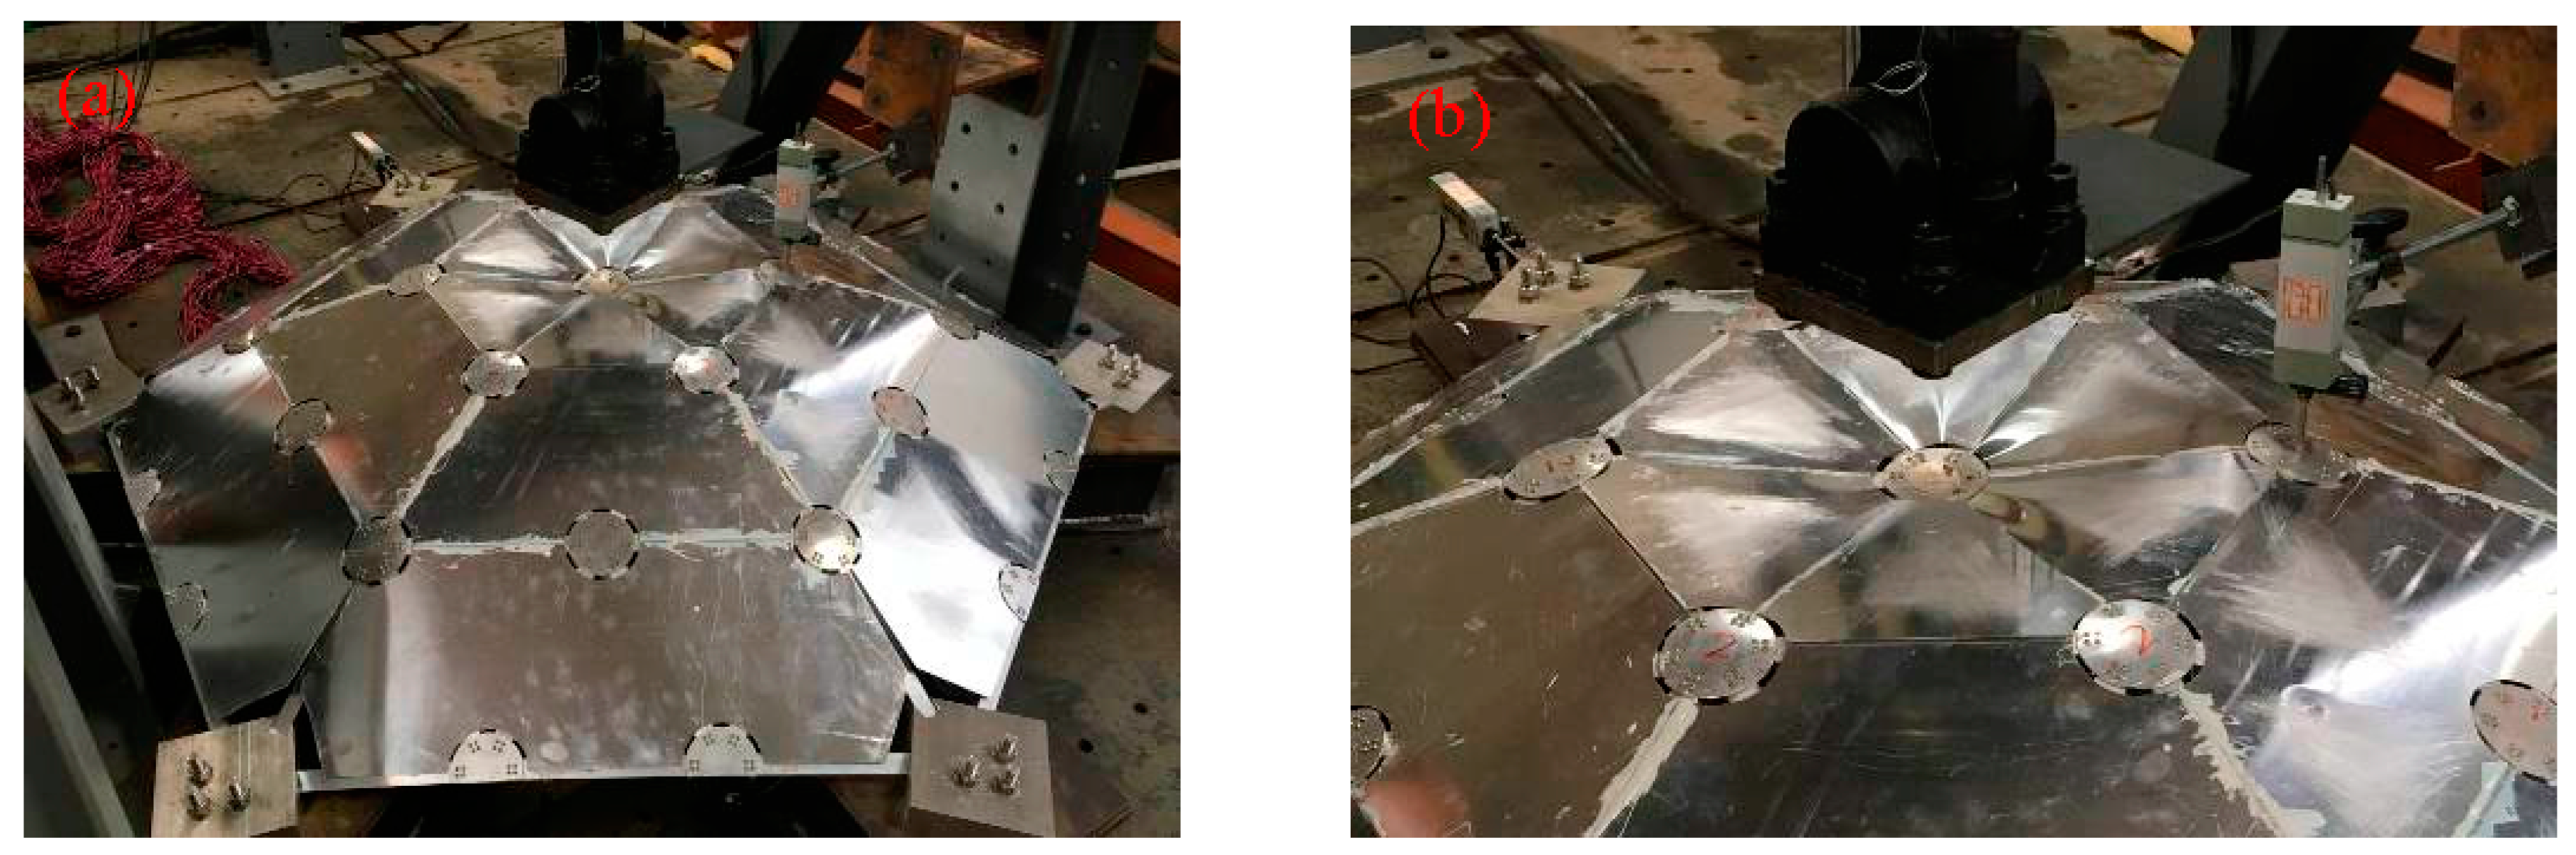
To study how a honeycomb panel enhances the stable bearing capacity of a lattice shell structure, in this paper, the authors designed six single-layer aluminum alloy lattice shell models. Among the six models, three were lattice shells without honeycomb panels providing reinforcement (A1, A2, and A3), and the other three were lattice shell models with reinforcement (B1, B2, and B3). Figure 2a–d show the configurations of the models. The model plane was a regular hexagon. The diameter was 1400 mm, and the vector height was 250 mm (as shown in Figure 2g,h). The models were made by assembling 90 bars, 37 nodes, and 54 triangular plates together. The bars were square aluminum alloy tubes. The side length was 20 mm, and the wall thickness was 2 mm. The bars were connected by circular disc node connectors 72 mm in diameter.
To guarantee the processing accuracy of the test model, the holes on each aluminum alloy bar were precision drilled using wire cutting technology. At the upper and lower surfaces of the rods, four screw holes of 2.5 mm in diameter were machined on each surface to connect the nodal plates. To prevent the rods from colliding during assembly, the ends of the rods were cut off. Because the scale of the test model was limited by the loading equipment, the thickness of the aluminum alloy honeycomb panel was only approximately 3 mm if the components of the test model were designed at full scale. The existing processing technology was not yet able to produce such thin aluminum alloy honeycomb panels. We decided to use 1-mm-thick aluminum alloy plates in place of the honeycomb panel. Because the aluminum alloy plate and the nodal plate were placed in the same positions for nodal attachment, to accommodate the nodal plate, the corners of the aluminum plate were rounded using laser cutting equipment. The circular gussets of the connecting rods were spherical disks with a certain curvature that were stamped using a specialized mold. A total of 24 pre-machined threaded holes (their diameters were same as those of the holes at the end of the rod) were drilled on each joint plate (Figure 2e). The bolt holes at the ends of the rod were aligned with the holes in the gusset plate and tightly fit with high-strength bolts. In the model with integrated aluminum alloy plates, because the cross section of the square aluminum alloy tube was too small, the aluminum plate and the bar could not be bolted (the minimum margin requirements were not met) or welded (the thin aluminum plate was prone to burning through). Therefore, they were connected using a high-strength structural adhesive. The model was supported by fixed supports that were slotted into a computer numerical control (CNC) machine. The dimensions of the three slots were measured repeatedly. It was ensured that the actual projected length and width of the aluminum alloy square tube in the lattice model were the same, and then, the bars were placed in the slot. In this way, the rod’s linear and angular displacements (Figure 2f) were well constrained. To study the influence of geometric imperfections of nodes on the bearing capacity of each model, geometric imperfections were introduced into two models (A2 and B2). The method was to reduce the Z coordinate of the top of the model by 5.6 mm (i.e., 1/250 of the lattice shell’s span).
2.2. Loading and Testing Methods
Standard and rosette strain gages were placed on the aluminum alloy tube and the aluminum plates, respectively (Figure 3a,b). The load was provided by the MTS automatic load control system. The loading rate of 0.02 mm/s was achieved using a displacement sensor. The test site is shown in (Figure 3c).
2.3. Results and Discussion
2.3.1. Failure Patterns of the Test Models
Failure Pattern of the Lattice Shell Model with No Aluminum Alloy Plate
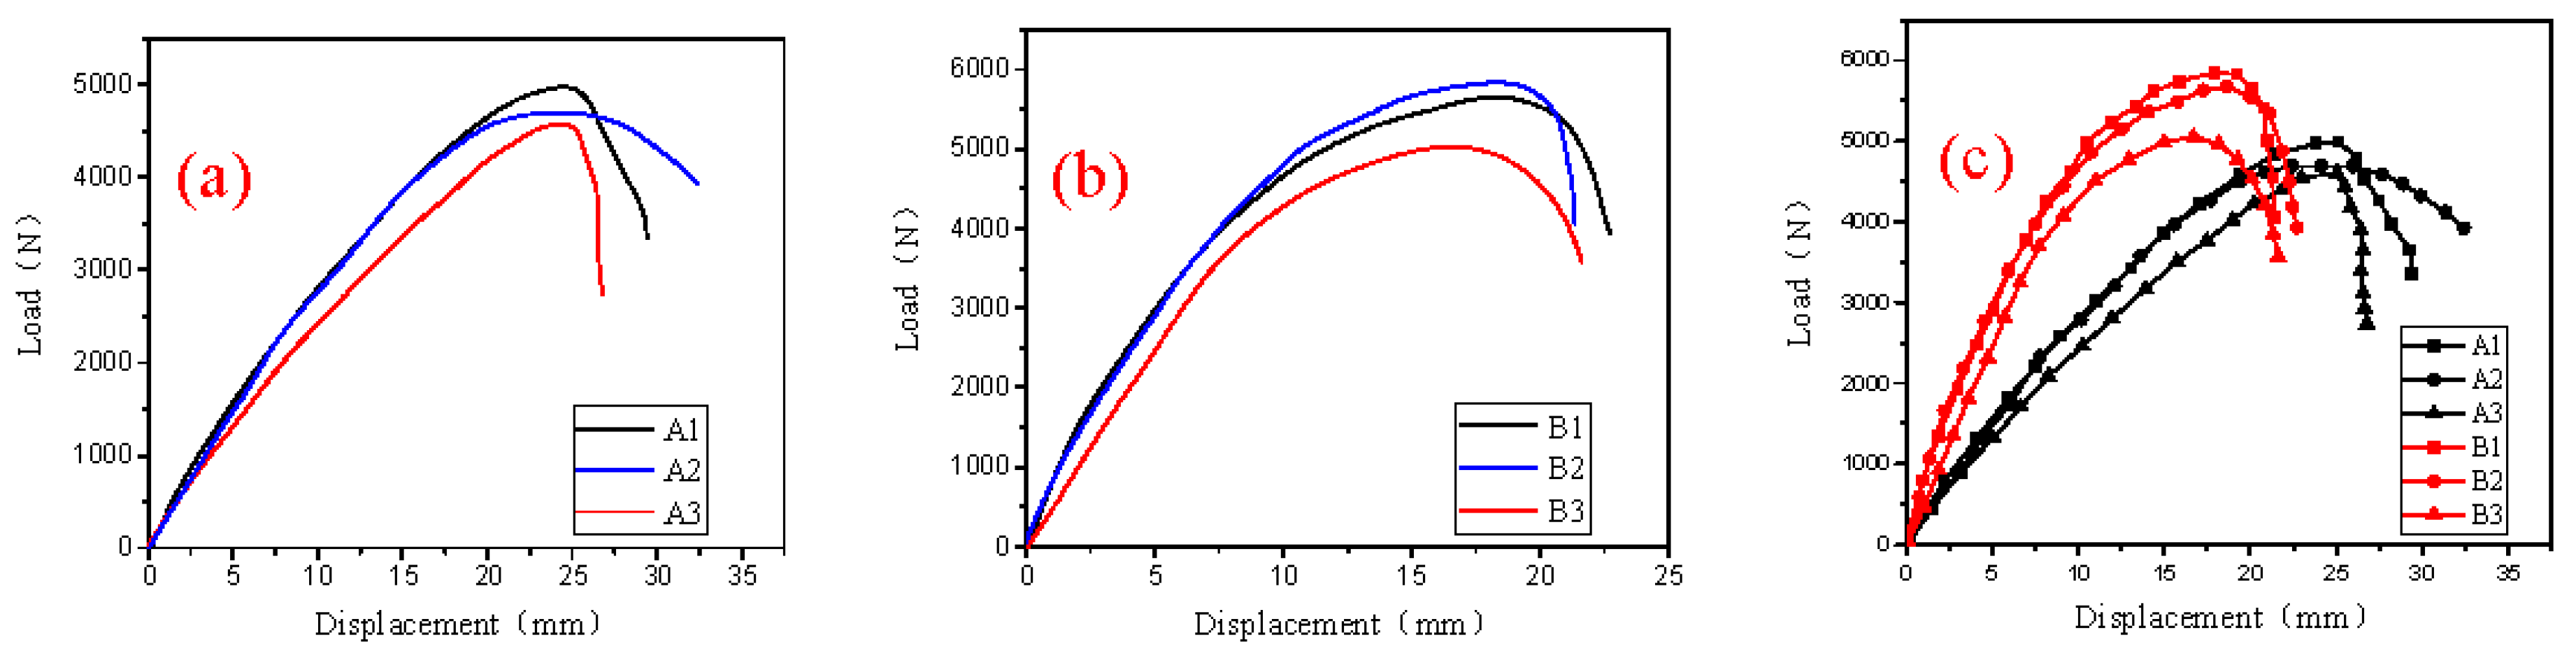
At the early stage of loading, when the load was less than 2500 N, the load increased linearly with displacement. As the load increased, it grew nonlinearly with displacement. When the displacement at the loading point reached 20~30 mm, the structure began to buckle. As the displacement continued to increase, some connecting bolts on the gusset plate broke, and the bearing capacity decreased rapidly. The bars in the area near the loading point were obviously concave. Figure 4 shows the instability failure pattern of the lattice shell structure without an aluminum alloy reinforcing plate.
The Failure Mode of the Combined Lattice Shell Model
When the load was less than 3000 N, it increased linearly with displacement. As the load further increased, it grew nonlinearly with displacement. When the displacement at the loading point reached 15~20 mm, the structure started to buckle. As the displacement continued to increase, some connecting bolts on the gusset plate broke. A small number of connectors that were holding the aluminum alloy plate to the bar were pulled from the degumming because they could no longer sustain the load. The bearing capacity decreased rapidly. The aluminum alloy plate and the bar buckled near the loading point. The structure was deemed to have failed. Figure 5 shows the measured instability failure mode of the combined aluminum alloy lattice shell structure.
2.3.2. Load-Displacement Curve of the Test Model
Figure 6a,b show the load displacement curves of the lattice shell with no aluminum alloy reinforcing plate and combined lattice shell models, respectively. These figures show that the shapes of the curves for the six models are similar (Figure 6c) regardless of whether an aluminum alloy plate is incorporated into the lattice shell and whether there are geometric imperfections. However, the ultimate bearing capacity and the maximum displacement are different. Because the aluminum alloy plate reinforces the structure, the overall rigidity and the stable bearing capacity of the combined lattice shell structure are enhanced remarkably. The ultimate bearing capacities of the lattice shells with plates are significantly larger than that of the lattice shell with no plate. They increase by approximately 15% on average. The enhancement of the defect-free lattice shell model is more pronounced than that of the model with defects.
In addition, the test results show that the sensitivity of each type of structures to geometric imperfections is different. The bearing capacity of the model with defects (A2) is approximately 7% lower than the capacity of those without defect (A1 and A3). In the combined lattice shell model, the bearing capacity of the model with defects (B2) is 12% less than the capacity of those without defects (B1, B3).
3. Analysis of the Nonlinear Stability of NSCLS to Defects
3.1. Basic Assumptions
In this paper, we make the following two basic assumptions when analyzing the stability of single-layer aluminum alloy lattice shells to defects using the random defect mode method. (1) The initial error in each node follows a normal probability density function within the double mean-square deviation. That means that the random variable that was representing the initial error along the X-, Y-, and Z-axes is RX/2, where the random variable X is normally distributed. R is the maximum initial error, and the error of the random variable is within [−R, R]. (2) The random variables representing the initial error of each node are independent of each other.
3.2. Analytical Methods
First, we introduce the initial error into each node in the model to create a computational model with stochastic defects; then, a nonlinear stability analysis is performed to determine the stable bearing capacity. This value is taken as a sample in the stable bearing capacity’s sample space. Repeat the above steps several times to obtain multiple stable bearing capacities. In this way, a stable bearing capacity sample space containing N samples is created. Finally, based on the theory of probability and mathematical statistics, we perform a statistical analysis of the calculated steady bearing capacity of the samples to determine the final stable bearing capacity of the structure.
In the finite element analysis, Beam 188 element is simulated aluminium alloy bars and Shell 181 element is simulated aluminium alloy plates, while contacted elements are used between bars and plates. The boundary constraint condition of the model is fixed support. The material properties of aluminum alloy are as follows: elastic modulus E = 70 GPa, shear modulus G = 27 GPa, poisson’s ratio μ = 0.33, volume weight ρ = 2.65 × 10⁴ N/m3.
3.3. Experimental Verification of Random Defect Mode Method
Before analyzing the nonlinear stability of the single-layer aluminum alloy lattice shells using the stochastic defect method, it is necessary to know the probability characteristics of each random variable, including its distribution and statistical parameters. This means that we need to determine the distribution of the initial geometric imperfections, and its mean, mean square deviation, and defect radius R (the absolute value of the maximum defect size), as well as other statistical parameters.
In this paper, we assume that the initial geometric imperfections are normally distributed. Due to the limitation of the nodal position deviation, we use a truncated Gaussian distribution. This is essentially a normal distribution, but only two truncation limits are set based on the normal distribution. Therefore, the input parameters for the distribution of the random variables that need to be determined are as follows: the mean μ, the standard deviation σ, the correlation coefficient ρ, and the truncation limits Xmin and Xmax. Because of the limited length of this paper, only two typical models of the six models are discussed (i.e., model A1, the lattice shell with no aluminum plates or defects, and model B2, the combined lattice shell model with defects).
3.3.1. Results for Model A1, the Defect-Free Lattice Shell Model with No Aluminum Plate
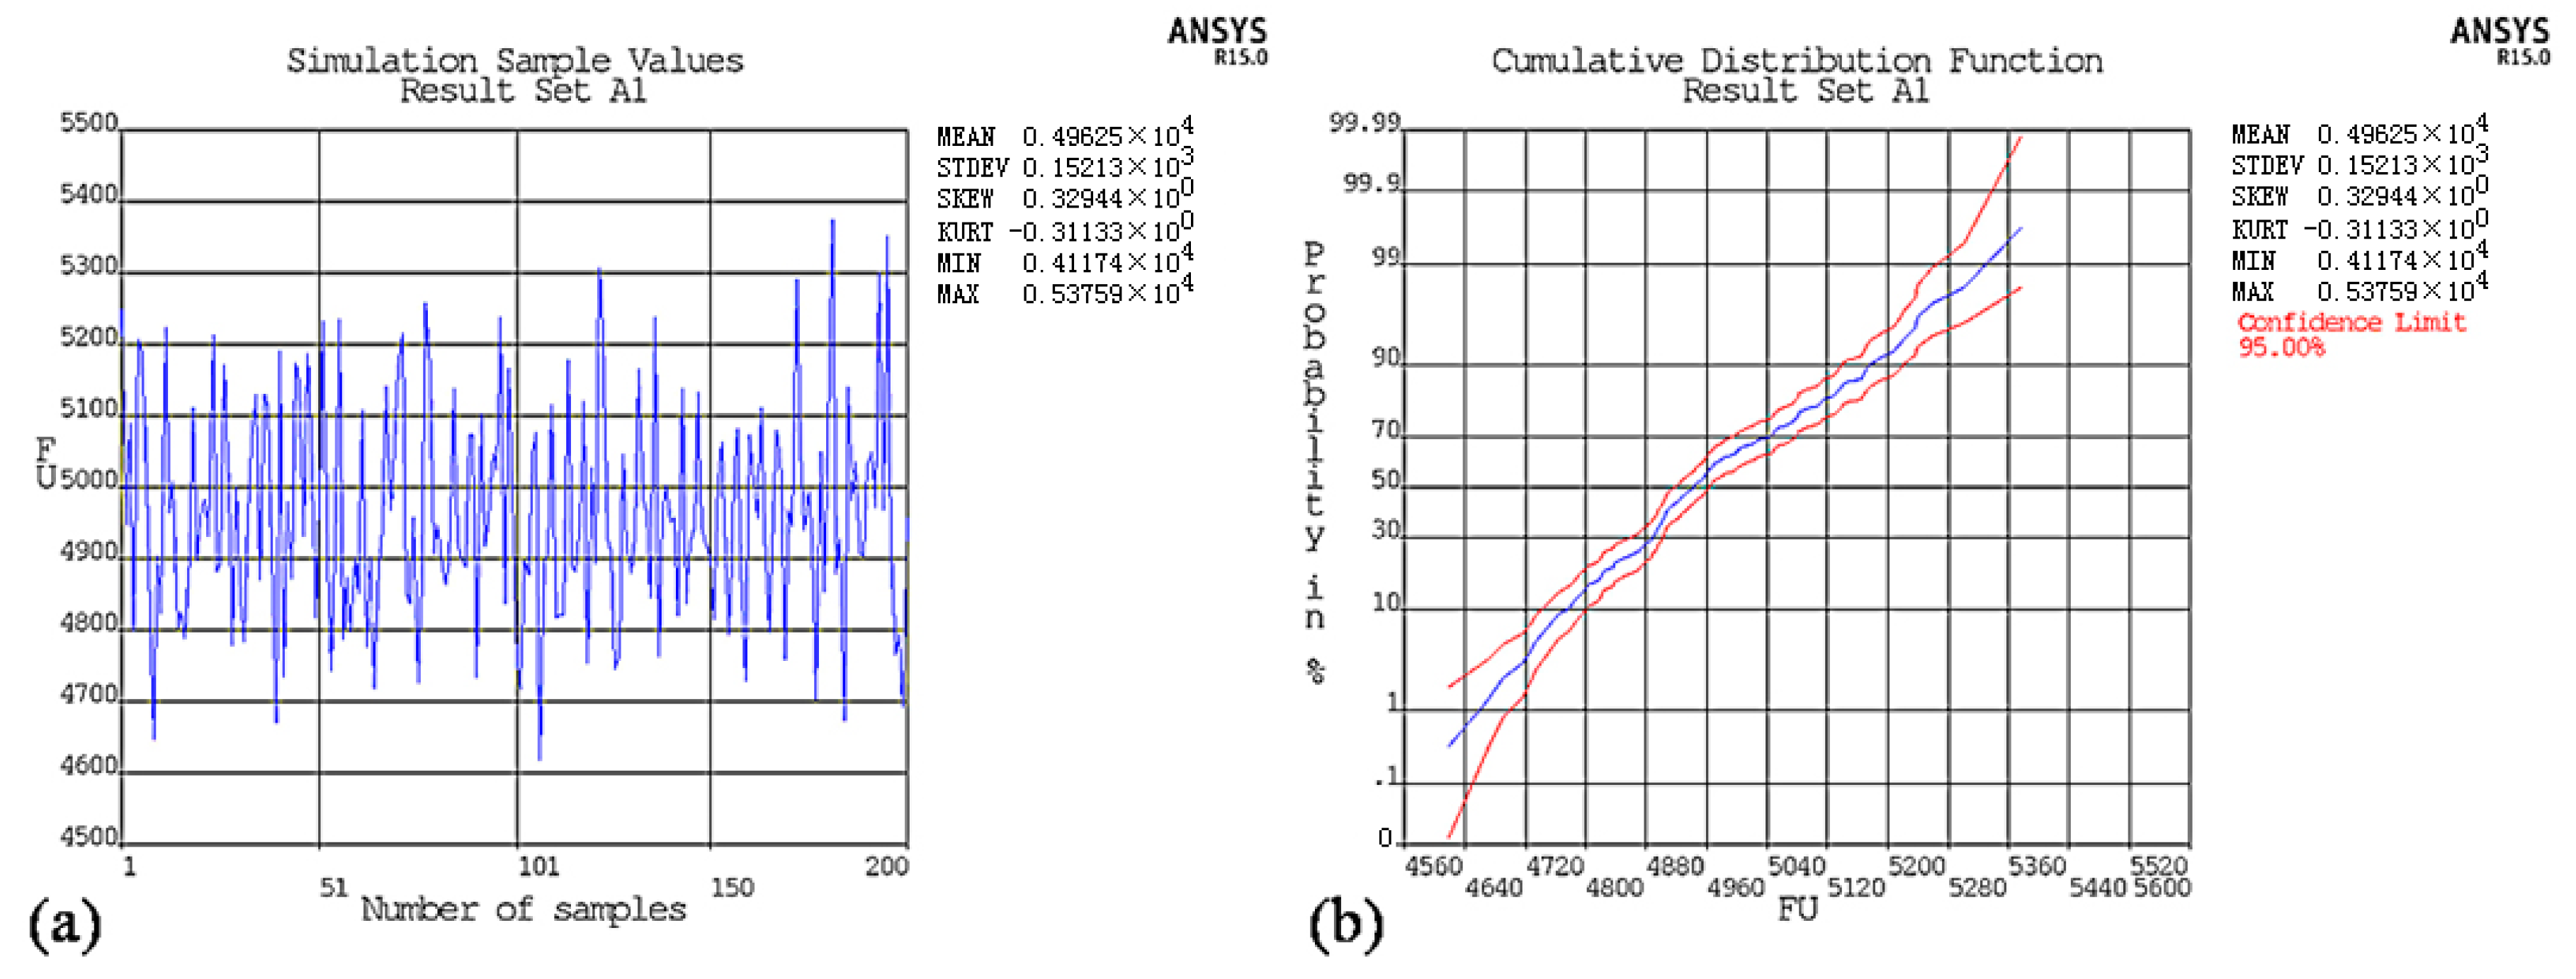
During the analysis, the authors measured the cross-sectional dimensions at the middle and at both ends of all the aluminum alloy bars. The average of the three measured cross-sectional dimensions was used for finite element modeling. In analyzing the ultimate bearing capacity of the random defect mode, as per the relevant literature, the mean was μ = 0 and the discrete coefficient was Cd = 0.423 (the average of the statistical results of the three coordinate components). The cutoff limit of the maximum amplitude of the deviation was Xt = 1.4 mm (1/1000 of the model’s span), the maximum correlation coefficient was ρmax = 0.65, and the number of random samples was N = 200.
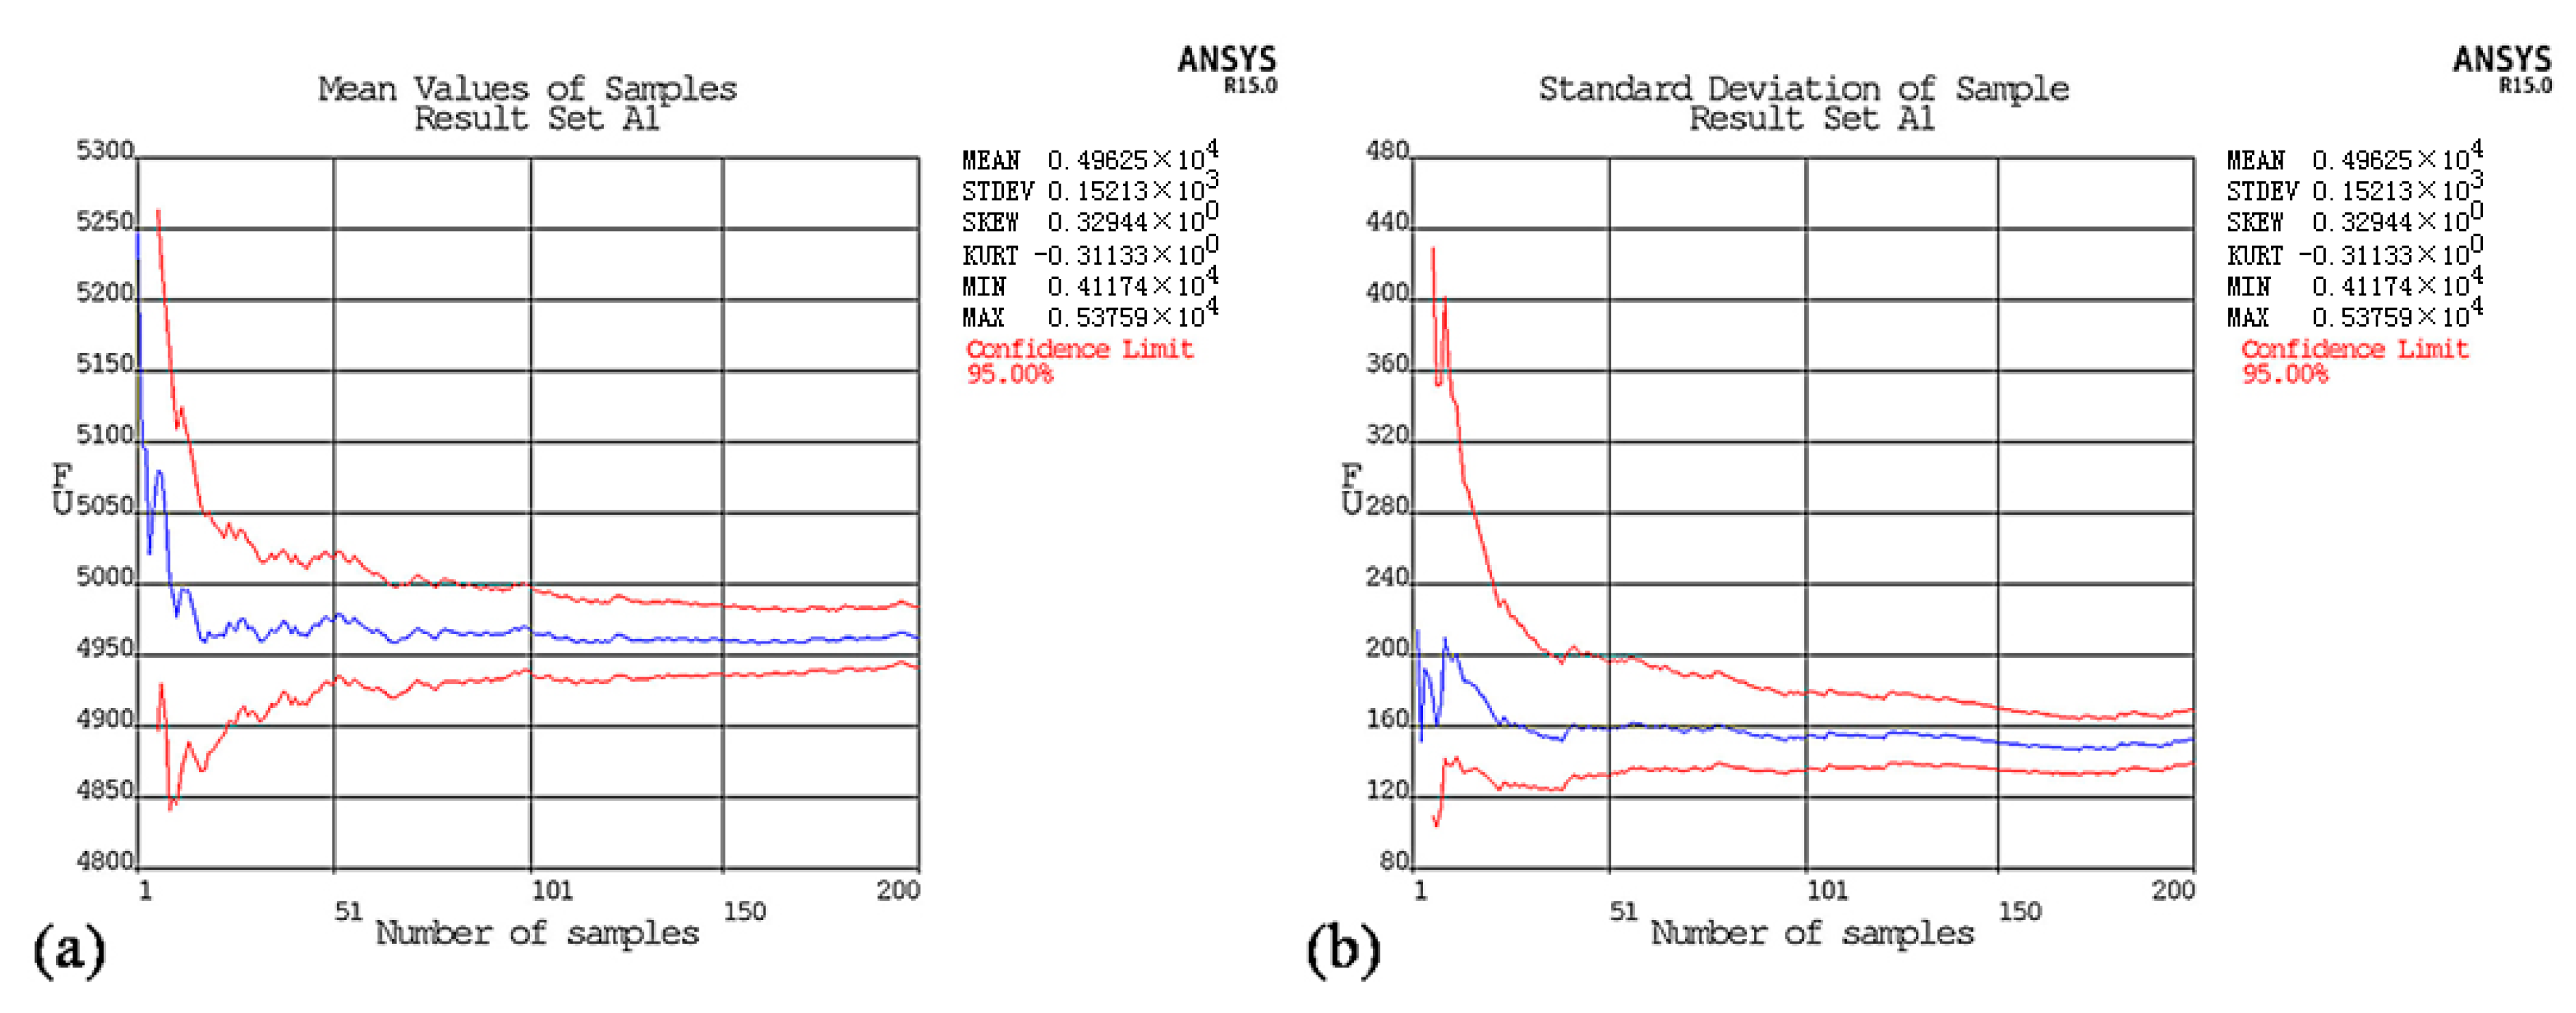
Figure 7a,b show the history and mean square deviation of the critical load samples for model A1, respectively. The blue curve in the middle of Figure 7b plateaus after the number of samples N exceeds 100. This indicates that the mean and mean square deviation of the critical load samples stabilize after the number of samples N exceeds 100. The red curves on the upper and lower sides are the boundaries at the 95% confidence level. The area between the curves in the graph decreases in size, which indicates that the accuracy of the history curve increases. Therefore, selecting 100 samples in practical engineering makes it possible to meet the accuracy requirements under normal conditions. The calculated results are reliable.
After using finite element analysis to analyze 200 samples with defects, we obtain a curve for the critical load samples (Figure 8a). Using the Gaussian method (if the random variable follows a Gaussian distribution, the probability distribution function is a straight line), we plot the probability distribution of the critical load samples (Figure 8b). The middle section of the blue curve is somewhat close to a straight line. We check that the critical load samples are normally distributed by evaluating the fit. The normal distribution assumption is acceptable at the 5% significance level.
The critical load samples are statistically analyzed and compared with the experimental results. The results are listed in Table 1. The critical loads Pcr in the table are determined by following the “3σ” principle (i.e., a 99.87% guarantee rate).
3.3.2. Analysis of the Combined Lattice Shell with Defects (Model B2)
In model B2, the authors artificially set the geometric deviation of the node coordinates, i.e., we reduced the Z coordinate of the top of the model by 5.6 mm (1/250 of the combined lattice shell’s span).
As for model A1, we conducted a finite element analysis of 200 samples using stochastic defects to obtain curves for the critical load samples and graphed the probability distributions of the critical load samples using the Gaussian method.
The critical load sample were statistically analyzed and compared with the experimental results. The results are listed in Table 2. The critical load values Pcr in the table were determined according to the “3σ” principle (i.e., 99.87% guarantee rate).
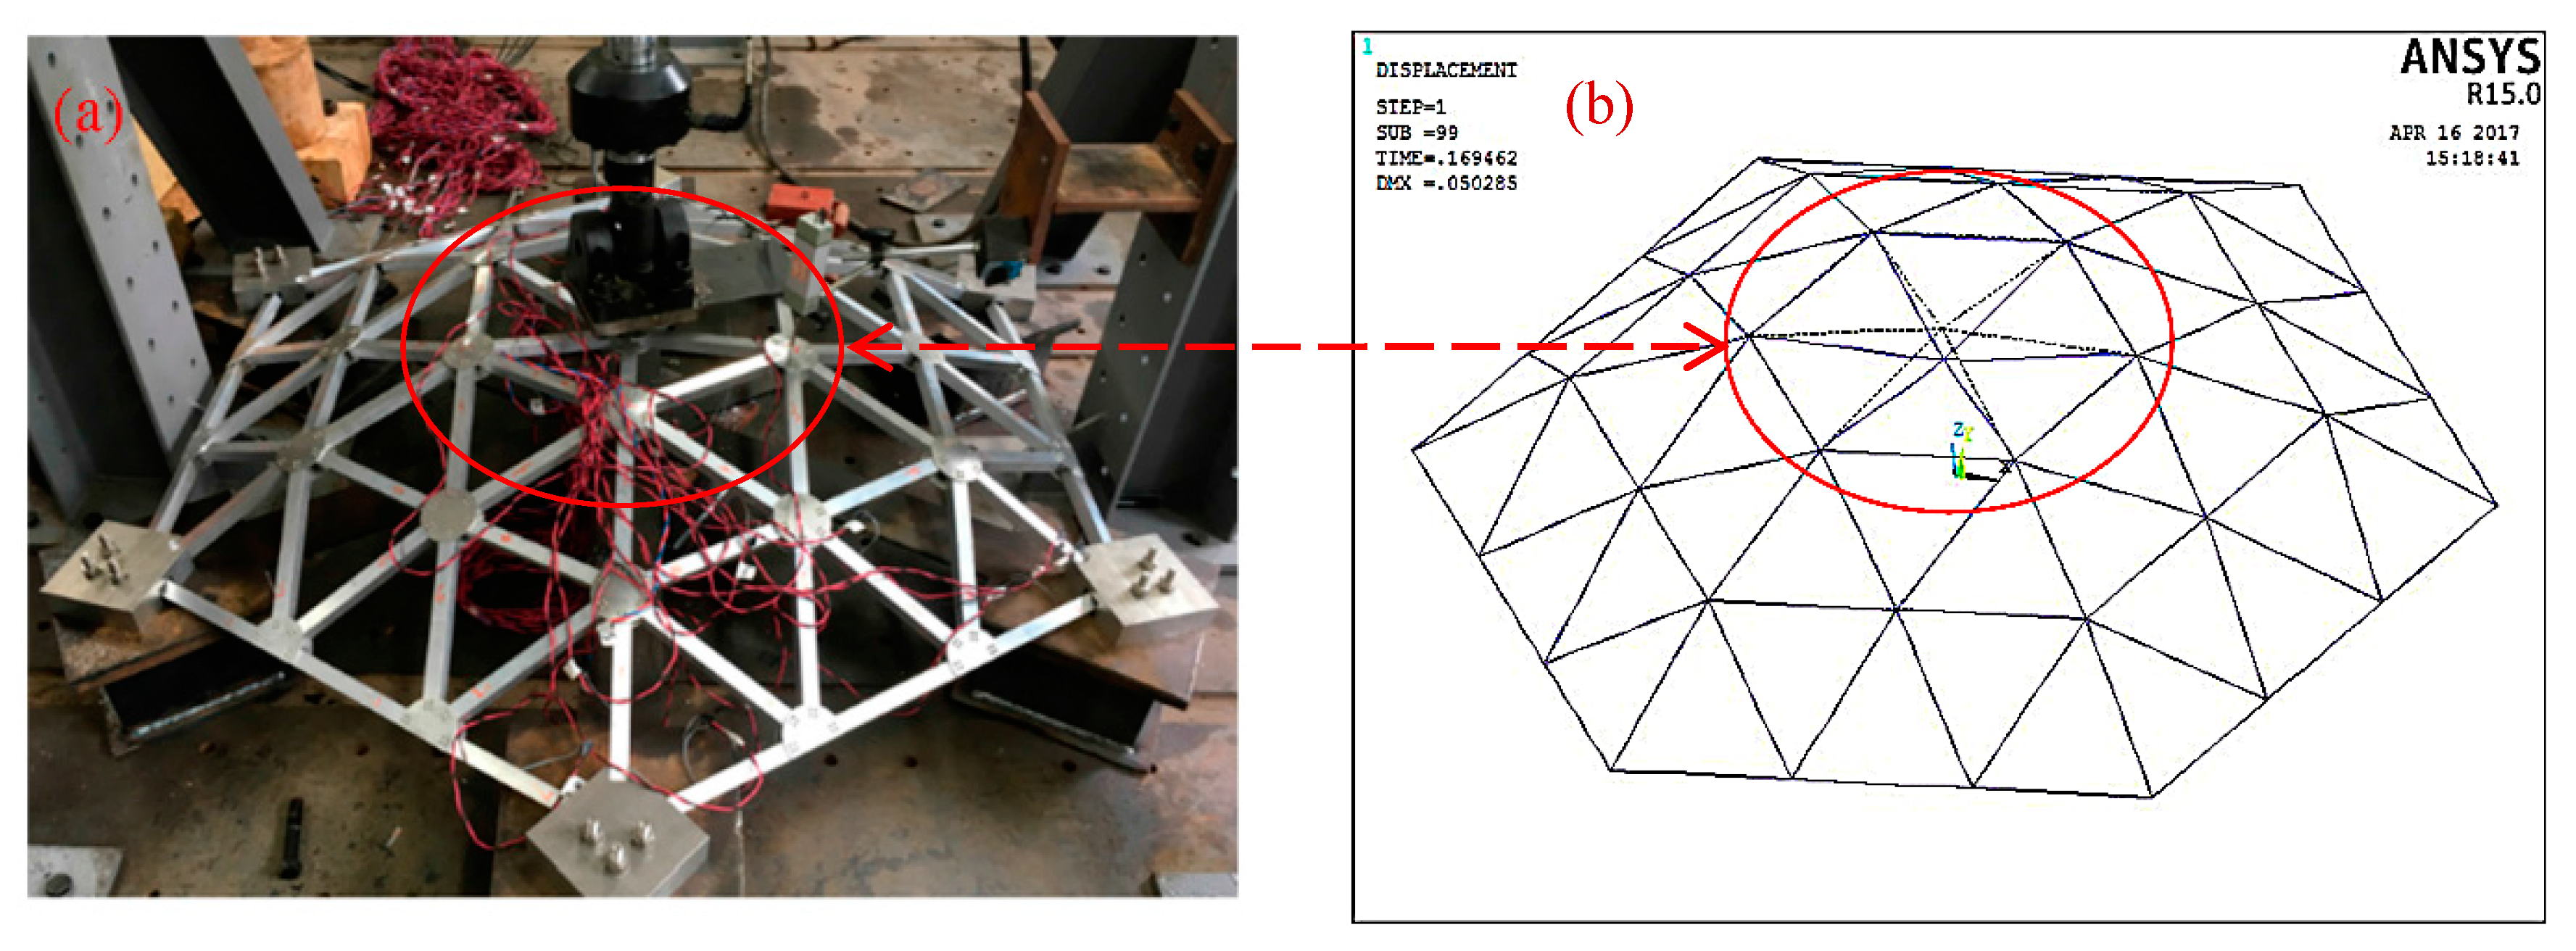
Figure 10 shows that, according to the random defect mode analysis of the combined lattice shell, the predicted theoretical failure pattern (Figure 10b) is very close to the experimental failure pattern (Figure 10a).
Table 3 shows that the results of the finite element analysis of the aluminum alloy lattice shell model obtained using the random defect mode method are very close to the experimental values. In the finite element analysis, the mean critical load and three times the mean square deviation of the standard values are accounted for. The average error of the six models is 5.7%. This can be attributed to the small discrete coefficient and defect amplitude and to the use of a truncated normal distribution for the random defects (i.e., a truncated Gaussian distribution) in this paper. It is apparent that the testing load Pe of the critical load is between Pmax and Pmin.
4. The Stability of NSCLS for Different Defect Sizes
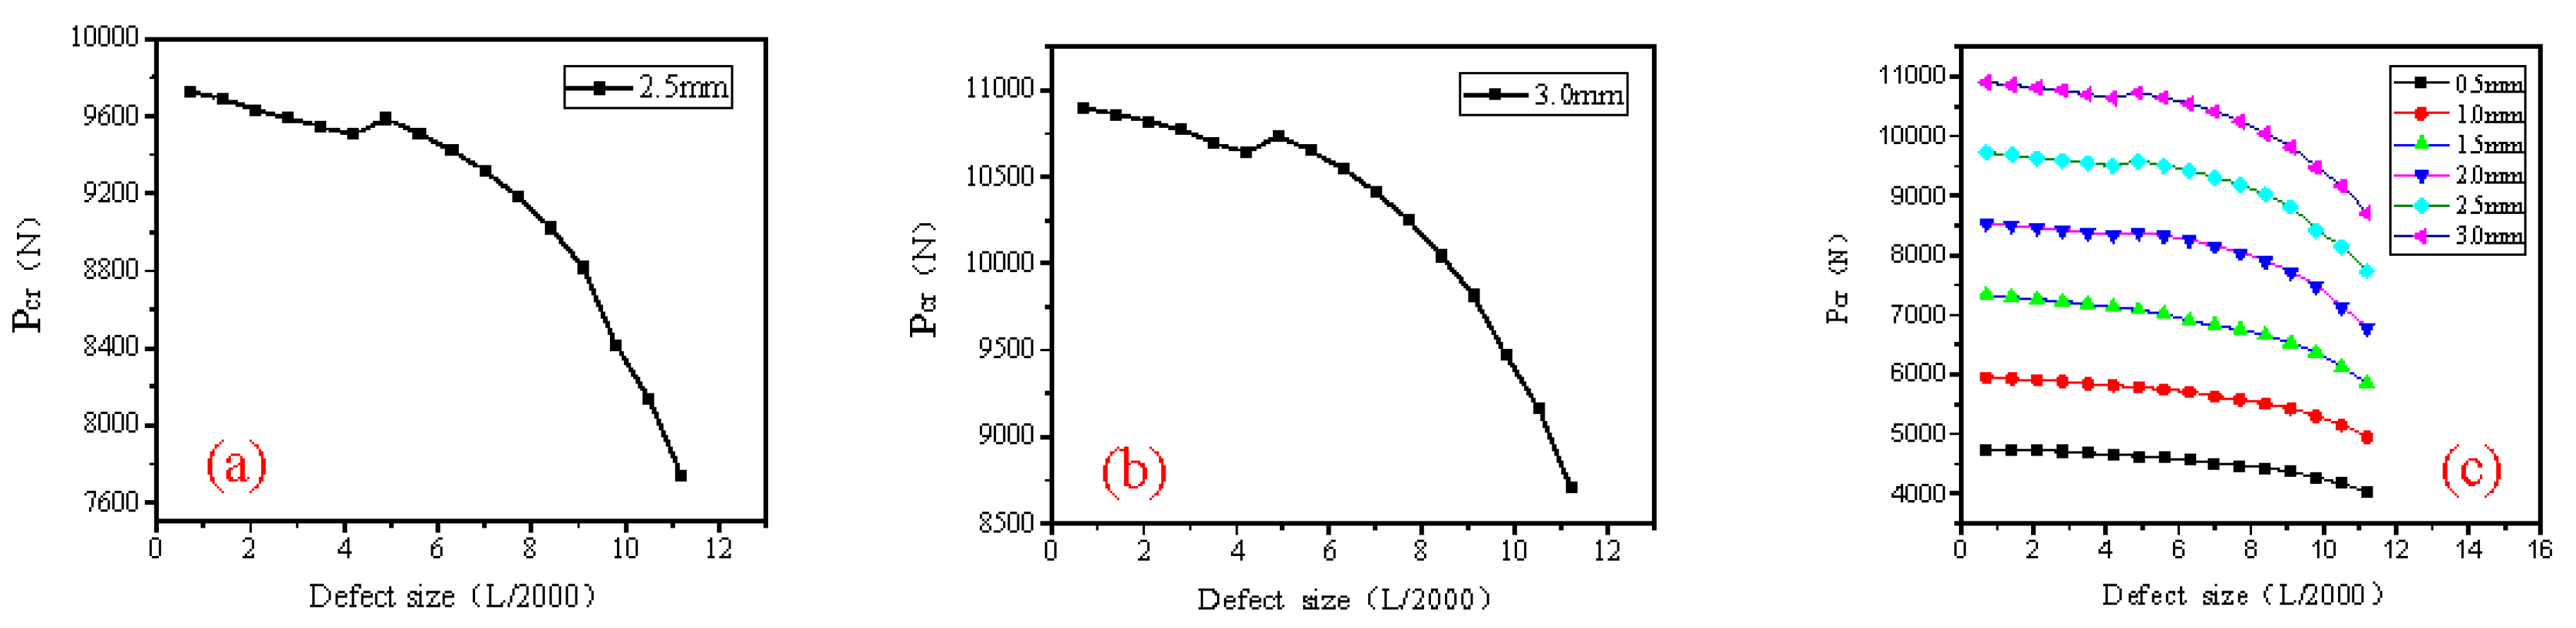
The current Chinese “Technical specification for spatial lattice structures” [27] stipulates that when analyzing the stability of a lattice structure, the maximum initial geometric imperfection size (i.e., the initial deviation of the surface shape) should be set to 1/300 of the lattice shell’s span. However, in this paper, the authors study a new type of single-layer aluminum alloy honeycomb combined lattice shell structure, and we find that the critical load obtained using the uniform defect mode is often not the smallest critical load. This is because the lowest-order buckling mode is frequently unable to characterize the most unfavorable distribution of defects in the structure. Therefore, the current specification of defect sizes may no longer be applicable. Therefore, it is necessary to investigate a reasonable maximum defect size for this type of structure. In this paper, we used the stochastic defect mode method to study the stable bearing capacity of a single-layer aluminum alloy lattice shell structure. To study the influence of different geometric defect sizes and plate thicknesses, the maximum defect sizes ranged from L/2000 to 16L/2000 (a total of 16 parameters), where L was the span of the combined lattice shell structure. The plate thickness was set to 0.5 mm, 1.0 mm, 1.5 mm, 2.0 mm, 2.5 mm, and 3.0 mm. The geometric dimensions and material properties that were used in the computational model were exactly the same as they were in the test model. A nonlinear finite element analysis was performed for lattice shell models with six plate thickness and 16 geometric defect sizes. Calculations were performed for 200 random samples (in total, 6 × 16 × 200 = 19,200 samples).
By processing and analyzing the nearly 20,000 samples discussed above, the authors determined the critical load Pcr by following the “3σ” principle. Figure 11 shows the results. The thickness of the plate and the standard bearing capacity of the structure for different defect sizes are comprehensively accounted for.
Figure 11 shows that the single-layer aluminum alloy combined lattice shell structure is sensitive to defects. As the defect size increases, the stable bearing capacity of the structure obviously decreases. When the defect size is small, i.e., below 6L/2000, the stable bearing capacity of the structure changes approximately linearly with the defect size. The bearing capacity does not change significantly. However, when the defect size exceeds 6L/2000, the stable bearing capacity of the structure decreases nonlinearly with the defect size. The decreasing slope becomes steeper as the defect size continues increasing. Therefore, the authors recommend that when designing NSCLS in the future, the maximum size of the initial geometric imperfections should be held below 3/1000 of the span of the lattice shell.
5. Conclusions
In this paper, the authors propose a new type of lightweight and high-strength aluminum alloy spatial combined lattice shell (referred to as a NSCLS). The authors analyze the structure’s stability using experimental studies and a nonlinear finite element analysis. The following major conclusions are reached:
- (1)
- By precision processing six models using a CNC machine and accounting for the initial geometric defects in the aluminum alloy lattice shell models, the authors performed a stability comparison. The results show that the overall stiffness and stable bearing capacity of the lattice shell are remarkably improved due to the aluminum alloy reinforcing plate. Regardless of whether there are geometric defects, the steady bearing capacity of the new combined lattice shells is approximately 16% higher than that of a lattice shell with the same span and no reinforcing plate. The magnitude of the increase for the lattice shell model with no defects is higher than that of the model with defects.
- (2)
- The NSCLS is a defect-sensitive structure. The influence of geometric defects on its stable bearing capacity is very obvious. The results of comparing the lattice shell models show that the sensitivities of the two types of structures are different. The bearing capacity of the defective model with no plate is approximately 7% lower than that of the model without defects. In the combined lattice shell model, the bearing capacity of the model with defects is 12% lower than that of the model without defects.
- (3)
- The finite element analysis results of applying the random defect mode method show that the theoretical failure patterns of the experimental models are basically consistent with those that were measured in the tests. The average difference between the theoretical stable bearing capacity and the experimental value is 5.7%. The theoretical load-displacement curves are also very close to the ones that were obtained in the tests. This indicates that the random defect mode method with a truncated Gaussian distribution is reasonable and reliable. It has sufficient accuracy. It can be used in structural analysis and design in practical engineering.
- (4)
- As the lowest-order buckling mode is unable to characterize the most unfavorable distribution of defects in the new structure, the critical load obtained using the uniform defect mode is frequently not the smallest critical load. Therefore, the existing specification of defect sizes can no longer be applicable. By calculating and analyzing nearly 20,000 NSCLS, we find that after the initial geometric defect value of the combined lattice shell reaches 3/1000 of the shell’s span, the stable bearing capacity decreases sharply. We recommend that the values be used as the maximum defect size for the combined lattice shell. The studies in this paper provide a theoretical basis for future design specifications for new composite lattice shell structures.
Acknowledgments
This study was supported by the Natural Science Foundation of China under Grant No. 51578136.
Author Contributions
Caiqi Zhao and Yangjian Zhao conceived and designed the experiments; Yangjian Zhao performed the experiments; Jun Ma and Yangjian Zhao analyzed the data; Jun Ma and Caiqi Zhao contributed reagents/materials/analysis tools; Caiqi Zhao wrote the paper.
Conflicts of Interest
The authors declare no conflict of interest.
References
- Ma, Y.X.; Zheng, Y.D.; Meng, H.Y.; Song, W.H.; Yao, X.F.; Lv, H.X. Heterogeneous PVA hydrogels with micro-cells of both positive and negative Poisson’s ratios. J. Mech. Behav. Biomed. Mater. 2013, 23, 22–31. [Google Scholar] [CrossRef] [PubMed]
- Dirks, J.-H.; Dürr, V. Biomechanics of the stick insect antenna: Damping properties and structural correlates of the cuticle. J. Mech. Behav. Biomed. Mater. 2011, 4, 2031–2042. [Google Scholar] [CrossRef] [PubMed]
- Koester, K.J.; Barth, H.D.; Ritchie, R.O. Effect of aging on the transverse toughness of human cortical bone: Evaluation by R-curves. J. Mech. Behav. Biomed. Mater. 2011, 4, 1504–1513. [Google Scholar] [CrossRef] [PubMed]
- Donius, A.E.; Liu, A.; Berglund, L.A.; Ulrike, G.K. Wegst Superior mechanical performance of highly porous, anisotropic nanocellulose–montmorillonite aerogels prepared by freeze casting. J. Mech. Behav. Biomed. Mater. 2014, 37, 88–99. [Google Scholar] [CrossRef] [PubMed]
- Tuo, W.Y.; Chen, J.X.; Wu, Z.S.; Xie, J.; Wang, Y. Characteristics of the tensile mechanical properties of fresh and dry forewings of beetles. Mater. Sci. Eng. C 2016, 65, 51–58. [Google Scholar] [CrossRef] [PubMed]
- Chen, J.X.; Zu, Q.; Wu, G.; Xie, J. Review of beetle forewing structure and biomimetic applications in China(II). Mater. Sci. Eng. C 2015, 50, 620–633. [Google Scholar] [CrossRef] [PubMed]
- Chen, J.X.; Gu, C.; Guo, S.; Wan, C.; Wang, X.; Xie, J.; Hu, X. Integrated honeycomb technology motivated by the structure of beetle forewings. Mater. Sci. Eng. C 2012, 32, 1813–1817. [Google Scholar] [CrossRef]
- Zhang, X.M.; Liu, C.; Chen, J.X.; Tao, Y.; Gu, Y. The influence mechanism of processing holes on the flexural properties of biomimetic integrated honeycomb plates. Mater. Sci. Eng. C 2016, 69, 798–803. [Google Scholar] [CrossRef] [PubMed]
- Chen, J.X.; He, C.L.; Gu, C.L.; Liu, J.X.; Mi, C.W.; Guo, J.S. Compressive and flexural properties biomimetic integrated honeycomb plates. Mater. Des. 2014, 64, 214–220. [Google Scholar] [CrossRef]
- Chen, J.X.; Tuo, W.Y.; Zhang, X.M.; He, C.L.; Xie, J.; Liu, C. Compressive failure modes and parameter optimization of the trabecular structure of biomimetic fully integrated honeycomb plates. Mater. Sci. Eng. C 2016, 69, 255–261. [Google Scholar] [CrossRef] [PubMed]
- Bourada, M.; Tounsi, A.; Houari, M.S.A.; Adda Bedia, E.A. A new four-variable refined plate theory for thermal buckling analysis of functionally graded sandwich plates. J. Sand. Struct. Mater. 2011, 14, 5–33. [Google Scholar] [CrossRef]
- Zyniszewski, S.S.; Smith, B.H.; Hajjar, J.F.; Arwade, S.R.; Schafer, B.W. Local buckling strength of steel foam sandwich panels. Thin-Walled Struct. 2012, 59, 11–19. [Google Scholar] [CrossRef] [Green Version]
- Katunin, A. Vibration-based spatial damage identification in honeycomb-core sandwich composite structures using wavelet analysis. J. Compos. Struct. 2014, 118, 385–391. [Google Scholar] [CrossRef]
- Zhao, C.Q.; Ma, J. Assembled Honeycombed Sheet Light Empty Stomach Building and Roof Structure System. Patent Application No. 200810100745.X, 21 April 2010. [Google Scholar]
- Zhao, C.Q.; Ma, J.; Tao, J. Experimental study on load capacity of new fabricated honeycomb panel open-web roof structures. J. Southeast Univ. (Nat. Sci. Ed.) 2014, 44, 626–630. [Google Scholar]
- Zhao, C.Q.; Zheng, W.D.; Ma, J.; Zhao, Y.J. Lateral compressive buckling performance of aluminum honeycomb panels for long-span hollow core roofs. Materials 2016, 9, 444. [Google Scholar] [CrossRef] [PubMed]
- Zhao, C.Q.; Zheng, W.D.; Ma, J.; Zhao, Y.J. Shear strength of different bolt connectors on large span aluminium alloy honeycomb sandwich structure. Appl. Sci. 2017, 7, 450. [Google Scholar] [CrossRef]
- Liu, H.B.; Ding, Y.Z.; Chen, Z.H. Static stability behavior of aluminum alloy single-layer spherical latticed shell structure with Temcor joints. Thin-Walled Struct. 2017, 46, 82–89. [Google Scholar] [CrossRef]
- Sugizaki, K.; Kohmura, S.; Hangai, Y. Experimental study on structural behaviour of an aluminum single-layer lattice shell. Trans. AIJ 1996, 61, 113–122. [Google Scholar] [CrossRef]
- Hiyama, Y.; Takashima, H.; Iijima, T. Experiments and analyses of unit single-layer reticular domes using aluminum ball joints for the connections. Trans. AIJ 1999, 64, 33–40. [Google Scholar] [CrossRef]
- Guo, H.N.; Xiong, Z.; Luo, Y.F. Block tearing and local buckling of aluminum alloy gusset joint plates. KSCE J. Civ. Eng. 2016, 20, 820–831. [Google Scholar] [CrossRef]
- Zhang, Z.C.; Wang, X.D. Structural design and analysis of aluminum dome for Caofeidian coal storage. Key Eng. Mater. 2016, 710, 396–401. [Google Scholar] [CrossRef]
- Gui, G.Q.; Wang, Y.E. Nonlinear stability analysis of single-layer aluminum alloy reticulated spherical shells. Eng. Mech. 2006, 23, 32–35. [Google Scholar]
- Attard, M.M.; Hunt, G.W. Sandwich Column Buckling: A Hyperelastic Formulation. J. Solids Struct. 2008, 45, 5540–5555. [Google Scholar] [CrossRef]
- Boudjemai, A.; Amri, R.; Mankour, A.; Salem, H.; Bouanane, M.H.; Boutchicha, D. Modal analysis and testing of hexagonal honeycomb plates used for satellite structural design. Mater. Des. 2012, 35, 266–275. [Google Scholar] [CrossRef]
- Ravishankar, B.; Sankar, B.V.; Haftka, R.T. Homogenization of integrated thermal protection system with rigid insulation bars. In Proceedings of the 51st AIAA/ASCE/AHS/ASC Structures, Structural Dynamics and Materials Conference, Orlando, FL, USA, 12–15 April 2010; American Institute of Aeronautics and Astronautics: Boston, MA, USA, 2010. [Google Scholar]
- Standardization Administration of China JGJ7-2010. Technical Specification for Spatial Lattice Structures; Standard Press of China: Beijing, China, 2010. [Google Scholar]
Figure 1.
Schematic diagram of a large-span single-layer aluminum alloy honeycomb panel combined lattice shell: (a) The overall structure; (b) A local area, magnified.
Figure 1.
Schematic diagram of a large-span single-layer aluminum alloy honeycomb panel combined lattice shell: (a) The overall structure; (b) A local area, magnified.
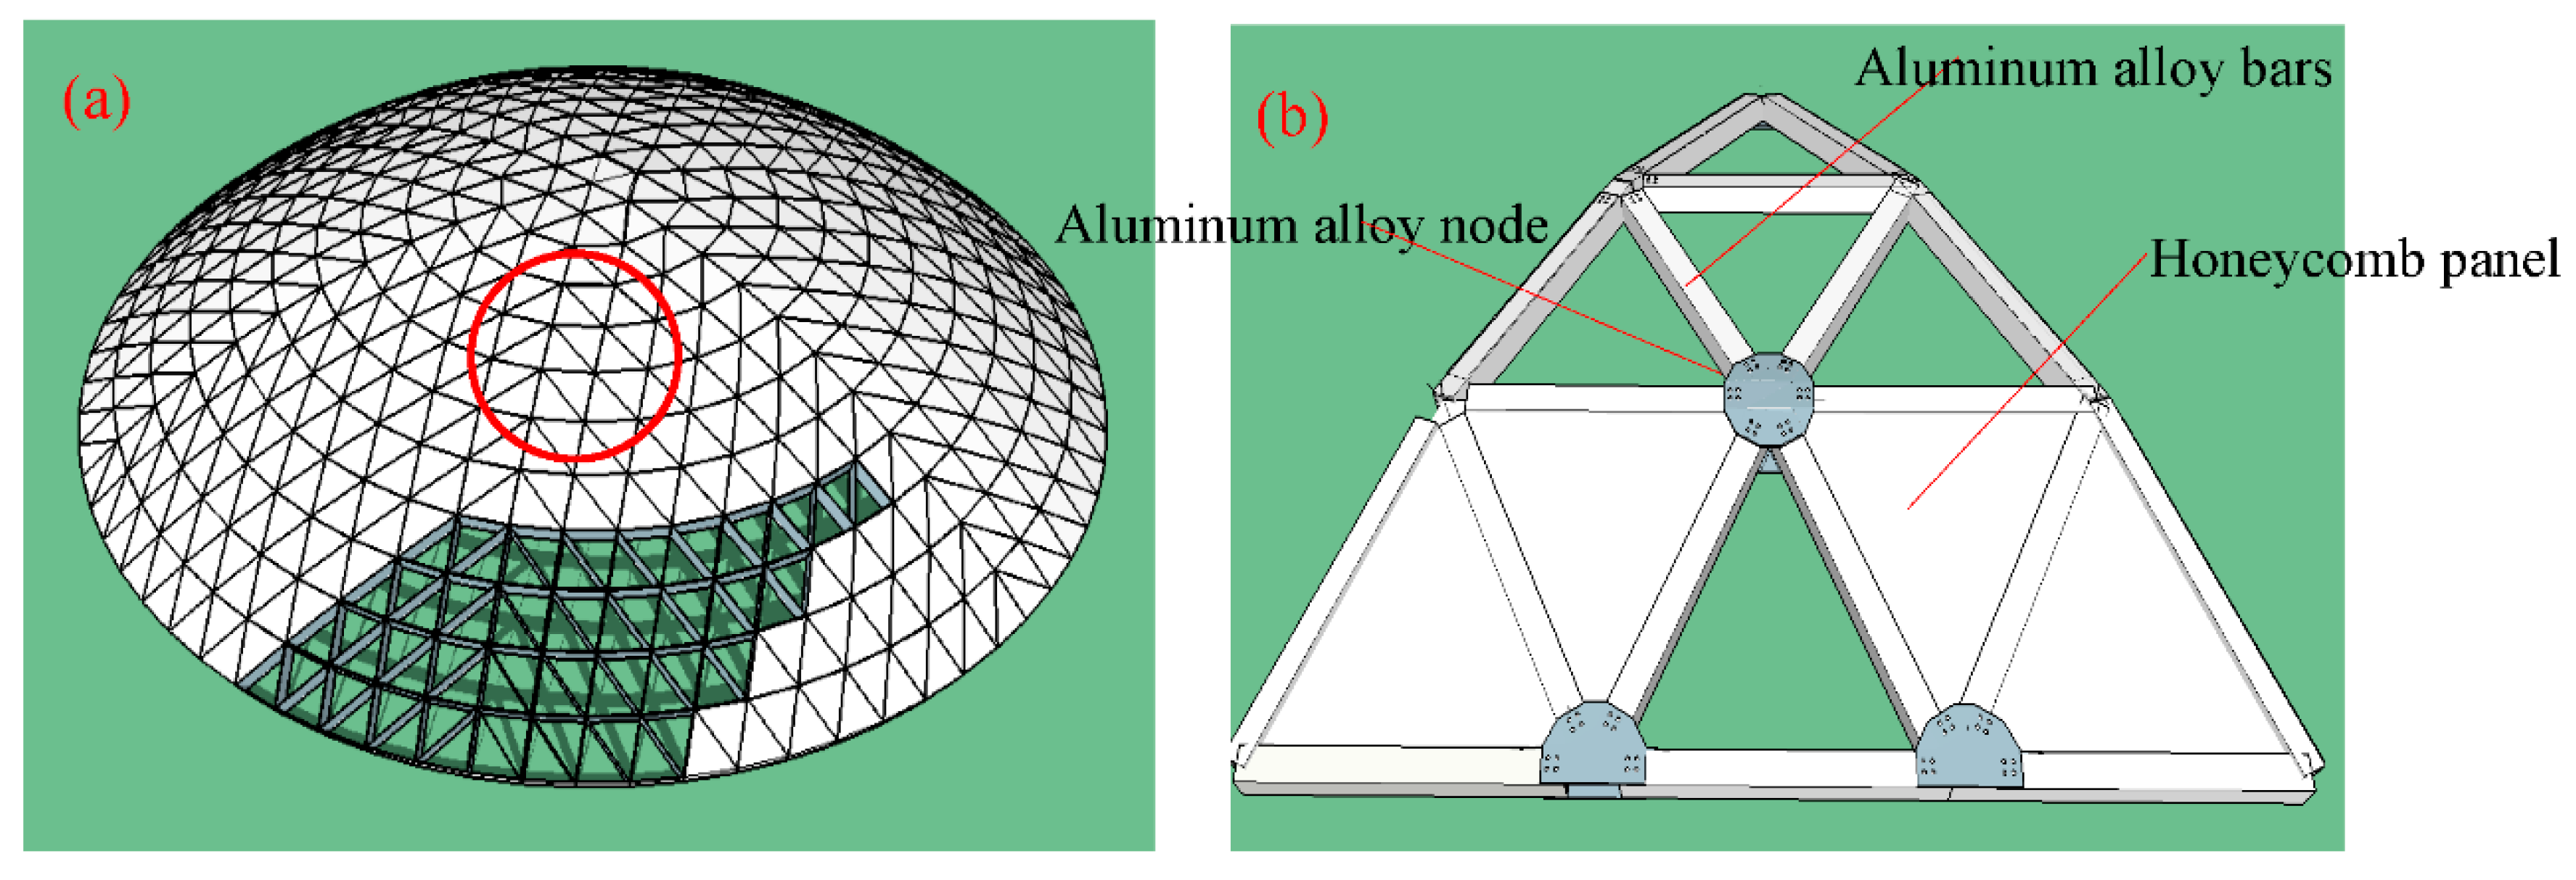
Figure 2.
Overview of the test model: (a,b) Lattice shell model without aluminum plate (A1, A2, and A3); (c,d) Combined lattice shell model (B1, B2, and B3); (e) Node in the middle; (f) Supporting node; (g) Plan view of the model; and, (h) Side view of the model.
Figure 2.
Overview of the test model: (a,b) Lattice shell model without aluminum plate (A1, A2, and A3); (c,d) Combined lattice shell model (B1, B2, and B3); (e) Node in the middle; (f) Supporting node; (g) Plan view of the model; and, (h) Side view of the model.

Figure 3.
The strain gauge layout and the testing site: (a) Strain gauge locations; (b) Rosette strain gage locations; and, (c) The testing site.
Figure 3.
The strain gauge layout and the testing site: (a) Strain gauge locations; (b) Rosette strain gage locations; and, (c) The testing site.
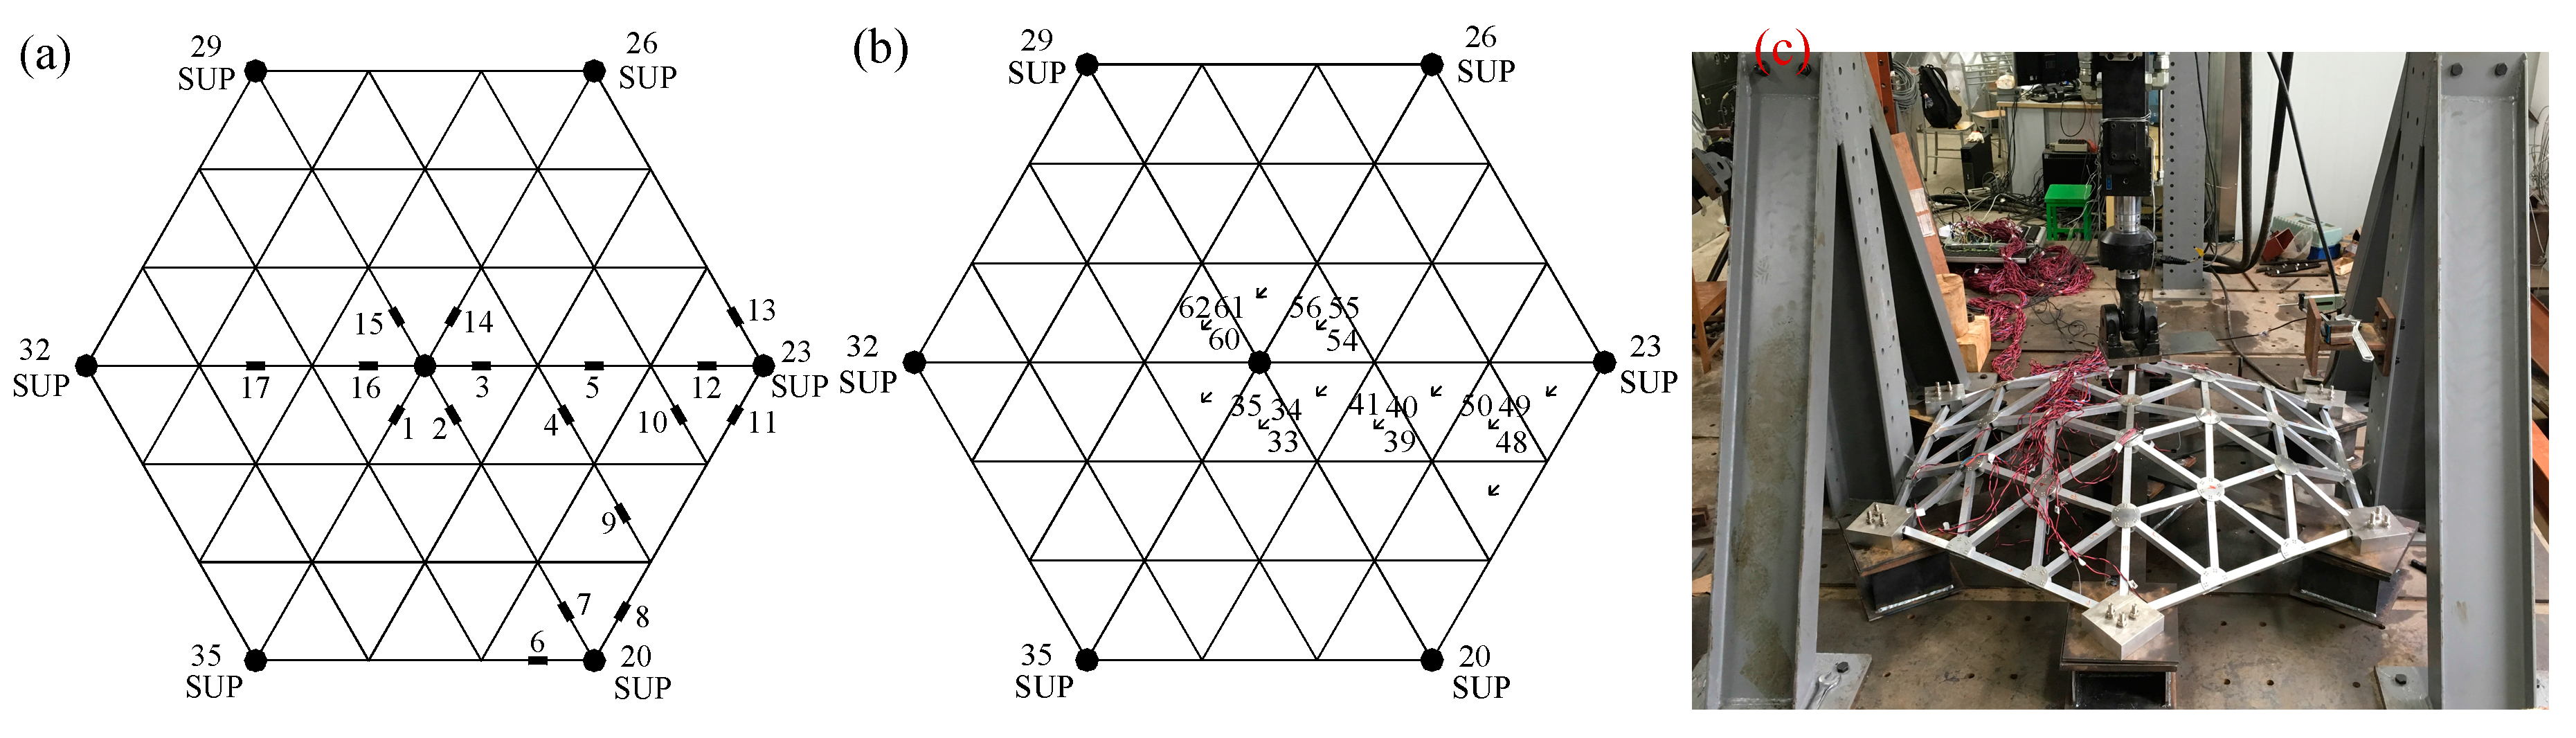
Figure 4.
Failure patterns of the lattice shell model without aluminum alloy plates: (a) The overall failure profile; (b) The amplified profile of a local destabilization area.
Figure 4.
Failure patterns of the lattice shell model without aluminum alloy plates: (a) The overall failure profile; (b) The amplified profile of a local destabilization area.

Figure 5.
Failure modes of the combined lattice shell model: (a) The overall failure profile; (b) The amplified profile of a local destabilization area.
Figure 5.
Failure modes of the combined lattice shell model: (a) The overall failure profile; (b) The amplified profile of a local destabilization area.

Figure 6.
Load-displacement curves at the loading points of the test models: (a) Curves for the lattice shell models without reinforcing plates; (b) Curves for the combined lattice shell models; and, (c) Curves for the six test models.
Figure 6.
Load-displacement curves at the loading points of the test models: (a) Curves for the lattice shell models without reinforcing plates; (b) Curves for the combined lattice shell models; and, (c) Curves for the six test models.

Figure 7.
The mean and mean square deviation of the critical load samples for model A1: (a) Mean; (b) Mean square deviation.
Figure 7.
The mean and mean square deviation of the critical load samples for model A1: (a) Mean; (b) Mean square deviation.

Figure 8.
History and probability distribution for the critical load of model A1: (a) History; (b) Probability distribution according to the Gaussian method.
Figure 8.
History and probability distribution for the critical load of model A1: (a) History; (b) Probability distribution according to the Gaussian method.

Figure 9.
Comparison of the failure patterns of the test model with no plate (A1): (a) Measured failure profile; (b) Theoretical failure profile.
Figure 9.
Comparison of the failure patterns of the test model with no plate (A1): (a) Measured failure profile; (b) Theoretical failure profile.

Figure 10.
Comparison of the failure modes of the combined lattice shell, model B2: (a) Measured failure pattern; (b) Theoretical failure pattern.
Figure 10.
Comparison of the failure modes of the combined lattice shell, model B2: (a) Measured failure pattern; (b) Theoretical failure pattern.
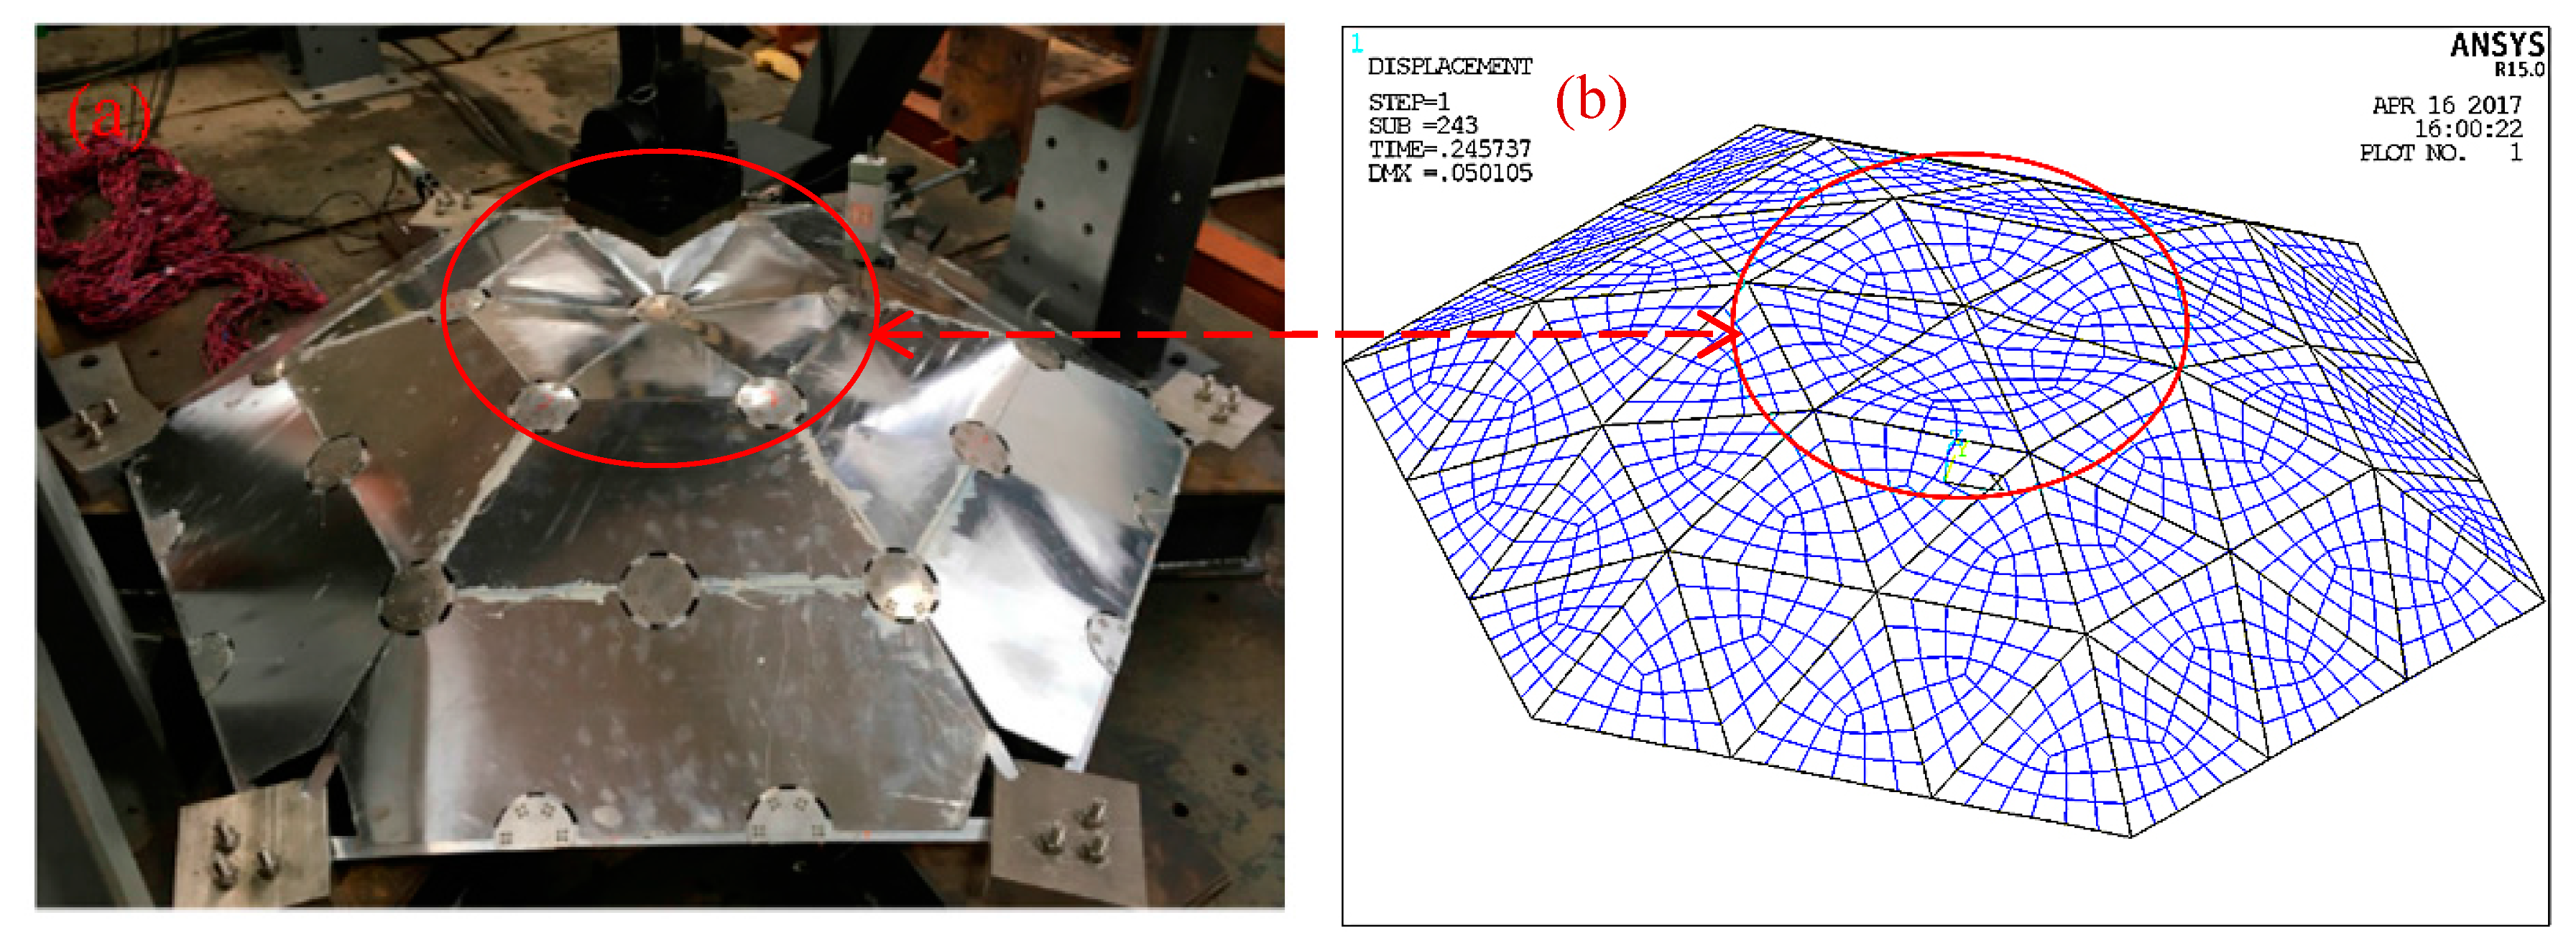
Figure 11.
The critical load for different defect sizes for the lattice shell models with different plate thicknesses: (a) Model with a plate thickness of 2.5 mm; (b) Model with a plate thickness of 3.0 mm; and, (c) Combined lattice shell models with different plate thicknesses.
Figure 11.
The critical load for different defect sizes for the lattice shell models with different plate thicknesses: (a) Model with a plate thickness of 2.5 mm; (b) Model with a plate thickness of 3.0 mm; and, (c) Combined lattice shell models with different plate thicknesses.


Table 1.
Comparison of the results obtained using the random defect mode analysis and the measured values for A1.
Table 1.
Comparison of the results obtained using the random defect mode analysis and the measured values for A1.
| Pe/N | Dmax/mm | Cd | Pmax/N | Pmin/N | Pμ/N | Pσ/N | Pcr |
|---|---|---|---|---|---|---|---|
| 4879 | 1.4 | 0.423 | 5376 | 4617 | 4962 | 152 | 4506 |
In the table: Pe—The test value of the critical load; Dmax—The maximum defect size; Cd—The discrete coefficient; Pmax—The maximum of the critical load samples; Pmin—The minimum of the critical load samples; Pμ—The mean of the critical load samples; Pσ—The mean square deviation of the critical load samples; Pcr—The standard value of the critical load (3 times the mean square deviation is accounted for).
Table 2.
Comparison of the results obtained from the random defect mode analysis and the measured values for B2.
Table 2.
Comparison of the results obtained from the random defect mode analysis and the measured values for B2.
| Pe/N | Dmax/mm | Cd | Pmax/N | Pmin/N | Pμ/N | Pσ/N | Pcr |
|---|---|---|---|---|---|---|---|
| 5058 | 1.4 | 0.423 | 6210 | 3787 | 5256 | 220 | 4596 |
Table 3.
Comparison of the critical load of the lattice shell with no plate and the combined lattice shell.
Table 3.
Comparison of the critical load of the lattice shell with no plate and the combined lattice shell.
| Model Configuration | Lattice Shell with No Plate | Combined Lattice Shell | ||||
|---|---|---|---|---|---|---|
| Experimental Value (N) | Simulated Value (N) | Error (%) | Experimental Value (N) | Simulated Value (N) | Error (%) | |
| Without defects | 4879 | 4506 | 7.6 | 5761 | 5947 | 3.2 |
| 4601 | 2.1 | 5556 | 6.6 | |||
| With defects | 4652 | 4305 | 7.5 | 4958 | 4596 | 7.3 |
© 2017 by the authors. Licensee MDPI, Basel, Switzerland. This article is an open access article distributed under the terms and conditions of the Creative Commons Attribution (CC BY) license (http://creativecommons.org/licenses/by/4.0/).
Share and Cite
MDPI and ACS Style
Zhao, C.; Zhao, Y.; Ma, J. The Stability of New Single-Layer Combined Lattice Shell Based on Aluminum Alloy Honeycomb Panels. Appl. Sci. 2017, 7, 1150. https://doi.org/10.3390/app7111150
AMA Style
Zhao C, Zhao Y, Ma J. The Stability of New Single-Layer Combined Lattice Shell Based on Aluminum Alloy Honeycomb Panels. Applied Sciences. 2017; 7(11):1150. https://doi.org/10.3390/app7111150
Chicago/Turabian StyleZhao, Caiqi, Yangjian Zhao, and Jun Ma. 2017. "The Stability of New Single-Layer Combined Lattice Shell Based on Aluminum Alloy Honeycomb Panels" Applied Sciences 7, no. 11: 1150. https://doi.org/10.3390/app7111150
Note that from the first issue of 2016, this journal uses article numbers instead of page numbers. See further details here.