Elastic Stability of Perforated Plates Strengthened with FRP under Uniaxial Compression

Key Laboratory of Concrete and Prestressed Concrete Structures of Ministry of Education, Southeast University, Nanjing 210096, China
*
Author to whom correspondence should be addressed.
Appl. Sci. 2017, 7(11), 1188; https://doi.org/10.3390/app7111188
Submission received: 18 October 2017
/
Revised: 8 November 2017
/
Accepted: 13 November 2017
/
Published: 18 November 2017
(This article belongs to the Special Issue Soft Computing Techniques in Structural Engineering and Materials)
Abstract
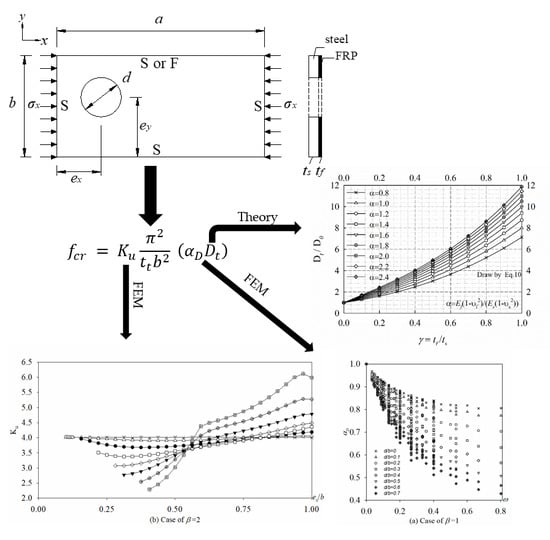
:Openings are frequently introduced in plates for the purpose of inspection, maintenance, service, etc. The presence of openings reduces the buckling and ultimate capacity significantly, and pasting fiber-reinforced polymers (FRP) is an ideal technique for postponing the buckling and increasing the ultimate capacity of the plates. In this paper, the finite element (FE) method has been employed to study the buckling stress of the perforated plates strengthened with FRP under uniaxial compression, and several parameters are considered: material’s geometrical and mechanical properties, boundary conditions, plate aspect ratio, hole sizes, and hole position. Then a method of calculating the buckling stress is proposed and modified based on the theory of composite plate and the numerical results. The study shows that, the stiffness modified factor αD, which considers the orthotropic properties of FRP are a function of the reinforcement index ω and hole size d/b for Boundary conditions (BCs) of 4S and 3S1F. And it is recommended to place the big hole close to the middle area of the plate in x-axis. It also shows that for a small hole size, there is little effect of the hole position ey/b on buckling coefficient Ku regardless of the BCs, and that effect becomes more pronounced as d/b increases, so it is recommended to put the holes near the middle of the plate for 4S and the simple support edge for 3S1F in y-axis.
1. Introduction
Thin steel plate elements are the main structural components of decks and platforms on ships, webs and flanges of plate and box girder bridges, platforms of offshore structures, and architecture structure [1]. Openings are frequently introduced in plates for the purpose of inspection, maintenance, service, etc. [2]. In such cases, the presence of openings redistributes the membrane stresses in the plates and reduces their buckling and compression capacity significantly [3,4,5]. The reduced buckling strength of the perforated plate may be insufficient to meet the requirements of normal structural serviceability and safety. In this situation, it is necessary and important to develop a method to improve the buckling and ultimate strength of perforated steel plates.
Fiber-reinforced polymer (FRP) has large strength to weight ratios, excellent resistance to corrosion and environmental degradation. It is also very flexible to be formed into any desired shape and easy to be handled during construction. Therefore, FRP has been widely used in strengthening steel structures. In recent years, there have been a number of studies on strengthening steel structures, particularly compressed thin-walled structures. Shaat and Fam [6,7,8,9] tested hollow structural steel (HSS) specimens strengthened with carbon fiber-reinforced polymers (CFRP) to study the influence on local and global buckling behavior and column strength. The test indicated that the transverse CFRP layers can help restrain outward directed local buckling of two opposite sides for short columns. Harris [10] employed the strengthening technique of externally bonding FRP sheets to selected sides of steel T-sections in order to improve global and local buckling behavior, and the results show that FRP material provides “bracing” against the local buckling. Haedir and Zhao [11] tested ten short cold-formed steel circular hollow section (CHS) columns with externally bonded hoop and longitudinal CFRP, the results show that the reinforcing hoop fibers provide better restraining force to postpone the steel skin buckling when the local slenderness ratio is higher, it also shows that the use of a combination of hoop and longitudinal CFRP in a slender tube can promote the attainment of the yield capacity of the bare tube. Bambach [12,13,14] tests a CFRP wrapped square hollow sections (SHS) columns with width-to-thickness ratio varying from 12.5 to 120. The experimental results show that the axial capacity of the wrapped SHS is up to twice of that without wrapping the CFRP, due to the restraining on the development of elastic buckling deflections from the wrapping CFRP. The critical stress is up to four times of that of the steel section due to this restraining effect. Moreover, a design method is developed whereby the theoretical elastic critical stress of the composite steel–CFRP sections developed by Pister and Dong [15] is used to determine the buckling load and the ultimate load.
The previous description shows that openings are frequently introduced in plates and the application of FRP is an ideal technique for postponing the local buckling and increasing the ultimate capacity of the steel structure. However, the researches on pasting FRP sheets for improving the degraded buckling of perforated plates are not investigated in the published literatures. Therefore, the objective of the present paper is to investigate the material’s geometrical and mechanical properties, boundary conditions, a plate aspect ratio, hole sizes, and hole position on elastic buckling of perforated plates strengthened with FRP under uniaxial compression. And a calculation method of buckling stress is proposed and modified based on the theory of composite plate and the numerical results.
2. Problem Definition
2.1. Basic Information
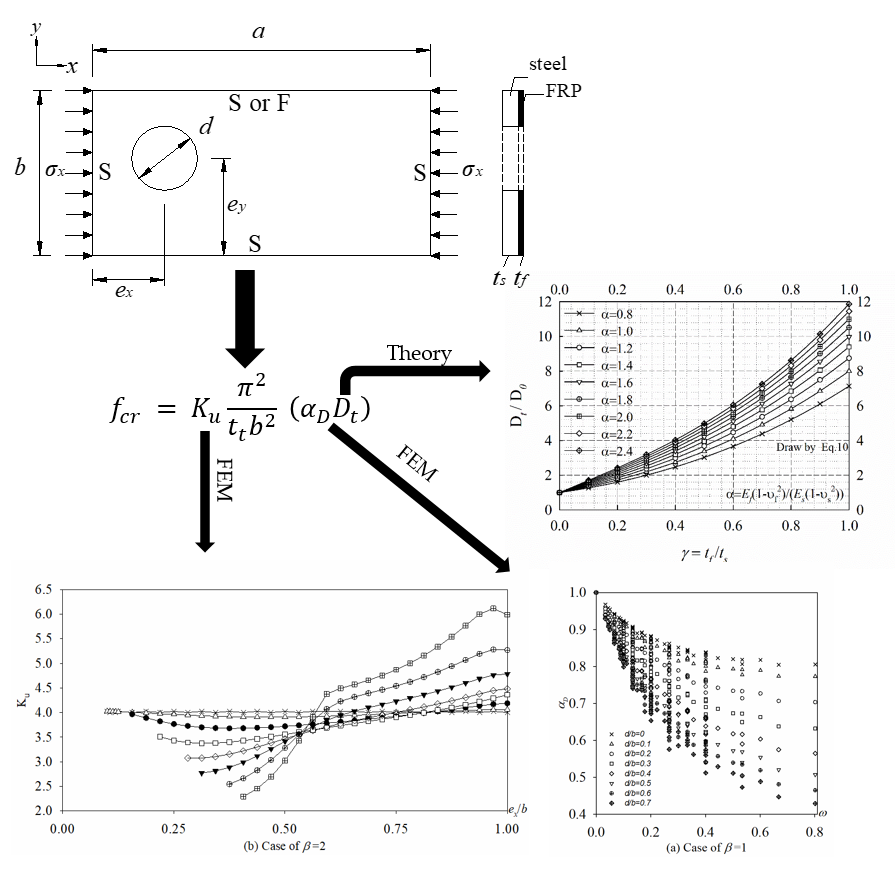
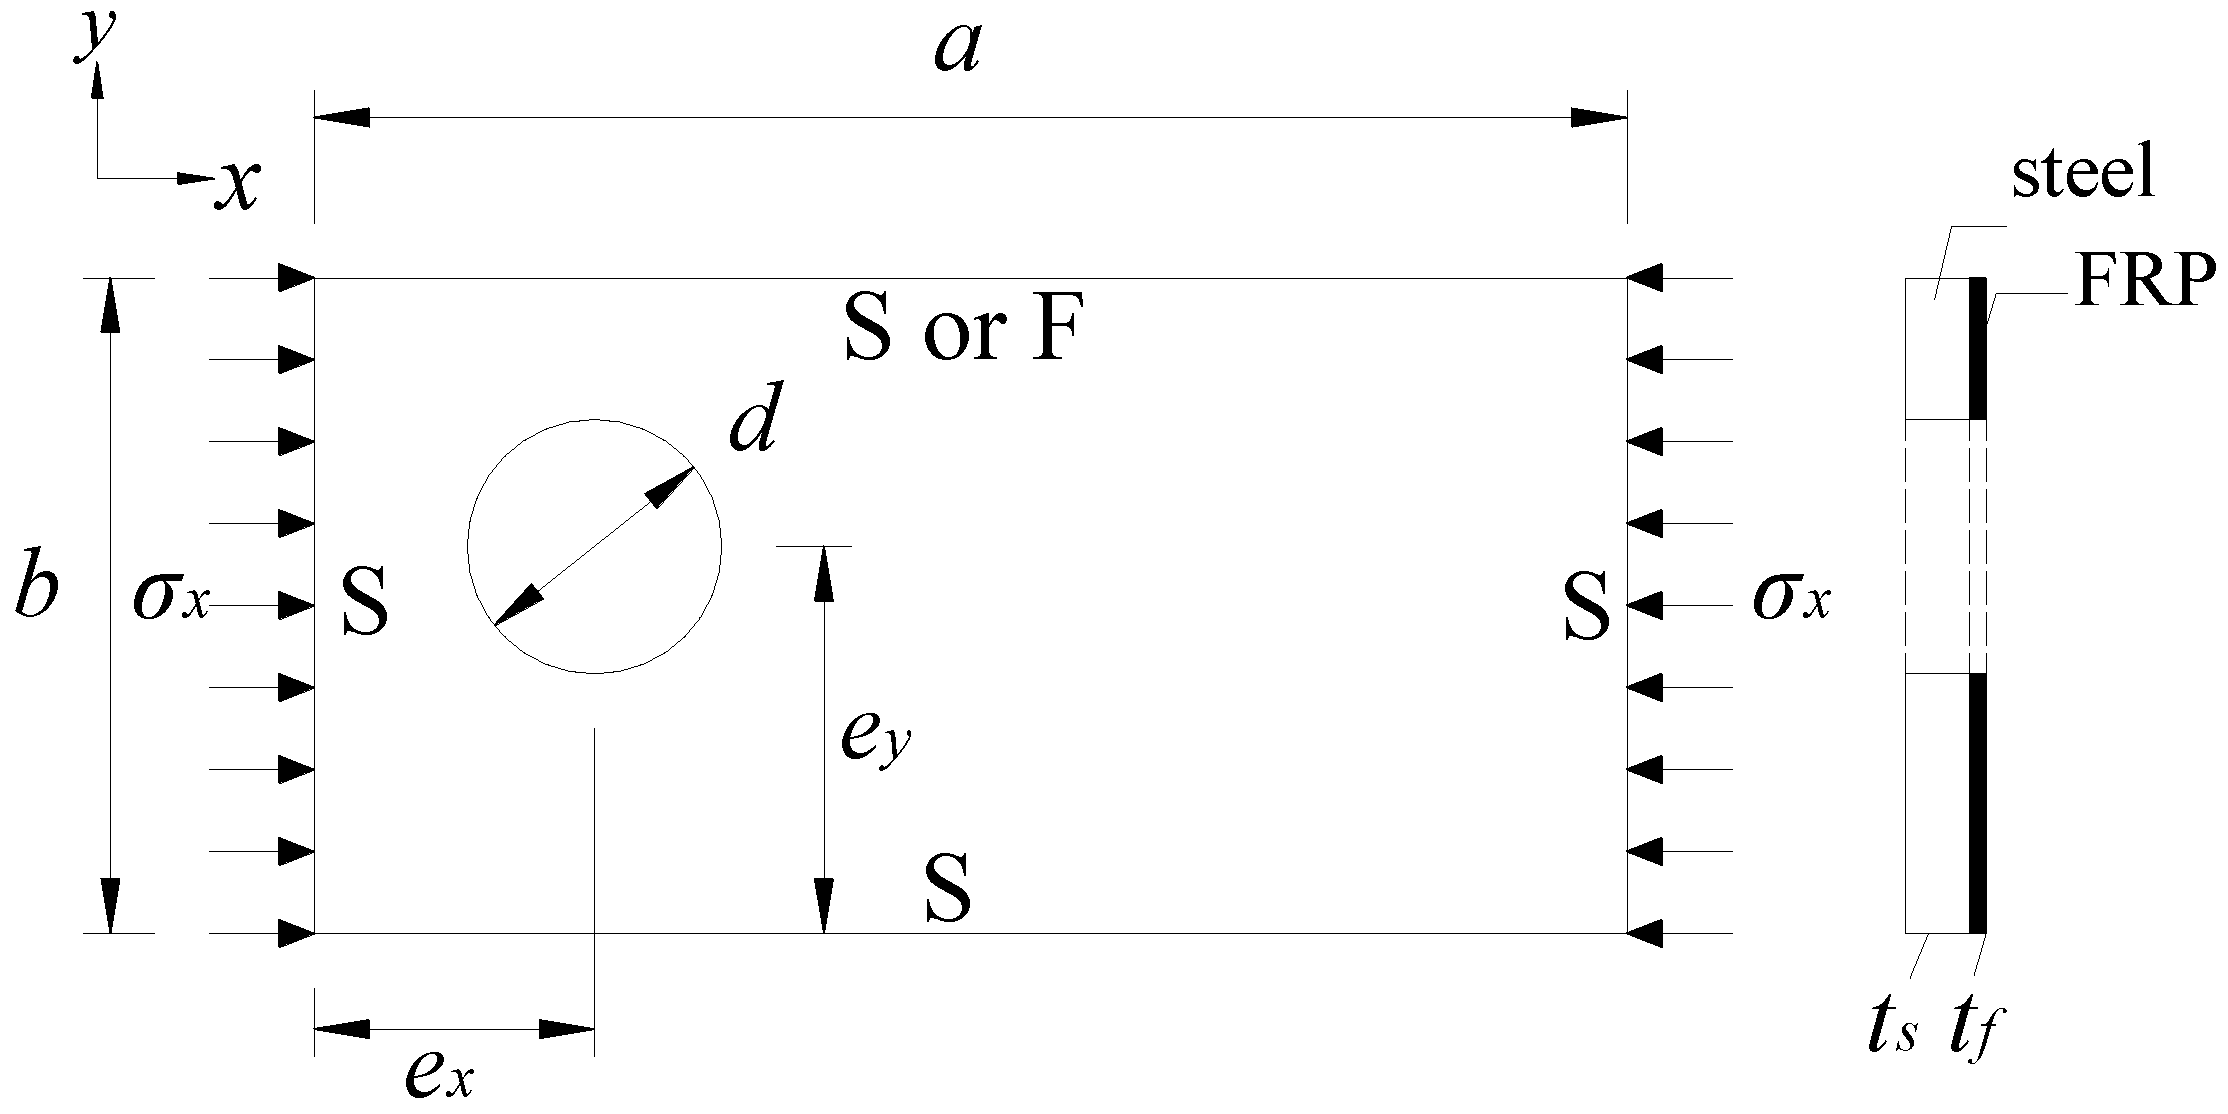
The problem of elastic buckling of perforated plates strengthened with FRP under uniaxial compression (Figure 1) is investigated in this study. The lengths of the plate in the longitudinal and transverse directions are a and b (in this paper, equal to 240 mm), respectively. The thicknesses of the steel plate and FRP sheet are ts and tf (single layer of FRP sheet’s thickness tf0 = 0.167 mm and FRP Layers’ number is nf), respectively. The hole has a diameter d, and ex (ey) is the distance along x-axis (y-axis) from the center of the hole to the left (bottom) edge. The elastic modulus of steel and FRP is Ef and Es, respectively. The Poisson ratio of FRP and steel is νf (equal to 0.25) and νs (equal to 0.3), respectively.
2.2. Boundary Conditions (BCs) of the Plate
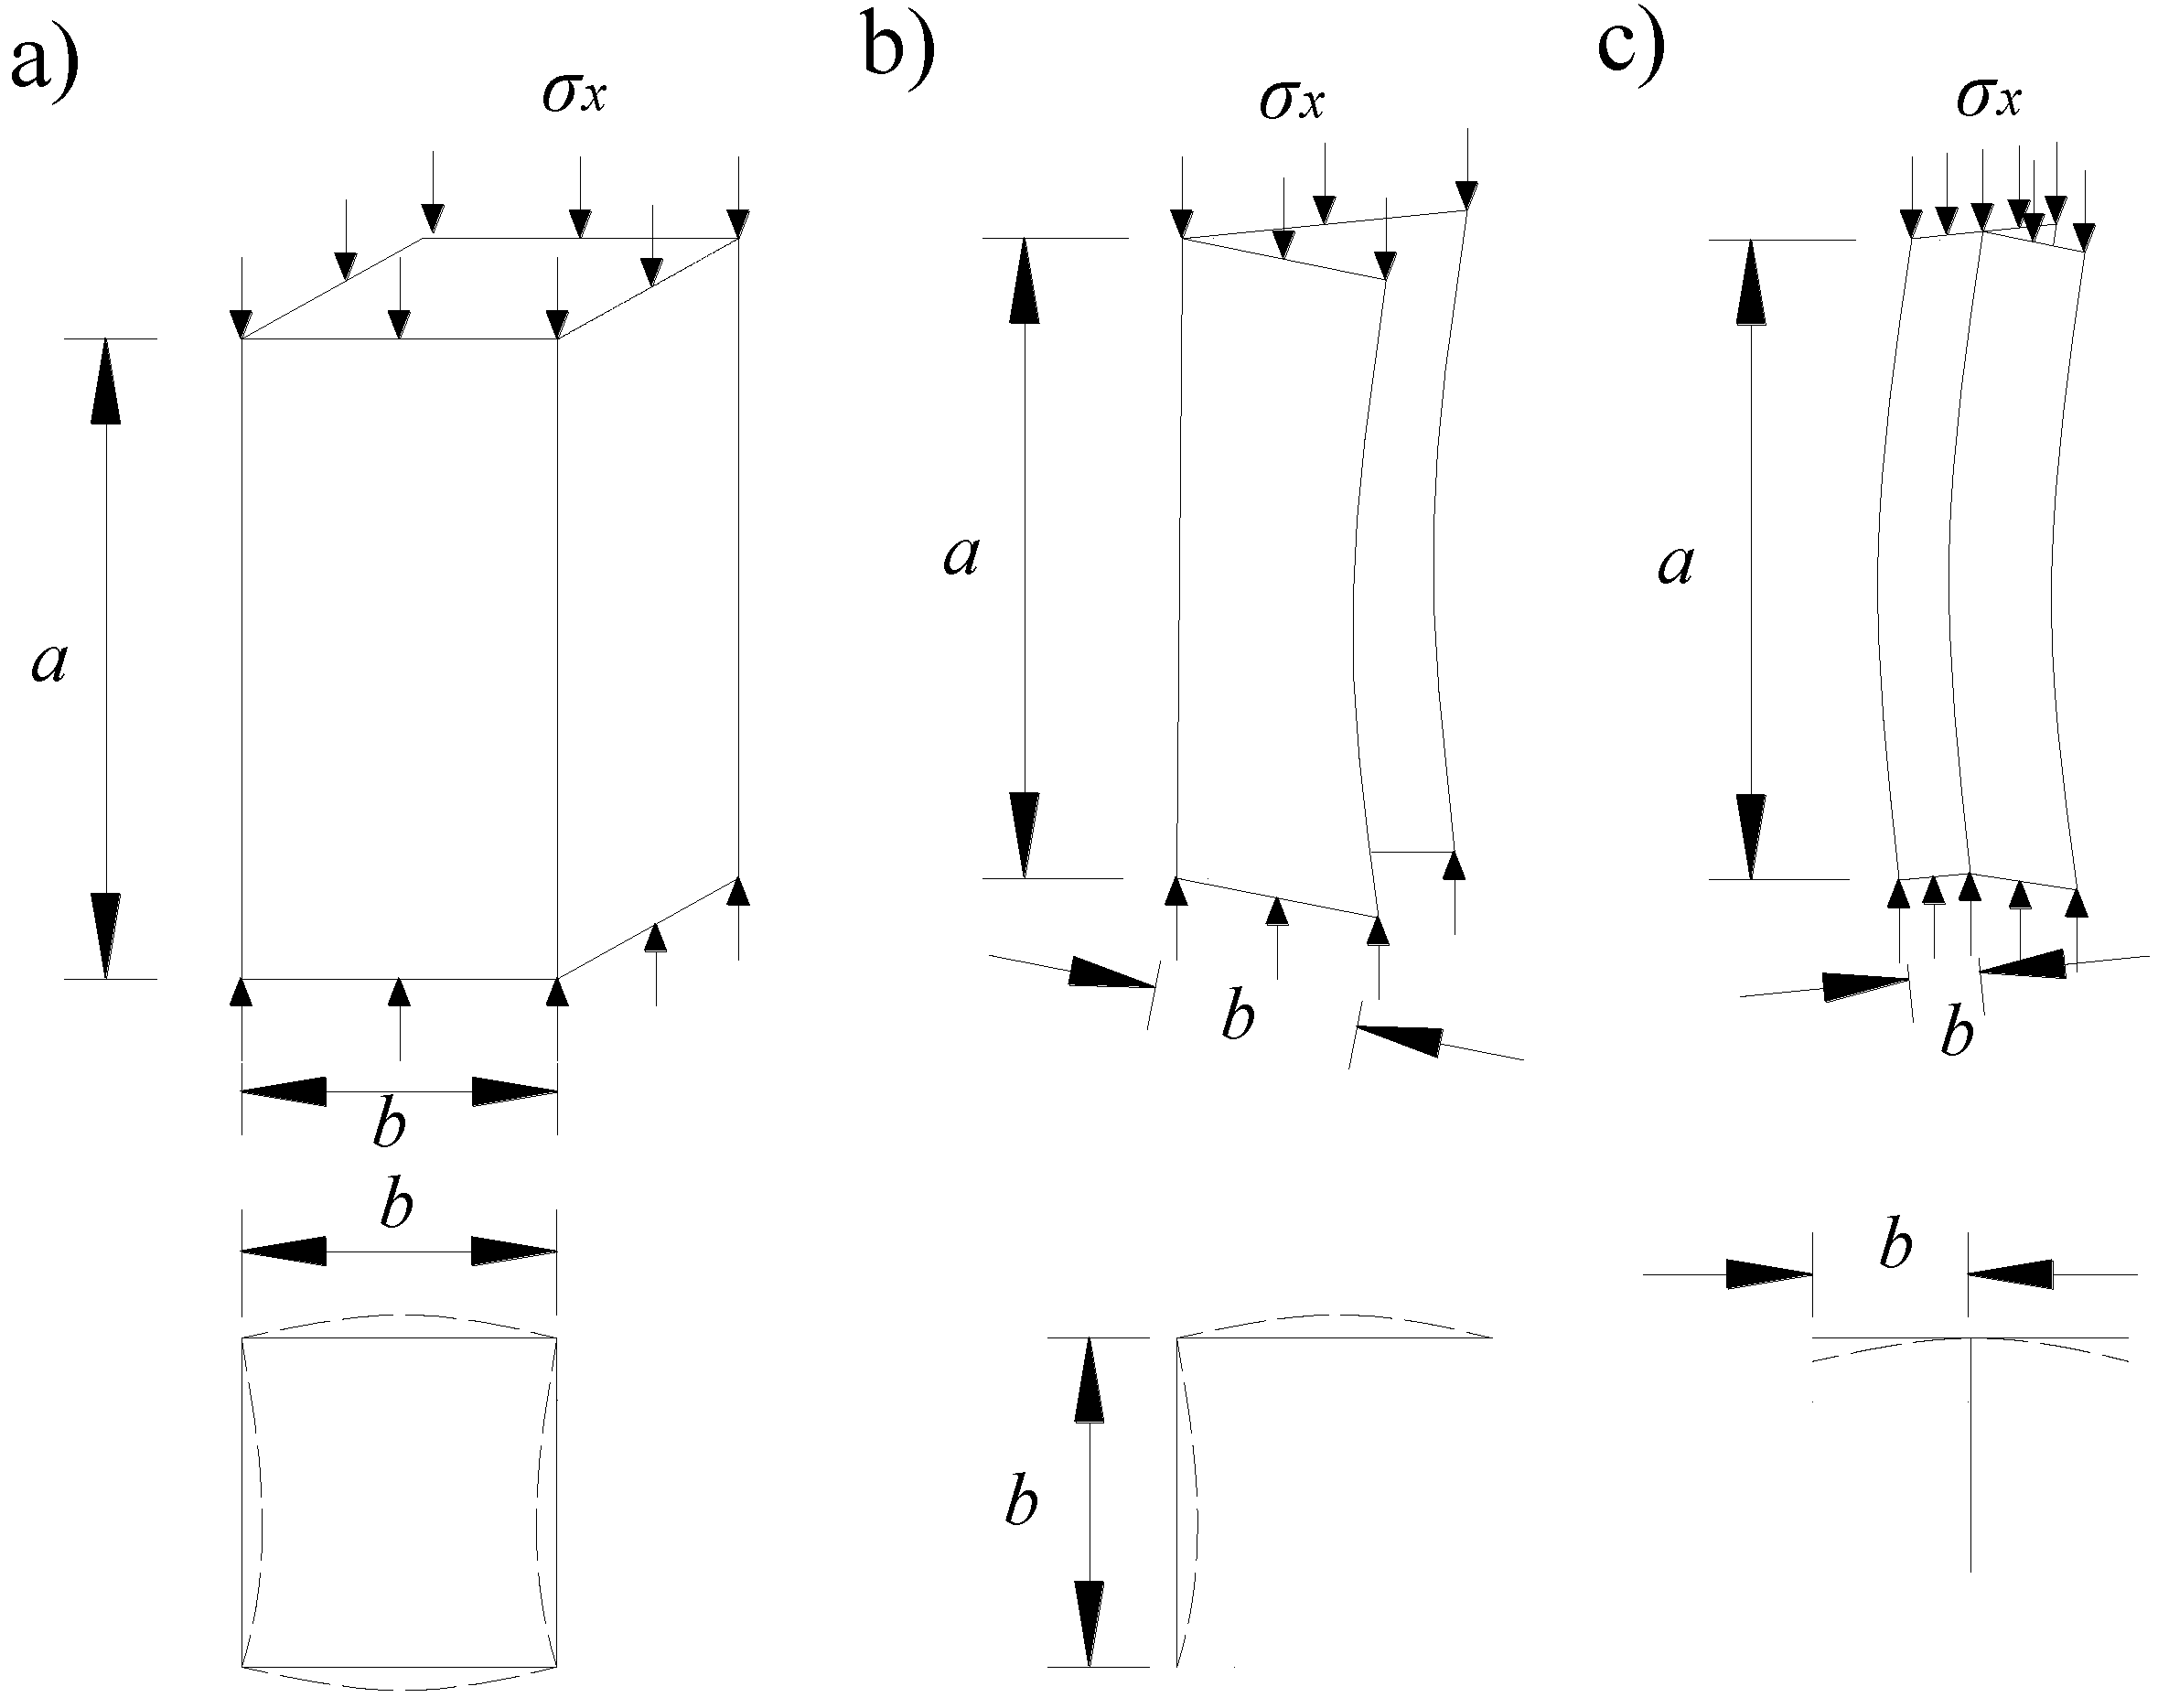
The buckling performances of the plate are significantly affected by the BCs. Rectangle, T and L sections are the common cross section types used in practical, see in Figure 2. It is noted that mechanical properties of compressed members are derived from the behaviors of the individual plate elements that make up the section [14], so the edges between two individual plates are in a state between rotatable and fixed constraint, and the edges are free when the edges have no adjacent edges. The critical case of simply supported edge is selected for conservative calculation for the edges in a state between rotatable and fixed constraint in this paper. Therefore, the columns with rectangle section (Figure 2a) can be seen as four plates with all four edges simple support (4S), the columns with L and T sections (Figure 2b,c) can be seen as two or three plates with three edges simple support and one edge free (3S1F), and both the BCs of 4S and 3S1F are considered in this paper, as shown in Figure 1.
2.3. Load Case
In the present study, only longitudinal uniform uniaxial compression in the x direction is considered, as shown in Figure 1. Other load cases such as biaxial compression and edge shear loading will be discussed in the authors’ subsequent research papers. The critical stress fcr is defined by the average stress that is equal to the uniformly applied compressive load divided by the full cross-sectional area assuming no opening within the plate.
2.4. Parameters Considered in This Study
The object of the present study is to investigate the buckling of the perforated plates strengthened with FRP under uniaxial compression. The geometric dimensions (such as tf, ts), and the elastic modulus of FRP Ef, the BCs of 4S and 3S1F, the effect of plate aspect ratio β (i.e., a/b), hole size d/b, hole position ex/b and ey/b have been considered:
- The parameters of geometrical and mechanical properties such as tf, ts, Ef, Es appear in the form . In this equation, Ef = 1.6 × 10⁵ MPa, 2.4 × 10⁵ MPa and 4.4 × 10⁵ MPa, Es = 2.0 × 10⁵ MPa, nf varies between 0 and 3 with an increment of 1, tf0 = 0.167 mm, ts = 2 mm, 3 mm and 4 mm.
- The BCs: 4S and 3S1F.
- Plate aspect ratio β: varies between 1 and 4 with increment of 1.
- Hole size d/b: varies between 0 and 0.7 with an increment of 0.1, in some case refines to 0.05.
- Hole position ex/b and ey/b. ex/b varies between 0.05 and 0.5β with an increment of 0.0625. ey/b varies between 0.5 and 0.9 with an increment of 0.025 for BCs of 4S and between 0.05 and 0.95 with an increment of 0.025 for BCs of 3S1F. In all conditions, the distance between hole’s edge and plate’s edge is no less than 0.05b.
3. The Theory of Composite Plate without Holes
The buckling problem of rectangular plate subjected to uniaxial compression, was first studied by Timoshenko [16] in 1961 and modified by Gerstle [17] in 1967. Only first order terms in the governing equations were considered, the critical stress fcr at buckling can be written as
where k is a dimensionless buckling coefficient of the plate. t and b are the thickness and width of the plate, respectively. D is the flexural rigidity of the plate, and for the steel plate, it can be written as:
3.1. The Transformed Flexural Rigidity Dt
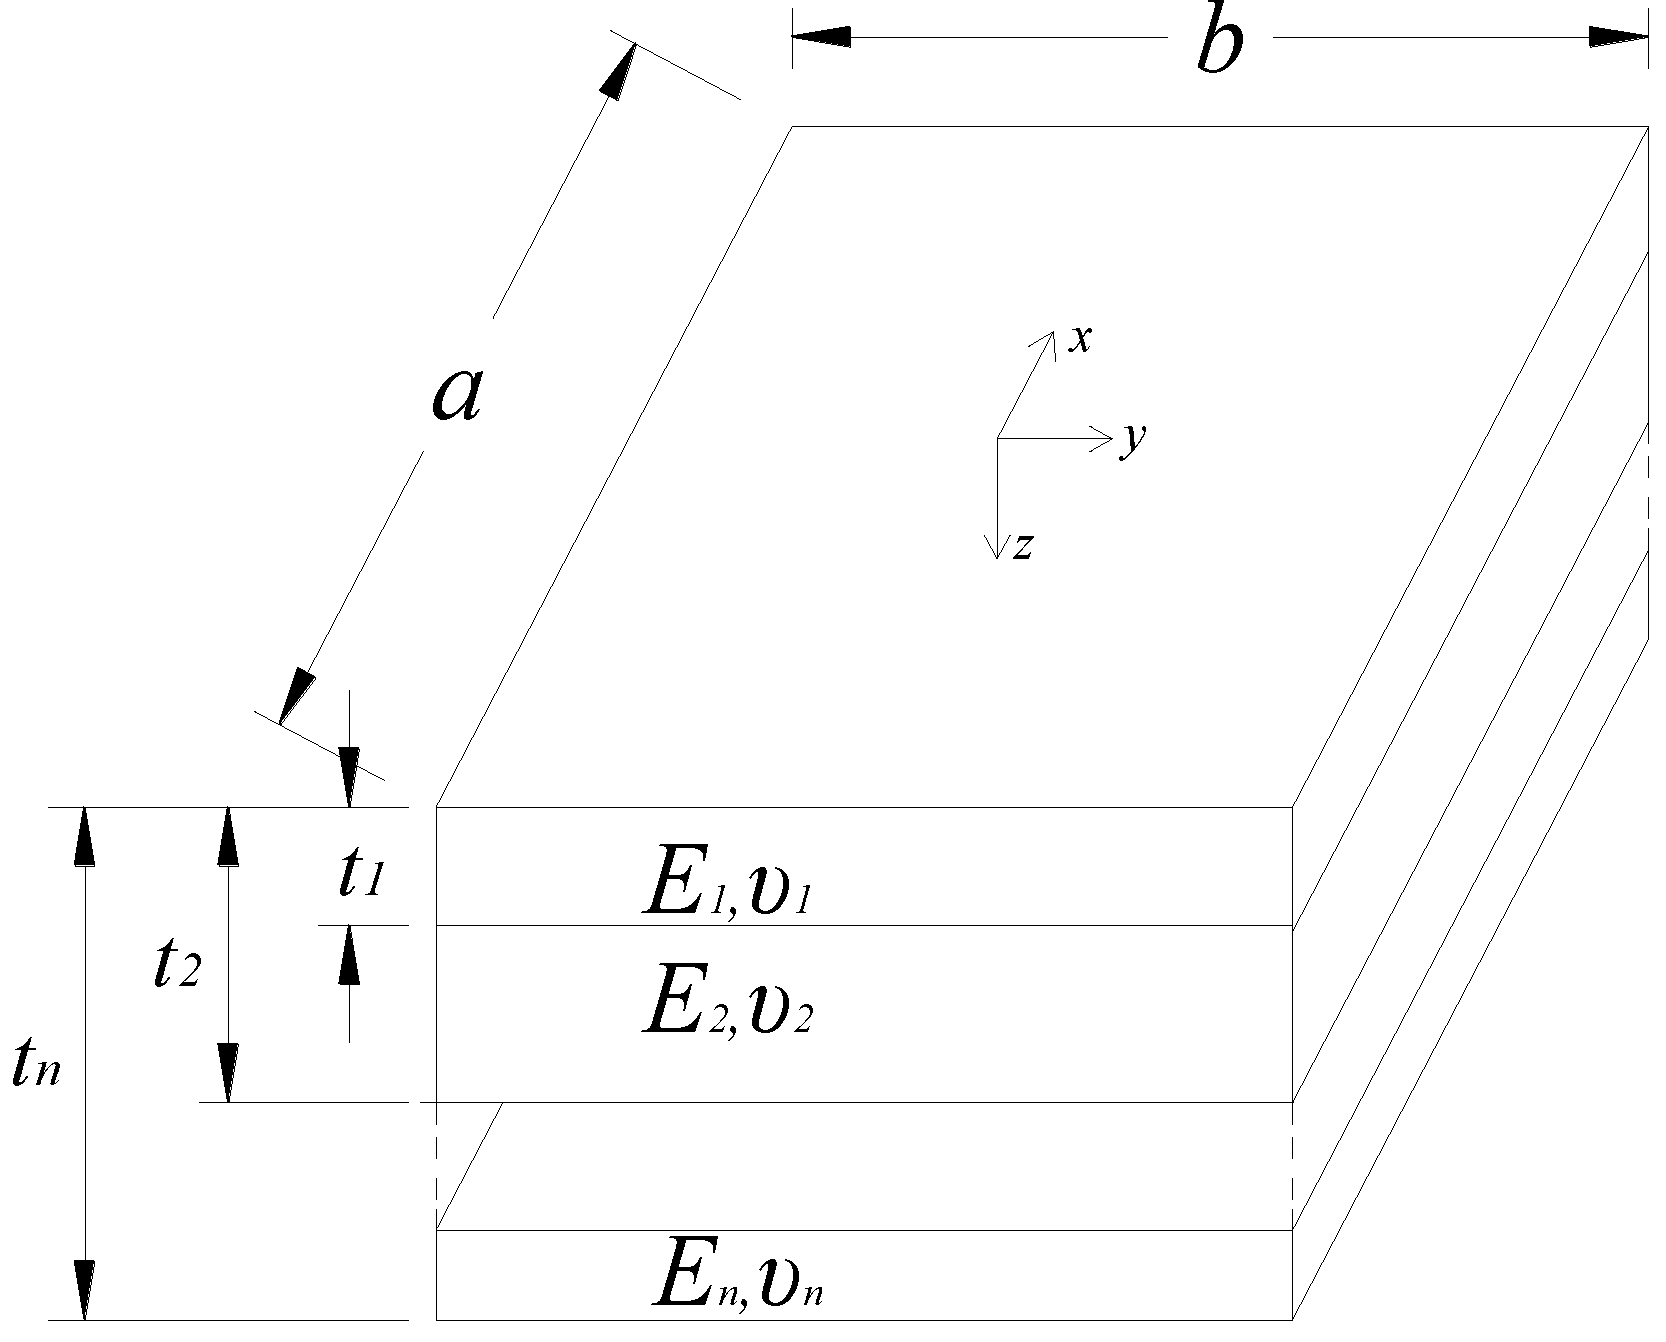
In 1959, Pister [15] proposed a solution for the transformed flexural rigidity Dt of the perfectly bonded layered plate where each layer is assumed to be isotropic, a plate element with the associated coordinate system is shown in Figure 3, and the calculation formulas of Dt are in Equations (3)–(6).
To a pure steel plate, the flexural rigidity of D0 can be calculated by Equations (4)–(6), and the rigidity D0 can be expressed as Equation (7), which is the same with Equation (2), so the method proposed by Pister can also be used to calculate the flexural rigidity of the pure steel plate.
Considering that the steel and CFRP are perfectly bonded up to the ultimate load [18] and the Young’s modulus of the adhesive layers is about 1/10 of those of steel and FRP, the effect of adhesive layers is not taken into account for conservative design in this paper. Therefore, a plate strengthened with FRP can be seen as FRP-steel layered plates. Two reinforcement index α, γ are introduced as given by Equations (8) and (9).
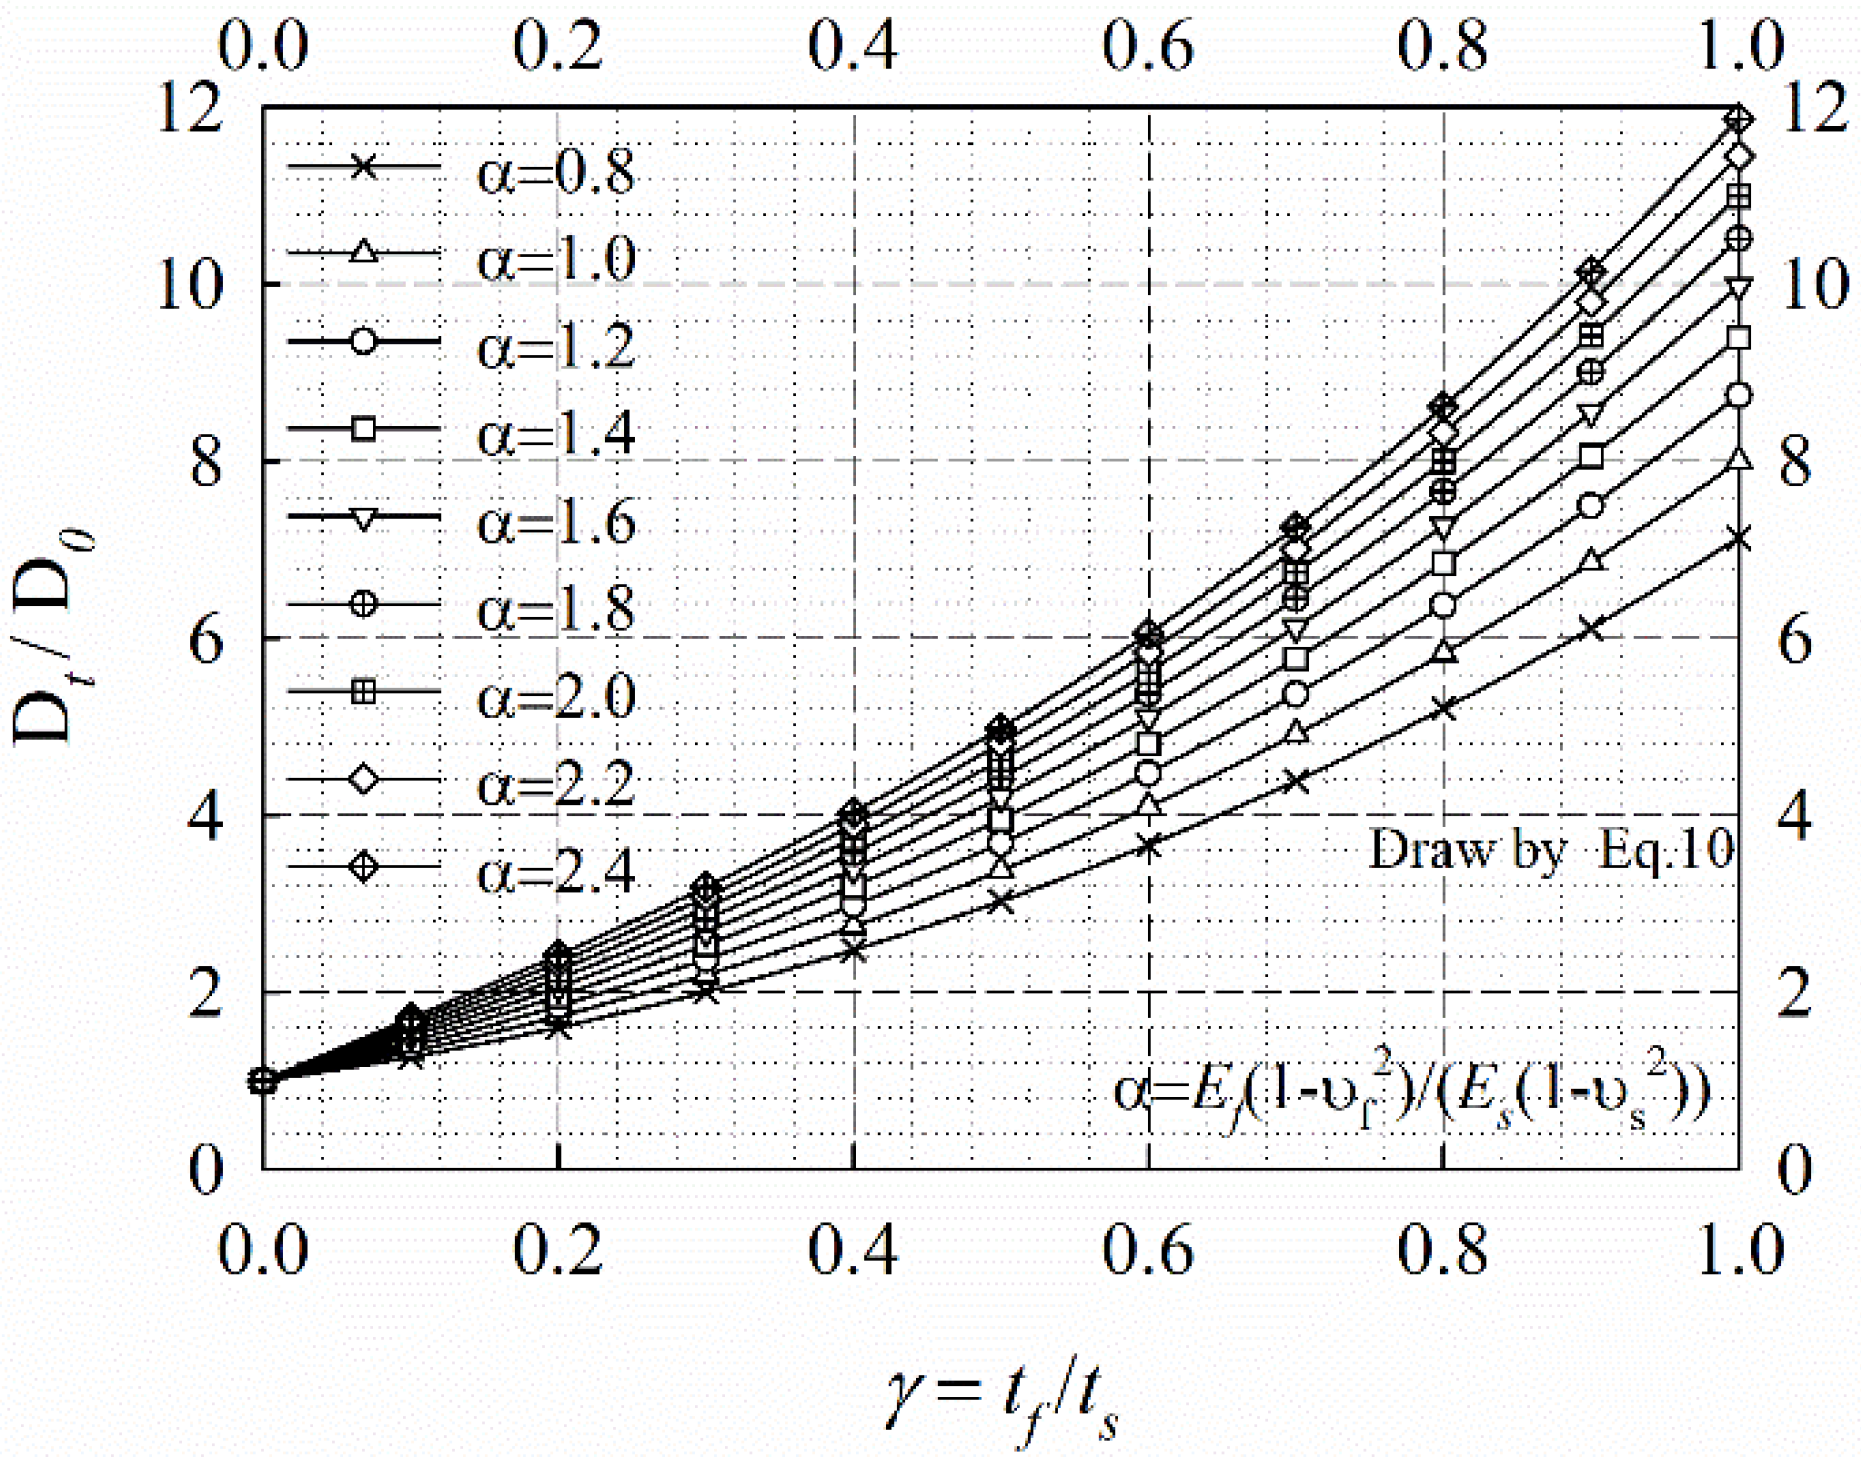
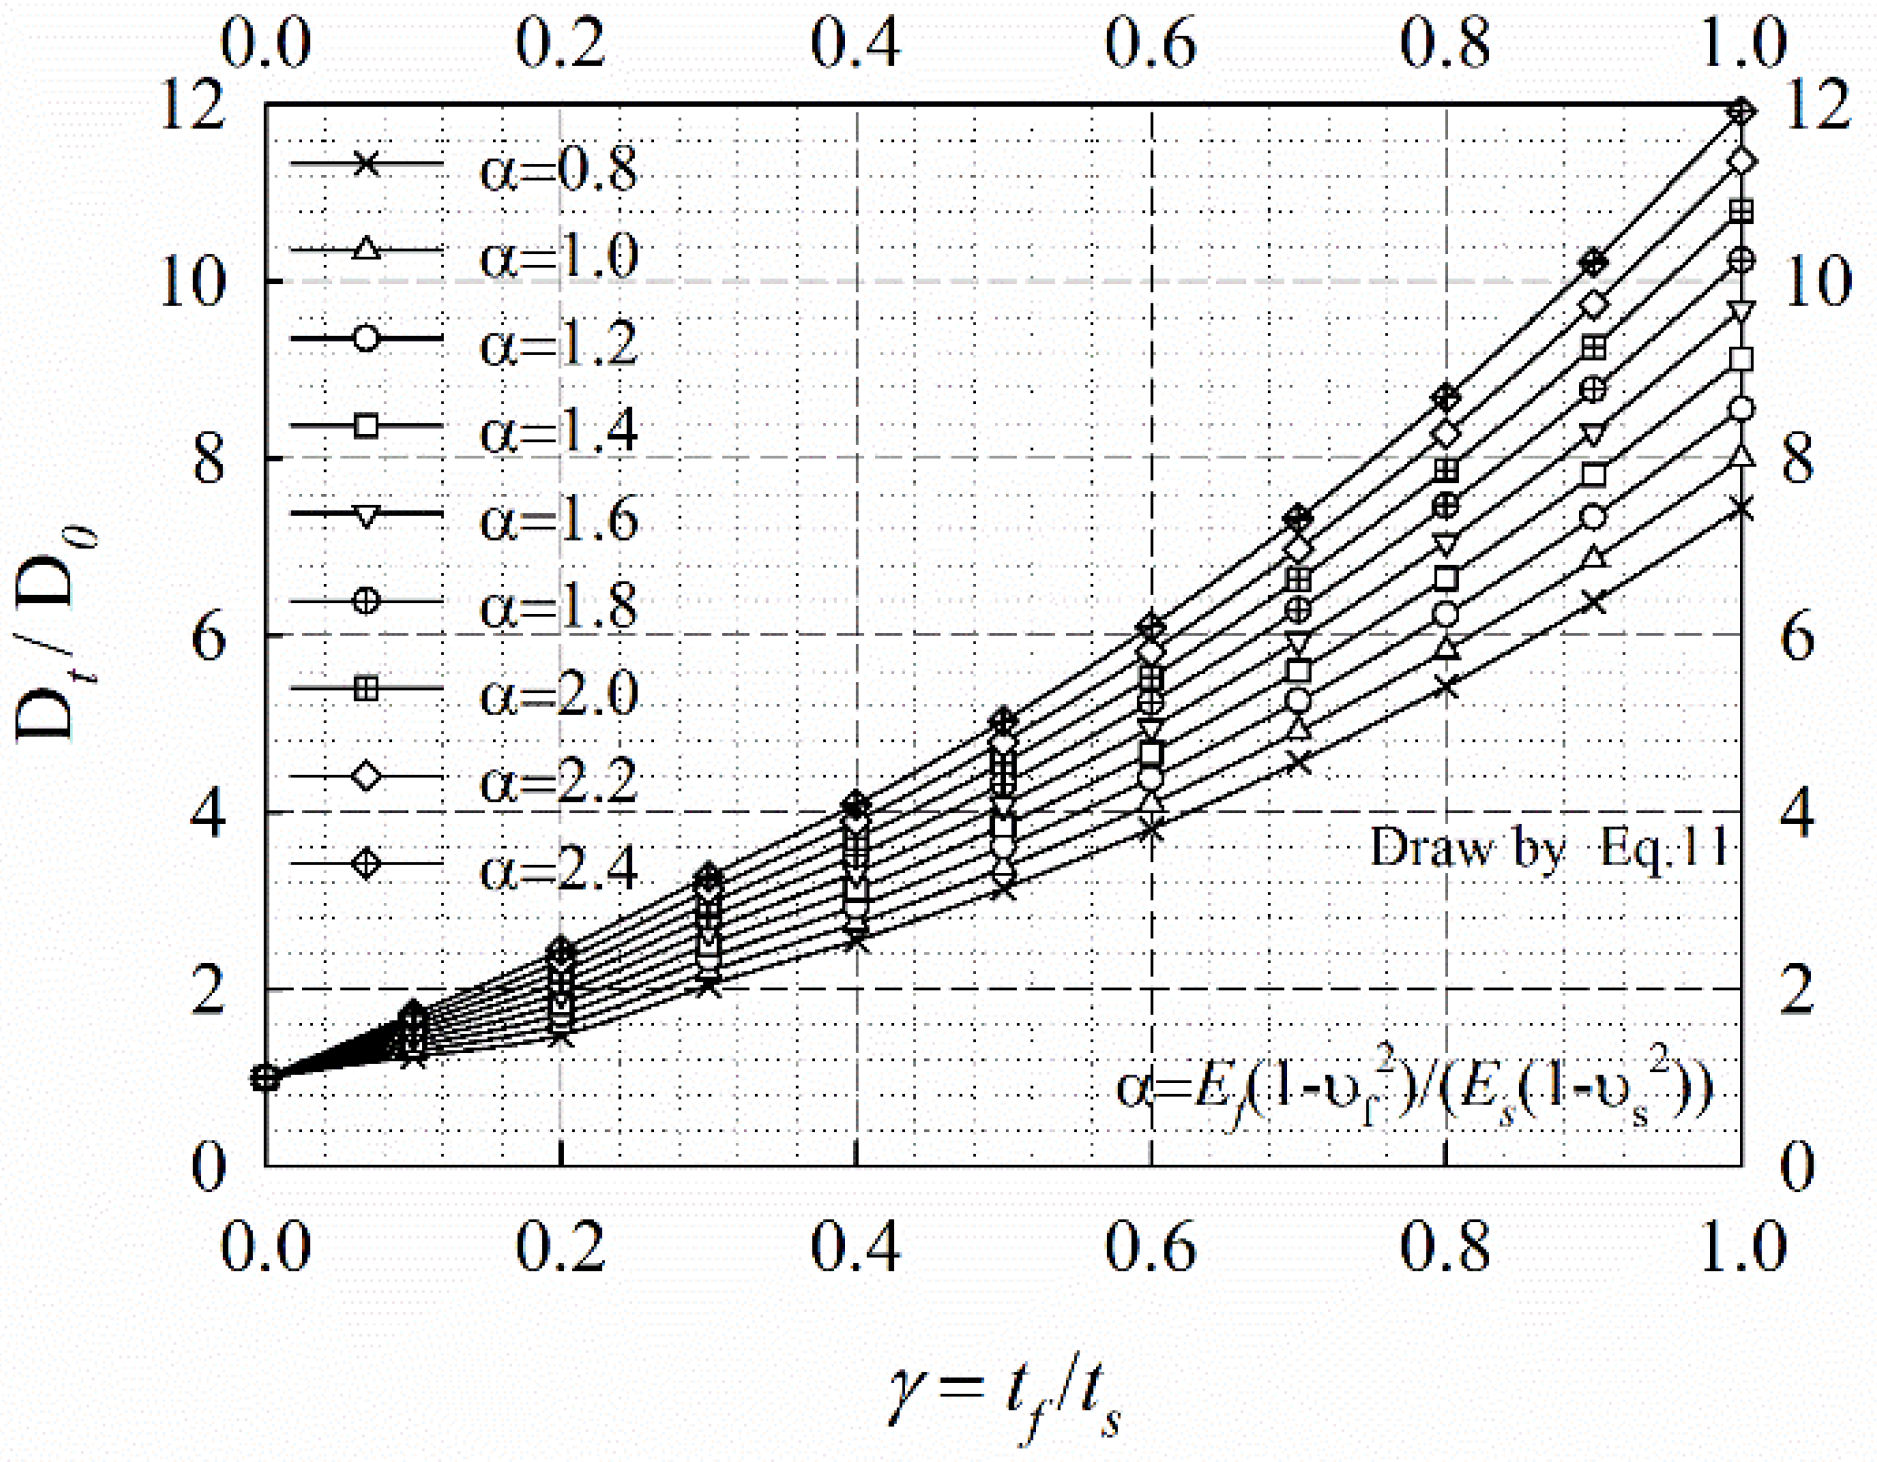
Substitution of Equations (8) and (9) into Equations (4)~(6) and then substitution of Equations (4)~(6) into (3) leads to Equation (10), where Dt is the flexural rigidity of plate strengthened with FRP. Therefore, Dt/D0 can be expressed as Equation (10), and shown in Figure 4. Equation (10) can be approximate simplified as Equation (11) for calculation convenient, and shown in Figure 5.
From the equations, figures and discussion above, the following can be concluded:
- The method proposed by Pister to calculate the transformed flexural rigidity of the perfectly bonded layered plate is available to calculate the flexural rigidity of the pure steel plate.
- When γ is in a range of 0 to 0.2 and α is in a range of 0.8 to 2.4, Dt/D0 almost had a linearly related with α and γ. For γ = 0.2, Dt/D0 will increase from 1.48 to 2.44 as α enlarges from 0.8 to 2.4.
- Dt/D0 will have a non-linear increase as γ is enlarged from 0.2 to 0.3.
- When γ is in a range of 0.3 to 1 and α; is in a range of 0.8 to 2.4: for a fixed α, Dt/D0 will had a cubic curvilinear increase as γ is enlarged from 0.3 to 1.0, and for a fixed γ, Dt/D0 will have a linear change as α enlarges from 0.8 to 2.4. When α = 0.8, Dt/D0 will increase from 2.05 to 7.47 as γ enlarges from 0.3 to 1, when α = 2.4, Dt/D0 will increase from 3.22 to 11.73 as γ enlarges from 0.3 to 1.
3.2. The Buckling Coefficient k
The buckling coefficient k is a dimensionless number factor which depends on the type of loading, BCs, the plate aspect ratio β and the openings; and it has nothing to do with whether pasting FRP or not. When the plate aspect ratio is a integer, k is equal to 4 and 0.456 + (b/a)2 for plates with BCs of 4S and 3S1F, respectively [16].
3.3. Comparison with the Experimental Results
In order to verify the theoretical method’s results, a comparison with the authors’ experimental results on the critical stress of perforated plates strengthened with FRP has been performed. As shown in Figure 6, a test rig capable of applying uniaxial compression on the plate was fabricated in the laboratory. And a classic perforated plate strengthened with FRP is shown in Figure 7. The unidirectional FRP has been used. The plates were constructed as following: Firstly, holes are drilled in plates if needed, then a single-layer of FRP is installed directly on the steel surface in the load direction and then another single-layer of FRP is installed in the direction of vertical load. The aim of this paper is to study the buckling of the plate, and when buckling, no delimitation of FRP has been found, so in the finite element (FE) models, the delimitation of FRP and the influence of manufacturing technology is not taken into account, and the FRP are considered an orthotropic material. The values of the basic geometry and material parameters are in Table 1, and the details of the experiments are in literature [19]. The elastic buckling loads PcrExp are determined from the experiments by two methods, and averaged; These two methods are the load–axial displacement curve and the load–transverse displacement squared method [14,20]. The experimental critical stress fcrExp can be calculated by PcrExp/(btt), where tt represents the total thickness of the plate. The comparison of experimental and theoretical results are in Table 2. From this table, it can be found that experimental and theoretical results are consistent when d/b and γ are equal to 0. It should be noted that the theoretical method cannot consider the influence of hole, which is a very important parameter to the elastic stability of perforated plates strengthened with FRP under uniaxial compression; so in calculating fcrEq.10 and fcrEq.11, k is taken as Ku, which is obtained by the numerical results in the following section. The values calculated by fcrEq.10 and fcrEq.11 are very closed, it proves the feasibility of Equation (11) in Calculating Dt. It also can be seen that when β ≠ 0, the theoretical results of fcrEq.10 and fcrEq.11 are basically larger than experimental results fcrExp. The reason is that the theory method cannot consider the orthotropic properties of FRP, the effect of FRP’s orthotropic properties is more obvious in the following numerical analysis, especially when pasting a lot of FRP.
3.4. The Proposed of Formula Correction
From the above comparison and analysis, we know that the stiffness obtained by theoretical calculation is too large due to not consider the orthotropic properties of FRP , so a modified factor of stiffness αD is proposed, we consider αD is a function of ω, β and d/b. It also can be seen from above analysis that the theory method cannot consider the influence of hole on buckling, so the buckling coefficient k needs to be modified as Ku which considers the change of d/b, β and the hole position ex (and ey). Therefore, the critical stress of perforated plates strengthened with FRP at buckling can be written as Equation (12). The values and change rules of αD and Ku are the focuses of the following numerical simulation studies.
4. Finite Element Model and Verification
4.1. Method of Analysis
The buckling problem of the plate is to solve the eigenvalue, the lowest eigenvalue corresponds to the critical stress while the eigenvector defines the deformed shape at buckling. A general-purpose finite element program, ABAQUS (Version: 6.11, Dassault Systemes S.A, Concord, MA, USA, 2011), has been utilized in the investigation to determine the elastic buckling loads of the perforated plates strengthened with FRP under uniaxial compression.
After performing the eigenvalue analysis, the lowest eigenvalue, λ1, can be expressed as Equation (13), so (αDKu) can be expressed as Equation (14). It should be noted that αD is equal to 1 as ω = 0 regardless of other parameters, so we let ω = 0 to study the variation of Ku as d/b, β, ex/b, ey/b and BCs change. We can change the form of αD into Equation (15) to study the variation of αD, where both the molecule and the denominator can be calculated by Equation (14) using numerical simulation results.
4.2. Model Description
Four typical perforated plate models with β = 1, 2, 3 and 4 are shown in Figure 8. The plates have dimensions a and b, and circular hole with diameter d. The plate was discretized into a mesh consisting of S4R element, each node of the S4R element has six active degrees of freedom (DOF), including three translational DOFs and three rotational DOFs. The mesh size are dependent on the hole sizes and the extensive convergence studies in the following section.
The classical elastic-plastic material and lamina material are used to model the steel and FRP, respectively. The steel-FRP composite section can be easily created by increasing the number of layers and changing the material properties of each layer.
The BCs of the plates considered in this paper are 4S and 3S1F. For simple support edge, there will be no lateral edge displacements perpendicular to the plate’s plane but rotations about the axis of each edge are allowed. And a uniform load of magnitude tt per unit width is applied perpendicular to the width edges.
4.3. Model Verification
A mesh study is conducted to observe the convergence of buckling stress as the mesh size increases. Take plate with No. 8 in Table 2 for example, the Eigenvalues with respect to element numbers depended on mesh size, as shown in Figure 9. It can be seen that the curves starts to converge after an element number of 400, which with the general mesh sizes of b/10 and with mesh sizes in hole edge of πd/40. In order to reduce computational time, those meshes are adopted in the subsequent buckling analysis.
In order to verify FE models used in this study, a comparison with the authors’ experimental results [19] on the critical stress of perforated plates strengthened with FRP has been performed, and the results are in Table 2. It can be seen that the FE models have a very limited relative absolute error in fcr, in the consider cases, the errors are 13.0% on maximum, 4.05% on average, and 0.108 on the coefficient of variation. Therefore, the FE models are very accurate and enough for the studies in the next section.
5. Discussion of the Results
5.1. Buckling Mode Shapes
Figure 10, Figure 11, Figure 12 and Figure 13 show the buckling mode shapes of perforated plates strengthened with FRP under uniaxial compression with different ex/b, β, d/b and BCs. The following are found:
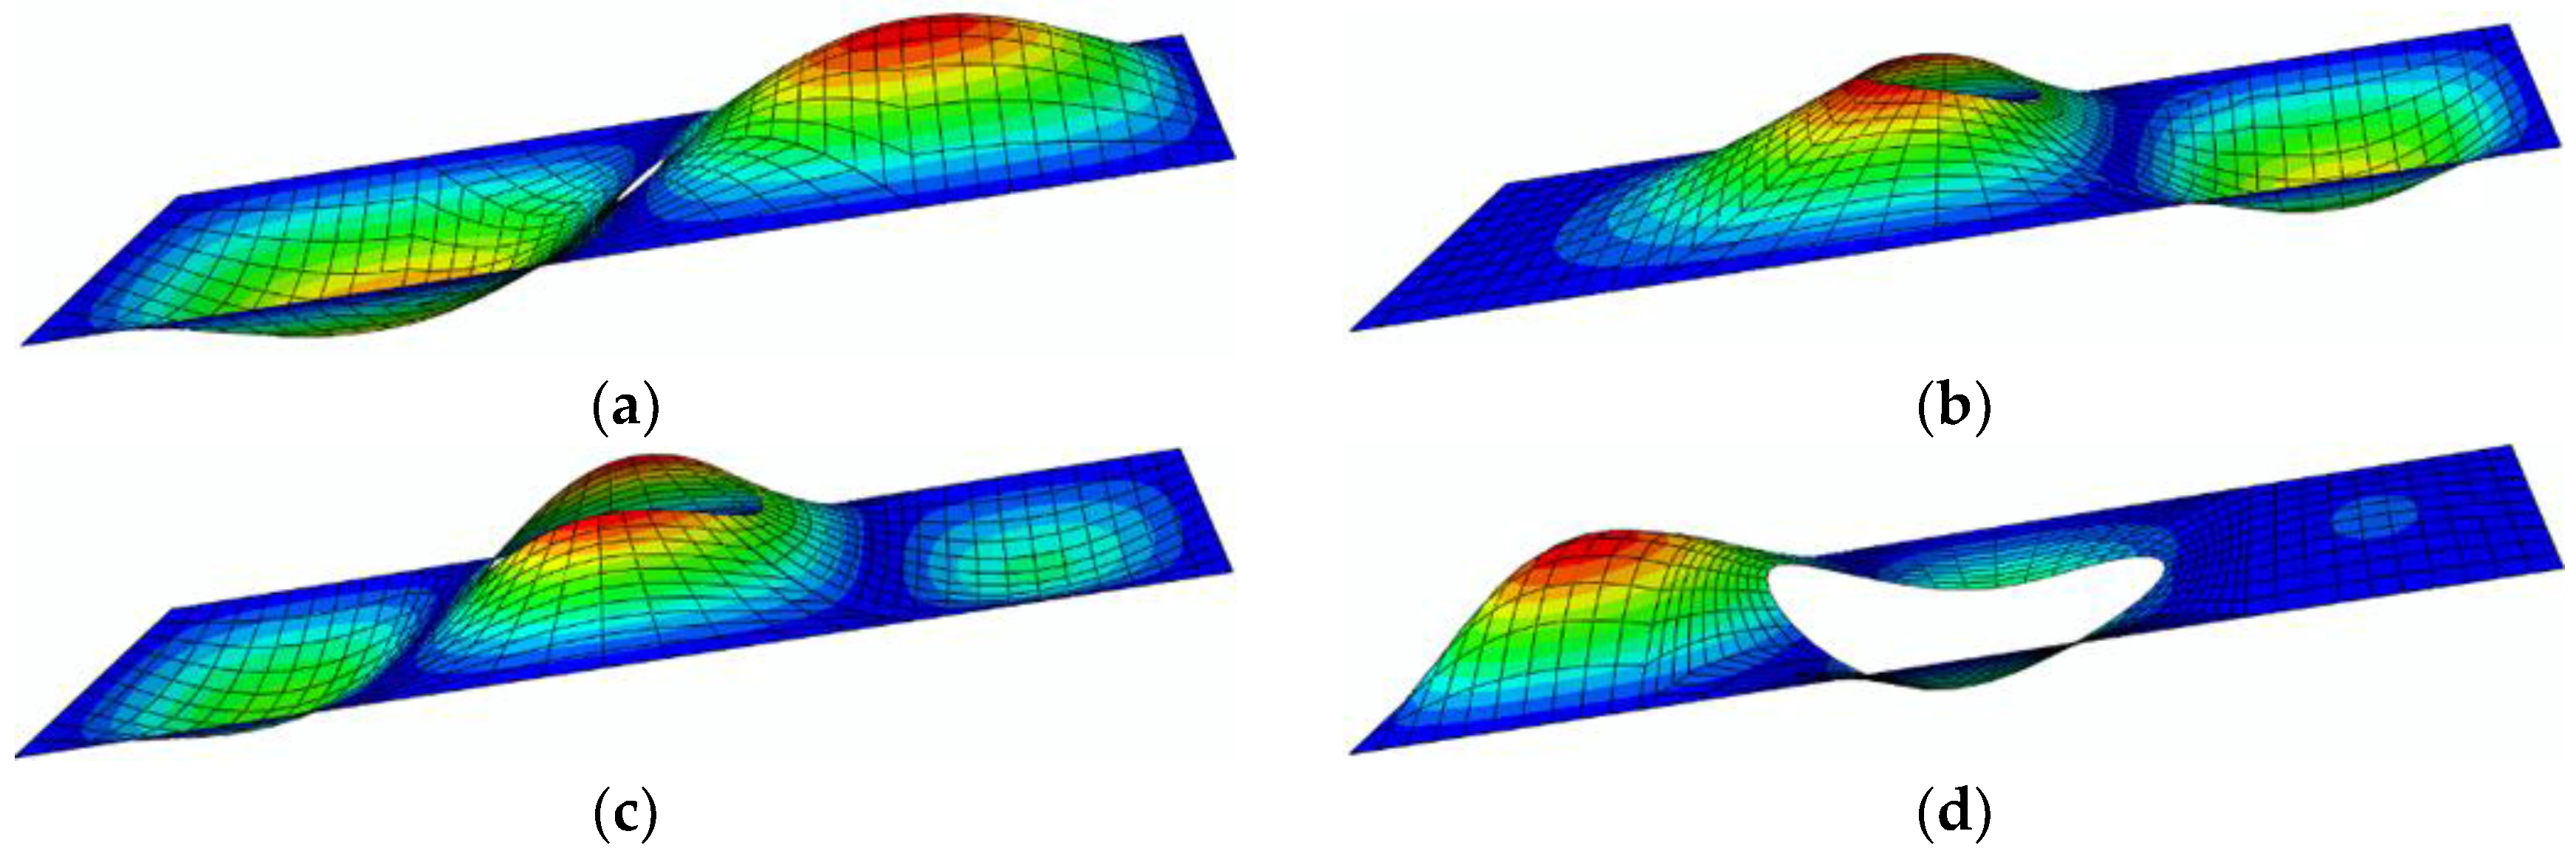
When the hole center is in the middle of the plate, the buckling mode shapes transform from two half-waves to three half-waves as d/b is enlarged from 0 to 0.7 (seen from Figure 10), a similar phenomenon occurs in all plates with ex/b = 1 and 2.
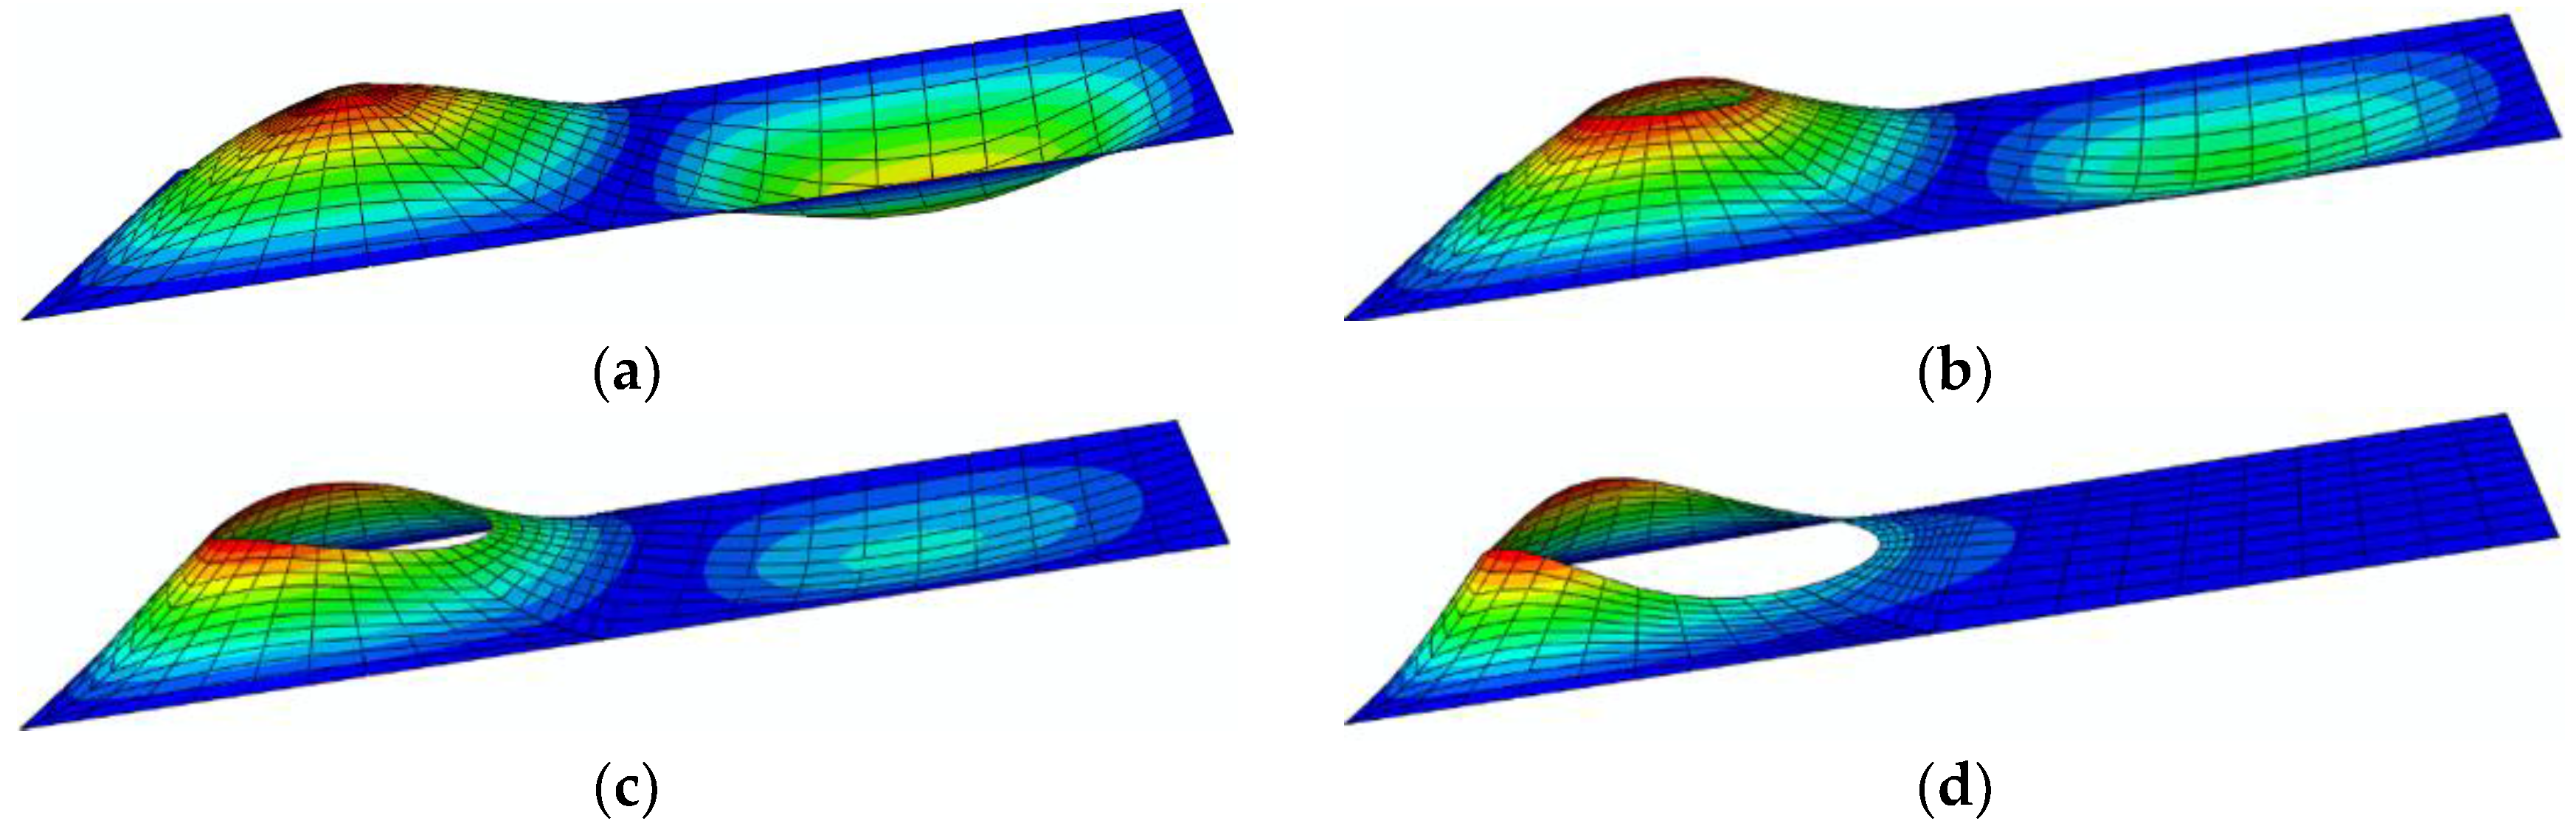
- From Figure 10a and Figure 11a, it can be seen that when d/b = 0.1, the buckling mode shapes are very close to plates without hole; and as d/b is enlarged, the max deformations of the plate are firstly centered near the hole then gradually transferred between hole and loading edge for 4S (seen from Figure 10b–d and Figure 11b–d).
- From Figure 12, it can be seen that as β increases, the deformations of the existing part have been basically unchanged, and the deformations of the adding part are very small.
- From Figure 13, it can be seen that the mode shapes are essentially unchanged as d/b is enlarged for plates with BCs of 3S1F.
5.2. The Stiffness Modified Factor
Due to the orthotropic properties of FRP, a modified factor of stiffness αD has been proposed. And a reinforcement index of FRP has been defined as:
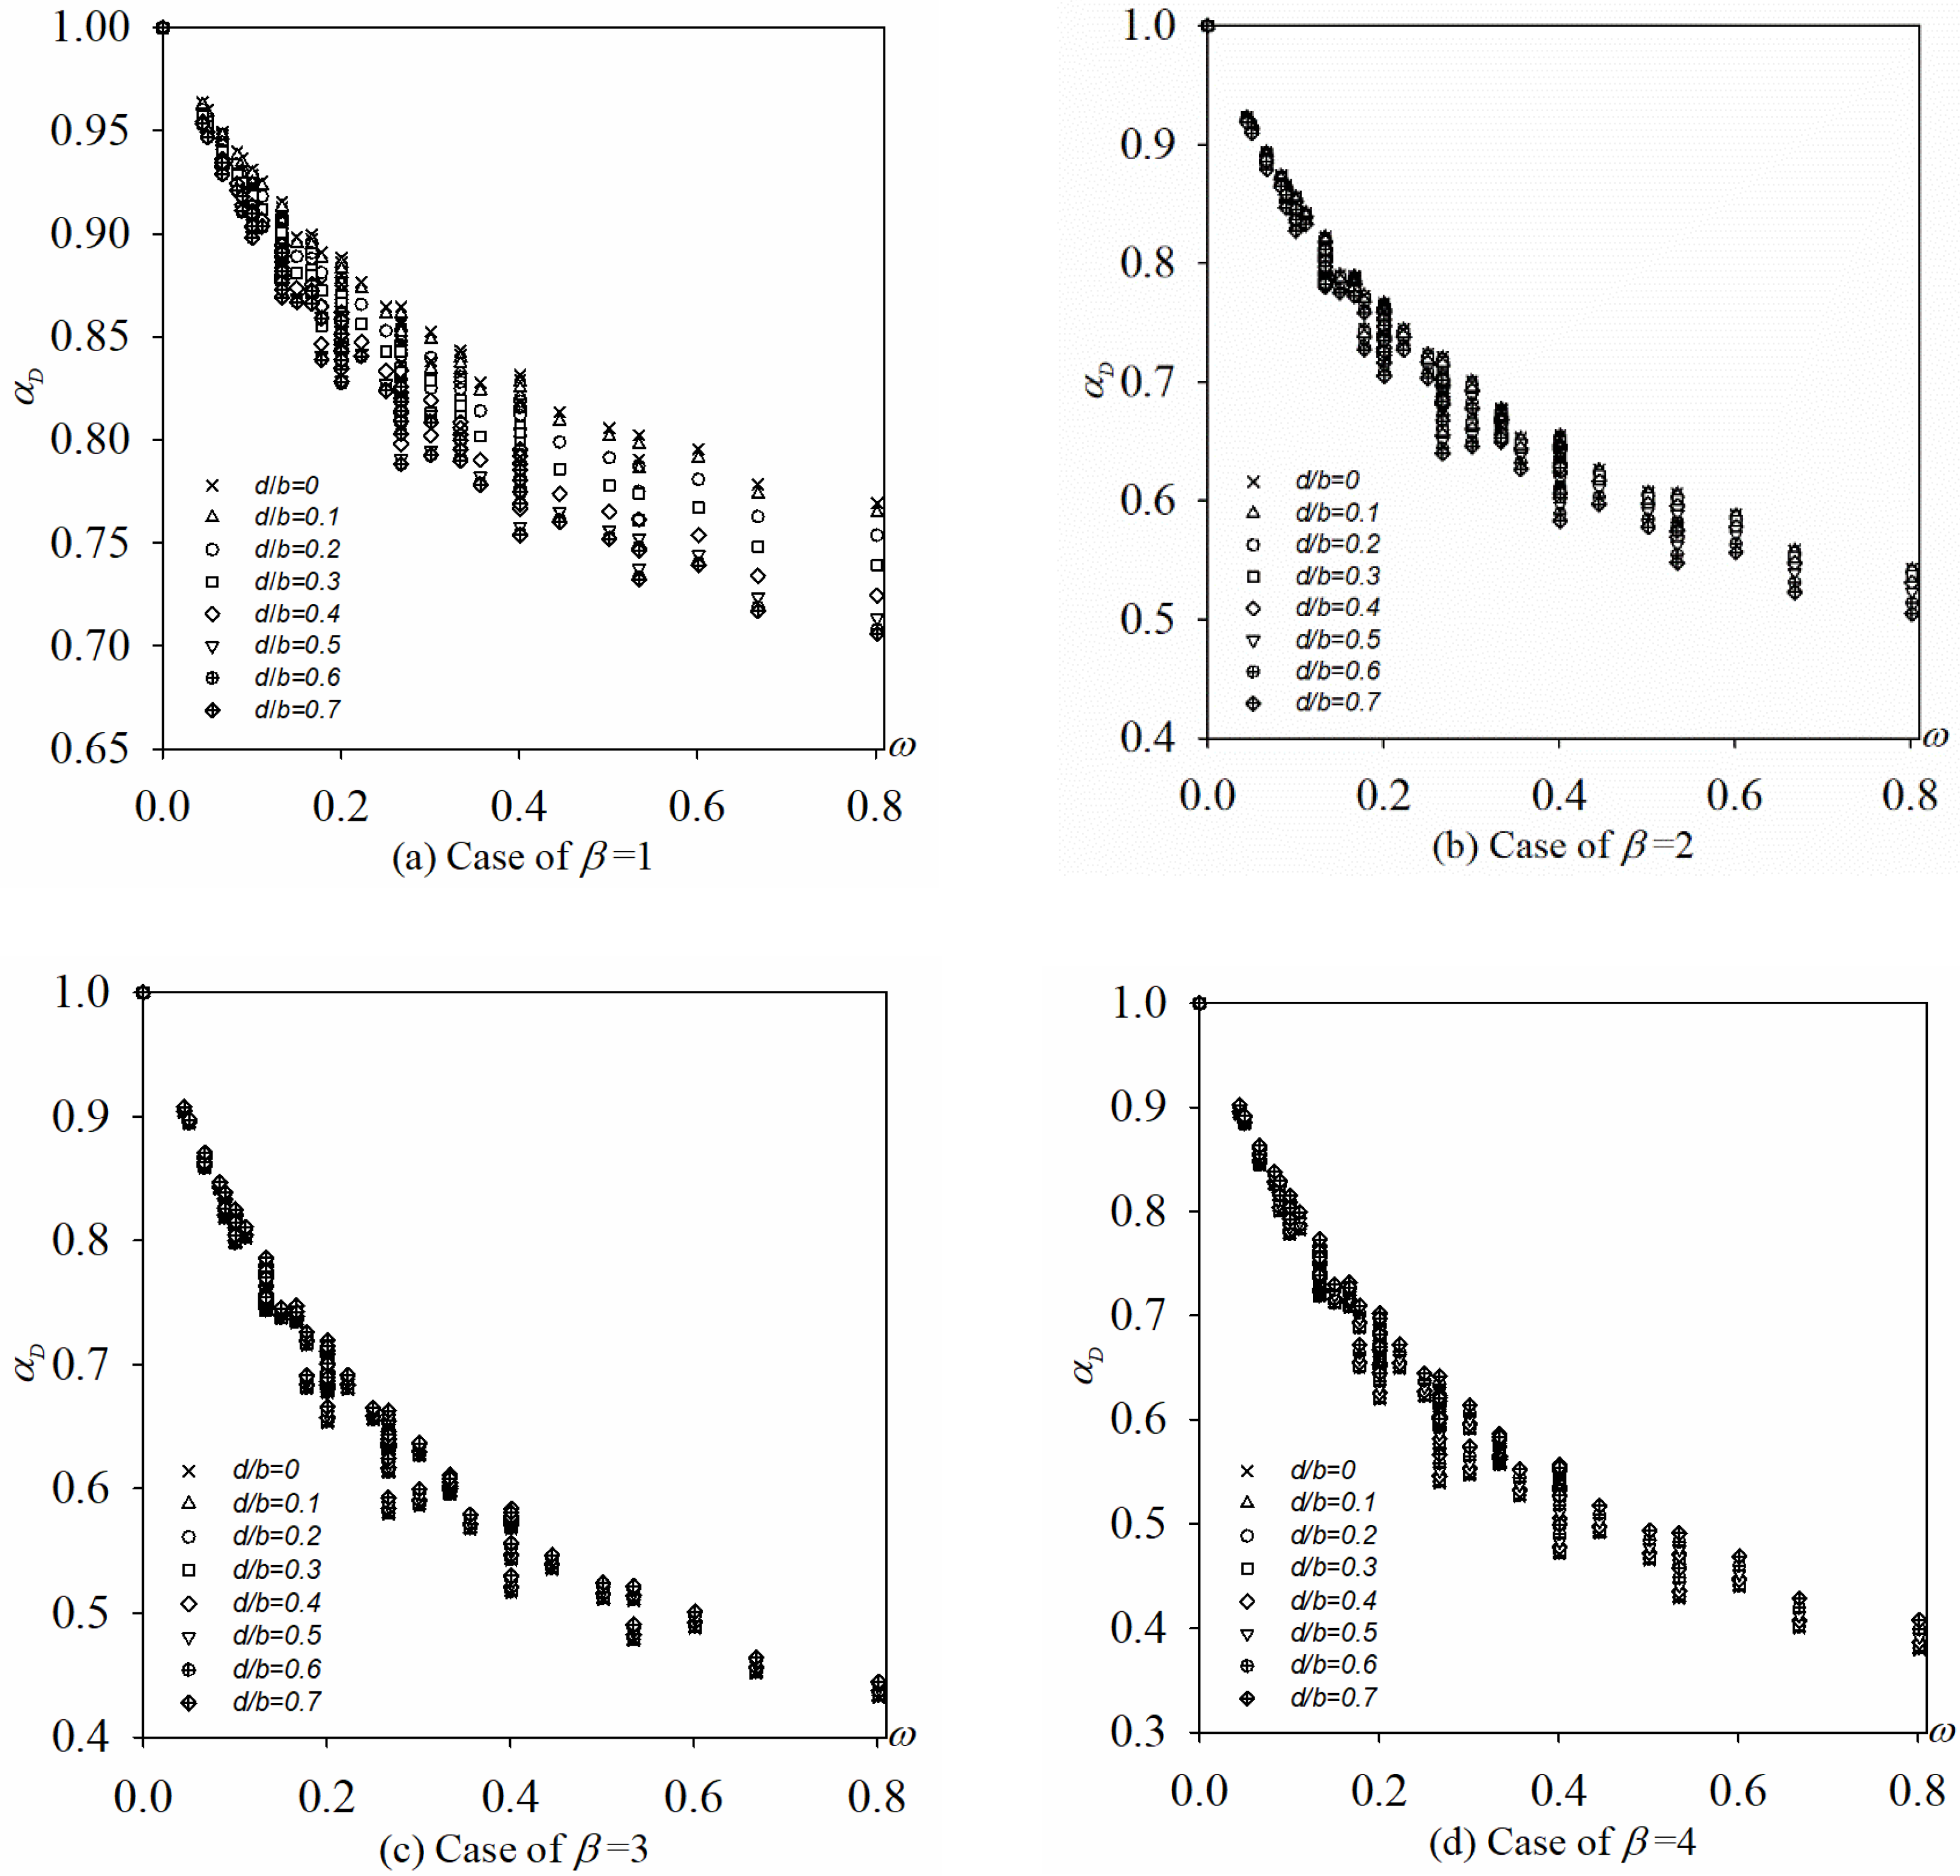
In order to study the variation of αD, a large number of parametric analysis have been performed in this section, the parameters include reinforcement index ω, plate aspect ratio β, hole size d/b, and BCs. The parametric analysis’ results are handled by the above approach in Equations (14) and (15), and plotted in Figure 14 and Figure 15 for BCs of 4S and 3S1F, respectively.
Figure 14 shows the variation of αD as the reinforcement index ω increases from 0 to 0.8 for different d/b from 0 to 0.7 and different plate aspect ratios β from 1 to 4 with the BCs of 4S. It can be seen that the curves in Figure 14 with the same d/b and different β are almost the same and the values in Figure 14a are slightly smaller. Therefore, αD of a perforated rectangular plate strengthened by FRP with an integer aspect ratio could be conservatively taken as that of a perforated square plate, so only plates with β = 1 are analyzed in the following. From Figure 14a, it can be seen that αD decreases as ω is enlarged and the curves can be coupled by Equation (17), where m, n are the undetermined second-order and first-order coefficients. For different d/b, m and n are calculated in Table 3, and R2 is the correlation coefficient.
In Table 3, m and n can be approximate expressed as Equations (18) and (19), so αD with BCs of 4S can be calculated by Equation (20)
For the plates with BCs of 3S in Figure 15, the same method can be used to study the variation in αD as the reinforcement index ω increases from 0 to 0.8 for different plate aspect ratios β from 1 to 4. It also can be seen that αD decreases as ω is enlarged. It is noted that αD is independent of d/b when β = 2, 3 and 4, so αD with BCs of 3S1F can be calculated by Equation (21).
5.3. The Buckling Coefficient
5.3.1. Hole Position Varying Along x-Axis
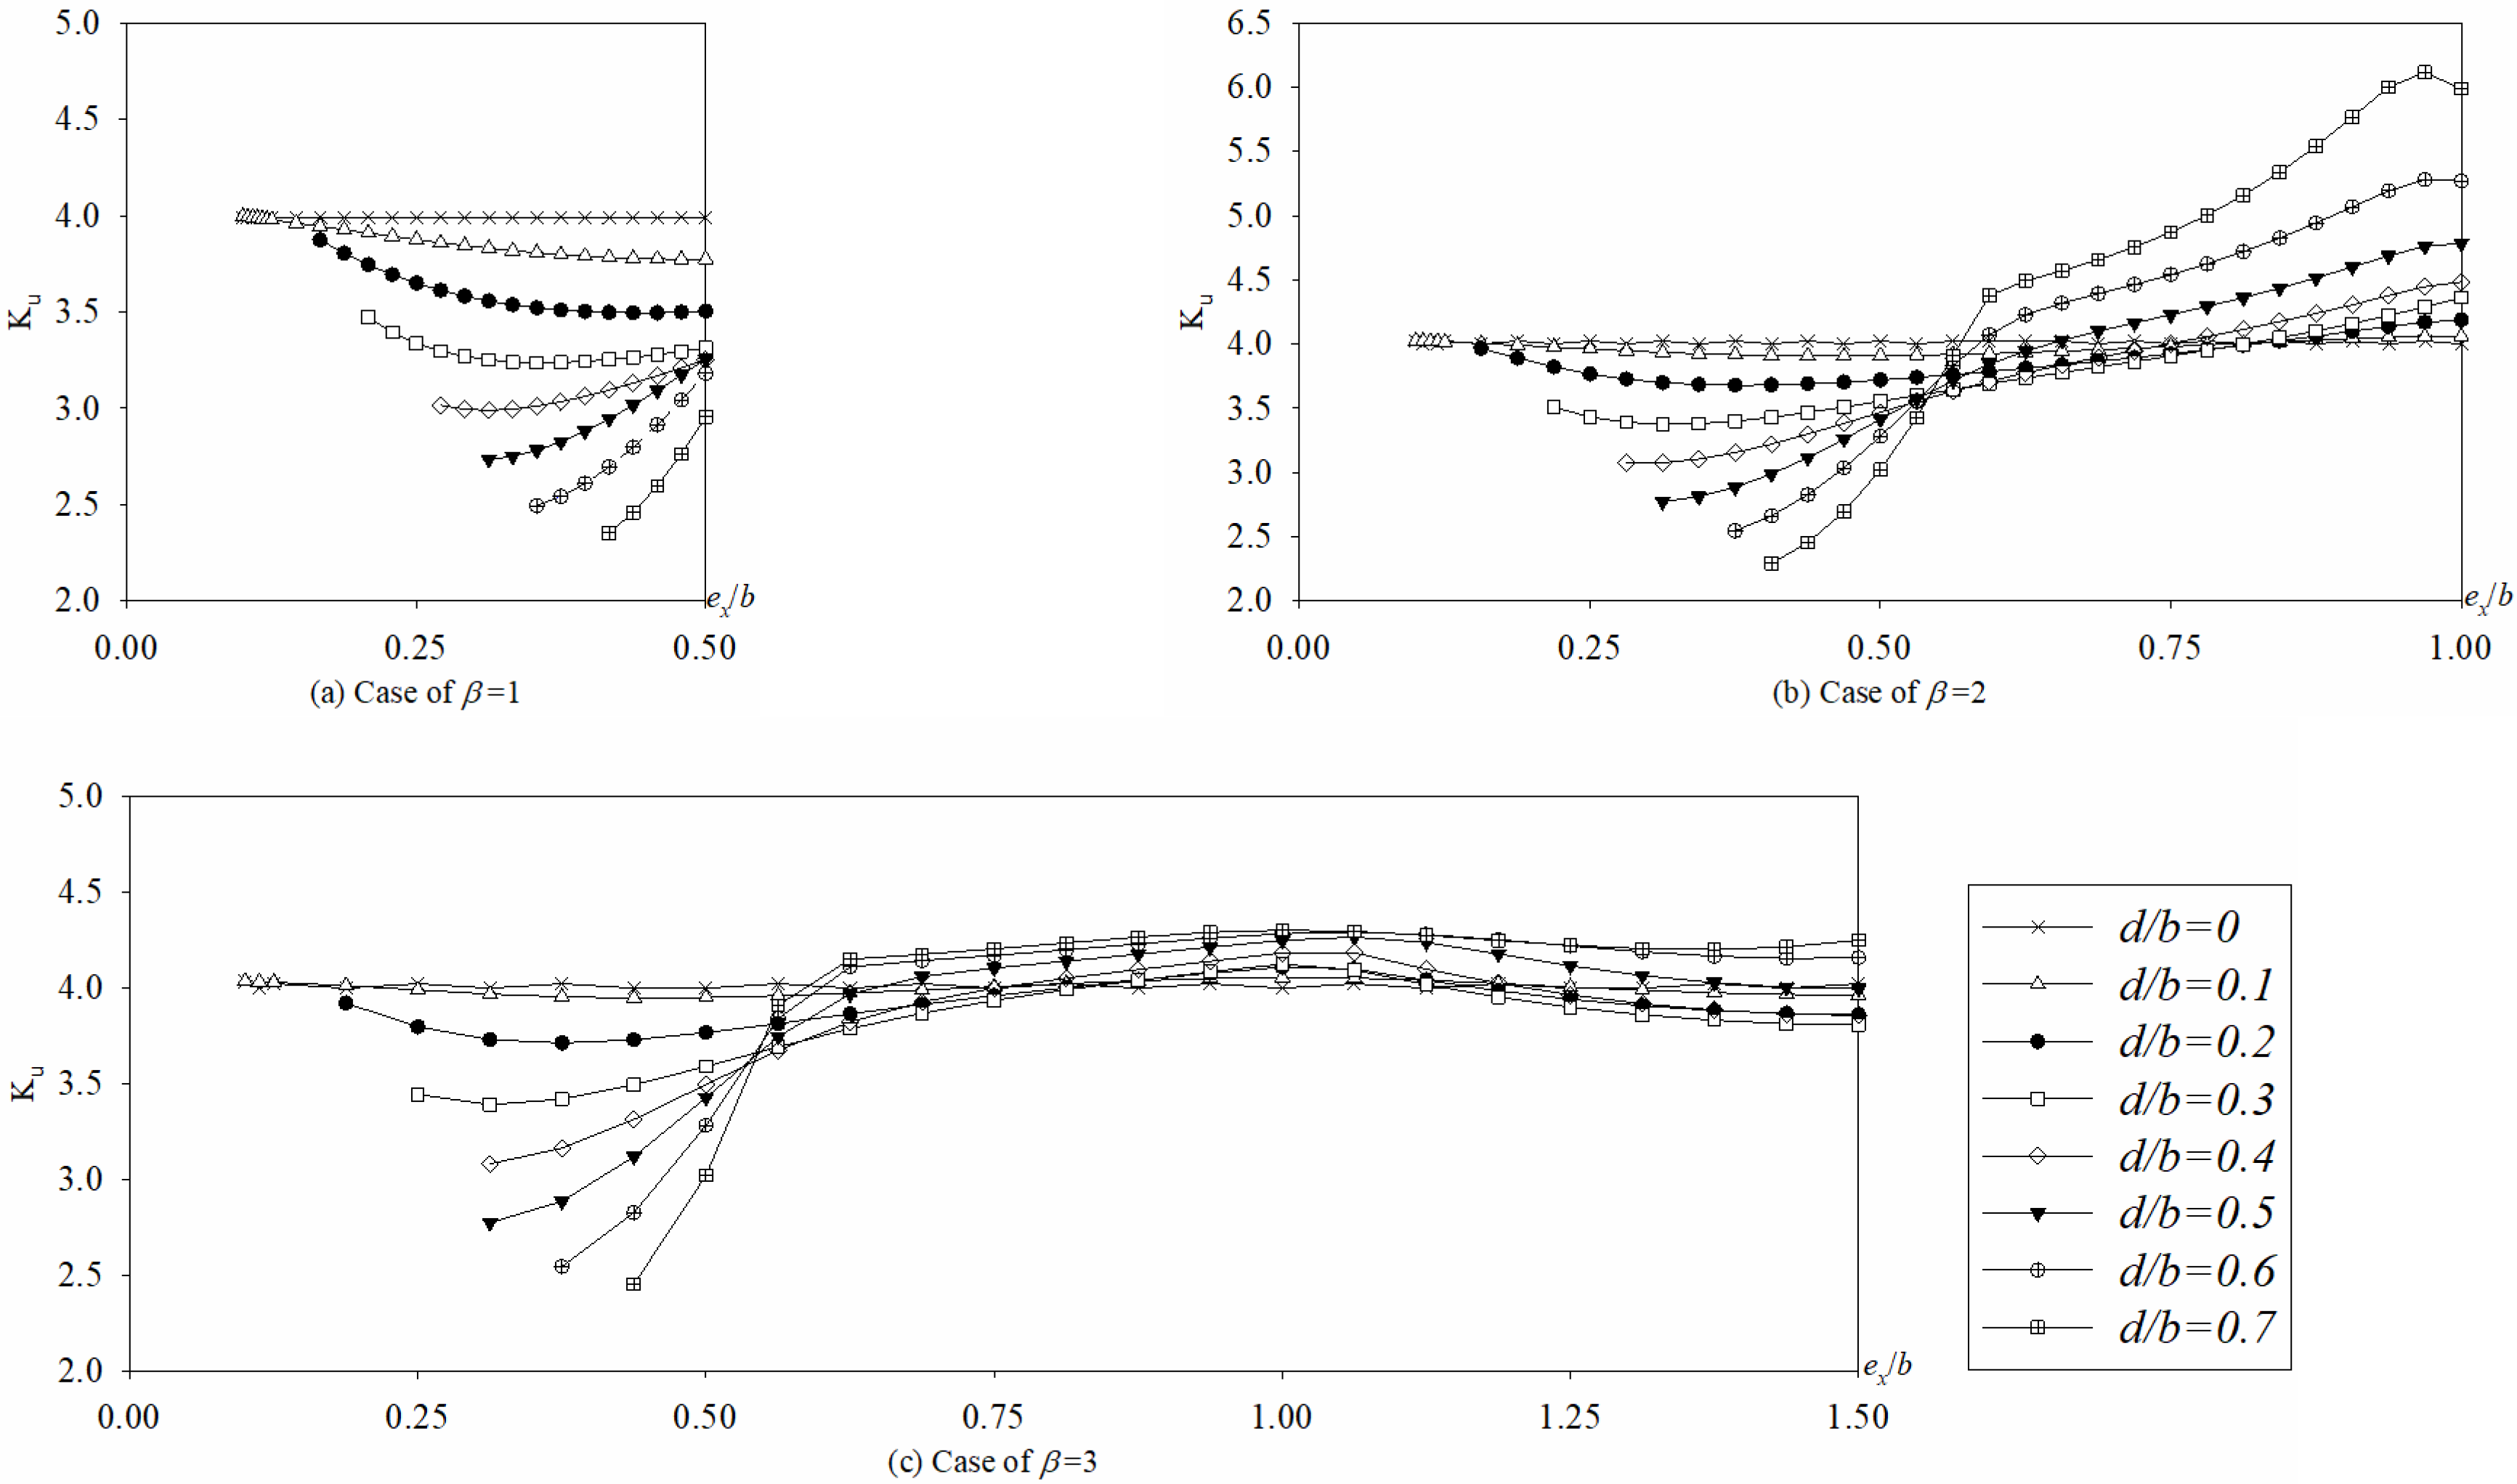
Figure 16a~d show the change in Ku as hole position parameter ex/b is enlarged with the BCs of 4S, for different d/b from 0 to 0.7 and different plate aspect ratios β from 1 to 4. It can be seen that hole position parameter ex/b has a little effect on Ku for d/b = 0.1, especially as the plate aspect ratios β enlarged. It also can be seen that all the curves are very similar in trends and values with the same d/b when ex/b is less than 0.5. It means that when β is an integer greater than 1 and ex/b is less than 0.5, the buckling coefficient Ku can be taken as a square plate with the same width b, the same hole d/b, and the same FRP pasting. It also can be seen from the figures that as ex/b is enlarged from 0 to 0.5, Ku decreases but gradual slow for d/b is 0.1, and first increases and then decrease for d/b is 0.2 and 0.3, and drastically increases for d/b is from 0.4 to 0.7. It means that when d/b is bigger than 0.4 and ex/b is less than 0.5, the buckling coefficient Ku is very unstable, so it should be avoided to place big hole too close to the loading edge. For ex/b is bigger than 0.5, Ku shows little variation with d/b and ex/b, except when β = 2 and d/b is bigger than 0.4. Figure 16b shows that for β = 2 and ex/b = 1, Ku increases from 4.48 to 5.99 as d/b is enlarged from 0.4 to 0.7, this also proves the necessity of placing the big hole in the middle area of the plate.
Figure 17a~d show the change in Ku as hole position parameter ex/b is enlarged with the BCs of 3S1F , for different d/b from 0 to 0.7 and different plate aspect ratios β from 1 to 4. In general, Ku of plates with BCs of 3S1F is very small, and the curves shows that Ku keeps almost constant irrespective of ex/b when β = 1, 2, and β = 3 (or 4) with d/b less than 0.3. When β = 3 (or 4) and d/b ≥ 0.3, Ku increases as the hole moves away from the loading edge towards its center along x-axis. Take β = 3 and d/b = 0.7 for example, as ex/b is enlarged from 0.375 to 1.5, Ku increases from 0.41 to 0.47. Therefore, it is also recommended to place the big hole close to the middle area of the plate in x-axis with the BCs of 3S1F when β is bigger than 3.
5.3.2. Hole Position Varying Along y-Axis
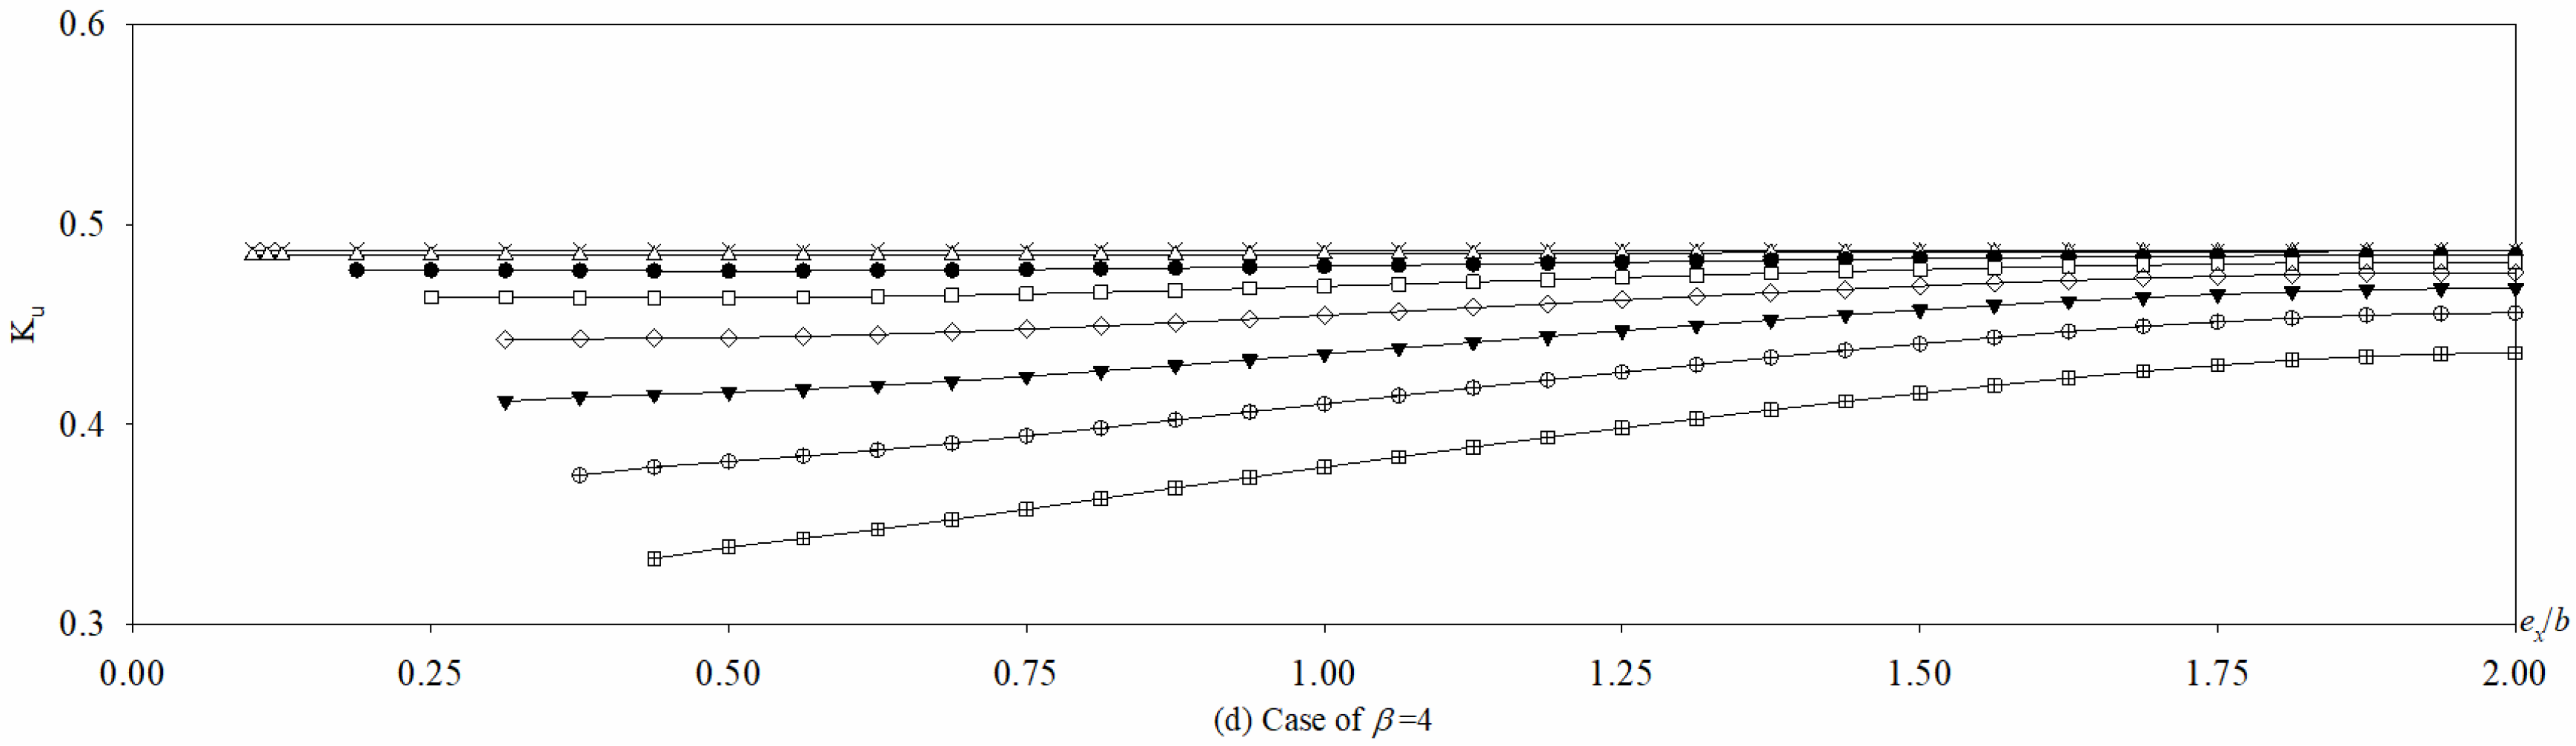
Figure 18 shows the change in Ku as hole position parameter ey/b is enlarged from 0.5 to 0.9 with the BCs of 4S, for different d/b from 0 to 0.7, different plate aspect ratios β from 1 to 4, and different ex/b = 0.5, 1.0, 1.5, and 2.0. The center of the hole is halfway between nodal cross lines when ex/b = 0.5 and 1.5, and the center of the hole is at the nodal cross line when ex/b = 1 and 2. It could be noticed that for a small hole d/b (e.g., d/b = 0.1 and 0.2), there are little effect of the hole location ey/b on Ku, and the effect becomes more pronounced as hole size d/b increases. When d/b ≥ 0.2 in Figure 18a~d, it can be seen that the curves are very similar irrespective of β, that is: with the increasing of ey/b, Ku will decrease dramatically as ey/b is enlarged, especially when d/b ≥ 0.4. Take β = 3, ex/b = 0.5 and d/b = 0.6 for example, as ey/b is enlarged from 0.5 to 0.65, Ku decreases from 3.28 to 2.20, this decline is very severe. The curves with ex/b = 1 in Figure 18e~g are also very similar, and the law of changes are similar to curves with ex/b = 0.5 (Figure 18a~d). What’s different is that for curves in Figure 18e~g, when ey/b is less than 0.575, Ku is bigger than 4 which is the Ku of plate without a hole. The law of changes in Figure 18h~j are between figures discussed above.
Figure 19 shows the change in Ku as hole position parameter ey/b is enlarged from 0.05 to 0.95 with the BCs of 3S1F, for different d/b from 0 to 0.7 and different plate aspect ratios β from 1 to 4. It can be seen that the Ku of plates with BCs of 3S1F is much less than those with BCs of 4S, especially when β is bigger than 1. The figure also shows that when the hole size d/b is smaller than a specific value (for β = 1: 0.1; β = 2: 0.1; β = 3: 0.3; β = 4: 0.4 ), there is a little effect of the hole position ey/b on buckling coefficient Ku and the d/b effect becomes more pronounced as d/b increases.
Over all, for a small hole size, there is little effect of the hole position ey/b on buckling coefficient Ku regardless of the BCs (4S or 3S1F), and becomes more pronounced as d/b increases. The plate’s stability improves as the hole places near the middle of the plate for 4S and the simple support edge for 3S1F in y-axis.
5.3.3. Hole Size d/b
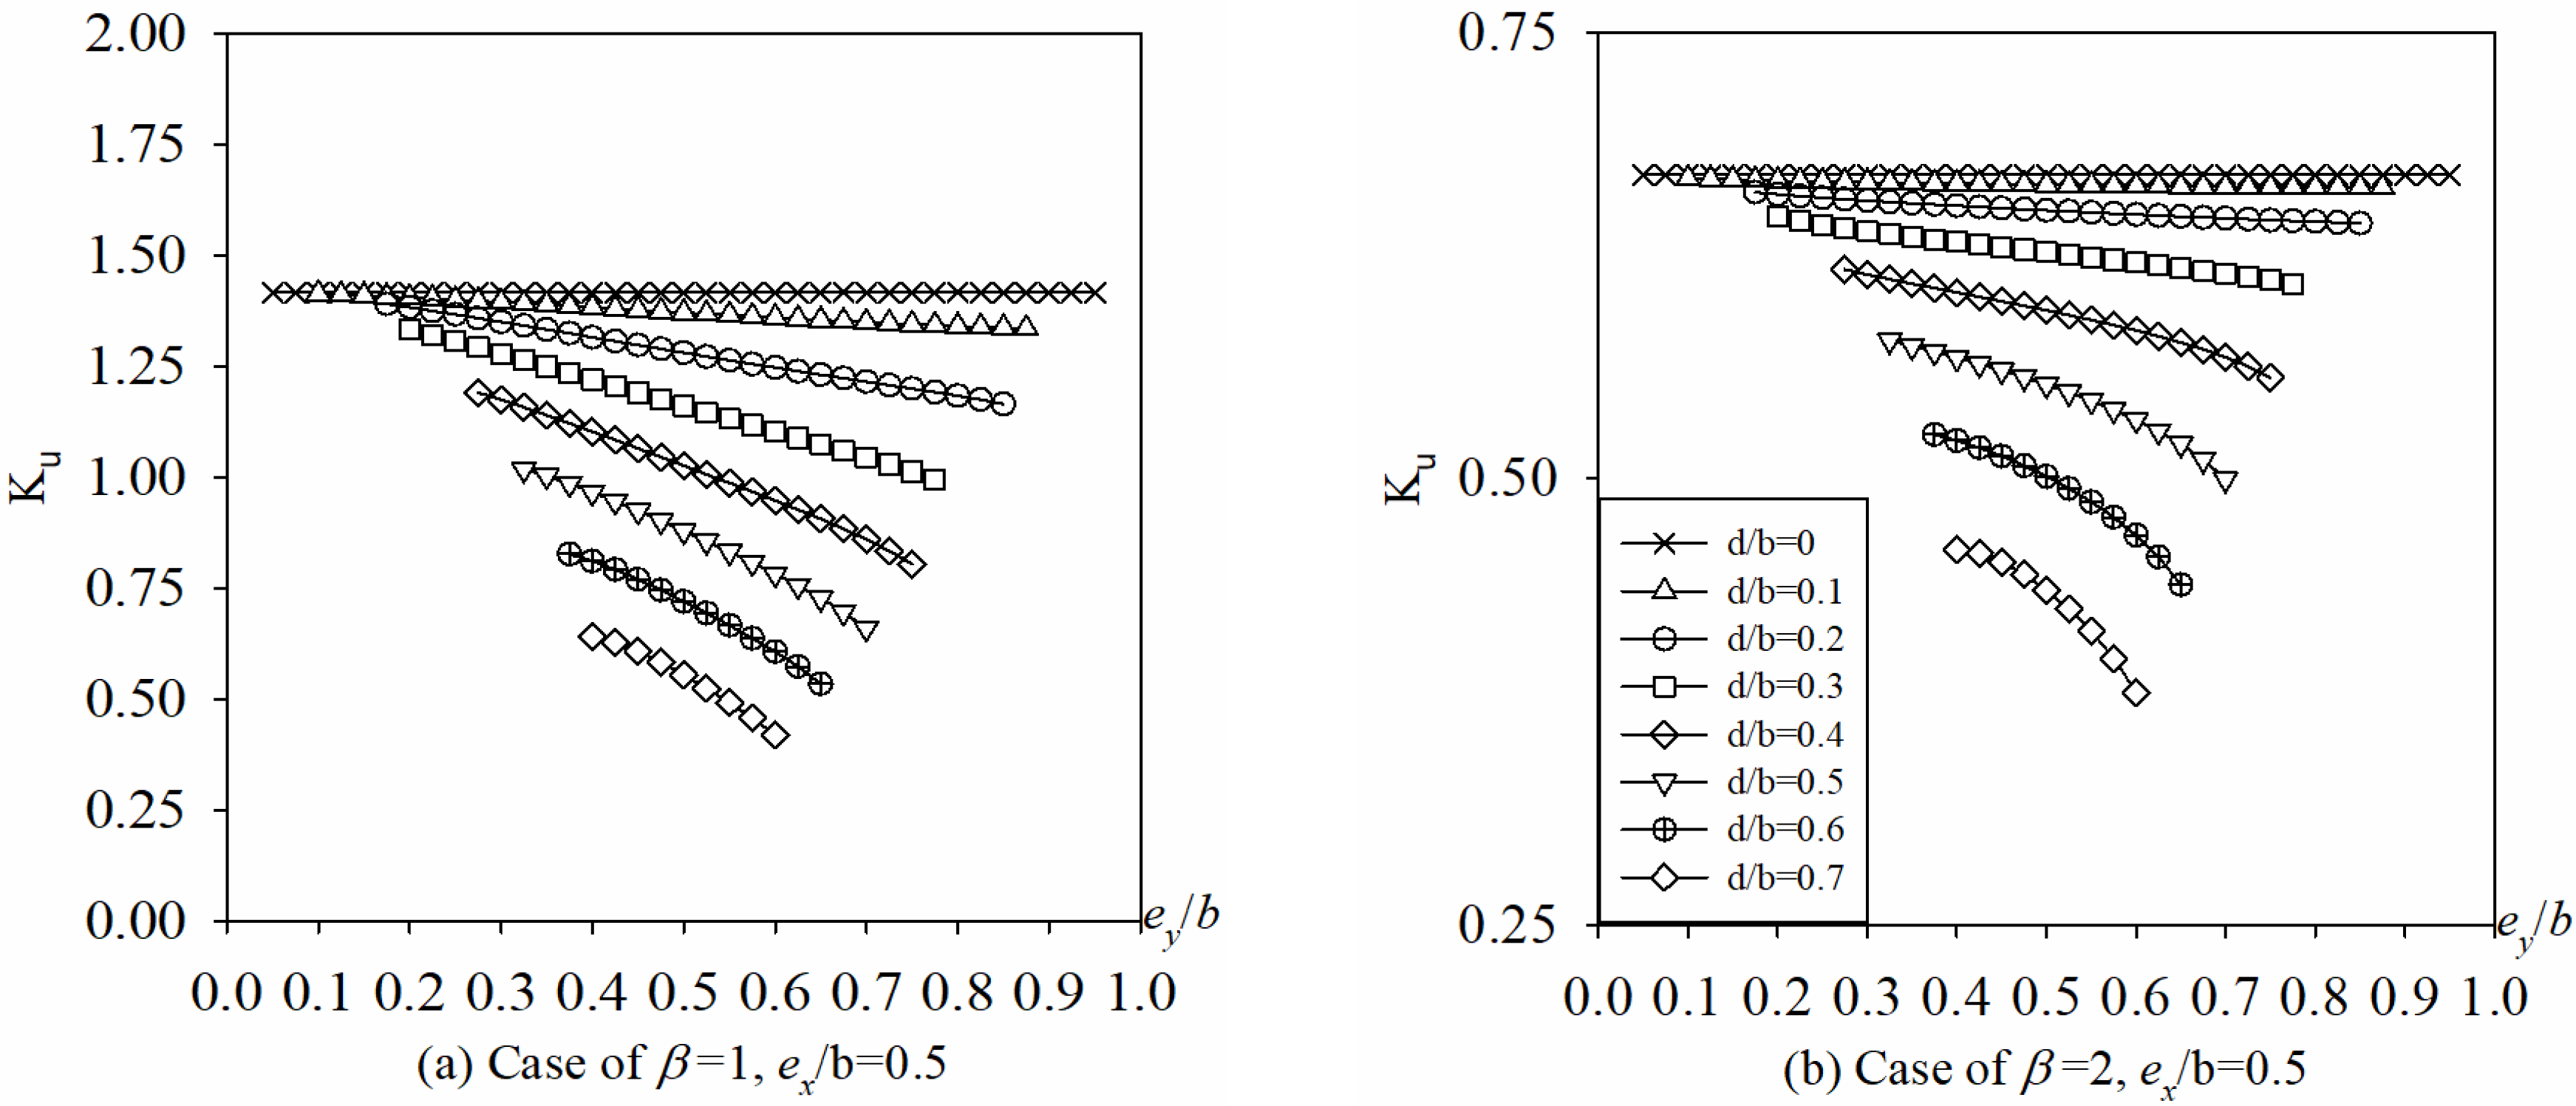
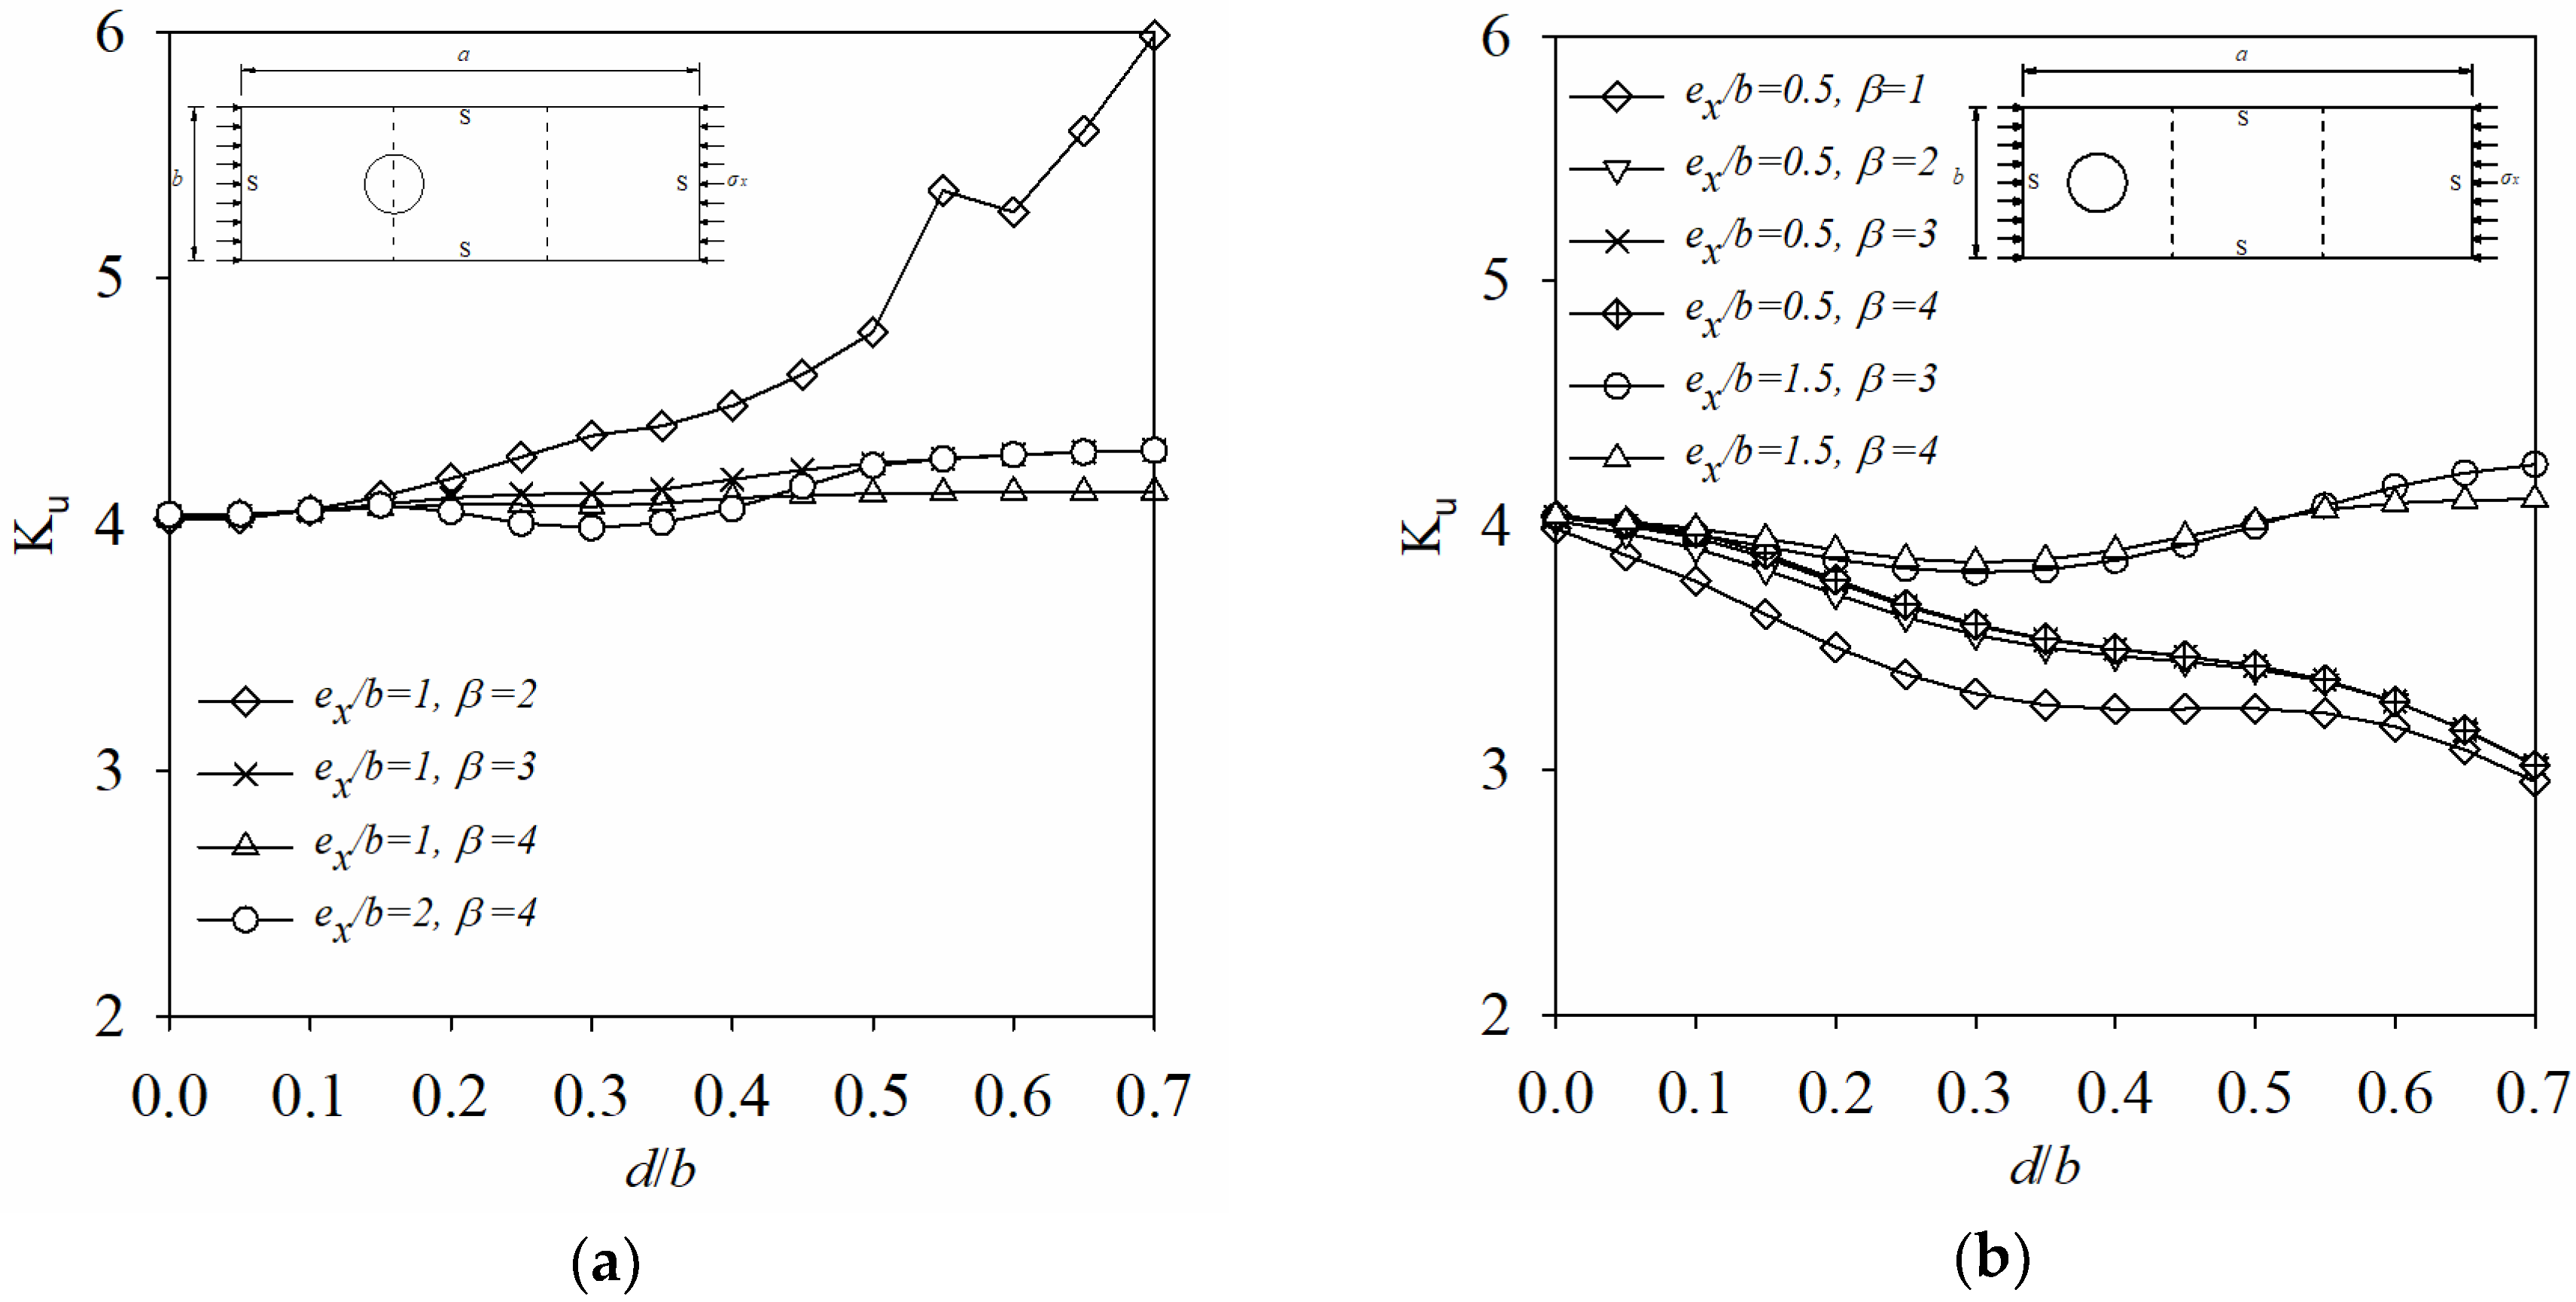
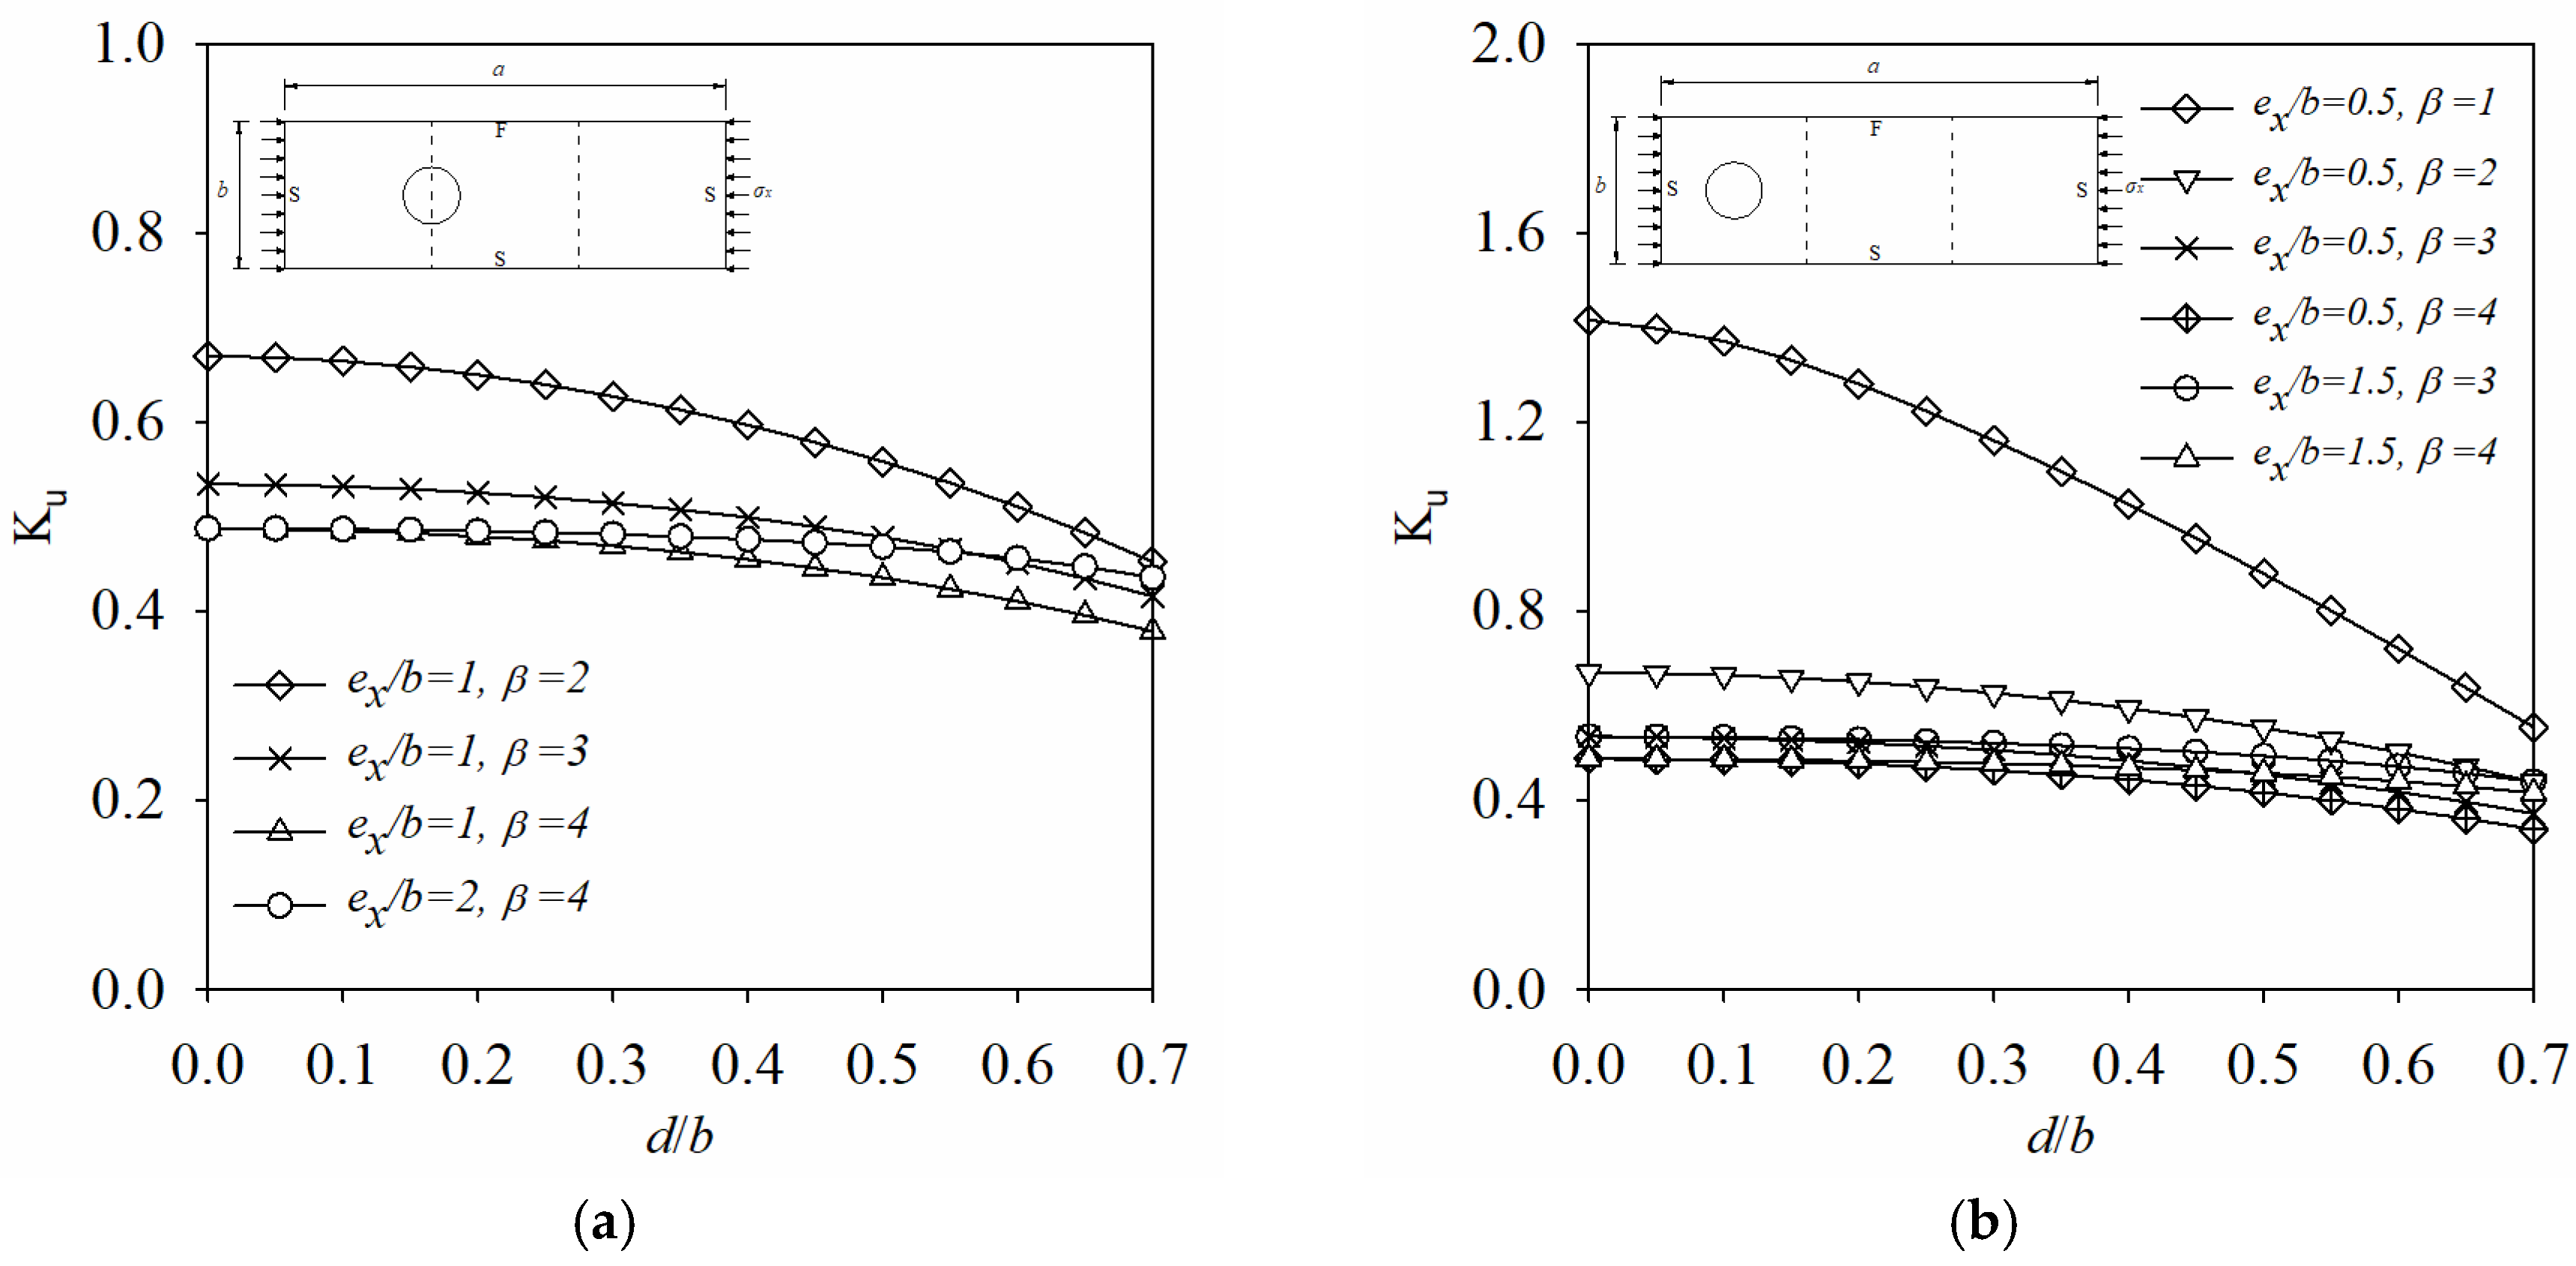
Figure 20 show the change in Ku as d/b is enlarged from 0 to 0.7 with the BCs of 4S. When ex/b is 1 or 2, the center of opening is in the node point. And when ex/b is 0.5 or 1.5, the center of opening is in the middle of the node points. As shown Figure 20, two different behaviors can be seen depending on the hole in the node point or in the middle of the node points. When the hole is at the node point (ex/b is 1 or 2), it is evident from the figure that Ku show an increasing trend as d/b is enlarged, for β = 2, Ku will increase from 4.02 to 5.99 as d/b is enlarged from 0 to 0.7, it is much better than that of all other cases. It also can be seen some discontinuities in the curves. Such discontinuities can be explained by the buckling mode shapes changing of the plate under compression, take β = 2 and ex/b = 1 for example, when d/b increases from 0 to 0.7, the buckling mode has changed from 2 half-waves to 3 half-waves (seen from Figure 10). On the other hand, when the hole is in the middle of the node points (ex/b is 0.5 or 1.5), Ku of plates with ex/b = 1.5 first decrease slowly and then increase as d/b is enlarged, and decreases gradually as d/b is enlarged for plates with ex/b = 0.5. At the same time, we found that the Ku of plates with ex/b = 1.5 are always bigger than those of plates with ex/b = 0.5. For a plate under uniaxial compression, the nodal cross-lines (the dotted line in the figures) act as imaginary supports for the plate in the lateral direction and the resistance to buckling is provided by the bending stiffness of the plate parts between these nodal cross lines, when the center of opening is in the node point, the bending stiffness will show little reduction, and when the hole is in the middle of the node points, it will reduce its bending stiffness and then reduce its buckling load and buckling coefficient, and Ku will further reduce as d/b increases, this can explain the phenomenon of Ku with ex/b = 1 and 2 are bigger than those of plates with ex/b = 0.5 and 1.5. Therefore, it is recommend to put the hole in the node point in design.
Figure 21 show the change in Ku as d/b is enlarged from 0 to 0.7 with the BCs of 3S1F. It is obviously that the buckling coefficient Ku of all the plates decrease as d/b is enlarged, especially for ex/b = 0.5 and β = 1, Ku decreases from 1.42 to 0.55 as d/b is enlarged from 0 to 0.7. Unlike the BCs of 4S, where the change rules of Ku relies on β and ex/b, Ku decreases rapidly as d/b increases irrespective of β and ex/b for plates with BCs of 3S1F, This phenomenon also can be explained as the buckling mode shapes are the same in all cases (seen from Figure 13). Meanwhile, by comparing Figure 21 with Figure 20, it is clear that Ku of plates with BCs of 3S1F are far less than those of 4S.
6. An Example for the Usage of the Proposed Method
Example calculation for the ultimate capacity of a perforated plate strengthened with FRP under uniaxial compression, according to the winter equations in (22)~(24), where ρ is a slenderness reduction factor, λ is the plate slenderness, fy is the yield stress of the steel, and fcr is the critical stress. fcr can be calculated using this method of this paper.
The basic parameters of the example (Table 2, No. 7):
- a = b = 240 mm, d/b = 0.1, ex/b = 0.5, ex/b = 0.5, ts = 2.61 mm, tf0 = 0.167 mm, nf = 1, Es = 2.0 × 10⁵ MPa, Ef = 2.6 × 10⁵ MPa, υs = 0.3, υf = 0.25, fy = 287.8 MPa, BCs: 4S.
The critical stress fcrCal:
- tt = 2.61 + 0.167 = 2.777 (mm), , < 0.2,
- ,
- ω = = 0.0784, from Equation (20)
- = 90.13 (MPa).
The ultimate capacity PuCal:
- ,
The experimental values of critical stress fcrExp and ultimate load PuExp are 92.87 MPa and 96.64 KN, it is obvious that the values of fcrCal and PuCal are very close to fcrExp and PuExp, respectively. Other plates are also calculated using this method and plotted in Table 2.
7. Conclusions and Recommendations
In order to study the elastic stability and propose a calculation method of perforated plates strengthened with FRP under uniaxial compression, series of FE models are built and several parameters are considered in the study: material’s geometrical and mechanical properties, boundary conditions, plate aspect ratio, hole sizes, and hole position. A calculation method of buckling stress is proposed and modified based on the theory of composite plate and the numerical results. In addition to the detailed discussion and conclusions given in the previous section, some general conclusions and recommendations can be summarized as follows:
- The theory of composite plate proposed by Pister is available to calculate the flexural rigidity of the pure steel plate and the perfectly bonded layered plate, but it should be modified when calculating the flexural rigidity of the perfectly bonded layered plate due to not considered the orthotropic properties of FRP.
- The buckling coefficient k needs to be modified as Ku which considers the change of plate aspect ratio β, hole sizes d/b and the hole position ex (or ey).
- For BCs of 4S, when ex/b is an integer, the buckling mode shapes change as d/b is enlarged, which cause some discontinuities in Ku vs. d/b curves (Figure 20). And for BCs of 3S1F, the buckling mode shapes is unchanged irrespective of d/b.
- For BCs of 4S, as ex/b is enlarged from 0 to 0.5, Ku decreases but gradual slow for d/b is 0.1, and first increases and then decrease for d/b is 0.2 and 0.3, and drastically increases for d/b is enlarged from 0.4 to 0.7. It means that when d/b is bigger than 0.4 and ex/b is less than 0.5, the buckling coefficient Ku is very unstable, so it should be avoided to place big hole too close to the loading edge in x-axis, especially when d/b is bigger than 0.4.
- For BCs of 3S1F, Ku is very small and stable irrespective of ex/b when β = 1, 2, and β = 3 (or 4) with d/b less than 0.4. When β = 3 or 4 and d/b is bigger than 0.4, Ku increases as the hole moves away from the loading edge towards its center along x-axis. Therefore, it is recommended to place the big hole (d/b ≥ 0.4) close to the middle area of the plate in x-axis, especially when d/b is bigger than 0.4.
- For a small hole size, there is little effect of the hole position ey/b on buckling coefficient Ku regardless of the BCs (4S or 3S1F), and that effect becomes more pronounced as d/b increases. So it is recommended to put the holes near the middle of the plate for 4S and the simple support edge for 3S1F in y-axis.
- As shown in Table 2, the buckling stresses and ultimate loads calculated by the proposed method of this paper combining with the winter equation are very close to the experimental values.
Acknowledgments
The major source of funding for this project was provided by the School of Civil Engineering, Southeast University, China. The authors would also like to express their gratitude to National 973 Plan Program (No. 2012CB026200) for financial support and to Key Laboratory of Concrete and Prestressed Concrete Structures of Ministry of Education for technical support.
Author Contributions
Xin Tao, Long Zhang and Shuangyin Cao conceived and designed the experiments; Xin Tao and Long Zhang performed the experiments; Xin Tao, Shuangyin Cao and Long Zhang analyzed the data; Xin Tao and Long Zhang contributed analysis tools; Xin Tao wrote the paper. Xin Tao, Long Zhang and Shuangyin Cao have made substantial contributions to revise the manuscript.
Conflicts of Interest
The authors declare no conflict of interest.
Glossary/Nomenclature/Abbreviations
| a,b | the lengths in the longitudinal (transverse) directions |
| ts | the thicknesses of the steel plate |
| tf | the total thicknesses of FRP sheet |
| nf | FRP Layers’ number |
| tf0 | single layer of FRP sheet’s thickness |
| d | diameter of the hole |
| ex(y) | the distance along x(y)-axis from the center of the hole to the left(bottom) edge |
| ES,Ef | the elastic modulus of steel and FRP |
| νs,νf | the Poisson ratio of steel and FRP |
| β | Plate aspect ratio, equal to b/a |
| k | the buckling coefficient |
| the flexural rigidity of plate without FRP and strengthened with FRP | |
| fcr | the critical stress of the plate |
| Pcr | the critical load of the plate |
| Pu | the ultimate load of the plate |
| α | reinforcement index of FRP, calculated by Equation (8) |
| γ | reinforcement index of FRP, calculated by Equation (9) |
| ω | reinforcement index of FRP, calculated by Equation (16) |
| Ku | the modified buckling coefficient |
References
- El-Sawy, K.M.; Nazmy, A.S. Effect of aspect ratio on the elastic buckling of uniaxially loaded plates with eccentric holes. Thin Walled Struct. 2001, 39, 983–998. [Google Scholar] [CrossRef]
- Shanmugam, N.E.; Thevendran, V.; Tan, Y.H. Design Formula for Axially Compressed Perforated Plates. Thin Walled Struct. 1999, 34, 1–20. [Google Scholar] [CrossRef]
- Brown, C.J.; Yettram, A.L. The elastic stability of square perforated plates under combinations of bending, shear and direct load. Thin Walled Struct. 1986, 4, 239–246. [Google Scholar] [CrossRef]
- Brown, C.J.; Yettram, A.L.; Burnett, M. Stability of plates with rectangular holes. J. Struct. Eng. 1987, 113, 1111–1116. [Google Scholar] [CrossRef]
- Cheng, B.; Zhao, J. Strengthening of Perforated Plates under Uniaxial Compression: Buckling Analysis. Thin Walled Struct. 2010, 48, 905–914. [Google Scholar] [CrossRef]
- Shaat, A.; Fam, A. Fiber-Element Model for Slender HSS Columns Retrofitted with Bonded High-Modulus Composites. J. Struct. Eng. 2007, 133, 85–95. [Google Scholar] [CrossRef]
- Shaat, A.; Fam, A. Axial loading tests on short and long hollow structural steel columns retrofitted using carbon fibre reinforced polymers. Can. J. Civ. Eng. 2006, 33, 458–470. [Google Scholar] [CrossRef]
- Shaat, A.; Fam, A. Strengthening of short HSS steel columns using FRP sheets. In Proceedings of the 4th International Conference Advanced Composite Materials Bridges Structures, Calgary, AB, Canada, 20–23 July 2004. [Google Scholar]
- Shaat, A.; Fam, A. Control of overall buckling of HSS slender steel columns using CFRP plates. In Proceedings of the First Asia Pacific conference FRP Structures (APFIS2007), Hong Kong, China, 12–14 December 2007; pp. 993–998. [Google Scholar]
- Harries, K.A.; Peck, A.J.; Abraham, E.J. Enhancing stability of structural steel sections using FRP. Thin Walled Struct. 2009, 47, 1092–1101. [Google Scholar] [CrossRef]
- Haedir, J.; Zhao, X.-L. Design of short CFRP-reinforced steel tubular columns. J. Construct. Steel Res. 2011, 67, 497–509. [Google Scholar] [CrossRef]
- Bambach, M.R. Axial Capacity and Crushing of Thin-Walled Metal, Fibre–epoxy and Composite Metal–fibre Tubes. Thin Walled Struct. 2010, 48, 440–452. [Google Scholar] [CrossRef]
- Bambach, M.R.; Elchalakani, M. Plastic Mechanism Analysis of Steel SHS Strengthened with CFRP under Large Axial Deformation. Thin Walled Struct. 2007, 45, 159–170. [Google Scholar] [CrossRef]
- Bambach, M.R.; Jama, H.H.; Elchalakani, M. Axial Capacity and Design of Thin-Walled Steel SHS Strengthened with CFRP. Thin Walled Struct. 2009, 47, 1112–1121. [Google Scholar] [CrossRef]
- Pister, K.S.; Dong, S.B. Elastic bending of layered plates. J. Eng. Mech. Div. 1959, 85, 1–10. [Google Scholar]
- Timoshenko, S.P.; Gere, J.M. Theory of Elastic Stability; McGraw-Hill Book Company: New York, NY, USA, 1961. [Google Scholar]
- Gerstle, K.H. Basic Structural Design; McGraw-Hill Book Company: New York, NY, USA, 1967. [Google Scholar]
- Bambach, M. 6-Strengthening of Thin-Walled (Hollow) Steel Sections Using Fibre-Reinforced Polymer (FRP) Composites. In Rehabilitation of Metallic Civil Infrastructure Using Fiber Reinforced Polymer (FRP) Composites, 1st ed.; Karbhari, V.M., Ed.; Woodhead Publishing: Cambridge, UK, 2014; pp. 140–168. ISBN 9780857096654. [Google Scholar]
- Tao, X.; Cao, S. Ultimate capacity of uniaxially compressed perforated steel plates strengthened by using CFRPs. In Civil, Architecture Environmental Engineering; CRC Press/Balkema: Leiden, The Netherlands, 2017; Volume 1, pp. 483–488. [Google Scholar] [CrossRef]
- Narayanan, R.; Chow, F.Y. Ultimate Capacity of Uniaxially Compressed Perforated Plates. Thin Walled Struct. 1984, 2, 241–264. [Google Scholar] [CrossRef]
Figure 1.
Geometry and Boundary conditions (BCs) of the perforated plates strengthened with fiber-reinforced polymers (FRP).
Figure 1.
Geometry and Boundary conditions (BCs) of the perforated plates strengthened with fiber-reinforced polymers (FRP).

Figure 2.
The common cross sections and deformations under compression. (a) Rectangle section; (b) L section; (c) T section.
Figure 2.
The common cross sections and deformations under compression. (a) Rectangle section; (b) L section; (c) T section.

Figure 3.
A composite plate with the associated system.

Figure 4.
Variation of Stiffness enhancing ratio Dt/D0 calculated by Equation (10) as a function of γ.
Figure 4.
Variation of Stiffness enhancing ratio Dt/D0 calculated by Equation (10) as a function of γ.

Figure 5.
Variation of Stiffness enhancing ratio Dt/D0 calculated by Equation (11) as a function of γ.
Figure 5.
Variation of Stiffness enhancing ratio Dt/D0 calculated by Equation (11) as a function of γ.

Figure 6.
Test rig setup.
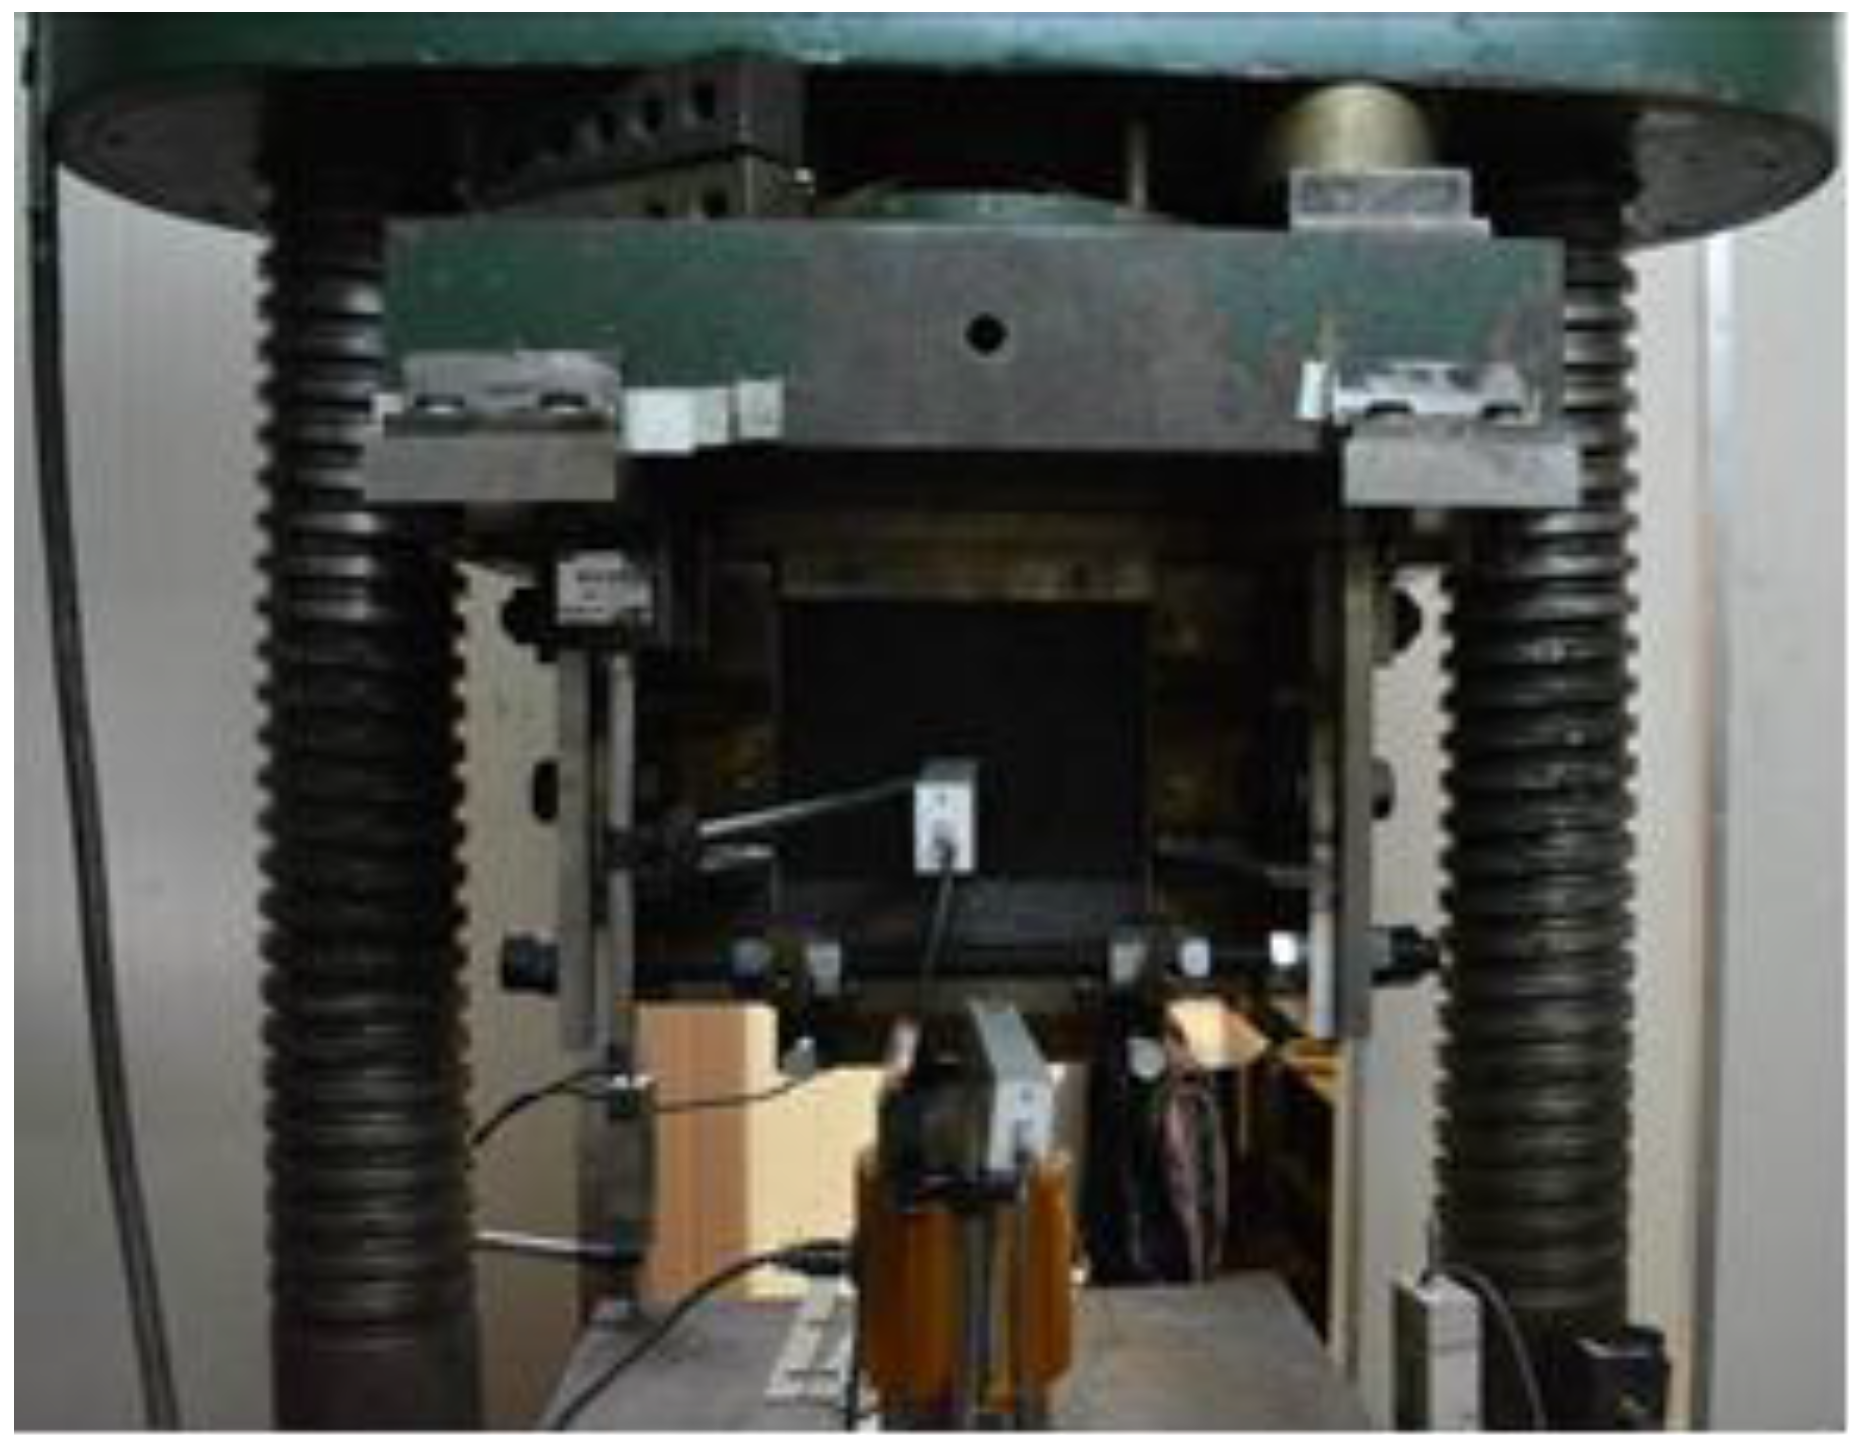
Figure 7.
A classic perforated plate strengthened with FRP.

Figure 8.
Examples of four typical plate models’ meshes. (a) case of β = 1; (b) case of β =2; (c) case of β = 3; (d) case of β = 4.
Figure 8.
Examples of four typical plate models’ meshes. (a) case of β = 1; (b) case of β =2; (c) case of β = 3; (d) case of β = 4.
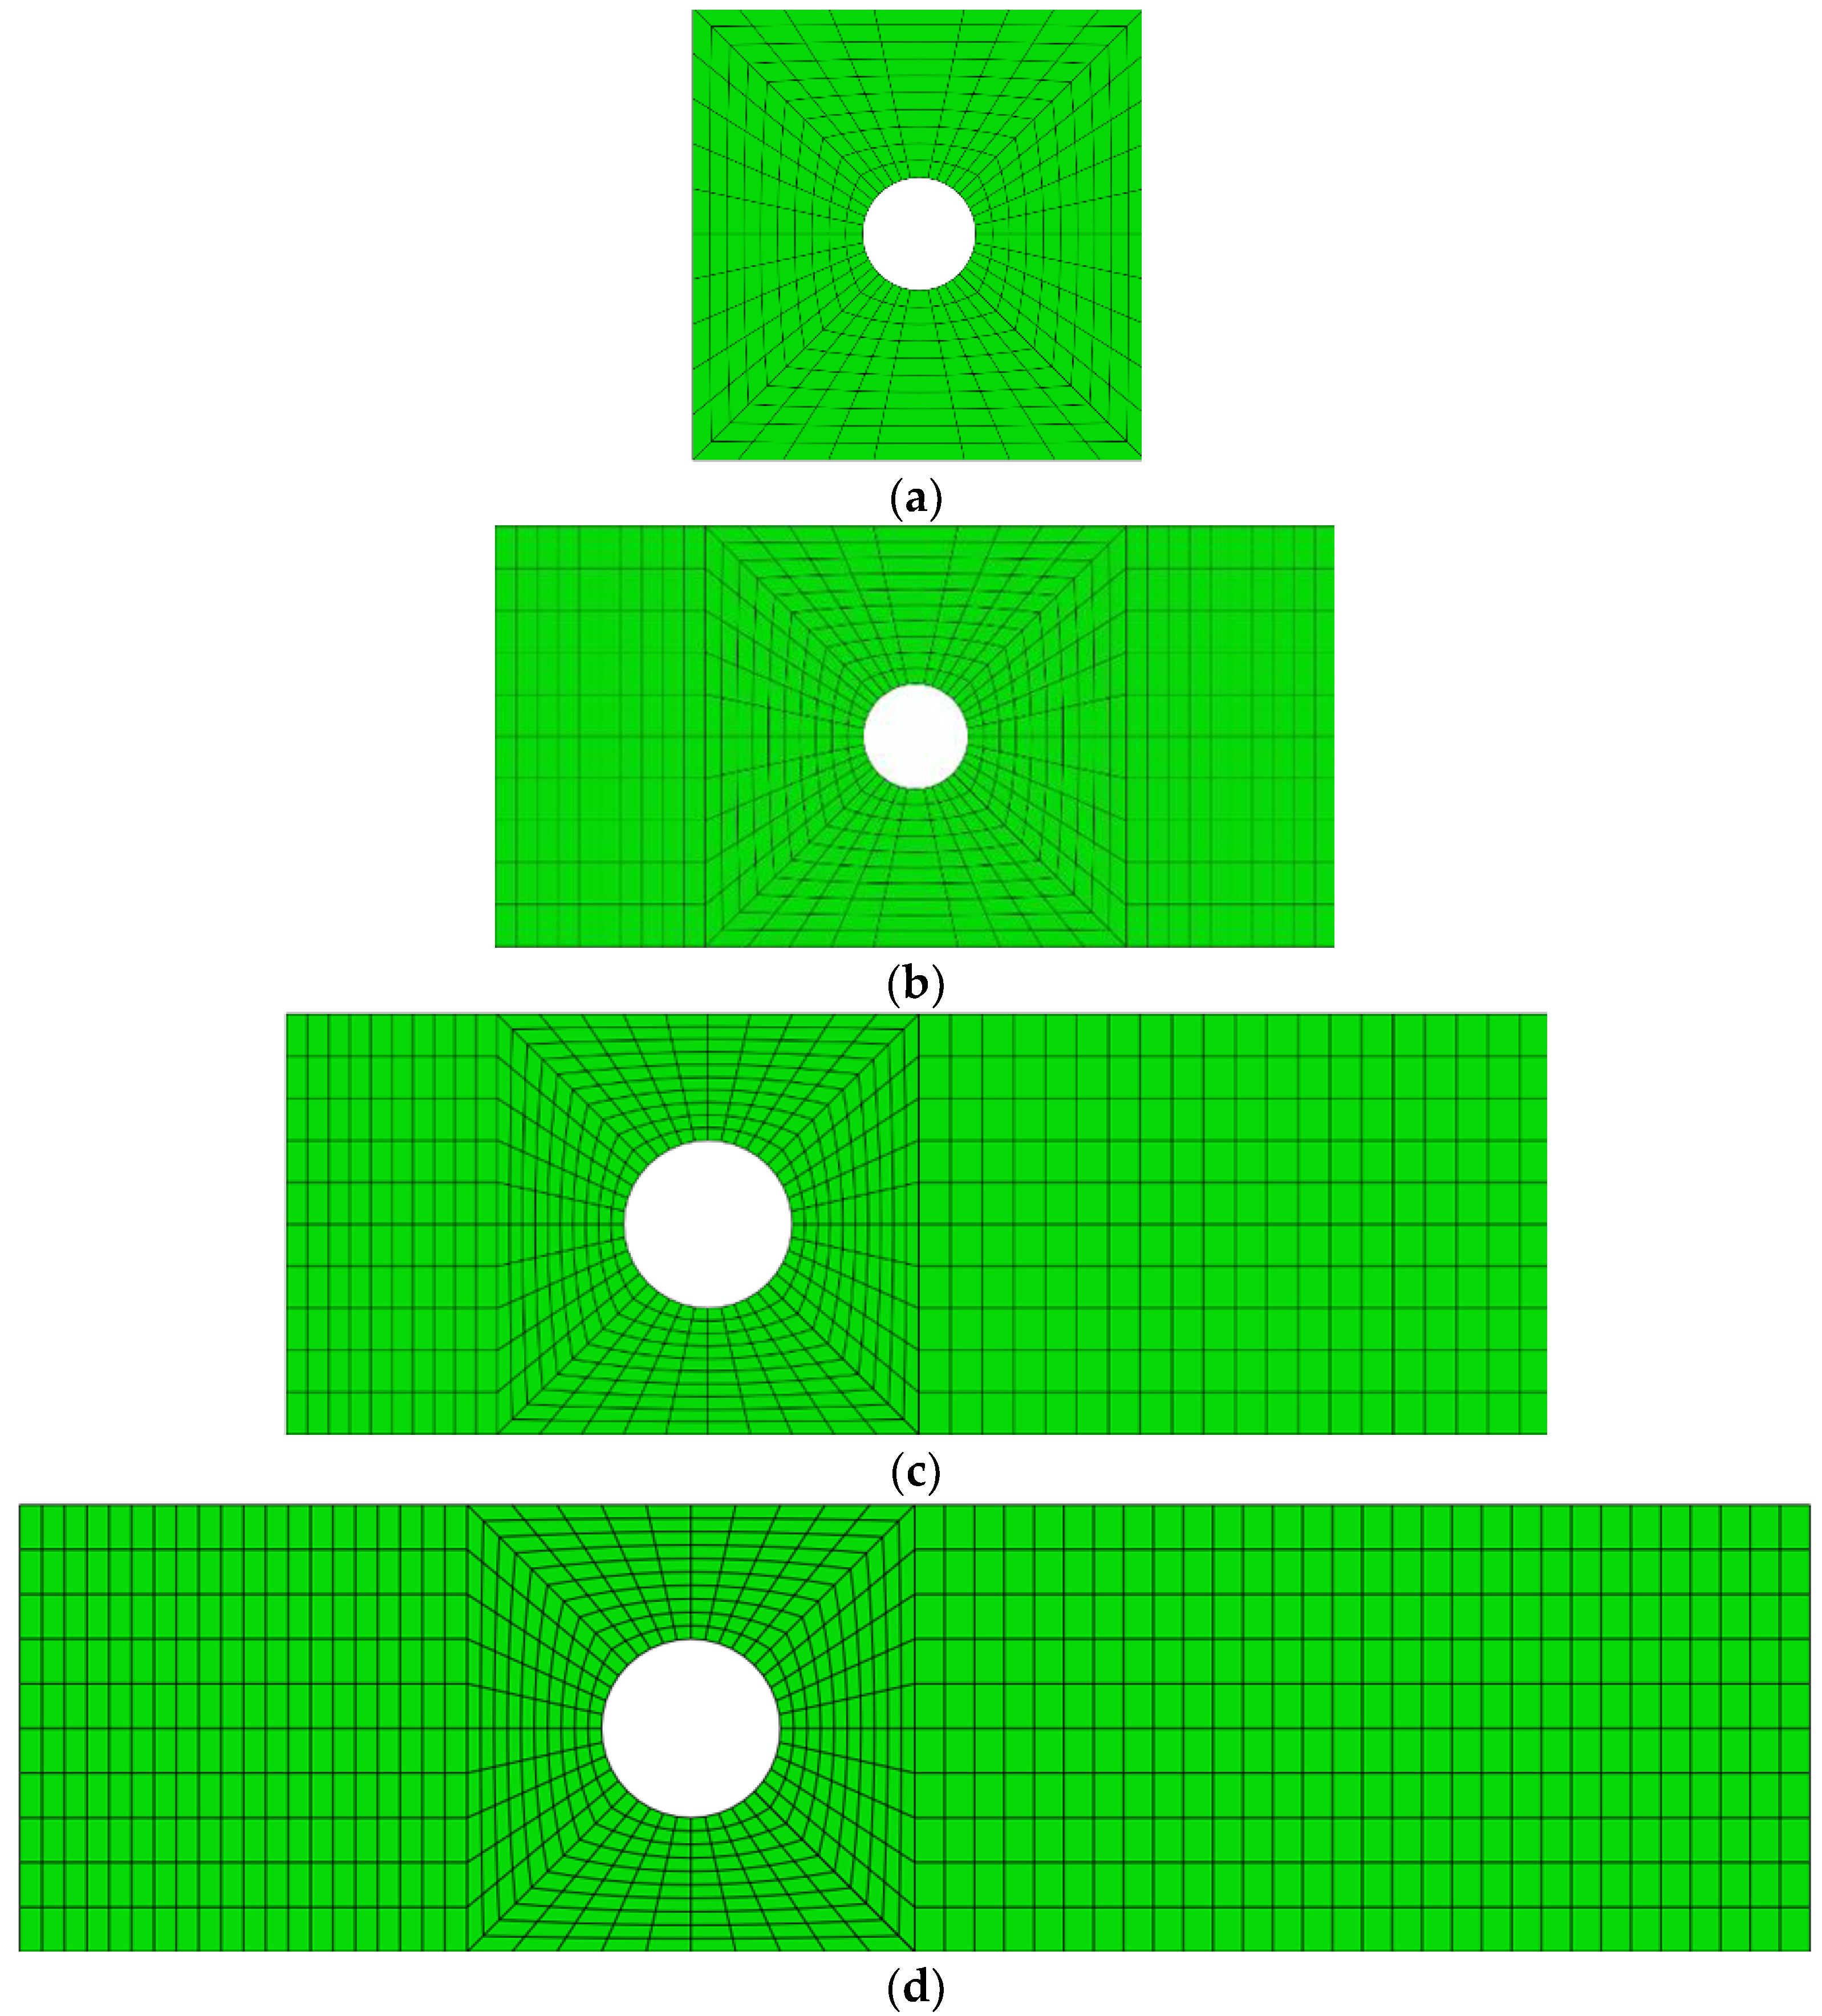
Figure 9.
Finite element (FE) models converge using mesh refinement.
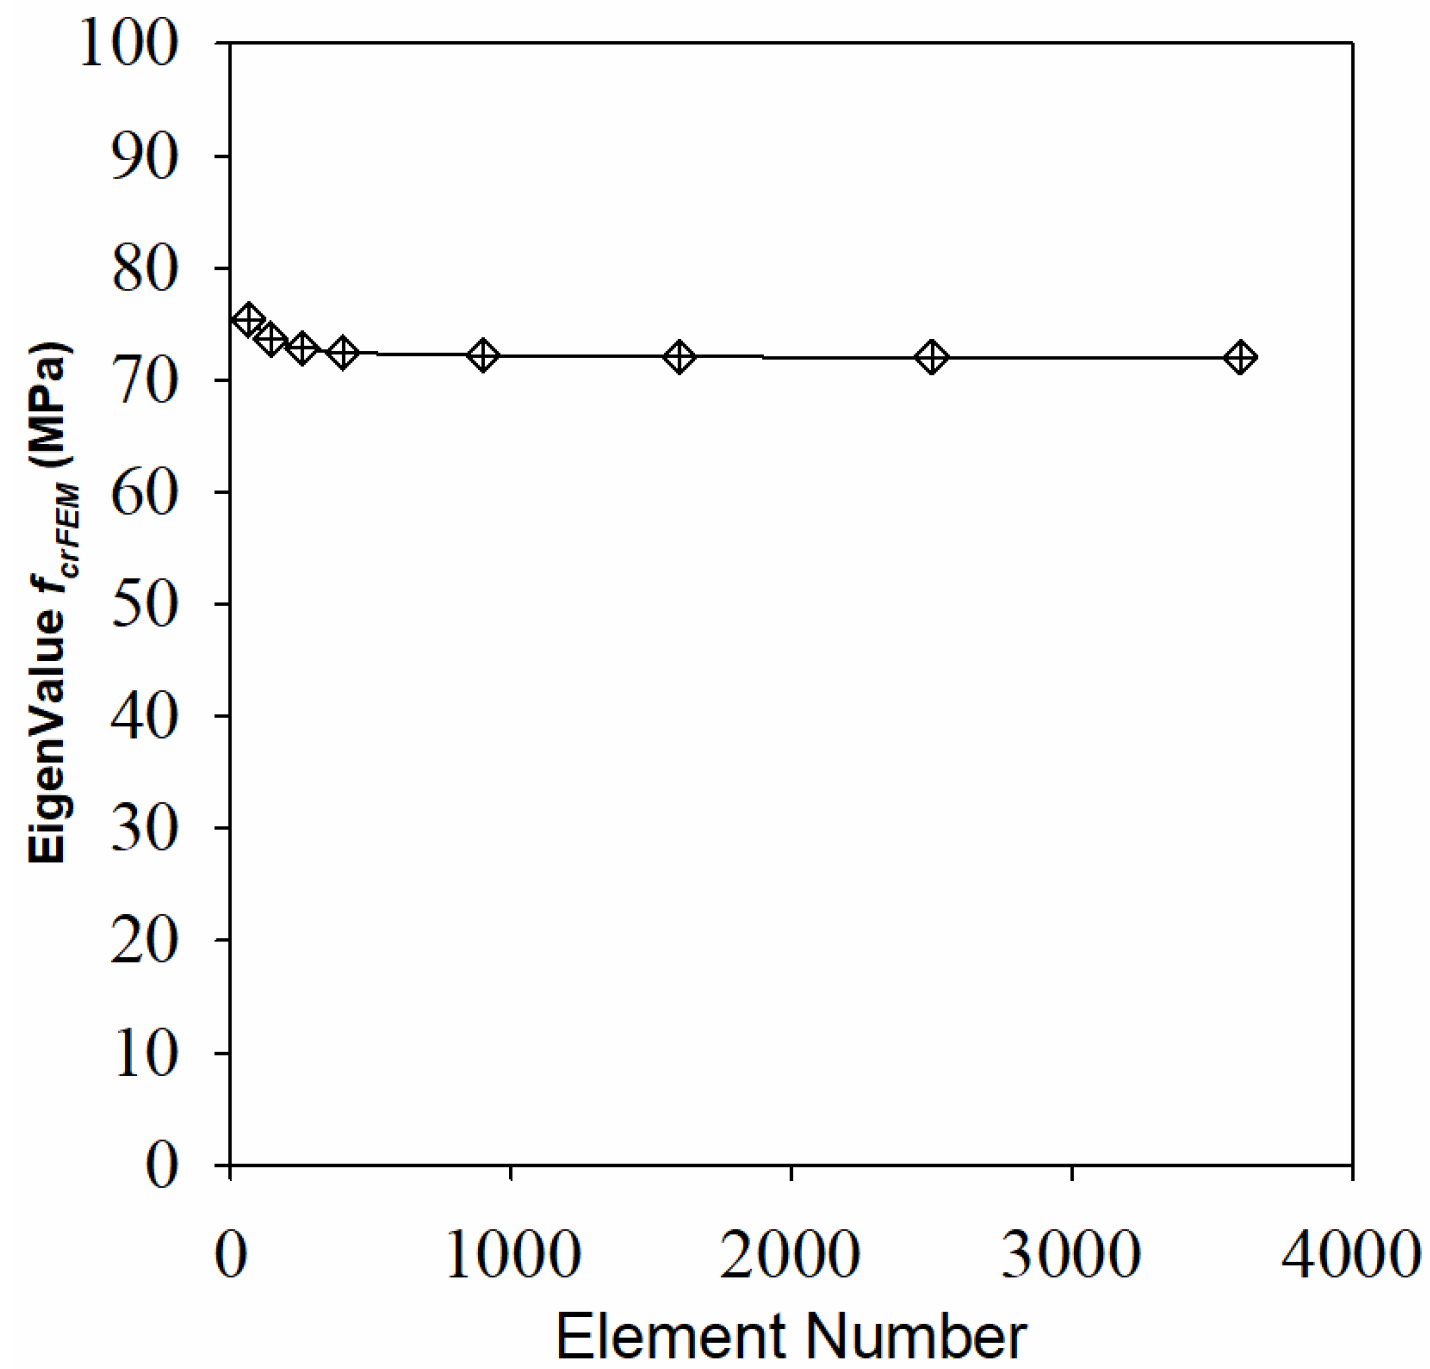
Figure 10.
The model shapes of plates with ex/b = 1, β = 2 and BCs of 4S. (a) d/b = 0.1; (b) d/b = 0.3; (c) d/b = 0.5; (d) d/b = 0.7.
Figure 10.
The model shapes of plates with ex/b = 1, β = 2 and BCs of 4S. (a) d/b = 0.1; (b) d/b = 0.3; (c) d/b = 0.5; (d) d/b = 0.7.

Figure 11.
The model shapes of plates with ex/b = 0.5, β = 2 and BCs of 4S. (a) d/b = 0. 1; (b) d/b = 0.3; (c) d/b = 0.5; (d) d/b = 0.7.
Figure 11.
The model shapes of plates with ex/b = 0.5, β = 2 and BCs of 4S. (a) d/b = 0. 1; (b) d/b = 0.3; (c) d/b = 0.5; (d) d/b = 0.7.

Figure 12.
The model shapes of plates with ex/b = 0.5, BCs of 4S and different β from 1 to 4. (a) β = 1; (b) β = 2; (c) β = 3; (d) β = 4.
Figure 12.
The model shapes of plates with ex/b = 0.5, BCs of 4S and different β from 1 to 4. (a) β = 1; (b) β = 2; (c) β = 3; (d) β = 4.
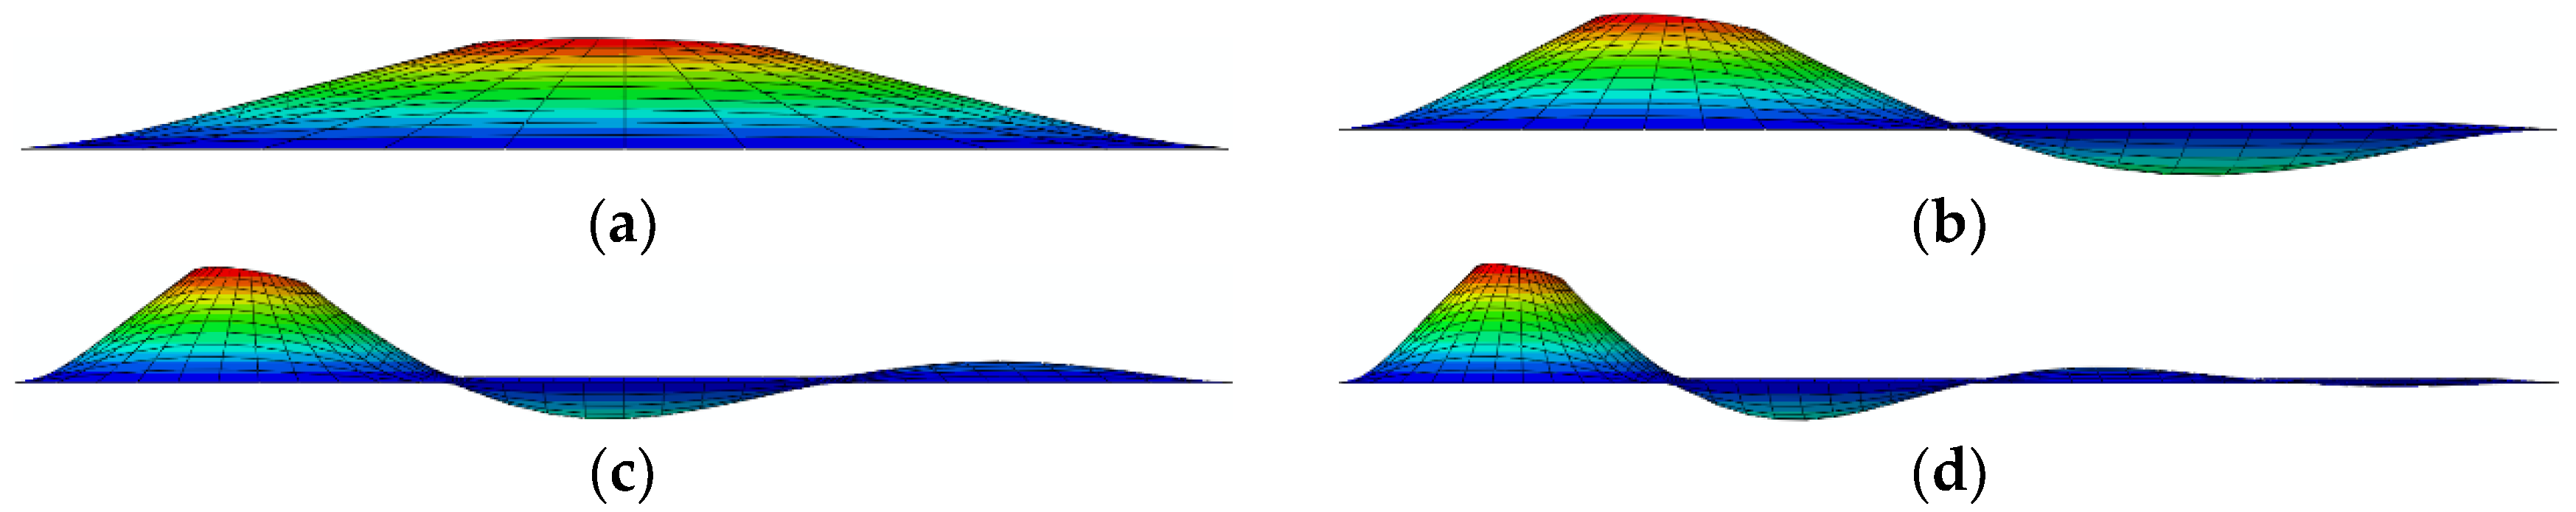
Figure 13.
The model shapes of plates with ex/b = 1, β = 3 and BCs of 3S. (a) d/b = 0.1; (b) d/b = 0.3; (c) d/b = 0.5; (d) d/b = 0.7.
Figure 13.
The model shapes of plates with ex/b = 1, β = 3 and BCs of 3S. (a) d/b = 0.1; (b) d/b = 0.3; (c) d/b = 0.5; (d) d/b = 0.7.
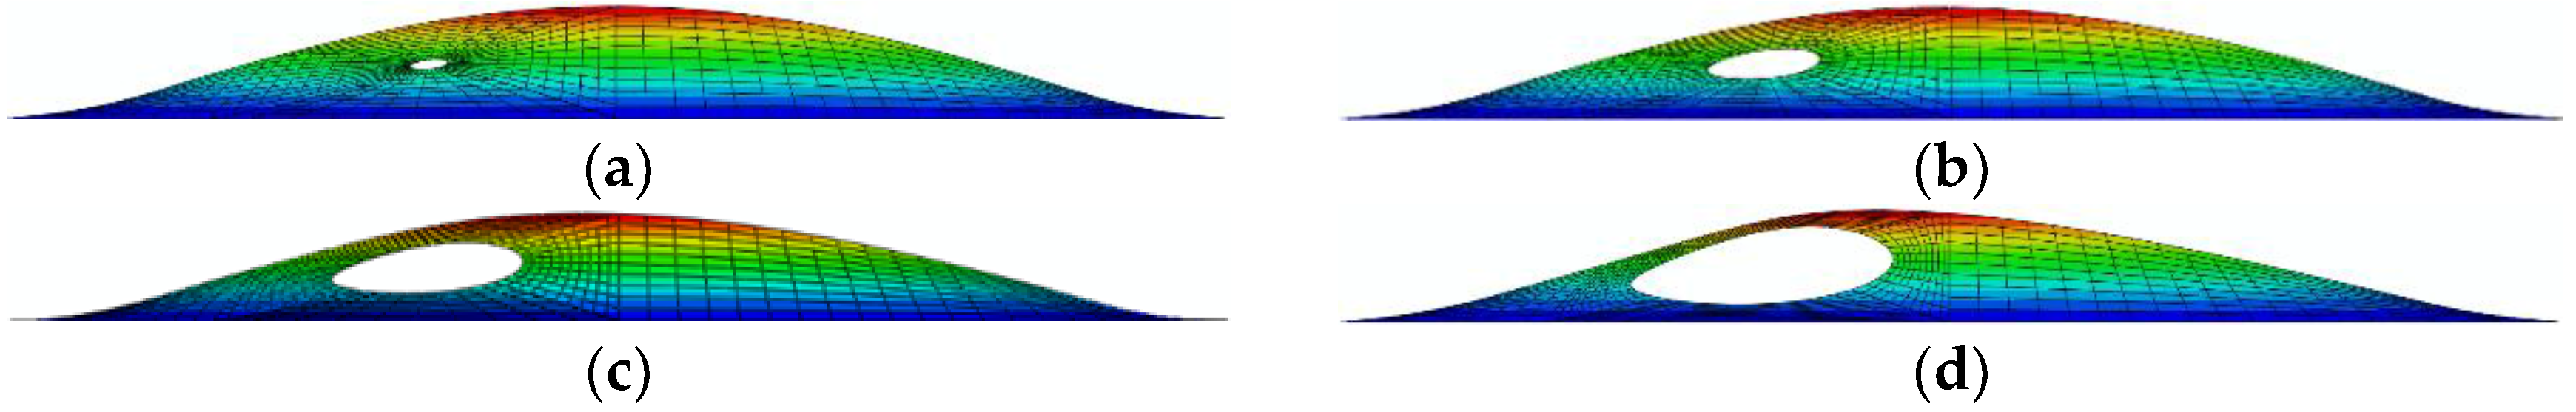
Figure 14.
αD vs. ω for perforated rectangular plate (β = 1, 2, 3, 4) with the BCs of 4S.
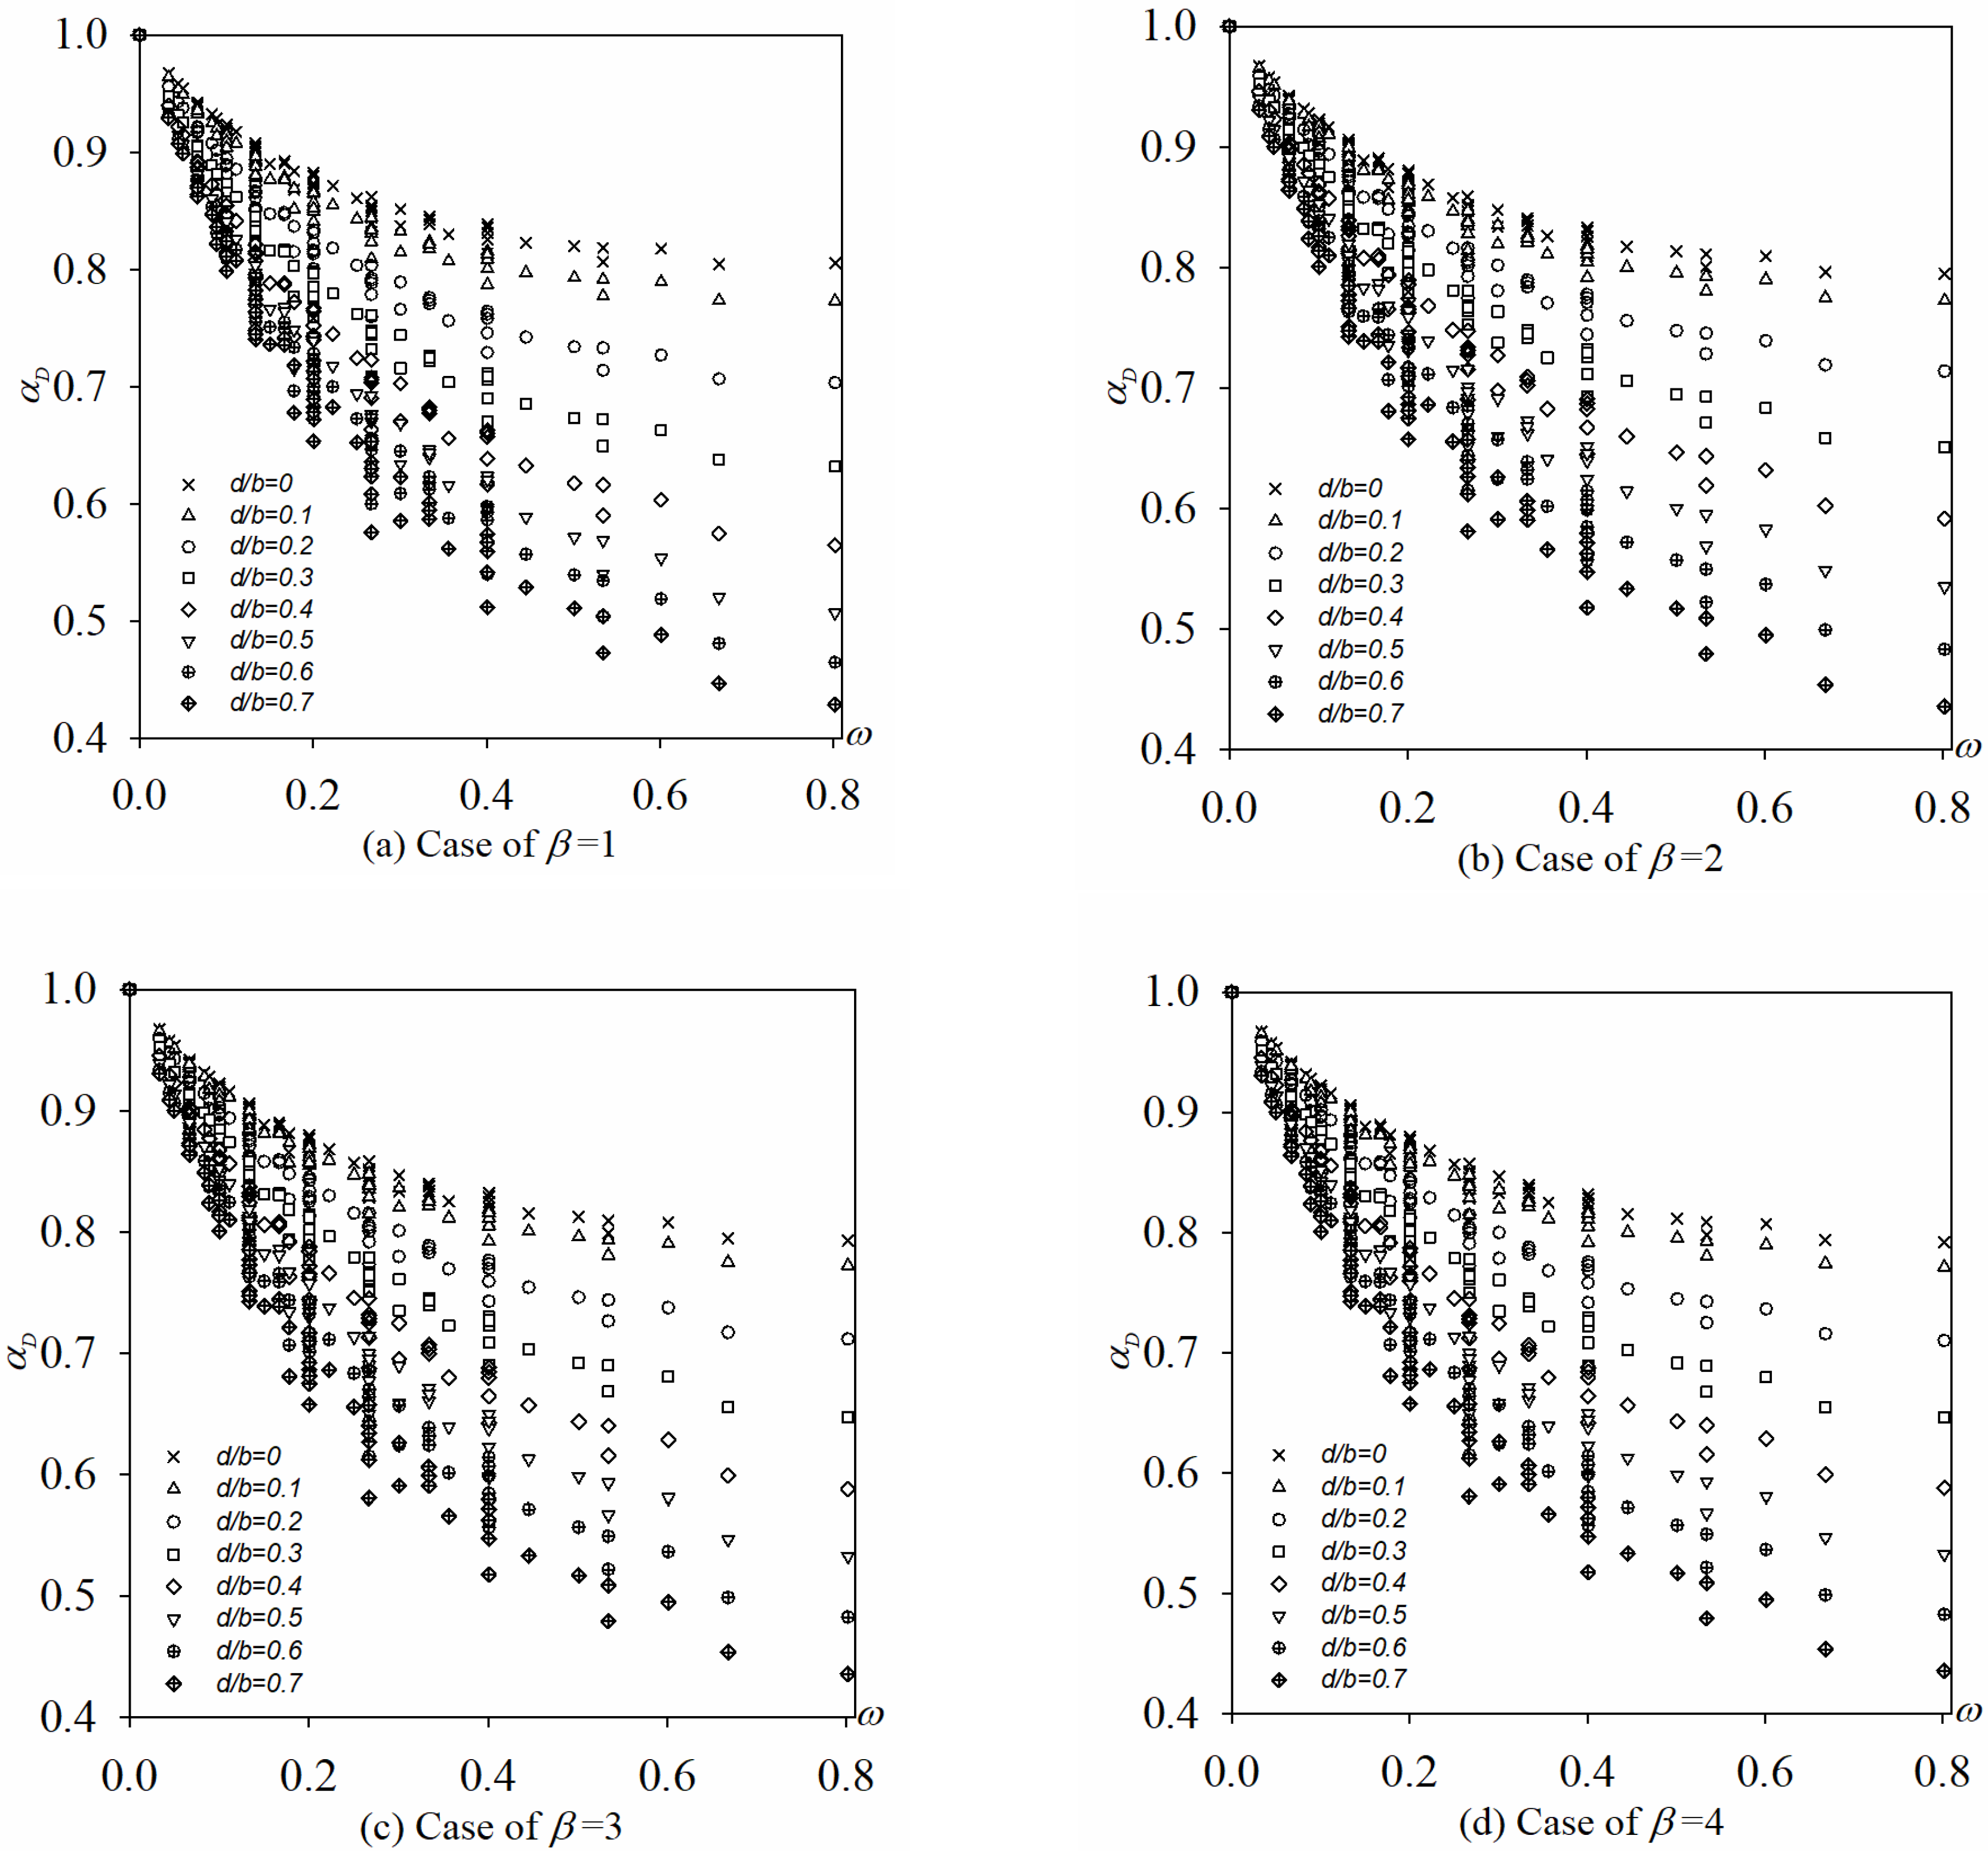
Figure 15.
αD vs. ω for perforated rectangular plate (β = 1, 2, 3, 4) with the BCs of 3S1F.

Figure 16.
Ku vs. ex/b for perforated rectangular plate (β = 1, 2, 3, 4) with the BCs of 4S.

Figure 17.
Ku vs. ex/b for perforated rectangular plate (β = 1, 2, 3, 4) with the BCs of 3S1F.


Figure 18.
Ku vs. ey/b for perforated rect38angular plate (β = 1, 2, 3, 4) with the BCs of 4S.
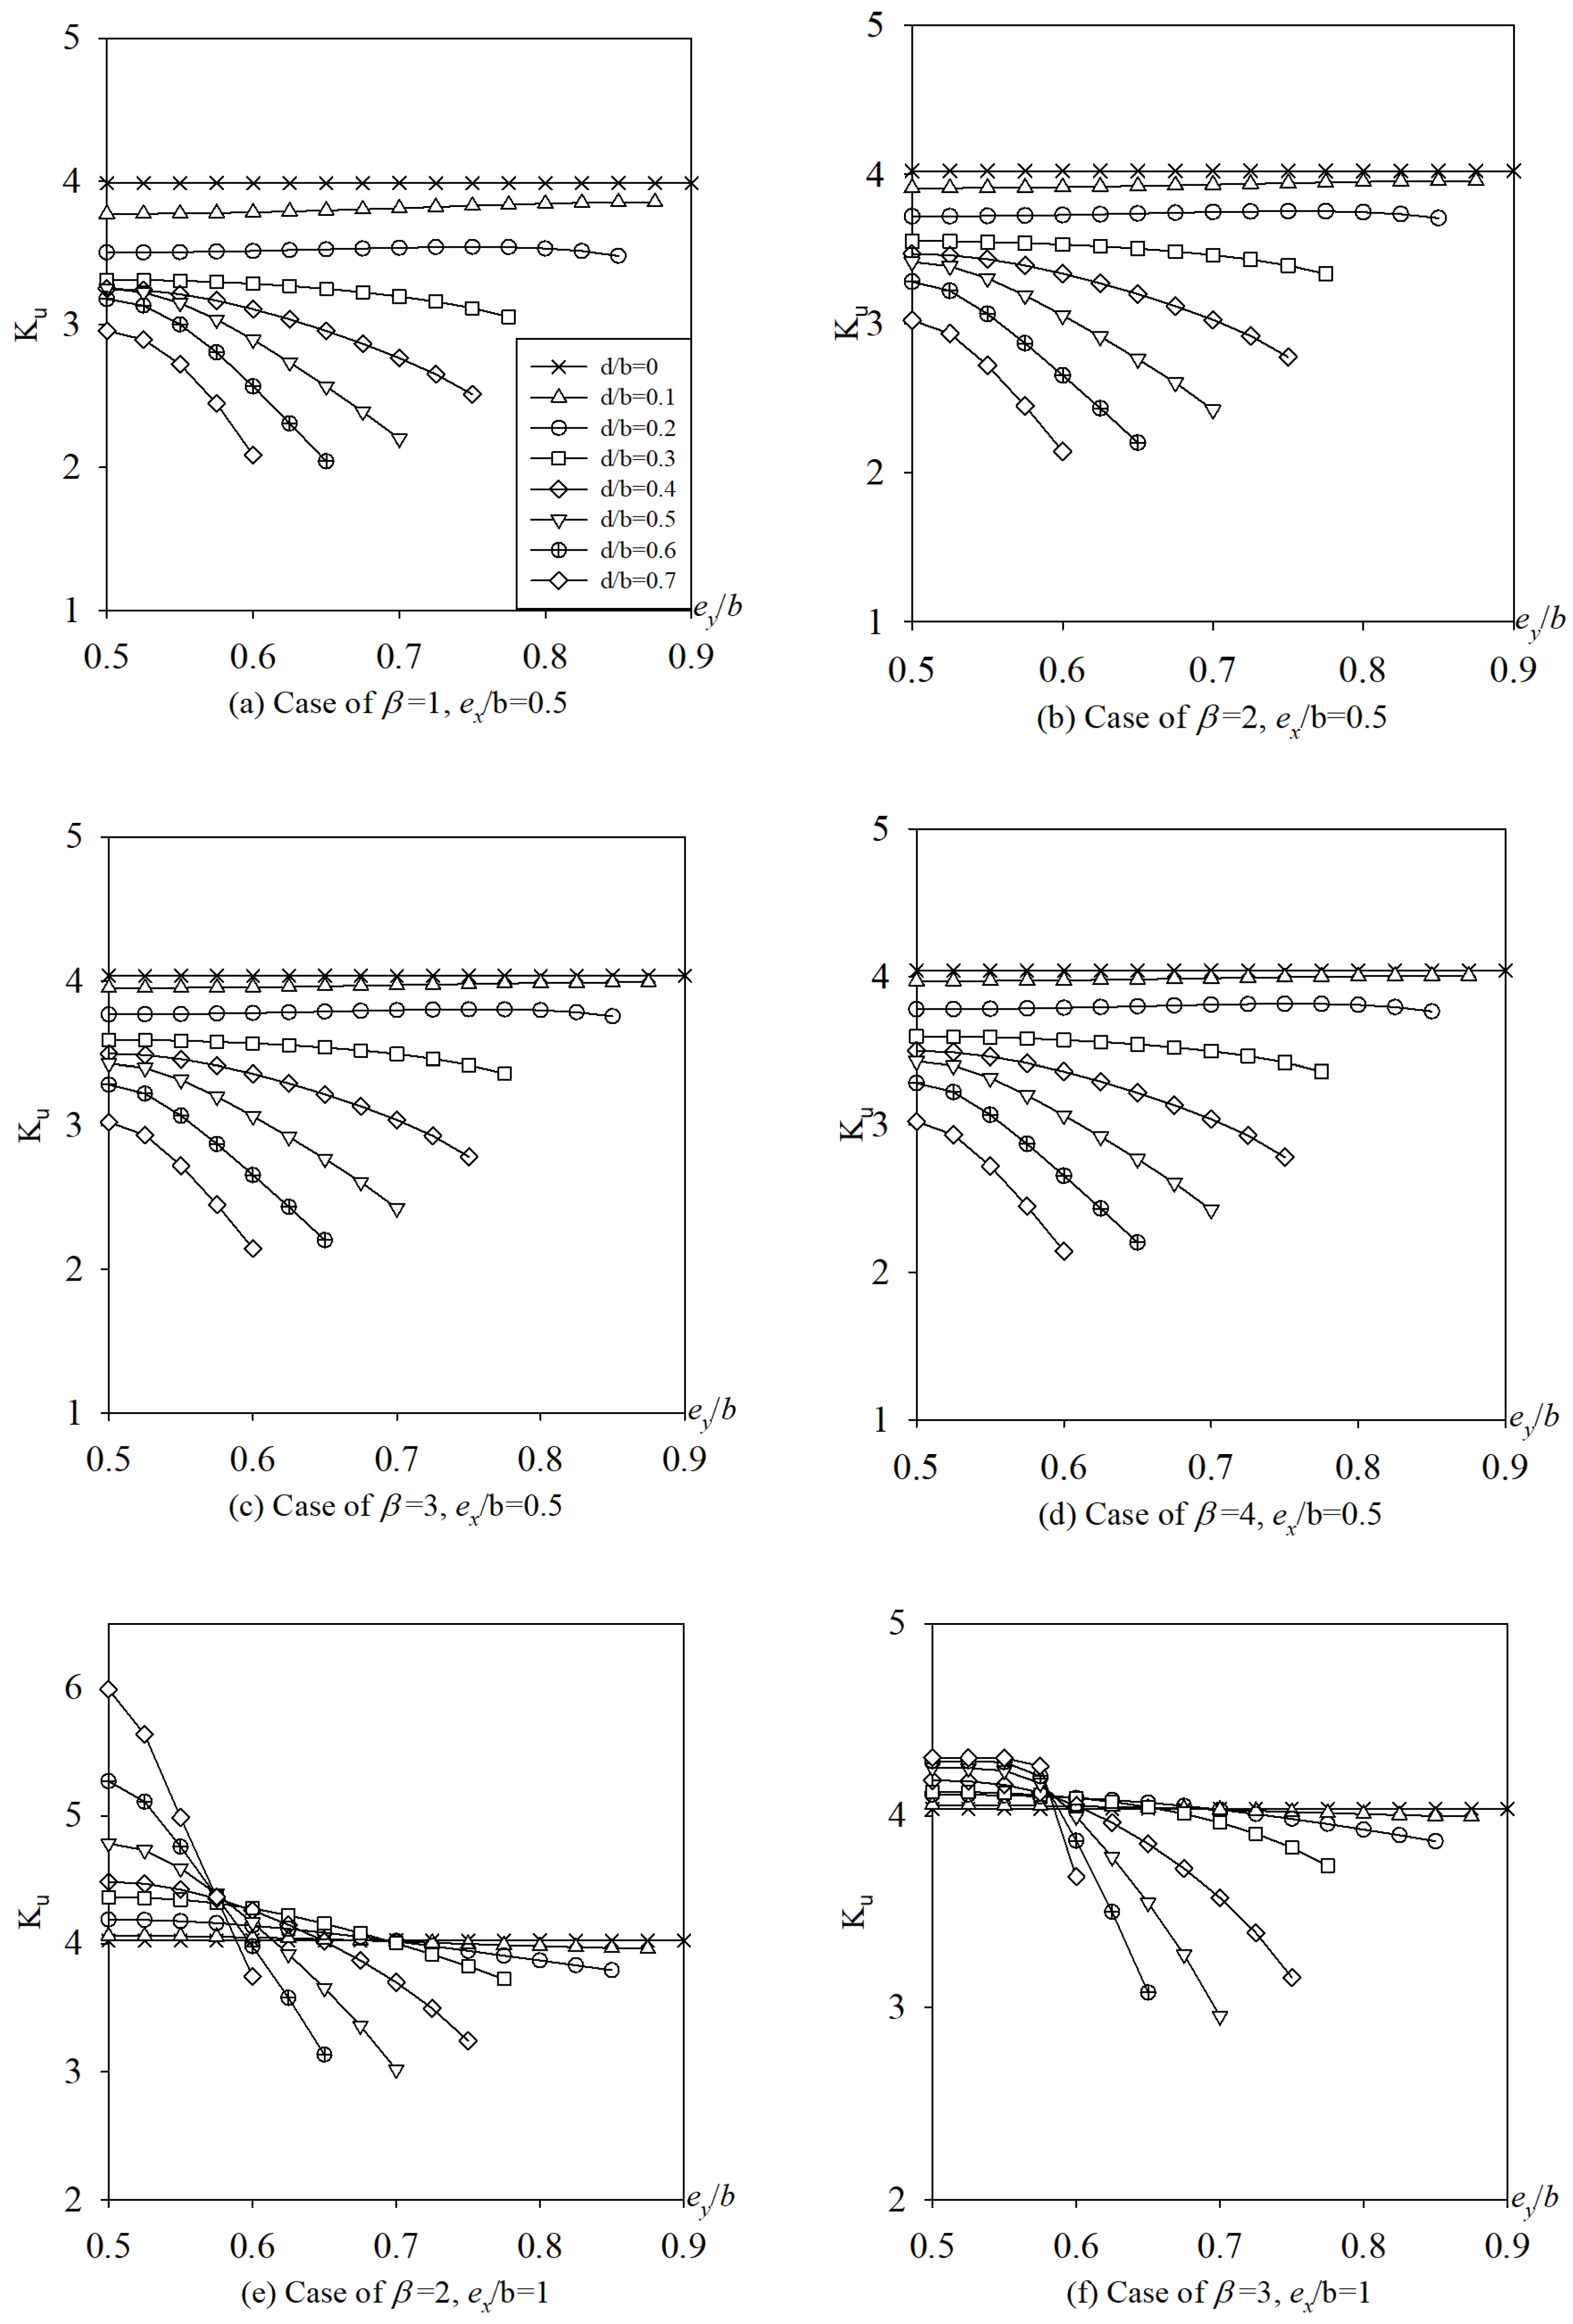
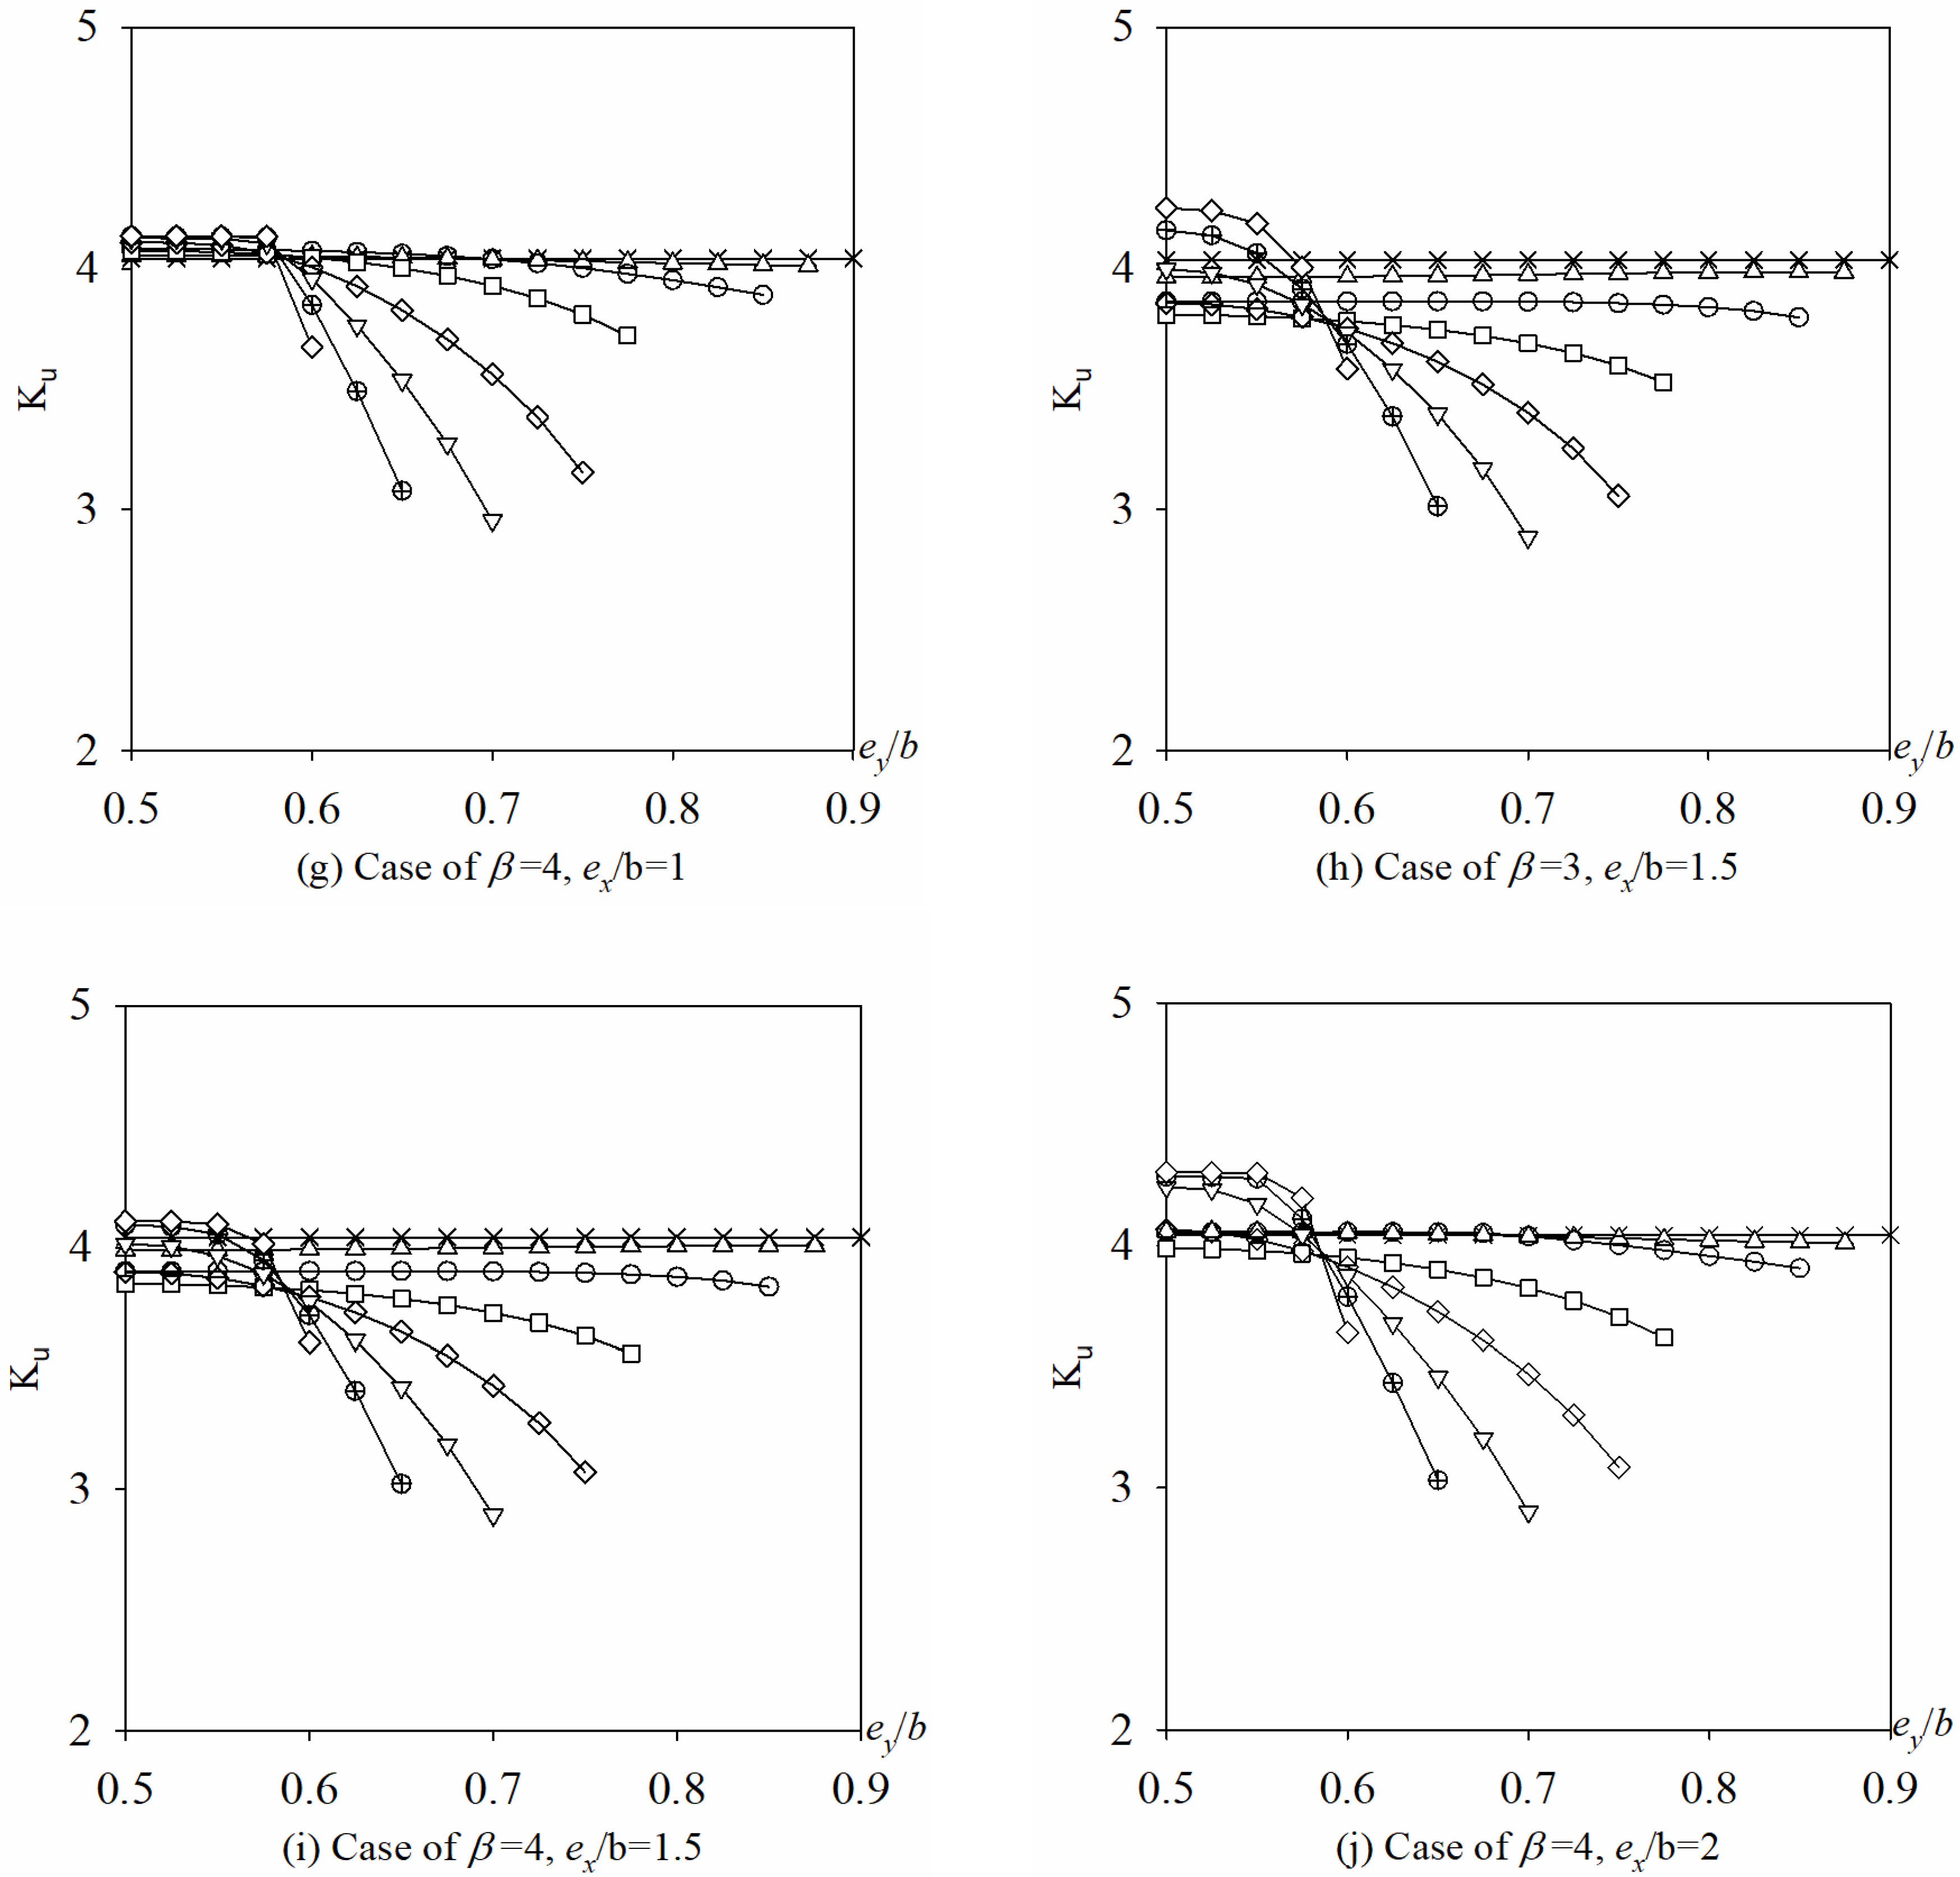
Figure 19.
Ku vs. ey/b for perforated rectangular plate (β = 1, 2, 3, 4) with the BCs of 3S1F.

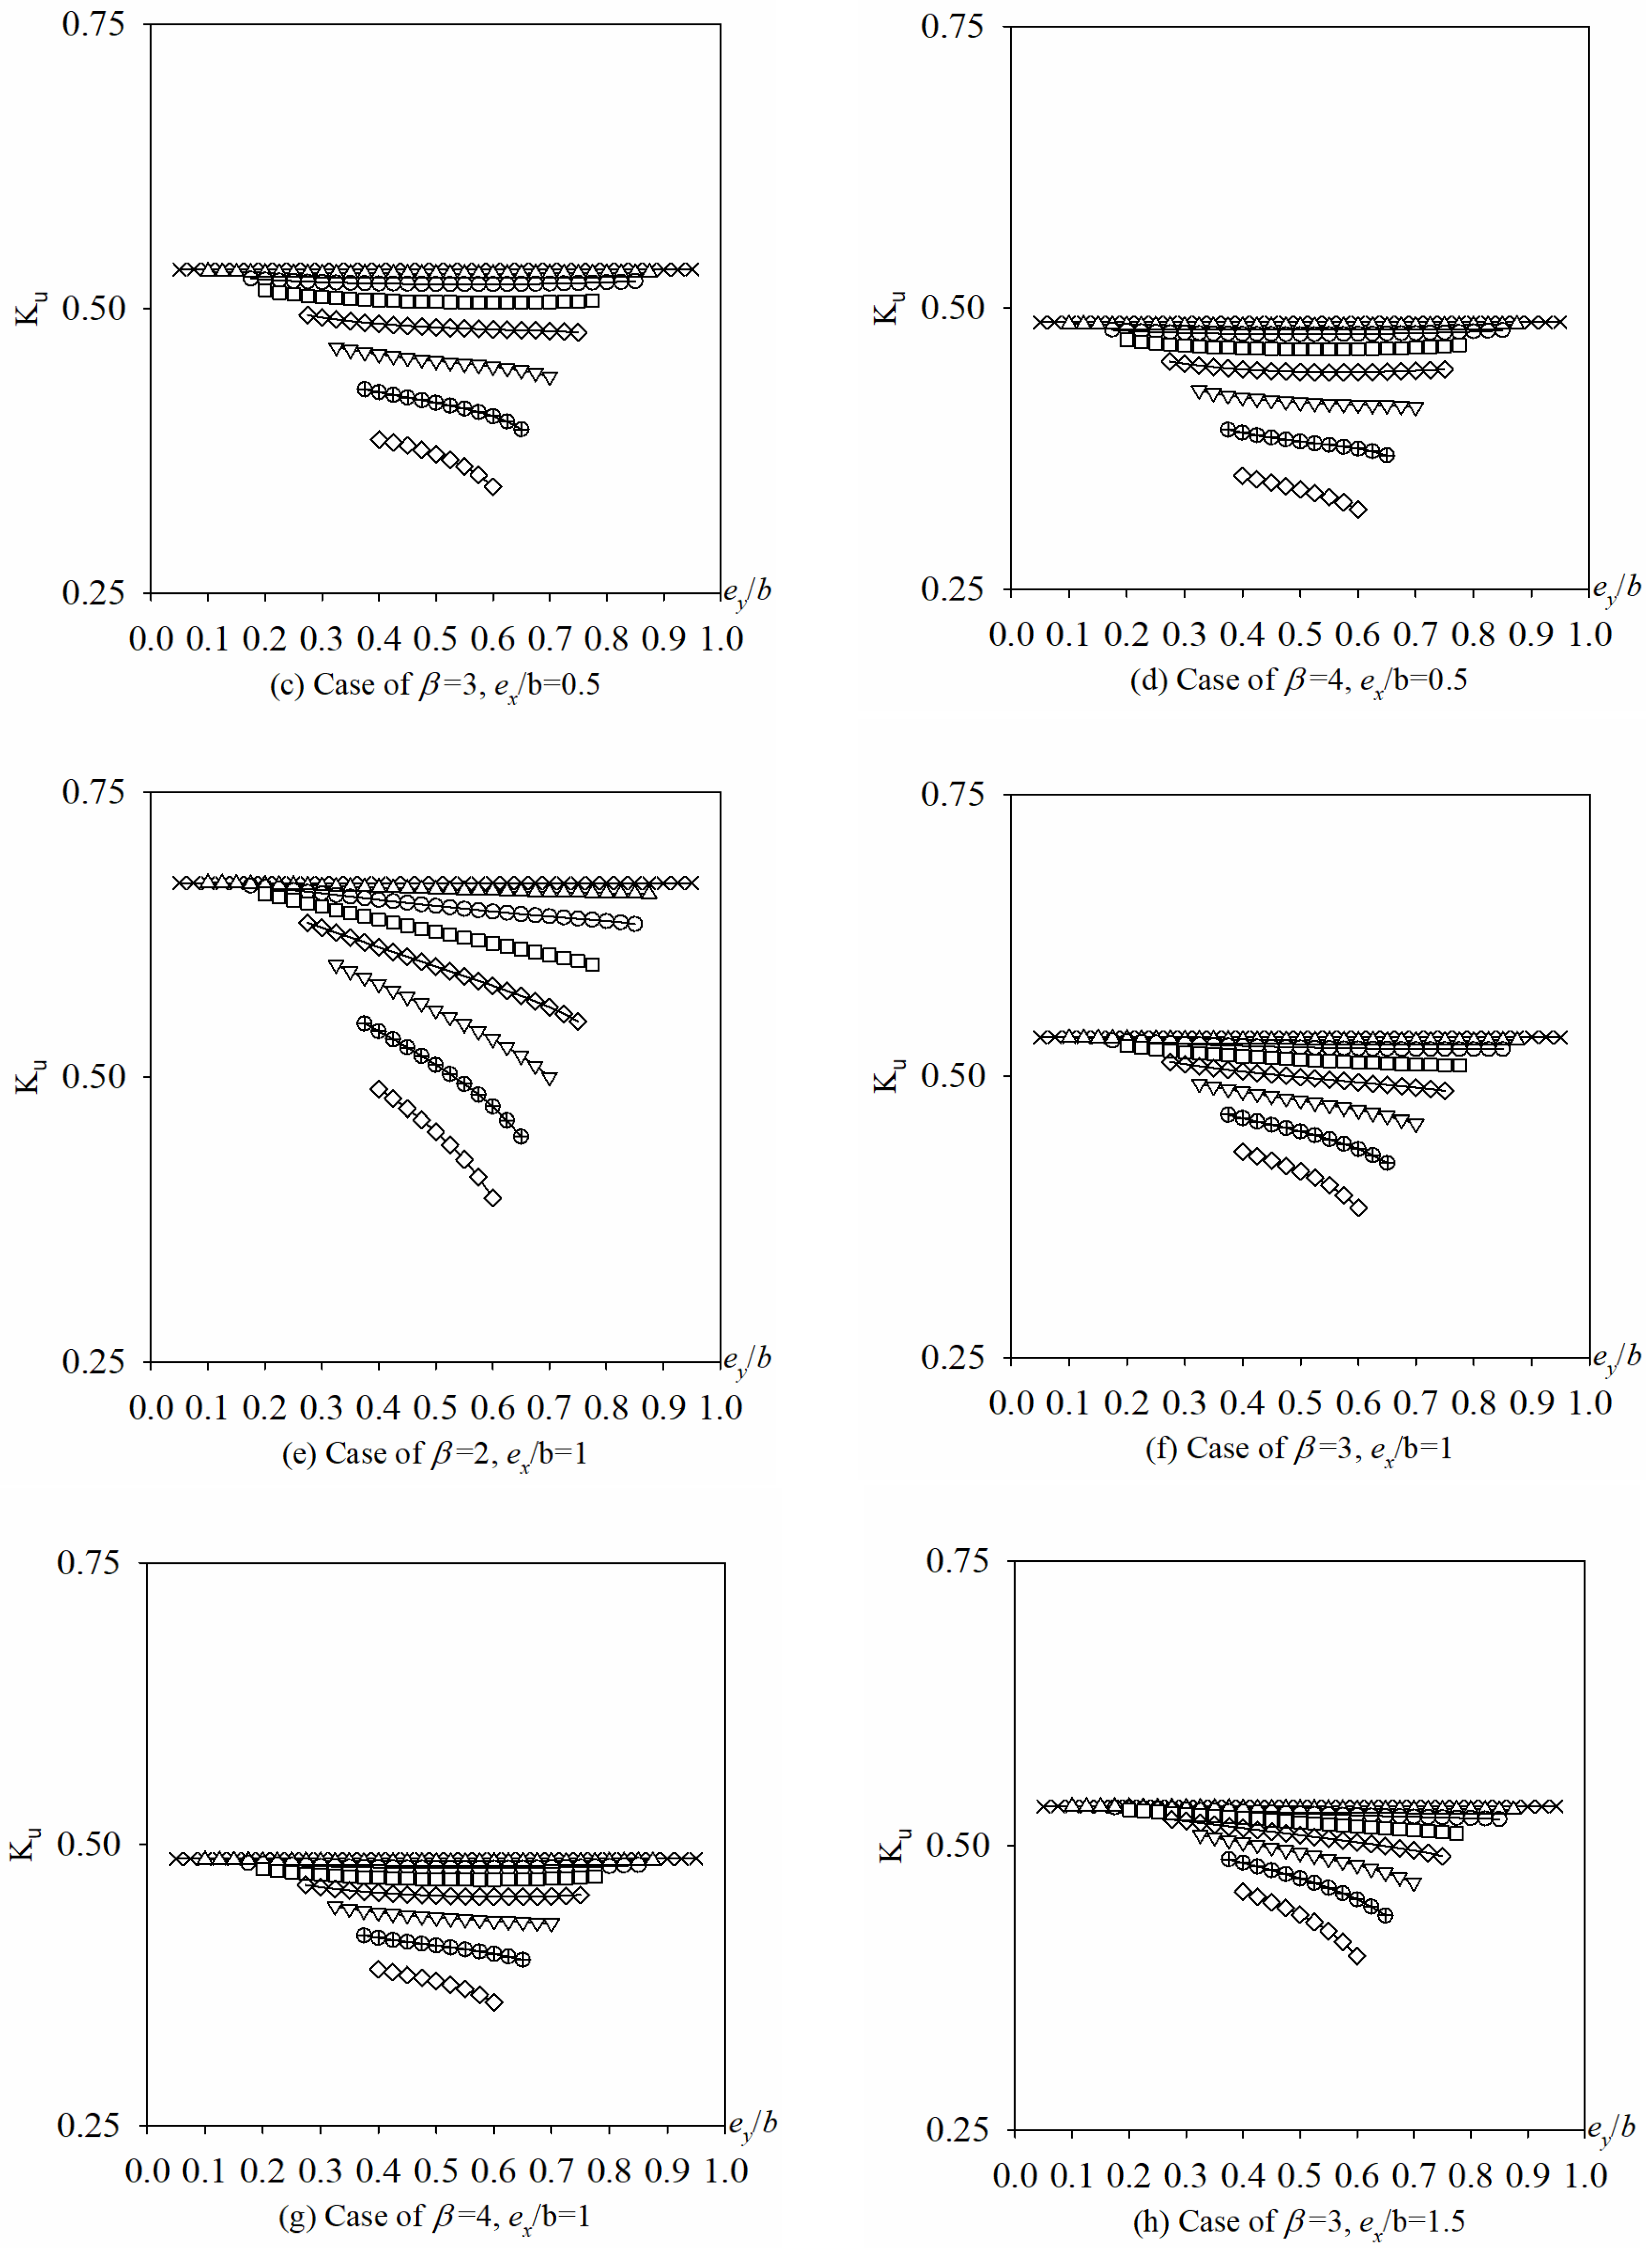
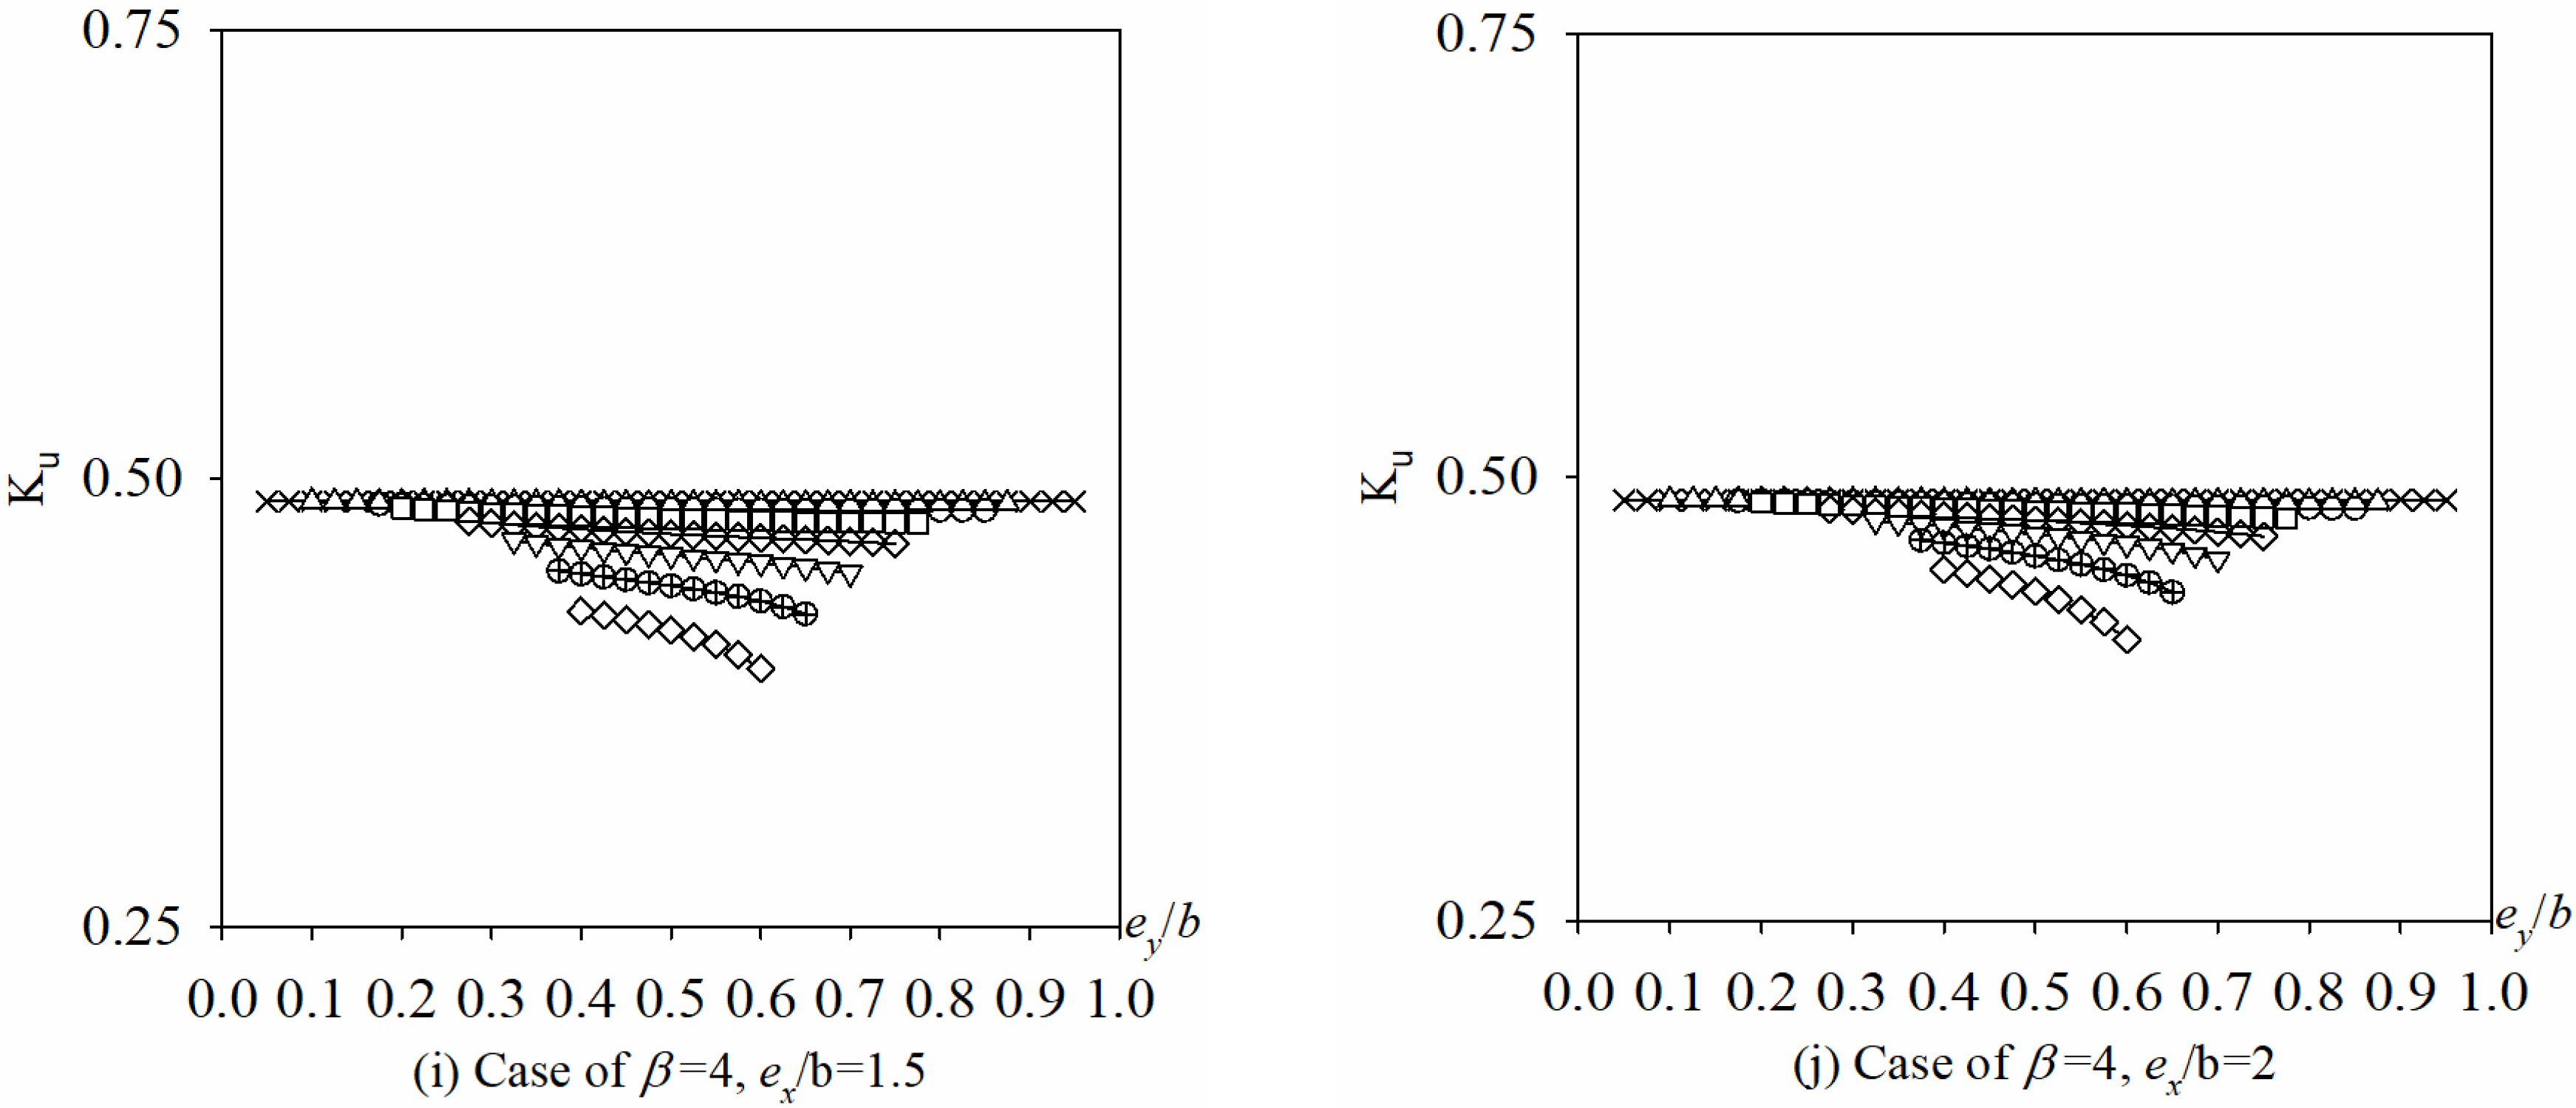
Figure 20.
Ku vs. d/b with BCs of 4S. (a): ex/b = 1 and 2; (b): ex/b = 0.5 and 1.5.

Figure 21.
Ku vs. d/b with BCs of 3S1F. (a): ex/b = 1 and 2; (b): ex/b = 0.5 and 1.5.


Table 1.
The basic geometry and material parameters. BCs: Boundary conditions.
| a (mm) | b (mm) | ts (mm) | tf0 (mm) | Es (MPa) | Ef (MPa) | υs | υf | fy (MPa) | BCs |
|---|---|---|---|---|---|---|---|---|---|
| 240 | 240 | 2.61 | 0.167 | 2.0 × 10⁵ | 2.6 × 10⁵ | 0.3 | 0.25 | 287.9 | 4S |
Table 2.
The comparison of experimental, theoretical, finite element (FE) models and Calculation method in this paper.
Table 2.
The comparison of experimental, theoretical, finite element (FE) models and Calculation method in this paper.
| NO. | d/b | α | γ(×10-2) | D0 (×105) | DtEq.10 (×105) | DtEq.11 (×105) | PcrExp | fcrExp. | fcrEq.17 | fcrEq.23 | fcrFEM | αD | Ku | fcrCal | PuExp | PuCal |
|---|---|---|---|---|---|---|---|---|---|---|---|---|---|---|---|---|
| 1 | 0 | 1.225 | 0 | 3.35 | 3.35 | 3.35 | 55.83 | 89.13 | 88.08 | 88.08 | 87.79 | 1.000 | 4.00 | 88.08 | 94.02 | 87.59 |
| 2 | 0.1 | 1.225 | 0 | 3.35 | 3.35 | 3.35 | 53.78 | 85.85 | 83.08 * | 83.08 * | 83.06 | 1.000 | 3.77 | 83.08 | 90.11 | 85.41 |
| 3 | 0.3 | 1.225 | 0 | 3.35 | 3.35 | 3.35 | 47.89 | 76.45 | 72.95 * | 72.95 * | 72.93 | 1.000 | 3.31 | 72.95 | 79.66 | 80.71 |
| 4 | 0.5 | 1.225 | 0 | 3.35 | 3.35 | 3.35 | 45.12 | 72.03 | 71.62 * | 71.62 * | 71.60 | 1.000 | 3.25 | 71.62 | 74.44 | 80.06 |
| 5 | 0 | 1.225 | 6.4 | 3.35 | 4.18 | 4.14 | 64.88 | 97.34 | 103.24 | 102.25 | 95.66 | 0.946 | 4.00 | 96.76 | 101.86 | 97.03 |
| 6 | 0.1 | 1.225 | 6.4 | 3.35 | 4.18 | 4.14 | 61.90 | 92.87 | 97.39 * | 96.45 * | 89.84 | 0.934 | 3.77 | 90.13 | 96.64 | 94.13 |
| 7 | 0.3 | 1.225 | 6.4 | 3.35 | 4.18 | 4.14 | 58.28 | 87.45 | 85.51 * | 84.68 * | 76.08 | 0.910 | 3.31 | 77.13 | 92.72 | 87.99 |
| 8 | 0.5 | 1.225 | 6.4 | 3.35 | 4.18 | 4.14 | 50.54 | 75.83 | 83.95 * | 83.15 * | 72.44 | 0.887 | 3.25 | 73.77 | 78.35 | 86.30 |
* k is taken as Ku, which is obtained by the numerical results in the following section.
Table 3.
The relationship d/b with m and n.
| d/b | 0 | 0.1 | 0.2 | 0.3 | 0.4 | 0.5 | 0.6 | 0.7 |
|---|---|---|---|---|---|---|---|---|
| m | 0.69 | 0.76 | 0.92 | 1.09 | 1.23 | 1.34 | 1.40 | 1.47 |
| n | −0.74 | −0.83 | −1.04 | −1.25 | −1.44 | −1.59 | −1.69 | −1.79 |
| R2 | 0.91 | 0.92 | 0.93 | 0.94 | 0.94 | 0.95 | 0.95 | 0.95 |
© 2017 by the authors. Licensee MDPI, Basel, Switzerland. This article is an open access article distributed under the terms and conditions of the Creative Commons Attribution (CC BY) license (http://creativecommons.org/licenses/by/4.0/).
Share and Cite
MDPI and ACS Style
Tao, X.; Cao, S.; Zhang, L. Elastic Stability of Perforated Plates Strengthened with FRP under Uniaxial Compression. Appl. Sci. 2017, 7, 1188. https://doi.org/10.3390/app7111188
AMA Style
Tao X, Cao S, Zhang L. Elastic Stability of Perforated Plates Strengthened with FRP under Uniaxial Compression. Applied Sciences. 2017; 7(11):1188. https://doi.org/10.3390/app7111188
Chicago/Turabian StyleTao, Xin, Shuangyin Cao, and Long Zhang. 2017. "Elastic Stability of Perforated Plates Strengthened with FRP under Uniaxial Compression" Applied Sciences 7, no. 11: 1188. https://doi.org/10.3390/app7111188
Note that from the first issue of 2016, this journal uses article numbers instead of page numbers. See further details here.