Utilizing Downdraft Fixed Bed Reactor for Thermal Upgrading of Sewage Sludge as Fuel by Torrefaction


Department of Environmental Engineering, Kongju National University, 1223-24 Cheonan-Daero, Seobuk, Chungnam 330-717, Korea
*
Author to whom correspondence should be addressed.
Appl. Sci. 2017, 7(11), 1189; https://doi.org/10.3390/app7111189
Submission received: 31 October 2017
/
Revised: 13 November 2017
/
Accepted: 15 November 2017
/
Published: 18 November 2017
(This article belongs to the Special Issue Renewable Energy 2018)
Abstract
:A lab-scale downdraft fixed bed reactor was used for the study of sewage sludge, a non-lignocellulosic biomass, torrefaction to enhance the thermochemical properties of sewage sludge. The torrefaction was carried out for a temperature range of 200–350 °C and a residence time of 0–50 min. Degree of torrefaction, torrefaction index, chemical exergy, gas analysis, and molar ratios were taken into account to analyze the torrefied product with respect to torrefaction temperature. The effect of torrefaction temperature was very pronounced and the temperature range of 250–300 °C was considered to be the optimum torrefaction temperature range for sewage sludge. Chemical exergy, calorific value and torrefaction index were significantly influenced by the change in the relative carbon content resulting in decrease of the O/C and H/C molar ratios.
1. Introduction
Biomass as a renewable energy source is recognized globally and is available in a generous amount on the earth, which can be transformed into biofuels or energy, utilizing various thermal, physical, or biological processes. Not only the curbing depletion of fossil fuel but negative environmental impacts associated with it, such as greenhouse gases, acid rain, and deterioration in climate has caught the interest of exploiting the renewable energy like biomass as fuel [1]. A study by Daniel et al. [2] has revealed integrating biomass into combined cooling and heating power (CCHP) for providing energy for buildings. Utilizing biomass or waste can lessen the environmental issues due to high carbon dioxide emissions, which are chiefly produced by fossil fuels. Hence, clean and renewable energy sources are in high demand [3] and sewage sludge is acknowledged as a low-cost material for biomass combustion [4] yet, these wastes are disposed into landfills or the ocean due to economic reasons. As the sewage sludge constitutes high amount of organic content, sewage sludge surely can be a promising biomass resource for energy recovery. Utilizing sewage sludge to generate heat through incineration and combustion can be a good alternative but the emission of heavy metals has led to various disagreements [5]. Due to low hemicellulose and cellulose, and a high ash content of sewage sludge, the combustion behavior is entirely different from that of lignocellulosic biomass [6]. For these reasons, the quality of raw sludge needs improvement to utilize it to obtain useful forms of energy. Energy recovery therefore plays a vital role whilst considering the management of sewage sludge. Various comparative studies have been carried out for the analysis of sewage sludge for energy recovery using various alternatives, such as Life-cycle assessment (LCA) [7] and SWOT (strengths, weaknesses, opportunities, and threats) [8].
For decades, thermochemical technologies, such as combustion, gasification, pyrolysis, and others, have been employed for biomass conversion [9]. A promising alternative is provided by torrefaction, which alters sludge into coal-like solid fuel particles. During torrefaction, the biomass is heated to a temperature range of 200–350 °C in the absence of oxygen. During the process, loss of moisture occurs with a partial loss of the volatile (approximately 20%) as a result of which there is alteration in the characteristics of original raw biomass [10]. With the removal of the light fraction volatiles, the heating value of the torrefied biomass gradually increases [10]. This thermal treatment converts oxygen to carbon monoxide and carbon dioxide, which in turn reduces the O/C ratio but elevates the energy density and hydrophobicity of sludge [11]. Torrefaction lessens the moisture content of the biomass, which is an imperative benefit that inhibits biological degradation [12], increases the energy density [13], and enhances the combustion efficiency [14]. Despite these advantages study of non-lignocellulosic biomass is still limited. Various reactors have been used to carry torrefaction, such as muffle furnace [15], fixed bed reactors [16], auger reactor [17], and fluidized bed reactors [18]. To the best of our knowledge, downdraft fixed bed has not yet been used for the torrefaction of biomass although the downdraft fixed bed reactors have been utilized for gasification of biomass [19]. A study by Kou et al. [19] reveals the benefit of using downdraft fixed bed over updraft and cross-draft bed reactor for gasification. This study, therefore, explores the benefits of using downdraft fixed bed reactor for torrefaction under different operating parameters. Higher heating value (HHV) or calorific value, different molar ratios, chemical exergy, torrefaction index, and severity factor were used to evaluate the optimum temperature range for torrefaction of sewage sludge using fixed bed downdraft reactor.
2. Materials and Methods
2.1. Experimental Apparatus
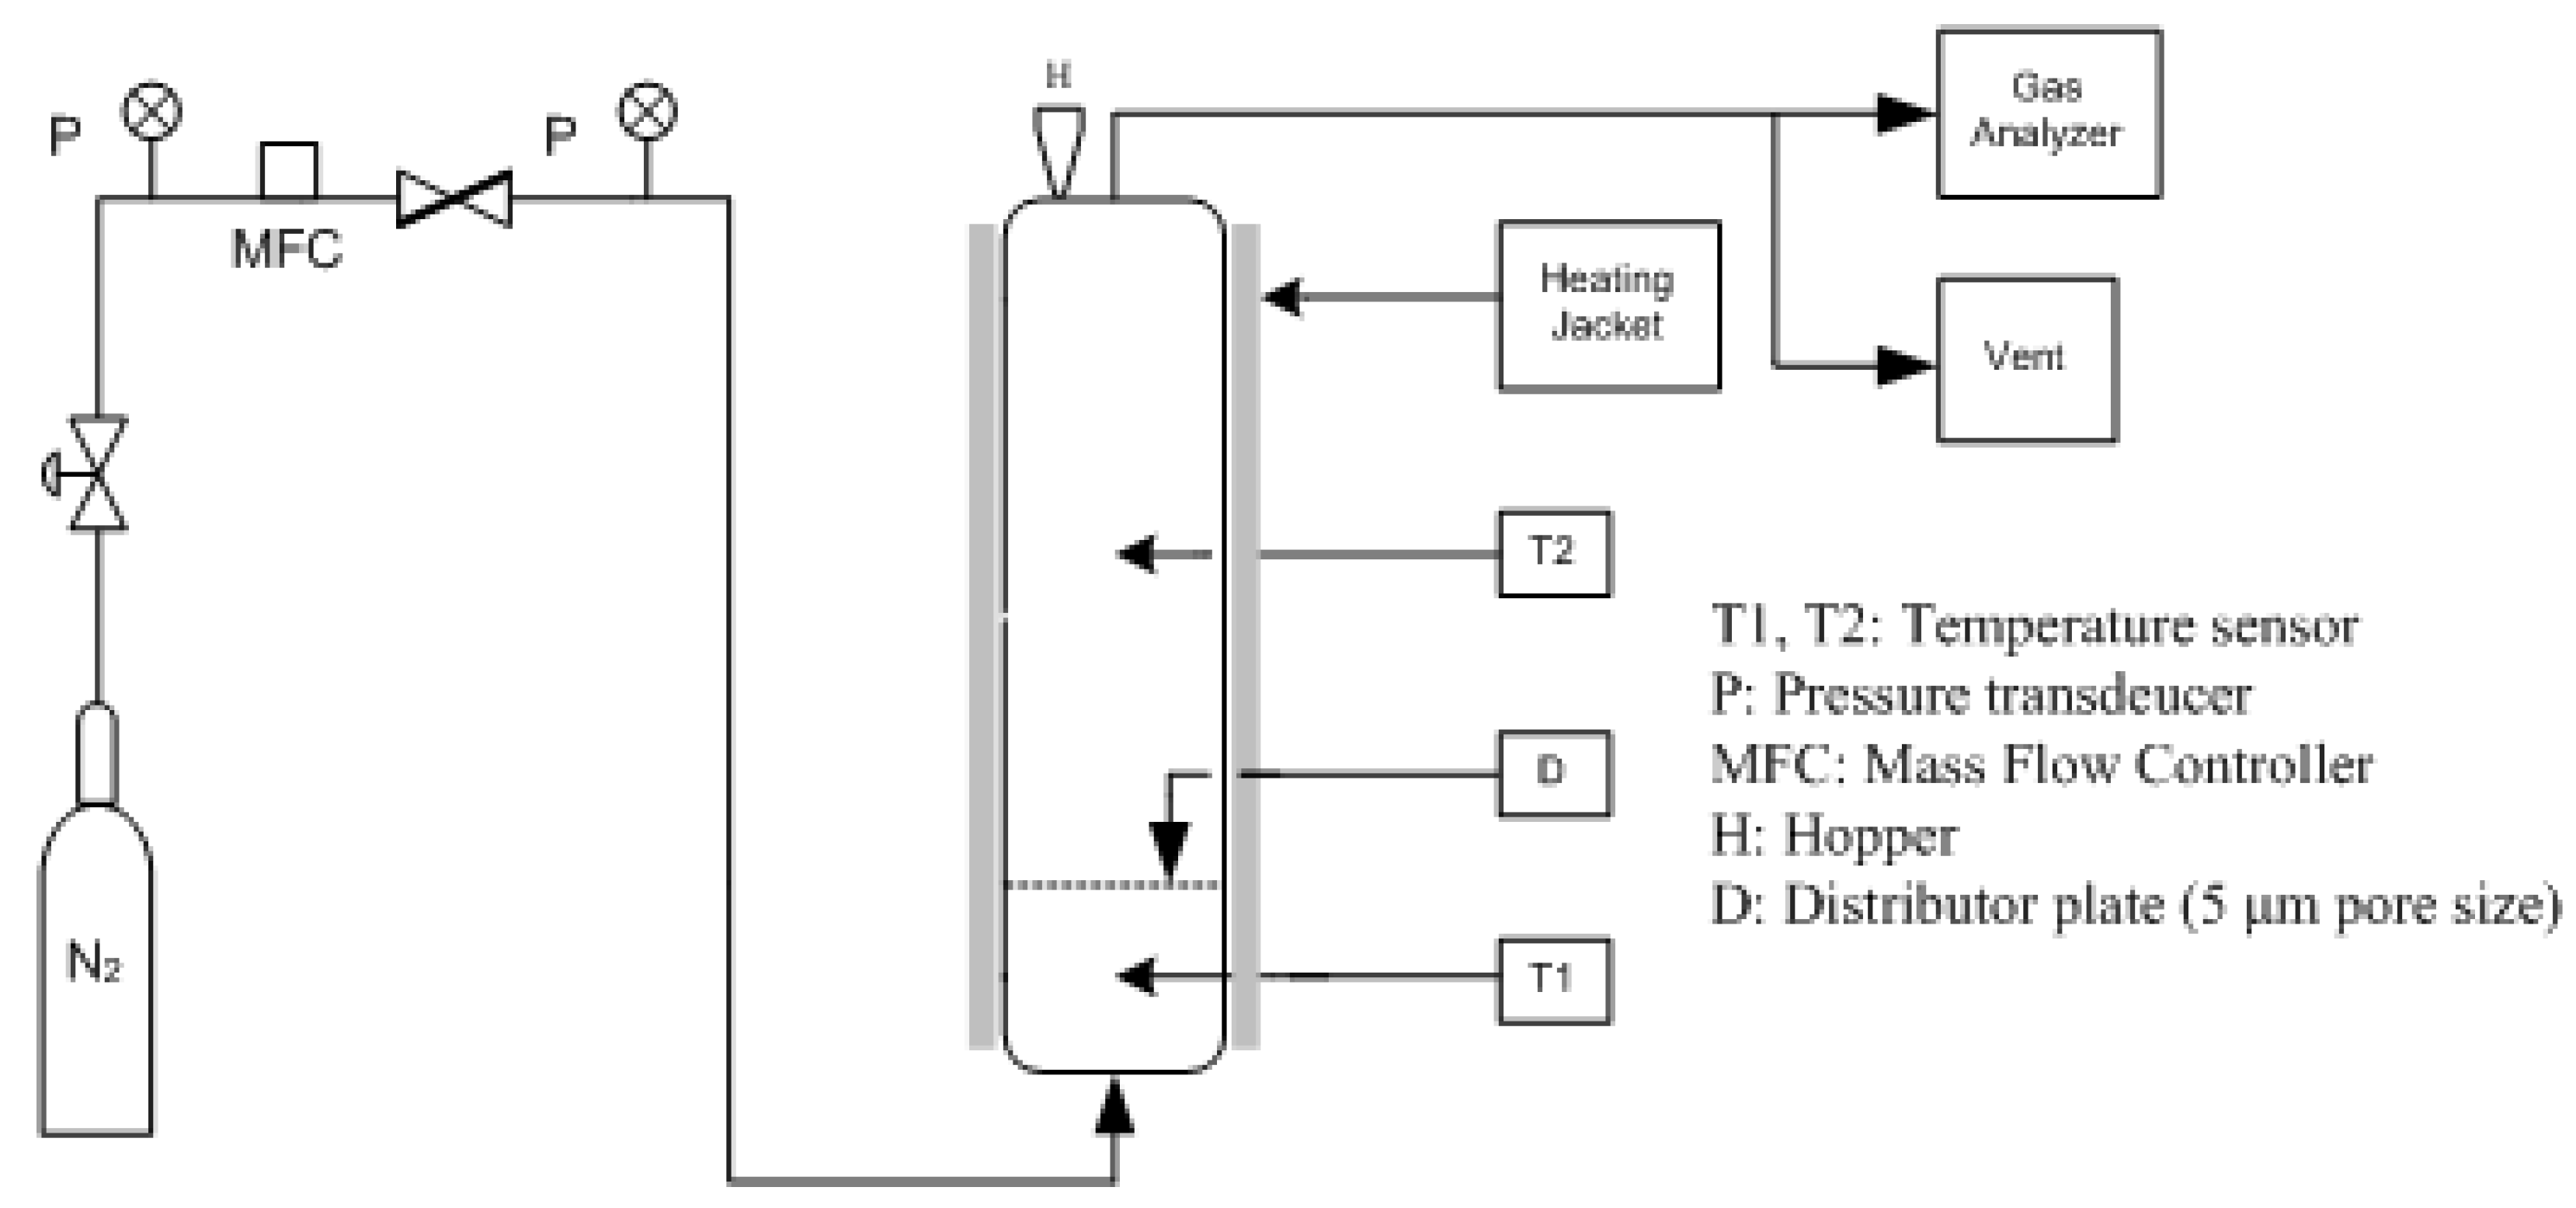
A laboratory scale downdraft fixed bed made of stainless steel was used for the torrefaction of sewage sludge. The bed height was 600 mm with an internal diameter of 30.7 mm. The schematic diagram of the bed is provided in Figure 1. Thermocouples were used to measure temperatures of the inlet gas, the bed, and the reactor wall. Calorific value was measured using bomb calorimeter (Parr Instrument Co., Model 1672, Moline, IL, USA), whereas for elemental analysis Thermo Fisher Scientific INC., Thermo FLASH 200 (Hudson, NH, USA) was used. In addition MK9000 (Eurotron Instruments, Chelmsford, UK,) gas analyzer was used to analyze the emitted gas during torrefaction. 200, 250, 300, and 350 °C temperature range along with 0–50 min of residence time was used for this study. American Society for Testing and Materials (ASTM) D3172 method was used for calculating proximate analysis of raw and torrefied sludge.
2.2. Materials
Sewage sludge was obtained from wastewater treatment plant in Pocheon, South Korea. The sample was homogeneously mixed and dried at 105 °C for 24 h. The samples were then ground into powders and sieved into separate sizes before torrefaction. 250–355 µm size was selected for this study. Table 1 illustrates properties of the sample where ‘others’ indicates inorganic components present in sewage sludge.
2.3. Methods
Sample load of 15 g (dry weight) and a volumetric flow of 300 Nm3/min of nitrogen was used for this study. Nitrogen helps in maintaining the inert atmosphere along with controlling the rapid temperature rise within the downdraft fixed bed. The bed was heated to the desired temperature using a heating jacket. After the desired temperature was reached, the weighed sample was fed from the hopper situated at the top of the reactor. The sample was torrefied at desired torrefaction temperature (200–350 °C) and residence time (0–50 min) in presence of predetermined volumetric flow rate of nitrogen as an inert material and heat carrier. After the completion of the test, the sample was taken out immediately.
2.4. Torrefied Product Analysis
All of the results obtained in this study are obtained prior to densification. The degree of torrefaction plays an important role in determining the quality and composition of the torrefied products. The degree of torrefaction is the ratio between the calorific value of the torrefied biomass to that of the raw biomass, which was calculated using the following equation:
The HHV or the calorific value was measured in Mega Joule per kilogram of biomass. The energy density enhancement was calculated using torrefaction index (non-dimensional form), which demonstrated the enhancement in the energy density through the torrefaction of sewage sludge using Equation (2):
In this study chemical exergy has also been introduced where the chemical exergy of sewage sludge and the torrefied product was calculated with the help of Equations (3) and (4) [20]:
where, HHV is the experimental calorific value that was obtained and λbiomass is a dimensionless coefficient relating chemical exergy and heating value of the biomass and C, H, N, are O are the elemental composition in wt. %. H/C is the ratio of hydrogen mass to carbon mass and N/C and O/C correspondingly for nitrogen and oxygen. Using Equations (3) and (4), chemical exergy was calculated for all of the torrefied sewage sludge at various temperatures and residence time.
3. Results and Discussion
3.1. Degree of Torrefaction
The HHV or the calorific value describes the potential energy content of a biomass. One of the major advantages of torrefaction is the elevated energy content per unit of mass of the torrefied yield. The degree of torrefaction can be used as an indicator to identify the relative energy gain in the torrefied product [21]. Nitthitron and Suthum [21] further illustrates that the value of degree of torrefaction exceeding unity shows a greater energy gain per unit mass.
Figure 2 illustrates the degree of torrefaction with respect to torrefaction residence time at various torrefaction temperatures. From the graph, it is clear that with an increase in torrefaction residence time and temperature the degree of torrefaction increases. From Figure 2, it can be seen that increasing the torrefaction residence time and temperature significantly increased the HHV, which in turn increased the degree of torrefaction of the sewage sludge except for 350 °C. At 200–300 °C, there is an increase in the degree of torrefaction with an increase in torrefaction residence time. This increase might be as a result of the gain of the calorific value due to the removal of oxygen. In contrast, pyrolysis reaction may have occurred at a higher torrefaction temperature, resulting in the decrease in the degree of torrefaction at 350 °C with an increase in torrefaction residence time. A study by Martin et al. [22] suggested that the effect of torrefaction temperature was greater than the effect of torrefaction residence time. Similarly, Barta et al. [23] found that the torrefaction temperature was dominant over residence time until 275 °C, but at 300 °C, the torrefaction residence time had a significant effect on the torrefied yield. This increase might be as a result of the gain of the calorific value due to the removal of oxygen. However, at 350 °C, the rate of degree of torrefaction decreases on further increasing the torrefaction residence time. This may be attributed to the fact that sewage sludge is a non-lignocellulosic biomass and constitutes thermally degradable organic components, which degrades easily on elevated temperatures as a result of which there is deterioration in the degree of torrefaction. In addition, the increase was best gained between 200 and 300 °C, although the overall net gain of the degree of torrefaction was more pronounced for 250 °C. An increase in the calorific value with torrefaction temperatures were obtained by Zanzi et al. [24], Iroba et al. [25], and Nimlos et al. [26].
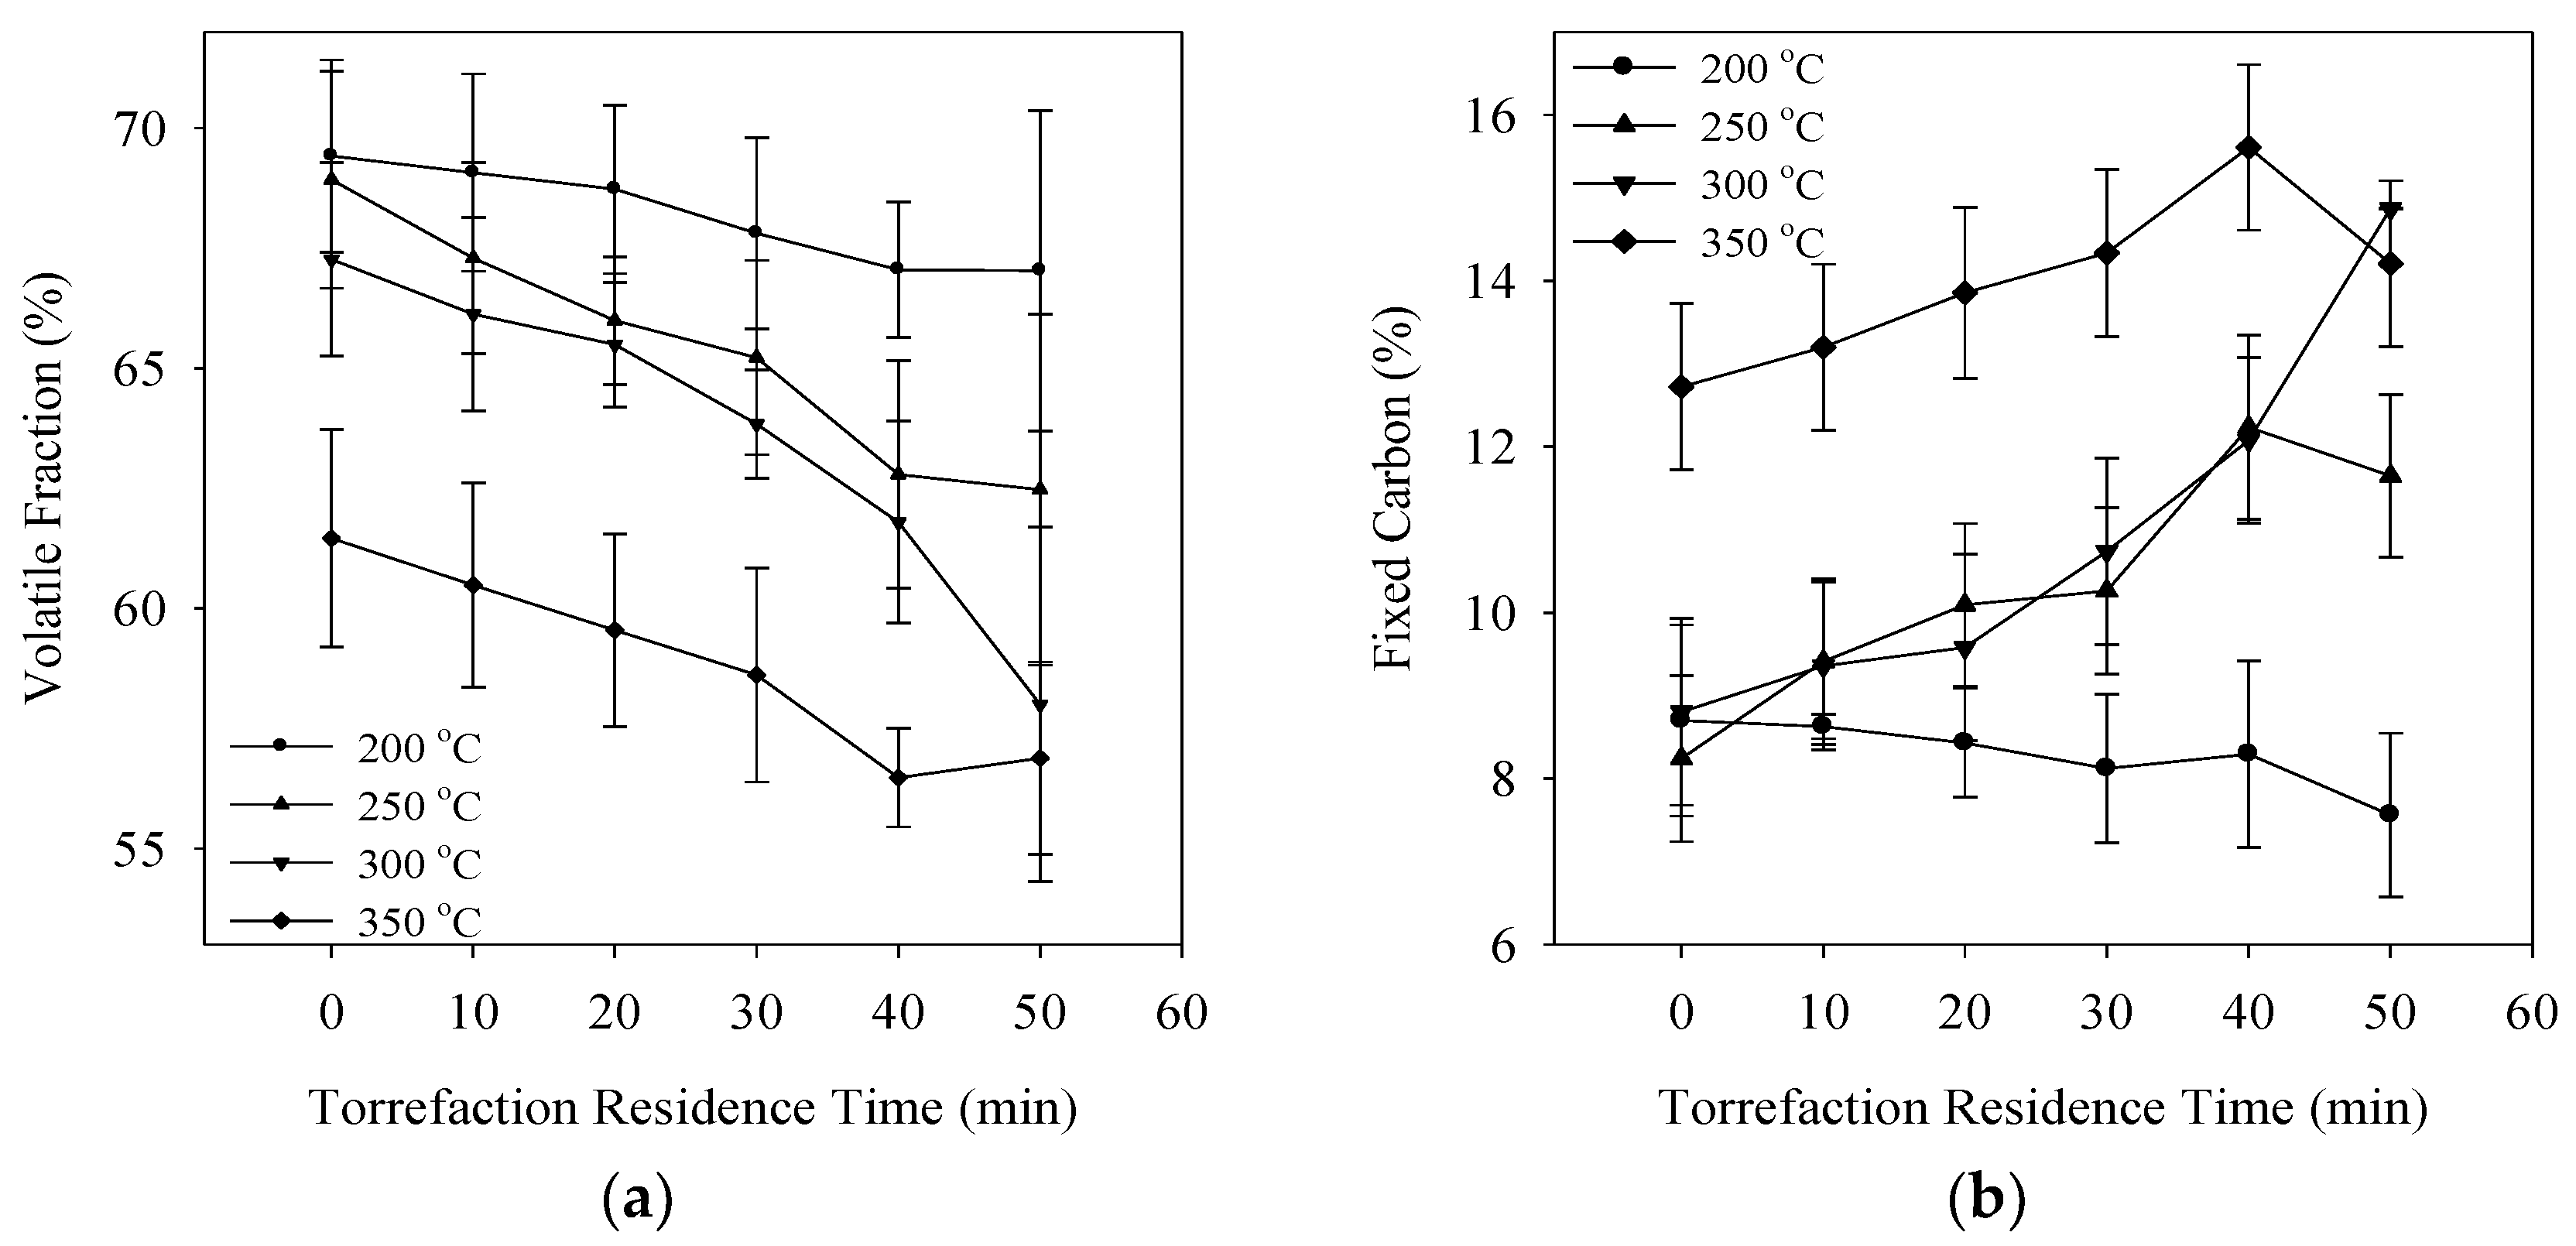
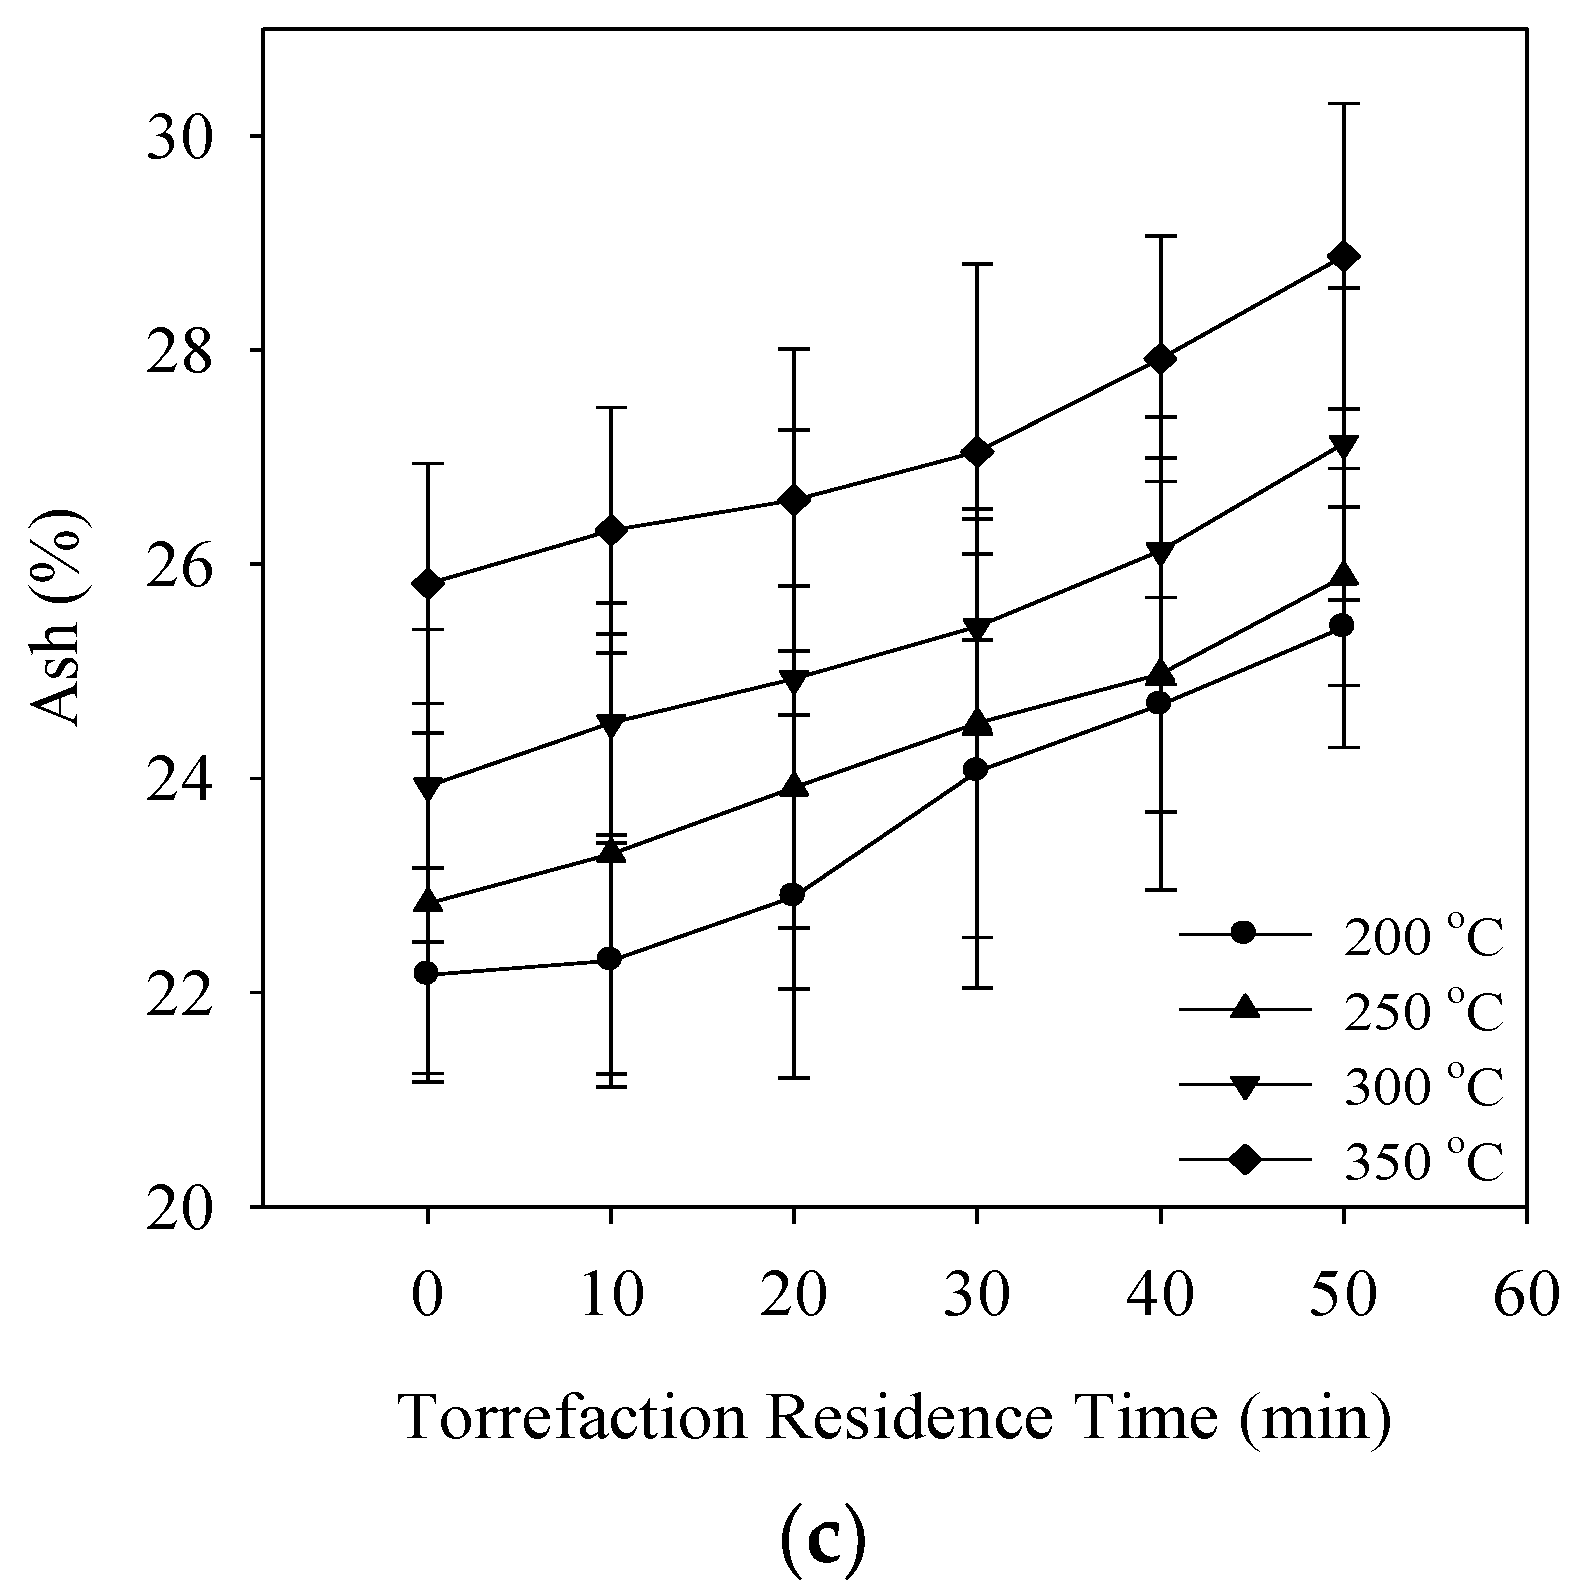
Other important parameters that contribute for the characterization of solid fuel are volatile matter and fixed carbon, which are also partly responsible for the alteration of calorific value [27]. As demonstrated in Figure 3a,b torrefaction has an opposite effect on these two operating parameters. With an increase in torrefaction temperature and residence time, it can be observed that the fixed carbon and ash increases whilst the volatile fraction decreases. The torrefied product is desired to have less volatile fraction and more fixed carbon as it amplifies the calorific value of the torrefied product. For 300 °C, there was a decrease of 13.77% in the volatile content, whereas an increase of 68.95% was observed for fixed carbon. Least changes were observed for 200 °C for both volatile fraction and fixed carbon. Although the highest value for fixed carbon is for 350 °C, the net gain in the value is minimal when compared to 250 and 300 °C. With an increase in torrefaction residence time and temperature, the ash content increased and the highest was for 350 °C. The increase in the ash content was primarily due to the mass loss during the torrefaction process. Similar results were obtained by Park et al. [28]. Improved fixed carbon value of torrefied biomass can be an advantage as it aids the heat of combustion improving the efficiency of the overall combustion applications [29]. In contrast, an increase in the ash content can have a negative impact on the usage of the torrefied product as a higher ash content is associated with fouling, slagging, and agglomeration of the bed [30]. A study by Deng et al. [31] demonstrated a decrease of 38.88% in the volatile content, whereas Mani [32] achieved only 7.8% decrease in the volatile content, the differences in the value was due to the types of the biomass that were used for the pretreatment process. The former was high due to the high volatile content that was present in the agricultural residue when compared to the latter, which considered woody biomass [33].
The molar ratios of hydrogen and oxygen with respect to the relative carbon content i.e., O/C and H/C ratios are substantial parameters for the characterization of fuel composition. From Figure 4, for both molar ratios, torrefaction at 200 °C did not have much of a significant effect, but with an increase in torrefaction temperatures from 250 to 300 °C presented a significant decrease. At 350 °C, for both H/C and O/C molar ratios, a steep decrease was observed. Whereas, a gradual decrease in the H/C molar ratio at 250 and 300 °C was achieved. For O/C at 300 °C, a slight increase was observed until 20 min residence time, after which the fall in the O/C value was noticeable. These alterations in the molar ratios are primarily due to the release of bound water and are also due to the fractional removal of oxygen by decarboxylation, and dehydration reactions [34]. This decrease consequently increased the gross calorific value, which in turn decreases the volatile content. In addition, with an increase in torrefaction temperature and residence time, the hydrogen and oxygen content of the torrefied product decreased, resulting in reduction of the H/C and O/C ratios. Therefore, it can be seen from the graph that the increase in torrefaction temperature and residence time provoked a reduction in the O/C and H/C molar ratios due to the loss of carbon in the form of carbon dioxide, light hydrocarbons, and water. Moreover, a similar reduction trend of O/C was observed by Sandeep et al. [35] in their study for lignocellulosic biomass. Reduction in the oxygen and hydrogen content strengthens the fact that the hydroxyl groups deteriorate during torrefaction. Moreover, from an energy density perspective, C–C bond projects higher energy compared to C–O or C–H bonds as the relative increase in carbon content results in better calorific value. Increase in the relative carbon content and decrease of other elements, such as O, N, H, and S may also result in a decrease in the volatile fraction.
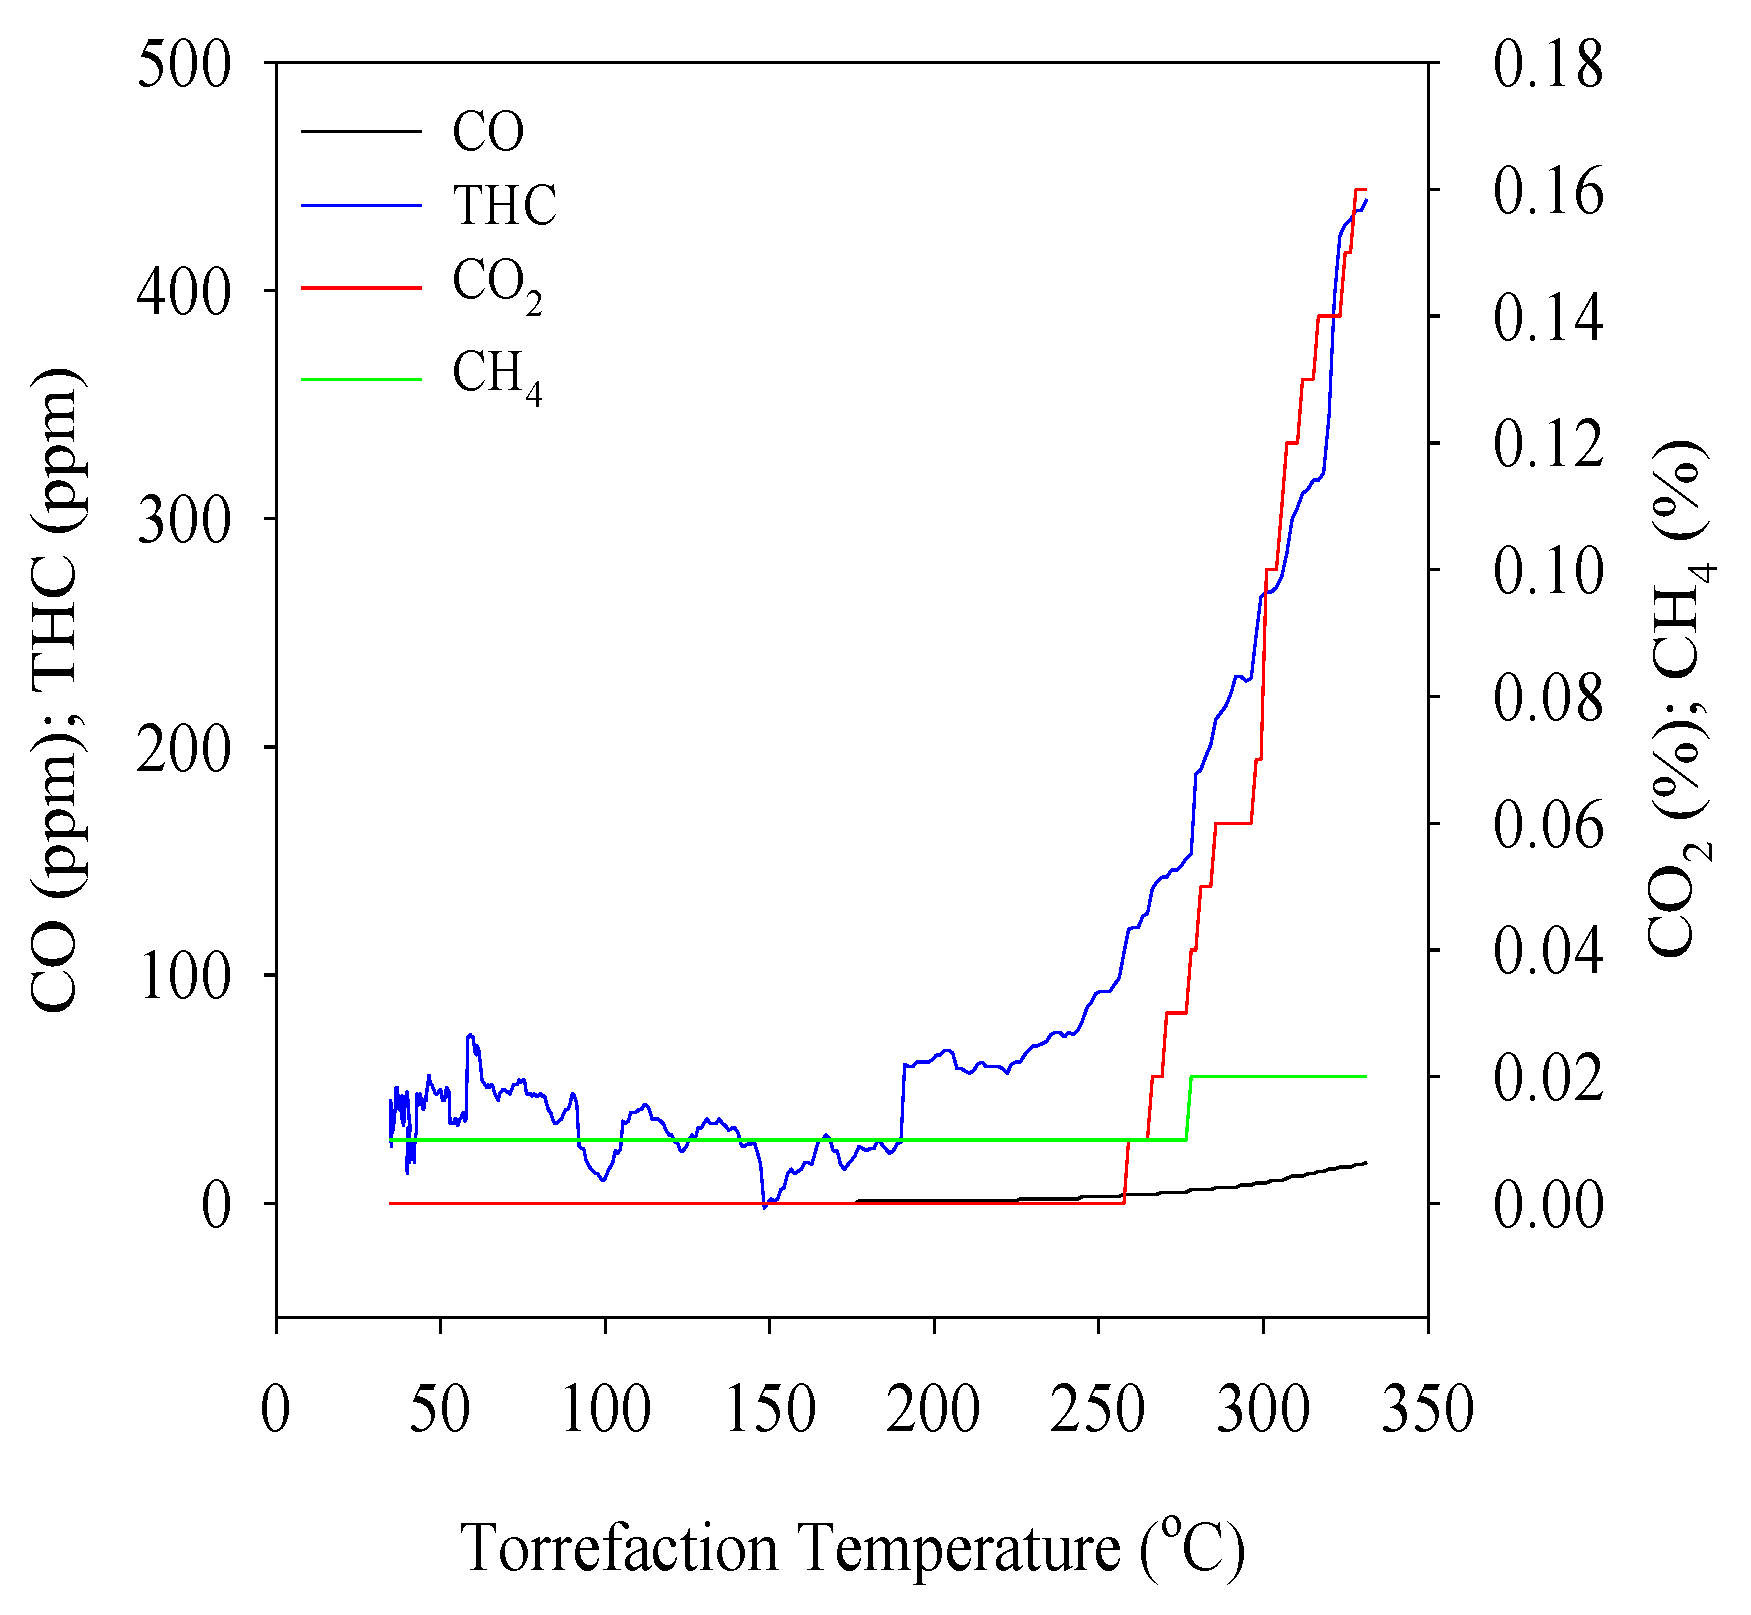
Increase in torrefaction temperature also favors the generation of gases, such as carbon monoxide (CO), carbon-dioxide (CO2), thermal hydrocarbon (THC), and methane (CH4), which is demonstrated in Figure 5. The gas analysis was carried out independently in order to study the gases that are emitted during the torrefaction of sewage sludge. The gas emission was not studied for different residence time. Rather, a continuous emission test from 50 to 350 °C was conducted to study the emission properties during torrefaction. CO2 and CO were released after 250 °C, whereas CH4 was released approximately after 270 °C and only subtle traces of THC is generated until 240 °C. This increase in the CO2 is associated with the decarboxylation of the acid group, as explained by White and Dietenberger [36], whereas methane is produced due to the cracking and de-polymerization reactions [31]. As aforementioned, the decarboxylation reaction occurs at an elevated temperature, which is also supported by the production of CO2 and CO [37]. Various researchers have proposed 300 °C as the optimal torrefaction temperature [38,39]. From the results obtained in this study, it can be concluded that 250–300 °C can be considered as the optimum temperature for the torrefaction of sewage sludge. The difference in the optimum temperature range obtained in other research to this research may be due to the different types of biomass that were used i.e., lignocellulosic and non-lignocellulosic biomass.
3.2. Torrefaction Index (TI)
A study by Pabir Basu et al. [40] suggests that the degree of torrefaction or energy densification alone cannot determine the quality of the torrefied product and proposes the use of the torrefaction index. Lee and Lee [41] also supports this statement that energy yield alone cannot be used to define the optimum operating condition for torrefaction. As a matter of fact, as the severity of the process escalates, there is a reduction in the energy yield, which in turn reduces the net usable energy of raw material. Therefore providing the optimized condition for torrefaction would aid the reduction of weight loss but would boost the calorific value.
Table 2 depicts the comparison of the experimental torrefaction index obtained in this study, with the torrefaction index for different torrefaction regimes according to Pabir Basu et al. [40]. It demonstrates that the values obtained in this study aligns well with the values provided by Pabir Basu et al. [40]. At 350 °C, not much improvement in the torrefaction index is demonstrated. Therefore, torrefaction of sewage sludge above 350 °C will not be required. If the polymeric composition of the biomass is known for specific torrefaction temperatures, than TI can be used as a potential tool for preliminary design or the selection of biomass ahead of operating absolute test [40].
3.3. Chemical Exergy (ech)
One of the effective ways to calculate energy quality is by analyzing the exergy of the biomass. Pavelka [42] defines exergy as the maximal theoretical useful work acquired if the system is in thermodynamic equilibrium with the surroundings via reversible process. In context of biomass, exergy plays a vital role in evaluating the energy potentiality that is stored in the form of chemical bonds of the compounds.
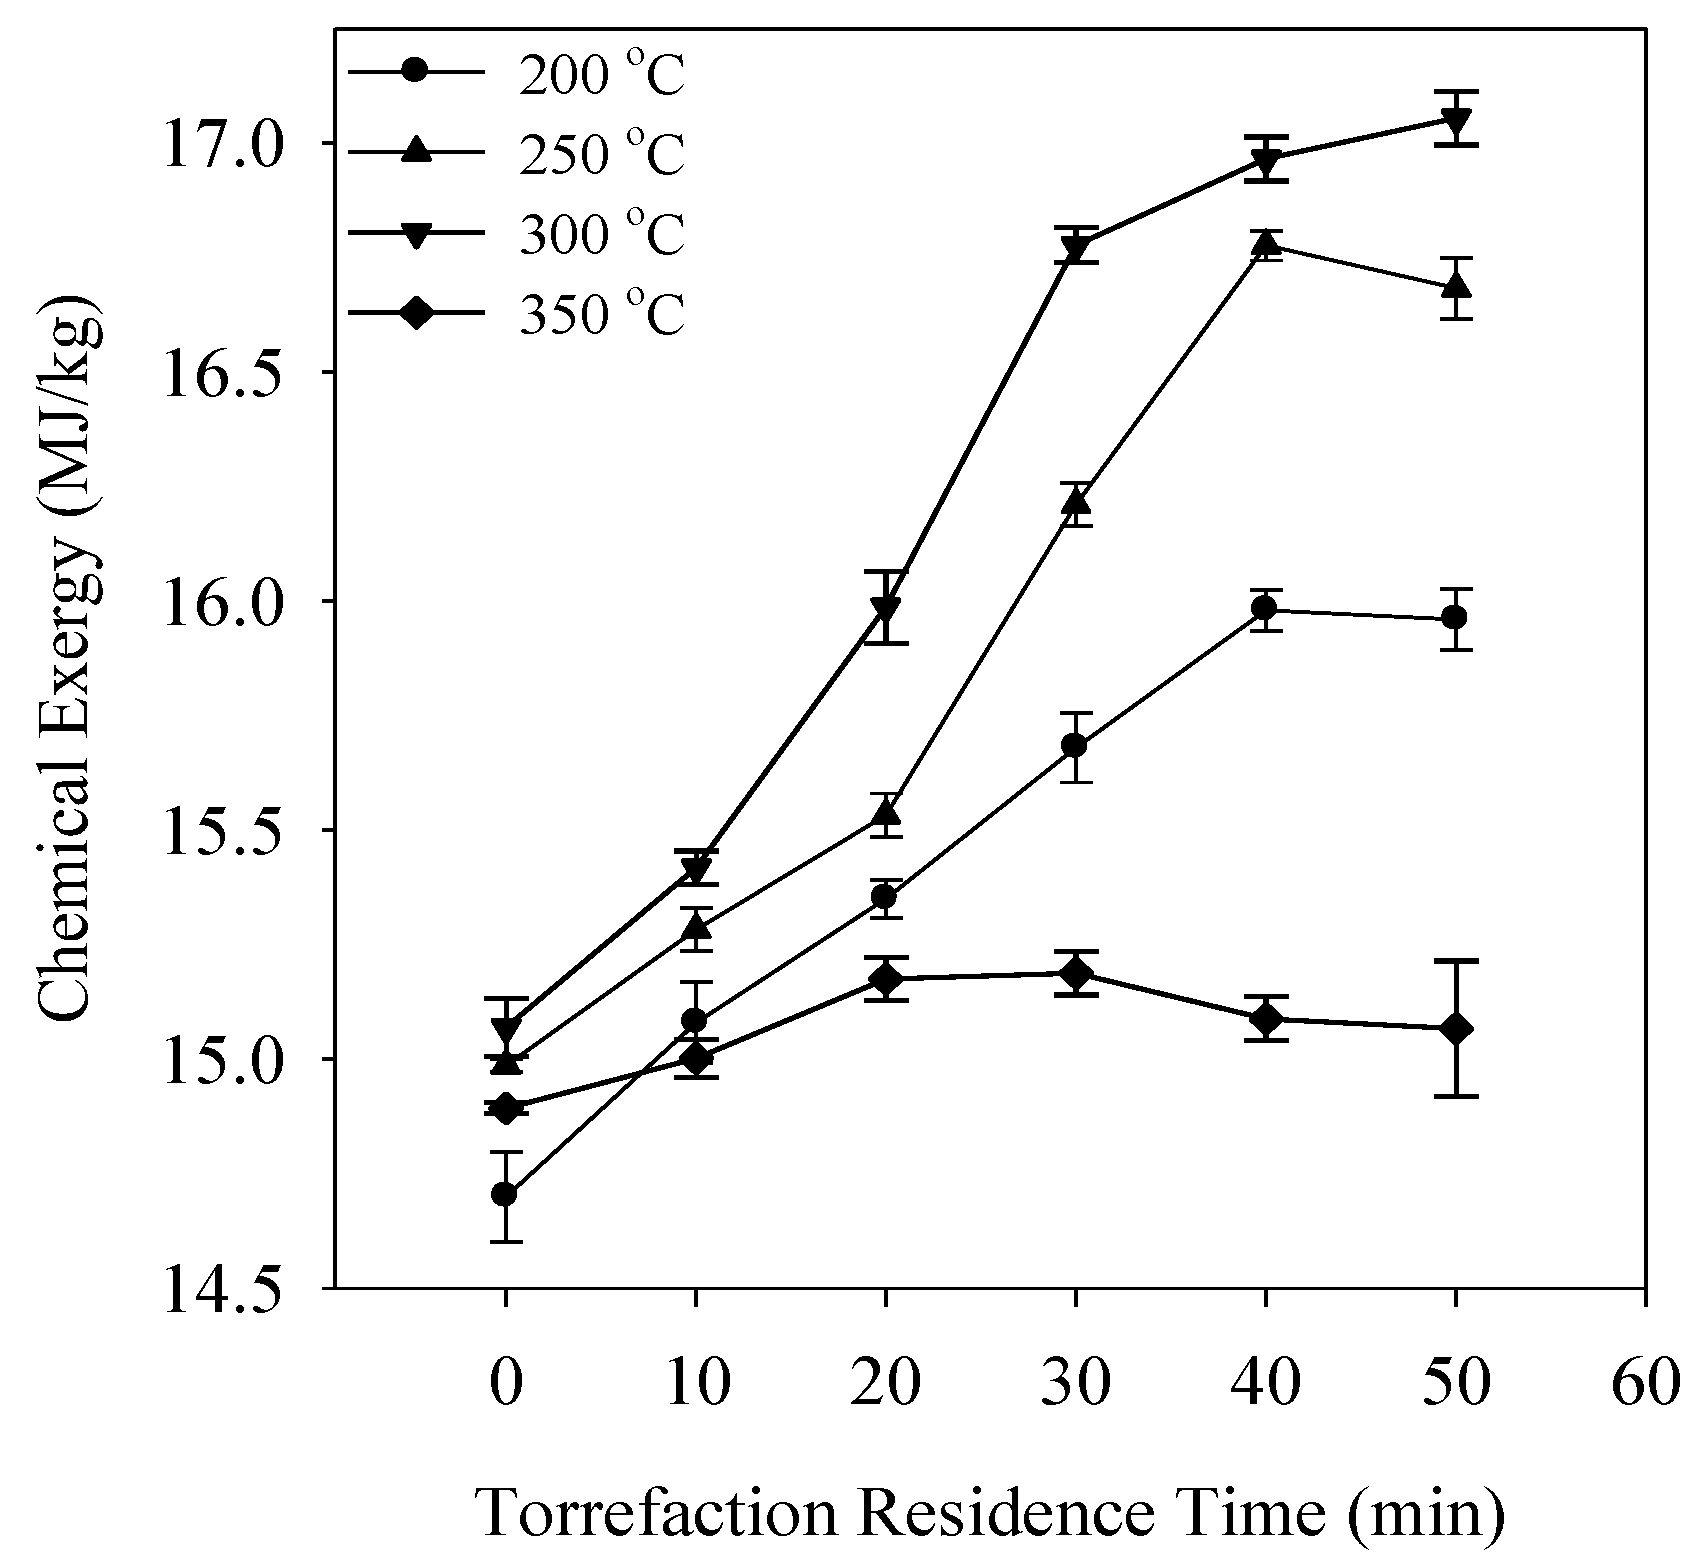
From Figure 6 it can be seen that the overall increase in chemical exergy increases with increase in torrefaction residence time and temperature. At 200 °C, there is a gradual increase in the exergy but a significant increase is observed at 300 °C followed by 250 °C and the least value is projected by 350 °C. The graph obtained for chemical exergy can be correlated with O/C molar ratio and degree of torrefaction. The decrease in the O/C molar ratio is due to the increase in the relative carbon content which in turn increases the chemical exergy. This may be due to the fact that elemental oxygen present in the biomass operates as an oxidizing agent instead of combustible matter in contrast to the elemental carbon of the biomass, which undergoes oxidation during the chemical reaction releasing heat, which can be converted to work. In addition, the trend followed by degree of torrefaction and chemical exergy is comparable. For 200–300 °C, the degree of torrefaction and chemical exergy increases with an increase in torrefaction residence time. At 350 °C, the degree of torrefaction decreases with an increase in residence time; whereas, there is a negligible increase in the chemical exergy. This again can be associated with the increase in calorific value of the biomass due to the increase in the relative carbon content with the increase in torrefaction residence time. The highest value of exergy obtained in this study was 17.05 MJ/kg for 300 °C at 50 min residence time. The greater the value of exergy the greater is the useful work of the torrefied biomass, which in turn can enhance the thermochemical processes, such as pyrolysis, combustion, and gasification. For better-torrefied yield product on the basis of chemical exergy it can be concluded that 250–300 °C can be used as the optimal torrefaction temperature for sewage sludge.
4. Conclusions
The torrefaction properties of sewage sludge were investigated using a downdraft fixed bed reactor with respect to torrefaction temperature and residence time. An increase in the degree of torrefaction was seen at higher torrefaction temperature and residence time. The total net gain in the degree of torrefaction was highest for 250 °C, whilst an adverse effect was seen for 350 °C with an increase in torrefaction residence time and temperature. Reduction in the O/C and H/C molar ratios, volatile content with increase in the fixed carbon, and ash content with escalated torrefaction temperature was observed. The increase in degree of torrefaction and decrease in the O/C can be associated with the increase in carbon content, resulting in an increment in the chemical exergy of the torrefied biomass. This increase in exergy might improve the thermodynamic properties of the biomass; however, economic analysis must be considered and further investigation must be made in order to gain a clear understanding. From all of the results obtained in this study, it can be concluded that torrefaction above 300 °C would not be desirable. Also, to obtain maximum yield, a temperature range of 250–300 °C should be considered for the torrefaction of sewage sludge.
This torrefaction temperature range of 250–300 °C for sewage sludge may vary depending on the origin of sewage sludge, chemical composition, reactor type, and other experimental parameters. Furthermore, an in depth study of energy consumption and losses during torrefaction must also be considered as further research in order to provide a better understanding of the torrefaction characteristics of sewage sludge.
Acknowledgments
This work was supported by the Human Resources Development Program (No. 20154030200940) and Renewable Energy’s Technology Department Program (No. 20143010101910) of the Korea Institute of Energy Technology Evaluation and Planning (KETEP) funded by the Ministry of Trade, Industry and Energy of the Korean Government.
Author Contributions
Sujeeta Karki and Jeeban Poudel equally contributed in the experiment while Sujeeta Karki was responsible for preparing the first draft of the paper. All three authors were equally responsible for preparing the final draft of this research article. Sea Cheon Oh supervised the research and finalized the paper.
Conflicts of Interest
The authors declare no conflict of interest.
References
- Uris, M.; Linares, J.I.; Arenas, E. Techno-economic feasibility assessment of a biomass cogeneration plant based on an Organic Rankine Cycle. Renew. Energy 2014, 66, 707–713. [Google Scholar] [CrossRef]
- Maraver, D.; Sin, A.; Sebastián, F.; Royo, J. Environmental assessment of CCHP (combined cooling heating and power) systems based on biomass combustion in comparison to conventional generation. Energy 2013, 57, 17–23. [Google Scholar] [CrossRef]
- Magdziarz, A.; Werle, S. Analysis of the combustion and pyrolysis of dried sewage sludge by TGA and MS. Waste Manag. 2014, 34, 174–179. [Google Scholar] [CrossRef] [PubMed]
- Kijo-Kleczkowska, A.; Środa, K.; Kosowska-Golachowska, M.; Musiał, T.; Wolski, K. Mechanisms and kinetics of granulated sewage sludge combustion. Waste Manag. 2015, 46, 459–471. [Google Scholar] [CrossRef] [PubMed]
- Miller, B.; Kandiyoti, R.; Dugwell, D. Trace element behavior during co-combustion of sewage sludge with polish coal. Energy Fuels 2004, 18, 1093–1103. [Google Scholar] [CrossRef]
- Su, Y.; Zhu, W.; Gong, M.; Zhou, H.; Fan, Y.; Amuzu-Sefordzi, B. Interaction between sewage sludge components lignin (phenol) and proteins (alanine) in supercritical water gasification. Int. J. Hydrog. Energy 2015, 40, 9125–9136. [Google Scholar] [CrossRef]
- Xu, C.; Chen, W.; Hong, J. Life-cycle environmental and economic assessment of sewage sludge treatment in china. J. Clean. Prod. 2014, 67, 79–87. [Google Scholar] [CrossRef]
- Somolada, M.C.; Zabaniotou, A.A. Comparative assessment of municipal sewage sludge incineration, gasification and pyrolysis for a sustainable sludge-to-energy management in Greece. Waste Manag. 2014, 34, 411–420. [Google Scholar] [CrossRef] [PubMed]
- Loow, Y.-L.; New, E.K.; Yang, G.H.; Ang, L.Y.; Foo, L.Y.W.; Wu, T.Y. Potential use of deep eutectic solvents to facilitate lignocellulosic biomass utilization and conversion. Cellulose 2017, 24, 1–28. [Google Scholar] [CrossRef]
- Cremers, M.; Koppejan, J.; Middelkamp, J.; Witkamp, J.; Sokhansanj, S.; Melin, S. Status Overview of Torrefaction Technologies. A Review of the Commercialisation Status of Biomass Torrefaction. Available online: http://www.ieabcc.nl/publications/IEA_Bioenergy_T32_Torrefaction_update_2015b.pdf (accessed on 28 September 2017).
- Van der Stelt, M.; Gerhauser, H.; Kiel, J.; Ptasinski, K. Biomass upgrading by torrefaction for the production of biofuels: A review. Biomass Bioenergy 2011, 35, 3748–3762. [Google Scholar] [CrossRef]
- Shankar Tumuluru, J.; Sokhansanj, S.; Hess, J.R.; Wright, C.T.; Boardman, R.D. A review on biomass torrefaction process and product properties for energy applications. Ind. Biotechnol. 2011, 7, 384–401. [Google Scholar] [CrossRef]
- McKendry, P. Energy production from biomass (part 1): Overview of biomass. Bioresour. Technol. 2002, 83, 37–46. [Google Scholar] [CrossRef]
- Hellwig, M. Basics of the Combustion of Wood and Straw; Elsevier Applied Science Publishers: London, UK, 1985; pp. 793–798. [Google Scholar]
- Dhungana, A.; Dutta, A.; Basu, P. Torrefaction of non-lignocellulose biomass waste. Can. J. Chem. Eng. 2012, 90, 186–195. [Google Scholar] [CrossRef]
- Ábrego, J.; Sánchez, J.L.; Arauzo, J.; Fonts, I.; Gil-Lalaguna, N.; Atienza-Martínez, M. Technical and energetic assessment of a three-stage thermochemical treatment for sewage sludge. Energy Fuels 2013, 27, 1026–1034. [Google Scholar] [CrossRef]
- Atienza-Martínez, M.; Mastral, J.F.; Ábrego, J.; Ceamanos, J.; Gea, G. Sewage sludge torrefaction in an auger reactor. Energy Fuels 2014, 29, 160–170. [Google Scholar] [CrossRef]
- Atienza-Martínez, M.; Fonts, I.; Ábrego, J.; Ceamanos, J.; Gea, G. Sewage sludge torrefaction in a fluidized bed reactor. Chem. Eng. J. 2013, 222, 534–545. [Google Scholar] [CrossRef]
- Kuo, P.; Wu, W.; Chen, W. Gasification performances of raw and torrefied biomass in a downdraft fixed bed gasifier using thermodynamic analysis. Fuel 2014, 117, 1231–1241. [Google Scholar] [CrossRef]
- Kotas, T.J. The Exergy Method of Thermal Plant Analysis; Krieger Publishing Company: Boston, MA, USA, 1995. [Google Scholar]
- Kongkeaw, N.; Patumsawad, S. Thermal upgrading of biomass as a fuel by torrefaction. In Proceedings of the International Conference on Environmental Engineering and Applications, Shanghai, China, 19 August 2011; pp. 38–42. [Google Scholar]
- Strandberg, M.; Olofsson, I.; Pommer, L.; Wiklund-Lindstrom, S.; Aberg, K.; Nordin, A. Effects of temperature and residence time on continuous torrefaction of spruce wood. Fuel Process. Technol. 2015, 134, 387–398. [Google Scholar] [CrossRef]
- Barta-Rajnai, E.; Wang, L.; Sebestyen, Z.; Barta, Z.; Khalil, R.; Skreiberg, O.; Gronli, M.; Jakab, E.; Czegeny, Z. Effect of Temperature and Duration of Torrefaction on the Thermal Behavior of Stem Wood, Bark, and Stump of Spruce. Energy Proced. 2017, 105, 551–556. [Google Scholar] [CrossRef]
- Zanzi, R.; Ferro, D.T.; Torres, A.; Soler, P.B.; Bjornbom, E. Biomass torrefaction. In Proceedings of the 6th Asia-Pacific International Symposium on Combustion and Energy Utilization, Kuala Lumpur, Malaysia, 20–22 May 2002. [Google Scholar]
- Iroba, K.L.; Baik, O.; Tabil, L.G. Torrefaction of biomass from municipal solid waste fractions II: Grindability characteristics, higher heating value, pelletability and moisture adsorption. Biomass Bioenergy 2017, 106, 8–20. [Google Scholar] [CrossRef]
- Nimlos, M.N.; Brooking, E.; Looker, M.; Evans, R. Biomass torrefaction studies with a molecular beam mass spectrometer. Am. Chem. Soc. Div. Fuel Chem. 2003, 48, 590–591. [Google Scholar]
- Chen, W.; Lu, K.; Lee, W.; Liu, S.; Lin, T. Non-oxidative and oxidative torrefaction characterization and SEM observations of fibrous and ligneous biomass. Appl. Energy 2014, 114, 104–113. [Google Scholar] [CrossRef]
- Park, J.; Meng, J.; Lim, K.H.; Rojas, O.J.; Park, S. Transformation of lignocellulosic biomass during torrefaction. J. Anal. Appl. Pyrol. 2013, 100, 199–206. [Google Scholar] [CrossRef]
- Bridgeman, T.; Jones, J.; Shield, I.; Williams, P. Torrefaction of reed canary grass, wheat straw and willow to enhance solid fuel qualities and combustion properties. Fuel 2008, 87, 844–856. [Google Scholar] [CrossRef]
- Sadaka, S.; Negi, S. Improvements of biomass physical and thermochemical characteristics via torrefaction process. Environ. Prog. Sustain. Energy 2009, 28, 427–434. [Google Scholar] [CrossRef]
- Deng, J.; Wang, G.; Kuang, J.; Zhang, Y.; Luo, Y. Pretreatment of agricultural residues for co-gasification via torrefaction. J. Anal. Appl. Pyrol. 2009, 86, 331–337. [Google Scholar] [CrossRef]
- Mani, S. Integrating biomass torrefaction with thermo-chemical conversion processes. In Proceedings of the AIChE Annual Meeting, Nashville, TN, USA, 8–13 November 2009; pp. 8–13. [Google Scholar]
- Tumuluru, J.S.; Wright, C.T.; Boardman, R.D.; Hess, R.J.; Sokhansanj, S. Review on biomass torrefaction process and product properties and design of moving bed torrefaction system model development. In Proceedings of the ASABE Annual Meeting, Louisville, Kentucky, 7–10 August 2011. [Google Scholar]
- Bergman, P.C.; Boersma, A.; Zwart, R.; Kiel, J. Torrefaction for Biomass Co-Firing in Existing Coal-FiredPower Stations. Energy Centre of Netherlands, Report No.ECN-C-05-013. Available online: https://www.researchgate.net/profile/Robin_Zwart/publication/204978559_Torrefaction_for_Biomass_Co-Firing_in_Existing_Coal-Fired_Power_Stations/links/09e41511c9aaf0e1c7000000.pdf (accessed on 5 October 2017).
- Kumar, S.; Gupta, R.; Lee, Y.; Gupta, R.B. Cellulose pretreatment in subcritical water: Effect of temperature on molecular structure and enzymatic reactivity. Bioresour. Technol. 2010, 101, 1337–1347. [Google Scholar] [CrossRef] [PubMed]
- White, R.H.; Dietenberger, M. Wood Products: Thermal Degradation and Fire; Elsevier: Amsterdam, The Netherlands, 2001. [Google Scholar]
- He, C.; Wang, K.; Giannis, A.; Yang, Y.; Wang, J. Products evolution during hydrothermal conversion of dewatered sewage sludge in sub-and near-critical water: Effects of reaction conditions and calcium oxide additive. Int. J. Hydrog. Energy 2015, 40, 5776–5787. [Google Scholar] [CrossRef]
- Sarvaramini, A.; Assima, G.P.; Beaudoin, G.; Larachi, F. Biomass torrefaction and CO2 capture using mining wastes—A new approach for reducing greenhouse gas emissions of co-firing plants. Fuel 2014, 115, 749–757. [Google Scholar] [CrossRef]
- Shang, L.; Ahrenfeldt, J.; Holm, J.K.; Sanadi, A.R.; Barsberg, S.; Thomsen, T.; Stelte, W.; Henriksen, U.B. Changes of chemical and mechanical behavior of torrefied wheat straw. Biomass Bioenergy 2012, 40, 63–70. [Google Scholar] [CrossRef] [Green Version]
- Basu, P.; Kulshreshtha, A.; Acharya, B. An index for quantifying the degree of torrefaction. BioResources 2017, 12, 1749–1766. [Google Scholar] [CrossRef]
- Lee, S.M.; Lee, J. Optimization of biomass torrefaction conditions by the gain and loss method and regression model analysis. Bioresour. Technol. 2014, 172, 438–443. [Google Scholar] [CrossRef] [PubMed]
- Pavelka, M.; Klika, V.; Vágner, P.; Maršík, F. Generalization of exergy analysis. Appl. Energy 2015, 137, 158–172. [Google Scholar] [CrossRef]
Figure 1.
Schematic diagram of the fluidized bed used in this study.

Figure 2.
The degree of torrefaction of torrefied sample as a function of torrefaction residence time.
Figure 2.
The degree of torrefaction of torrefied sample as a function of torrefaction residence time.

Figure 3.
(a) Volatile fraction (%); (b) Fixed carbon (%); and (c) Ash (%) as a function of torrefaction residence time.
Figure 3.
(a) Volatile fraction (%); (b) Fixed carbon (%); and (c) Ash (%) as a function of torrefaction residence time.


Figure 4.
Changes of (a) H/C (b) O/C molar ratios as a function of torrefaction residence time.
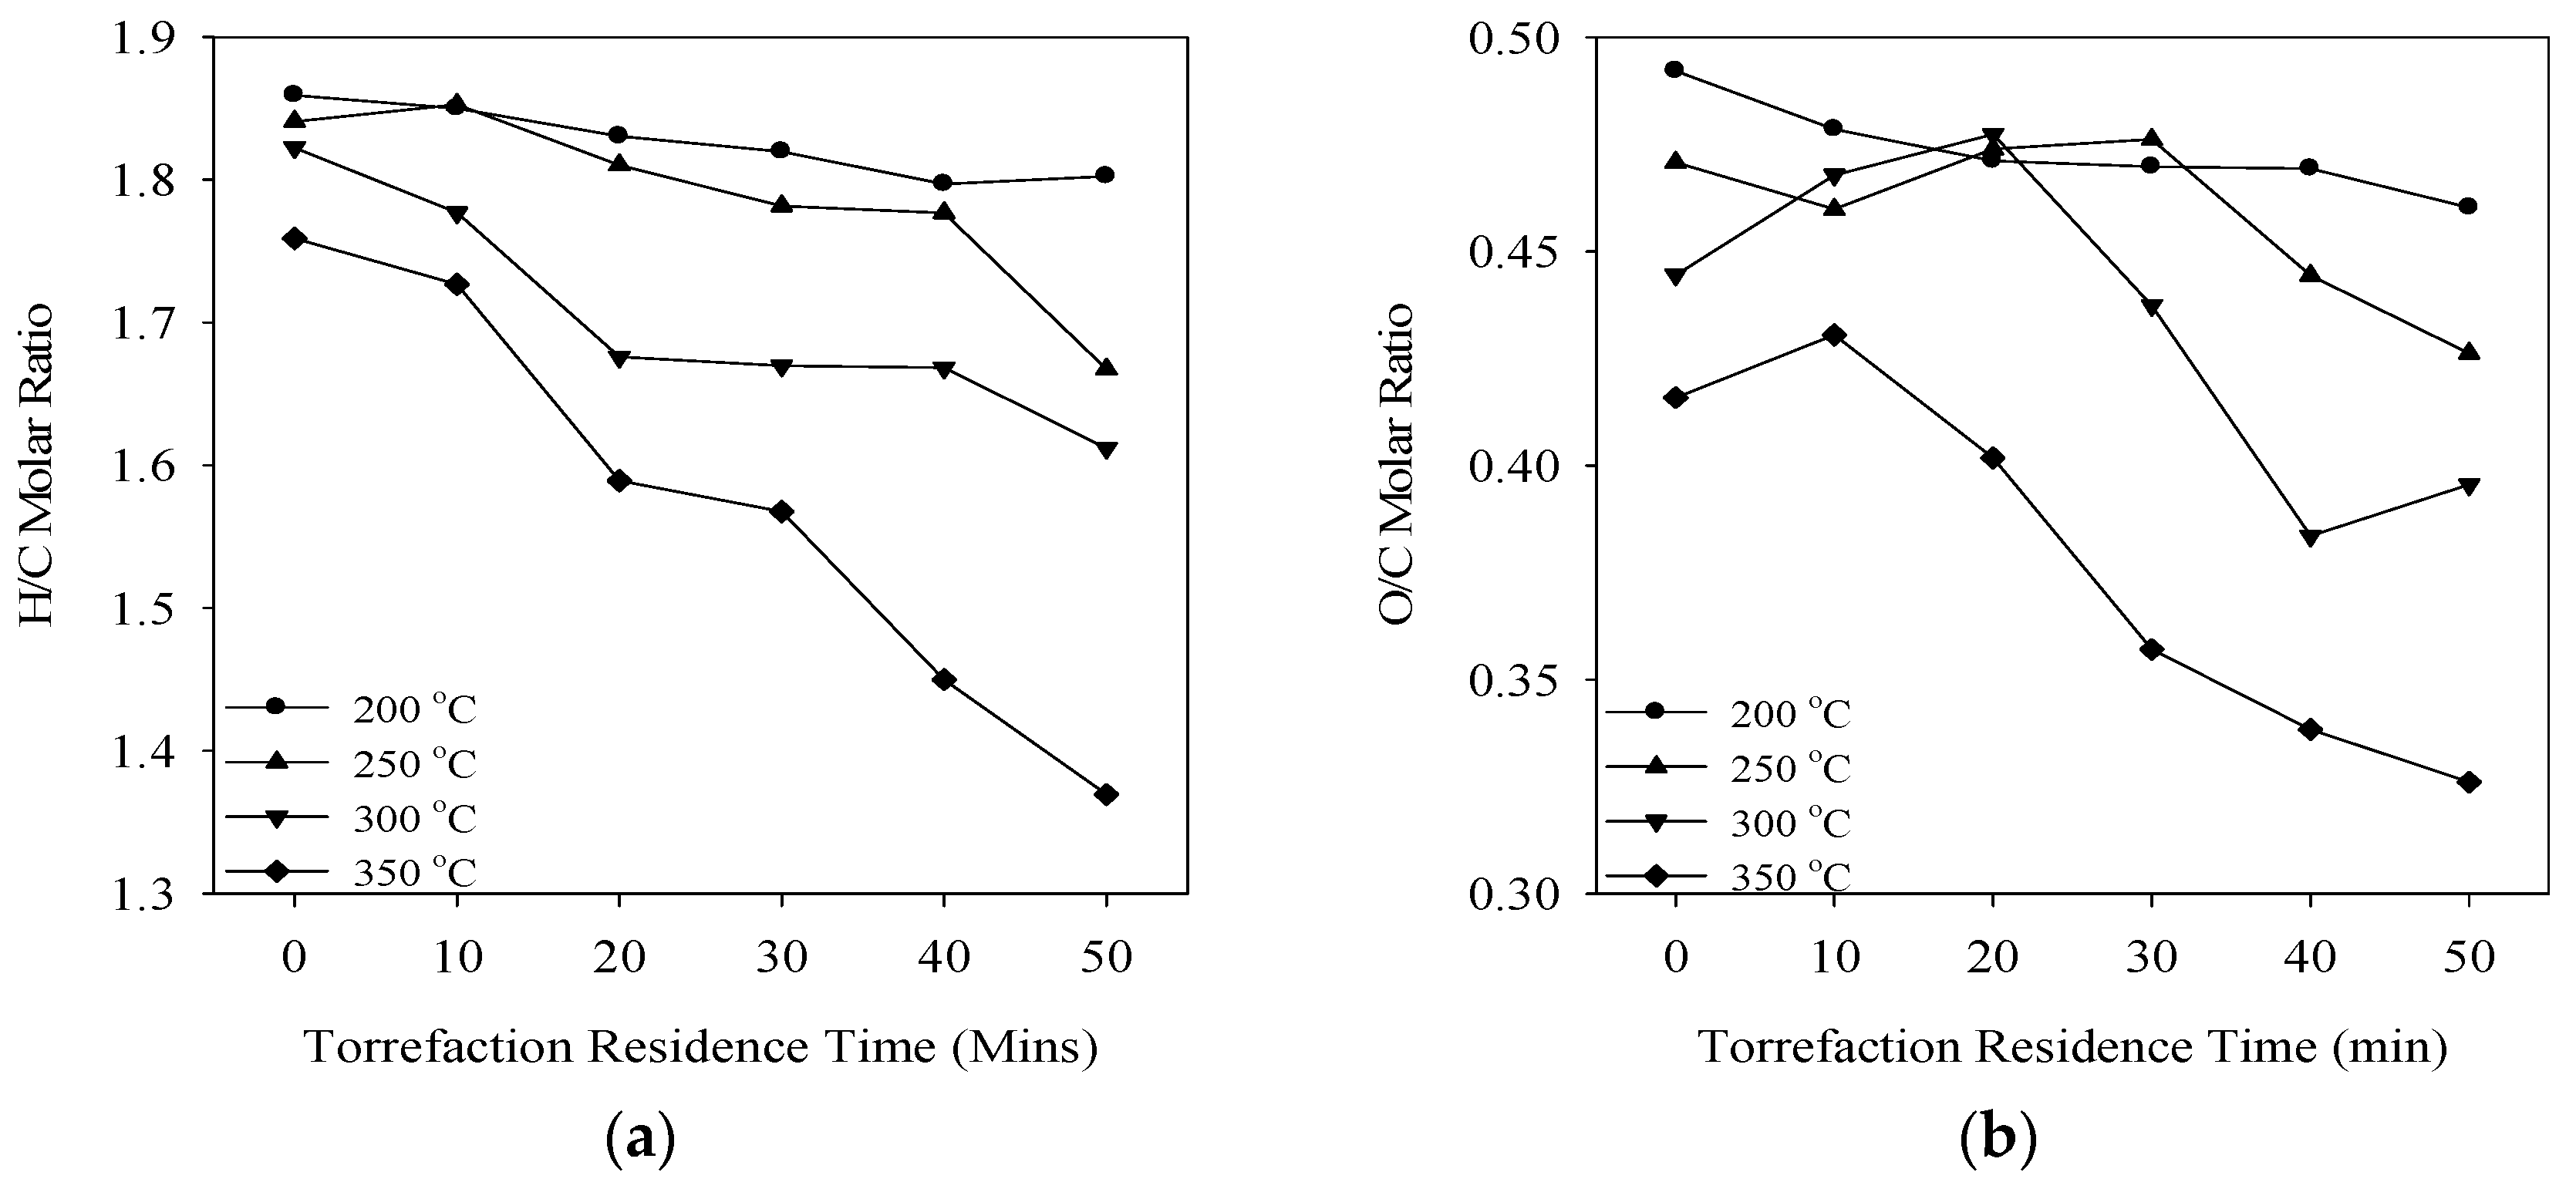
Figure 5.
Gas analysis from torrefaction of sewage sludge as a function of the temperature.

Figure 6.
Chemical exergy of sewage sludge as a function of torrefaction residence time.

Table 1.
Properties of raw sewage sludge.
| Elemental Analysis (wt. %) * | C | 37.82 |
| H | 5.82 | |
| N | 4.14 | |
| O | 25.12 | |
| S | 1.44 | |
| Others | 25.66 | |
| Proximate Analysis (wt. %) ** | Moisture (%) | 80.12 |
| Volatile Content (%) | 12.87 | |
| Ash (%) | 5.50 | |
| Fixed Carbon (%) | 1.51 | |
| HHV (MJ/Kg) * | 15.81 | |
* Dry Basis; ** Wet Basis.
Table 2.
Torrefaction Index in different Regimes.
| Torrefaction Regimes | Temperature (°C) | Torrefaction Index (TI) [40] | TI (Obtained in this Study) |
|---|---|---|---|
| Light | 200 to 235 | 0.93 to 0.95 | 0.89–0.96 |
| Medium | 235 to 275 | 0.95 to 0.97 | 0.94–0.99 |
| Severe | 275 to 300 | 0.97 to 1.0 | 0.96–1.0 |
| - | 350 | - | 0.94–0.92 |
© 2017 by the authors. Licensee MDPI, Basel, Switzerland. This article is an open access article distributed under the terms and conditions of the Creative Commons Attribution (CC BY) license (http://creativecommons.org/licenses/by/4.0/).
Share and Cite
MDPI and ACS Style
Karki, S.; Poudel, J.; Oh, S.C. Utilizing Downdraft Fixed Bed Reactor for Thermal Upgrading of Sewage Sludge as Fuel by Torrefaction. Appl. Sci. 2017, 7, 1189. https://doi.org/10.3390/app7111189
AMA Style
Karki S, Poudel J, Oh SC. Utilizing Downdraft Fixed Bed Reactor for Thermal Upgrading of Sewage Sludge as Fuel by Torrefaction. Applied Sciences. 2017; 7(11):1189. https://doi.org/10.3390/app7111189
Chicago/Turabian StyleKarki, Sujeeta, Jeeban Poudel, and Sea Cheon Oh. 2017. "Utilizing Downdraft Fixed Bed Reactor for Thermal Upgrading of Sewage Sludge as Fuel by Torrefaction" Applied Sciences 7, no. 11: 1189. https://doi.org/10.3390/app7111189
Note that from the first issue of 2016, this journal uses article numbers instead of page numbers. See further details here.