Article

LPaMI: A Graph-Based Lifestyle Pattern Mining Application Using Personal Image Collections in Smartphones

Data and Knowledge Engineering Lab, Department of Computer Science and Engineering, Kyung Hee University, Suwon 446-701, Korea
*
Author to whom correspondence should be addressed.
Appl. Sci. 2017, 7(12), 1200; https://doi.org/10.3390/app7121200
Submission received: 10 October 2017 / Revised: 25 November 2017 / Accepted: 17 November 2017 / Published: 27 November 2017

Abstract

:
Normally, individuals use smartphones for a variety of purposes like photography, schedule planning, playing games, and so on, apart from benefiting from the core tasks of call-making and short messaging. These services are sources of personal data generation. Therefore, any application that utilises personal data of a user from his/her smartphone is truly a great witness of his/her interests and this information can be used for various personalised services. In this paper, we present Lifestyle Pattern MIning (LPaMI), which is a personalised application for mining the lifestyle patterns of a smartphone user. LPaMI uses the personal photograph collections of a user, which reflect the day-to-day photos taken by a smartphone, to recognise scenes (called objects of interest in our work). These are then mined to discover lifestyle patterns. The uniqueness of LPaMI lies in our graph-based approach to mining the patterns of interest. Modelling of data in the form of graphs is effective in preserving the lifestyle behaviour maintained over the passage of time. Graph-modelled lifestyle data enables us to apply variety of graph mining techniques for pattern discovery. To demonstrate the effectiveness of our proposal, we have developed a prototype system for LPaMI to implement its end-to-end pipeline. We have also conducted an extensive evaluation for various phases of LPaMI using different real-world datasets. We understand that the output of LPaMI can be utilised for variety of pattern discovery application areas like trip and food recommendations, shopping, and so on.

1. Introduction

Smartphone usage is common for a variety of auxiliary services like photography, game playing, schedule planning, and so on. Utilisation of these services generates large amounts of data with respect to personal use for individuals. This data contains the use patterns of various applications [1,2,3,4,5] and also helps to understand personality traits [6]. For instance, Vijay et al. [5] mined frequent co-occurrence patterns in smartphone application usage. Similarly, Frey et al. [2] proposed detection of life events based on a smartphone user’s app installation behaviour. Do et al. [3] also proposed analysis of the usage of smartphone applications. Therefore, we find that utilizing the data from smartphone usage can help facilitate learning of the lifestyle patterns/behaviour of a user.
Among various types of accumulated data in a smartphone, photographs taken by smartphone cameras are also of vital importance. Photograph collections in smartphones truly demonstrate the interests and likes of a user. A person normally takes photographs of all those things and places which are of interest to him/her. For instance, a tourist may have a large collection of photos of various places, or a person interested in shopping may take photographs of various shopping malls and shopping items, and so on. Therefore, the photo collection in the smartphone can help give information on the lifestyle patterns of a user. The utilisation of a smartphone camera to monitor daily eating patterns of a user [7], and use of a wearable camera to automatically record images for healthcare [8], are some recent studies in this line of work. It has also been observed that images from online resources, like Flicker, have been used for various purposes like predicting home and vacation locations and for trip recommendations [9,10,11]. Interested readers can refer to [12] to obtain a detailed survey on the utilisation of image data from Flicker in various research applications. In contrast, our aim is to focus on personal photograph collections for behaviour analysis rather than relying on external resources.
In this paper, we present Lifestyle Pattern MIning (LPaMI), which was introduced and demonstrated at the World IT Show organised in COEX Mall, Seoul, South Korea from 24 to 27 May 2017 as part of G-ITRC project from Kyung Hee University, South Korea. It is a lifestyle pattern mining application to mine intrinsic patterns existing in user smartphone photo collections. We define the lifestyle pattern of a user as a frequent group of actions performed in different intervals of time. For example, a group of frequent actions for a person of a tourist nature can be visiting a park, followed by a trip to lake, then to mountains etc., over the weekends in a month. We understand that such lifestyle pattern information with respect to the user can be utilised in various types of personalised recommendation services. Hence, LPaMI can be used to extract the naturally occurring lifestyle patterns followed by a user. The novelty of our proposal lies in the proposal of an end-to-end solution for lifestyle behaviour learning that involves extracting objects of interest (OOIs) from photos, modelling OOIs in a graph format, and graph-based pattern mining. OOIs refer to scenes in photographs related to given application area. For example, areas of application can include tourism, shopping, and eating, while their relevant objects can be outing spots, gift items, and food items, respectively. To model the data in the form of graphs, each extracted OOI is declared as a node and an edge indicates a connection between them, for example, two places visited in a sequence. We then apply various graph mining techniques to discover numerous patterns of a user for lifestyle analysis. The key instinct of LPaMI is that its output i.e., a list of lifestyle patterns, can enhance the functionality of any state-of-the-art recommendation application. For instance, various trip advisor applications contain sufficient information for different type of venues for any given city of the world. Some of them are customizable to provide only relevant types of recommendations like suggesting specific types of restaurants in a city to person who loves eating different types of food. However, the customisation capability of these applications is limited i.e., the user must specify his/her likes and dislikes, personal information, and interests. In this way, they are restricted to making recommendations based on a user’s supplied information and do not use his/her patterns followed over the passage of time. We understand that consideration of the lifestyle patterns provides a better overview of the personality traits of the user, which can be used for better recommendations. We show the step-by-step functionalities of LPaMI in Figure 1 as a bird’s-eye view to clearly show our concept. We summarise the contributions of our paper as below:
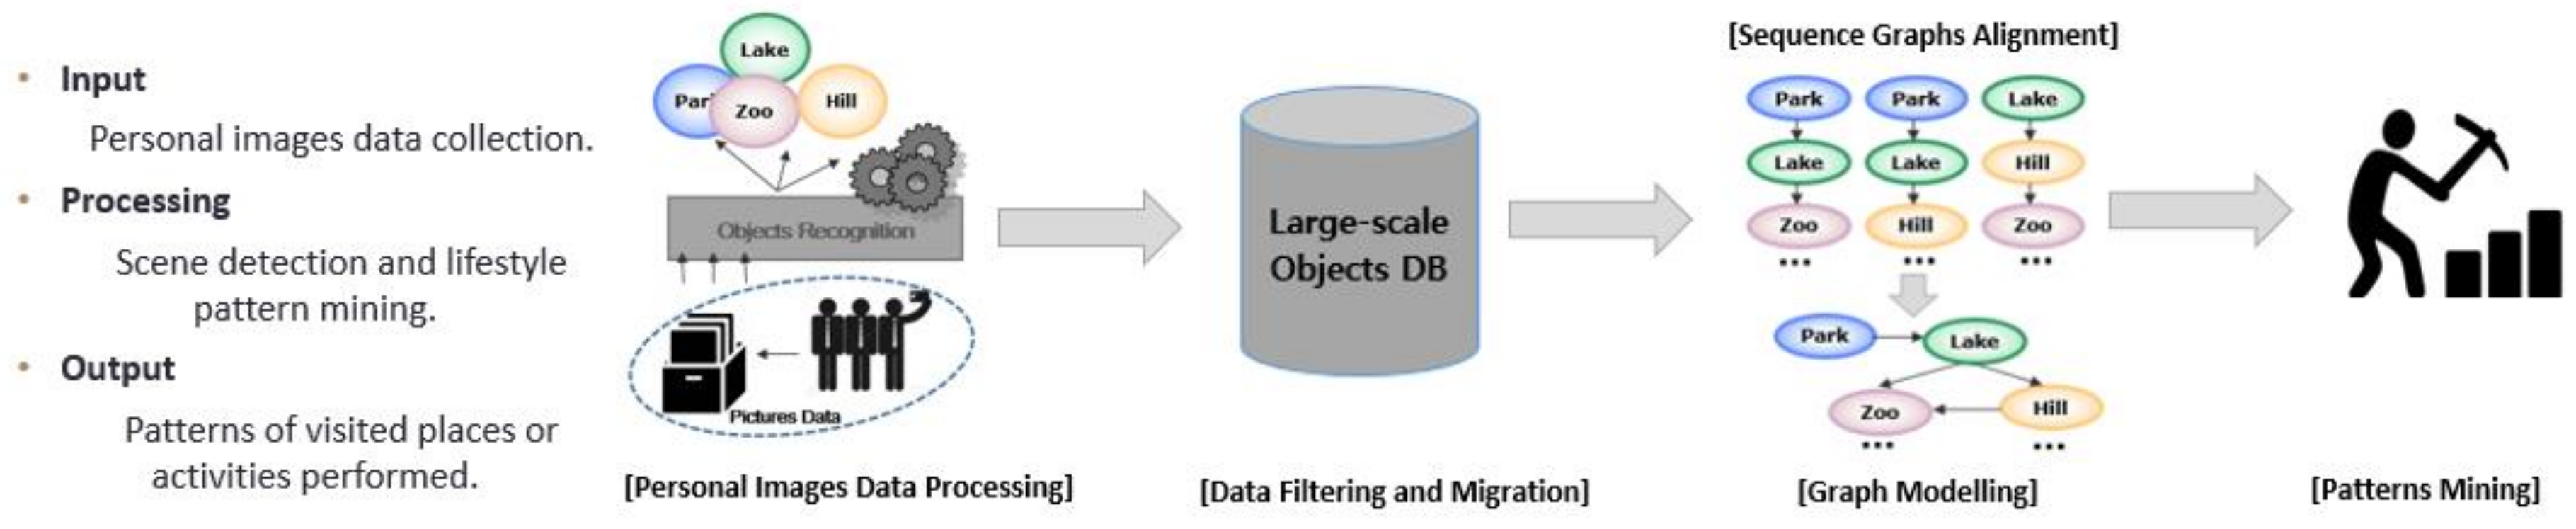
  • We propose mining the lifestyle patterns of a user through his/her personal photo collection in a smartphone. In this way, our goal is to avoid dependency on external resources like GPS and online connectivity. Rather, we want to make maximum use of the local and free resources available. Nonetheless, the support of any external resource can be embedded to further enhance the lifestyle pattern mining capabilities.
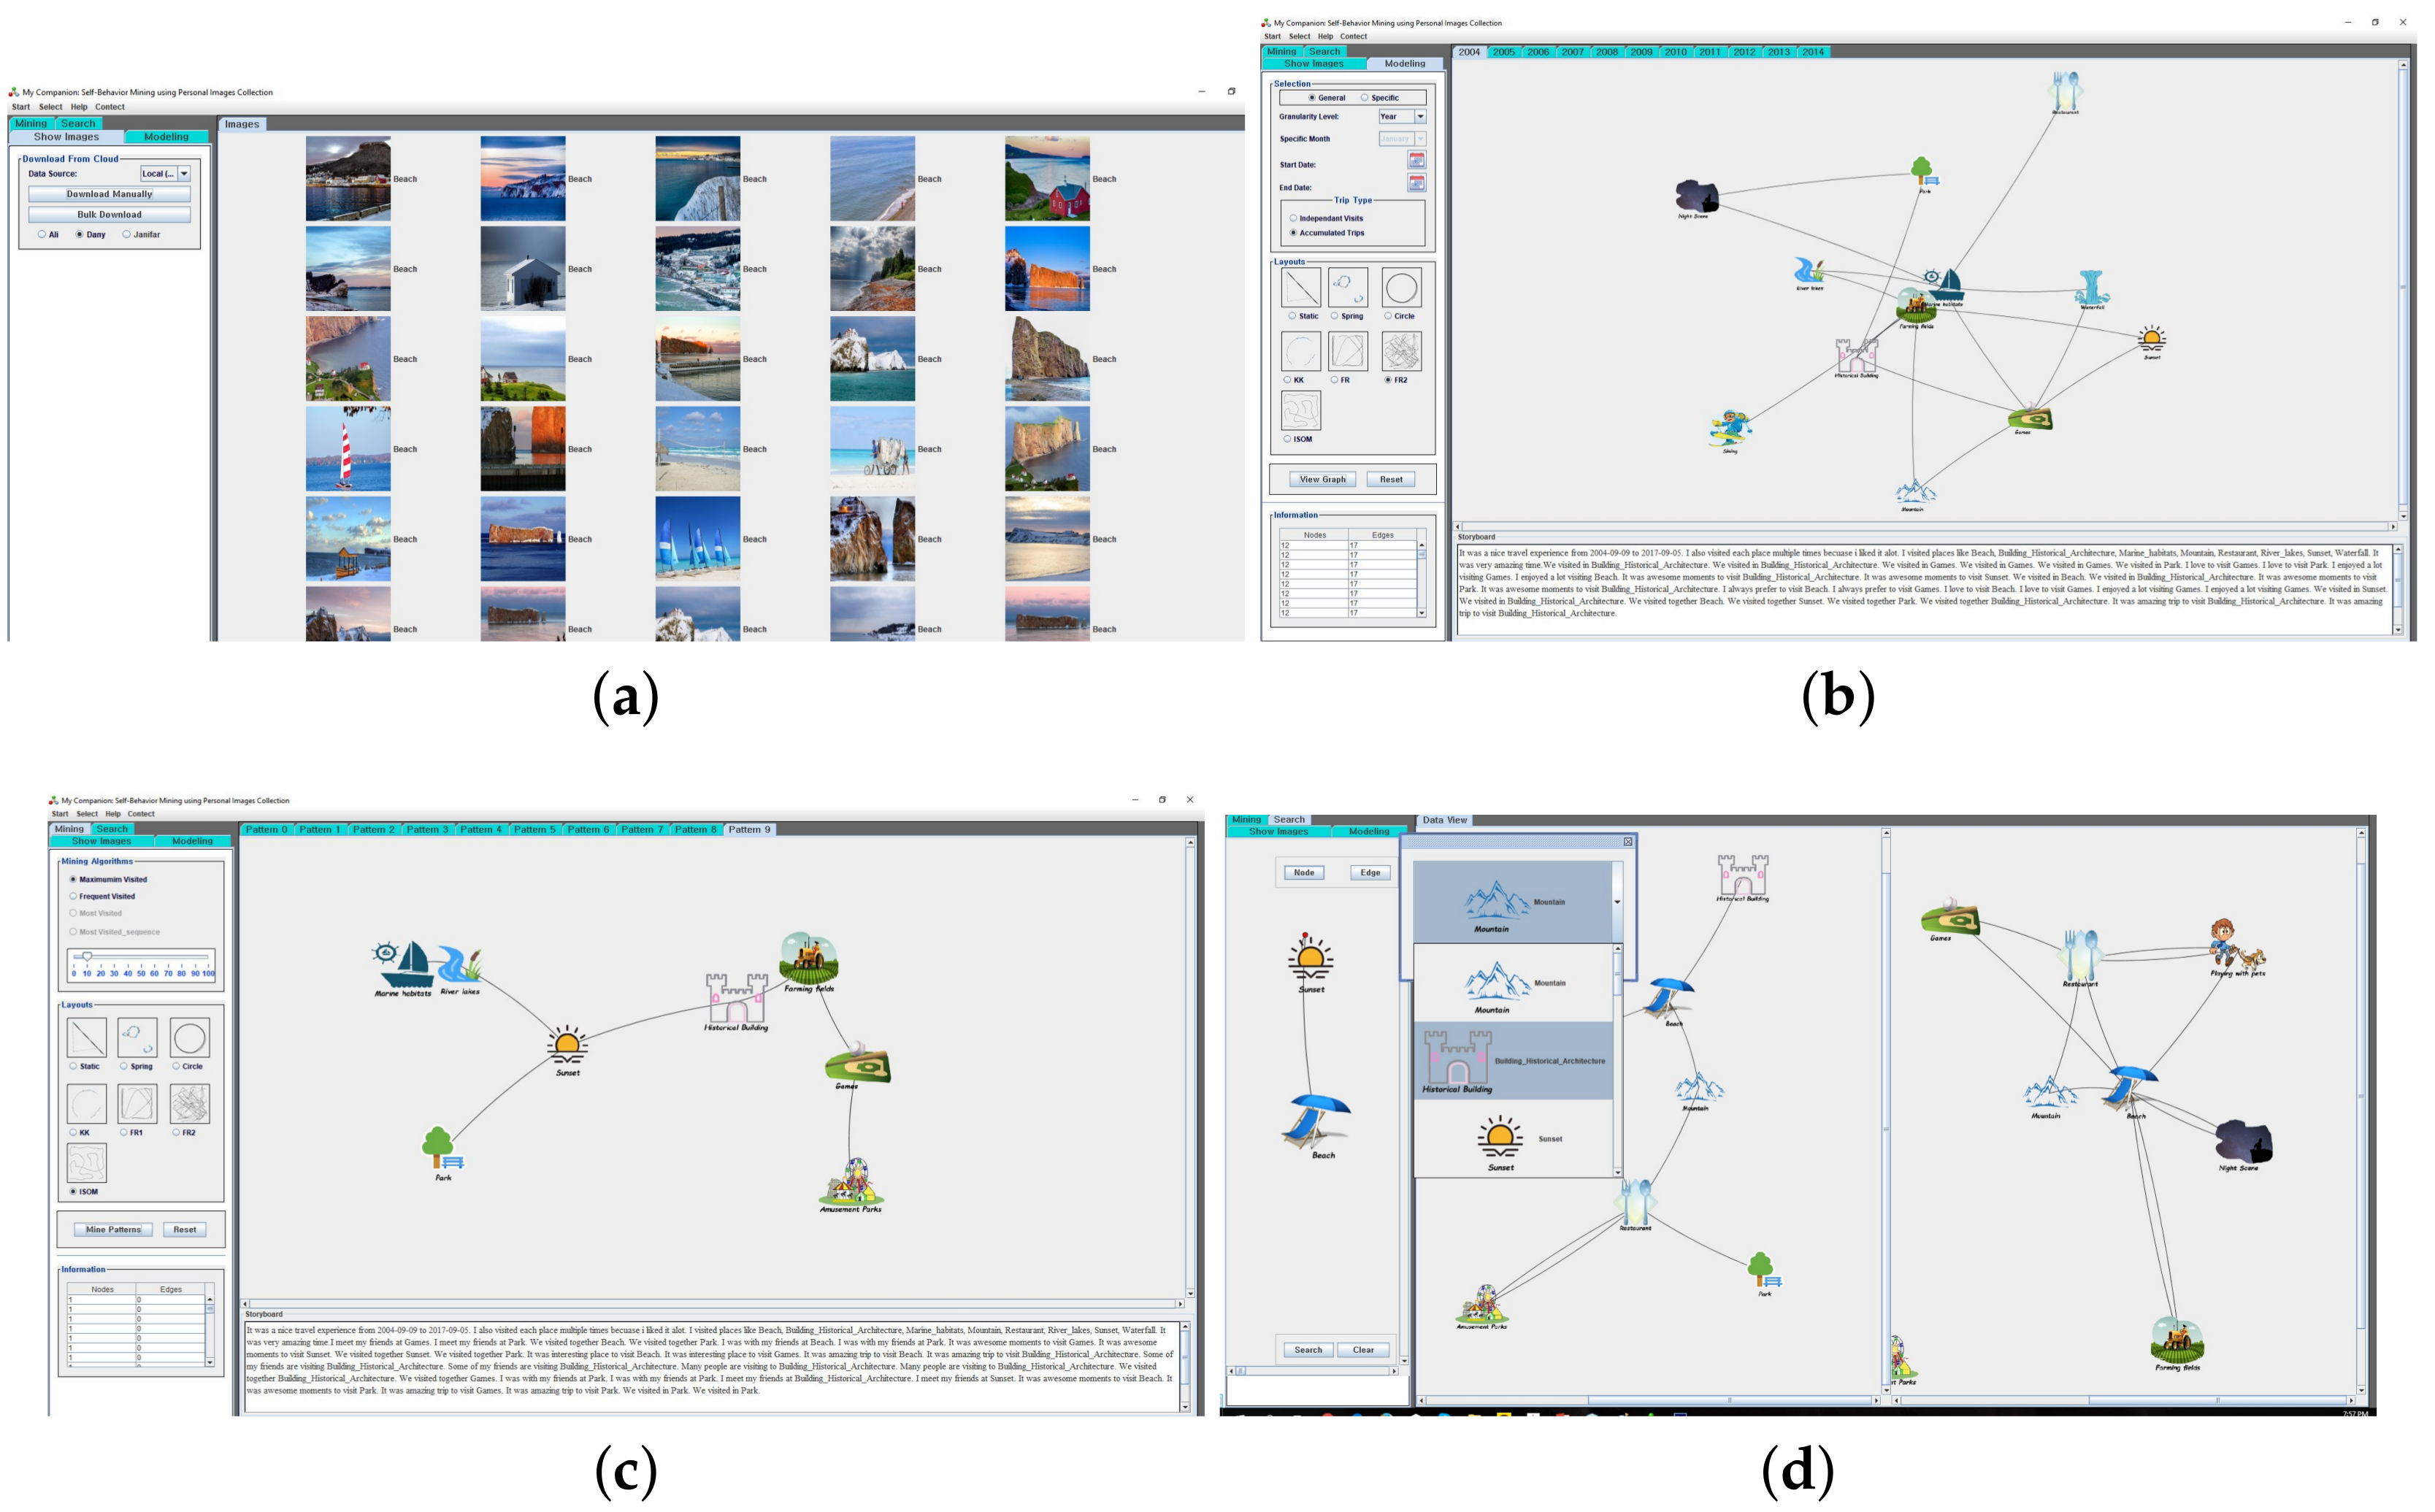
  • To mine the lifestyle patterns through the photo collections found on user smartphones, we present a prototype application, LPaMI, that recognises the OOIs via state-of-the-art scene recognition techniques. We then model the OOIs in the form of a graph(s) and apply various graph pattern mining techniques to learn the patterns.
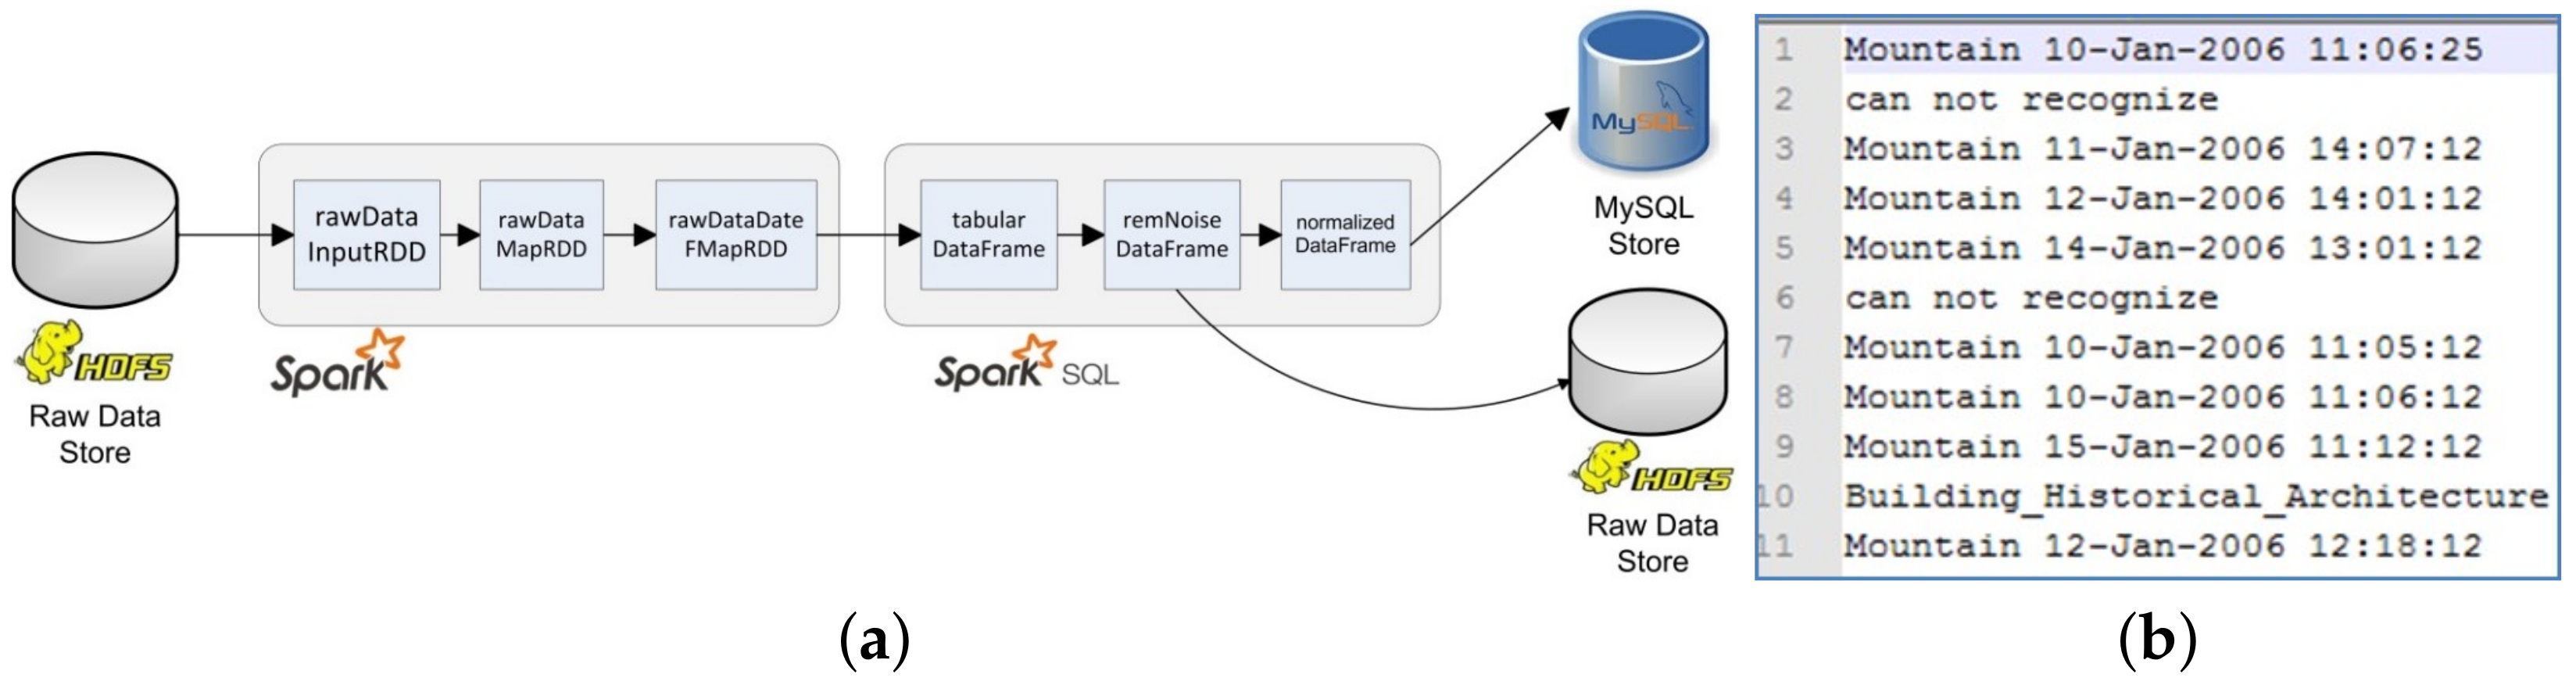
  • We have designed and implemented a prototype application for LPaMI to demonstrate its functionality and effectiveness. For each phase, like scene/OOI recognition, data migration, graph modelling, and graph pattern mining, we have implemented various state-of-the-art algorithms to present a robust and effective solution. Our implementation of data migration is in Spark environment to make the solution scalable in the case of big data with respect to personal images and to make it useable if the data source is changed from the mobile image collection to any other data repository.
  • We also present an extensive evaluation of various phases using real-world datasets to prove the effectiveness of our proposal.

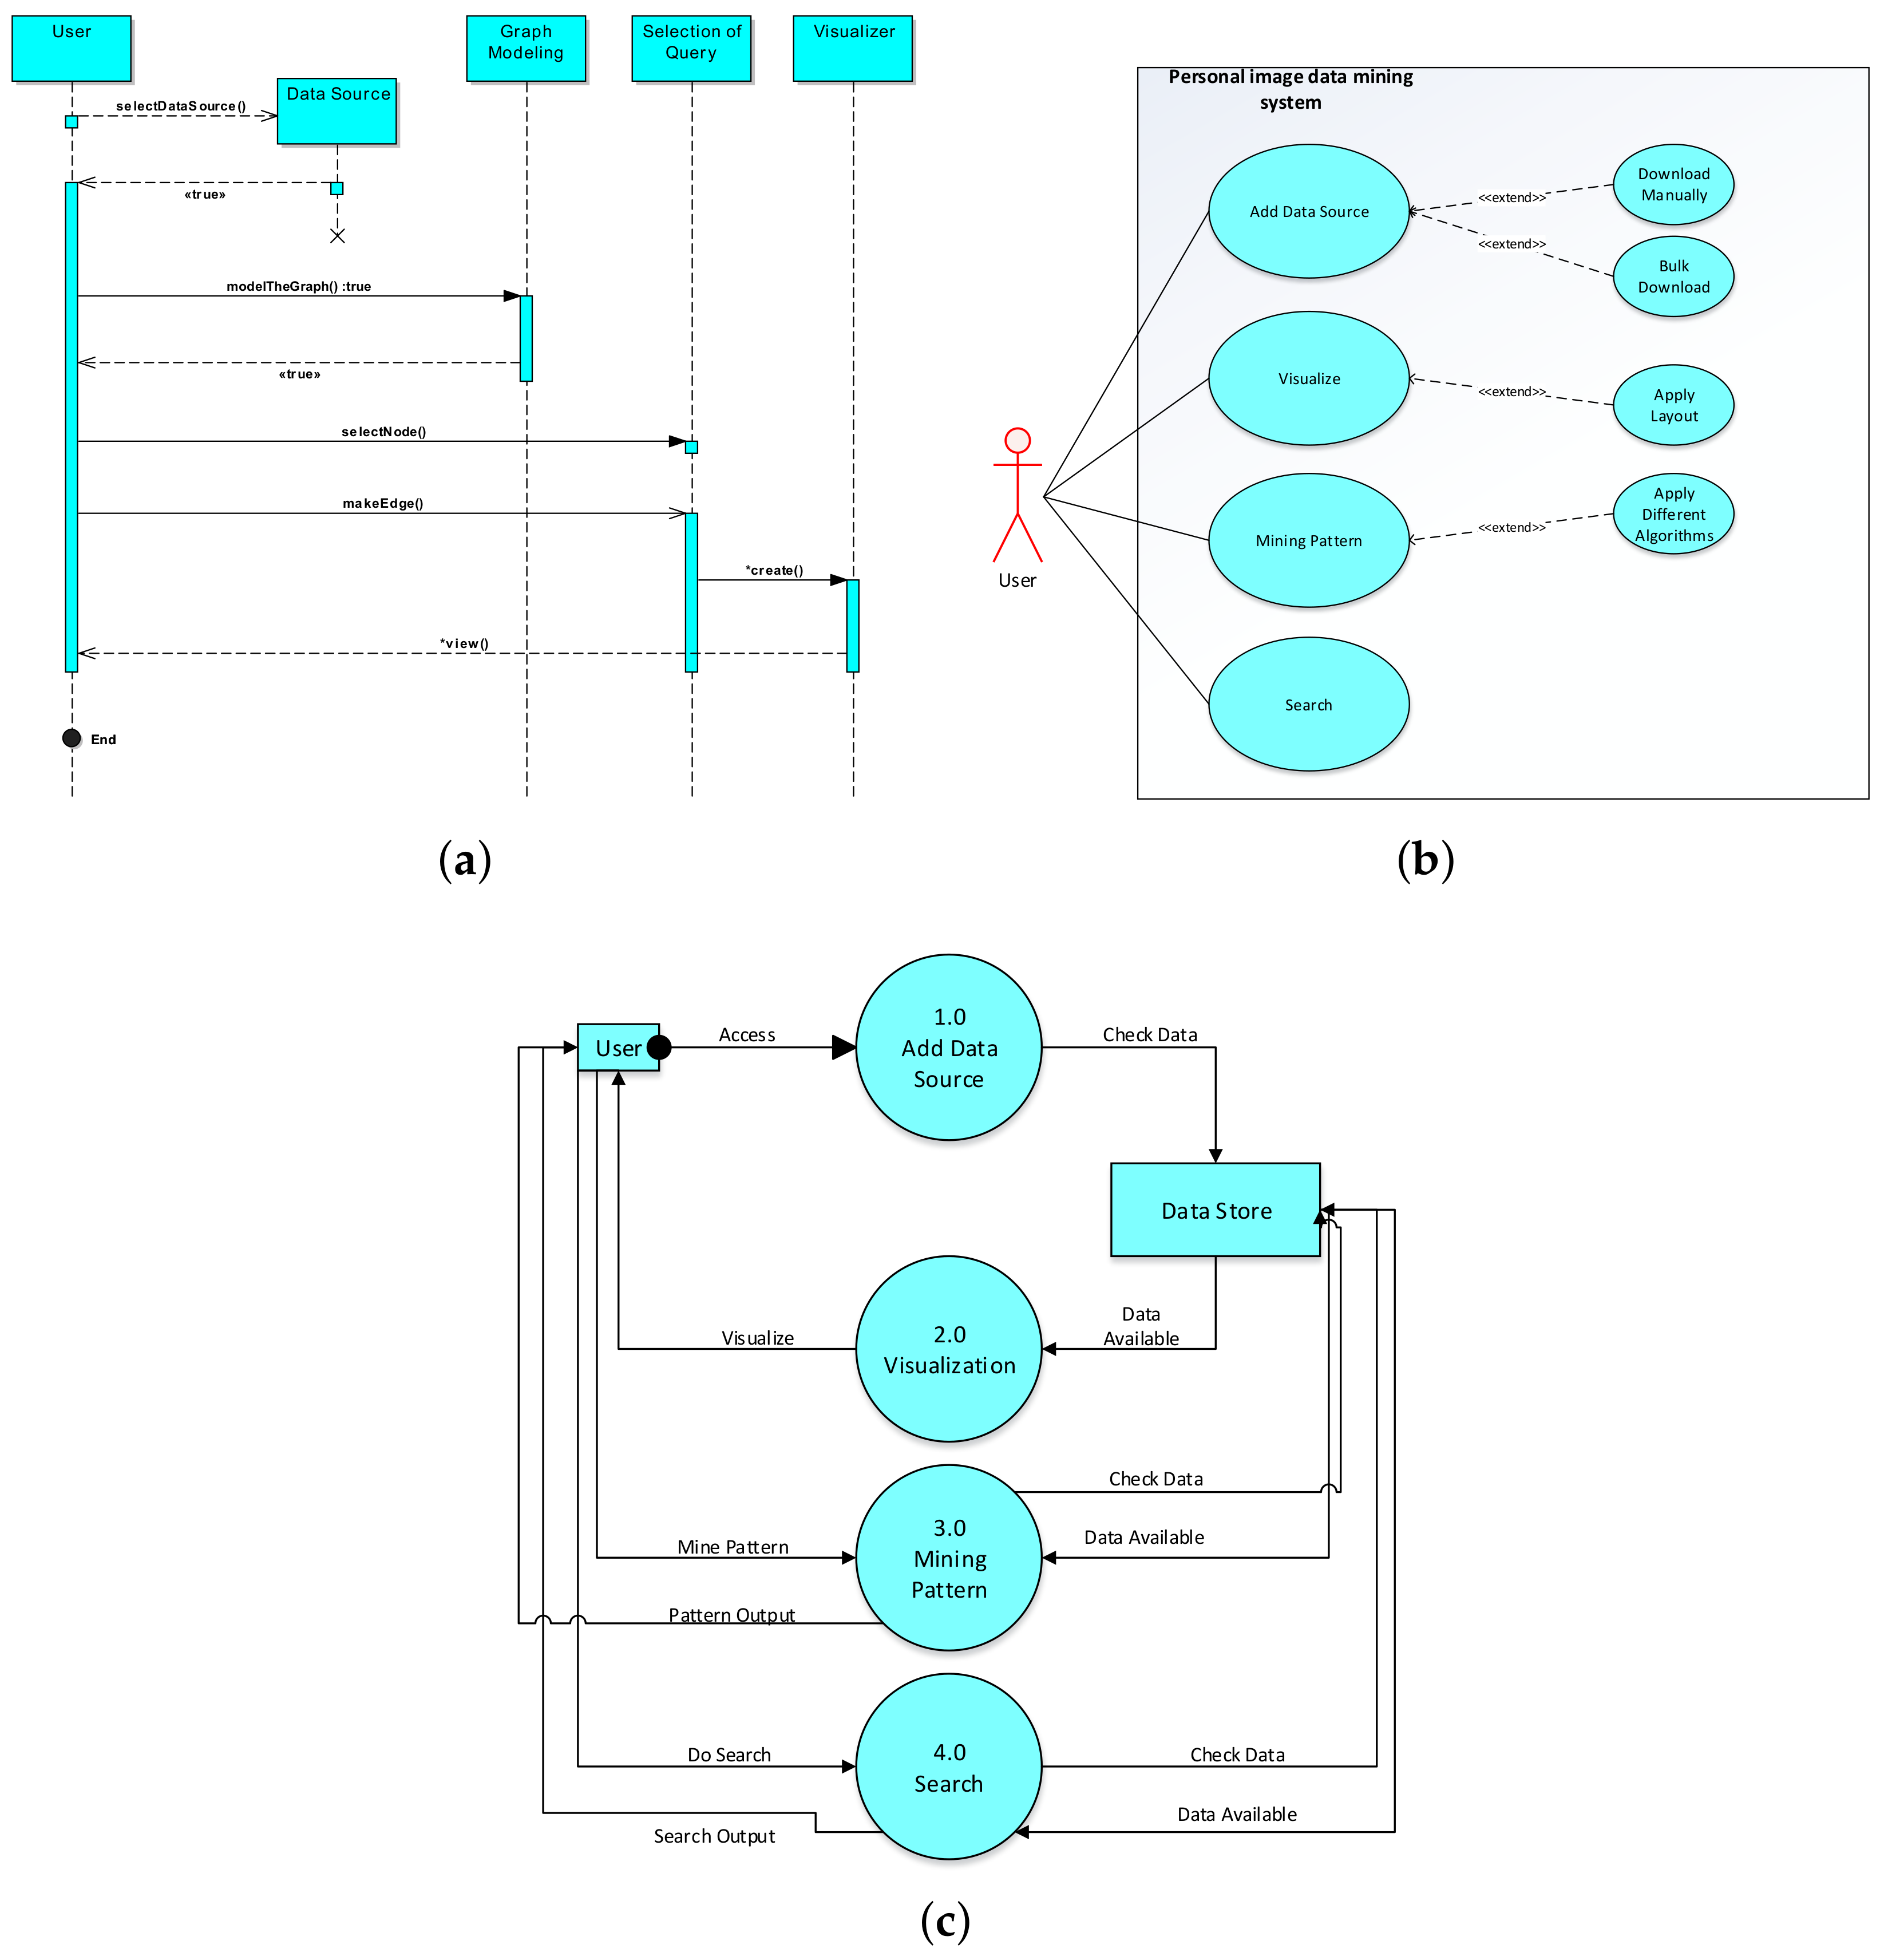
2. Overview of LPaMI

In this section, we present a quick overview of our application, LPaMI, along with its pipeline algorithm. We also present some formal modelling practices like a sequence diagram, use case diagram, and data flow diagram along with a demo/illustration of LPaMI to interact with them. The aim is to explain the internals of LPaMI to create ease of effective utilisation.

2.1. Features of LPaMI

LPaMI allows a user to either consider selected photographs from his/her collection or download in bulk from cloud storage. The retrieved photographs to be processed further can be seen in the “Show Images” screen, as shown in Figure 2a. As soon as the photographs are selected, the back-end process of OOI recognition starts. The retrieved data on OOIs is written to the disk, and the data migration routines start processing to clean, filter, and then load the data in the persistent storage. We then perform graph modelling based on different configuration settings like granularity level, the set of photographs to consider for mining in certain period of time, modelling as either a single large graph or as a set of graphs, visualisation layout, and basic quantitative information of the graphs. Finally, the data of OOIs takes up the shape of a graph and is visualised for analysis, as shown in Figure 2b.
As soon as the OOIs are modelled as a graph, pattern mining can be applied. We show the screen for this purpose in Figure 2c. It allows a user to select the type of patterns to be mined. The user is provided a control using a slider to set a minimum support threshold for pattern mining. Resultantly, all the patterns satisfying the input threshold criteria are displayed. LPaMI also provides a “Search” screen to the user as shown in Figure 2d. Here, a user can select some nodes of interest using a dialogue box and can create a query graph. The query graph is then used to mine patterns containing or similar to the input pattern with the aim of analysing the behaviour in a customised manner. In this way, LPaMI provides an interactive procedure to understand the details of the data.
LPaMI also describes the data using a storyboard, shown at the bottom of the Figure 2b,c. The storyboard explains the data in a textual format and presents the details of data and of mined patterns too. Our idea is to make LPaMI a user-friendly product, so this feature is a great facilitation option. To explain OOIs in terms of a graph, the storyboard reads data from persistent storage along with its metadata to explain the situation. On the other hand, it explains each pattern obtained as a result of applying pattern mining. To build a story, we have a database of different statements, and each is randomly picked and concatenated with the name of every OOI along with the metadata information of the concerned graph. Finally, the statements built using metadata and other statements, describing OOIs, are combined to shape a story. We understand that such procedure of generating the storyboard may be a naïve approach, however, we plan to make it richer in semantics in next release of LPaMI.

2.2. Formal Modelling Practices for LPaMI

We present some formal modelling practices, like sequence diagrams, use-case diagrams, and data flow diagrams to explain interactions with LPaMI. A sequence diagram represents the scenario or flow of events in one single use case, so first we need to define a use case. Let a user aim to visualise search output. The list of steps is as follows. Firstly, the user gets access to the system. Secondly, the user selects the photographs. Thirdly, the data is modelled as a graph. Finally, some query nodes are selected and edges are created between them. We illustrate the sequence diagram for the aforementioned objective in Figure 3a. Figure 3b shows the use case diagram which demonstrates the step-by-step process for the said task. Finally, Figure 3c displays the data flow diagram (DFD) which also demonstrates the above-listed tasks.
Finally, we present a high-level pseudocode (Algorithm 1) that states the step-by-step outline of LPaMI, consisting of four main components.

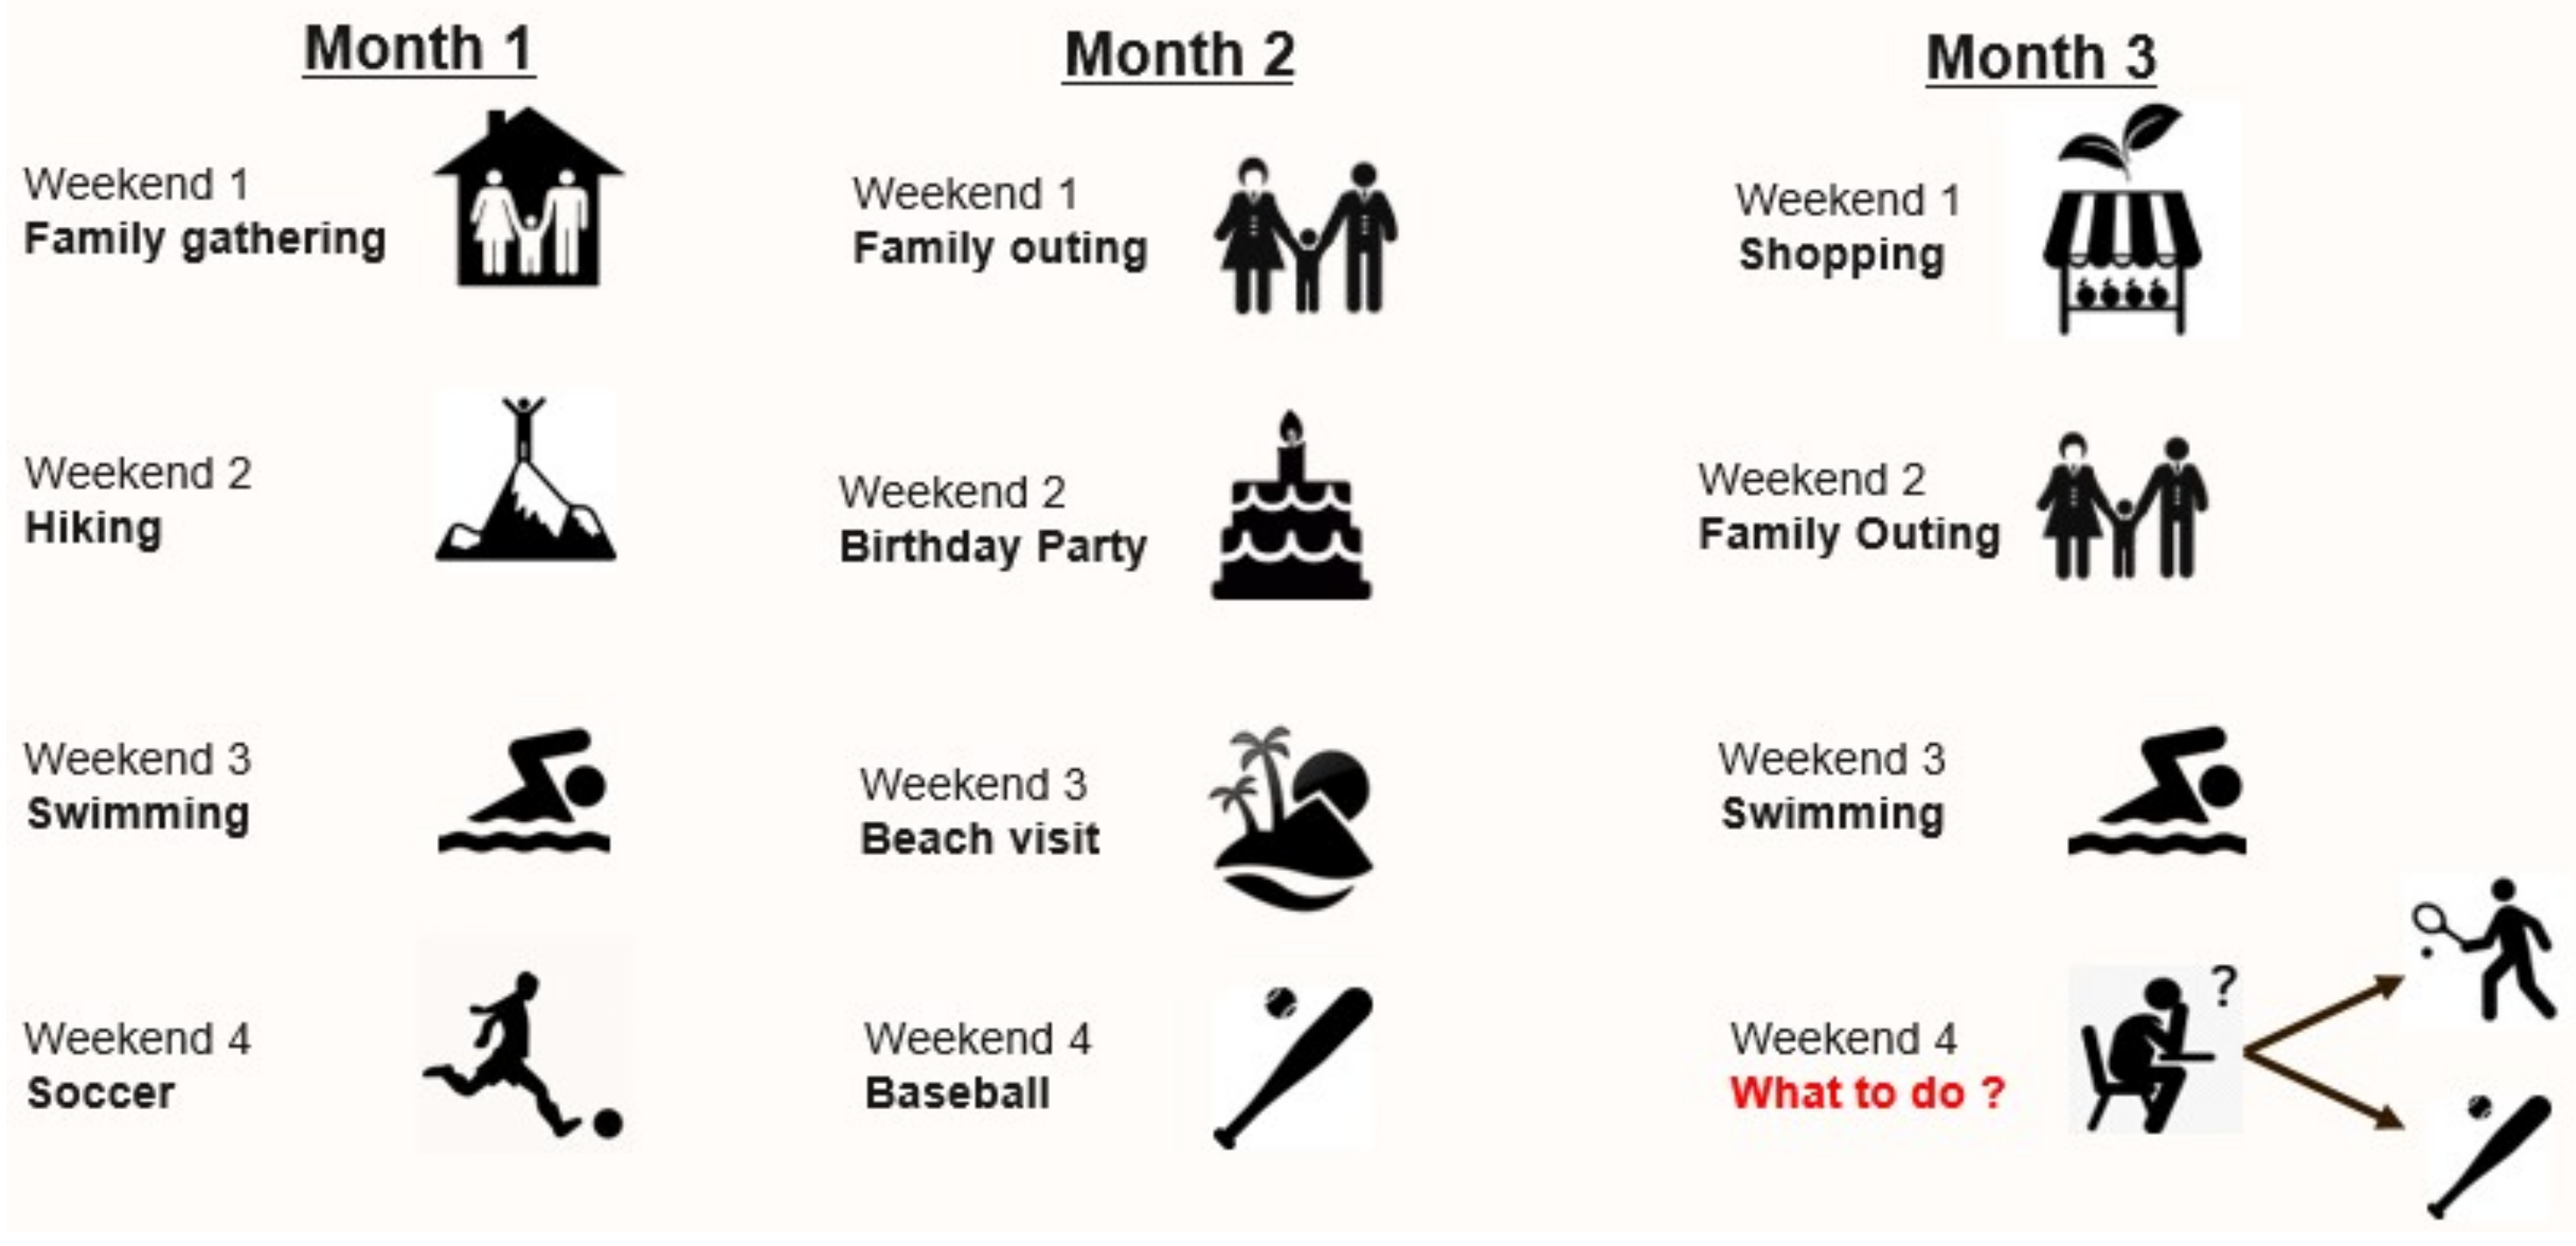
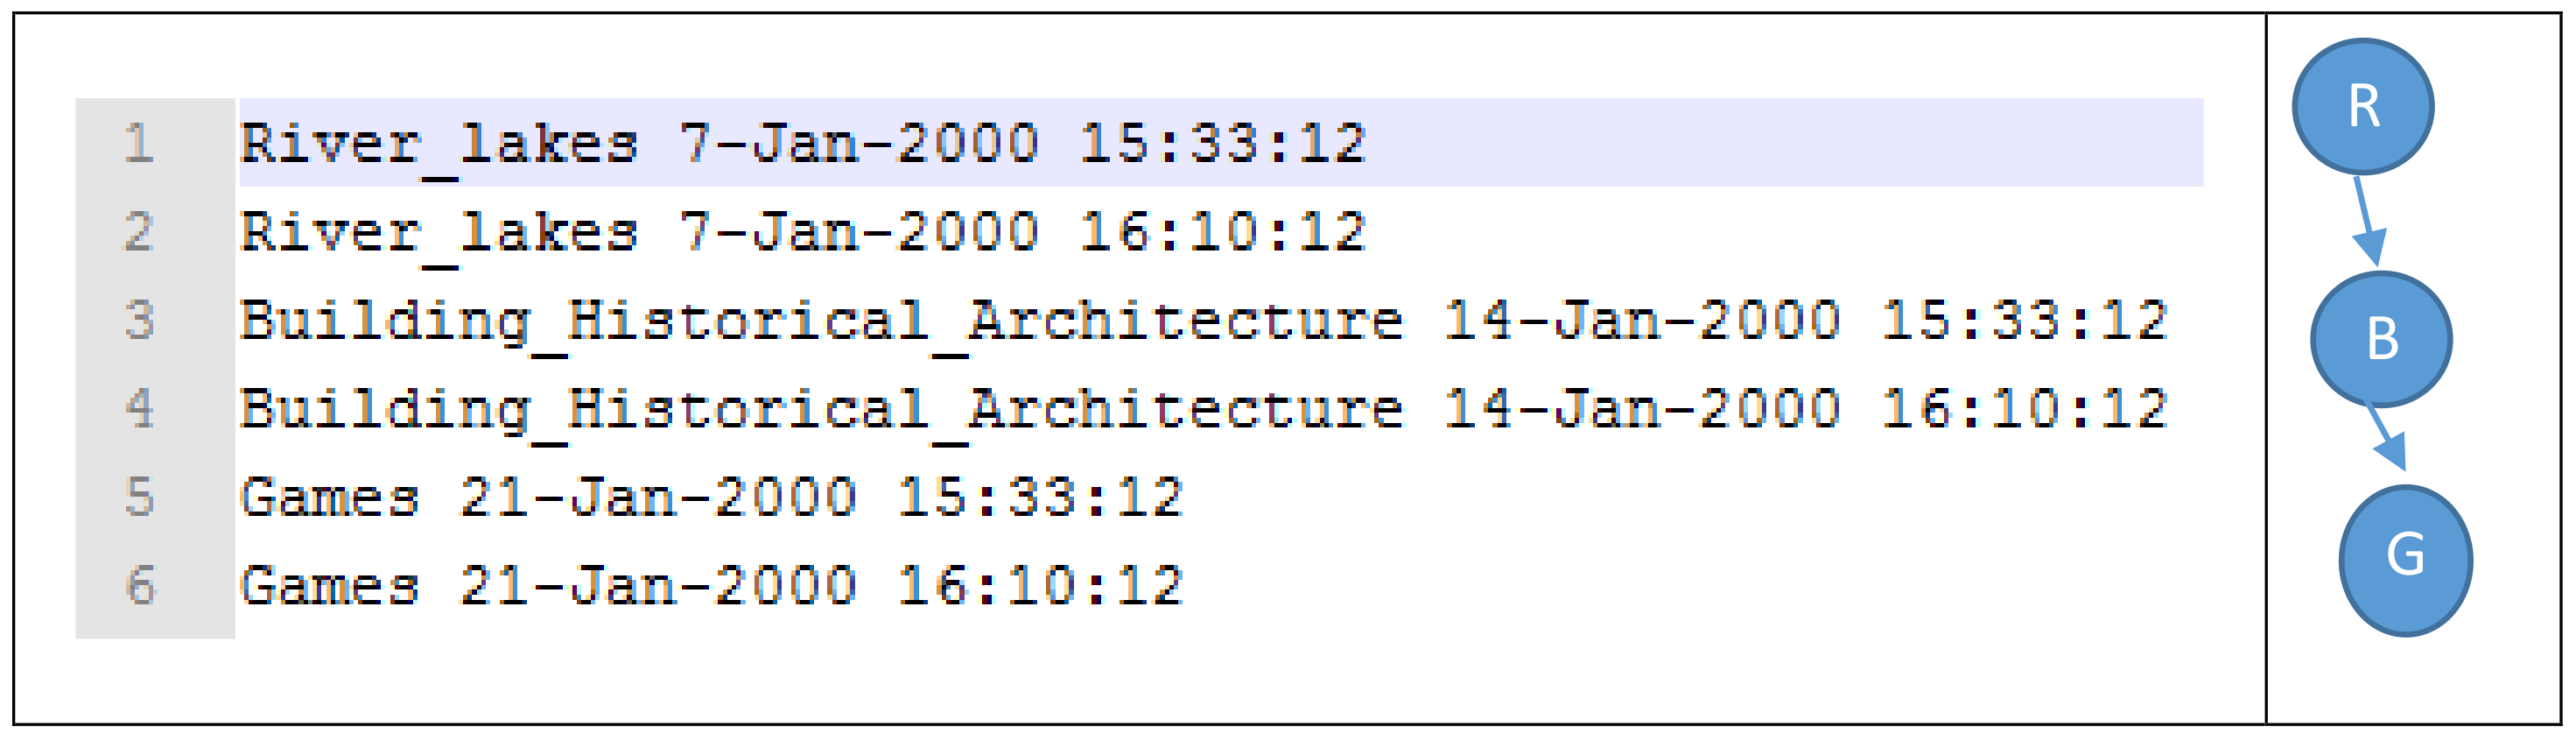
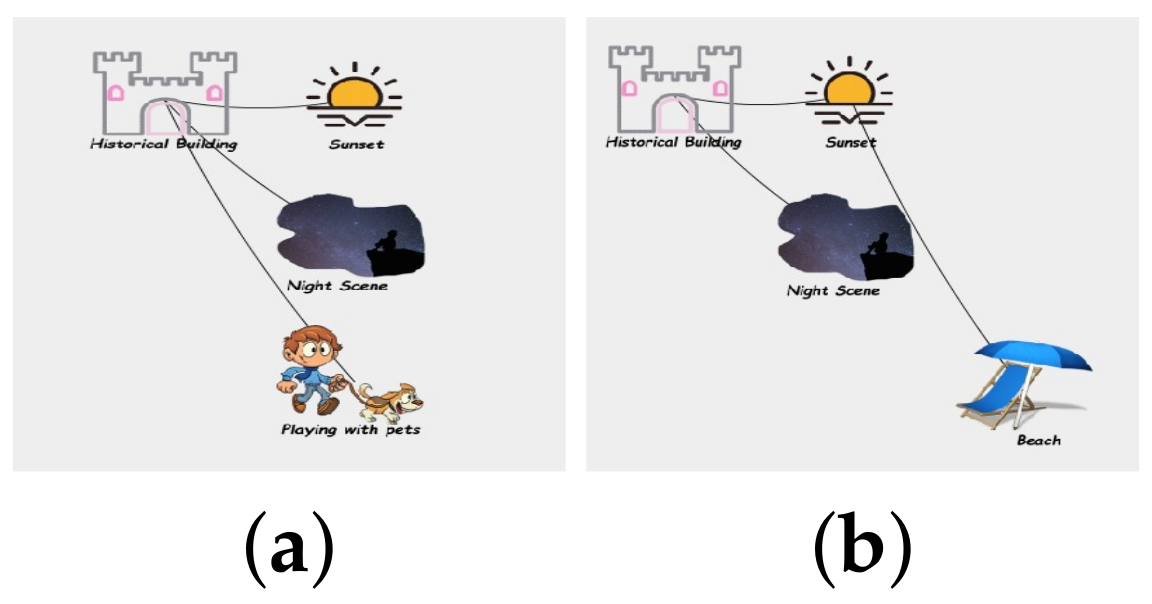
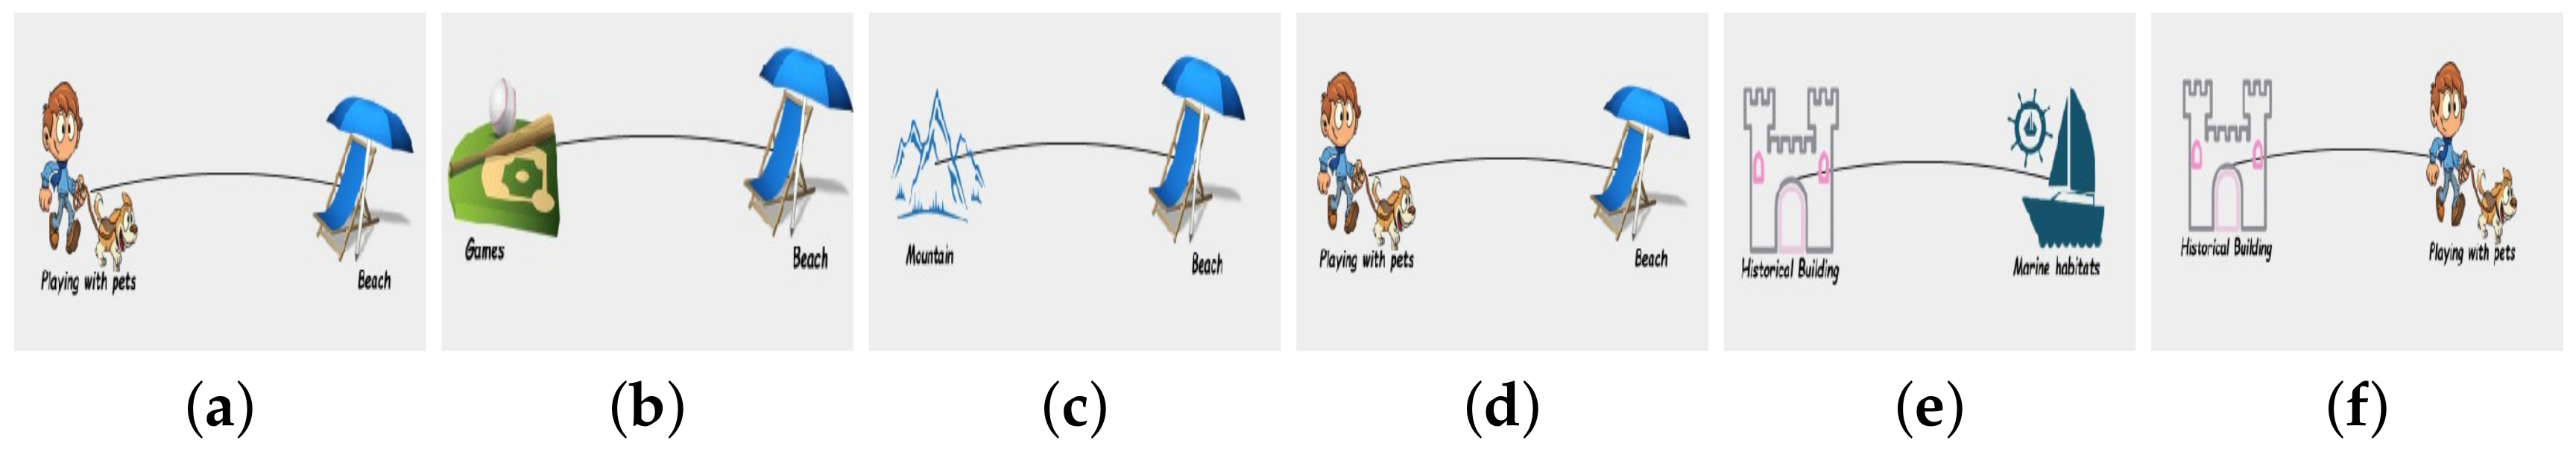
2.3. Example Illustration

Consider Figure 4 that shows different activities performed by a person for each weekend of last three months i.e., a set of photos provided as input. We find that the person is busy with the family-related activities in the first and second weekends of every month, whereas he/she goes for swimming every third weekend, followed by an outdoor sport at the next weekend. This is a natural lifestyle pattern of interest for the given user, which can be utilised in various personalised recommendation applications. For example, a personalised recommendation service can use this pattern to suggest her playing either tennis or baseball in the last weekend of month 3. This example clearly illustrates the objective of LPaMI, in that how it finds the lifestyle patterns from the photo collection.
Algorithm 1 Pipleline Algorithm for LPaMI
Require: Image collection C of given application area obtained from the smartphone of a user U
Ensure: Patterns of interest mined for U
 /* Object Recognition Phase */
 1: Extract Objects of Interest from C into text files on disk
 /* Data Migration Phase */
 2: Load the data into staging area in the database
 3: Filter and clean the noise created during processing of the images
 4: Migrate the filtered data into the normalised data model
 /* Data Transformation into Graph Format Phase */
 5: Generate sequence graphs based on given time window
 6: Model a graph database or one large graph from the sequence graphs
 /* Pattern Mining Phase */
 7: Mine user-defined type of patterns of actions performed by U

3. Component-Wise Details of LPaMI

We present details of each component of LPaMI in this section. For each of the phases, we utilise state-of-the-art algorithms and procedures to design an effective product. We accept the fact that our intention is not to propose any new solution/algorithm for any specific phase of LPaMI. However, we aim to design a robust and scalable architecture for LPaMI using already proven solutions so that the output of LPaMI is really effective and meaningful.

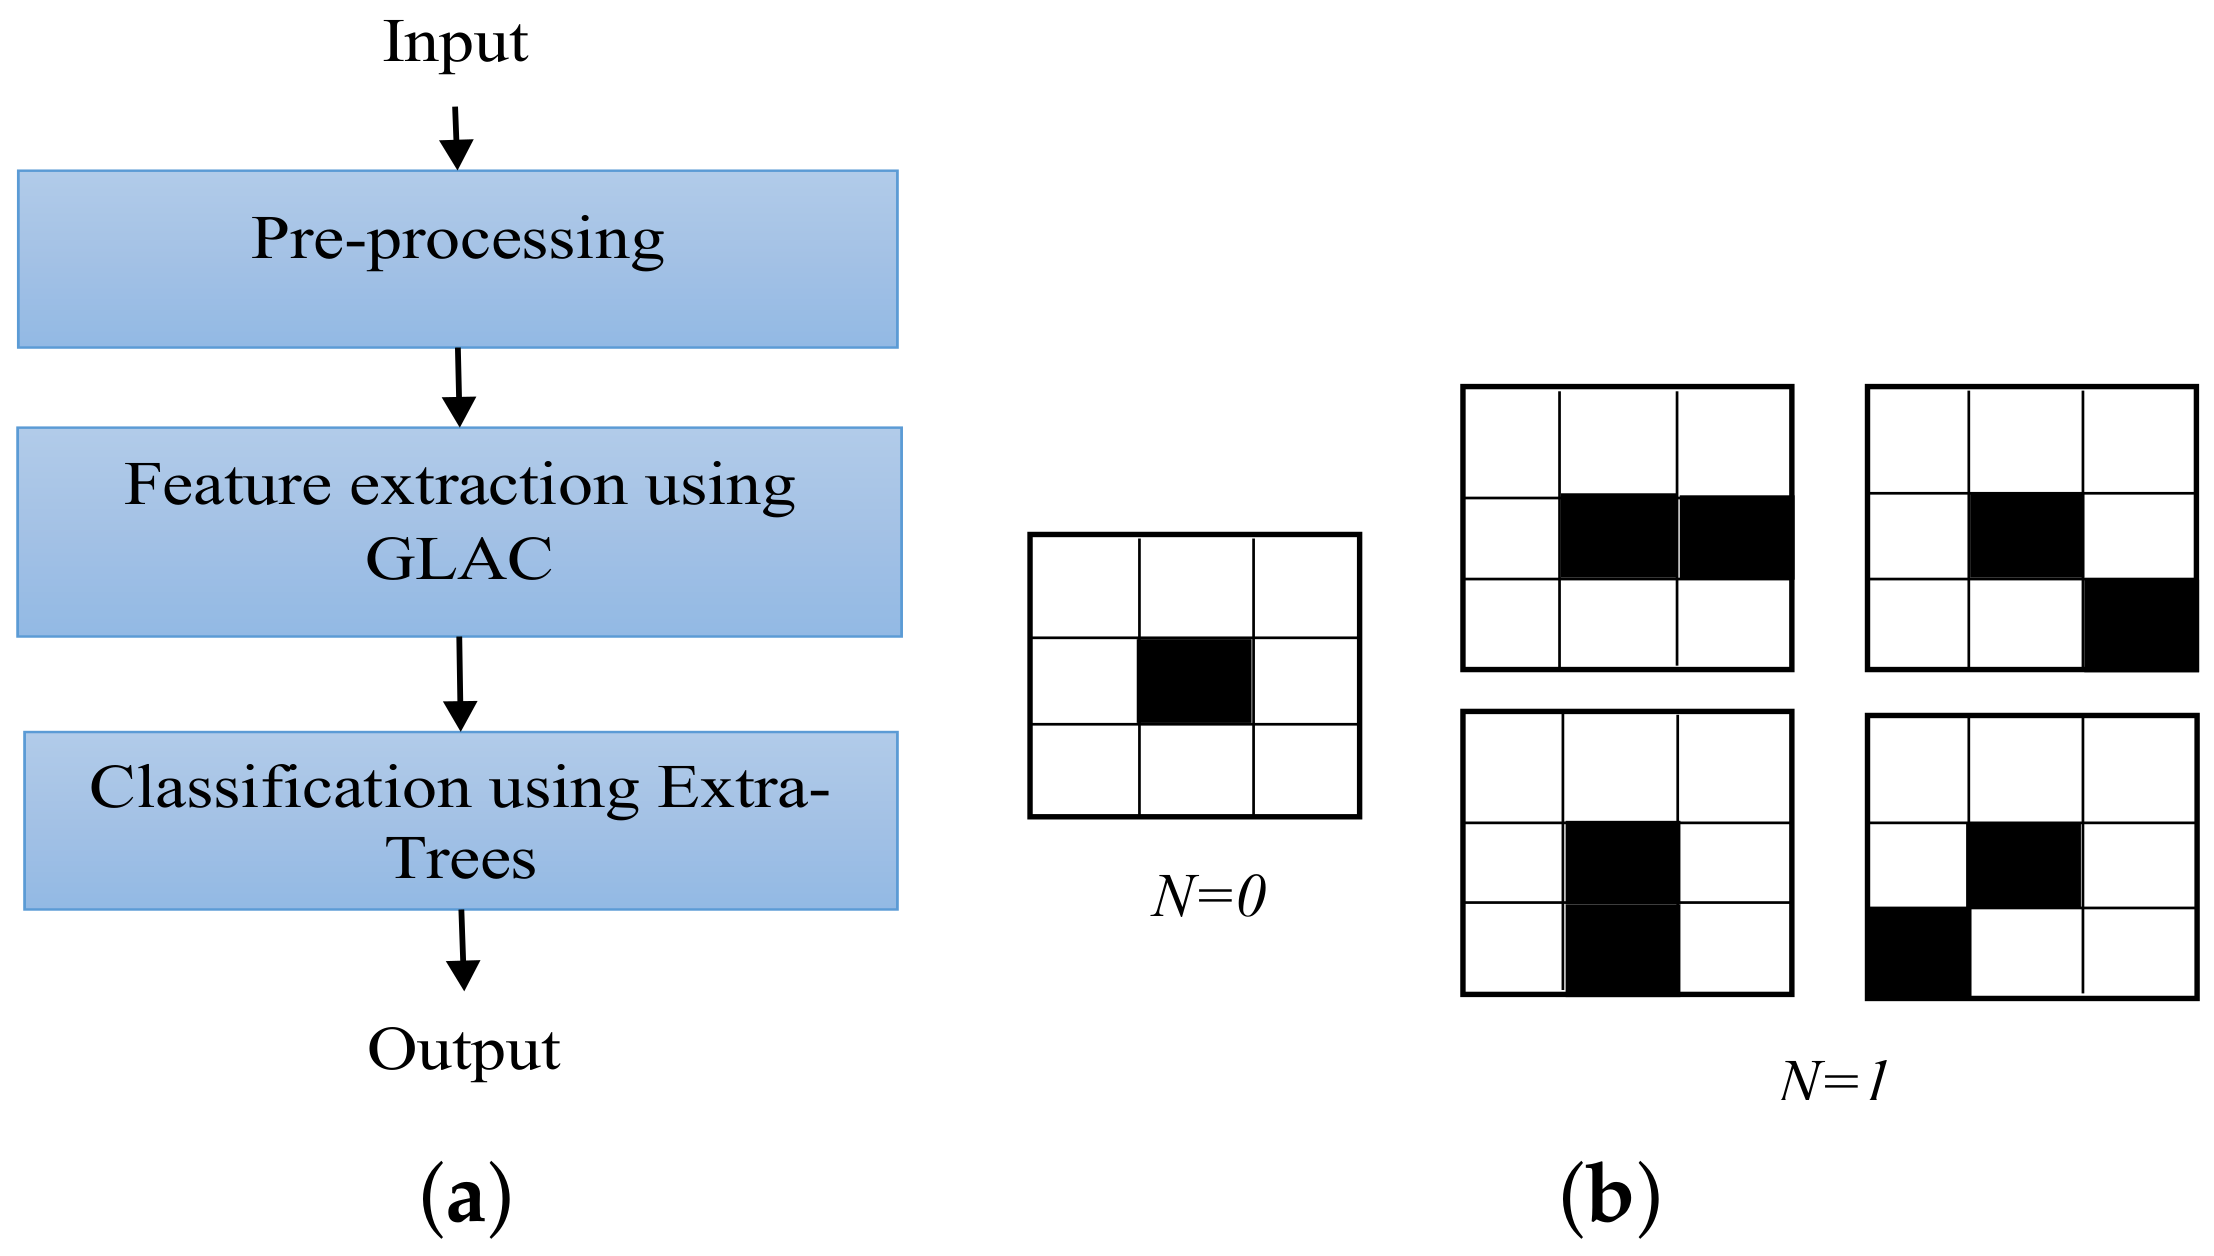
3.1. Recognizing OOIs from Photographs

Scene understanding and recognition has attracted significant attention from researchers in the computer vision and artificial intelligence community. Its major objective is to understand or recognise the world captured in a photograph, at a single glance. However, in this work our task is to recognise the OOIs (e.g., beaches, mountains, and so on) from photographs such as scenes. Hence, the OOIs represent the high-level view of a photograph. However, there are various challenges to recognizing OOIs. Typically, OOIs have to be recognised against global properties, noisy surroundings, and under different illumination environments. To deal with these challenges, one of the most popular approaches relies on local features. In particular, a set of local features (like scale-invariant feature transform, SIFT [13]) is extracted from an image and then converted into the global image representation using encoding techniques (e.g., BoV [14], and the Fisher Vector [15]). Lastly, this image representation is fed into the classifier (e.g., SVM, random forest) for recognizing the scene category. Some recent works [16,17,18] have investigated deep convolutional neural networks (CNNs) to compute image representation. These approaches employ fully connected networks to encode an input of raw image as a high-dimensional vector, and hence are computationally expensive too.
We now explain our proposed approach to detect OOIs from the given photo collection from a smartphone user. Our idea is to extract low-level features, like shape features, to recognise the scenes. The block diagram in Figure 5a shows the proposed framework for the scene recognition from photographs.

3.1.1. Pre-Processing

We first pre-process the photographs before the extraction of OOIs. This phase includes processing, for example image conversion and image resizing. Image conversion is employed to change an RGB image to a gray scale image. Image resizing is then used to resize images to a fixed size.

3.1.2. Feature Extraction

We select a state-of-the-art approach, gradient local auto-correlations (GLACs) [19], for the feature extraction process in LPaMI. The GLAC descriptor is an efficient method for obtaining shift-invariant features. This technique is considered as an extended form of the histogram of oriented gradients (HOG) [20] and scale-invariant feature transform (SIFT) [13]. It can also be employed as a local feature descriptor. GLACs extract more features since they are second-order statistics of gradients. They are built on the spatial and orientational auto-correlations of image gradients. Below we formally explain our feature extraction process using GLACs.
Let R be an image region and p = (x, y)t is a position vector. For each pixel, the image gradient δ R δ x , δ R δ y t can be represented as the magnitude m = δ R 2 δ x + δ R 2 δ y and the orientation angle θ = a r c t a n δ R δ x , δ R δ y . Voting weights to the nearest bins are applied to code the orientation angle θ into D orientation bins. With the gradient orientation vector f along with the gradient magnitude m, the Nth order auto-correlation function of gradients in local neighbours can be described as
G d 0 , d N , a 1 , , a N = w m p , , m p + a N f d 0 p f d 1 p + a 1 f d N p + a N d p
where a i represents displacement vectors from the reference point p, w is a weighting function, and f d is the dth element of f. Figure 5b shows spatial auto-correlation patterns. In this study, we consider N ∈ {0, 1}, a 1 x , y ∈ {± Δr, 0}, and w(·) = min(·) according to [19]. For N ∈ {0, 1}, GLACs can be expressed as
0 t h o r d e r , G N = 0 d 0 = p R m p f d 0 p
1 s t o r d e r , G N = 1 d 0 , d 1 , a 1 = p R m i n m p , m p + a 1 f d 0 p f d 1 p + a 1

3.1.3. Classification

In order to recognise the OOIs effectively, we have adopted the extremely randomised trees classifier. Extremely randomised trees (extra-trees) are an ensemble of absolutely randomised decision trees, where the complete training sample is applied to build every tree in the tree ensemble [21]. Extra-trees have three important parameters that include the number of attributes K, the number of trees M, and the minimum sample size n m i n to divide a node. The extra-trees classifier applies the following process to split the nodes. Firstly, it randomly picks K attributes from all candidate attributes, and selects a random splitting value for every attribute. A score is then assigned to each attribute, and the attribute with maximum variance reduction abilities is picked to split the node. Experimental results in  [21] show that this technique is most of the time superior to random forests in terms of accuracy and time complexity since it eliminates the necessity for the optimisation of the discretisation thresholds.
We encapsulate the execution of this phase in Algorithm 2 that contains details of scene recognition for the OOIs from given set of photographs.
Algorithm 2 Recognition of Objects of Interest from Photographs
Require: Image collection C of a given application area obtained from the smartphone of a user U, Number of Trees n u m T r e e s , Number of Attributes n u m A t t r , Splitting Node Size n o d e S i z e
Ensure: Classify the OOI and Extract the Date and Time from C onto the disk
1:
Read images from C into I
2:
Find Date and Time as image infomation from I
3:
Perform RGB to Gray scaling of I and save into I m c o v
4:
Resize the I m c o v into I m r e s i z e
5:
Perform feature extraction using GLACs as ( I m r e s i z e ) –> F e a t u r e v e c
6:
Compute scores as [ e n s e m b l e , s c o r e s ] = E x t r a T r e e ( n u m T r e e s , n u m A t t r , n o d e S i z e , t r a i n S e t , i n p u t T y p e )
7:
Determine the scene type as C a t e g o r y via p r e d i c t W i t h E x t r a T r e e ( e n s e m b l e , F e a t u r e v e c )
8:
Write the output in the file ( C a t e g o r y , D a t e , T i m e )

3.2. Data Filtering and Migration Phase

As soon as we extract OOIs from the image collection, we place the resultant raw data in the HDFS. In this way, we aim to perform a faster processing of this data using Spark. We use Spark as we understand that photo collections can be very large in various application areas. For example, a user may have taken photographs of the ocean on a certain day, so OOIs can be water, beaches, ships, fish, and so on. Resultantly, big data of time-stamped photos is accumulated for a user over the passage of time. We present a step-by-step procedure of raw data processing in Figure 6a and explain the details of every step and operation in the following sub-sections.

3.2.1. Data Migration from HDFS to Relational Database

We now present details of processing of the raw text data (stored in the HDFS) containing OOIs. The aim of this phase is to clean, filter, format, and normalise the data. A sample of raw text data is shown in Figure 6b that hints at the travel record of a person in terms of visiting different places. Each row contains the name of an OOI along with its timestamp. We also observe that there are few statements with information errors resulting in the non-recognition of entities. This occurs due to classification inaccuracy.

3.2.2. Data Reading from HDFS

We begin with reading the raw text data from HDFS using Apache Spark. Apache Spark is a fast, in-memory data processing engine containing useful APIs that allow developers to execute variety of data-intensive workloads by an easy integration with the HDFS. Initially, we load the batch of text data from HDFS storage into a Spark resilient distributed dataset (RDD) for parallel in-memory distributed processing. RDD is a fundamental data structure of Spark and is an immutable, partitioned collection of elements to be operated on in parallel. On reading the raw data, we load it into an RDD called rawDataInputRDD, as shown in the Figure 6a.

3.2.3. Data Processing in RDDs

Having loaded the data in rawDataInputRDD, we are now able to partition it across the cluster for parallel processing. Since each RDD is immutable, we create rawDataMapRDD that obtains data from rawDataInputRDD and splits it into place and time attributes. This timestamp creation is necessary as it helps in graph modelling, which is the next phase in LPaMI. Finally, the resultant data is stored in rawDataDateFMapRDD.

3.2.4. Transformations, Data Processing, and Normalisation of DataFrames

Data storage in the tabular format is flexible enough to support a wide variety of data transformation operations. For this purpose, Spark provides DataFrame, which is a distributed collection of data organised into named columns. It is conceptually equivalent to a table in a relational database. One can incorporate SQL while working with DataFrames using Spark SQL. Spark SQL is a component on the top of Spark core that introduces a form of data abstraction called SchemaRDD. SchemaRDD enables us to perform in-memory SQL operations on structured and semi-structured data.
To perform in-memory SQL operations on the data, we move the data from rawDataDateFMapRDD into SparkSQL tabularDataFrame. The tabular data may consist of noise or errors e.g., the object not found error. Thus the tabularDataFrame is transformed to remNoiseDataFrame to remove noise or filter unwanted data from the tabularDataFrame and then the refined remNoiseDataFrame is saved on the HDFS in Parquet file format which is a column-based storage format. Finally, the refined remNoiseDataFrame is normalised i.e. assigned to two DataFrames named pictureDataFrame and pictureObjectDataFrame, and then permanently loaded into a persistent relational database.

3.3. Modelling Data as a Graph

With the successful migration of filtered and cleaned data into persistent storage, we obtain the big data of OOIs. Each OOI is a notable entity extracted from every photo. Fortunately, the time stamp factor attached to each photo enables us to align the OOIs into a sequence of actions. We then model list of sequences into graph(s), where a node denotes an OOI and the edges between them demonstrate the order for performing a particular action in certain period of time, like visiting one place after ther other. The main advantage is that this graph modelling enables us to apply various graph pattern mining algorithms for lifestyle behaviour learning. To model graph(s) from sequences, we use the state-of-the-art MUSCLE [22] algorithm. MUSCLE is an iteration-based multiple sequence alignment method, which has been found to be the fastest for large numbers of sequences. Using MUSCLE, we can generate undirected, directed, or weighted graph(s).

Graph Construction

Since we have a time-stamped collection of OOIs, the domain of time is a linearly ordered set T. A time-dependent network is a directed graph G = ( V , E ) , where every edge e has an associated link-traversal function f e : T T . We consider two same OOIs as one instance in LPaMI if the time gap between them t = ( t i + 1 t i ) is below a given threshold TimeThreshold. We consider such photographs to be taken in same place and represent them as a single node. Furthermore, if v i = v i + 1 and t < T i m e T h r e s h o l d , they can be converged into one record such as v = v i = v i + 1 ; t = ( t i + t i + 1 ) / 2 . If v i v i + 1 or t > T i m e T h r e s h o l d , we create an edge e = ( v i , v i + 1 ) . We illustrate the sample travel data of a person and display it in a graph format in the Figure 7.
To support applying versatile graph mining operations in LPaMI, we propose generating graphs of two types: (1) a set of sequence graphs; and (2) a cumulated graph. We define both of them below.
Sequence Graph Model: Let f be the function to create the set of sequence graphs S t ( V t , E t ) S from given graph G and time set T. If f satisfies f ( t ) f ( t + 1 ) then the total numbers of vertices and edges are monotonically increasing over time.
Suppose S t ( V t , E t ) is a sequence graph, where V t V is the set of vertices v 1 , v 2 , , v k V t , and E t E is the set edges for the time-instance t. Each edge connects the consecutive two vertices e ( v i , v i + 1 ) E t , i = 1 , , k 1 . The vertex v 1 is called the source, t 1 the starting time, v k the destination, and t k the arrival time in time instance t. The set of sequence graphs is homogeneous in nature, where all the nodes are of same type.
Definition 1.
(Set of Sequence Graphs). We define S, S = S t 1 S t 2 S t k , as a sequence graph where t i < t i + 1 .
For instance, a user visits every place in a sequence in a real-world scenario. Using the given data, we create a set of sequence graphs and align them to generate cumulated graphs based on the defined granularity level of a user (granularity level can be either year, quarter, month, weekly, or day) using the MUSCLE algorithm. A set of sequence graphs is illustrated in Figure 1 in the graph modelling phase, where the size of each sequence is of one month.
Cumulated Graph Model: Our model takes as input a sequence of edge sets E 1 , E 2 , E n arriving at times T 1 , T 2 , T n and a function f W ( G ) , which outputs the value of a specified statistic on graph G. At each time T i , g is applied to the current aggregated graph G i to obtain value w ( e ) i for edge weight. Each vertex v i in G i is merged by node type i.e, if they are same OOIs. Given a large graph and the granularity level, the proposed model creates a set of heterogeneous graphs G t ( V t , E t , T V , g ) that consists of various types of nodes. Member graphs at each time interval are combined to create an aggregated graph. Here, T V is a finite set of node types and the function g is applied to the current aggregated graph G t to obtain edge weight value w ( e ) t for each edge. In each graph G t , the number of vertices is much smaller because the vertex v i in G t is merged by node type.
Definition 2.
(Cumulated Graph): The cumulated graph G ( V t , E t , T V , g ) is a single large graph, where V t V for the set of edges E t E . T V is a finite set of node types, and a function g assigns edge weight in G t .
We illustrate a cumulated graph from a set of sequence graphs in Figure 1 in the graph modelling phase and present the pseudocode of this process in Algorithm 3.
Algorithm 3 Data Transformation into Graph Format Phase
Require: Image data I is produced by Object Recognition and Data Migration Phases for Data Transformation, only such data tuples i have the recognised object o and time information t, given time window τ
Ensure: Graph data G ( V , E )
/* Sequence Graphs Creation */
Generate sequence graphs S based on given time window τ
 1: Assign each tuple i ( o , t ) I into appropriate set t i T where s t a r t f ( t i ) < f ( t ) < e n d f ( t i ) and s t a r t f ( t i ) e n d f ( t i ) = τ .
 2: Align the created daily sequences S d using the MUSCLE algorithm, S d S
 3: Create a set of sequence graphs S = S ( t 1 ) S ( t 2 ) S ( t k ) .
/* Graph Formating */
Model a graph database G t or one large graph G from the sequence graphs
 4: Identify vertices and edges O V , v i V and e ( v i , v i + 1 ) E .
 5: Calculate graph statistics and assign attributes by function f w .
 6: Create the sequence graph G t = ( V t , E t , f W ) ; a large graph G t G

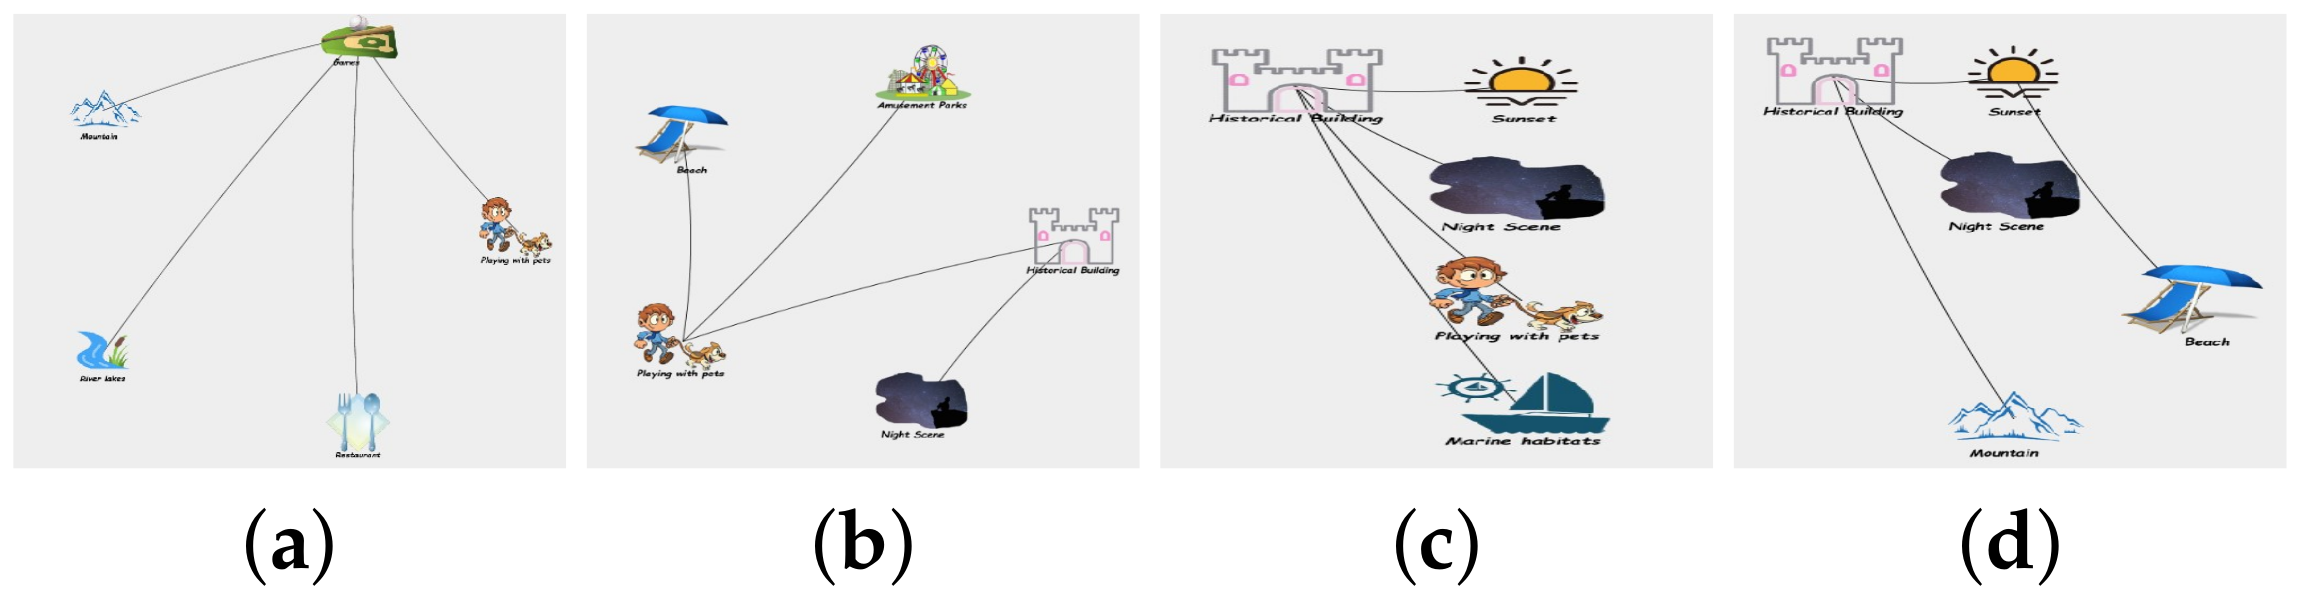
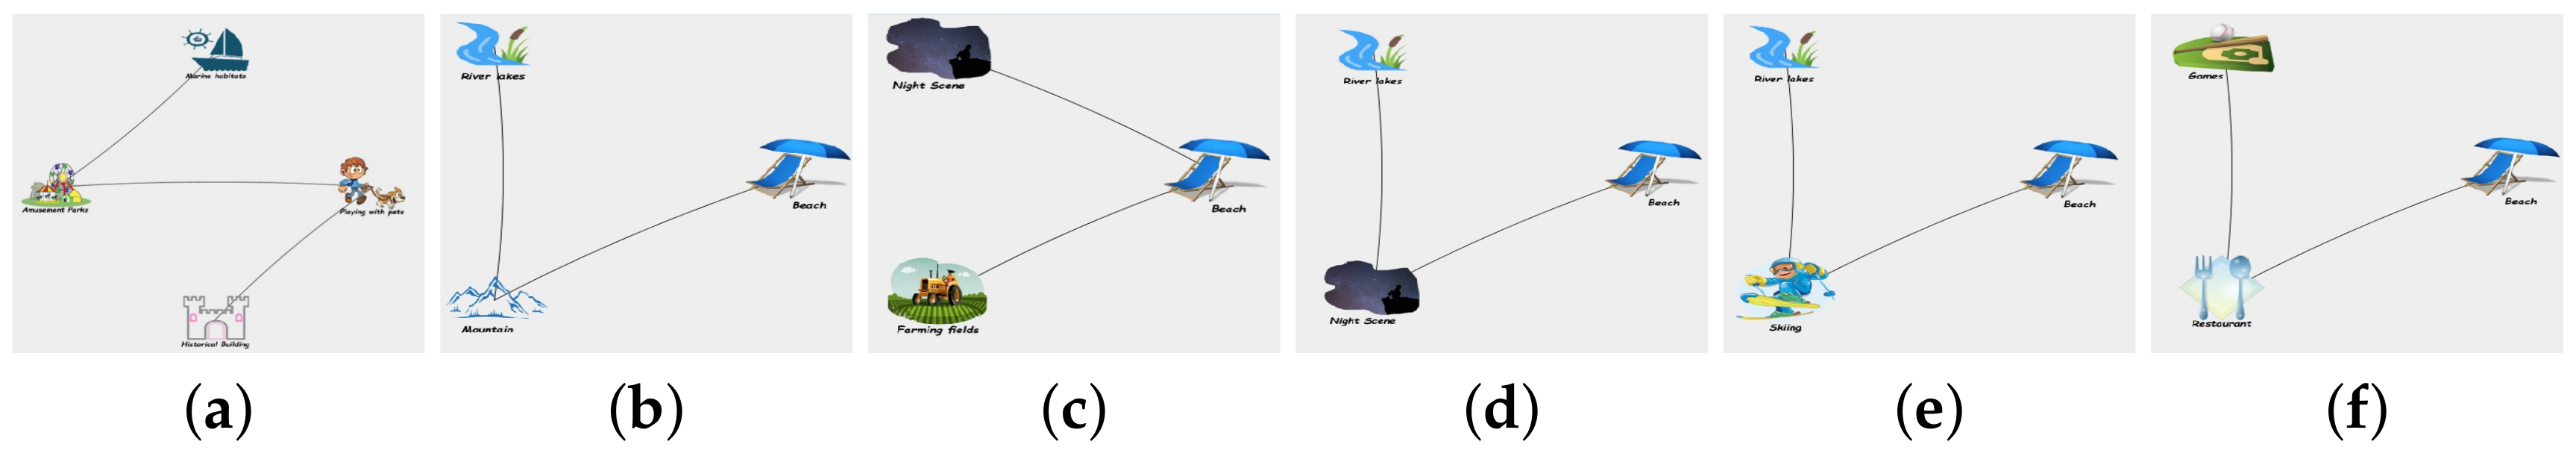
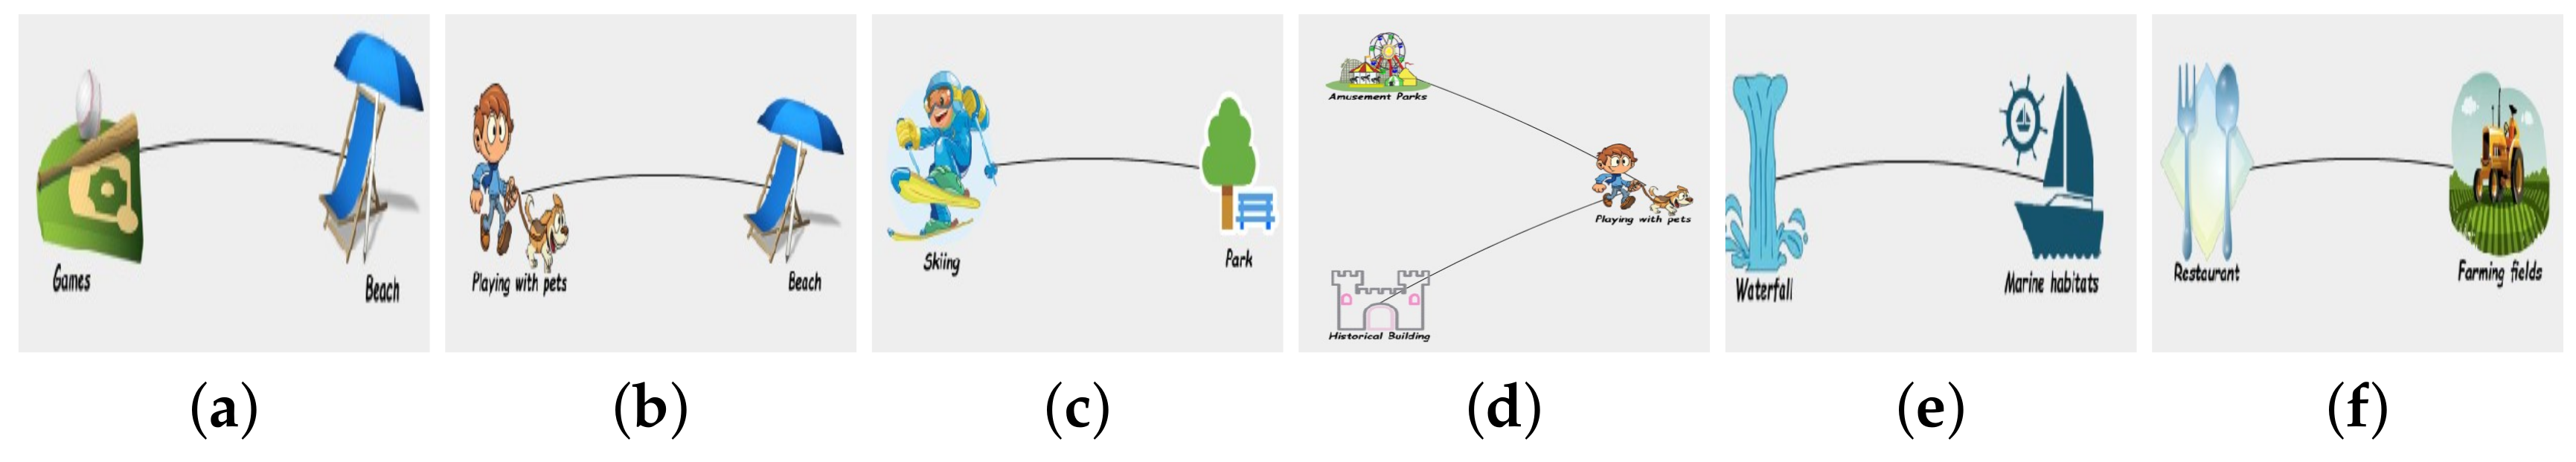
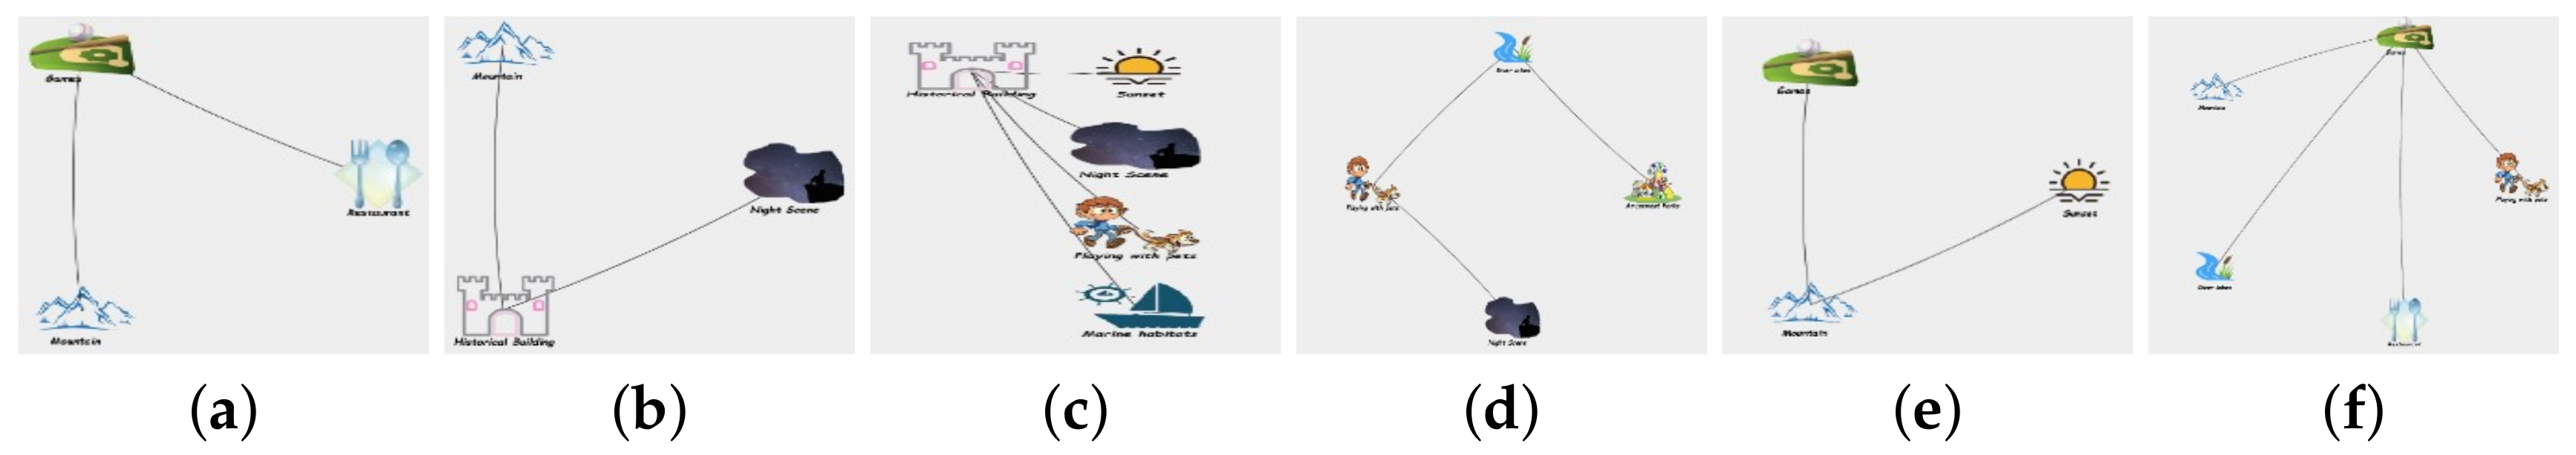
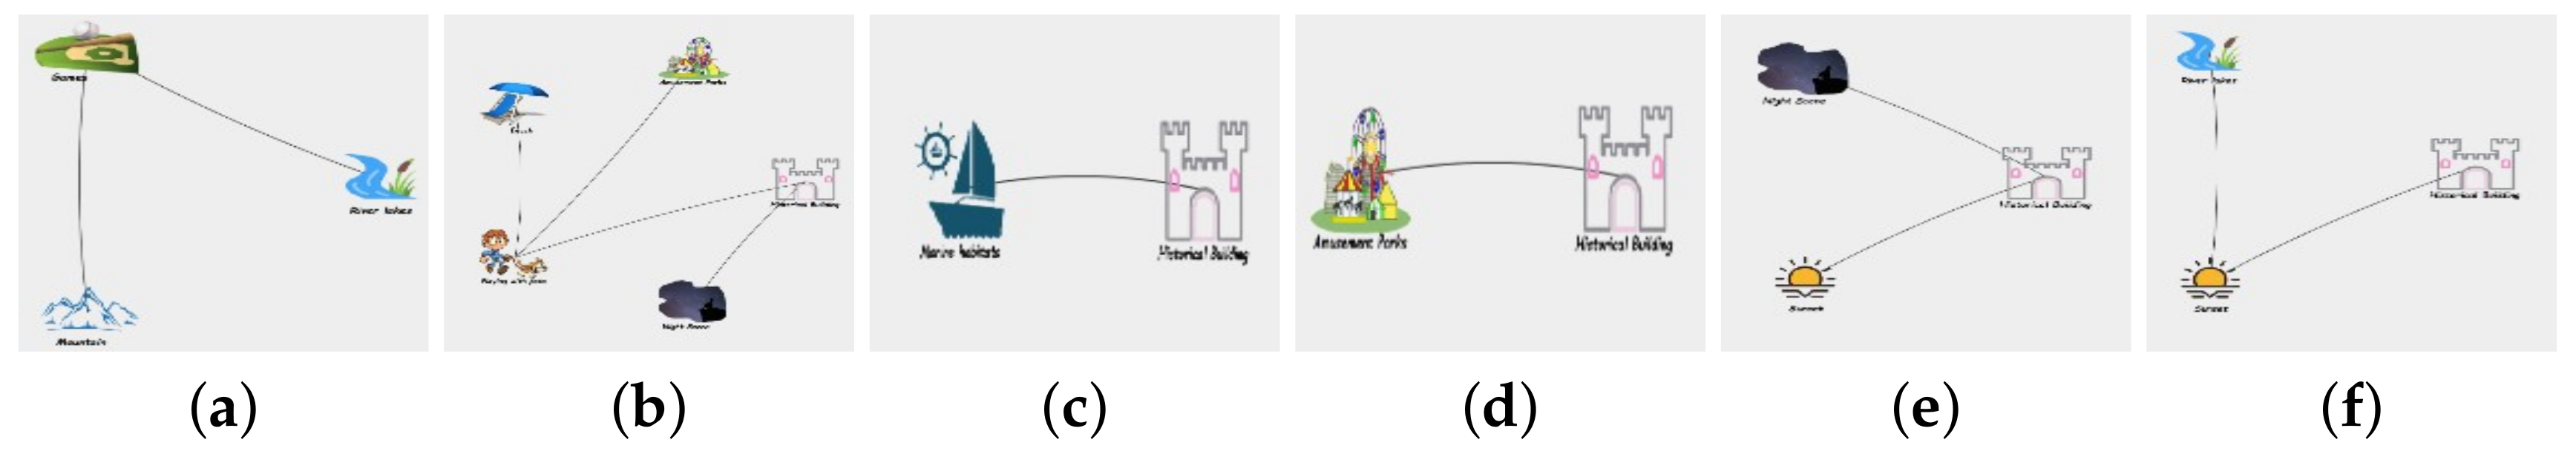
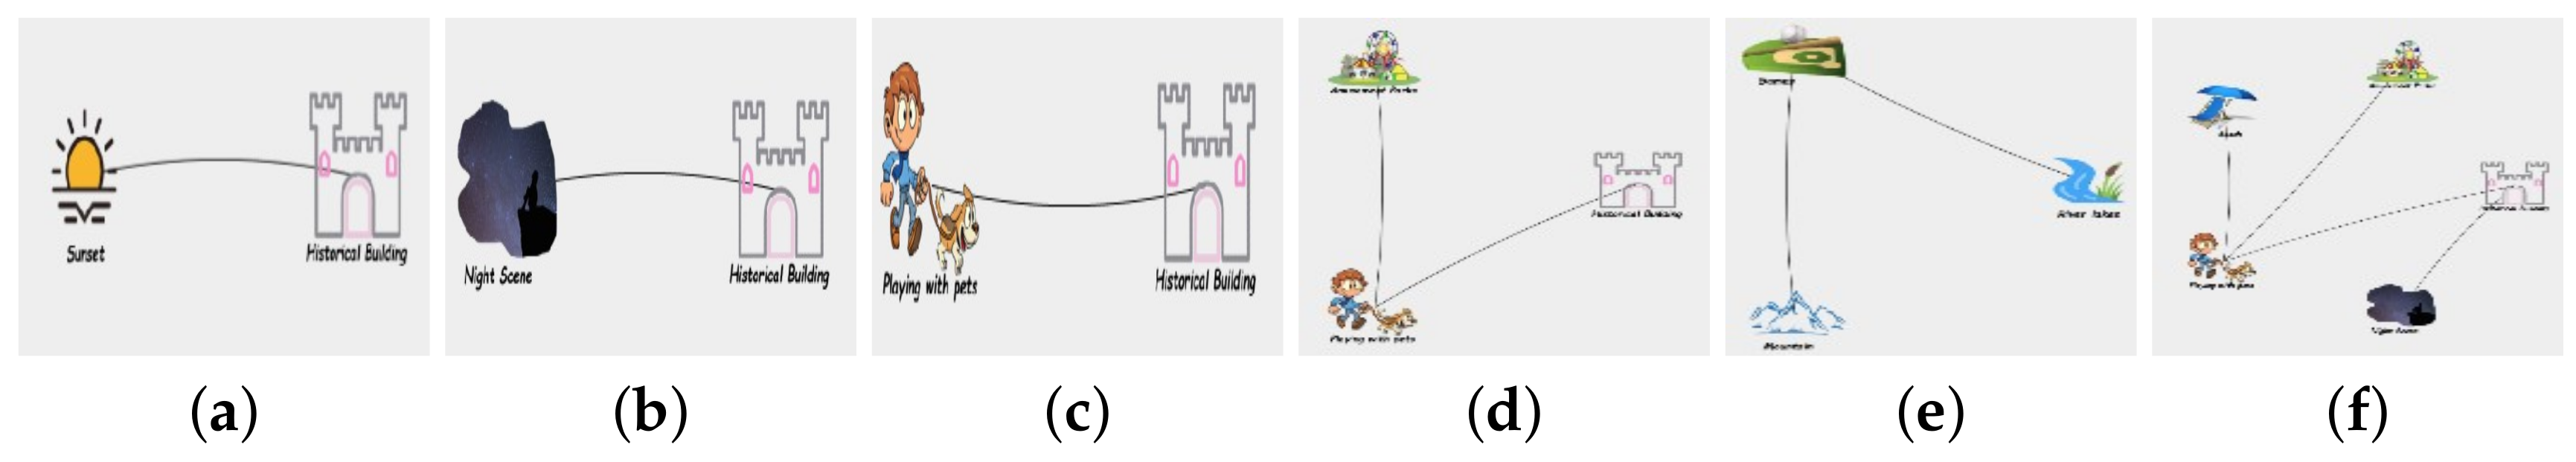
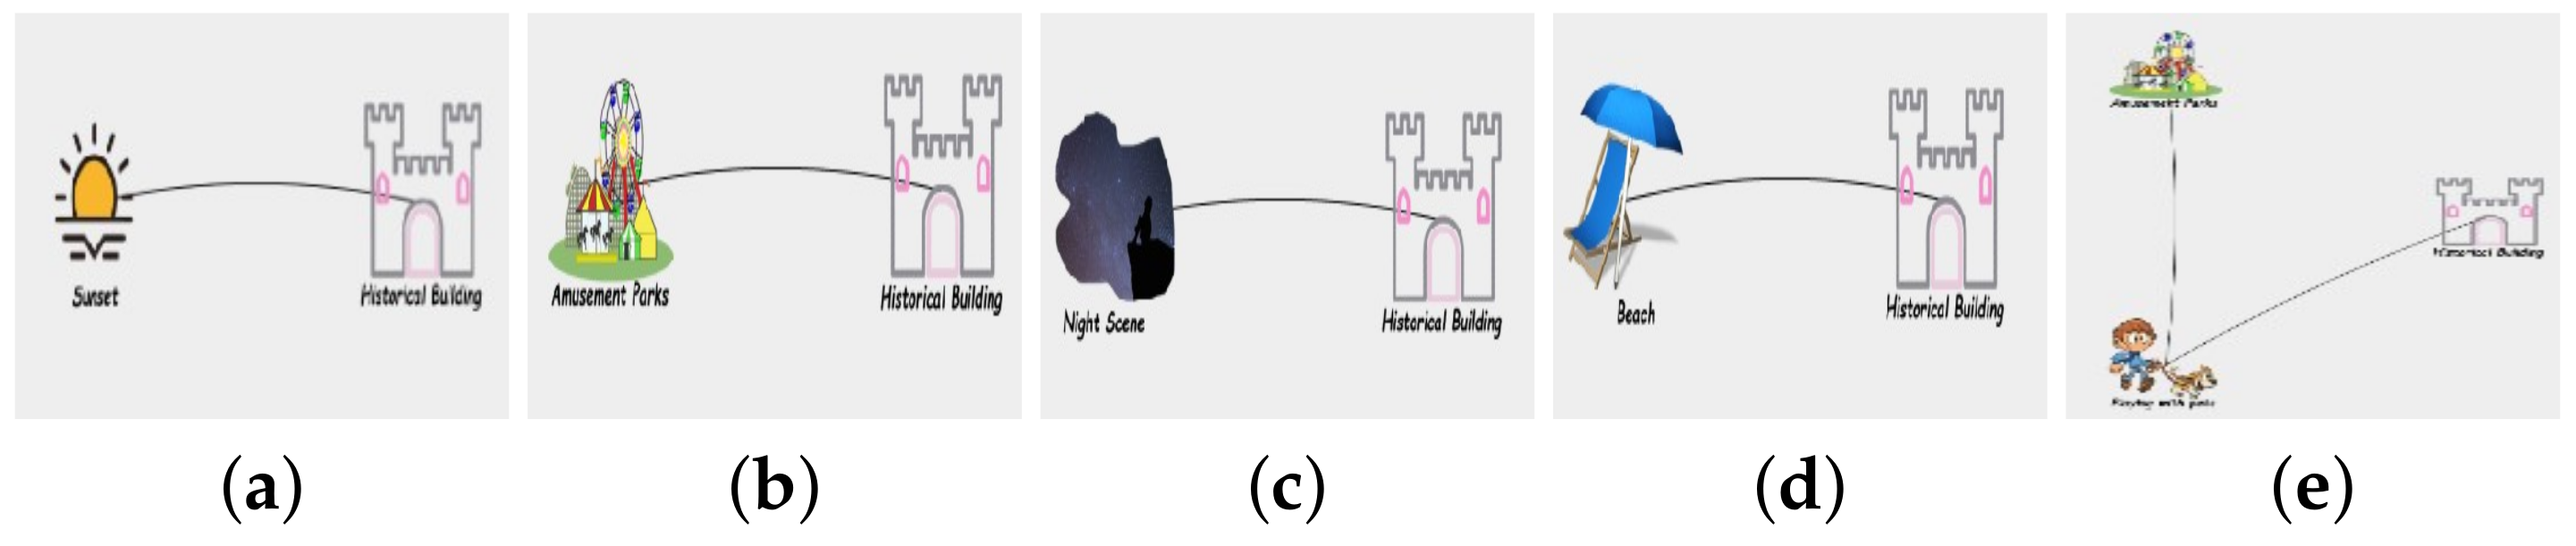
3.4. Graph Pattern Mining

As soon as graph modelling is performed, we apply state-of-the-art frequent subgraph mining algorithms to extract lifestyle patterns. A variety of algorithms have been utilised to discover various interesting lifestyle patterns, both from our cumulated graph model (Definition 2) and from the graph database (Definition 1). Table 1 shows the selected algorithms and their characteristics. We use gSpan [23], Gaston [24], and kFISM [25] to mine graph database. The gSpan finds patterns whose occurrence count satisfies the minimum support threshold. The maximal frequent subgraph, found using Gaston, is defined if a frequent graph pattern g is maximal in a database when none of its supergraphs is frequent. Similarly, an induced subgraph of a graph, obtained using kFISM, is a subgraph that is formed from a subset of the vertices of the graph and contains edges connecting pairs of vertices in that subset. On the other hand, GRAMI [26] is used to mine an cumulated graph. It mines the frequent patterns, satisfying some minimum support threshold criteria from a single large graph.

4. Experimental Evaluation

4.1. Dataset Description and System Configuration

We used various datasets for the evaluation of LPaMI as displayed in the Table 2. The 8-Scene and INRIA Holidays datasets are used to evaluate the performance of our utilised classifiers to recognise OOIs from the photograph collection. The 8-Scene dataset has various images containing eight class labels i.e., coasts, inside city, forests, highways, open country, mountains, streets, and tall buildings. Similarly, the INRIA holidays dataset also has eight categories, e.g., mountains, waterfalls, sunsets, beaches, historical buildings, restaurants, marine habitats, and rivers. For the INRIA dataset we have used 700 images for training and 200 images for testing. For the 8-Scene dataset we have used 1880 images for training and 808 images for testing. Since both of these datasets are much smaller in size, they cannot be used to evaluate the scalability of LPaMI in terms of its performance in data migration from the HDFS to a structured format in a persistent storage space. Hence, we simulate the MT, BK, and T7 datasets for the aforementioned purposes. For the data migration phase, we set up the distributed Hortonworks Data Platform (HDP 2.6.1.0) cluster consisting of one server (Intel machine Core i7-6950X CPU @ 3.00 GHz) and four agents while using the Ubuntu 14.04 LTS operating system. Each machine consists of 4 processors, 8 GB of RAM and 100 GB of hard disk.
All the aforementioned datasets are used for the performance evaluation of its OOI extraction plus data migration phases. For the lifestyle pattern mining phase, we opt to perform effectiveness analysis of LPaMI using the INRIA dataset only since it is a real-world dataset of photographs. The INRIA Holidays dataset contains outdoor scene images. This dataset is helpful for us to simulate the photograph collection created in a smartphone of a user because the outdoor scene images can be referred to as photographs taken during different trips. The results discovered in the INRIA datasets are of travelling patterns and we present the visualisations obtained using LPaMI.

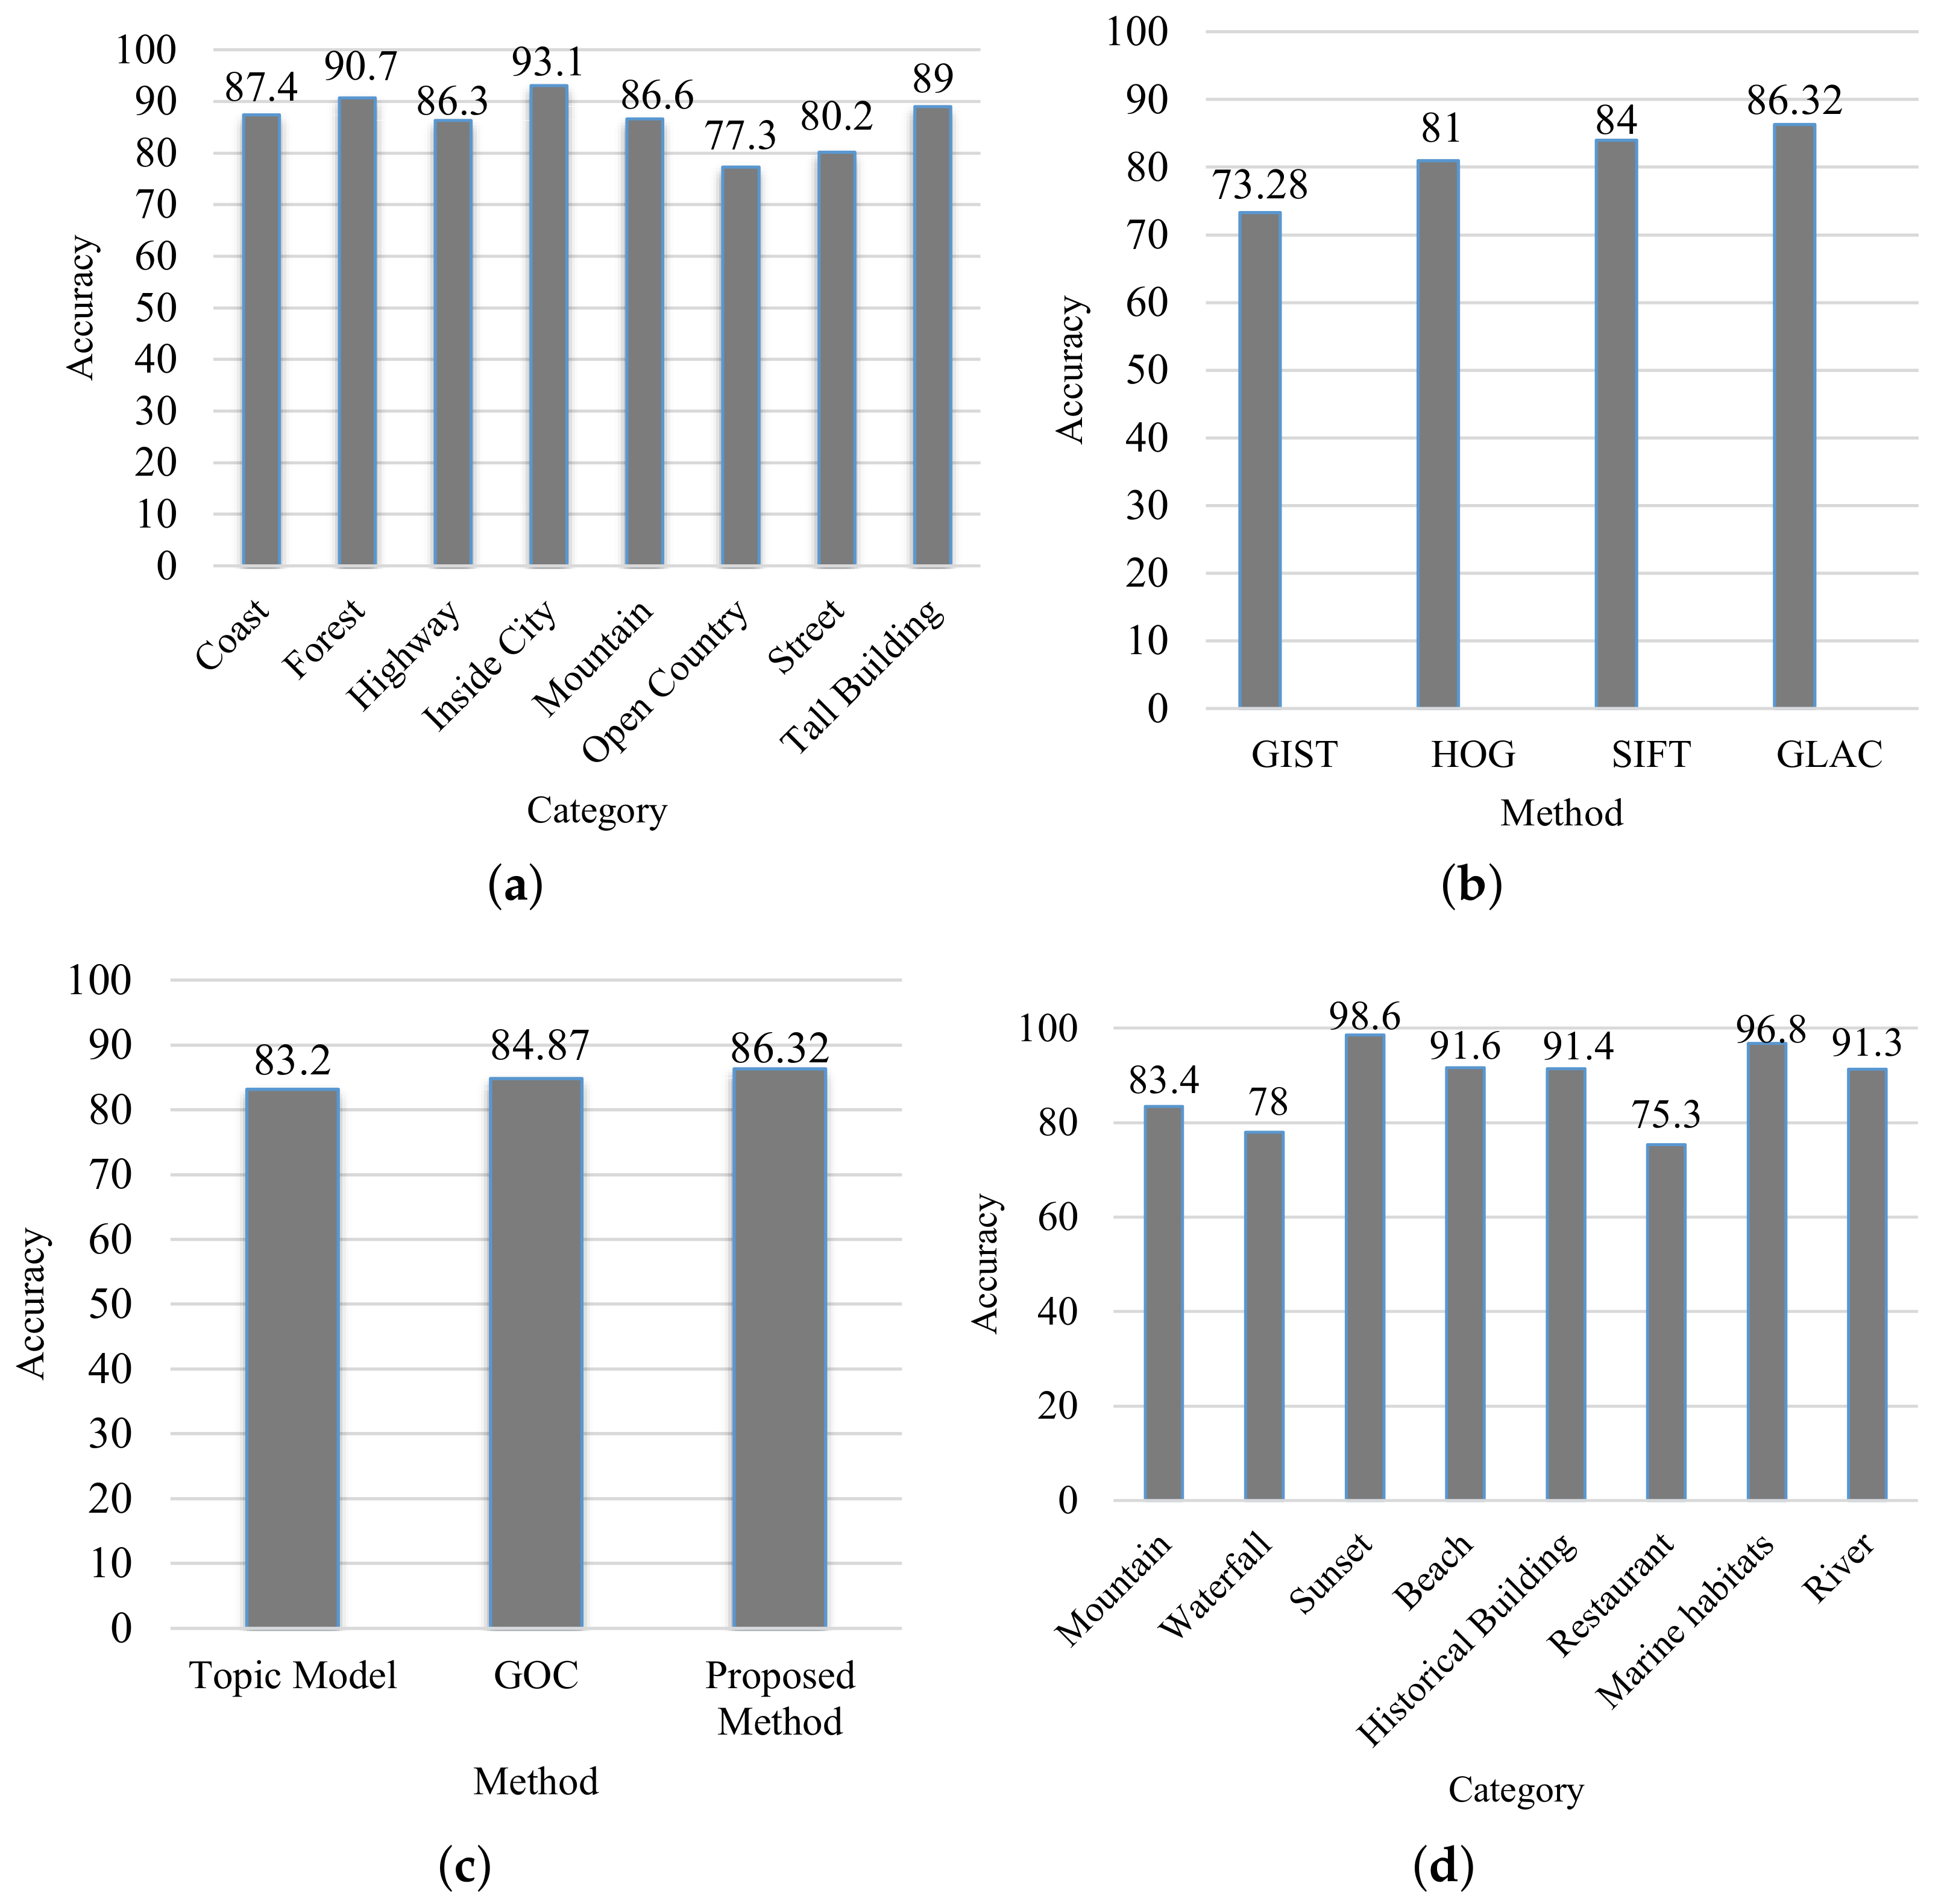
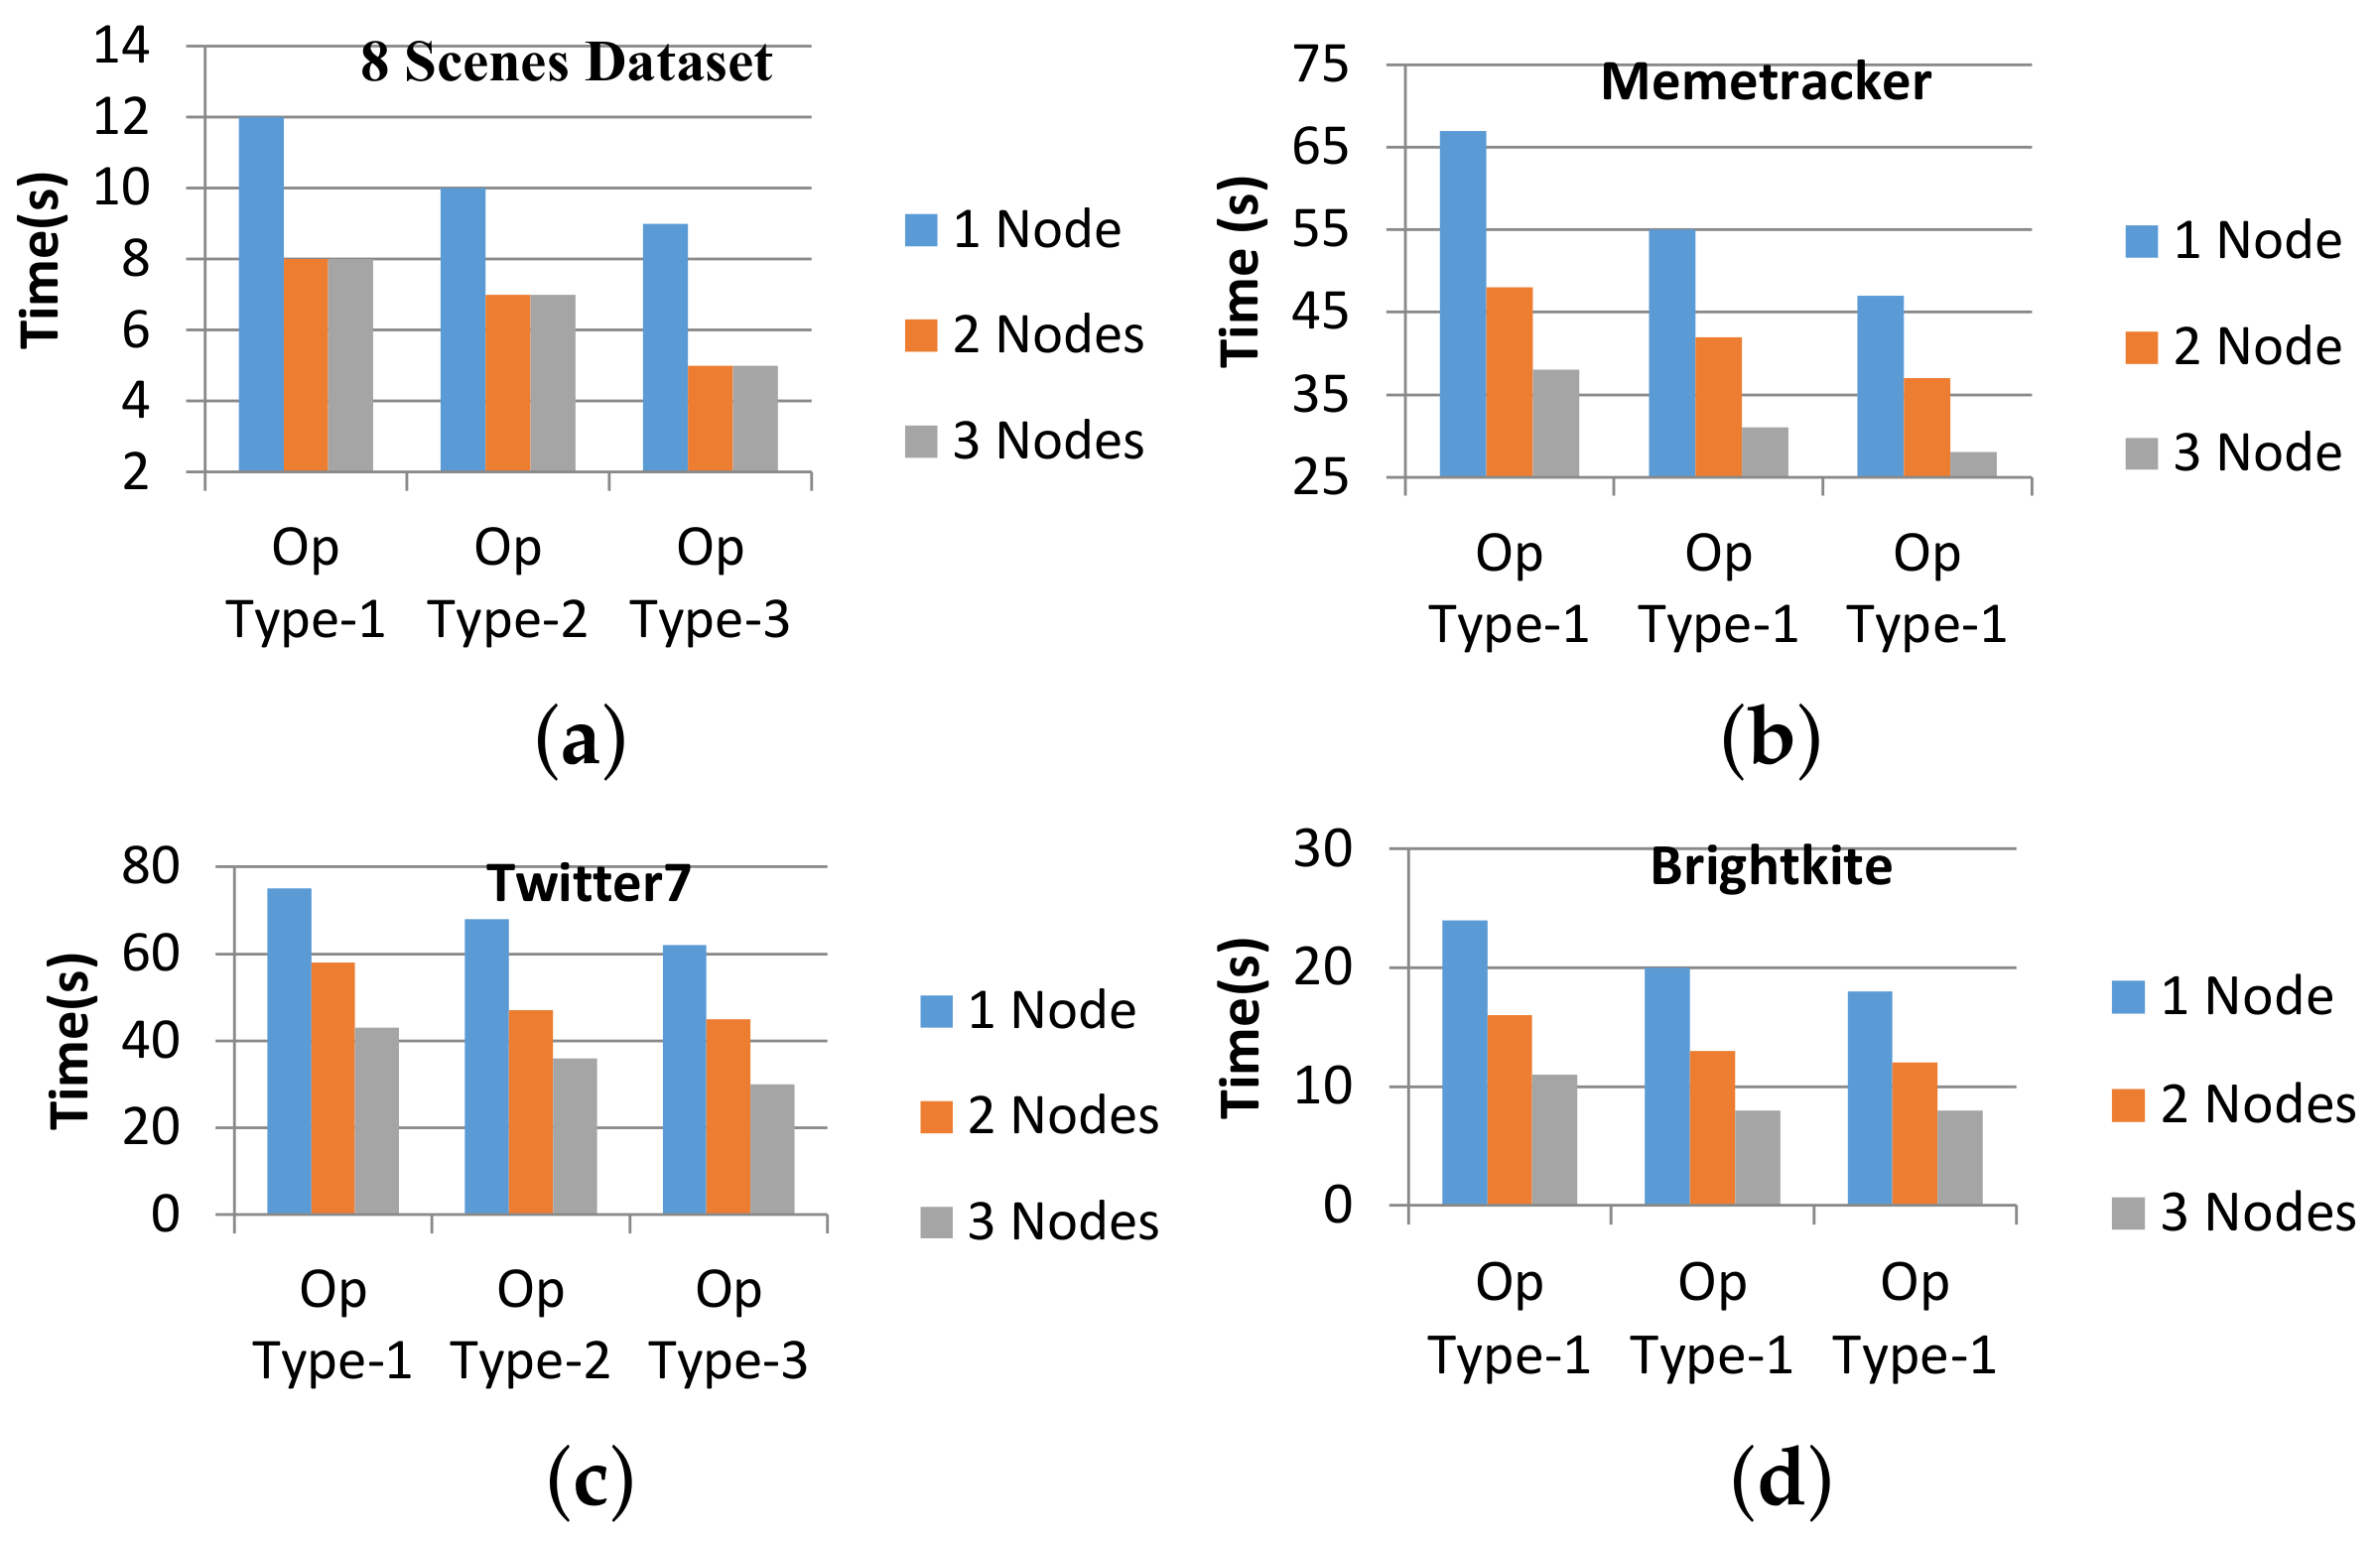
4.2. Performance Analysis

All of the classification results are achieved by utilizing extremely randomised trees (extra-trees) along with the feature extraction by GLACs. In order to evaluate our proposed method, we have employed two benchmark datasets: 8-Scenes and INRIA Holidays. For the 8-Scene dataset, our method shows 86.32% accuracy as shown in Figure 8b. Figure 8a illustrates the performance of our proposed approach after employing GLACs and extra-trees on the 8-Scene dataset. Here the categories like “open country’ and “streets” show lower accuracy since the “open country” and “mountain” categories contain almost the similar scenes. Figure 8b,c illustrate the comparison between GLACs and other feature extraction techniques that include HOG, GIST and SIFT and comparison with existing works for the 8-Scenes dataset. On the other hand, for the INRIA Holidays dataset our approach shows an average accuracy of 88.0%. Finally, Figure 8d, shows the performance of our approach after employing GLACs and extra-trees. These experiments demonstrate a reasonable accuracy of our proposed approach and also that of the selected classifiers for LPaMI.
It should be recalled that in the pre-processing stage, we have resized the images to a fixed size of 384 × 256 . The reason for setting such a low resolution is that the size of the images in the INRIA dataset is 3268 × 2448 and that of the images in the 8-Scene dataset is 256 × 256. The depth of the input images in both the INRIA dataset and 8-Scene dataset is 24 bits and after converting image from RGB image to gray image the depth becomes 8 bits. In case of INRIA dataset, if we use the original size of the image then the total time required to extract the features using GLACs is approximately 3372.5817 s (average accuracy of 90.1%), and on the other hand if we resize the images to 384 × 256, then the total time required to extract the features using GLACs is approximately 302.0094 seconds (average accuracy of 88.0%). Therefore, in order to reduce the feature extraction time, we have reduced the size of the images to a low resolution.
For the data migration phase, our aim is to check the scalability of data transfer from HDFS to persistent storage under different constraints. These constraints are the varying types of operations for data, as shown in Table 3. From the results in Figure 9, it is obvious that execution time of data migration improves with an increase in the number of processing nodes for Spark. Hence, we observe a sharp decrease in the execution time in all the datasets except the 8-Scenes dataset. This happens because the size of the 8-Scenes dataset is much smaller than the rest, and hence, data is processed efficiently without much impact on the processing nodes. Next, we observe that the execution time of data migration mode of type-1 is more computationally expensive than the remaining two. We observe the key difference happens due to data normalisation. We perform data normalisation so that there is no redundancy in the data in persistent storage media and to facilitate the graph modelling phase without scanning the entire data.

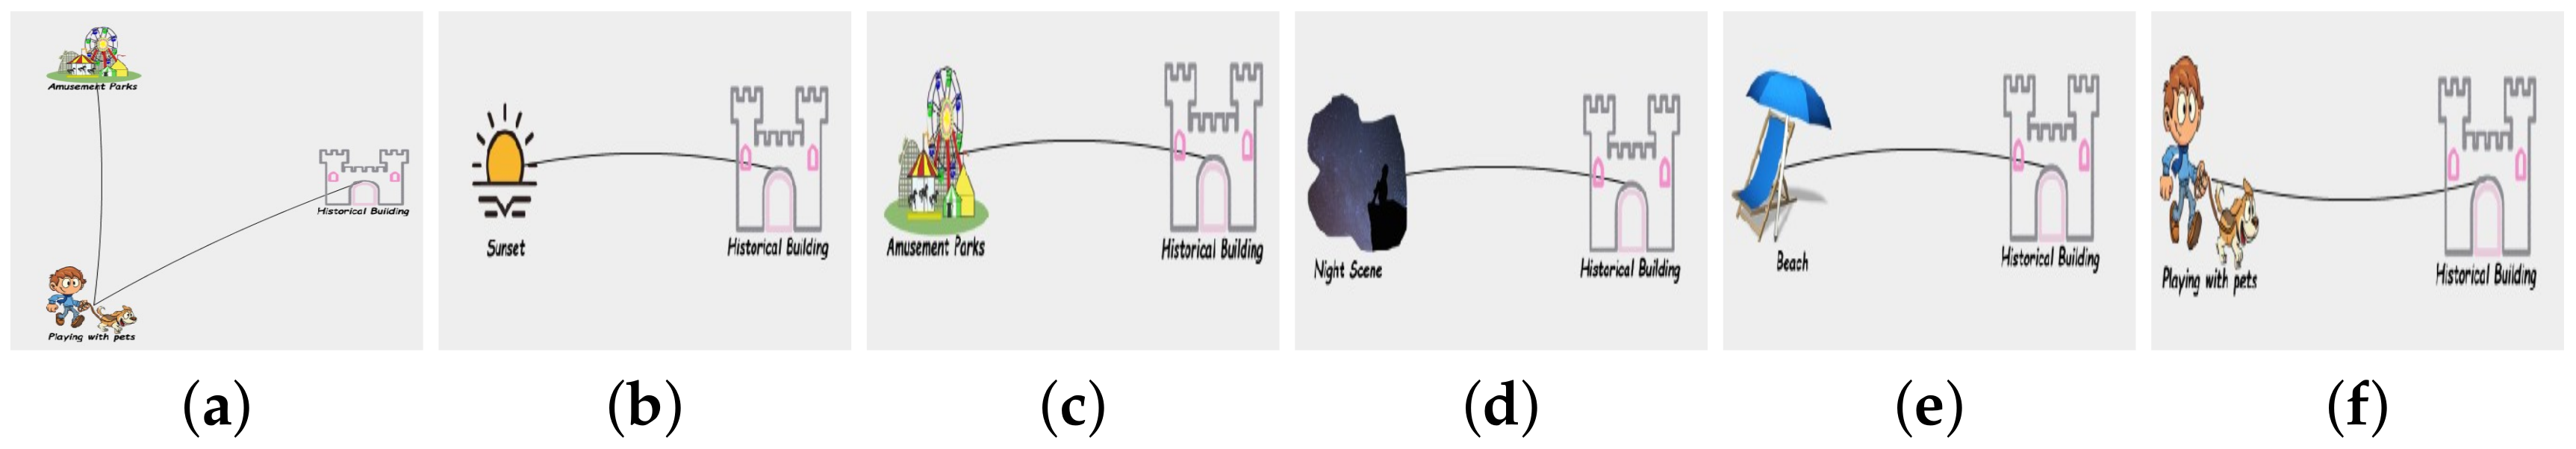
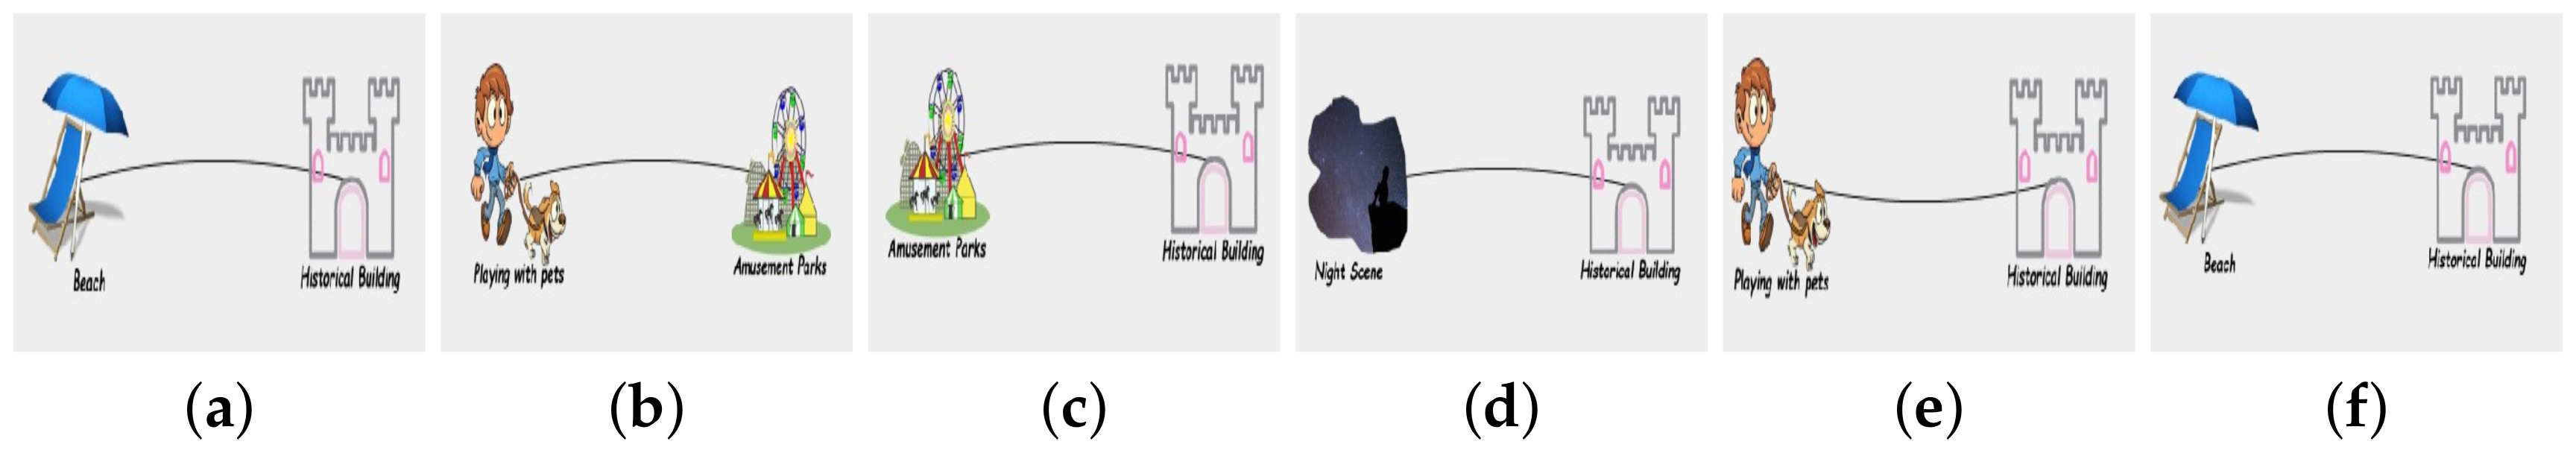
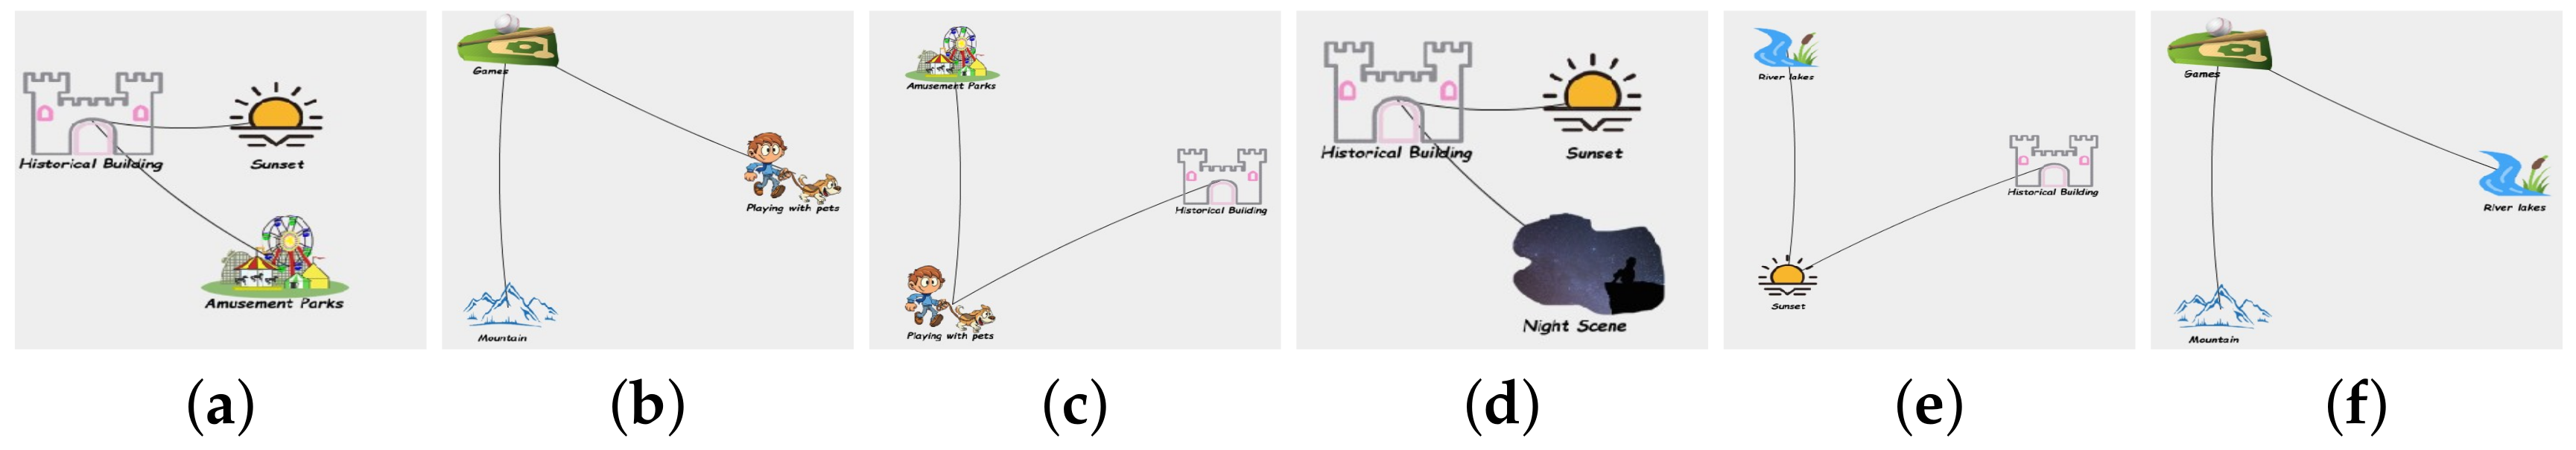
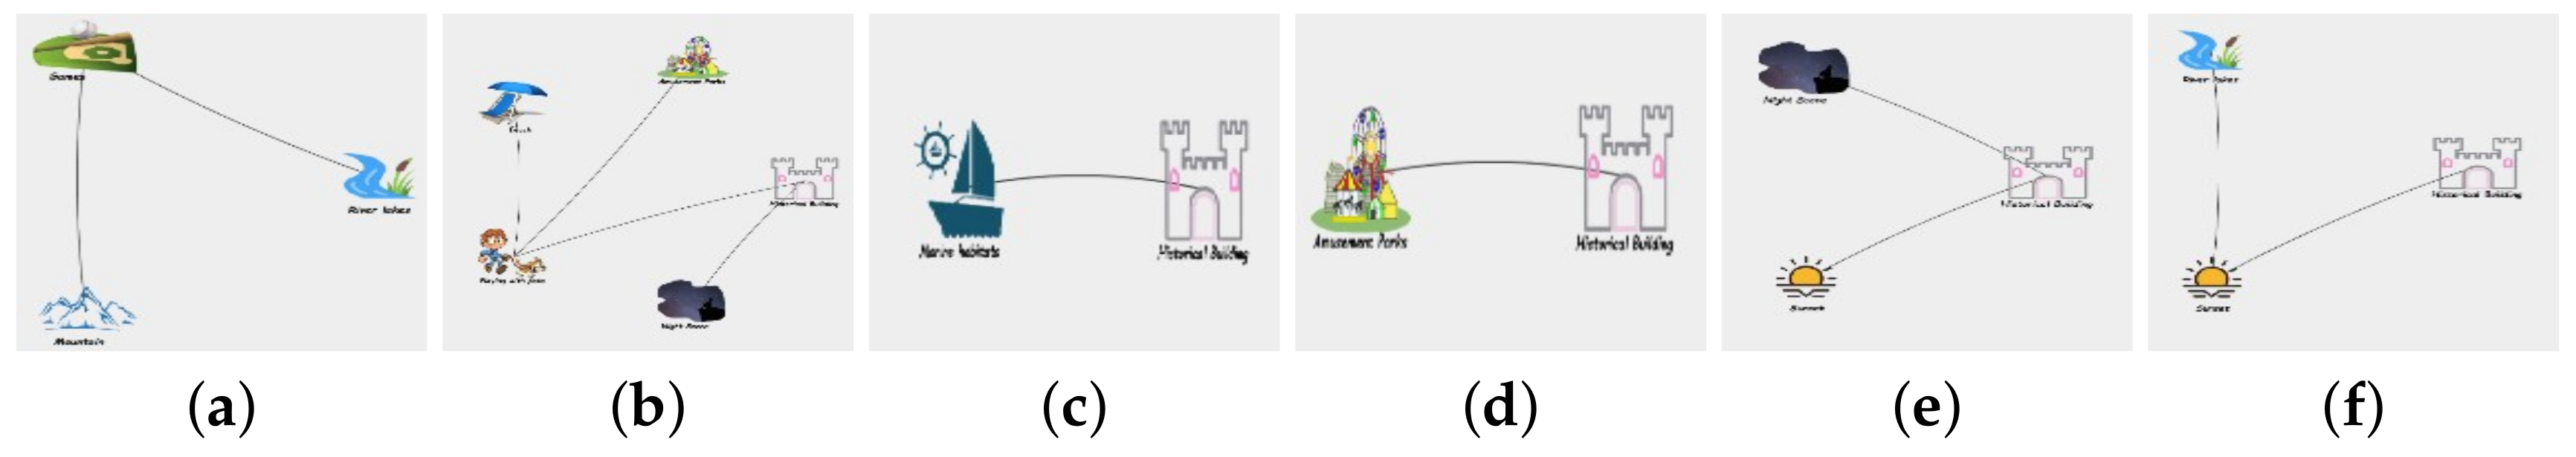
4.3. Effectiveness Analysis of LPaMI Using Graph Pattern Mining

We use the INRIA Holidays dataset for effectiveness analysis of LPaMI. This dataset contains various images and we consider them as photographs taken by a user during his/her holiday period. To mine the patterns, we utilise gSpan, Gaston, kFISM, and GRAMI. Recall that gSpan, Gaston, and kFISM operate on the graph database, whereas GRAMI mines the patterns from the cumulated graph. Furthermore, kFISM also requires an input about the size of the pattern (number of nodes in a subgraph) to return. So, we can observe a slight variation in the results by the said algorithm.
On obtaining the results from gSpan and Gaston, we observe that gSpan outputs large numbers of patterns whereas Gaston only outputs maximal frequent patterns which are fewer in number. Hence, the output of Gaston is more meaningful for learning the lifestyle patterns and behaviour of the user. For a lower minimum support threshold like 10%, we observe that there are some common patterns found by both of the algorithms (as shown in Figure 10 and Figure 11). However, the output of Gaston contains only maximal frequent patterns which are not found by gSpan. Furthermore, the number of nodes in such patterns is normally greater than for gSpan, hence providing us with more useful information about the travelling patterns. Figure 12, Figure 13, Figure 14 and Figure 15 further show the results for minimum support thresholds of 20% and 30%, respectively, for both of the algorithms.
In contrast to gSpan and Gaston, kFISM facilitates learning lifestyle patterns in the form of subgraphs of certain sizes by imposing restrictions on the size of the patterns. In this way, it can serve to analyse the patterns containing certain specific nodes. The patterns of size 2, for instance, show many results with the node “historical building” as displayed in Figure 16. We find that there are many visits to historical places after a variety of activities like visits to the beach and amusement parks, playing with pets, and enjoying night scenes. By further detailed analysis of the results of increasing sizes, we find that this image collection is heavily dominated by trips to historical places, as demonstrated in Figure 17, Figure 18 and Figure 19. This helps us to learn the travelling behaviour of the user; the user pays a visit to a historical place after a visit to almost every other type of place i.e., every alternative trip of the user is towards a historical place. Therefore, we find the effectiveness of kFISM in real life to be really useful. gSpan, on the other hand, outputs all the frequent subgraph patterns, which may be larger in number. Hence, it may be hard to interpret the results of a real-life scenario like that of LPaMI. Gaston produces only the maximal frequent patterns; hence their numbers are fewer than those of gSpan. However, it outputs patterns similar to those of gSpan at a higher threshold. On the other hand, by setting patterns of certain sizes, kFISM gives us more flexibility to learn lifestyle patterns with a detailed focus.
We use the GRAMI algorithm to mine frequent subgraph patterns from the cumulated graph. We adjust the frequency to be 2, 3, 4 and observe the results in Figure 20, Figure 21 and Figure 22. Frequency 2 means that the subgraph occurred at least twice in the cumulated graph. Such output by GRAMI demonstrates the frequent behaviour of the user towards obeying certain lifestyle patterns.
Discussion on the Results: We now discuss how the obtained result/output of LPaMI reveals the lifestyle patterns encapsulated in the photograph collections of a user. We understand that the existence/analysis of lifestyle is learned through obtained patterns which contain certain types of nodes and their frequent occurrences with the other nodes. It should be noted that we aggregate and represent similar types of places like historical venues with a unique same label. Hence, we find only one type of node, which basically encapsulates multiple related places.
Based on the obtained results, we observe that almost all of the results contain the node referring to a historical place, which is connected to various other types of nodes like visits to the park, playing with pets, enjoying night scenes, and so on. Such connectivity of nodes demonstrates the travel pattern of the user and her interest towards the subject of history. The user pays many visits to such places and takes the photographs. By further focusing the patterns obtained from various algorithms, we find that most of the edges of the node showing historical places are with node types like night scenes, sunsets, playing with pets, and amusement parks. These patterns provide a hint with respect to the nature of travel/lifestyle of the user in that after some trips to historical places, the user spends some time with pets, and similarly visits some places to enjoy night scenes and sunsets. We find instances of the historical venue multiple times along with aforementioned types of nodes, therefore, they appear at different support thresholds.
Since our definition of lifestyle patterns (stated in the Introduction Section) corresponds to a frequent group of actions (travel to different places in the datasets used), this very aspect is also the focus of the utilised graph-mining algorithms like gSpan, Gaston, kFISM, and GRAMI. Hence, they rightly match with the anticipated outcomes of LPaMI. As a result of frequent visits to certain places, the utilised graph mining algorithms in LPaMI also reveal the corresponding patterns.

5. Related Works

In this section, we present a literature review of existing works related to various aspects of LPaMI.

5.1. Learning User’s Lifestyle Patterns via Smartphone Data

The MIT Technology Review reports 99.5% of newly created digital data remains unanalysed, as highlighted by Liew et al. in their study [27]. Motivated by this fact, there is a great need to make use of the digital data from various possible computational perspectives. Personal data collection in the smartphone of a user is one of the potential areas to focus on. This data can be mined to discover hidden knowledge patterns like frequent activities, etc. Therefore, LPaMI aims to mine the personal photograph collection available in the smartphone of a user to analyse his/her interests and likes. In this way, the deriving force behind the proposal of LPaMI is bi-folded: maximum utilisation of local resources (photograph collection in this case) to analyse personal lifestyle traits while preserving privacy and security. We now review some of the existing studies which use smartphone data for lifestyle analysis and show the uniqueness of our proposal.
Lane et al. [28] present a smartphone app, BeWell, that tracks the activities of a user which impact physical, social, and mental wellbeing, namely sleep, physical activity, and social interactions. They concurrently monitor multiple dimensions (e.g., sleep patterns, social interaction, and physical activity), representing a more complete picture of the user’s overall wellbeing. For this purpose, they use multiple sensors available in smart-like accelerometers, digital compasses, gyroscopes, GPSs, microphones, and cameras. Similarly, Fahim et al. [29] utilise a smartphone to track sedentary lifestyle in daily routine. The authors propose helping ordinary persons to monitor their lifestyles in a proactive manner. For this purpose, they rely on the accelerometer sensor available in a smartphone to sense the motion patterns of a user. In another study [30], they also focus on learning the sedentary behaviour of a person through the smartphone. In this study, they utilise the audio sensor of smartphone in addition to the accelerometer. Similarly, we find Raghu et al. [31] develop a method to assess daily living patterns using a smartphone equipped with microphones and inertial sensors. They fuse the information retrieved from various sensors of a smartphone and present a computationally light-weight algorithm to identify various high level activities or lifestyle patterns of a user. Wang et al. [32] propose a smartphone app, called StudentLife, that evaluates the impact of the workload on stress, sleep, activity, mood, sociability, and mental well-being of students on a daily and weekly basis. StudentLife makes use of MobileEMA, which is an ecological momentary assessment (EMA) component available for android and iPhone, to examine the behaviour of the student’s mental state across the defined study period. In a similar manner, Xiang Sheng et al. [33] propose a smartphone sensing app (called LIPS), to learn the lifestyles of a user. Their idea is to leverage multiple sensors on a smartphone to obtain a comprehensive view of the context (such as location, local weather, activities etc.) of a mobile user over a long period, and to find out what a mobile user likes to do (characterisation) and what she/he will do next (prediction) based on the collected sensor data about the places of interest (PoIs). We find that the idea of LIPS is similar to our idea of LPaMI, however, we go few steps ahead and mine the patterns using graph-based approach to learn the interactions among different actions performed or places visited in a sequence. We understand that all the aforementioned studies are quite useful. However, they rely on multiple sensory data sources. On the other hand, we only focus on the photo collection to model the lifestyle data. Therefore, by imposing a lesser dependency on the available resources, we aim to retrieve maximum information. We accept the fact that only relying on the photographs collection for lifestyle analysis may not be accurate and detailed enough for different application areas, however, we aim to design a light-weight application that is purely a reflection of the interests of a smartphone user.
The above-mentioned studies consider various sensors. However, smartphone cameras and wearable cameras have also been utilised for lifestyle data analysis. Gupta et al. [7] use the smartphone camera to observe the daily eating patterns of various individuals. The authors argue that food diary and food frequency questionnaires are typically used to learn food eating patterns. However, they cannot focus on learning daily eating pattern data and its frequent variations. Therefore, many researchers are developing methods to collect evidence-based and time-stamped ingestion data and to analyse it for daily patterns of eating and fasting. Hence, camera phones are increasingly being used in nutritional studies. In another study, Doherty et al. [8] focus on the use of a wearable camera in the healthcare domain. The authors state that these devices can be worn all day and automatically record images from a first-person point of view, requiring no intervention or attention from the subject or the researcher. In this case, one of the most mature visual lifelogging devices is Microsoft’s SenseCam, a wearable camera. All the above mentioned studies are very useful for lifestyle analysis, however, the uniqueness of our proposal lies in its graph-based modelling. Modelling data as a graph preserves an order and shows relationships between different actions performed, hence, the output is more meaningful.
We find that Apple [34] provides a machine learning framework, Core ML, to develop apps for iPhone and iPads. Core ML helps to develop various apps for vision aspects (like face tracking, face detection, landmarks, text detection, and so on.) and natural language processing applications (like language identification, tokenisation, lemmatisation, part of speech, and named entity recognition.) In particular, Core ML provides various ready-to-use models like SqueezeNet, ResNet50, Places205-GoogLeNet, and so on. The models like SqueezeNet and ResNet50 detect the dominant objects present in an image from a set of 1000 categories such as trees, animals, food, vehicles, people, and more. On the other hand, Places205-GoogLeNet is very similar to what we propose in LPaMI in that it detects the scene of an image from 205 categories such as airport terminals, bedrooms, forests, coasts, and more. Hence, we find that our idea of LPaMI is a practical step towards learning the lifestyle behaviour of a smartphone user since we further make use of the detected scenes (OOIs in our case) for pattern searches. Apple claims that the app development and mobile data remain secure as the Core ML models run on the device so data does not need to leave the device to be analysed. That is also the aim of LPaMI: use of minimum (one-dimensional) local plus freely collected data in the smartphone.
We understand that the above cited studies may be providing more information about the lifestyle patterns of a smartphone user as compared to our proposed approach in LPaMI. However, our aim is to design an app which is light-weight in terms of using the minimum possible resources (only the photograph collection in this case) which are obtained without spending extra effort on data collection. Photograph collection is one such resource established in a smartphone, which does not require any extra effort by the user and does show intrinsic likes and interests at the same time.

5.2. Recognizing OOIs

Scene recognition and understanding is one conventional issue in the field of computer vision and machine learning. The key to identifying a scene type is to obtain its global information, which shows higher-level semantics. The global information can be obtained using various approaches like in [35]. Numerous works have already been done for scene recognition from images. However, HOG [20] and SIFT [13] features are still considered as state-of-the-art, as they are able to extract the local shape information of the images. In [36], the authors proposed topic model-based scene recognition, which is able to obtain both global and local features of the images. Gradient orientation consistency (GOC) is also able to obtain the local information from the images, and was introduced in [37]. However, the GOC is inspired from LBP and HOG. The main benefit of the GOC feature is the insensitiveness to illumination variance. In [38], the authors presented census transform-based feature extraction from the scenes. Moreover, a co-occurrence modelling framework is proposed in [39] to recognise the scenes, where multiple features are integrated in the semantic space. In our work, we also utilise state-of-the-art approaches to recognise OOIs with high accuracy.

5.3. Graph Modelling

LPaMI models the OOI data in the form of a graph to make use of graph pattern mining techniques. We observe that there exist many studies which also propose use of different data modelling strategies. For example, Ceccaroni et al. [40] obtained profile information initially from the user to analyse activity actions. The studies by Castillo et al. [41], Lee et al. [42], and Sebastia et al. [43] are also some examples in which the system is built by the combination of agents that corresponds to different operational components such as the user interface, preference and interest elicitation module, analysis and matching module, and route planning along with its generation module. Ant colony optimisation is used by Lee et al. [42] in the design of a route recommendation system that incorporates users. Optimal coverage of the attractions along a route is obtained here by approximating a solution of a travelling salesman problem by an autonomous entity set representing the ants that globally and indirectly communicate through pheromone mediation. These existing studies mine activity patterns based on statistics or sequential pattern models. However, these models are limited in their functionalities in that the statistics-based model cannot reflect all activity sequences and the sequential-pattern model can mine only daily activity patterns. On the other hand, our graph-based approach is very flexible in terms of supporting different types of graph mining algorithms.
We observe that Lee [44] proposed a graph-based approach to model and index video data. For this purpose, a a new graph-based video data structure is proposed, called the Spatio-Temporal Region Graph (STRG), which represents spatio-temporal features and the relationships among the video objects. The STRG is then used for various tasks like detecting object graph and background graph to facilitate searching process. Hence, we find that there exist some works which model video data in the form of a graph (where graph modelling from images can be considered as its simplest implementation) for certain tasks.

5.4. Graph Pattern Mining

Frequent subgraphs are patterns that have repeated or multiple instances within the given graph data. Frequent subgraph mining discovers common substructures which are used for data analysis, including graph classification, clustering, and indexing. For instance, this can be useful to find the association between chemical elements common to several chemical molecules or discovering frequent patterns in social networks to understand the functioning of society or the dissemination of diseases.
There exist numerous benefits of frequent subgraph mining (FSM), so many works have been proposed. They are divided into two categories: FSM on transactional graph data, and on a single graph. The transactional case allows the input as a set of small graphs, where each graph represents a transaction. A subgraph is frequent if it exists in at least t transactions, where t is a user-defined threshold. Some of the representative works in this domain are AGM [45], gSpan [23], CloseGraph [46], SPIN [47], Gaston [24], and Mofa [46]. On the other hand, in case of a single large graph, a subgraph is frequent if it has at least t appearances. The studies like SIGRAM [48], GREW [49], and GRAMI are some of the known studies. Since our aim is to utilise different pattern mining algorithms to learn lifestyle behaviour, we just provide a bird’s eye view of various algorithms in this section. Interested readers can refer to [50] for detailed study.

6. Conclusions

In this paper, we present LPaMI, which is an application to mine the lifestyle behaviour of a person from the photograph collection in his/her smartphone. It is a common practice to take photographs of things/places of interest. Therefore, we utilise this user data in order to learn lifestyle patterns. In this way, there is no dependency on external data sources or utilities. The uniqueness of our proposal lies in the graph-based modelling of related entities extracted from the photographs to make the data applicable for various graph pattern mining algorithms. We understand that the proposed model of LPaMI does not introduce any breach of privacy, as personal image data is kept with the user of the application and is locally mined for behaviour learning. Hence, LPaMI can be used as a plug-in for various services like recommendation systems. In the future, we plan to develop a smartphone application for LPaMI to directly operate on the existing photograph collections of users in smartphones.

Acknowledgments

This research was supported by the MSIT (Ministry of Science and ICT), Korea, under the Grand Information Technology Research Center support program (IITP-2017-2015-0-00742) supervised by the IITP(Institute for Information & communications Technology Promotion) and the MSIT(Ministry of Science and ICT), Korea, under the ITRC (Information Technology Research Center) support program(IITP-2017-2013-0-00717)supervised by the IITP(Institute for Information & communications Technology Promotion).

Author Contributions

Young-Koo Lee played the key role during the discussions to improve quality of this work; Kifayat Ullah Khan was the main idea provider and in-charge of the manuscript; Aftab Alam worked on the data migration phase of the manuscript; Batjargal Dolgorsuren worked in the graph modelling phase of the manuscript; Md Azher Uddin worked on the image processing phase of the manuscript; Muhammad Umair did the implementation of the manuscript; Uijeong Sang helped in the idea development and contributed during the development; Van T.T. Duong worked on the pattern mining phase; Weihua Xu worked in image processing phase of the manuscript.

Conflicts of Interest

The authors declare no conflict of interest.

References

  1. Rashidi, P.; Cook, D.J. Mining and monitoring patterns of daily routines for assisted living in real world settings. In Proceedings of the 1st ACM International Health Informatics Symposium, Arlington, VA, USA, 11–12 November 2010; pp. 336–345. [Google Scholar]
  2. Frey, R.M.; Xu, R.; Ilic, A. Reality-mining with smartphones: Detecting and predicting life events based on app installation behavior. In Proceedings of the International Conference on Information Systems (ICIS 2015), Fort Worth, TX, USA, 13–16 December 2015. [Google Scholar]
  3. Do, T.M.T.; Blom, J.; Gatica-Perez, D. Smartphone usage in the wild: A large-scale analysis of applications and context. In Proceedings of the 13th International Conference on Multimodal Interfaces, Alicante, Spain, 14–18 November 2011; pp. 353–360. [Google Scholar]
  4. LiKamWa, R.; Liu, Y.; Lane, N.D.; Zhong, L. Moodscope: Building a mood sensor from smartphone usage patterns. Proceeding of the 11th Annual International Conference on Mobile Systems, Applications, and Services, Taipei, Taiwan, 25–28 June 2013; pp. 389–402. [Google Scholar]
  5. Srinivasan, V.; Moghaddam, S.; Mukherji, A.; Rachuri, K.K.; Xu, C.; Tapia, E.M. Mobileminer: Mining your frequent patterns on your phone. In Proceedings of the 2014 ACM International Joint Conference on Pervasive and Ubiquitous Computing, Seattle, WA, USA, 13–17 September 2014; pp. 389–400. [Google Scholar]
  6. Xu, R.; Frey, R.M.; Fleisch, E.; Ilic, A. Understanding the impact of personality traits on mobile app adoption–Insights from a large-scale field study. Comput. Hum. Behav. 2016, 62, 244–256. [Google Scholar] [CrossRef]
  7. Gupta, N.J.; Kumar, V.; Panda, S. A camera-phone based study reveals erratic eating pattern and disrupted daily eating-fasting cycle among adults in India. PLoS ONE 2017, 12, e0172852. [Google Scholar] [CrossRef] [PubMed]
  8. Doherty, A.R.; Hodges, S.E.; King, A.C.; Smeaton, A.F.; Berry, E.; Moulin, C.J.; Lindley, S.; Kelly, P.; Foster, C. Wearable cameras in health. Am. J. Prev. Med. 2013, 44, 320–323. [Google Scholar] [CrossRef] [PubMed]
  9. Zheng, D.; Hu, T.; You, Q.; Kautz, H.A.; Luo, J. Towards Lifestyle Understanding: Predicting Home and Vacation Locations from User’s Online Photo Collections. In Proceedings of the 9th International AAAI Conference on Web and Social Media, Oxford, UK, 26–29 May 2015; pp. 553–561. [Google Scholar]
  10. Lim, K.H.; Wang, X.; Chan, J.; Karunasekera, S.; Leckie, C.; Chen, Y.; Tan, C.L.; Gao, F.Q.; Wee, T.K. PersTour: A Personalized Tour Recommendation and Planning System. In Proceedings of the 27th ACM Conference on Hypertext and Social Media (HT’16), Halifax, NS, Canada, 13–16 July 2016. [Google Scholar]
  11. Korakakis, M.; Mylonas, P.; Spyrou, E. Xenia: A context aware tour recommendation system based on social network metadata information. In Proceedings of the 2016 11th International Workshop on Semantic and Social Media Adaptation and Personalization (SMAP), Thessaloniki, Greece, 20–21 October 2016; pp. 59–64. [Google Scholar]
  12. Spyrou, E.; Mylonas, P. A survey on Flickr multimedia research challenges. Eng. Appl. Artif. Intell. 2016, 51, 71–91. [Google Scholar] [CrossRef]
  13. Lowe, D.G. Distinctive image features from scale-invariant keypoints. Int. J. Comput. Vis. 2004, 60, 91–110. [Google Scholar] [CrossRef]
  14. Philbin, J.; Chum, O.; Isard, M.; Sivic, J.; Zisserman, A. Object retrieval with large vocabularies and fast spatial matching. In Proceedings of the IEEE Conference on Computer Vision and Pattern Recognition (CVPR’07), Minneapolis, MN, USA, 17–22 June 2007; pp. 1–8. [Google Scholar]
  15. Perronnin, F.; Liu, Y.; Sánchez, J.; Poirier, H. Large-scale image retrieval with compressed fisher vectors. In Proceedings of the 2010 IEEE Conference on Computer Vision and Pattern Recognition (CVPR), San Francisco, CA, USA, 13–18 June 2010; pp. 3384–3391. [Google Scholar]
  16. Gong, Y.; Wang, L.; Guo, R.; Lazebnik, S. Multi-scale orderless pooling of deep convolutional activation features. In European Conference on Computer Vision; Springer: Berlin, Germany, 2014; pp. 392–407. [Google Scholar]
  17. Krizhevsky, A.; Sutskever, I.; Hinton, G.E. Imagenet classification with deep convolutional neural networks. In Proceedings of the Advances in Neural Information Processing Systems, Lake Tahoe, NV, USA, 3–6 December 2012; pp. 1097–1105. [Google Scholar]
  18. Oquab, M.; Bottou, L.; Laptev, I.; Sivic, J. Learning and transferring mid-level image representations using convolutional neural networks. In Proceedings of the IEEE Conference on Computer Vision and Pattern Recognition, Columbus, OH, USA, 23–28 June 2014; pp. 1717–1724. [Google Scholar]
  19. Kobayashi, T.; Otsu, N. Image feature extraction using gradient local auto-correlations. In European Conference on Computer Vision; Springer: Berlin, Germany, 2008; pp. 346–358. [Google Scholar]
  20. Dalal, N.; Triggs, B. Histograms of oriented gradients for human detection. In Proceedings of the IEEE Computer Society Conference on Computer Vision and Pattern Recognition (CVPR 2005), San Diego, CA, USA, 20–26 June 2005; Volume 1, pp. 886–893. [Google Scholar]
  21. Geurts, P.; Ernst, D.; Wehenkel, L. Extremely randomized trees. Mach. Learn. 2006, 63, 3–42. [Google Scholar] [CrossRef]
  22. Edgar, R.C. MUSCLE: Multiple sequence alignment with high accuracy and high throughput. Nucleic Acids Res. 2004, 32, 1792–1797. [Google Scholar] [PubMed]
  23. Yan, X.; Han, J. gSpan: Graph-based substructure pattern mining. In Proceedings of the 2002 IEEE International Conference on Data Mining (ICDM 2003), Maebashi City, Japan, 9–12 December 2002; pp. 721–724. [Google Scholar]
  24. Nijssen, S.; Kok, J.N. The gaston tool for frequent subgraph mining. Electron. Notes Theor. Comput. Sci. 2005, 127, 77–87. [Google Scholar] [CrossRef]
  25. Duong, V.T.; Khan, K.U.; Jeong, B.S.; Lee, Y.K. Top-k frequent induced subgraph mining using sampling. In Proceedings of the Sixth International Conference on Emerging Databases: Technologies, Applications, and Theory, Jeju, Korea, 17–19 October 2016; pp. 110–113. [Google Scholar]
  26. Elseidy, M.; Abdelhamid, E.; Skiadopoulos, S.; Kalnis, P. Grami: Frequent subgraph and pattern mining in a single large graph. Proc. VLDB Endow. 2014, 7, 517–528. [Google Scholar] [CrossRef]
  27. Ur Rehman, M.H.; Liew, C.S.; Wah, T.Y.; Shuja, J.; Daghighi, B. Mining personal data using smartphones and wearable devices: A survey. Sensors 2015, 15, 4430–4469. [Google Scholar] [CrossRef] [PubMed]
  28. Lane, N.D.; Mohammod, M.; Lin, M.; Yang, X.; Lu, H.; Ali, S.; Doryab, A.; Berke, E.; Choudhury, T.; Campbell, A. Bewell: A smartphone application to monitor, model and promote wellbeing. In Proceedings of the 5th International ICST Conference on Pervasive Computing Technologies for Healthcare, Dublin, Ireland, 23–26 May 2011; pp. 23–26. [Google Scholar]
  29. Fahim, M.; Khattak, A.M.; Chow, F.; Shah, B. Tracking the sedentary lifestyle using smartphone: A pilot study. In Proceedings of the 18th International Conference on Advanced Communication Technology (ICACT), PyeongChang, Korea, 31 January–3 February 2016; pp. 296–299. [Google Scholar]
  30. Fahim, M.; Khattak, A.M.; Baker, T.; Chow, F.; Shah, B. Micro-context recognition of sedentary behaviour using smartphone. In Proceedings of the 2016 Sixth International Conference on Digital Information and Communication Technology and Its Applications (DICTAP), Konya, Turkey, 21–23 July 2016; pp. 30–34. [Google Scholar]
  31. Ganti, R.K.; Srinivasan, S.; Gacic, A. Multisensor fusion in smartphones for lifestyle monitoring. In Proceedings of the 2010 International Conference on Body Sensor Networks (BSN), Singapore, 7–9 June 2010; pp. 36–43. [Google Scholar]
  32. Wang, R.; Chen, F.; Chen, Z.; Li, T.; Harari, G.; Tignor, S.; Zhou, X.; Ben-Zeev, D.; Campbell, A.T. StudentLife: Assessing mental health, academic performance and behavioral trends of college students using smartphones. In Proceedings of the 2014 ACM International Joint Conference on Pervasive and Ubiquitous Computing, Seattle, WC, USA, 13–17 September 2014; pp. 3–14. [Google Scholar]
  33. Sheng, X.; Tang, J.; Wang, J.; Li, T.; Xue, G.; Yang, D. LIPS: Lifestyle Learning via Mobile Phone Sensing. In Proceedings of the 2016 IEEE Global Communications Conference (GLOBECOM), Washington, DC, USA, 4–8 December 2016; pp. 1–7. [Google Scholar]
  34. Core ML, A Machine Learning Framework in iOS. Available online: https://developer.apple.com/machine-learning/ (accessed on 25 October 2017).
  35. Torralba, A. Contextual priming for object detection. Int. J. Comput. Vis. 2003, 53, 169–191. [Google Scholar] [CrossRef]
  36. Li, H.; Wang, F.; Zhang, S. Global and local features based topic model for scene recognition. In Proceedings of the 2011 IEEE International Conference on Systems, Man, and Cybernetics (SMC), Anchorage, AK, USA, 9–12 October 2011; pp. 532–537. [Google Scholar]
  37. Gao, C.; Sang, N.; Huang, R. Spatial multi-scale gradient orientation consistency for place instance and Scene category recognition. Inf. Sci. 2016, 372, 84–97. [Google Scholar] [CrossRef]
  38. Wu, J.; Rehg, J.M. Where am I: Place instance and category recognition using spatial PACT. In Proceedings of the IEEE Conference on Computer Vision and Pattern Recognition (CVPR 2008), Anchorage, AK, USA, 23–28 June 2008; pp. 1–8. [Google Scholar]
  39. Song, X.; Jiang, S.; Herranz, L.; Kong, Y.; Zheng, K. Category co-occurrence modeling for large scale scene recognition. Pattern Recognit. 2016, 59, 98–111. [Google Scholar] [CrossRef]
  40. Ceccaroni, L.; Codina, V.; Palau, M.; Pous, M. PaTac: Urban, ubiquitous, personalized services for citizens and tourists. In Proceedings of the Third International Conference on Digital Society (ICDS’09), Cancun, Mexico, 1–7 February 2009; pp. 7–12. [Google Scholar]
  41. Castillo, L.; Armengol, E.; Onaindía, E.; Sebastiá, L.; González-Boticario, J.; Rodríguez, A.; Fernández, S.; Arias, J.D.; Borrajo, D. SAMAP: An user-oriented adaptive system for planning tourist visits. Expert Syst. Appl. 2008, 34, 1318–1332. [Google Scholar] [CrossRef]
  42. Lee, C.S.; Chang, Y.C.; Wang, M.H. Ontological recommendation multi-agent for Tainan City travel. Expert Syst. Appl. 2009, 36, 6740–6753. [Google Scholar] [CrossRef]
  43. Sebastia, L.; Giret, A.; Garcia, I. A Multi Agent Architecture for Tourism Recommendation. In Trends in Practical Applications of Agents and Multiagent Systems; Springer: Berlin, Germany, 2010; pp. 547–554. [Google Scholar]
  44. Lee, J. A graph-based approach for modeling and indexing video data. In Proceedings of the 8th IEEE International Symposium on Multimedia (ISM’06), San Diego, CA, USA, 11–13 December 2006; pp. 348–355. [Google Scholar]
  45. Inokuchi, A.; Washio, T.; Motoda, H. An apriori-based algorithm for mining frequent substructures from graph data. In Proceedings of the 4th European Conference on Principles of Data Mining and Knowledge Discovery, Lyon, France, 13–16 September 2000; pp. 13–23. [Google Scholar]
  46. Bifet, A.; Holmes, G.; Pfahringer, B.; Gavaldà, R. Mining frequent closed graphs on evolving data streams. In Proceedings of the 17th ACM SIGKDD International Conference On Knowledge Discovery and Data Mining, San Diego, CA, USA, 21–24 August 2011; pp. 591–599. [Google Scholar]
  47. Huan, J.; Wang, W.; Prins, J.; Yang, J. Spin: Mining maximal frequent subgraphs from graph databases. In Proceedings of the 10th ACM SIGKDD International Conference On Knowledge Discovery and Data Mining, Seattle, WA, USA, 22–25 August 2004; pp. 581–586. [Google Scholar]
  48. Kuramochi, M.; Karypis, G. Finding frequent patterns in a large sparse graph. Data Min. Knowl. Discov. 2005, 11, 243–271. [Google Scholar] [CrossRef]
  49. Kuramochi, M.; Karypis, G. Grew-a scalable frequent subgraph discovery algorithm. In Proceedings of the 4th IEEE International Conference on Data Mining (ICDM’04), Brighton, UK, 1–4 November 2004; pp. 439–442. [Google Scholar]
  50. Jiang, C.; Coenen, F.; Zito, M. A survey of frequent subgraph mining algorithms. Knowl. Eng. Rev. 2013, 28, 75–105. [Google Scholar] [CrossRef]
Figure 1. Pipeline of Lifestyle Pattern MIning (LPaMI) from personal image collections in a smartphone.
Applsci 07 01200 g001
Figure 2. Screen-shots of our prototype application LPaMI. (a) Image selection; (b) Graph modelling; (c) Lifestyle pattern mining; (d) Lifestyle pattern search.
Applsci 07 01200 g002
Figure 3. Formal modelling practices to interact with LPaMI. (a) Sequence diagram; (b) Use case diagram; (c) Data flow diagram.
Applsci 07 01200 g003
Figure 4. Discovering patterns in the photo collection of a smartphone.
Applsci 07 01200 g004
Figure 5. (a) Proposed method for object of interest (OOI) recognition; (b) Spatial auto-correlation patterns of ( p , p + a 1 ) . GLACs: gradient local auto-correlations.
Applsci 07 01200 g005
Figure 6. (a) Raw data processing steps; (b) Raw text sample data stored in HDFS. RDD: resilient distributed dataset.
Applsci 07 01200 g006
Figure 7. Modelling scene data from photographs in a graph format. Each node is an OOI, like a visited place, and an edge denotes two places visited one after the other.
Applsci 07 01200 g007
Figure 8. Evaluation of the utilised classifiers for scene/OOI recognition. (a) Performance of the proposed method on the 8-Scene dataset using 5-fold cross-validation; (b) Comparison between GLACs and other feature extraction techniques on the 8-Scene dataset using 5-fold cross-validation; (c) Comparison of the proposed approach with existing works for the 8-scene dataset using 5-fold cross-validation; (d) Performance of the proposed approach on the INRIA Holiday dataset using 5-fold cross-validation. GLACs: gradient local auto-correlations; HOG: histogram of oriented gradients; SIFT: scale-invariant feature transform; GOC: gradient orientation consistency.
Applsci 07 01200 g008
Figure 9. Performance analysis of the data migration phase with various datasets, using different combinations of numbers of worker nodes in Spark against varying data migration modes.
Applsci 07 01200 g009
Figure 10. Effectiveness analysis of LPaMI-Gaston with minimum support 10%.
Applsci 07 01200 g010
Figure 11. Effectiveness analysis of LPaMI-gSpan with minimum support 10%.
Applsci 07 01200 g011
Figure 12. Effectiveness analysis of LPaMI-Gaston with minimum support 20%.
Applsci 07 01200 g012
Figure 13. Effectiveness analysis of LPaMI-gSpan with minimum support 20%.
Applsci 07 01200 g013
Figure 14. Effectiveness analysis of LPaMI-Gaston with minimum support 30%.
Applsci 07 01200 g014
Figure 15. Effectiveness analysis of LPaMI-gSpan with minimum support 30%.
Applsci 07 01200 g015
Figure 16. Effectiveness analysis of the LPaMI-k-FISM algorithm to mine the subgraph with size 2.
Applsci 07 01200 g016
Figure 17. Effectiveness analysis of the LPaMI-k-FISM algorithm to mine the subgraph with size 3.
Applsci 07 01200 g017
Figure 18. Effectiveness analysis of the LPaMI-k-FISM algorithm to mine the subgraph with size 4.
Applsci 07 01200 g018
Figure 19. Effectiveness analysis of the LPaMI-k-FISM algorithm to mine the subgraph with size 5.
Applsci 07 01200 g019
Figure 20. Effectiveness analysis of LPaMI-GRAMI to mine the subgraph with frequency 2.
Applsci 07 01200 g020
Figure 21. Effectiveness analysis of LPaMI-GRAMI to mine the subgraph with frequency 3.
Applsci 07 01200 g021
Figure 22. Effectiveness analysis of LPaMI-GRAMI to mine the subgraph with frequency 4.
Applsci 07 01200 g022
Table 1. List of algorithms along with their features.
InputAlgorithmOutput
Set of sequence graphsgSpanFrequent patterns
Set of sequence graphsGastonMaximal frequent patterns
Set of sequence graphskFISMTop-k frequent induced patterns
Cumulated graphGRAMIFrequent patterns
Table 2. List of datasets used.
NameInstancesClass LabelsType of Evaluation
8-Scenes (8S) [1]26888accuracy of processing OOIs
INRIA Holidays [2]9008accuracy of processing OOIs, pattern mining
Memetracker (MT)13 M execution time of data migration phase
Brightkite (BK)4.4 M execution time of data migration phase
Twitter7 (T7)15 M execution time of data migration phase
Table 3. Operations performed during data migration phase from the disk to persistent storage.
Data Migration ModeSet of Operations
Type-11. Data loading
2. Mapping data attributes
3. In-memory SQL operations
4. Data cleaning
5. Save to the HDFS in Parquet file format
6. Data normalisation
Type-21. Data loading
2. Mapping data attributes
3. In-memory SQL operations
4. Data cleaning
5. Save to the HDFS in Parquet file format
6. Data normalisation
Type-31. Data loading
2. Mapping data attributes
3. In-memory SQL operations
4. Data cleaning
5. Save to the HDFS in Parquet file format
6. Data normalisation

