Effect of Various Silica Nanofluids: Reduction of Fines Migrations and Surface Modification of Berea Sandstone


Institute of Petroleum Technology, University of Stavanger, 4036 Stavanger, Norway
*
Author to whom correspondence should be addressed.
Appl. Sci. 2017, 7(12), 1216; https://doi.org/10.3390/app7121216
Submission received: 7 November 2017
/
Revised: 20 November 2017
/
Accepted: 21 November 2017
/
Published: 24 November 2017
(This article belongs to the Special Issue Nanotech for Oil and Gas)
Abstract
:This work is aimed at addressing surface modification of berea sandstone by silica nanofluids (NFs). Three types of nanofluids were used: silica/deionized water (DIW), silica in DIW with a stabilizer fluid (3-Mercaptopropyl Trimethoxysilane) and sulfonate-functionalized silica in DIW. Core flood studies showed that application of silica nanoparticles (NPs) improved water injectivity in sandstone. The change in the measured zeta potential indicated surface modification of sandstone by application of NPs. Computation of the surface forces showed that the modified berea sandstone has net attractive potential with fines (obtained from water/rock interaction) leading to reduction of fines migration, hence improvement of water injectivity. It was also observed that the silica NPs have greater affinity to adhere/adsorb on quartz surfaces than kaolinite in berea core. This was confirmed by scanning electron microscope imaging and isothermal static adsorption tests. Although the stabilizing of NFs almost did not reduce the fine migration, as was qualitatively indicated by the pressure drop, it enhanced the NPs adsorption on the minerals as obtained by isothermal static adsorption tests. The reduction of fines migration due surface modification by silica NP suggests that NPs can be utilized to overcome the problem of formation damage induced during low salinity flooding in sandstones.
1. Introduction
With the rising demand for energy and fast approaching end of the era of easy oil, the petroleum industry today faces unique challenges especially in the Enhanced Oil Recovery (EOR) area. Over the past decade, many of researches have focused on application of nanoparticles (NP) as an EOR method. The small size and high specific surface area of NP offer unique advantages like allowing them to easily pass through pore throats and enhanced interaction in the reservoir even with a small quantity of NP. NPs have displayed the potential to act as surface modifiers that could alter the wettability and reduce the oil/water interfacial tension leading to better mobility of the oil phase [1,2,3,4,5,6,7] and reduce fines migration [8,9]. Recent laboratory studies have indicated that nanofluids, which are colloidal dispersions of NP in a dispersing medium have the potential to increase oil recovery [2,7,10,11,12,13]. Over the past decade, special focus has been directed to silica NPs for EOR due to its hydrophilic nature and ease of functionalization.
Hofmann et al. [14] postulated the presence of silanol groups (Si–OH) on the silica surface that causes its hydrophilicity, wherein silanol groups act as binding sites (H+ bonds) for water. The protonation and deprotonation of these silanol groups determine the surface charge of silica NP and the extent of the repulsive energy that keep them dispersed in the solution [15]. For two-phase systems like nanofluids, one of the most important issue is their colloidal stability i.e., no or low rate of agglomeration of the NP. Stability of NP is essential for injection application as EOR agents in oil reservoirs. Agglomeration can lead to blockage of micro channels, formation damage, hinder the transport of NP and the displacing fluid in the reservoir. The main strategies utilized to enhance the stability of nanofluids are: (a) electrostatic stabilization [16] (by varying pH of the nanofluids); (b) employing stabilizing fluid/surfactant [17]; (c) surface modification [18,19] (functionalization) of the NP. Electrostatic stabilization (for example by varying the pH) is expected to fail in the presence of dissolved salts in brines. Electrolytes could destabilize particle dispersions by compressing the electrical double layer. As the electrolyte concentration increases, the energy barrier is lowered to an extent that kinetic energy of particles dictates the kinetics of particle aggregation [15]. For a given surface charge, the aggregation of silica NP occurs because of the presence of electrolytes. Metin, Lake, Miranda and Nguyen [15] studied the effect of pH, cation type, temperature and electrolyte concentration on the stability of silica dispersions. They found that pH does not have a significant effect on stability in the presence of electrolytes. Although addition of stabilizing fluid can be an effective way to enhance the dispersion of NP, it might cause several problems like foaming and stabilizing fluid adsorption in porous media leading to loss of the intended stabilization. Surface modification of NPs (functionalized NP) is a promising approach towards increasing the stability of NPs. Yang and Liu [18] presented a work on the synthesis of functionalized silica (SiO2) NP by grafting silanes directly to the surface of silica NP which showed good stability. Weston, Jentoft, Grady, Resasco and Harwell [19] systematically performed surface modification of silica with different silanes and studied the wettability of the modified nanomaterials. However, it is essential to examine the effect these stabilization strategies have on the effectiveness of the nanofluids.
For stable nanofluids, which can be utilized as EOR agents, an important factor is the interaction of the NPs with the rock minerals over a wide area of the reservoir. When NPs are introduced into porous medium, different processes may take place such as adsorption, desorption, blocking, transportation and aggregation [4]. The adsorption phenomenon could be reversible (desorption) during the transport of NP in the porous medium [20]. Blocking of pore throats may occur if the NPs aggregate in situ so that their size exceeds the pore throat [21]. The transportation of the NP through the porous medium is governed by advection-diffusion and hydrodynamics once equilibrium adsorption and desorption has been achieved.
This work is aimed at studying the surface modification of berea sandstone by the adsorption/adhesion of silica NPs. Arab and Pourafshary [8] and Arab, Pourafshary, Ayatollahi and Habibi [9] studied the surface modification of sandstone by NPs to reduce fines migration and colloid facilitated transport in porous medium modified by NPs. However, affinity of NPs towards major minerals present in sandstone, adsorption/adhesion of NPs in the porous medium and the influence of nanofluid stabilization on the in-situ surface modification has been addressed in this study. Three types of nanofluids containing silica, silica with a stabilizer (3-Mercaptopropyl Trimethoxysilane) and sulfonate-functionalized silica in deionized water (DIW) were investigated. Thus two stabilization methods: the use of stabilizing fluid and NP functionalization have been investigated. The dynamic adsorption/desorption of the NP was addressed by continuous monitoring of the pressure drop and analysing the effluents produced during injection of DIW into nanofluid modified berea, for produced NP and the stabilizing fluid concentration were determined. It was found that application of silica NP could improve water injectivity in the porous medium by reducing fine migration. Zeta potential measurements indicated surface modification of sandstone by application of silica NPs. Calculated surface forces showed that modified berea has net attractive potential with fines leading to reduction of fines migration, hence improvement of water injectivity. It was also observed that silica NP tend to preferentially adsorb/adhere on quartz as compared to kaolinite.
2. Materials and Methods
The silicon dioxide NP (637246 Aldrich) used in this study were acquired from Sigma Aldrich, Drammensveien, Oslo, Norway. As reported by manufacturer, the Silica NP had a primary particle size of 10–15 nm (spherical). The NP were dispersed in DIW and DIW containing 3-Mercaptopropyl Trimethoxysilane (MPTMS) as stabilizing fluid. MPTMS (175617 Aldrich) was also acquired from Sigma Aldrich. Berea sandstone (outcrops) cores used in this work were acquired from Koucurek Industries Inc., Caldwell, TX, USA. The properties and mineral composition of the used cores are listed in Table 1. Quartz (00653 Sigma-Aldrich) and kaolinite (03584 Sigma-Aldrich) mineral powders were acquired from Sigma Aldrich with chemical compositions: SiO2 and Al2O3∙2SiO2∙2H2O, respectively. The specific surface area of the mineral powders are 0.62 m2/g and 8.56 m2/g, respectively [22] previously determined by nitrogen adsorption.
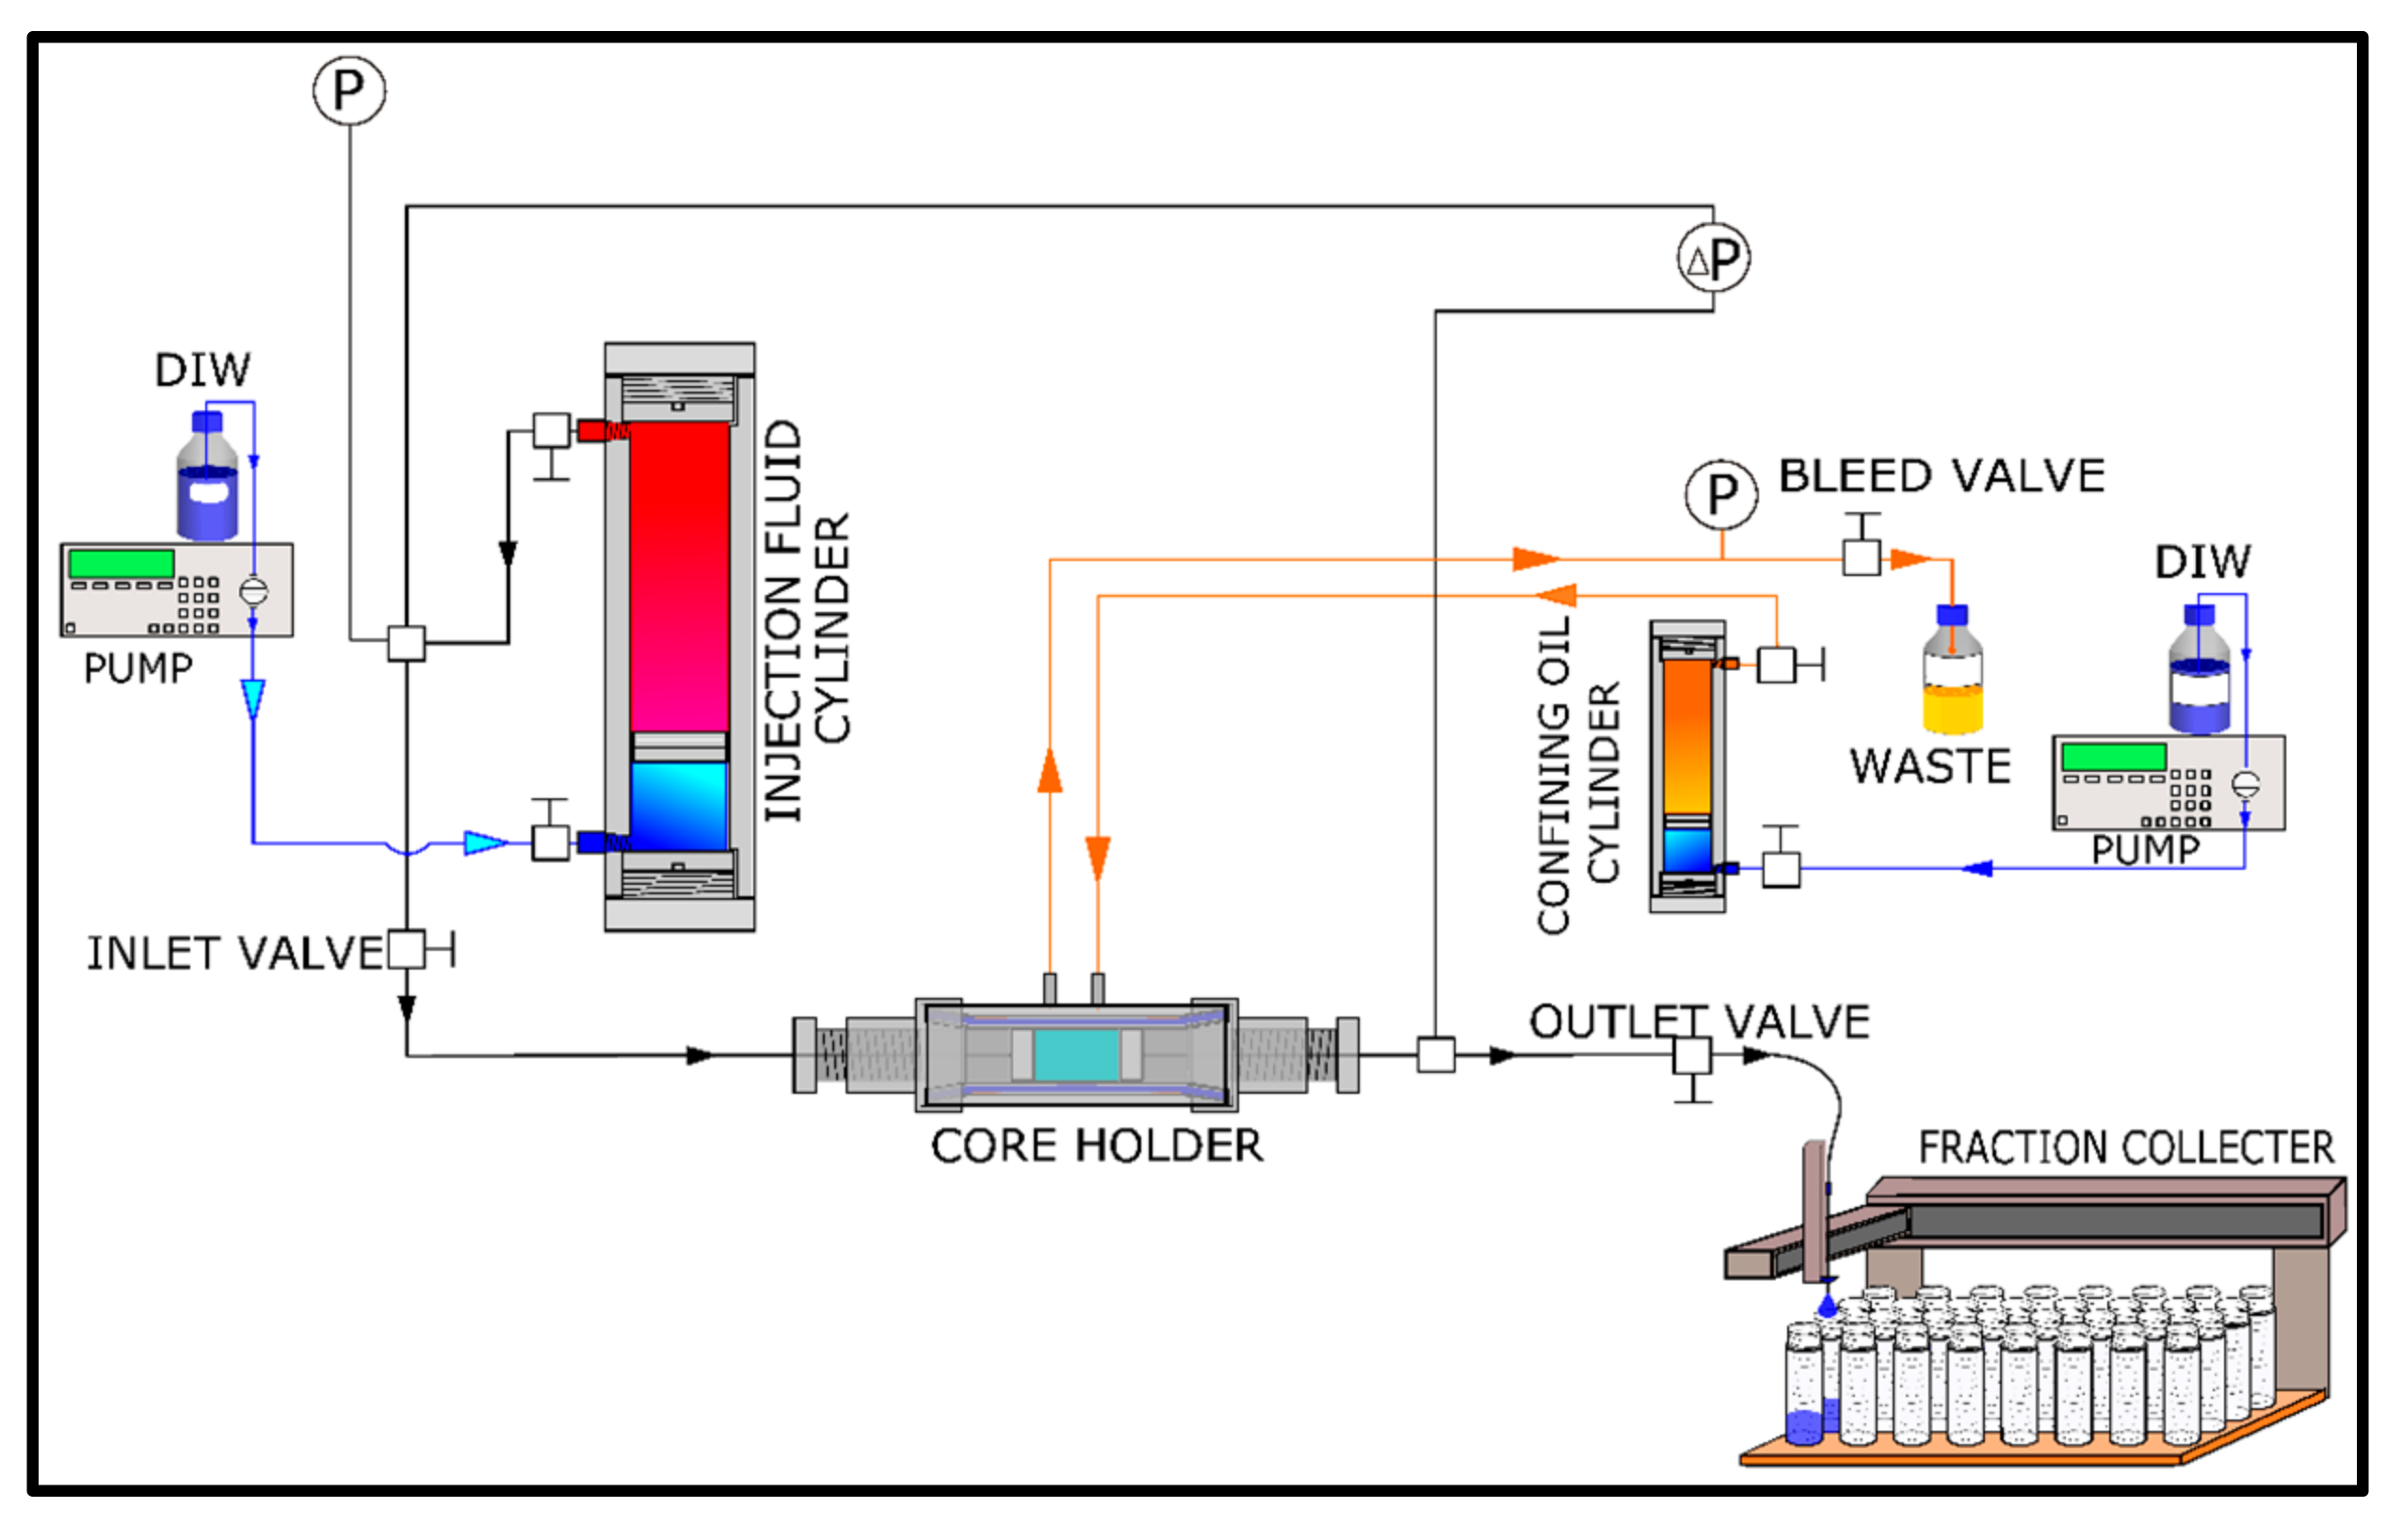
The nanofluid preparation was done using ultrasonic processor: UP400S (400 watts, 24 kHz) by Hielscher Ultrasonics. A TurbiScan Lab instrument by Formulaction Inc. (Worthington, OH, USA) was used to determine the stability and concertation of silica nanofluids. A dual beam UV/Vis spectrophotometer: UV 1700 PharmaSpec by Shimadzhu Corporation (Nakagyo-ku, Kyoto, Japan) was used to determine the concentration of the stabilizing fluids in the effluents. The particle size and zeta potentials of the NP in the prepared nanofluids were measured using a Zetasizer Nano ZSP from Malvern Instruments (Malvern, Worcestershire, UK). The zeta potential of the mineral powders was measured using an Acosustisizer II S/M Flow-through System by Colloidal Dynamics. Scanning Electron Microscope (SEM) imaging of the barea cores saturated with the nanofluids was performed on a SUPRA 35 VP instrument by Zeiss with an integrated energy-dispersive X-ray spectroscopy (EDX) analyzer by EDAX. Core flood studies were conducted to study the adsorption and transport of NP in the porous medium. A schematic of the core flood apparatus is shown in Figure 1. The setup consists of a core holder connected to a piston cylinder filled with injection fluid. The prepared core was wrapped in a plastic sleeve. The wrapped core with the plastic sleeve was inserted in a cylindrical rubber sleeve and loaded into the core holder. As shown in Figure 1, another pump and cylinder filled with confining oil (Tellus S2 V 32) was used for applying confining pressure. The outlet valve of the core was connected to automated liquid handler (GX-271 by Gilson Inc. Middleton, WI, USA) to collect the effluent at regular intervals. Pressure gauges are connected at the inlet and outlet valve to record the differential pressure drop across the core. The experimental methods used in in this study are explained in detail in the following sections.
2.1. Nanofluid Preparation
The NP were dispersed in deionized water (DIW) at a predetermined concentration using a magnetic stirrer at 500 rpm for 30 min. To loosen the agglomerates in the nanopowder and disperse it, probe sonication was applied using an ultrasonic processor. Sonication was performed for 120 min (50% amplitude and 0.5 pulse) with breaks every 15 min to avoid overheating. Mondragon et al. [23] observed that silica nanofluids prepared by dispersing the NP in DIW using an ultrasonic probe proved to be the most effective technique. Three types of nanofluids were prepared at varying concentrations of NP:
- Silica dispersed in DIW.
- Sulfonated silica dispersed in DIW (functionalized).
- Silica dispersed in DIW with MPTMS stabilizing fluid.
Two types of NP were used in this study: firstly, silica acquired from Sigma-Aldrich and surface modified NP. The modification procedure is described in the following section. The nanofluids of silica in DIW with MPTMS stabilizing fluid were prepared by dispersing the desired concentration of silica in DIW via ultrasonication. Thereafter, 1 g of MPTMS was added per 100 mL of the nanofluid under vigorous stirring. To avoid confusion in this text between NP and MPTMS concentration, NP concentration is always stated in g/L units and MPTMS concertation is always stated in g/100 mL units.
2.2. NP Functionalization
The aim of functionalization of silica was to increase the hydrophilicity and stability of the silica NPs. The grafting of silanes on NP leads to steric stabilization. The surface modification was performed based on the method described by Weston, Jentoft, Grady, Resasco and Harwell [19]. 10 g of silica NP was dispersed in 100 mL toluene by probe sonication. 5 g of MPTMS was added to the dispersed silica in toluene. The solution was stirred for 12 h at 35 °C. Particles were removed from the dispersion by centrifugation (7000 rpm for 10 min). Thereafter, the particles were washed 5 times with isopropyl alcohol, after each time, the fluids were centrifuged to separate the particles. The wash with isopropyl alcohol was done to remove excess silane/toluene and followed by washing twice with 70/30 (v/v) mixture of isopropyl alcohol and DIW. The NP were dried in a vacuum oven at 120 °C for 24 h. Thereafter, the thiol groups of MPTMS were oxidized based on the technique described by Oh et al. [24]: the dried NP were dispersed in a solution of 30% H2O2 and stirred at room temperature for 24 h. This results in the formation of sulfonic acid groups on the silica surface. The particles were then washed several times with water and dried. The sulfonic acid groups were converted into sodium sulfonate by dispersing the particles in 0.1 M solution of NaOH under continuous stirring for 24 h. The particles were washed and dried in a vacuum oven for 3 days at 35 °C. These surface modified NP are referred to as sulfonated NP.
2.3. Particle Size and Zeta Potential Measurement
The particle size and zeta potentials of the NP in the prepared nanofluids were measured using a Zetasizer Nano ZSP instrument based on the principle of Dynamic Light Scattering (DLS). The zeta potential of the mineral powders was determined by an Acosustisizer II S/M Flow-through System based on the principle of Electrostatic Attenuation (ESA). The measurement are listed in Table 2.
2.4. Introduction of Silica Nanofluids to the Porous Medium
Silica nanofluid was introduced into the berea sandstone core under vacuum with 1 pore volume of nanofluid (nanofluid slug), followed by injection of DIW to address the effects of NPs assisted surface modification. The produced effluents were analyzed and the differential pressure drop was recorded. The list of injection experiments conducted is shown in Table 3.
The core was dried in a vacuum oven at 100° for 24 h until its weight stabilizes. The dry weight, length and diameter was noted. The core was vacuum saturated with DIW and the pore volume (PV) of the core was calculated based on the saturated weight of the core. The core was loaded in a core holder and confining pressure of 25 bar was applied. DIW was injected at 0.3 mL/min (≈20 PV/day). Injection was performed at atmospheric pressure (no back pressure). Differential pressure drop across the core (dP) was recorded using Labview 7.1. Upon stabilization of dP, the core was removed from the holder and dried in a vacuum oven at 100 °C until the weight of the core becomes equal to dry core weight previously measured. Thereafter, the core was treated (vacuum saturated) with 1 PV of a particular nanofluid depending on the experiment and loaded in the core holder with the same inlet-outlet orientation as before. Post flush was performed by injecting DIW at 0.3 mL/min (≈20 PV/day). Produced effluent samples were collected and analyzed. In this part of the study, the effect of surface modification by the different nanofluids was analyzed. Also, the adsorption of NP and determination of possible absorption of the stabilizing fluid (MPTMS) in the berea sandstone cores was studied. The experiments are listed in Table 3. Two experiments performed with nanofluids containing MPTMS (Experiment 4 and 5 in Table 3) have been performed again (Experiment 7 and 8 in Table 3) to determine the repeatability of the results.
2.5. Nanofluid Stability and Determination of NP Concentration
The suspended NP in fluid have the tendency to aggregate due to the large surface area to volume ratio leading to high surface energy, hence they tend to aggregate to minimize the surface energy. The stability of the nanofluids was investigated. Measurement of transmissivity of nanofluids at different points (along the vertical height) in a sample is a method that addresses the uniformity of dispersion of the NP in the fluid. The used instrument was TurbiScan Lab by Formulaction Inc. The instrument measures, among other things, the % transmissivity with predetermined scanning time and duration. Uniform dispersion of the NP in a fluid, is indicated by stable transmissivity along the vertical length. The results for the prepared nanofluid showed that it was stable and uniformly dispersed for up to 24 h. In general, from this work it was found that the tested nanofluids were stable for about 24 h beyond which the settlement of particles could be visually observed. The nanofluid with sulfonated silica NP was the most stable. This nanofluid was stable for about one week. All the experiments were performed within 10 h to ensure that the experiments were within the stability period.
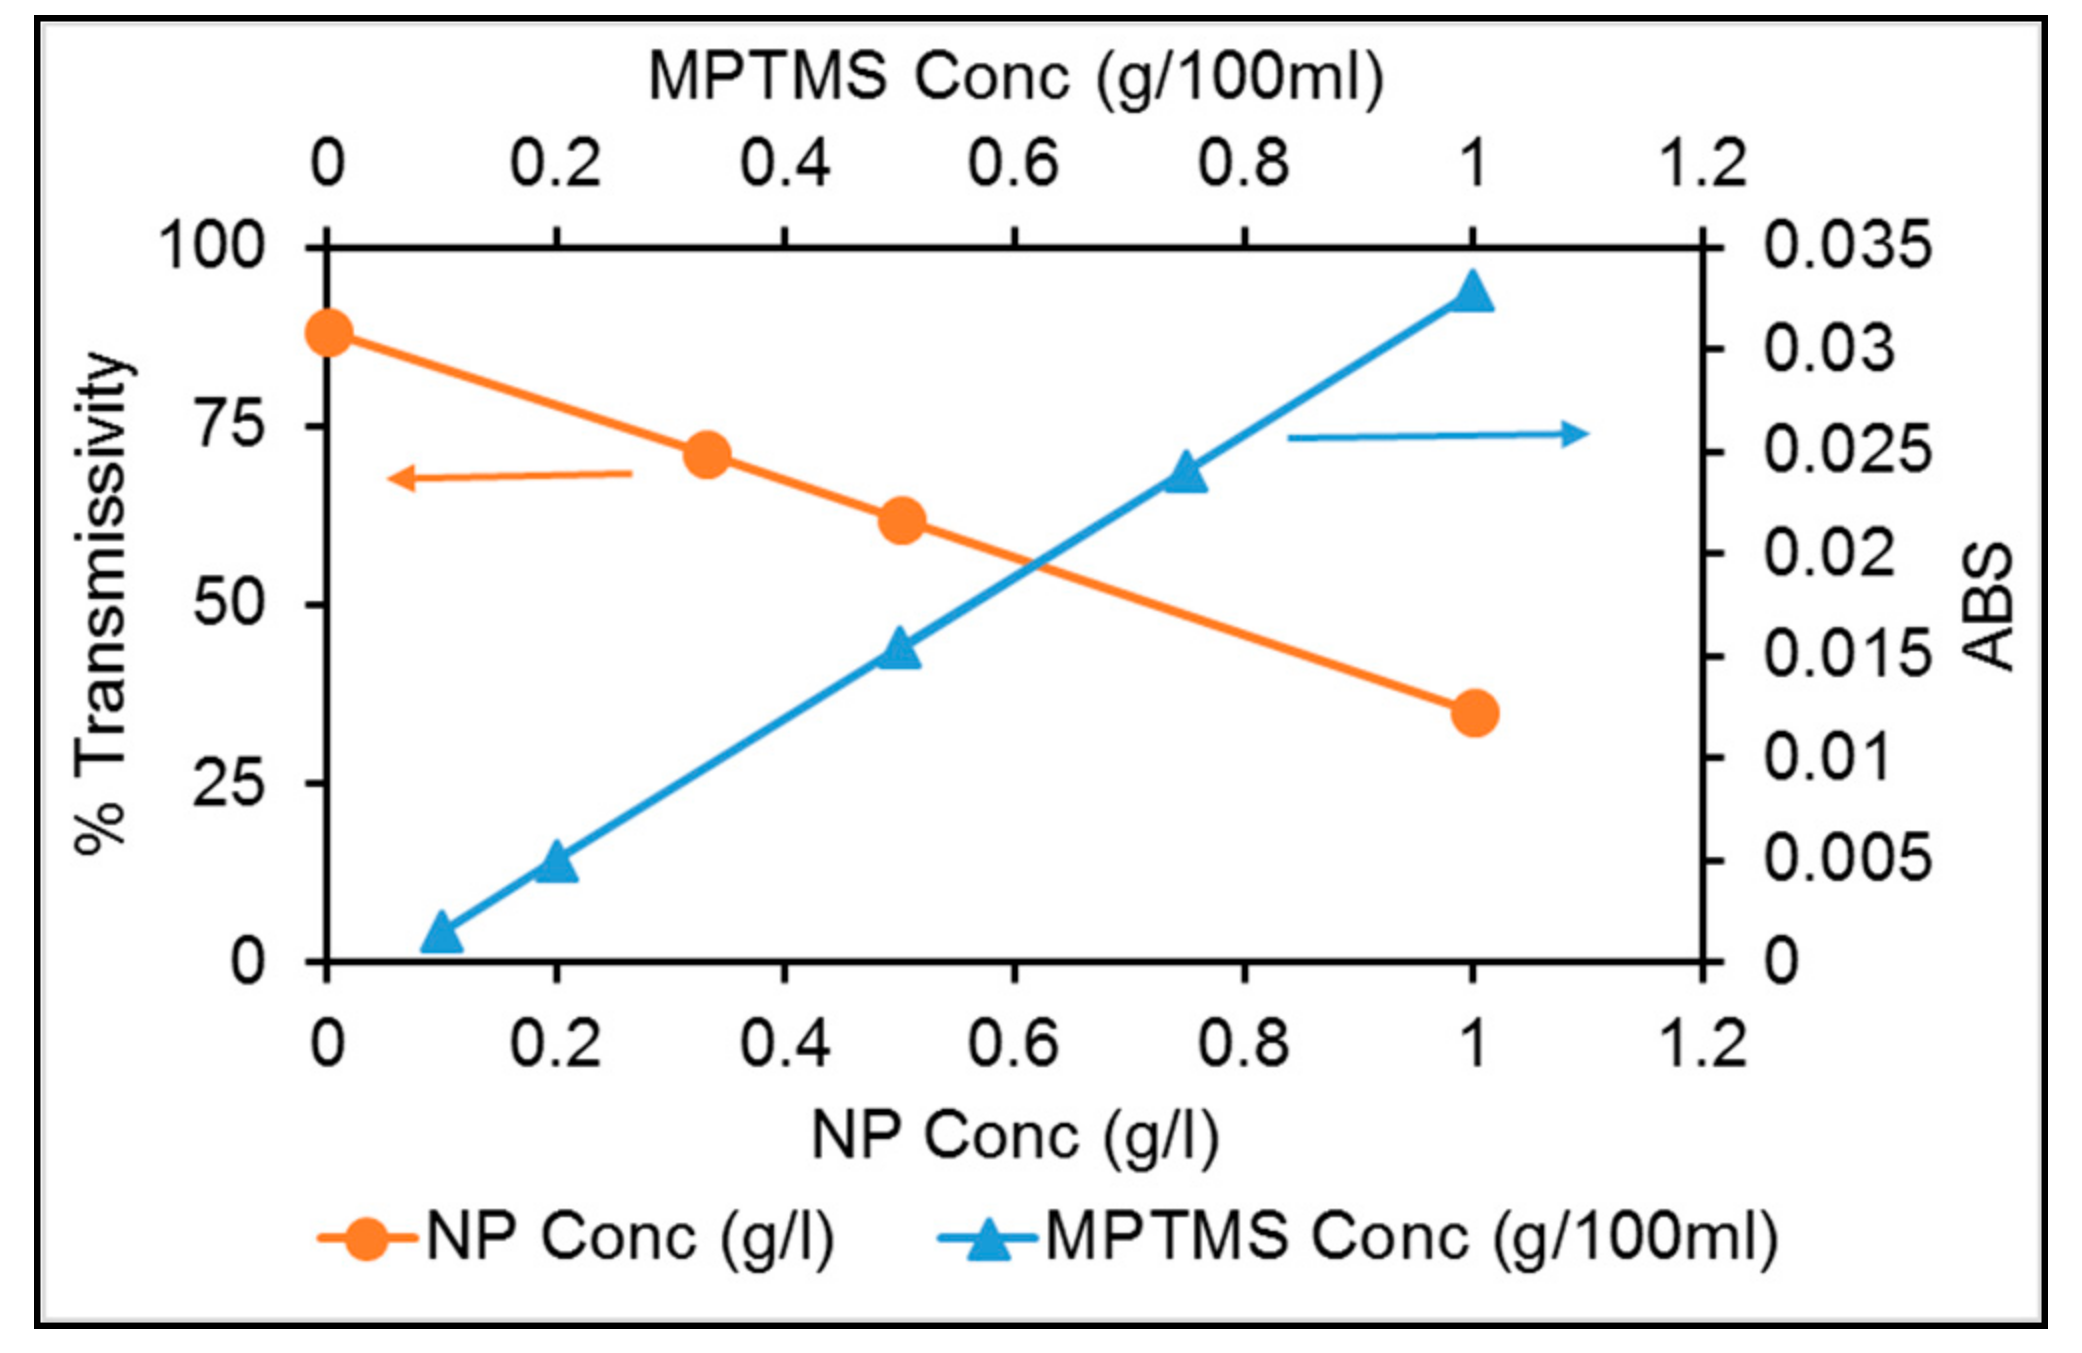
The effluent was analyzed for the concentrations of the NP and the stabilizing fluid. Transmissivity calibration curve (Figure 2) was constructed by dispersing NP in a corresponding fluid. In this case was done with deionized water (DIW) with different concentrations of NP. For example, the transmissivity measurement of the 1 g/L dispersion of bare silica in DIW was performed along the turbiscan tubes with sample height of 35 mm. The maximum transmissivity measured was 35.67%, the minimum was 34.87% and the mean transmissivity was 35.14%. This indicates that the prepared nanofluid prepared was uniformly dispersed. Further, the nanofluid was diluted to 0.5 g/L and 0.33 g/L NP concentration and the samples were placed in an ultrasonic bath for 1 h after which the transmissivity was measured. These measurements along with the transmissivity of DIW (no NP) was used to make the calibration curve shown in Figure 2. The calibration curve was used to determine the concentration of NP in effluent samples. For each nanofluid prepared for particular experiment, a calibration curve was constructed following the above process. The transmissivity of the effluent samples is measured and compared against the calibration curve to determine the concentration of the NP in the effluent. The total amount of NP adsorbed/retained in the core was calculated via mass balance of the amount of NP introduced (calculated from the pore volume of the core and the concentration of the nanofluid introduced in the core) into the porous medium and the amount of NP produced determined from the concentration and the volume of the effluents.
2.6. Determination of MPTMS Concentration in Effluent
As mentioned earlier the NP in the nanofluid tend to aggregate, which may lead to resisting the flow. Two strategies were employed to prevent/minimize the agglomeration of NP. Firstly, functionalization or surface modification of the NP. The second is by using a stabilizing fluid that keeps the NP suspended. Hendraningrat and Torsæter [11] employed Polyvinylpyrrolidone (PVP) at 1% weight concentration in the nanofluid as a stabilizer for silica based nanofluids. However, an important question that arises is the adsorption of the stabilizing fluid on the mineral during the injection that may take place. This changes the ratio between the fluid and NP, which may induce agglomeration of NP during the injection. In this study a method was developed to determine the adsorption of the stabilizing fluid in the rock during the injection. The method was based on mass balance calculation, where the effluent was analyzed by Ultraviolet light (UV). The used wavelength was 300 nm that gives adequate linear relationship between the absorption and concentration of MPTMS (stabilizing fluid). The constructed calibration curve was then used to estimate the loss in the mass balance i.e., related to the adsorbed MPTMS in the core. For each nanofluid containing MPTMS, calibration curve was constructed prior to the injection experiment by measuring the absorption in a dual beam UV/VIS spectrometer at wavelength 300 nm. Absorption of the MPTMS was measured referenced to DIW (with pH adjusted to 2 by dropwise addition of 0.1 M HCl). The removal of the NP from the effluent fluid was achieved by adjusting the pH of the effluent fluid to about 2, then centrifuging the fluid for 60 min at 10,000 rpm to promote the settling of NP. The absorption of the supernatant was determined. As an example, the UV/VIS calibration curve for 1 g/L nanofluid with 1 g/100 mL MPTMS is presented in Figure 3. In summary, after measuring the NPs concentration in the effluent samples through transmissivity measurements, the pH of the samples was then adjusted to 2 by dropwise addition of 0.1 M HCl followed by centrifuging for 60 min at 10,000 rpm. The absorption of supernatant was measured relative to a reference of DIW (pH adjusted to about 2) in the double beam UV/VIS spectrometer.
2.7. Isothermal Static Adsorption Experiments
Berea sandstone cores are composed mostly of quartz and kaolinite. Adsorption tests were run on samples of 0.15 g of the individual minerals separately. The mineral powder were dispersed in 30 mL of nanofluid (1 g/L in DIW), the mass ratio between the minerals and the NP was kept constant at 5:1 mineral/NP. The minerals were dispersed in the three types of nanofluids. The samples were agitated in a rotator agitator for 24 h at room temperature. Thereafter the samples were centrifuged at low speed (1000 rpm) for 10 min to promote the settling of mineral powders. The liquid was decanted and further centrifuged for 10 min. The transmissivity of the supernatant was measured. To establish base line, samples containing minerals only were prepared in similar manner and their transmissivity were measured. The baseline corrected transmissivity was used to determine the concentration of NP in the supernatant liquid. The adsorbed NP were calculated from the change in concentration, and the volume of the fluid. Based on the specific surface area of the mineral powders, the amount of NP (mg) adsorbed per unit surface area of the mineral powders was determined.
2.8. Surface Forces
The theory of surface forces has been utilized to characterize the inter-surface interaction between NP-mineral and fine-mineral based on the Derjaguin-Landau-Verwey-Overbeek (DLVO) theory. It describes the forces between charged surfaces interacting in a medium. The DLVO theory combines the effect of attraction due to van der Waals interaction and the electrostatic repulsion due to the double layer of counter ions around charged surfaces in a medium. Silica NP and fines have sizes in the order of 100–500 nm and 0.1–5 µm respectively. These are much smaller than the size the pore throats of the porous medium. Due to this size difference, the curvature of the mineral surfaces may be neglected and the interactions can be modelled as Sphere-Plate collector geometry [8,20,25,26,27]. The forces acting on a particle approaching a mineral surface are the sum of van der Waals attraction, electric double layer repulsion and Born repulsion.
where V is the potential of interaction as a function of separation distance (h) between the particle and the collector surface. The subscripts t, LVA, BR, EDLR denote total, London-van der Waal interaction, electric double layer interaction and Born Repulsion, respectively. The sign of the total interaction potential indicates attractive potential and repulsive potential for negative and positive signs respectively. The interaction potential can be represented in non-dimensional (ND) form as follows:
where kB is the Boltzmann constant (1.38 × 10⁻²³ J∙K−1) and T is temperature. In this study, all the experiments are conducted at room temperature hence T = 297 K. The contributions due to the different types of interactions in Equation (1) can be calculated as follows [8,25,26]:
where
And, ap is the particle radius (m). A132 is the Hamaker’s constant between the sphere and plate collector which is typically in the range of 10−19 J. This value of the Hamaker’s constant is based on the assumption that the van der Waals interactions occurs in vacuum and is not influenced by the presence of surrounding particles. Hence, to account of the intervening fluid and the surrounding particles, the Hamaker’s constant must be modified based on the Lifshitz theory [28]. Based on previous works which are in turn based on the expression for modified Hamaker’s constant developed by Israelachvili, the Hamaker’s constant in this study is taken to be equal to 10−21 J [8]. Also, ɛ0 is the permittivity of free space (8.854 × 10⁻¹² C2 J−1 m−1) and De is the dielectric constant of water equal to 78 [8,26]. κ is the inverse Debye length. For pure water used in this study, the inverse Debye length is equal to (9.6 × 10⁻⁷)−1 m−1 [8]. ζp and ζs are the surface potentials of the particles and the surface respectively which can be replaced by the zeta potential [26]. In Equation (5), σ is the atomic collision diameter and is equal to 0.5 nm [26]. The born repulsive potentials are formed when the particle approaches point of contact with the mineral resulting in overlap of electron clouds. Hence it is a short range interaction and thus calculated only when the distance of separation is less than 1 nm. For the various scenarios in this study, the zeta potentials have been experimentally measured. σ is the atomic collision diameter and is equal to 0.5 nm [26].
3. Results and Discussion
Injection experiments were performed with three kind of nanofluids: silica dispersed in DIW, silica dispersed in DIW containing MPTMS (1 g/100 mL) stabilizing fluid and sulfonated silica NP, dispersed in DIW. The effect of application (by vacuum treatment as outlined in Section 2.4) of each of these three nanofluids on berea sandstone are discussed in the following sections.
3.1. Unmodified Silica Nanofluids
Figure 3a compares effluent NP concentration profiles for cores treated with 1 PV of unmodified silica NP dispersed in DIW. It may be observed that for both 1 and 2.5 g/L, the majority of the NP seized to be produce at about 0.5 and 1 PV, respectively. Long tail in the effluent concentration profile was observed for 2.5 g/L. The percentage of NP adsorbed in the core (calculated from mass balance) as the post flush progressed is plotted in Figure 3b. The estimated adsorbed NP was higher for 2.5 g/L nanofluid (88.82%) as compared to that for 1 g/L (85.82%) nanofluid. The recorded pressure drop during these experiments is shown in Figure 4.
Figure 4 shows that after treatment with 1 and 2.5 g/L silica NP, pressure drop profiles were lower than that for the initial DIW injection in unmodified berea. It may be observed that the entry resistance post application of NP was lower than the initial DIW injection as indicated by pressure peak of about 0.12 and about 0.09 bar, for initial DIW injection and post flush respectively (treatment with 2.5 g/L of nanofluid). It may be concluded from Figure 4a,b that using 1 g/L concertation leads to greater improvement in water injectivity, as there is a greater difference between the pressure drop for initial DIW injection and post flush after treatment with NP. Fines refer to solid mineral particles of the sandstone minerals that lose their coherence due to fluid/mineral interaction and become mobilized with the flowing fluids. In this study, the injection has been performed with DIW wherein the salinity is almost zero hence lower than the Critical Salt Concentration (CSC), which may induce interaction with minerals and produces fines that migrate and increase resistance to flow which may ultimately lead to formation damage [29]. Arab and Pourafshary [8] studied the applicability of NP for mitigating fine migration in engineered porous media (glass beads). In their work, they studied the application of different metal oxide NP to mitigate fines formation. They found that treating the porous medium with NP caused reduction in concentration of fines particles in the effluents as compared to untreated porous media. For example, they observed that treating the porous medium with silica dispersed in DIW led to approximately 20% reduction in effluent fines concentration as compared to the reference case. They observed that porous media that has been treated with NPs acts as a strong adsorbent of fine particles [9]. Huang et al. [30] made a similar observation wherein they observed that for a sand pack treated with NP, the pressure drop across the sand pack was 10% lower than of sand pack without NP, showing an improvement in water injectivity.
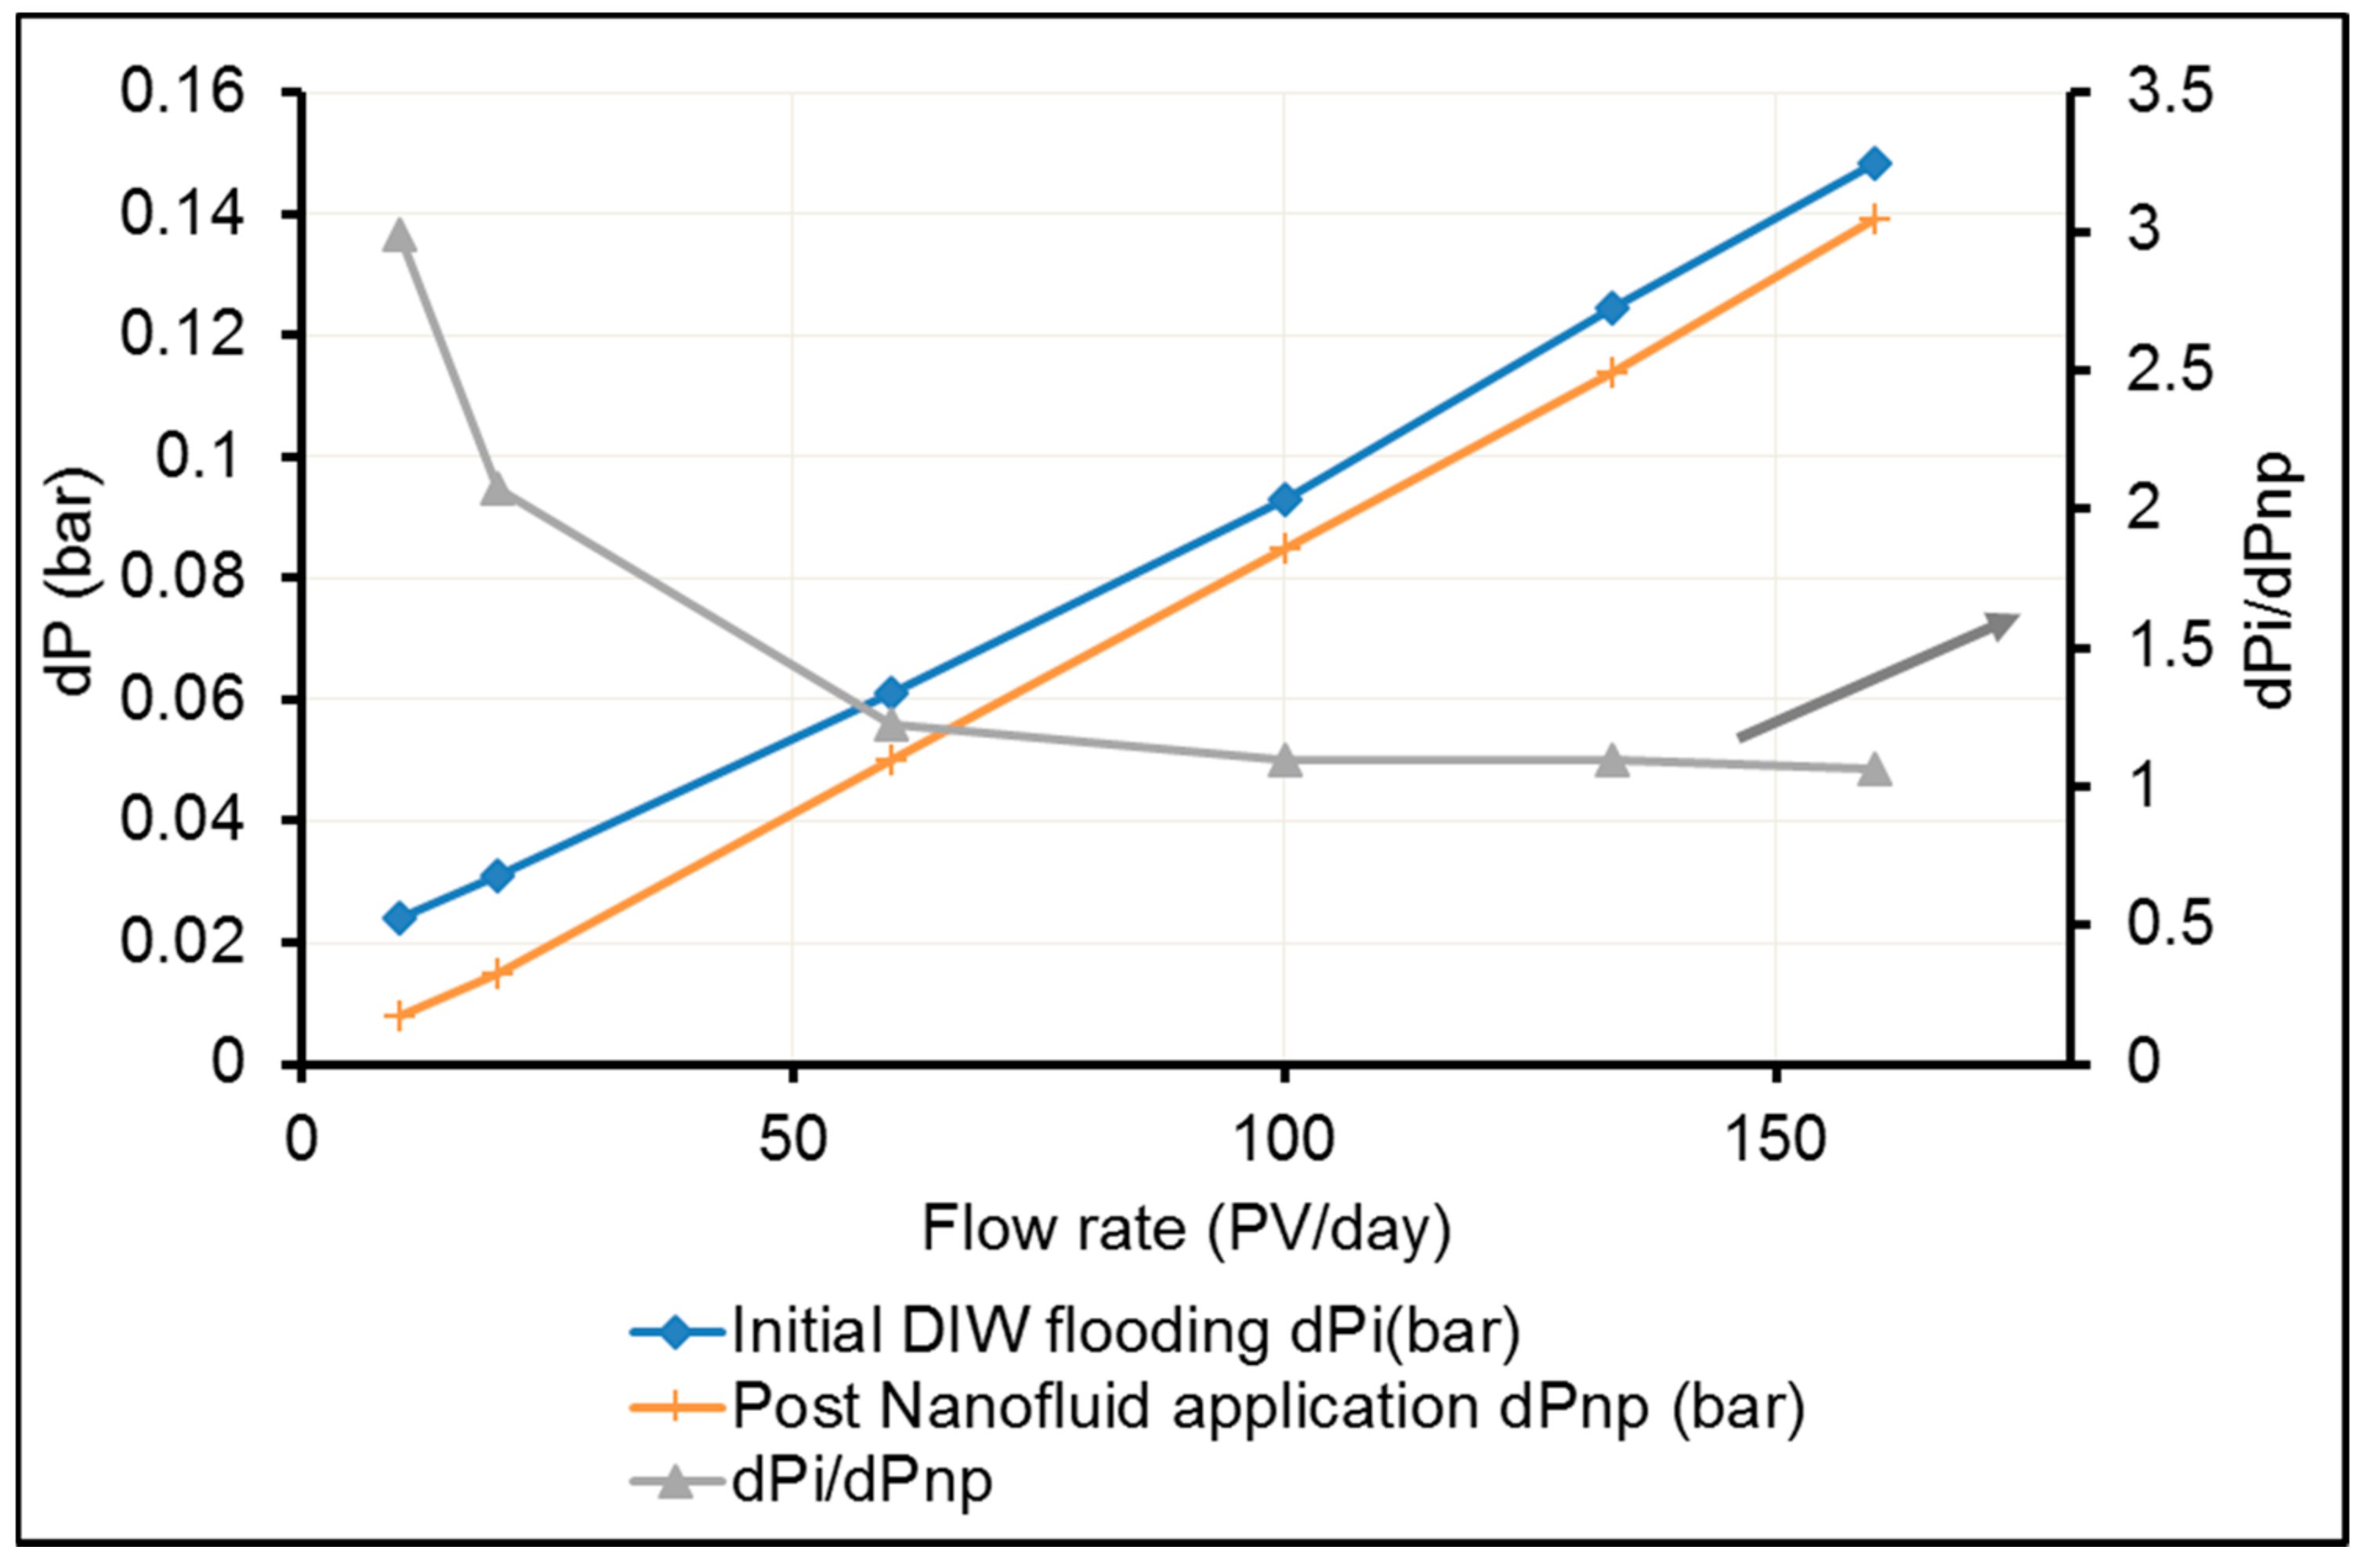
To verify the effects of surface modification by silica NP and the associated improvement in water injectivity, experiment 3 was performed. In experiment 3, the core sample was initially injected with DIW and the stabilized dP was recorded at increasing injection rates. Thereafter the core was unloaded from the core holder, vacuum dried and treated with 1 g/L silica nanofluid prepared in DIW and flushed again with DIW. Stabilized dP was recorded at increasing injection rates. The results are shown in Figure 5. It can be observed that saturating the porous medium with the NP improves the water injectivity as indicated by lower dP (≈8%) during DIW flooding post treatment with NP. To quantify the remedial effect due to the application of NP, the ratio of the original pressure drop during the initial DIW injection (dPi) to the pressure drop post treatment with nanofluid (dPnp) was estimated and plotted as shown in Figure 5. As shown, the nanofluid treatment was effective at lower injection rates i.e., in reducing pressure drop. This is perhaps due to the increased hydrodynamic forces at higher injection rates.
SEM imaging was performed to better visualize the adsorption/adhesion of the NP on the rock surface, which causes the surface modification. Figure 6a shows the image of a slice of berea core. It may be noted that the slice of the berea core was cleaved along the injection plane approximately at the center of the core. The integrated energy-dispersive X-ray spectroscopy (EDX) analyzer was used to identify the minerals. As shown, the core was mainly composed of well-defined quartz with some feldspar and the core has pores of several microns in diameter. Another cylindrical slice of berea, which was vacuum saturated with 1 g/L silica NP in DIW, was examined using SEM (Figure 6b). The adsorbed/adhered NP were clearly shown on the mineral’s surface. Figure 6c is a magnified view where the adsorbed/adhered silica NP is present. The adhered NP were in successive layers. This might be due to the drying effect. In addition, it was observed that most of the NP adsorption/adhesion was on quartz mineral. This is an interesting observation and static adsorption test and quantitative analysis based on the theory of surface forces were performed to further test this observation. Thus, it may be concluded that the NP adhere/adsorb on the minerals and this perhaps causes in situ surface modification. This modified surface is more effective at capturing fines, which can cause injectivity improvement. To test this, the theory of surface forces was utilized to quantify the interaction between the fines and the mineral before and after the application of NP. This addressed in a latter section.
3.2. Nanofluids Stabalized by MPTMS
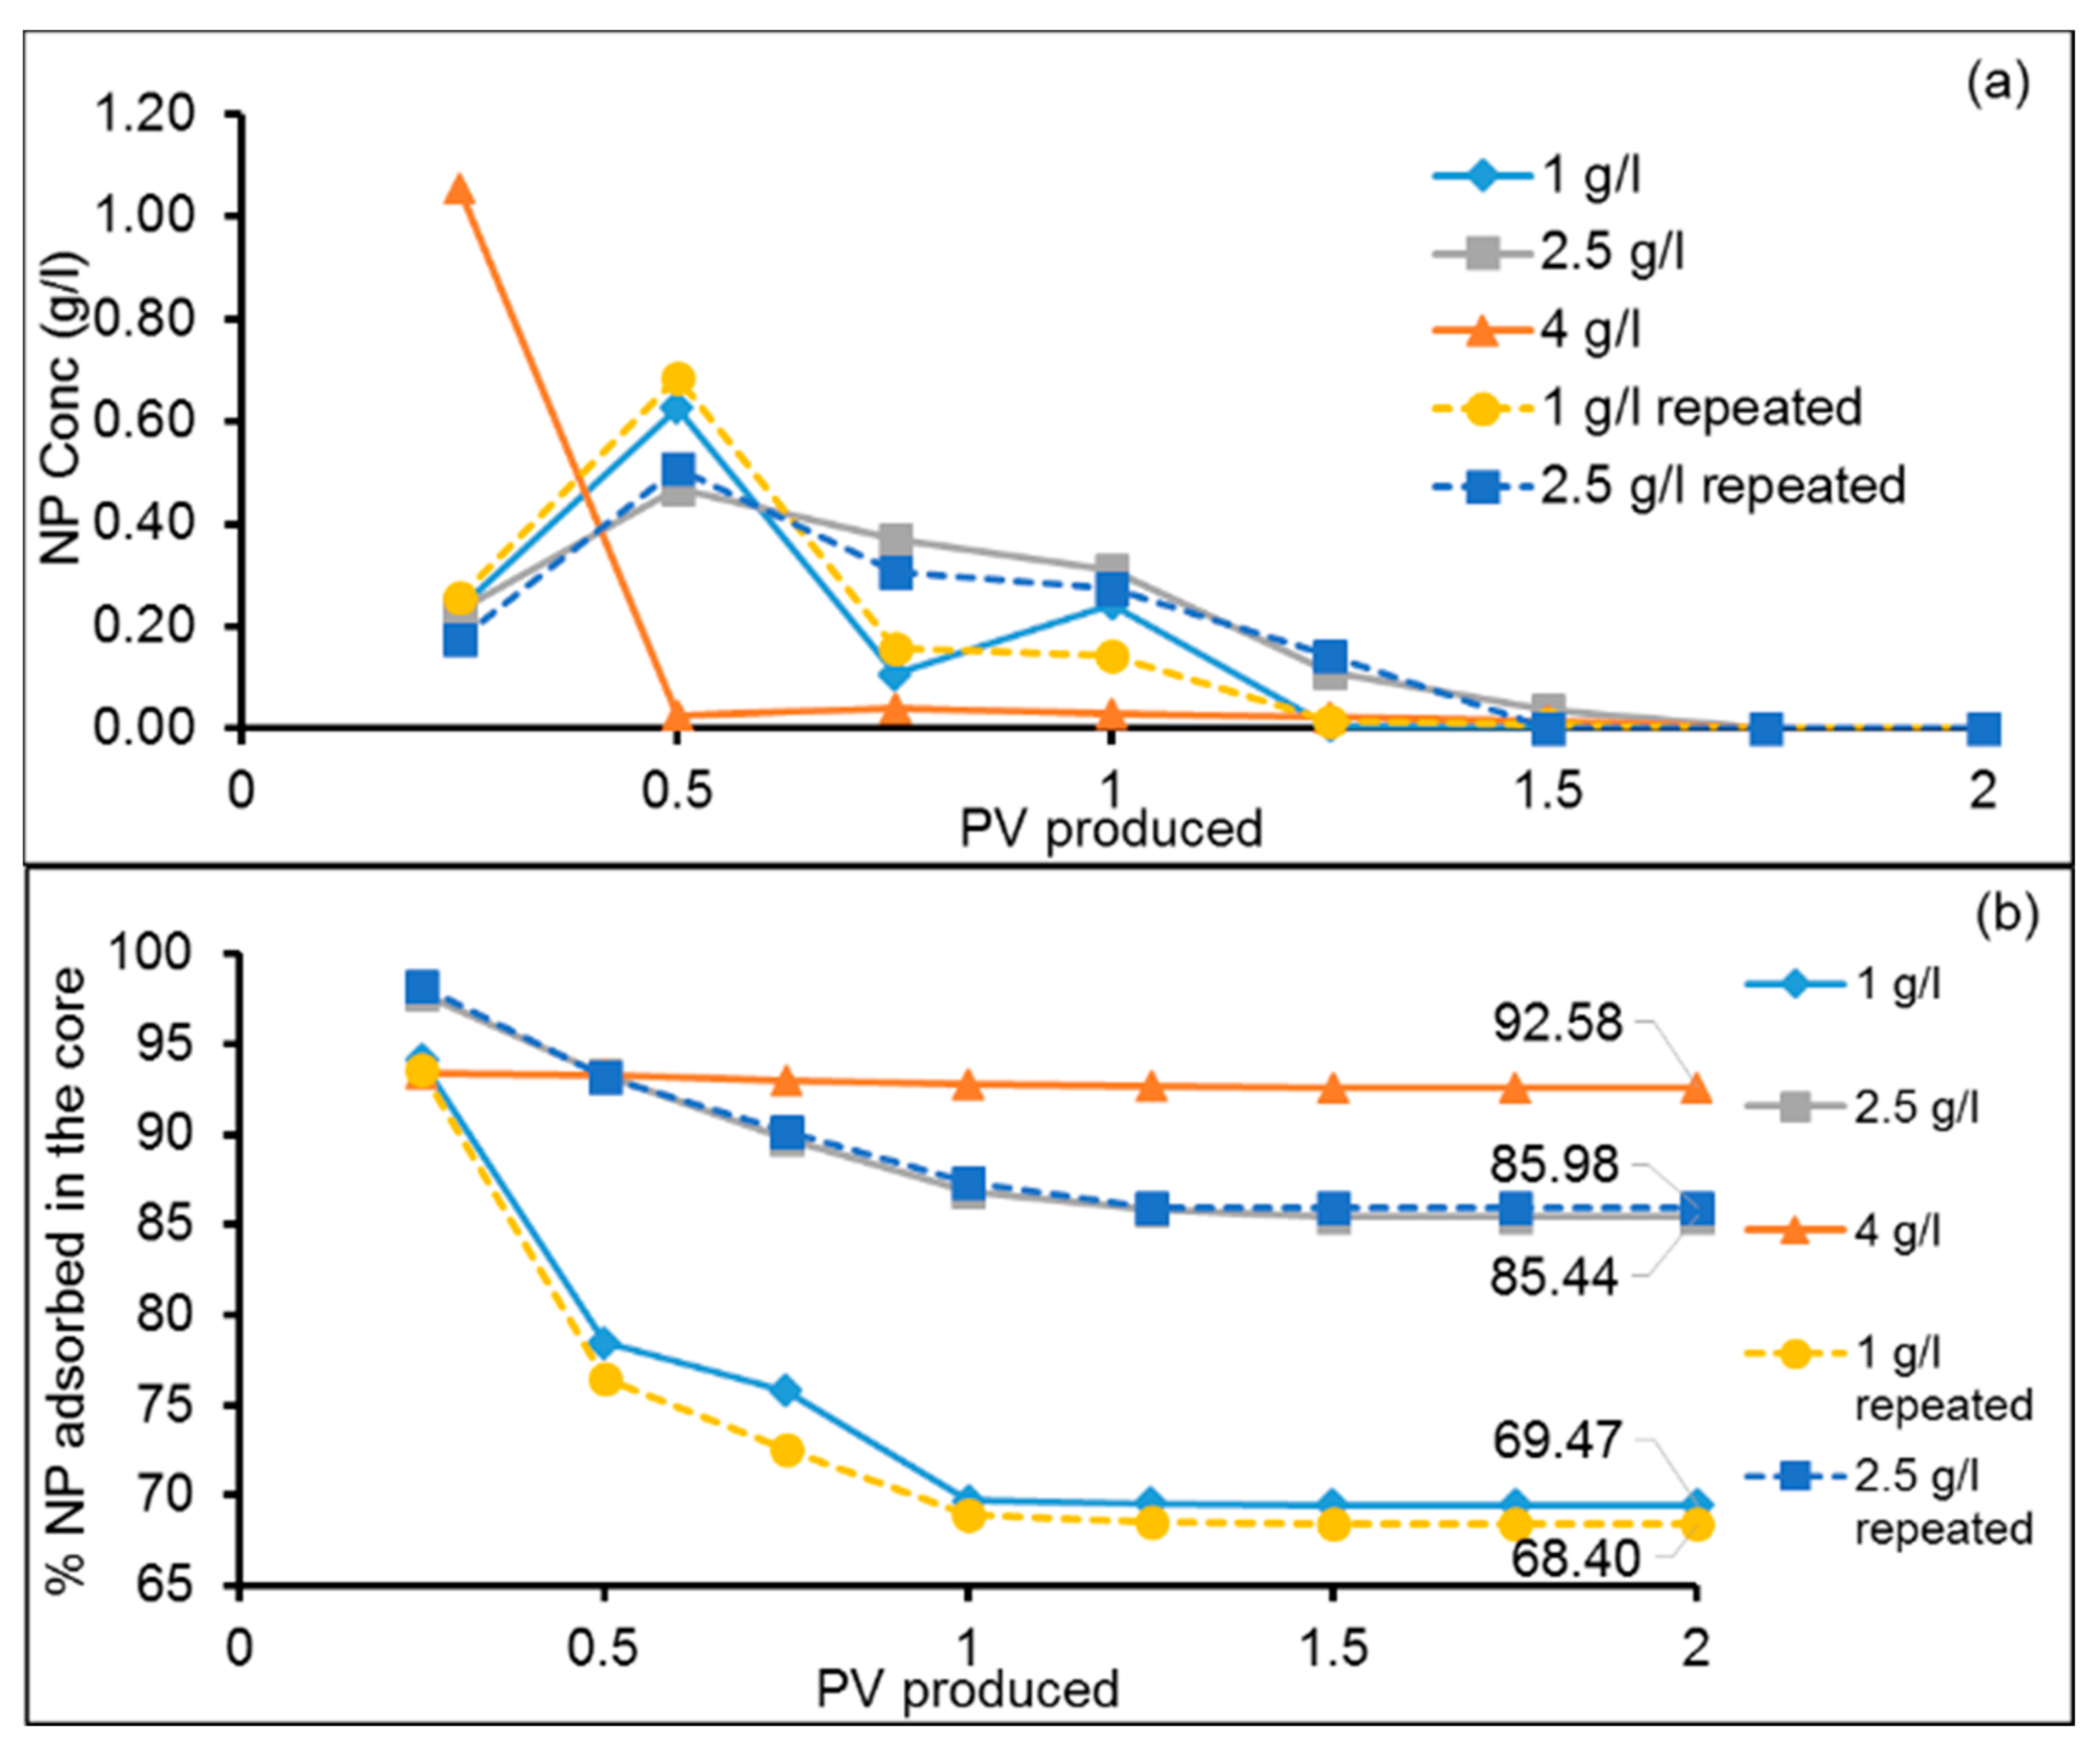
In this part of the study, surface modification of the porous medium was performed with nanofluids that were stabilized by addition of MPTMS. As stated previously, to avoid confusion, NP concentration is stated in g/L units and MPTMS concertation is stated in g/100 mL units. The effluent concentration profiles of NP during the post flush (with DIW) for the cores treated with nanofluids at different concentrations (Experiment: 4–8) are shown in Figure 7a. As shown, the nanofluids with 1 g/L and 2.5 g/L NP show similar profile of NP production. After DIW flush of about 1.5 PV for 2.5 g/L and 1 PV for 1 g/L the NP production in the effluent stopped. To ensure that this difference does not arise due to dissimilarities in the core, experiments 4 and 5 were repeated. The effluent concentration profiles shown in Figure 7a for the repeated cases are close to the initial experiments 4 and 5. For the nanofluid at 4 g/L concentration, the behaviour is completely different. The percentage of NP adsorbed in the core (Experiment 4–8) as the post flush progresses is shown in Figure 7b. In these experiments, the cores were vacuum saturated with the nanofluid. Therefore, it may be assumed that the spatial distribution of the NP in the core was uniform. Gradually decreasing retention for the case of 1 g/L and 2.5 g/L possibly suggests desorption of particles in the core or that the retained particles were forced out during the post flush. However, for 4 g/L it can be inferred from the almost flat nature of the curve that possibly only the NP near the outlet of the core were produced and substantial channelling of the fluid may be caused by blockage of some pore throats. This was confirmed by the monitoring the corresponding pressure drop during the experiments (Figure 8).
Figure 8 shows the recorded pressure drop (dP) during the post flush with DIW after application of nanofluid (Experiments 4–6). The recorded pressure drop during initial DIW injection was taken as a base line for the pressure drop. It is interesting to see that the pressure drop peaked at about 0.25 PV indicating entry resistance. The lowest pressure drop peak occurred for 1 g/L followed by the base fluid (DIW), then 2.5 g/L. In the case of 4 g/L, the pressure drop increased to above 0.3 bar. For cores saturated with NP concentration of 1 g/L, more fluctuations in dP was observed, followed by two peaks between 1–2 PV, while the others (DIW and 2.5 g/L) dP declined smother. It may be concluded that 1 g/L flowed through the core with occasions of resistance to the flow. From mass balance, in the case of 1 g/L, 69.47% (0.01389 g) and for 2.5 g/L, 85.44% (0.044 g) of NP were adsorbed/retained in the core, i.e., the loss of the NP in the core for the case of 2.5 g/L exceeded 3 times higher compared to 1 g/L, yet the dP curves eventually became almost equal to the initial DIW injection, this may indicate that the retained/adsorbed NP did not hinder the flow. However, the surface modification of he surfaced by this nanofluid does not lead improvement in water injectivity. In contrast, for the 4 g/L, where the pressure drop increased for more than 2 PV before it was stabilized at dP > 0.3 bar, this may indicate possible aggregation of NPs that restricted/blocked some of the pore throats.
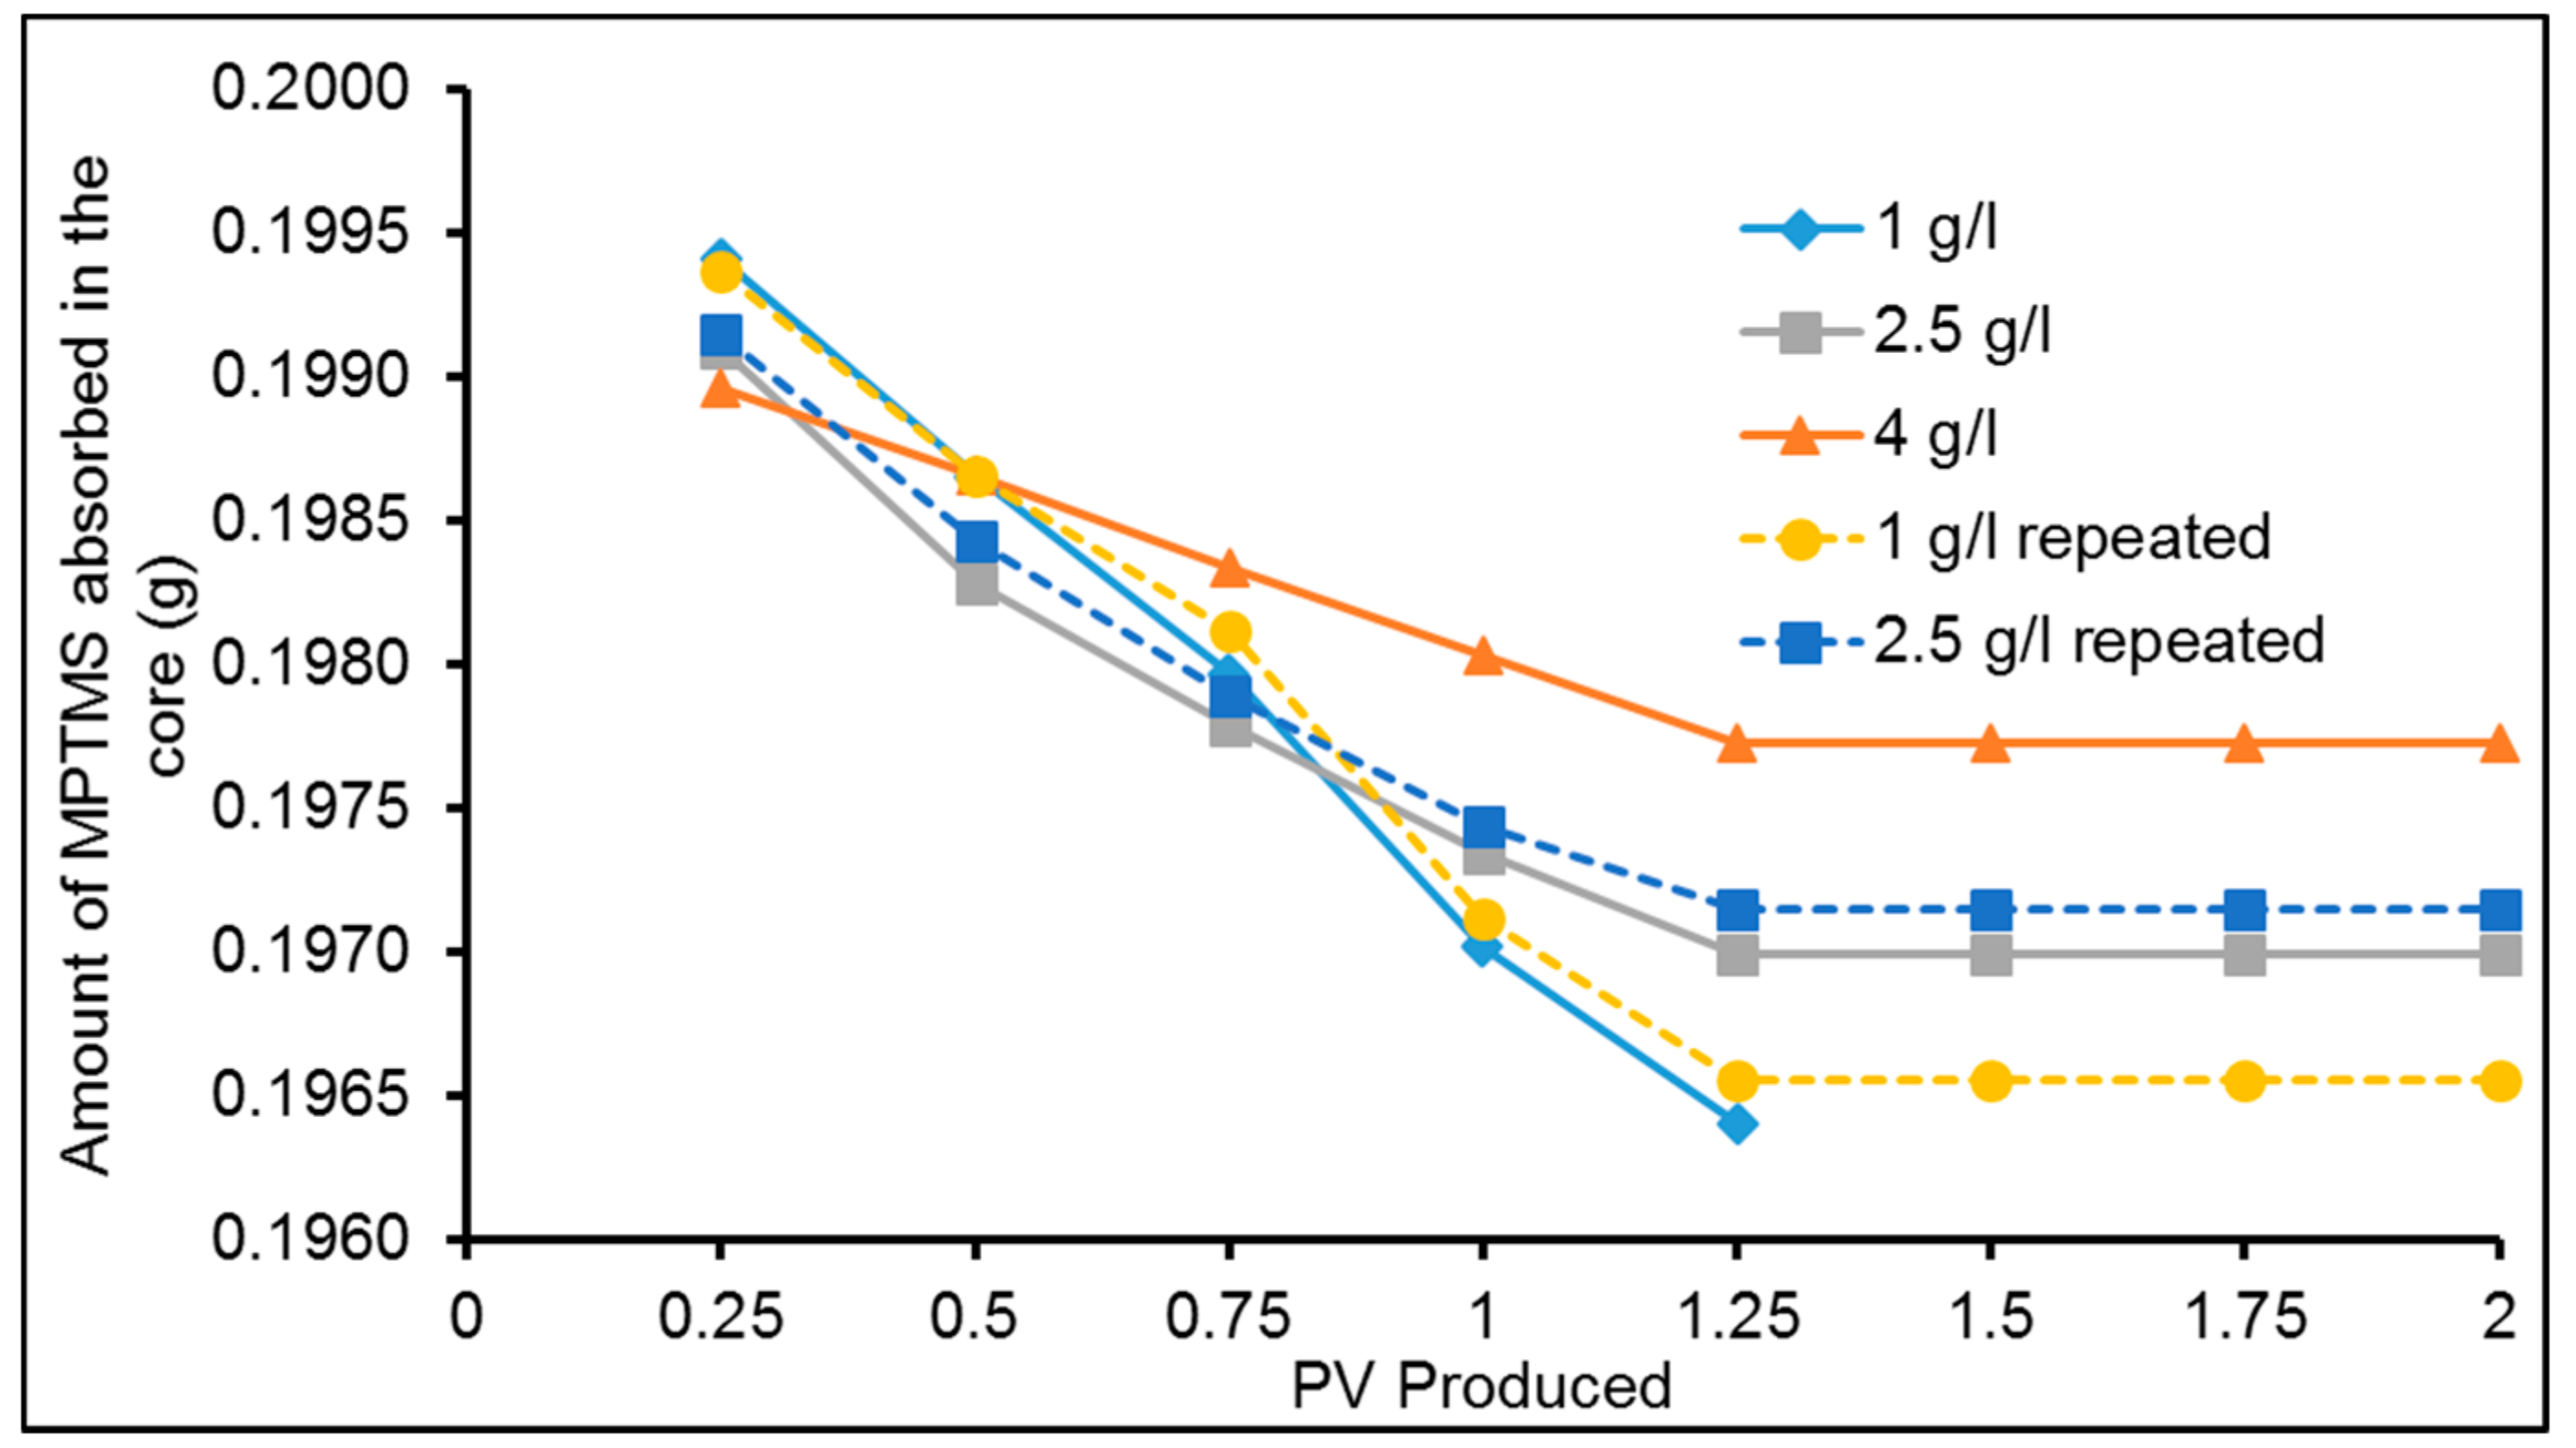
Figure 9 shows the amount of MPTMS adsorbed in the core. The concertation of MPTMS was measured by UV/VIS. The amount of MPTMS retained in the core was calculated from the mass balance. It may be observed that a high amount of the stabilizing fluid in adsorbed in the core. High adsorption of NP stabilizing fluid (MPTMS) in the porous media suggest that this method may not be suitable for subsurface application.
3.3. Sulfonated Silica Nanofluids
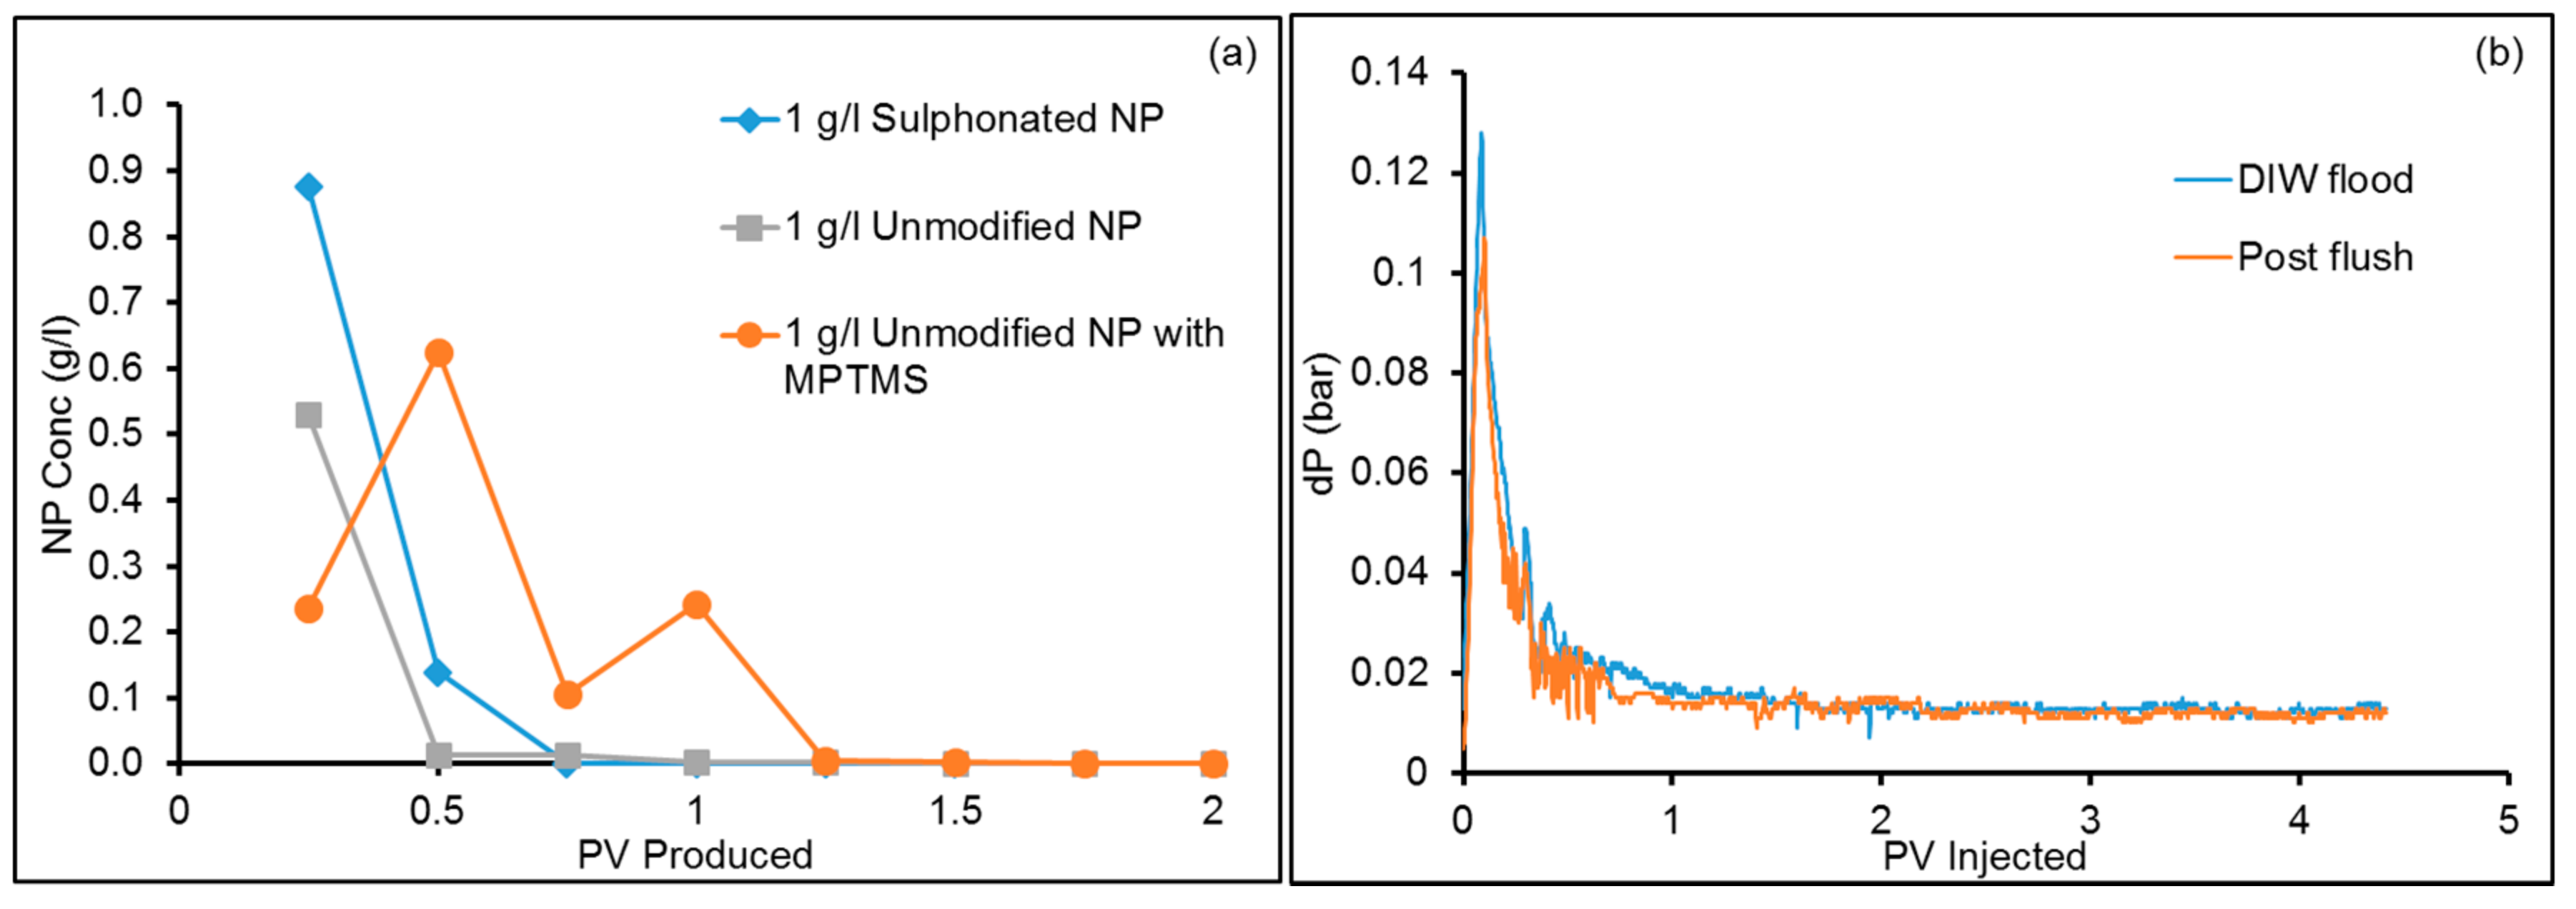
This section addresses the behaviour of sulfonated silica. Sulfonated silica NP were prepared by the method described earlier Section 2.2 and dispersed at 1 g/L concentration in DIW. The effluent concentration profile during the post flush for core saturated with 1 g/L surface modified (sulfonated) NP in DIW is shown in Figure 10a. For the sake of comparison, the effluent concertation profiles for cores saturated with 1 g/L unmodified NP and NP stabilized with MPTMS are also shown in Figure 10a. It may be observed that the behaviour of sulfonated NP was similar to silica NP. That is the majority of the NP were produced in the first 0.5 PV. Contrary to that with MPTMS (stabilizing fluid), the NP production continues for 1 PV. Based on mass balance it was calculated that 74.6% of the sulphonated NPs were adsorbed in the core. Pressure drop profile recorded with sulphonated NP is shown in Figure 10b. As may be observed that the entry resistance post application of sulfonated NP was lower than the initial DIW injection. This observation was consistent with the case of the post flushing for cores saturated with unmodified NP. As the NP were being produced, high variation frequency was observed in the pressure drop. Thereafter the pressure drop profile declined smoother and almost overlaps with the initial DIW injection. In summary, the application of sulfonated NP did not lead improvement of water injectivity.
Two important observations are made from the application of nanofluids and SEM imaging conducted: (1) The preferential adsorption of the silica NPs on quartz mineral, which to the best knowledge of the authors have not been reported previously and (2) The water injectivity improvement was observed upon the application of silica NPs only. That is, the two nanofluid stabilization methods tend to reduce the effectiveness of the surface modification by the NPs. These observations are further investigated and strengthened in latter sections.
3.4. Adsorption of NP on Minerals
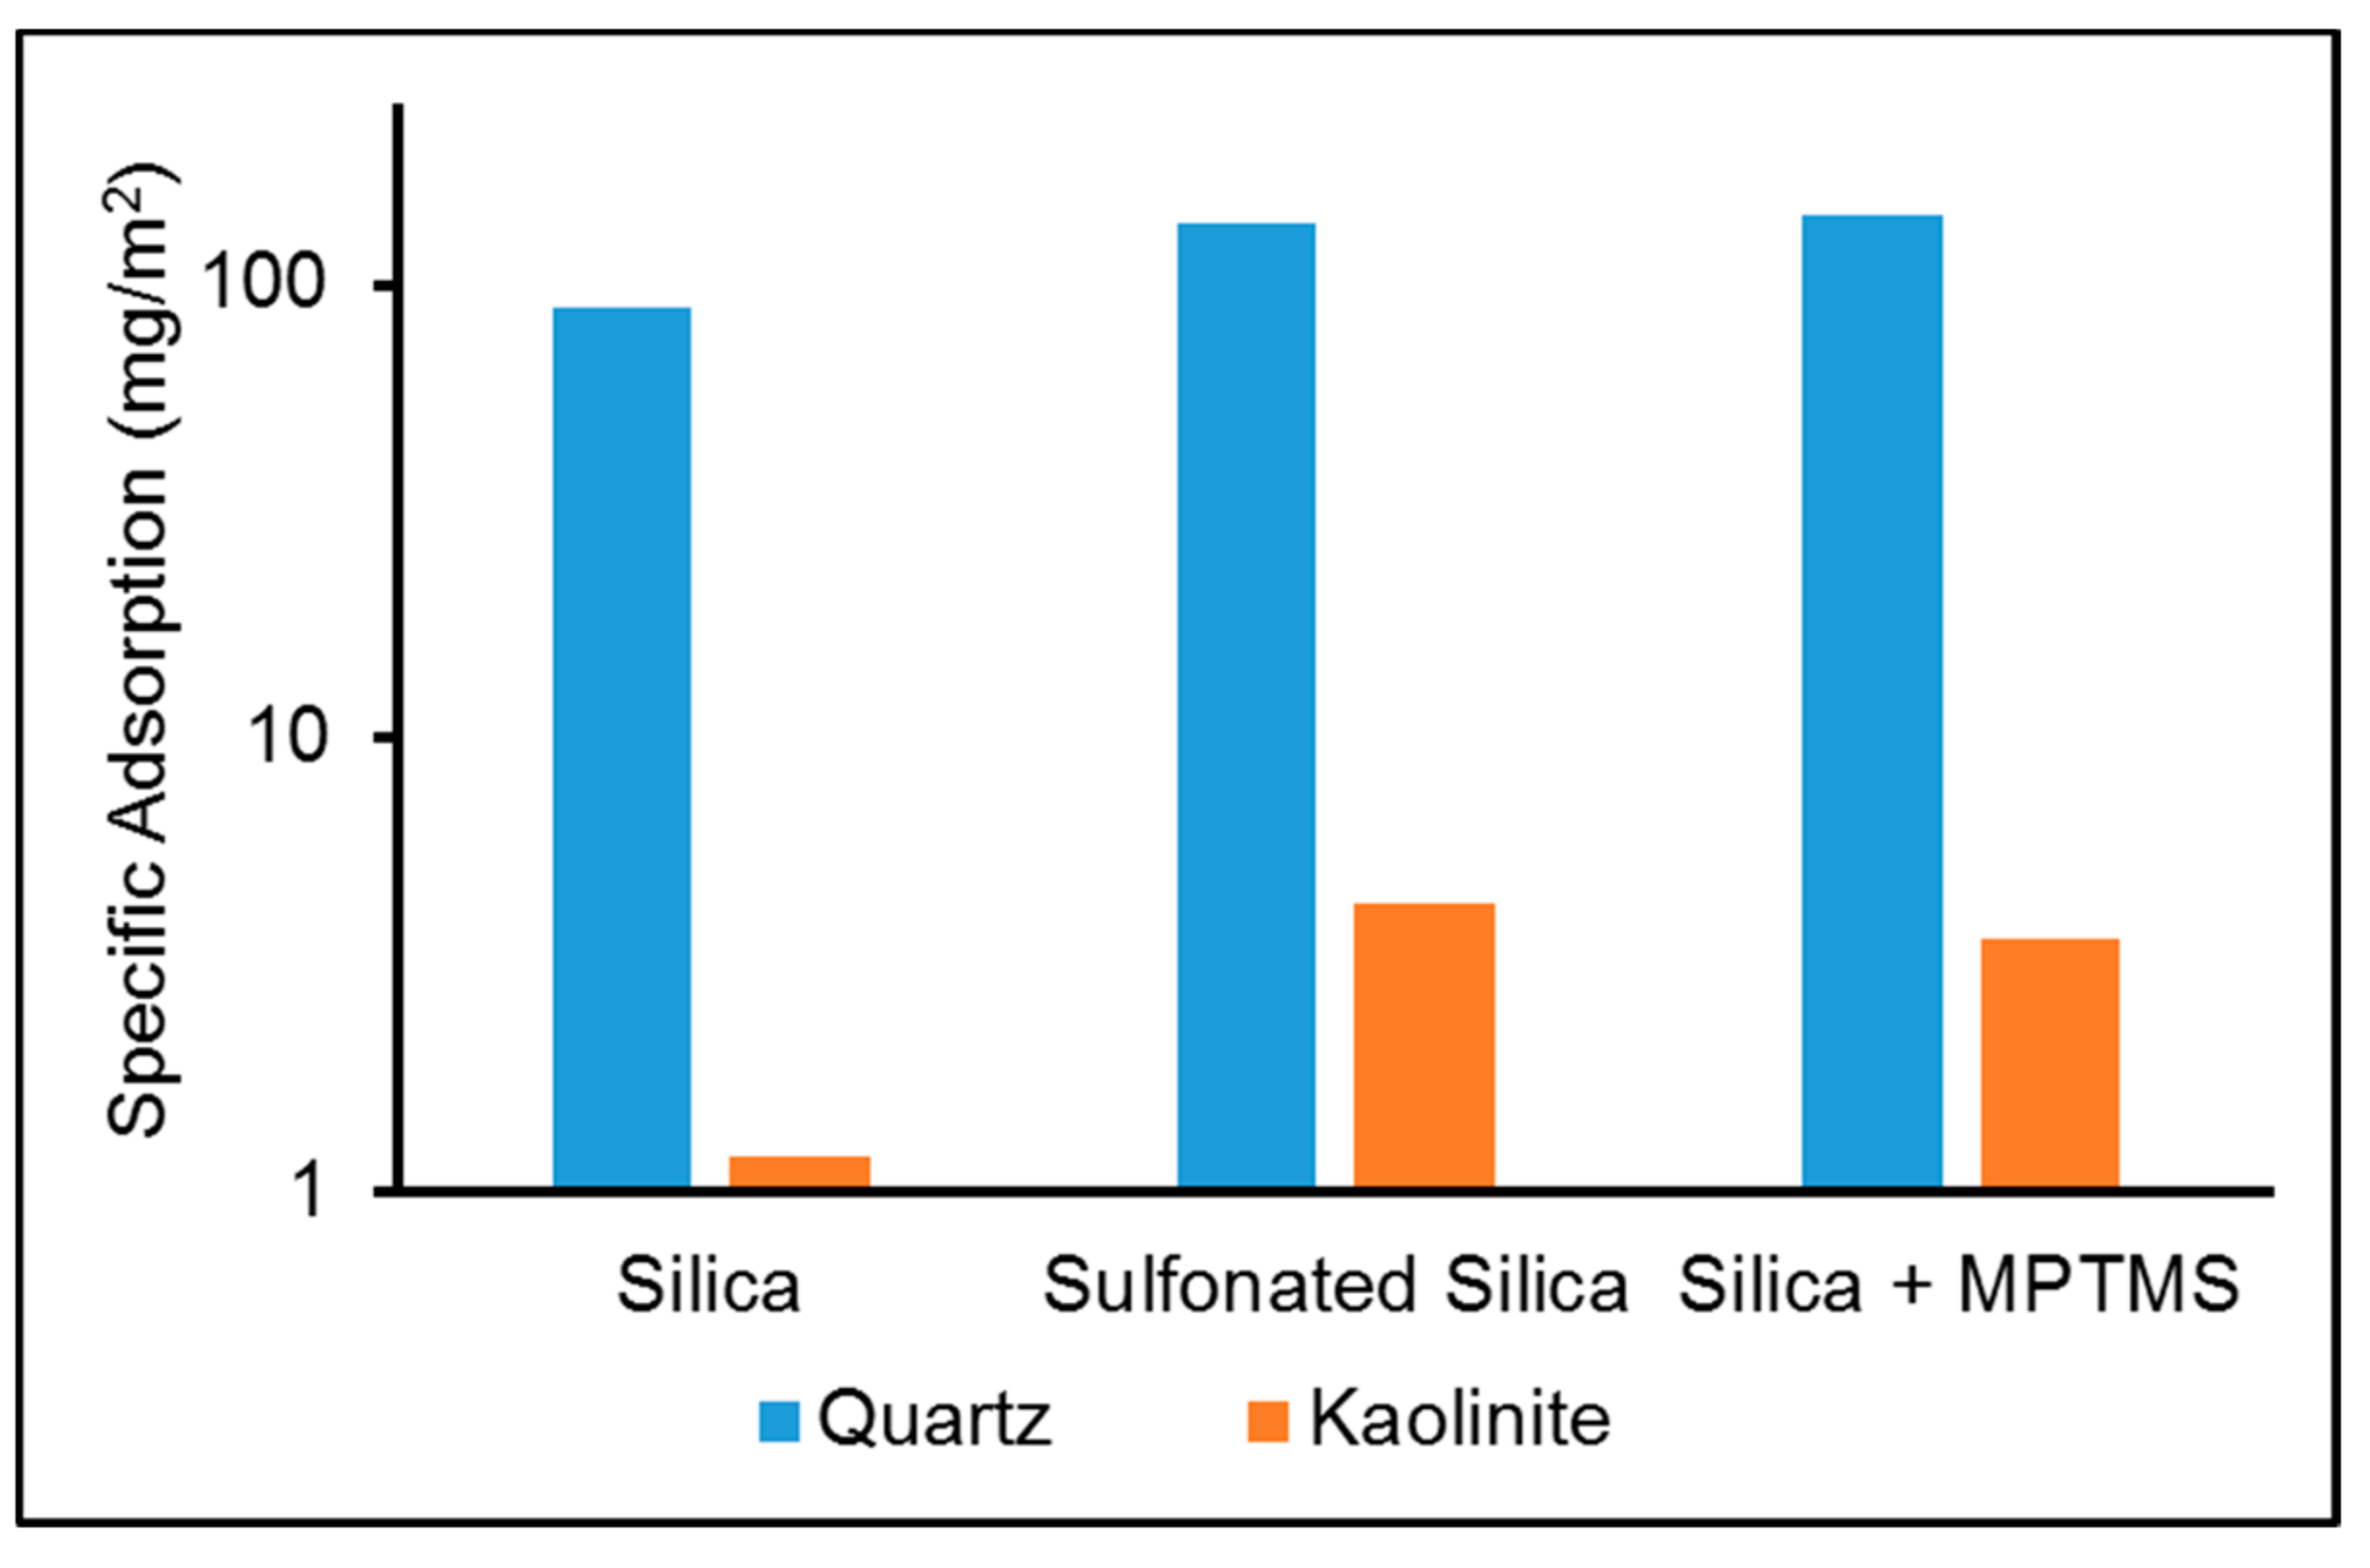
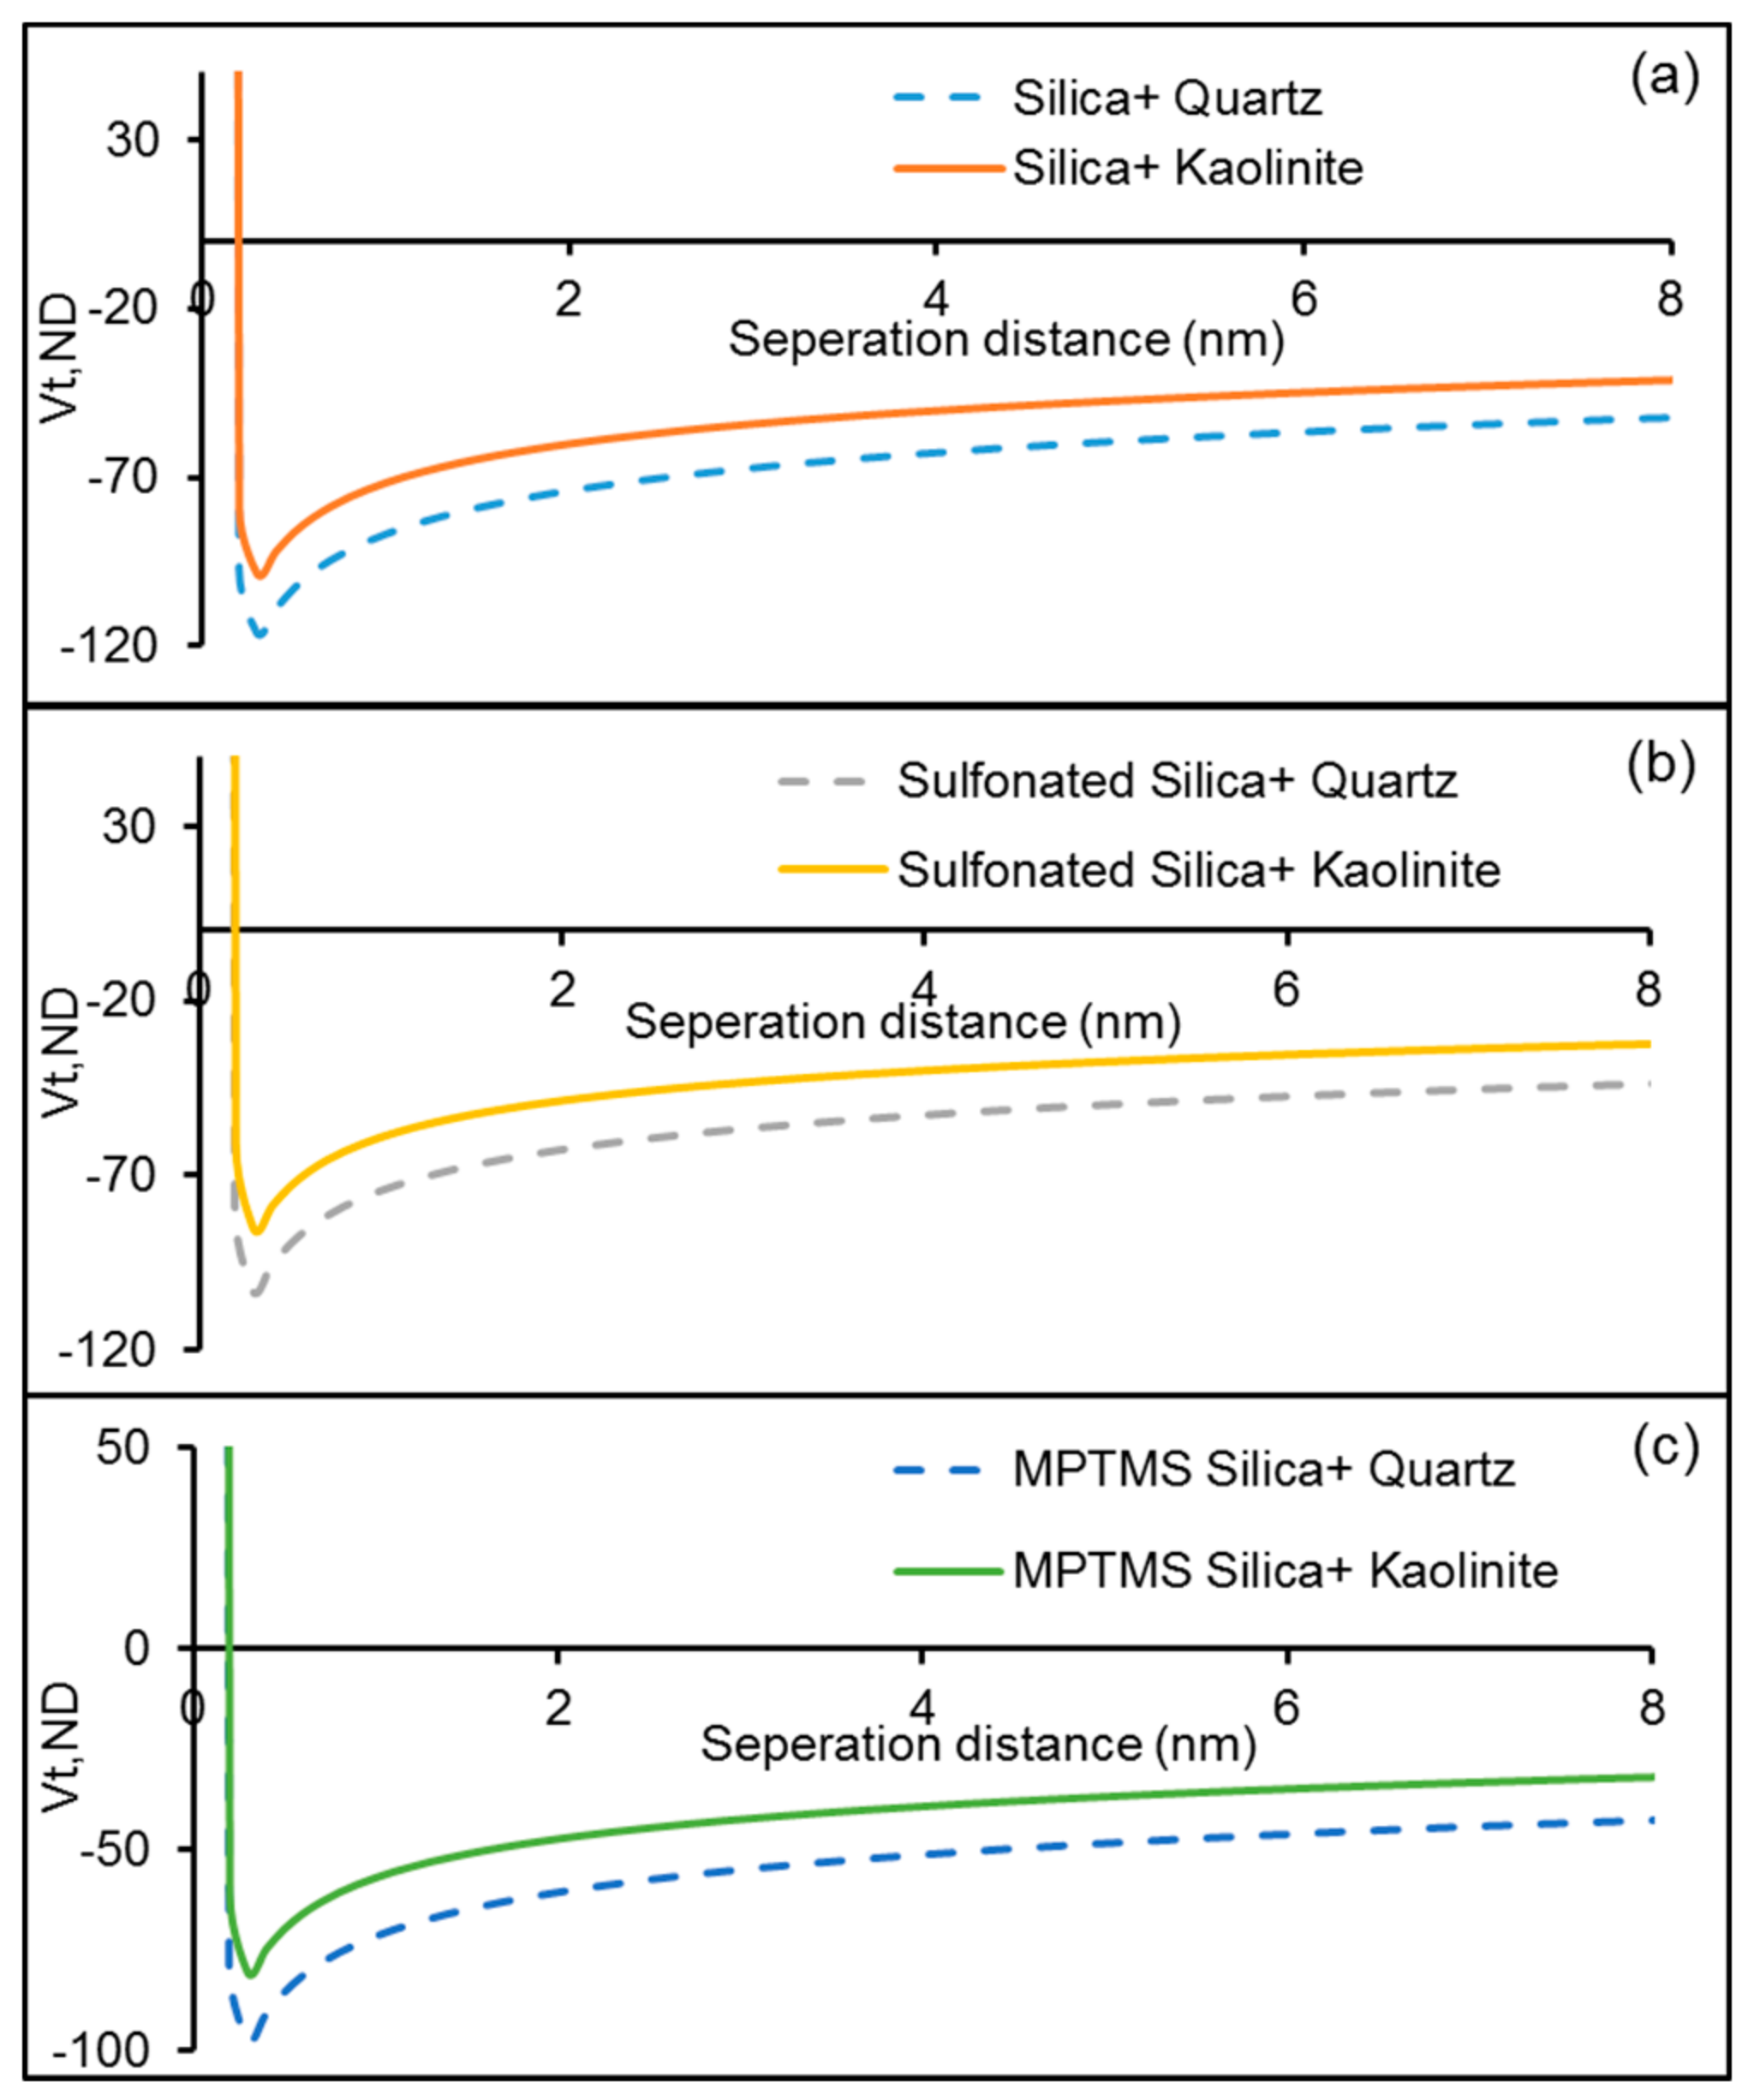
SEM imaging for cores saturated with silica NP showed that the adsorption was mostly on quartz. Isothermal static adsorption tests and calculation of interaction potential between the NP and the mineral powders were performed to investigate the affinity of the NP to quartz and kaolinite mineral powders. Metin et al. [31] have previously studied the adsorption of silica NP onto representative mineral surfaces. SEM imaging for cores saturated with silica NP showed that the adsorption was mostly on quartz. To further investigate this, quartz and kaolinite were dispersed in all three kinds of nanofluids and the adsorption of NP per unit surface area of the mineral was determined. The results are shown in Figure 11. In addition, the interaction potentials between the minerals and NP was calculated by the model presented in Section 2.8 based on the particle size and zeta potential data presented in Table 2. The results are plotted in Figure 12.
Figure 11 shows higher adsorption of NP on quartz compared to kaolinite. As shown, Figure 11, the adsorption of NP is higher for stabilized nanofluids (with MPTMS and modified by sulphonated material). This was supported by Figure 12, where the attractive interaction potentials for all three type of NP were greater for quartz as compared to kaolinite. This validates SEM images where most of the adhesion/adsorption of NPs/nanofluids were on the quartz mineral as compared to kaolinite.
In the previous section it was noted that the unmodified silica showed highest adsorption on the berea core (85.82%) followed by sulfonated silica (74.61%) and MPTMS stabilised silica (69.47%), however the stabilized NPs by MPTMS show higher adsorption in the static adsorption tests. The reason is not known, however, the observation, may be explained by (1) insufficient contact time with minerals, i.e., slower kinetics than the unmodified NPs; (2) influence of the collective neighbouring minerals compared to individual isolated minerals (static adsorption); (3) weak adsorption on mineral surface, hence desorbed in fluid flow and (4) all the above factors. More work is ongoing on this observation.
3.5. Interaction between Fines and Porous Media
The surface charge of berea in DIW was determined to be −29.53 mV (Table 2). To investigate the surface charge modification caused by NP, powdered berea at 10 g/L concentration was added to nanofluids of silica and sulfonated silica prepared in DIW at 1 g/L concentration. This mixture was left under stirring for 12 h. Thereafter, the surface charge of the barea powder treated with unmodified and sulfonated silica was measured using Acosustisizer II S/M Flow-through System. It was found that the surface charge of treated barea was reduced to −11.4 mV and −20.36 mV in the case of unmodified and sulfonated silica respectively. The fines produced were analysed for the size and zeta potential. Specifically, effluent sample from effluent bank collected during DIW injection was collected and analysed in the Zetasizer Nano ZSP (Malvern instruments). It was found that the zeta potential of the fine particles was −22.9 mV. The measured zeta potential of fines is in close agreement with previous measurements of fines eluted from berea sandstone [32]. In addition, the fines produced were in there different size classes (Table 4).
The interaction potential between the fine particles and the porous media was calculated based on the sphere plate collector model presented in Section 2.8. Since the fines have separate size classes, the interaction potential was calculated for each size class and summed on a weighted basis:
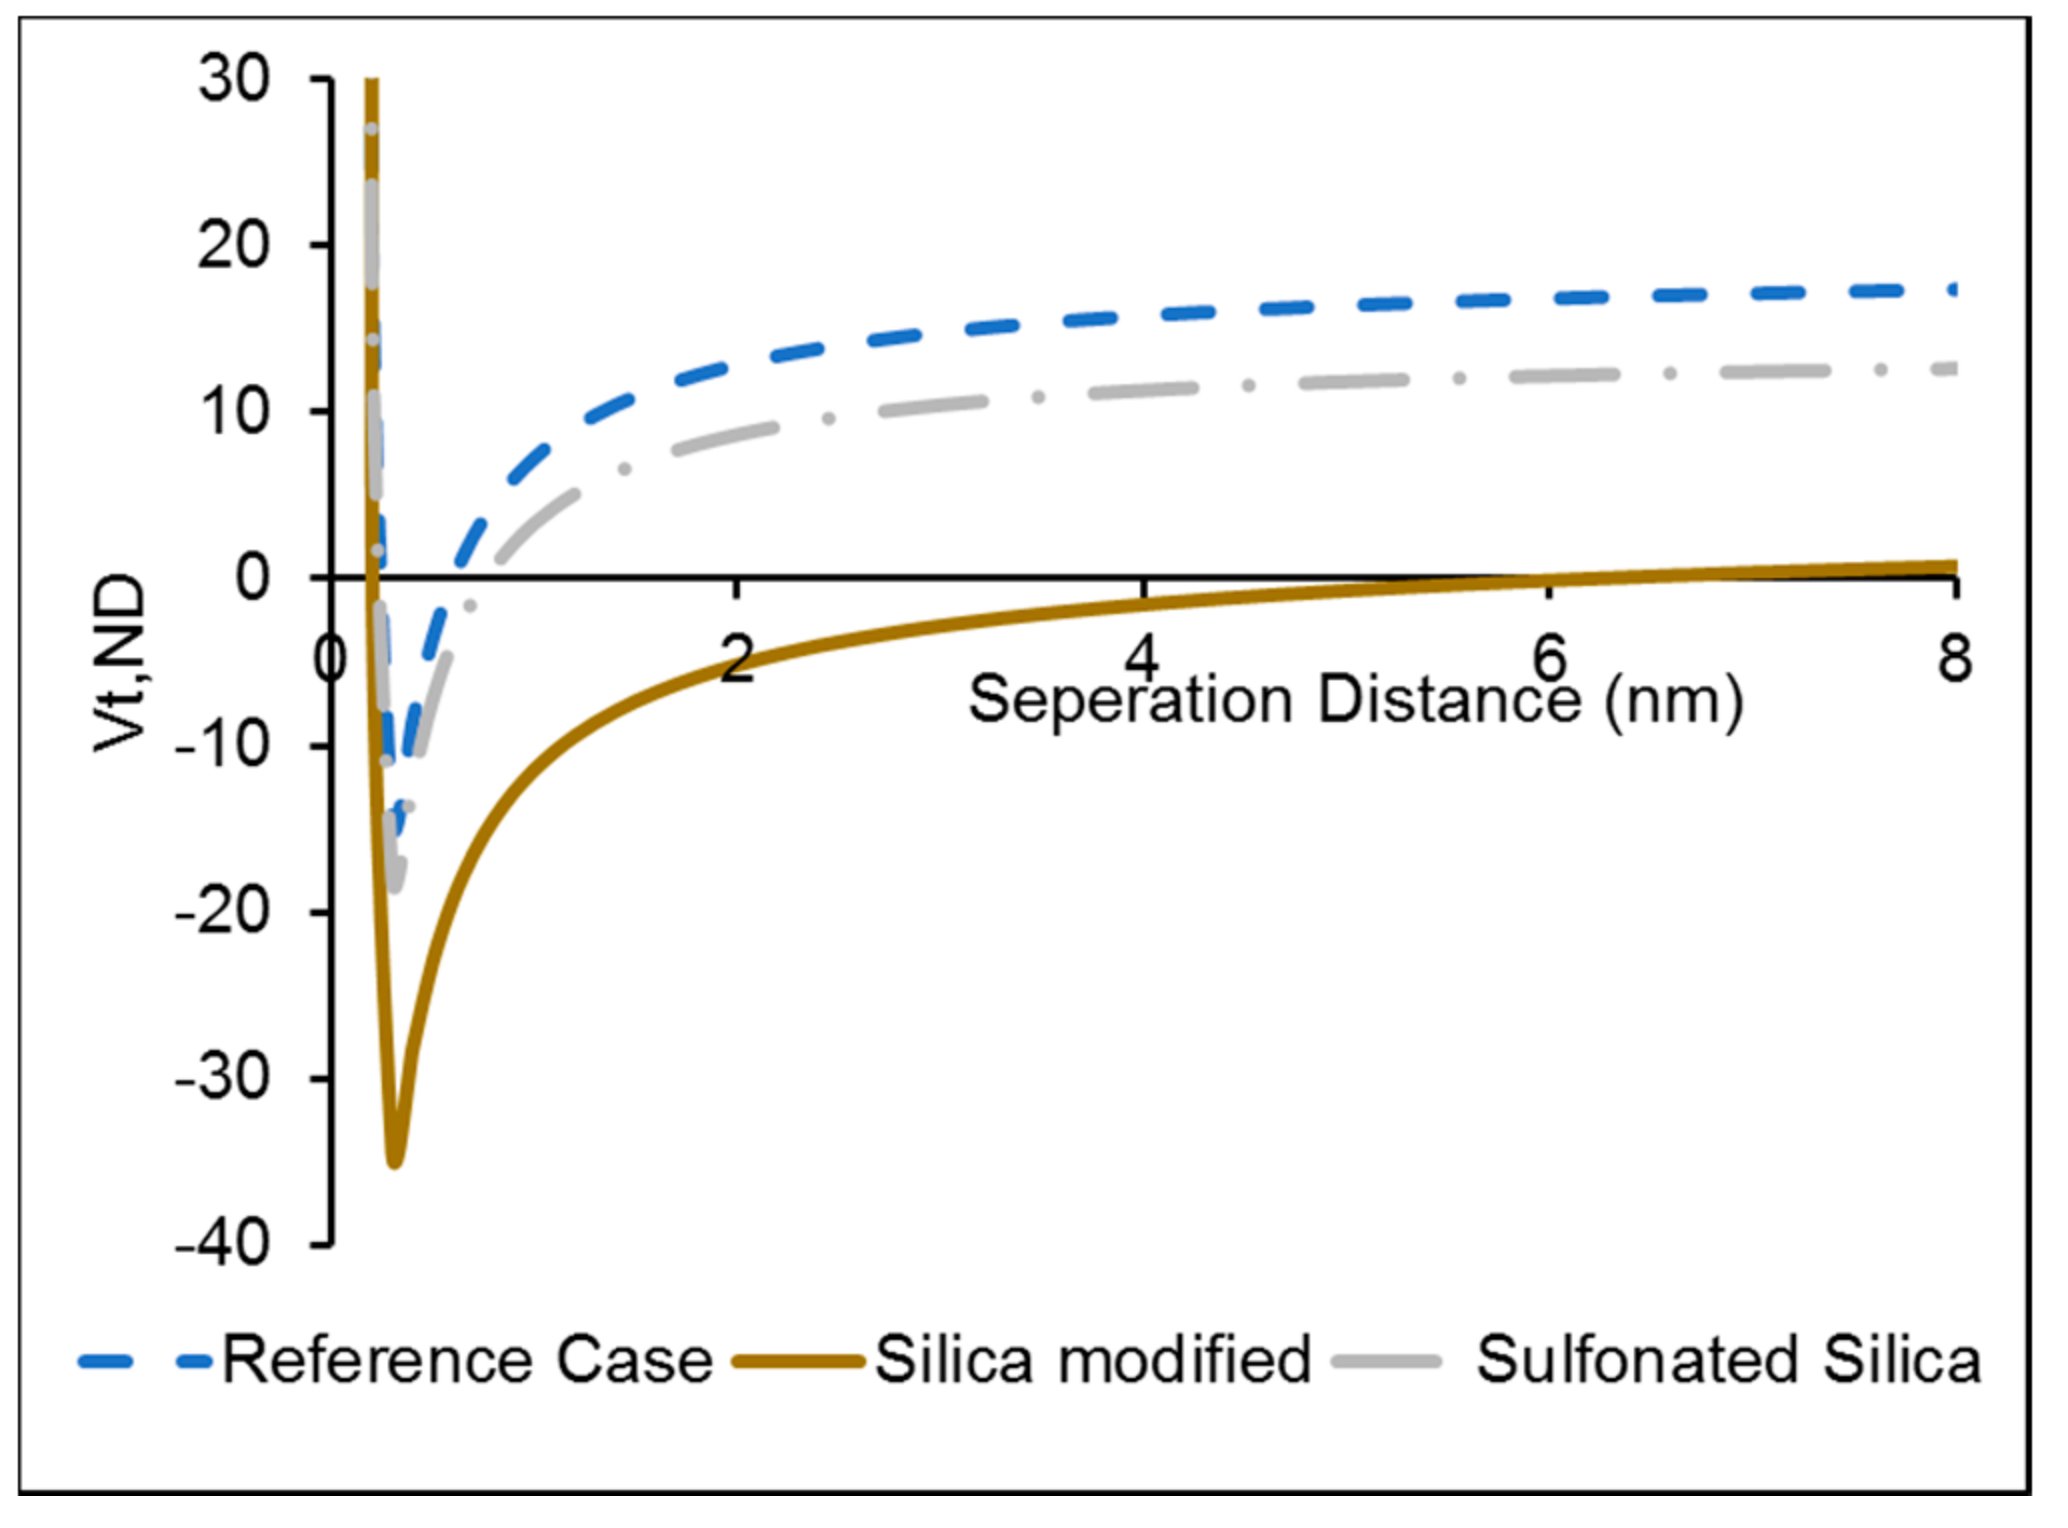
where wi is the weight intensity of each size class and Vt,i(h) is the interaction potential calculated for the specific size class and finite distance of separation (h). Thereafter, the non-dimensional interaction energy was determined using Equation (2). The interaction potentials between berea mineral and fines calculated for the reference case (no NP) and berea treated with silica and sulfonated silica is shown in Figure 13.
In Figure 13, it may be observed that in the reference case, there is a net repulsive potential (energy barrier) between the fines and the mineral surface. However, for mineral treated with silica, there is a net attractive potential (no energy barrier) between the fines and the mineral. This could possibly cause the mineral to act as collectors for capturing fine particles thereby reducing fine migration. This may explain the improvement in water injectivity post application of silica nanofluid as observed in Figure 4 and Figure 5. In the case where berea was treated with sulfonated NP, there a reduction in the energy barrier (Figure 13), however the net potential is still repulsive and close to the reference case. This may explain the similarity in pressure drops observed during initial DIW injection and post flush after saturating the core with sulfonated NP in Figure 10. Thus, it maybe concluded that the surface modification caused silica is much more effective at reducing fine migration and thereby improving the water injectivity in berea cores. Li and Torsæter [4] observed that the injection of colloidal NP into berea sandstone did not lead to permeability impairment. They stated that adsorption of NP on the pore wall act like lubrication reducing the friction between the water and pore walls. However as discussed earlier, this effect may be explained based on reduction of the fine migration rather than direct influence on flow. Reduction of fine production may overcome the problem of formation damage induced during low salinity flooding in sandstones.
4. Conclusions
Low salinity water (LSW) flooding is currently a popular method for EOR. However, it suffers from the results of water/mineral interaction and production of fines. Excessive fines production may lead to formation damage. This work addressed the potential of different silica nanofluids as surface modifying agents for berea sandstone, hence reduced fines migration. The reduction of the fines was indicated by the reduced pressure drop during the post flush of the NPs’ slug. This supports the reduction of fines, which may be explained based on NPs’ adsorption on berea surface, i.e., reduction of direct contact between water and minerals.
Silica NPs have shown to have a higher affinity to adhere/adsorb on quartz surface compared to kaolinite minerals.
Unmodified silica nanofluid reduced fine migration and improved water injectivity. Adsorption of NPs on mineral surfaces may be utilized to overcome the problem of formation damage induced during low salinity flooding.
The used stabilizing methods for the NPs almost did not reduce the fine migration, which was qualitatively indicated by the pressure drop across the porous media. The used stabilizing fluids enhances the static adsorption of NPs on quartz and kaolinite minerals. However, as discussed earlier, may not be strong enough to resist the dynamic fluid forces, their effect on fines, hence are not as effective as the unmodified NPs.
Acknowledgments
The authors would like to thank the University of Stavanger (UiS), Norway for funding this work. We also like to thank Mona W. Minde (UiS) for helping with the SEM imaging and Lutz Eichacker (UiS) for providing access to the DLS equipment. The authors would like to thanks Inger Johanne M-K Olsen (UiS) for acquiring the chemical used in this study. In addition, the authors would like to thank Kim Andre Vorland (UiS) and Krzysztof I Nowicki (UiS) for helping with the setup.
Author Contributions
Rockey Abhishek and Aly A. Hamouda conceived and designed the experiments; Rockey Abhishek performed the experiments; Rockey Abhishek and Aly A. Hamouda analyzed the data; Rockey Abhishek and Aly A. Hamouda wrote the paper.
Conflicts of Interest
The authors declare no conflict of interest. The funding sponsors had no role in the design of the study; in the collection, analyses, or interpretation of data; in the writing of the manuscript, and in the decision to publish the results.
References
- Abhishek, R.; Kumar, G.S.; Sapru, R. Wettability alteration in carbonate reservoirs using nanofluids. Pet. Sci. Technol. 2015, 33, 794–801. [Google Scholar] [CrossRef]
- Behzadi, A.; Mohammadi, A. Environmentally responsive surface-modified silica nanoparticles for enhanced oil recovery. J. Nanopart. Res. 2016, 18, 1–19. [Google Scholar] [CrossRef]
- Giraldo, J.; Benjumea, P.; Lopera, S.; Cortés, F.B.; Ruiz, M.A. Wettability alteration of sandstone cores by alumina-based nanofluids. Energy Fuels 2013, 27, 3659–3665. [Google Scholar] [CrossRef]
- Li, S.; Torsæter, O. Experimental investigation of the influence of nanoparticles adsorption and transport on wettability alteration for oil wet berea sandstone. In Proceedings of the SPE Middle East Oil & Gas Show and Conference, Manama, Bahrain, 8–11 March 2015; Society of Petroleum Engineers: Richardson, TX, USA, 2015. [Google Scholar]
- Shahrabadi, A.; Bagherzadeh, H.; Roostaie, A.; Golghanddashti, H. Experimental investigation of hlp nanofluid potential to enhance oil recovery: A mechanistic approach. In Proceedings of the SPE International Oilfield Nanotechnology Conference and Exhibition, Noordwijk, The Netherlands, 12–14 June 2012; Society of Petroleum Engineers: Richardson, TX, USA, 2012. [Google Scholar]
- Sheshdeh, M.J. A review study of wettability alteration methods with regard to nano-materials application. In Proceedings of the SPE Bergen One Day Seminar, Bergen, Norway, 22 April 2015; Society of Petroleum Engineers: Richardson, TX, USA, 2015. [Google Scholar]
- Zhang, H.; Nikolov, A.; Wasan, D. Enhanced oil recovery (EOR) using nanoparticle dispersions: Underlying mechanism and imbibition experiments. Energy Fuels 2014, 28, 3002–3009. [Google Scholar] [CrossRef]
- Arab, D.; Pourafshary, P. Nanoparticles-assisted surface charge modification of the porous medium to treat colloidal particles migration induced by low salinity water flooding. Colloids Surf. A Physicochem. Eng. Asp. 2013, 436, 803–814. [Google Scholar] [CrossRef]
- Arab, D.; Pourafshary, P.; Ayatollahi, S.; Habibi, A. Remediation of colloid-facilitated contaminant transport in saturated porous media treated by nanoparticles. Int. J. Environ. Sci. Technol. 2014, 11, 207–216. [Google Scholar]
- Hendraningrat, L.; Li, S.; Torsæter, O. A coreflood investigation of nanofluid enhanced oil recovery. J. Pet. Sci. Eng. 2013, 111, 128–138. [Google Scholar]
- Hendraningrat, L.; Torsæter, O. Metal oxide-based nanoparticles: Revealing their potential to enhance oil recovery in different wettability systems. Appl. Nanosci. 2015, 5, 181–199. [Google Scholar] [CrossRef]
- Ogolo, N.; Olafuyi, O.; Onyekonwu, M. Enhanced oil recovery using nanoparticles. In Proceedings of the SPE Saudi Arabia Section Technical Symposium and Exhibition, Al-Khobar, Saudi Arabia, 8–11 April 2012; Society of Petroleum Engineers: Richardson, TX, USA, 2012. [Google Scholar]
- Suleimanov, B.; Ismailov, F.; Veliyev, E. Nanofluid for enhanced oil recovery. J. Pet. Sci. Eng. 2011, 78, 431–437. [Google Scholar] [CrossRef]
- Hofmann, U.; Endell, K.; Wilm, D. Röntgenographische und kolloidchemische untersuchungen über ton. Angew. Chem. 1934, 47, 539–547. [Google Scholar] [CrossRef]
- Metin, C.O.; Lake, L.W.; Miranda, C.R.; Nguyen, Q.P. Stability of aqueous silica nanoparticle dispersions. J. Nanopart. Res. 2011, 13, 839–850. [Google Scholar] [CrossRef]
- Ortega, D.J.S.; Kim, H.B.; James, L.A.; Johansen, T.E.; Zhang, Y. The effectiveness of silicon dioxide SiO2 nanoparticle as an enhanced oil recovery agent in ben nevis formation, hebron field, offshore eastern canada. In Proceedings of the Abu Dhabi International Petroleum Exhibition & Conference, Abu Dhabi, UAE, 7–10 November 2016; Society of Petroleum Engineers: Richardson, TX, USA, 2016. [Google Scholar]
- Hendraningrat, L.; Torsæter, O. A stabilizer that enhances the oil recovery process using silica-based nanofluids. Transp. Porous Media 2015, 108, 679–696. [Google Scholar] [CrossRef]
- Yang, X.; Liu, Z.-H. A kind of nanofluid consisting of surface-functionalized nanoparticles. Nanoscale Res. Lett. 2010, 5, 1324. [Google Scholar] [CrossRef] [PubMed]
- Weston, J.S.; Jentoft, R.E.; Grady, B.P.; Resasco, D.E.; Harwell, J.H. Silica nanoparticle wettability: Characterization and effects on the emulsion properties. Ind. Eng. Chem. Res. 2015, 54, 4274–4284. [Google Scholar] [CrossRef]
- Zhang, T.; Murphy, M.J.; Yu, H.; Bagaria, H.G.; Yoon, K.Y.; Nielson, B.M.; Bielawski, C.W.; Johnston, K.P.; Huh, C.; Bryant, S.L. Investigation of nanoparticle adsorption during transport in porous media. SPE J. 2014. [Google Scholar] [CrossRef]
- Wang, W.; Yuan, B.; Su, Y.; Wang, K.; Jiang, M.; Moghanloo, R.G.; Rui, Z. Nanoparticles adsorption, straining and detachment behavior and its effects on permeability of berea cores: Analytical model and lab experiments. In Proceedings of the SPE Annual Technical Conference and Exhibition, Dubai, UAE, 26–28 September 2016; Society of Petroleum Engineers: Richardson, TX, USA, 2016. [Google Scholar]
- Tabrizy, V.A.; Denoyel, R.; Hamouda, A. Characterization of wettability alteration of calcite, quartz and kaolinite: Surface energy analysis. Colloids Surf. A Physicochem. Eng. Asp. 2011, 384, 98–108. [Google Scholar] [CrossRef]
- Mondragon, R.; Julia, J.E.; Barba, A.; Jarque, J.C. Characterization of silica–water nanofluids dispersed with an ultrasound probe: A study of their physical properties and stability. Powder Technol. 2012, 224, 138–146. [Google Scholar] [CrossRef]
- Oh, Y.-K.; Hong, L.-Y.; Asthana, Y.; Kim, D.-P. Synthesis of super-hydrophilic mesoporous silica via a sulfonation route. J. Ind. Eng. Chem. 2006, 12, 911–917. [Google Scholar]
- Seetha, N.; Majid Hassanizadeh, S.; Kumar, M.; Raoof, A. Correlation equations for average deposition rate coefficients of nanoparticles in a cylindrical pore. Water Resour. Res. 2015, 51, 8034–8059. [Google Scholar] [CrossRef]
- Khilar, K.C.; Fogler, H.S. Migrations of Fines in Porous Media; Springer Science & Business Media: New York, NY, USA, 1998; Volume 12. [Google Scholar]
- Dunphy Guzman, K.A.; Finnegan, M.P.; Banfield, J.F. Influence of surface potential on aggregation and transport of titania nanoparticles. Environ. Sci. Technol. 2006, 40, 7688–7693. [Google Scholar] [CrossRef]
- Israelachvili, J.N. Intermolecular and Surface Forces; Academic Press: Cambridge, MA, USA, 2011. [Google Scholar]
- Yuan, H.; Shapiro, A.A. Induced migration of fines during waterflooding in communicating layer-cake reservoirs. J. Pet. Sci. Eng. 2011, 78, 618–626. [Google Scholar] [CrossRef] [Green Version]
- Huang, T.; Han, J.; Agrawal, G.; Sookprasong, P. Coupling nanoparticles with waterflooding to increase water sweep efficiency for high fines-containing reservoir-lab and reservoir simulation results. In Proceedings of the SPE Annual Technical Conference and Exhibition, Houston, TX, USA, 28–30 September 2015; Society of Petroleum Engineers: Richardson, TX, USA, 2015. [Google Scholar]
- Metin, C.O.; Baran, J.R.; Nguyen, Q.P. Adsorption of surface functionalized silica nanoparticles onto mineral surfaces and decane/water interface. J. Nanopart. Res. 2012, 14, 1246. [Google Scholar] [CrossRef] [PubMed]
- Kia, S.; Fogler, H.; Reed, M. Effect of ph on colloidally induced fines migration. J. Colloid Interface Sci. 1987, 118, 158–168. [Google Scholar] [CrossRef]
Figure 1.
Schematic of the core flood setup. DIW: Deionized water; P: Pressure.

Figure 2.
Calibration curves for detecting nanoparticle (NP) concentration and 3-Mercaptopropyl Trimethoxysilane (MPTMS) concentration. ABS: Absorption.
Figure 2.
Calibration curves for detecting nanoparticle (NP) concentration and 3-Mercaptopropyl Trimethoxysilane (MPTMS) concentration. ABS: Absorption.

Figure 3.
(a) Effluent NP concentration profiles; (b) % adsorbed NP during post flush. PV: Pore Volume.
Figure 3.
(a) Effluent NP concentration profiles; (b) % adsorbed NP during post flush. PV: Pore Volume.
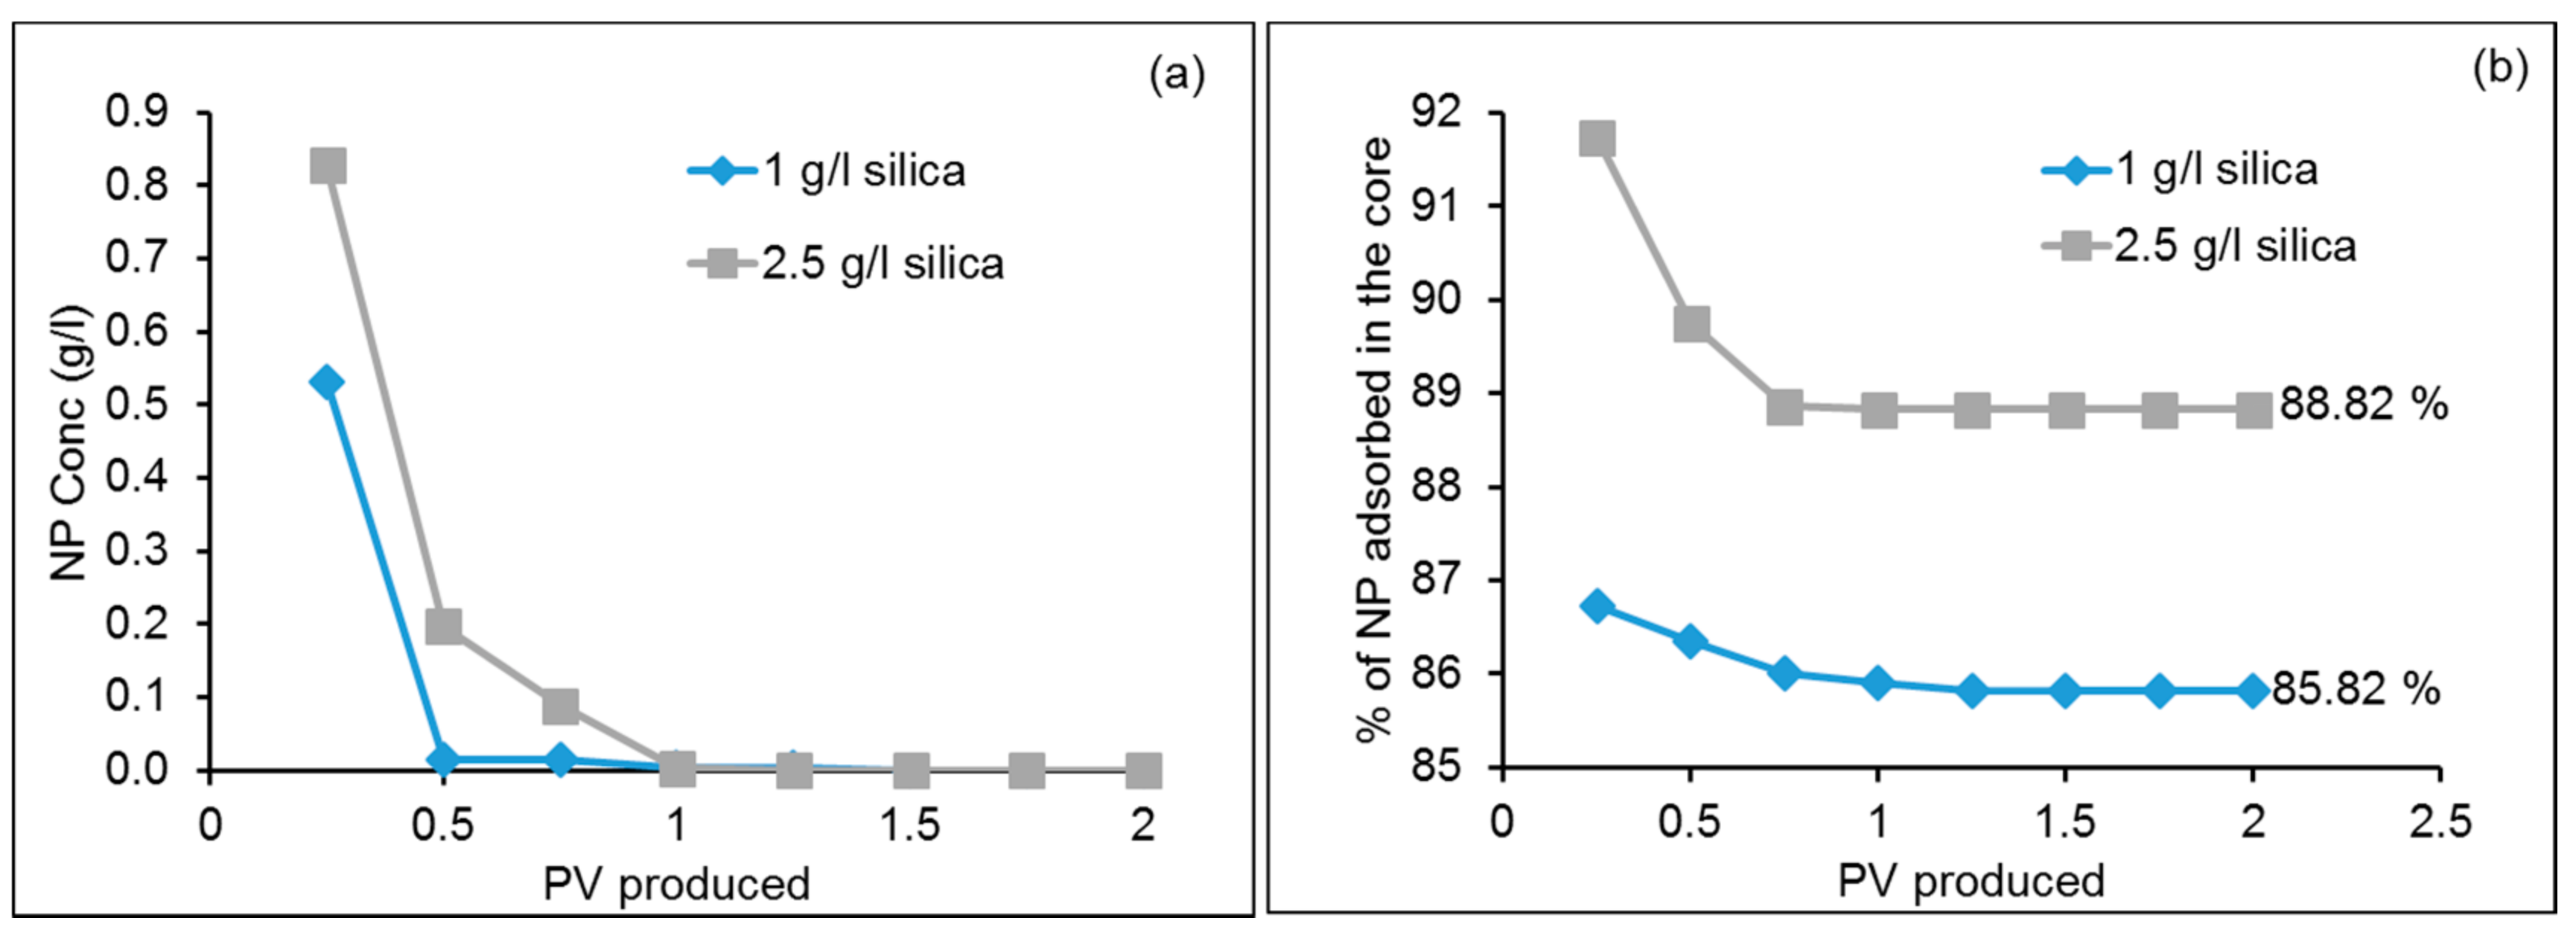
Figure 4.
Pressure drop profiles for silica dispersed in deionized water (DIW) at (a) 1 g/L and (b) 2.5 g/L concentration.
Figure 4.
Pressure drop profiles for silica dispersed in deionized water (DIW) at (a) 1 g/L and (b) 2.5 g/L concentration.
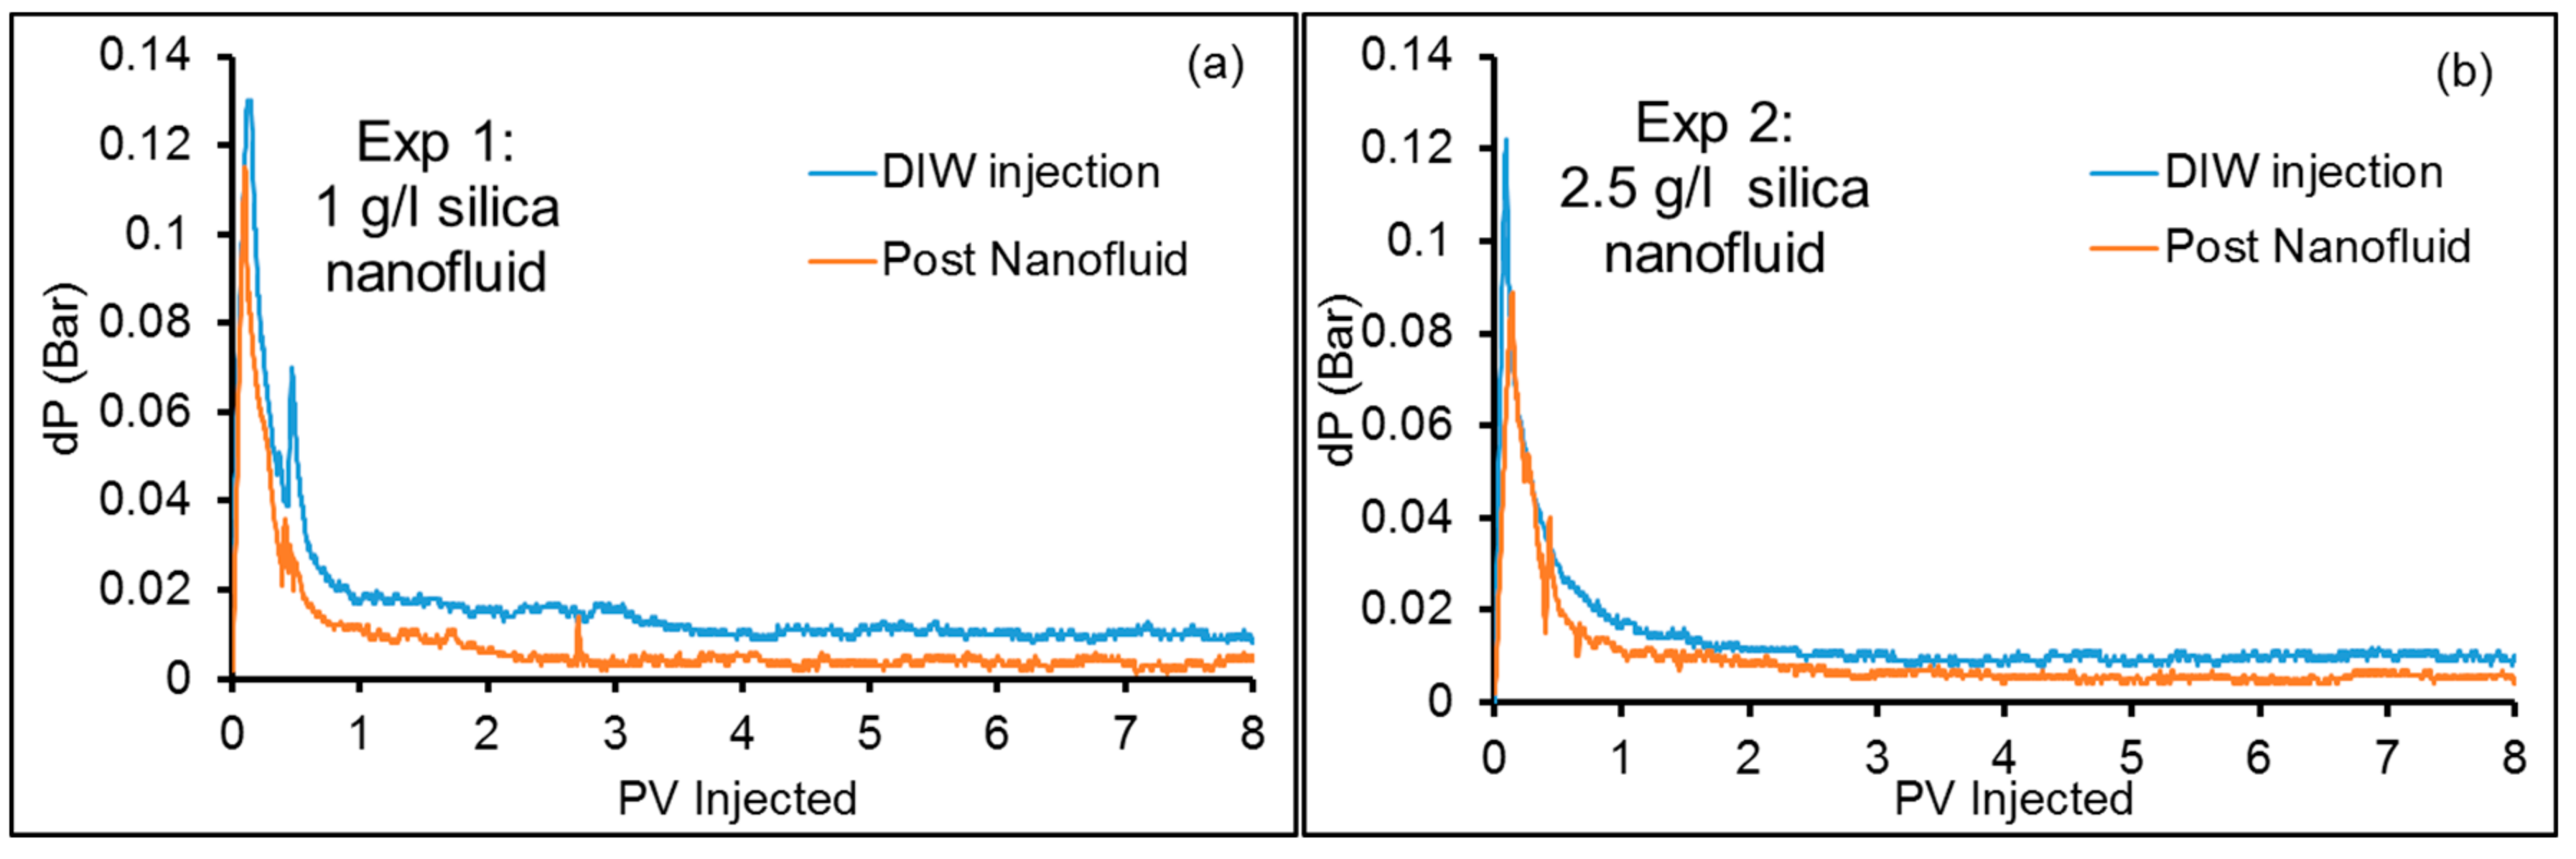
Figure 5.
Pressure drop as function of injection rates (Experiment 3).

Figure 6.
SEM image of (a) berea sandstone sample; (b) berea sandstone treated with nanofluid; (c) magnified look at the adsorbed/adhered silica.
Figure 6.
SEM image of (a) berea sandstone sample; (b) berea sandstone treated with nanofluid; (c) magnified look at the adsorbed/adhered silica.
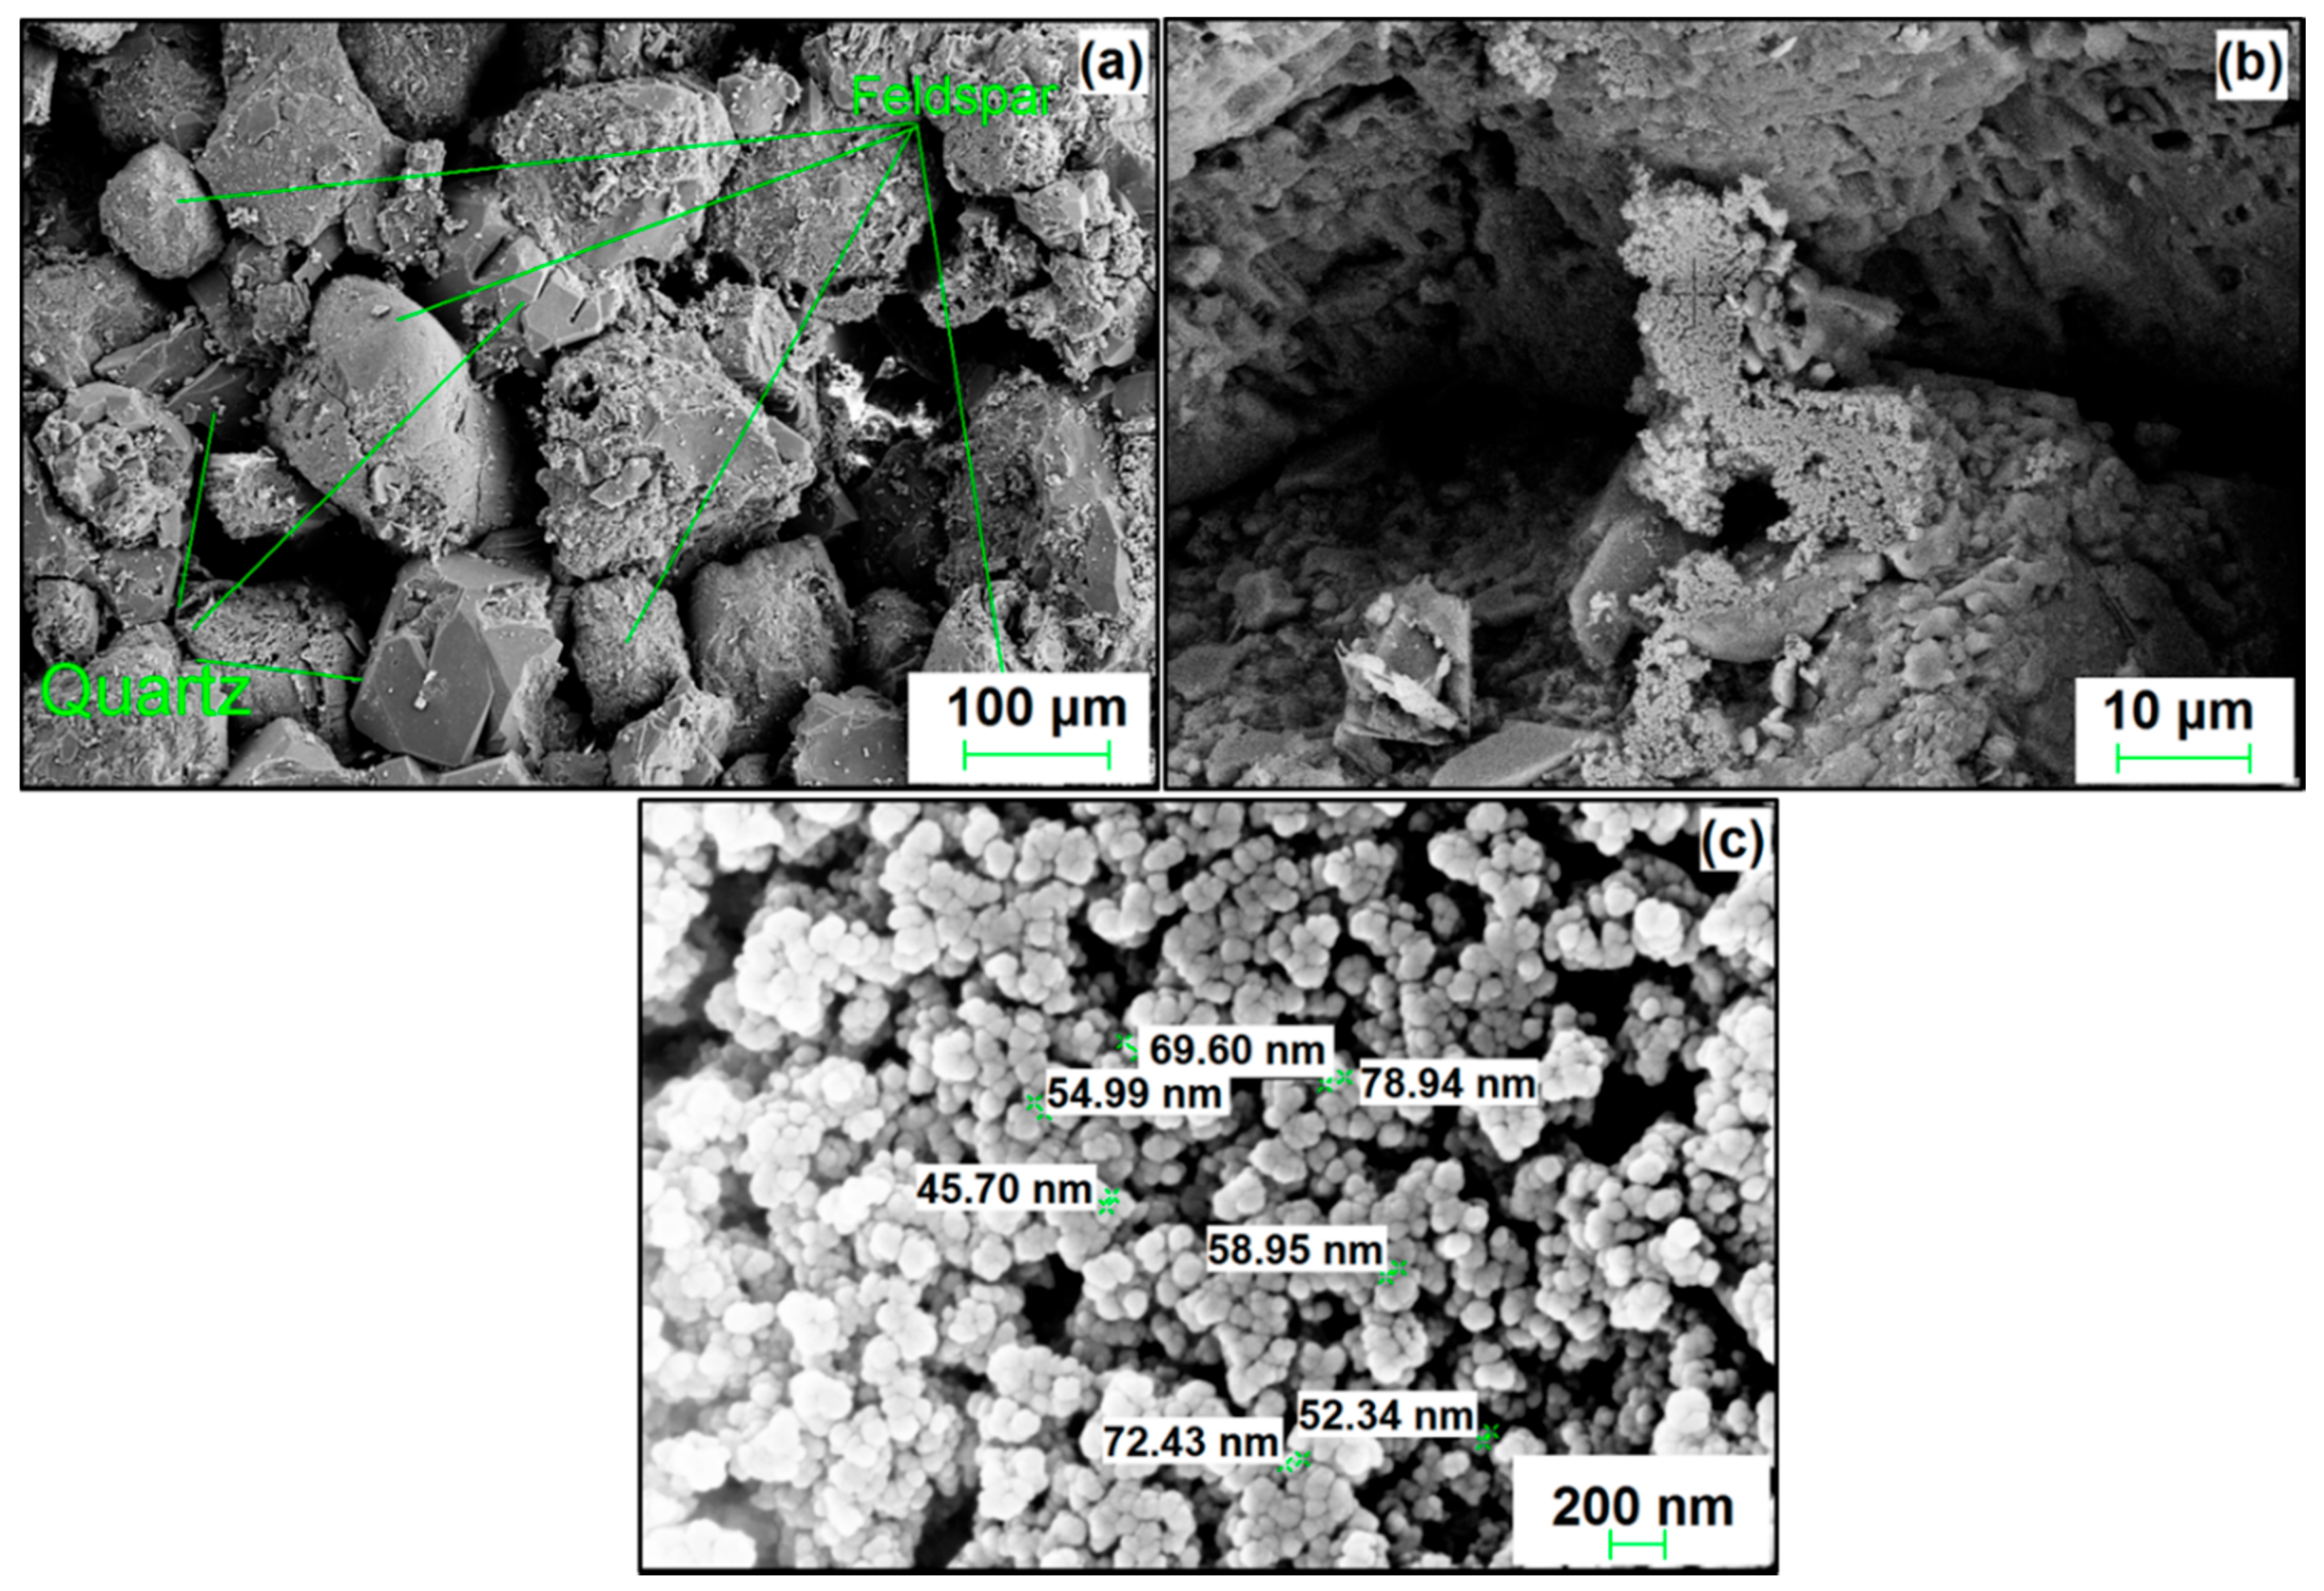
Figure 7.
(a) Effluent NP concentration profiles and (b) % adsorption of NP during post flush for cores saturated with silica dispersed in DIW with MPTMS stabilizing fluid (Experiments: 4–8).
Figure 7.
(a) Effluent NP concentration profiles and (b) % adsorption of NP during post flush for cores saturated with silica dispersed in DIW with MPTMS stabilizing fluid (Experiments: 4–8).

Figure 8.
Variation of the drop across the core (dP) during post flush with DIW after saturation of the core with MPTMS stabilized nanofluids at different NP concentrations of NP (Experiments 4–6).
Figure 8.
Variation of the drop across the core (dP) during post flush with DIW after saturation of the core with MPTMS stabilized nanofluids at different NP concentrations of NP (Experiments 4–6).
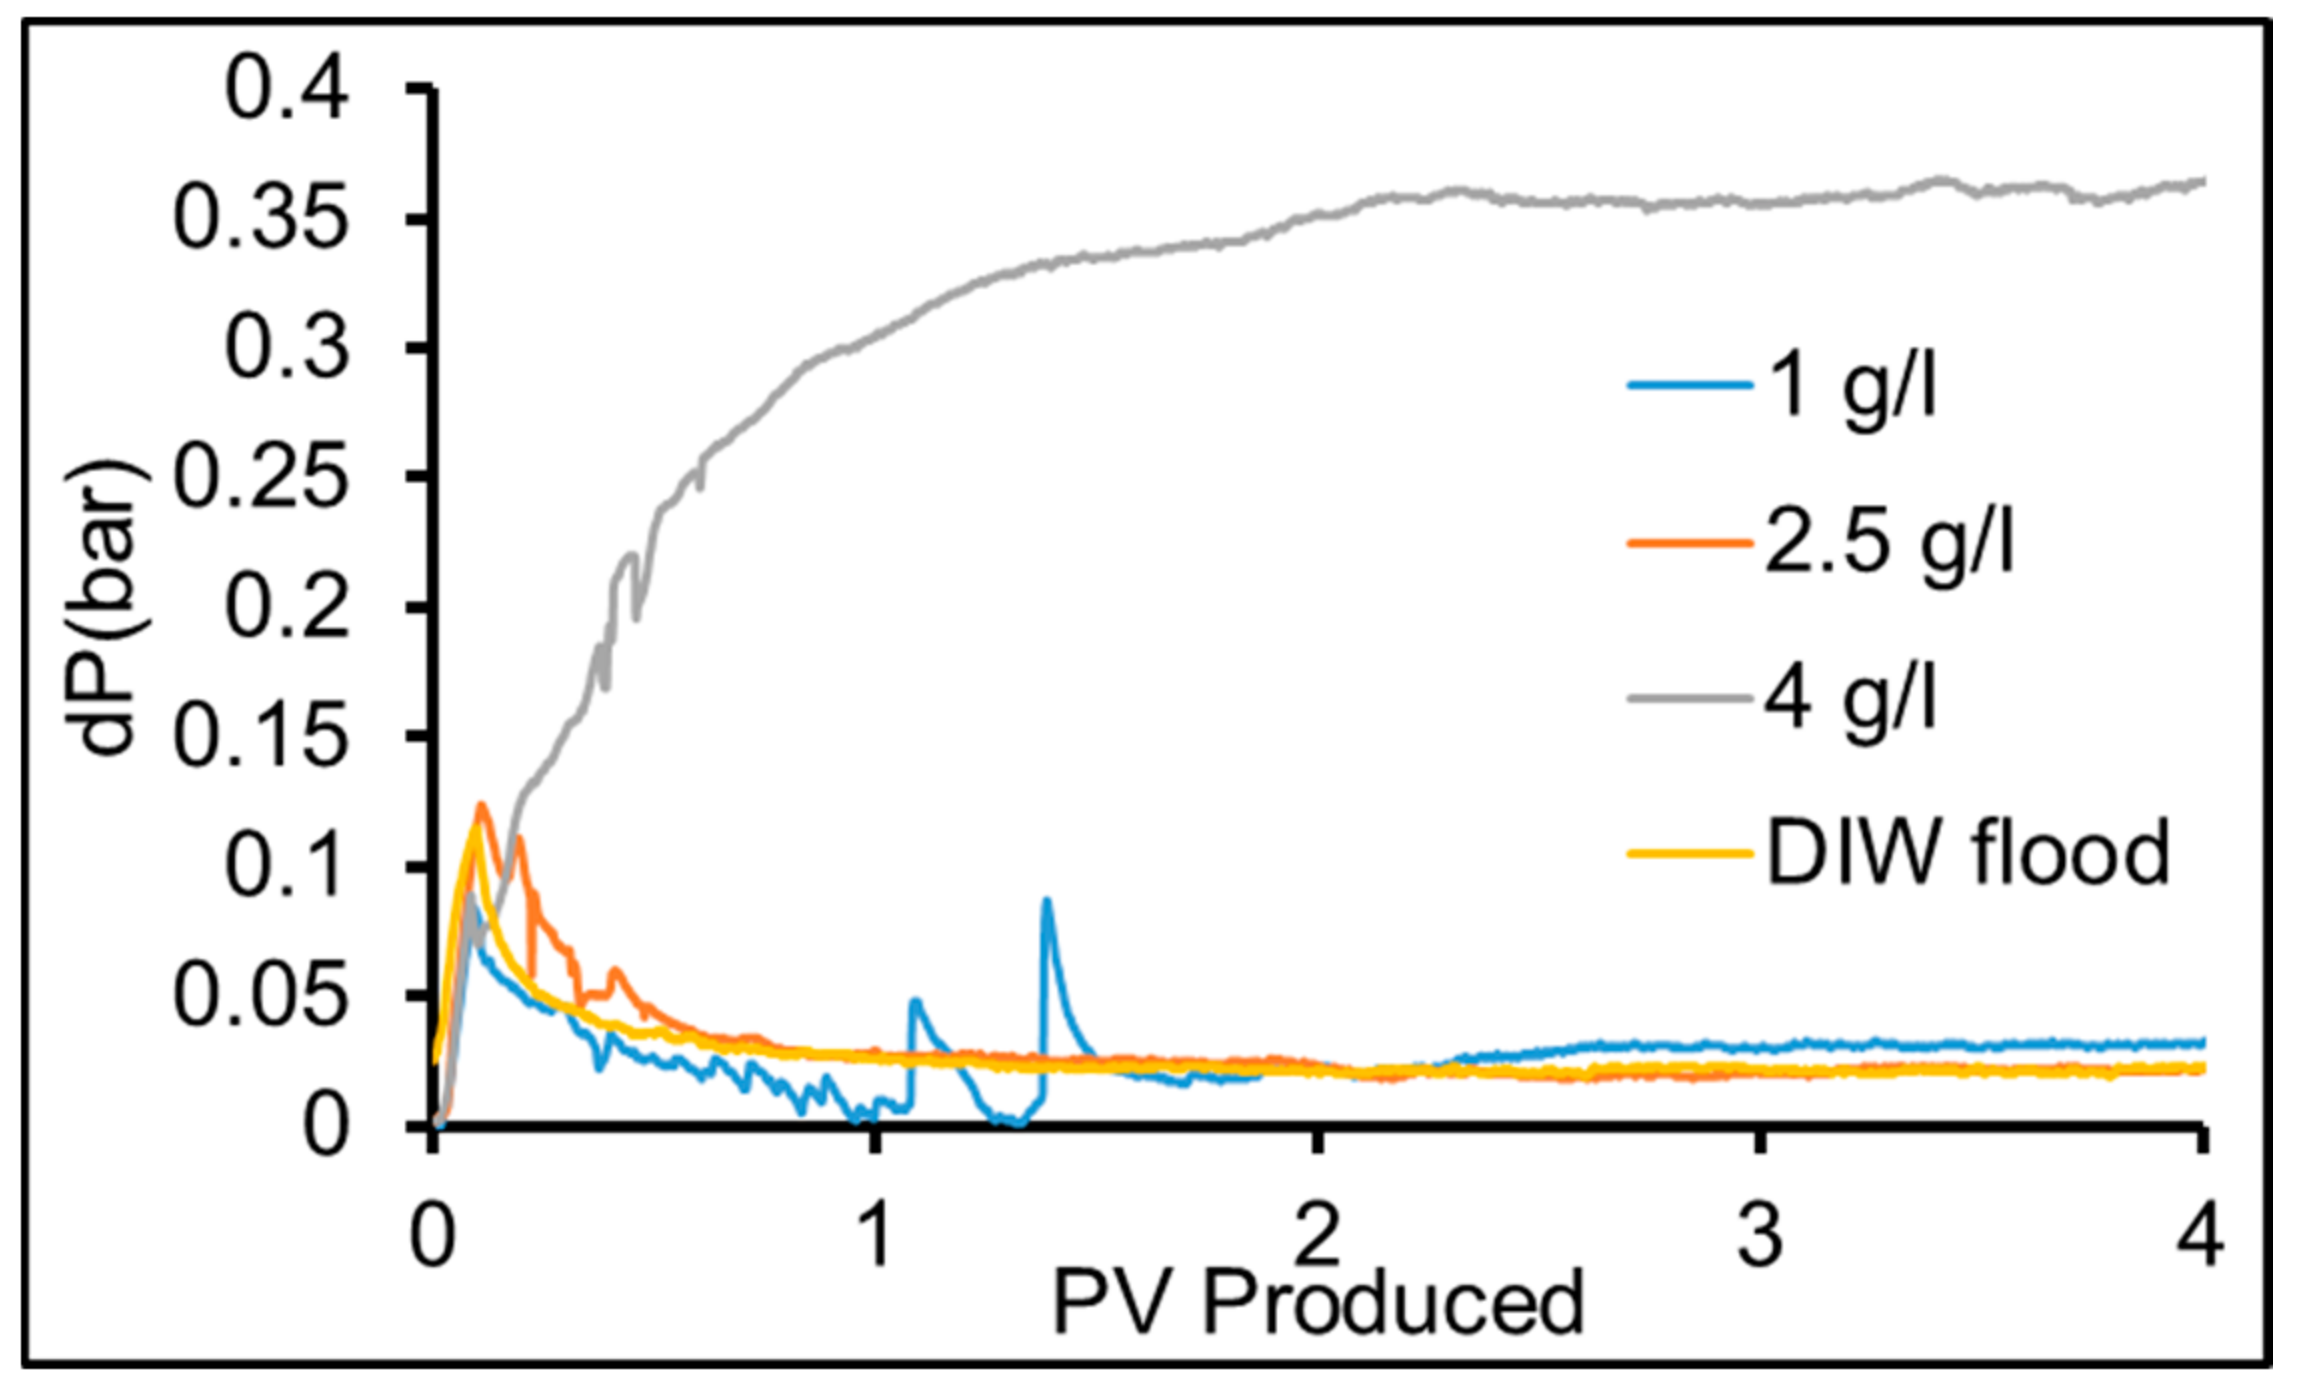
Figure 9.
Absorbed MPTMS for cores saturated with nanofluid stabilized with MPTMS (Experiments: 4–8).
Figure 9.
Absorbed MPTMS for cores saturated with nanofluid stabilized with MPTMS (Experiments: 4–8).

Figure 10.
(a) Comparison of effluent concentration profiles of the different types of nanofluid (concentration of NP: 1 g/L) silica, sulfonated and silica with stabilizing fluid; (b) Pressure drop profiles for core treated with sulfonated NP.
Figure 10.
(a) Comparison of effluent concentration profiles of the different types of nanofluid (concentration of NP: 1 g/L) silica, sulfonated and silica with stabilizing fluid; (b) Pressure drop profiles for core treated with sulfonated NP.

Figure 11.
Specific adsorption of NP (mg/m2) on quartz and kaolinite.

Figure 12.
Interaction potential between the mineral and (a) unmodified silica; (b) sulfonated silica; and (c) unmodified silica + MPTMS.
Figure 12.
Interaction potential between the mineral and (a) unmodified silica; (b) sulfonated silica; and (c) unmodified silica + MPTMS.

Figure 13.
Dimensionless form of Interaction potential for interaction between the fines and the berea mineral for reference case (no NP), berea treated with silica and berea treated with sulfonated silica.
Figure 13.
Dimensionless form of Interaction potential for interaction between the fines and the berea mineral for reference case (no NP), berea treated with silica and berea treated with sulfonated silica.

Table 1.
Properties and mineral composition of used Berea sandstone.
| Core Properties | Mineral Composition of Berea | ||
|---|---|---|---|
| Type | Berea Sandstone | Mineral Name | Semi-Quantitative (%) |
| Length | 8.95 ± 0.08 cm | Quartz | 94 |
| Diameter | 3.78 cm | Kaolinite | 1 |
| Porosity | 20.05 ± 0.76% | Muscovite | 1 |
| Permeability | 200–220 mD | Microline | 1 |
Table 2.
Particle Size and Zeta potential measurements. DIW: Deionized water; MPTMS 3-Mercaptopropyl Trimethoxysilane; NA: Not Applicable; DLS: Dynamic Light Scattering; ESA: Electrostatic Attenuation.
Table 2.
Particle Size and Zeta potential measurements. DIW: Deionized water; MPTMS 3-Mercaptopropyl Trimethoxysilane; NA: Not Applicable; DLS: Dynamic Light Scattering; ESA: Electrostatic Attenuation.
| Material | Conc (g/L) | Dispersing Phase | Zeta Potential (mV) | Particle Radius (nm) | Method |
|---|---|---|---|---|---|
| Silica | 1 | DIW | −51.45 | 161.2 | DLS |
| Sulfonated Silica | 1 | DIW | −44.8 | 182.9 | DLS |
| Silica | 1 | DIW + 1 g/100 mL MPTMS | −47.75 | 153.3 | DLS |
| Powdered Berea | 10 | DIW | −29.53 | NA | ESA |
| Quartz powder | 10 | DIW | −5.732 | NA | ESA |
| Kaolinite powder | 10 | DIW | −9.097 | NA | ESA |
Table 3.
List of injection experiments performed in this study.
| Experiment No. | NP Conc. (g/L) | Type of NP | Dispersing Phase | Comments |
|---|---|---|---|---|
| 1 | 1 | Silica | DIW | |
| 2 | 2.5 | Silica | DIW | |
| 3 | 1 | Silica | DIW | Performed at varying injection rates |
| 4 | 1 | Silica | DIW + MPTMS (1 g/100 mL) | |
| 5 | 2.5 | Silica | DIW + MPTMS (1 g/100 mL) | |
| 6 | 4 | Silica | DIW + MPTMS (1 g/100 mL) | |
| 7 | 1 | Silica | DIW + MPTMS (1 g/100 mL) | Repeated Experiment 4 |
| 8 | 2.5 | Silica | DIW + MPTMS (1 g/100 mL) | Repeated Experiment 5 |
| 9 | 1 | Sulfonated | DIW |
Table 4.
Size classes of the fine particles.
| Radius of Fine Particles (nm) | Intensity (%) |
|---|---|
| 233.8 | 73.0 |
| 68.57 | 24.2 |
| 2687 | 2.8 |
© 2017 by the authors. Licensee MDPI, Basel, Switzerland. This article is an open access article distributed under the terms and conditions of the Creative Commons Attribution (CC BY) license (http://creativecommons.org/licenses/by/4.0/).
Share and Cite
MDPI and ACS Style
Abhishek, R.; Hamouda, A.A. Effect of Various Silica Nanofluids: Reduction of Fines Migrations and Surface Modification of Berea Sandstone. Appl. Sci. 2017, 7, 1216. https://doi.org/10.3390/app7121216
AMA Style
Abhishek R, Hamouda AA. Effect of Various Silica Nanofluids: Reduction of Fines Migrations and Surface Modification of Berea Sandstone. Applied Sciences. 2017; 7(12):1216. https://doi.org/10.3390/app7121216
Chicago/Turabian StyleAbhishek, Rockey, and Aly A. Hamouda. 2017. "Effect of Various Silica Nanofluids: Reduction of Fines Migrations and Surface Modification of Berea Sandstone" Applied Sciences 7, no. 12: 1216. https://doi.org/10.3390/app7121216
Note that from the first issue of 2016, this journal uses article numbers instead of page numbers. See further details here.