Design of a Road Simulator for Motorcycle Applications


1
Department of Industrial and Mechanical Engineering, Automotive Group, University of Brescia, Brescia I-25123, Italy
2
Departamento de Engenharia Mecanica, Universidade de Sao Paulo, Sao Paulo 05508-010, Brasil
*
Author to whom correspondence should be addressed.
Appl. Sci. 2017, 7(12), 1220; https://doi.org/10.3390/app7121220
Submission received: 16 October 2017
/
Revised: 18 November 2017
/
Accepted: 23 November 2017
/
Published: 25 November 2017
(This article belongs to the Section Mechanical Engineering)
Abstract
:Four-wheeled vehicles are often tested on indoor, four-poster road simulator rigs. Road loads are simulated with the use of servo-hydraulic systems for suspension set-up optimisation, NVH analysis, and fatigue life cycles. The use of a road simulator is not such a common practice for two-wheeled vehicles despite problems to be faced being extremely similar. The paper presents a device for testing motorcycles on a Servotest® four-poster. A dedicated restraint system had to be devised in order to support the motorcycle without altering its inertial characteristics. Additional pneumatic actuators with a purposely developed instrumentation have been designed to reproduce braking and power thrusts.
1. Introduction
Developments in mechanical engineering and design require increasingly more effort in terms of computing and modelling, especially in the automotive industry where advanced computer models can help to reduce expensive and time-consuming track/road tests, and save time and resources. In order to be successful, this approach should rely on validated models which are proven to be effective and reliable.
A four-poster test rig is a servo-hydraulic road simulator that excites an unrestrained road vehicle through its tyres to determine some of the dynamic characteristics of the vehicle, with particular regard to the suspension system. The excitation can be:
- Fed in terms of heave, roll, and pitch
- Aimed at resonance frequency tracking
- Aimed at reproducing an acceleration/load history vs. time as recorded in road testing.
The so-called four-poster can be used to validate models of a generic four-wheeled vehicle with regard to vertical dynamics, fatigue durability and suspension tuning [1,2,3]. Activities like NVH testing, comfort evaluation [4,5,6], and the search for natural frequencies and vibration modes can be carried out as well. Automotive engineers consider the four-poster a key device in developing their product and the same considerations can be made for the motorcycle industry [7,8,9].
Indoor suspension testing and development can be an effective support to either simulation or outdoor testing, thus reducing vehicle time-to-market. Test techniques give a valuable insight into a range of parameters that would normally take significant road testing effort to achieve.
Very similar needs are in focus when it comes to motorcycles; in this case, the unrestrained condition is not so easily achievable since the vehicle is not self-supporting.
A survey showed that similar works in the literature present systems that are mainly focused on human-machine interfaces, comfort characterization, and riding simulation over different scenarios, with the aim of improving road safety [1,10,11,12,13,14,15]. They are conceived to evaluate the rider’s subjective feeling or to train riders to face various situations, from normal riding to emergency manoeuvres and, except for [1], they are not able to employ a real-world motorbike. The proposed system has been conceived as an engineering tool and it is aimed at the evaluation of the motorcycle vertical dynamic behaviour and its interaction with the road. It is, therefore, based on the use of a real-world motorcycle, so that subjective feedback coming from the rider can be integrated with objective data coming from the investigation of natural frequencies, wheel hub acceleration and displacement, chassis movement, suspension characterisation, and fatigue testing, and from NVH analysis in general.
To date very few research and development facilities in the world feature a system able to perform the above-mentioned activities on a free-standing motorcycle. A search for similar test rigs gave no results in Southern Europe, hence, the University of Brescia, and the Department of Mechanical and Industrial Engineering, in particular, decided to retrofit a four-poster test rig with a custom-designed fixture to perform tests on two-wheeled vehicles as well. In this case the motorbike (bike) is resting on two of the four actuators and an aluminium structure in such a way that the dynamic response is not affected.
The motorcycle is restrained so that it is free to move around the centre of gravity, i.e., in pitch as well as along the vertical direction in order to enable interaction between longitudinal and vertical dynamics, which is of particular interest on motorbikes. Two pneumatic actuators have been added with the specific intent to simulate longitudinal forces due to acceleration and braking and replicate suspension, as well as fork/chassis, deflections.
The fixture has been designed with a modular approach using extruded aluminium components so that it can be easily modified to accommodate vehicles with different geometry. The bike is connected by means of a set of adjustable connecting rods (at least three per side) to a sledge providing both vertical and pitch degrees of freedom.
2. Materials and Methods
2.1. Support System Requirements and Design
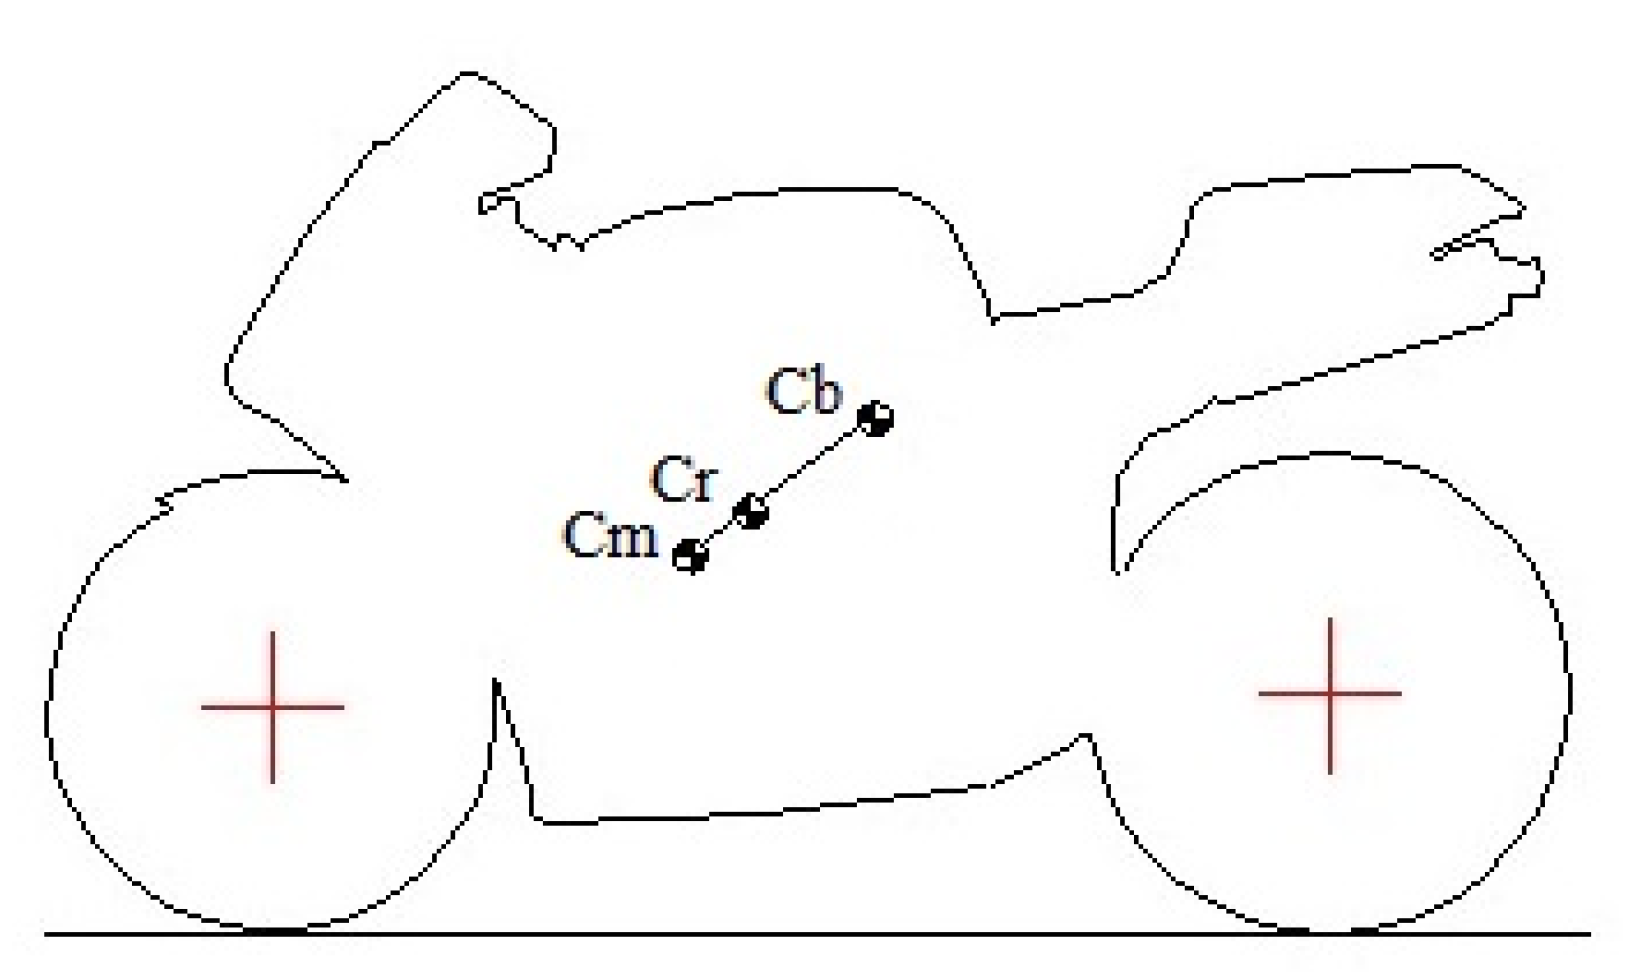
As stated in Section 1, the support system should leave the motorcycle unrestrained to simulate riding while leaving the vehicle/rider mass and moment of inertia unaltered as much as possible. Such an issue is critical since the rider mass is about 35% of the total vehicle system. Moreover, the rider bends forward to reduce drag along the straights, then raises himself while braking and leans into the corner, thus moving the centre of mass and varying the moment of inertia. The location of the centre of mass was measured for the bike alone, as well as with rider in the straight and braking positions (see Figure 1). The moment of inertia was accurately measured with the well-known pendulum system [16] and, consequently, an equivalent rider mass was devised to obtain a realistic mass distribution.
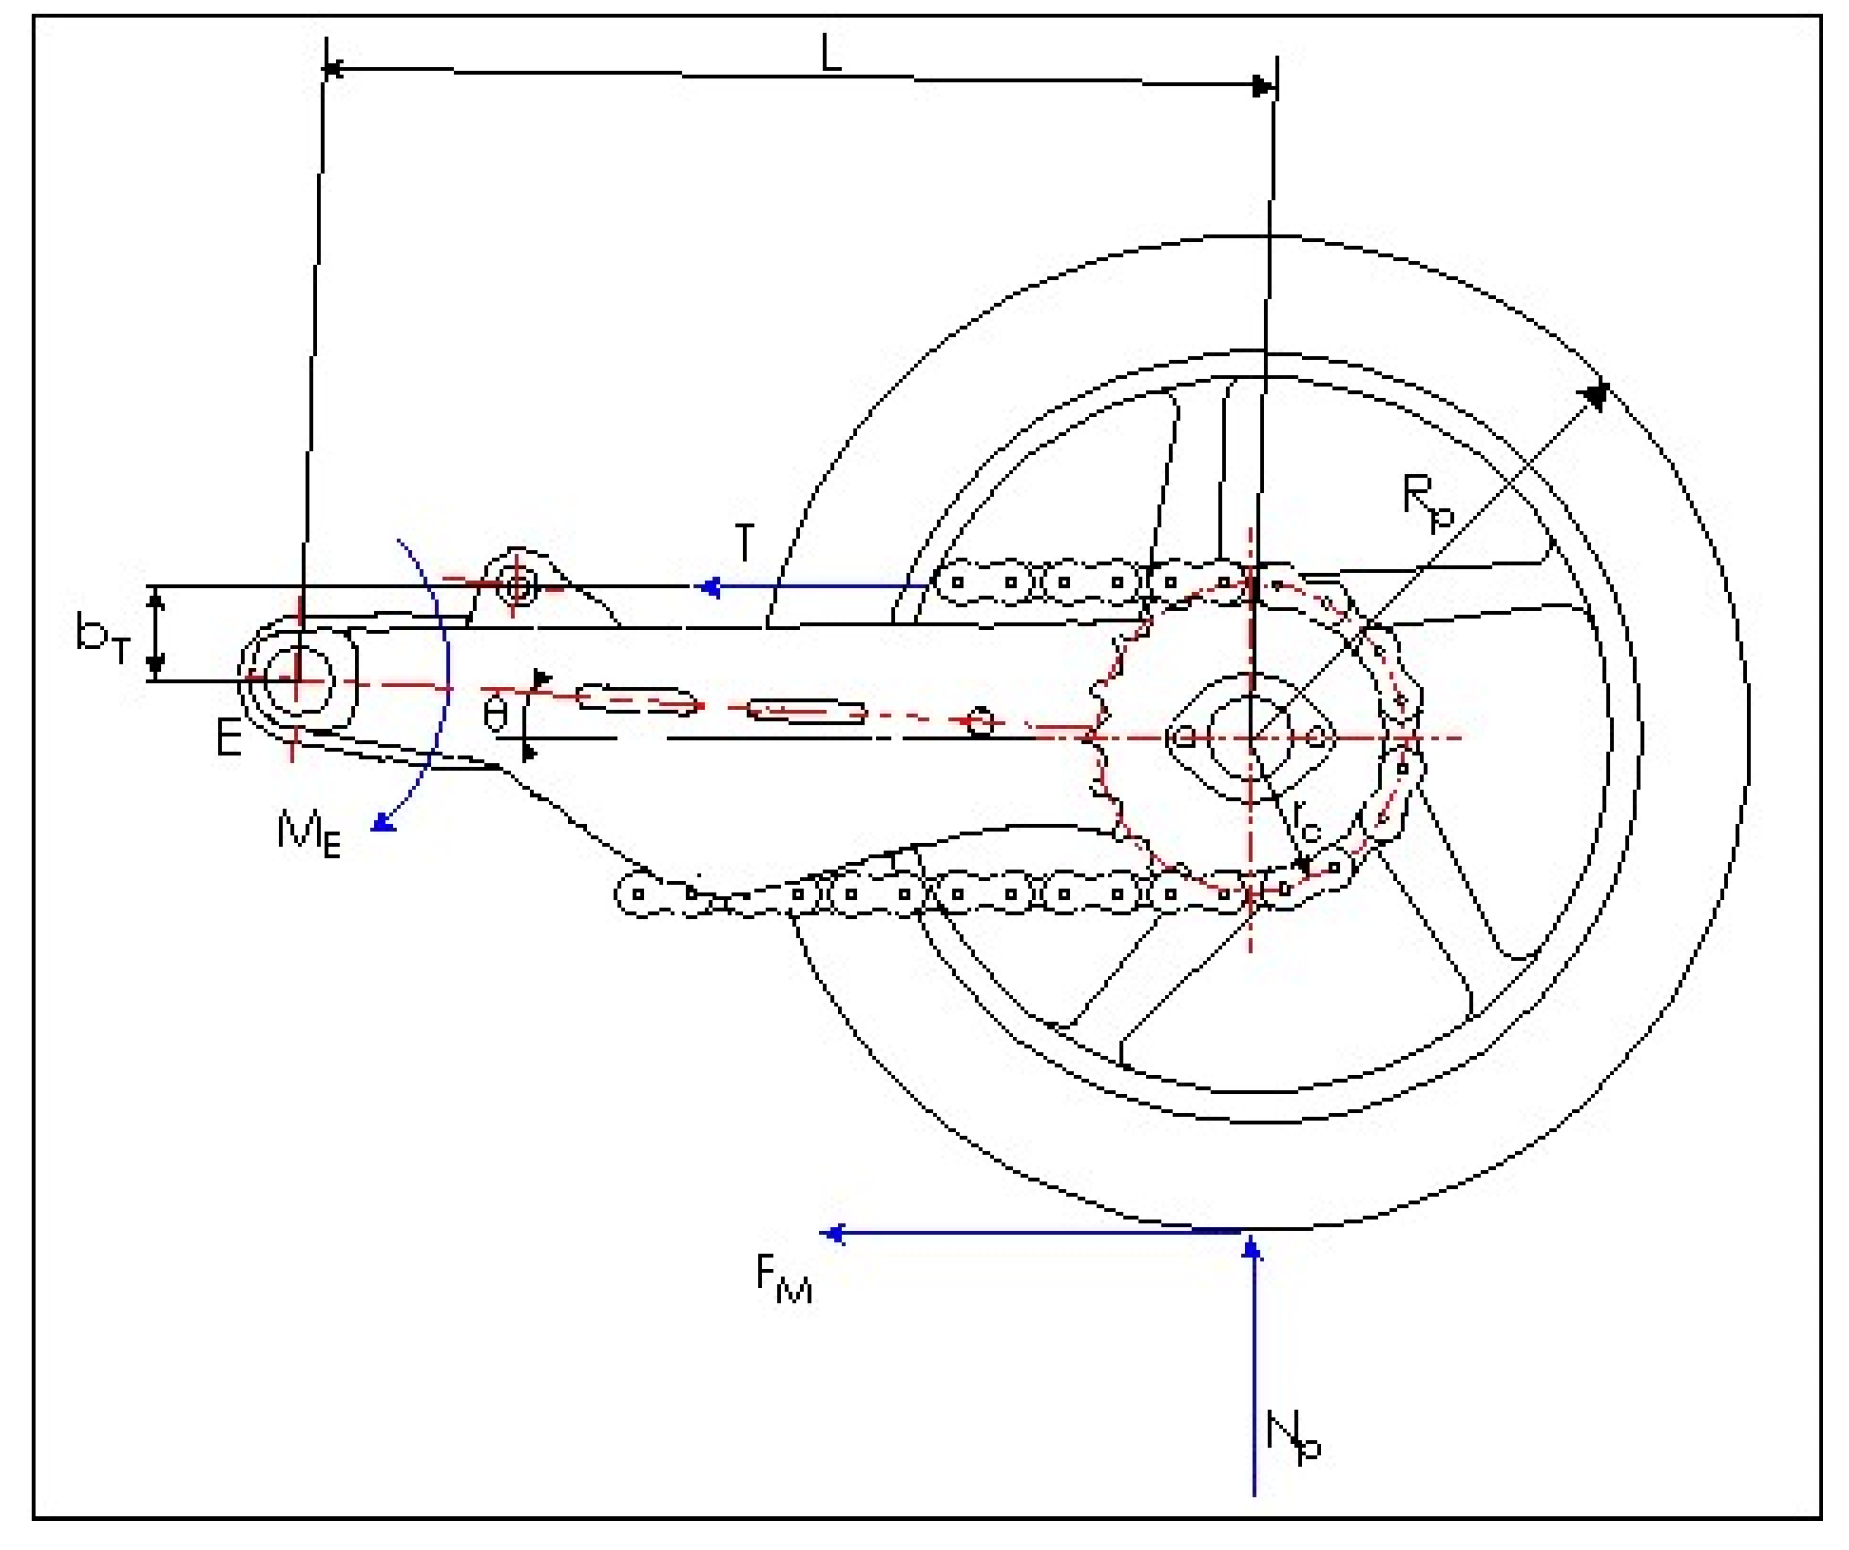
Due to a relatively high centre of mass in conjunction with a short wheelbase and high power-to-weight ratio, the interaction between the vertical and longitudinal dynamics is another key parameter to be taken into account. The chain tension in particular can heavily affect the response of the rear suspension under power (see Figure 2) while the front fork can show a tendency to stick up in heavy braking [17], thus jeopardising the ability to cope with small amplitude, high-frequency road bumps. Therefore, the test system should be able to apply power or braking torque while leaving the tyres free to leave the ground as they occasionally do under heavy longitudinal acceleration or on severe bumps.
Again, as mentioned in Section 1, a standard four-poster rig has been retrofitted with a custom-designed fixture able to hold the motorcycle in the upright position without adding unnecessary restraints.
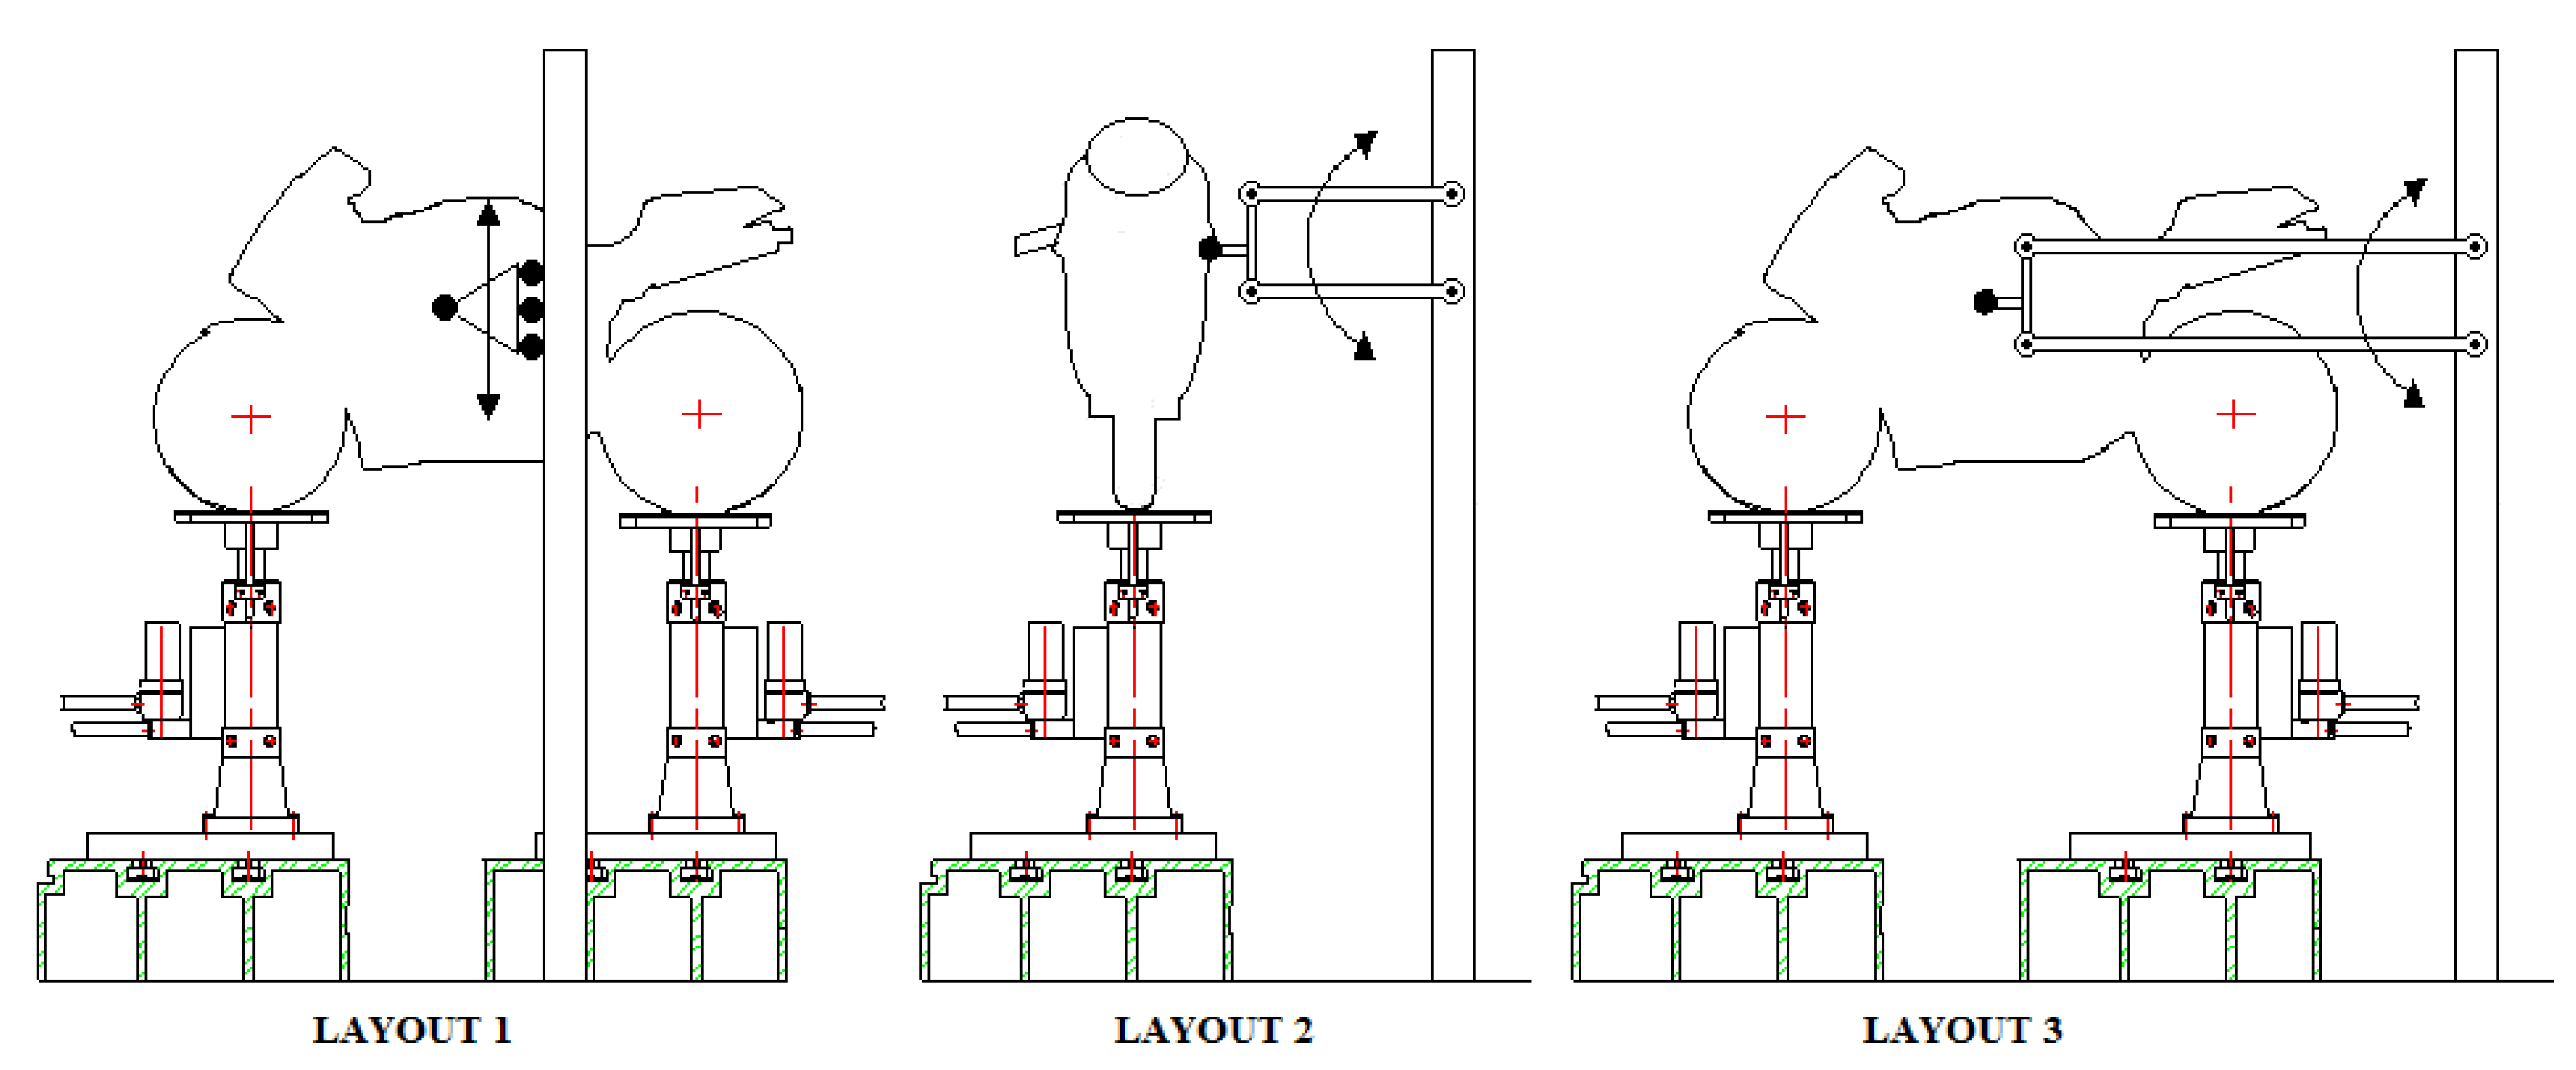
Three different layouts were considered at first, as shown in Figure 3.
Layout 2 was discarded due to its asymmetric shape with the resulting lateral scrub between tires and actuator pads during system motion. Layout 3 was discarded for stiffness reasons and the resulting longitudinal movements during system operation. Furthermore, the two long connecting rods can affect system inertia hence dynamics. Therefore, the proposed layout is the first one in Figure 3, since it is able to hold the motorcycle without affecting its dynamic response. Moreover, the connecting rods are very short and stiffness and inertia issues can be avoided.
Such a layout is based on two low-friction, recirculating ball linear guides along the vertical axis. These are off-the-shelf components deemed to reduce undesired side effects like slip-stick friction, resonances, and additional inertia. Their mass is close to the average rider’s weight and can be adjusted by adding or removing ballast.
The main structure supporting the twin-sledge system was then designed using commercial extruded aluminium modular components instead of a more traditional welded steel structure. The advantage of this solution is that the structure is lighter and easier to build in-house, and the need for machined components was almost completely avoided. FEM (Finite Element Method) analysis was employed to ensure that natural frequencies of the structure are well beyond the typical frequency range of vehicle ride dynamics. Moreover, bolted junctions can help to dampen vibrations more efficiently due to friction in the contact area. The schematic picture reported in Figure 4 shows the final layout of the road simulator.
A pivot mounted on low-friction bushings is placed on the two previously-mentioned sledges. The pivot—whose axis requires careful alignment with the bike centre of gravity—is then connected to the motorbike chassis via three conrods with ball-joint ends to provide an isostatic restraint, so that pitch oscillation around the CG (Center of Gravity) is free (see Figure 4, Figure 5 and Figure 6).
The use of modular aluminium components for the support structure makes it versatile and suitable for further developments. It can accommodate motorcycles of any size and geometry.
2.2. Power and Braking Torque Application
As stated in Section 2.1 and in [17] the interaction between vertical and longitudinal dynamics is not negligible, especially on sports and racing motorbikes. Since the target of the whole system is the simulation of ride characteristics when the vehicle is running in a straight line—from corner exit under power, to the following braking—a device which simulates the application of power and braking torque is required. Such a system should not provide any additional unsprung mass and should also leave the vertical wheel motion unaffected.
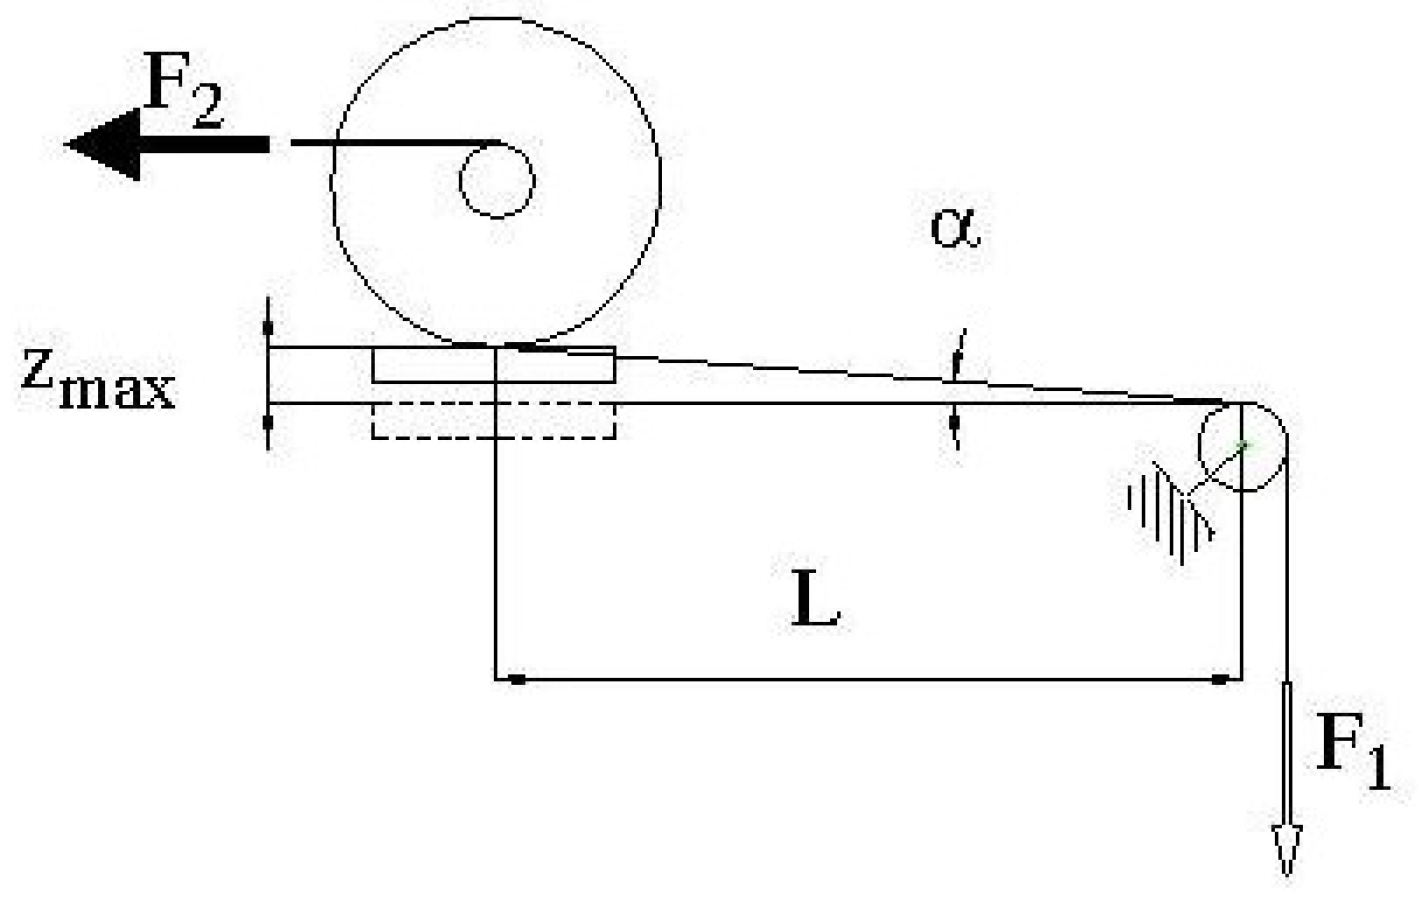
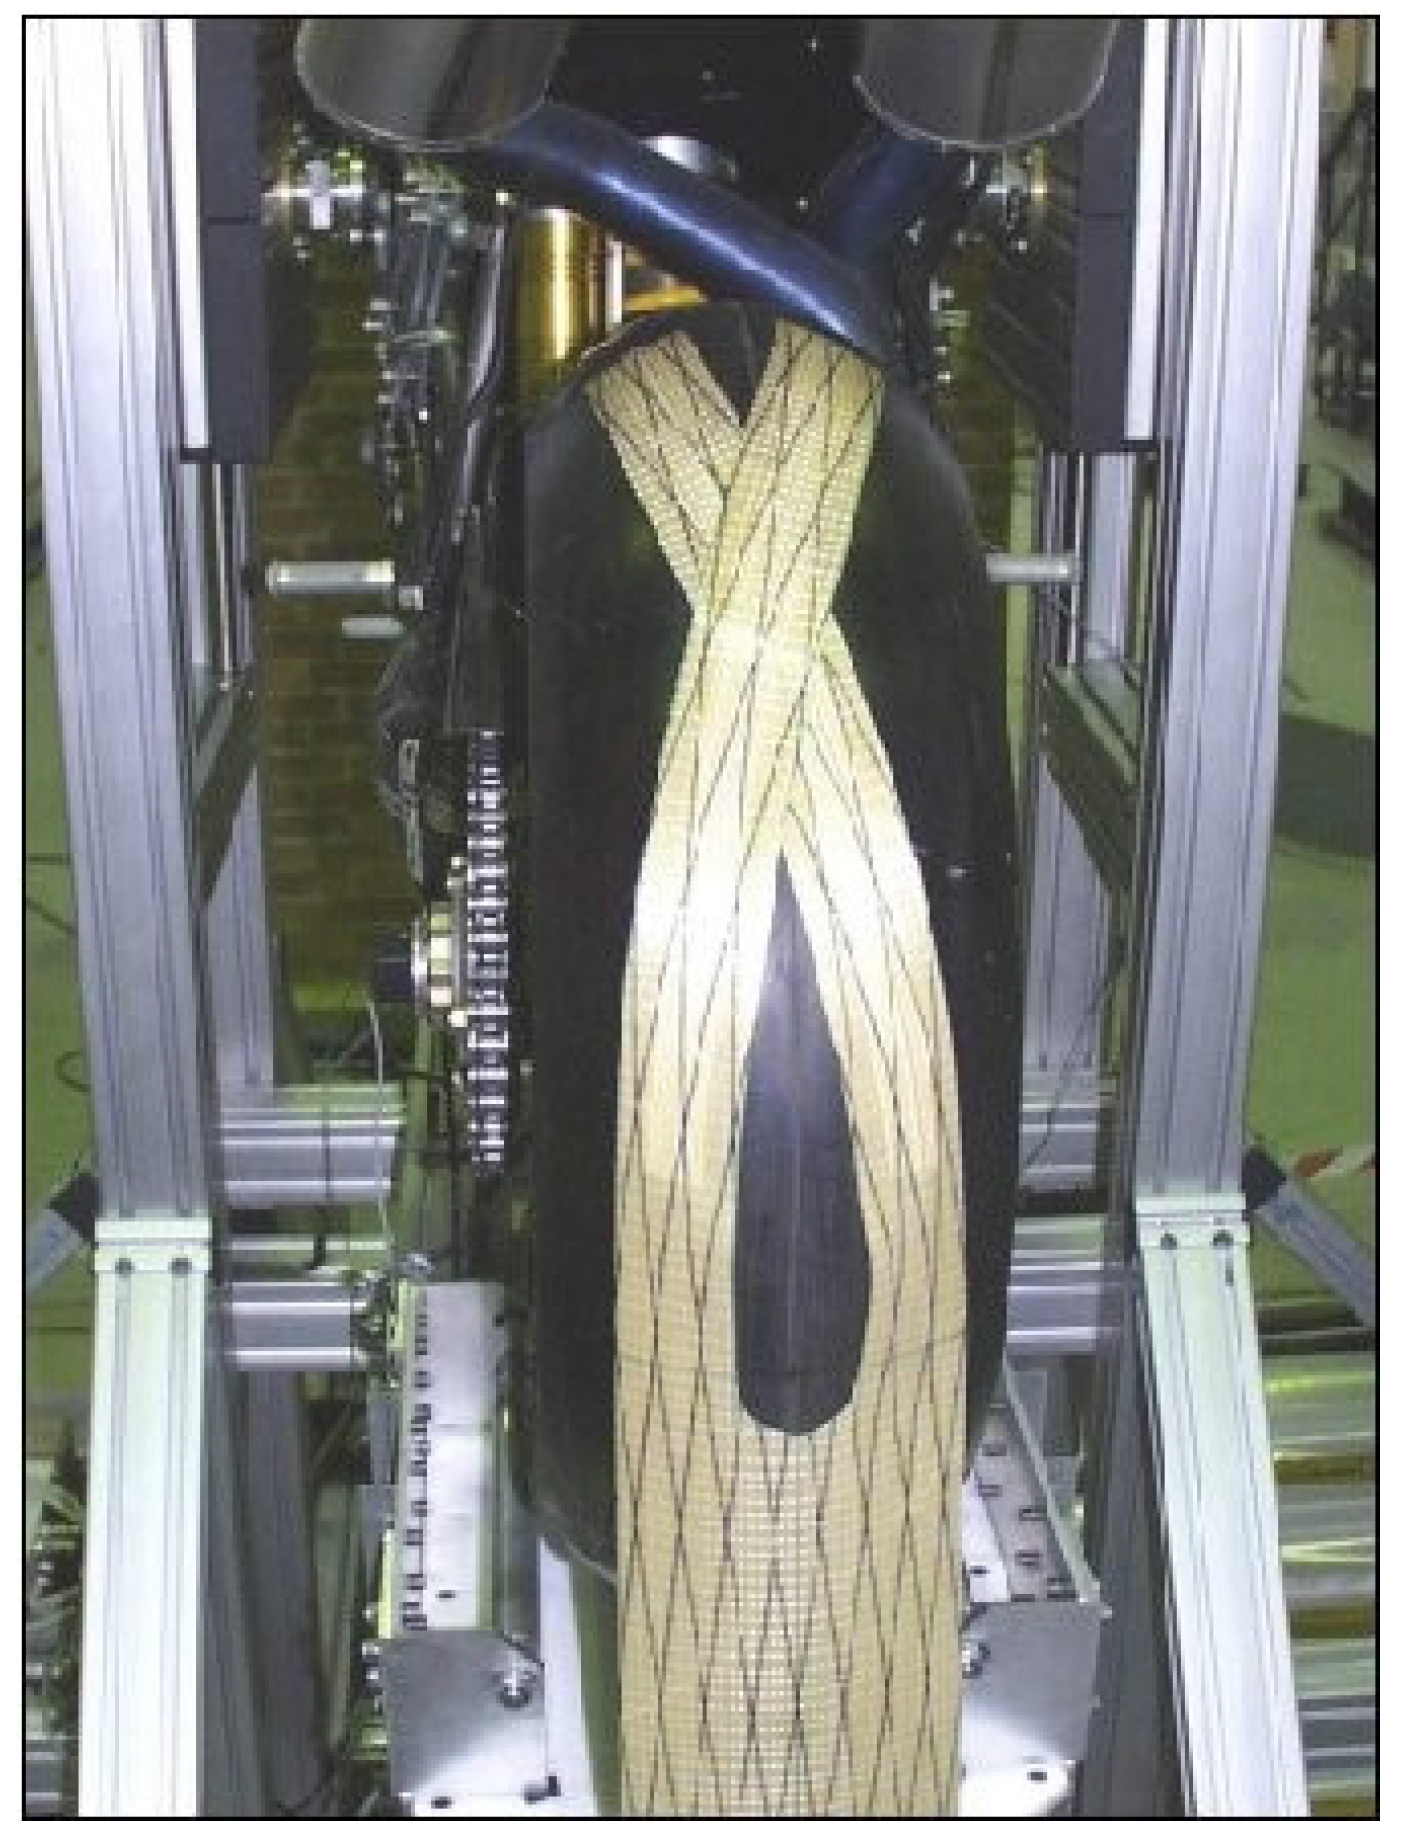
A cable system was purposely conceived (see Figure 4 and Figure 7) which is compatible with small wheel displacements; the cable is tensioned by a pneumatic actuator controlled in closed-loop force mode. A fast response of the pneumatic actuators is not required since the rider input commands in acceleration and braking can be assumed as low-frequency signals. This force (F1 in Figure 7) is then transmitted through a pulley to a belt made of Mylar®, a composite material commonly used for manufacturing high-performance sails. The belt is bonded to the tyre tread as shown in Figure 8 and Figure 9. The results of a shear force test, performed on the bonded components using an Instron® test rig (Instron Engineering Corp., Norwood, MA, USA), are shown in Figure 10. They show that all the components (bonding included) can cope with this kind of stress.
The chain (on the rear wheel, for power simulation) or the front disc brake (for braking simulation) must be locked to provide adequate torque transmission to the bike chassis. With regard to Figure 7, the belt system transmits the force F1 (generated by the pneumatic actuator) to the wheel as a tractive force. The wheel is locked and reacts with force F2. The vertical component on the wheel is negligible for small displacements of Z, hence, the small α angles.
2.3. Power and Braking Torque Control; Data Acquisition
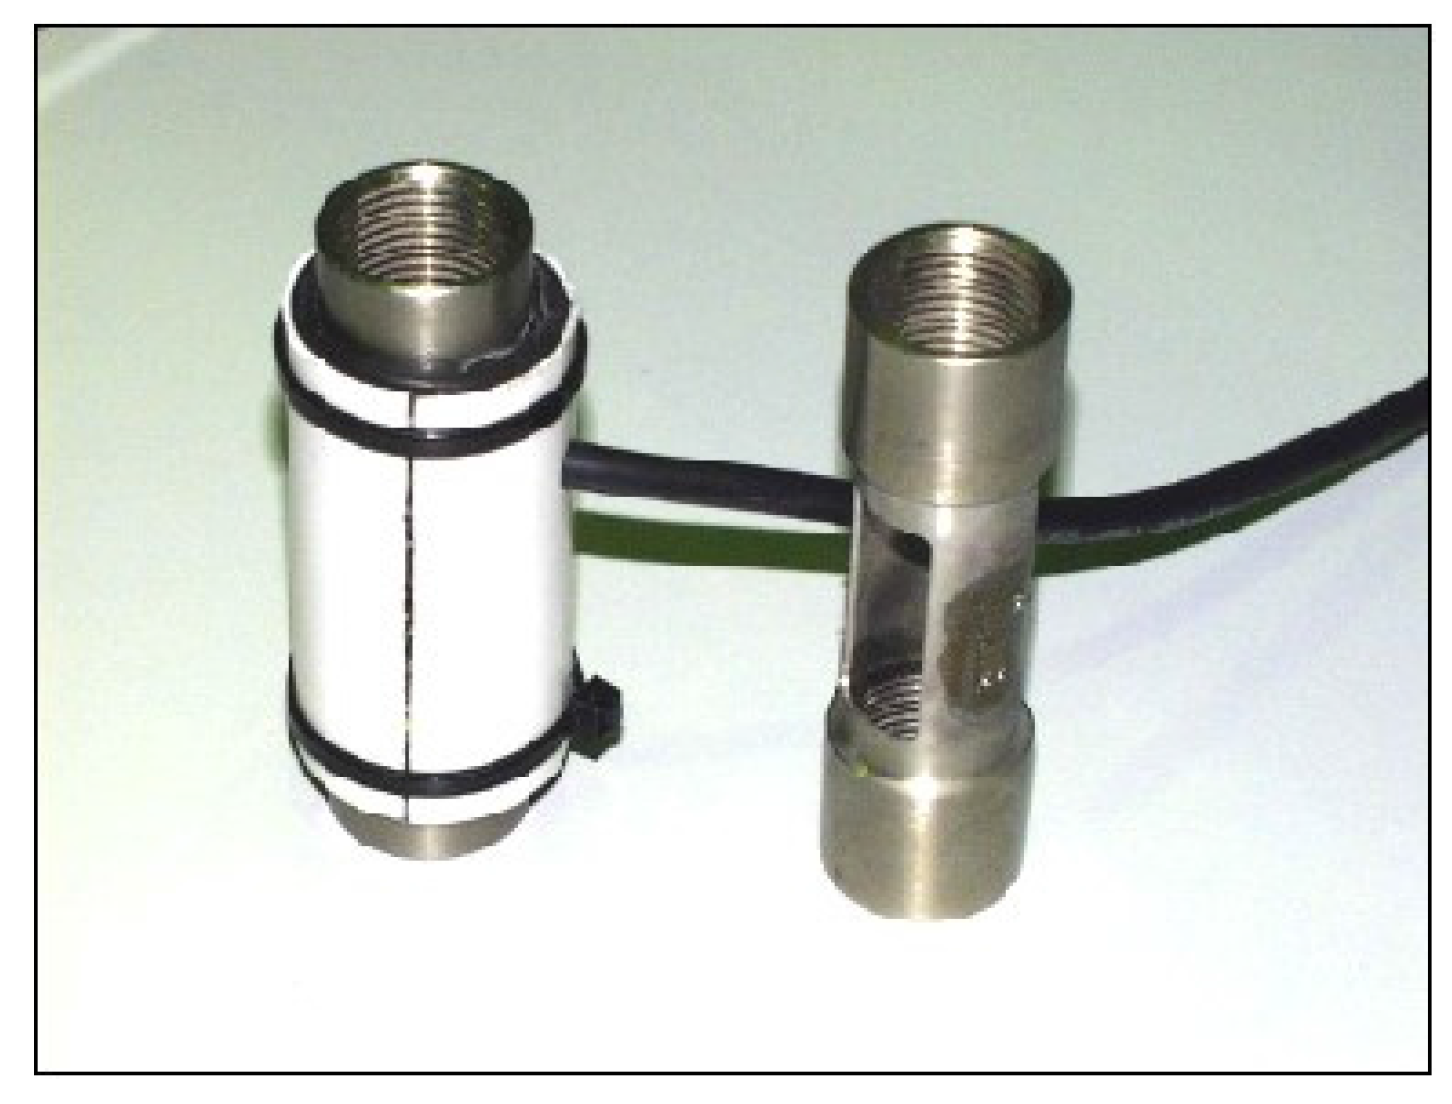
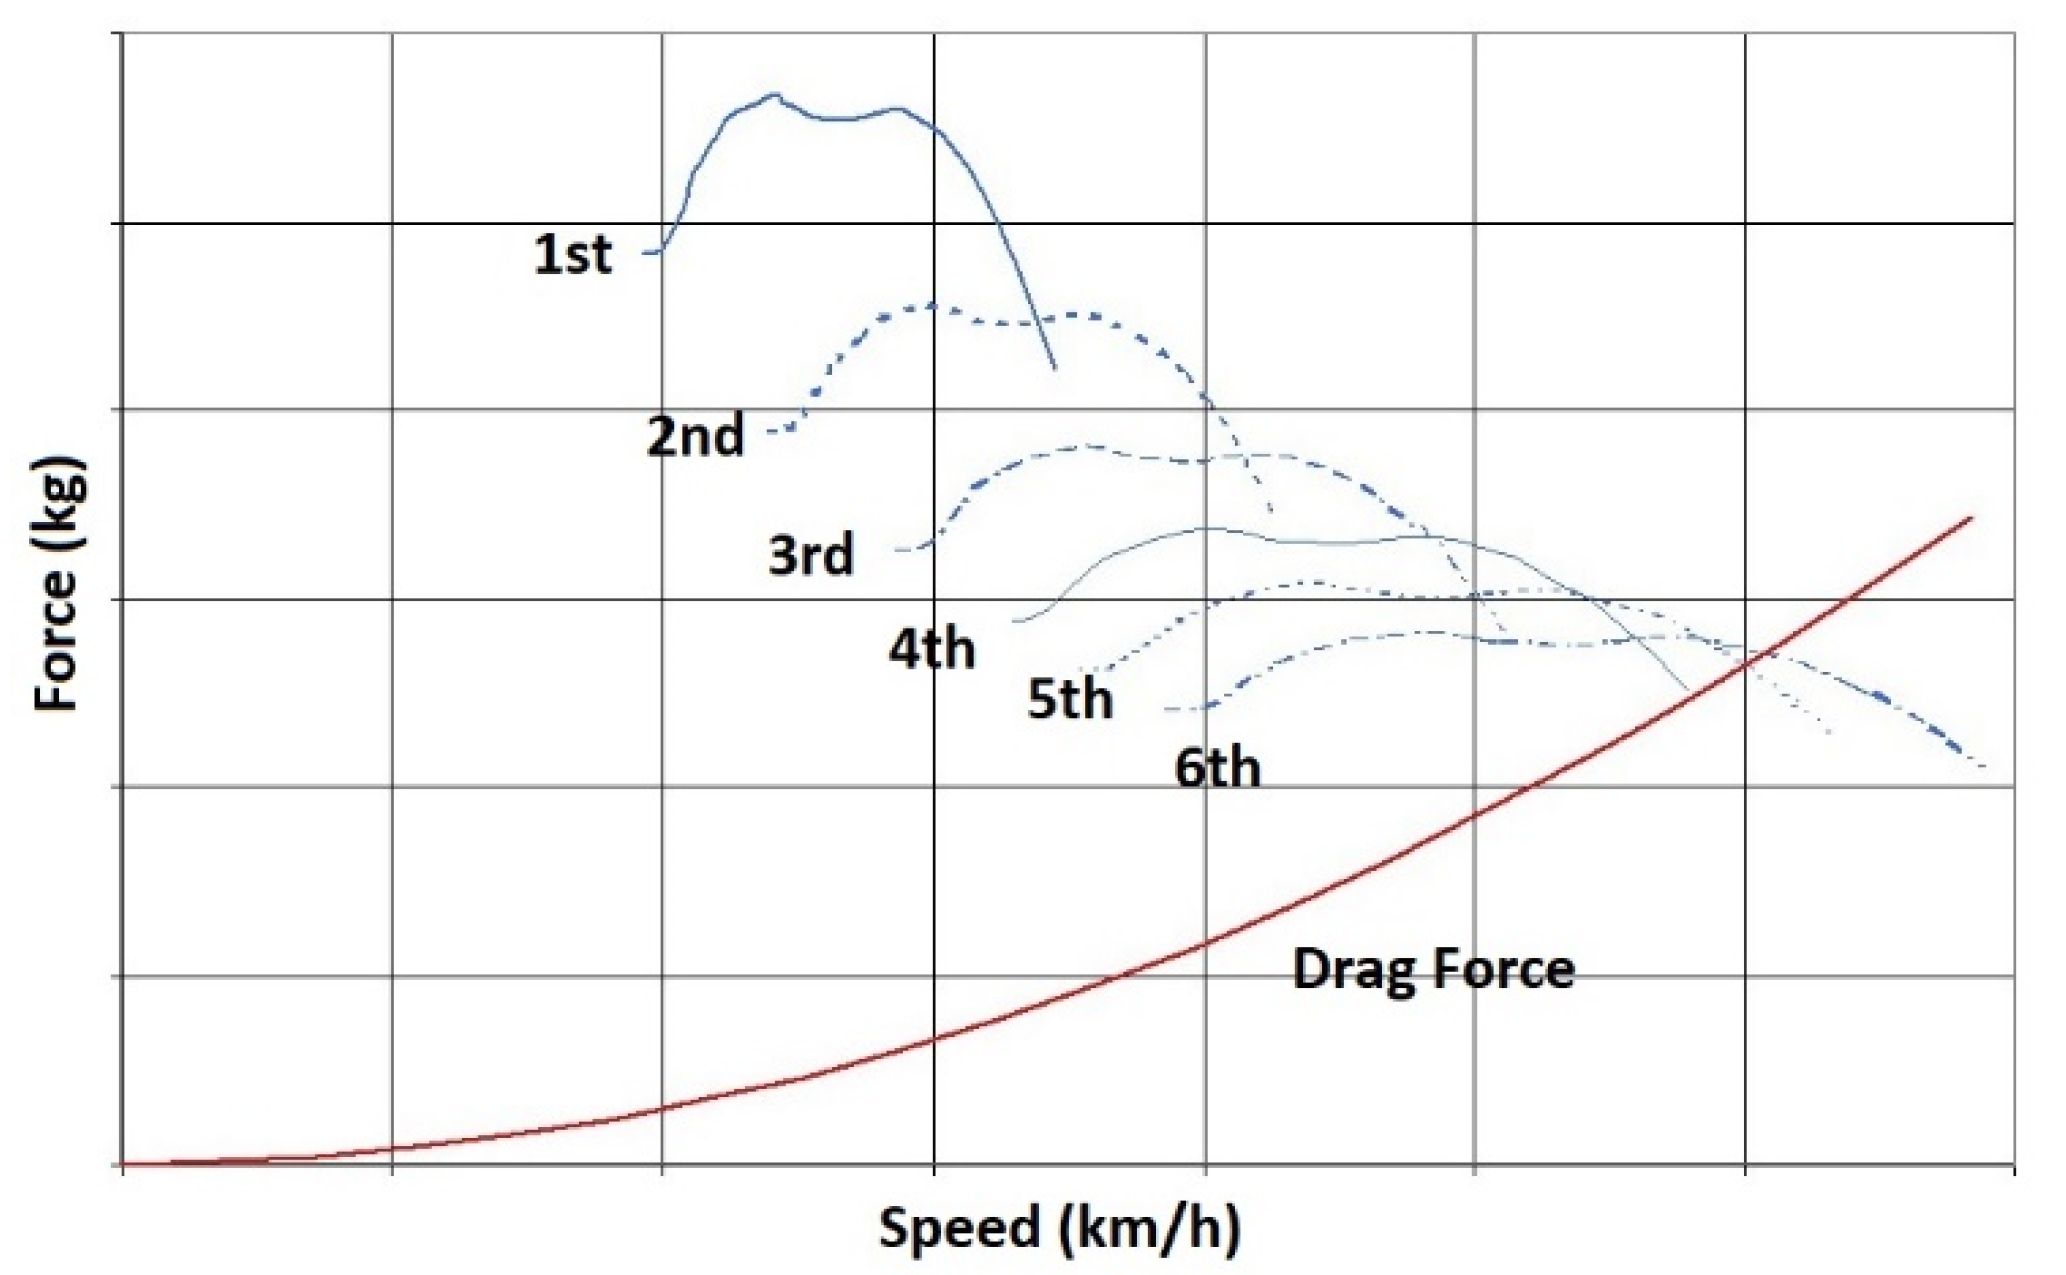
In addition to the four-poster controller, a separate control system was deemed necessary. The pneumatic actuators applying power and braking torques are controlled by a dedicated Labview® application via a CAN (Controller Area Network) line. Actuators, valves and pressure regulators are off-the-shelf components while the force is measured through a purposely developed load cell as shown in Figure 11. The force is controlled in a closed-loop and Figure 12 shows the tractive force vs. speed as computed starting from the engine torque and transmission characteristics. The closed loop control system enables the simulation of a complete corner exit/straight line/braking cycle as well.
The Labview® software (National Instruments, Austin, TX, USA) has been used in conjunction with a National Instruments acquisition card for data logging. Unsprung mass acceleration, suspension displacements, and vertical road loads are measured on both front and rear ends. In addition, two linear potentiometers control the roll angle in the case a structural failure eventually occurs on the motorcycle restraint system.
3. Results
3.1. Sweep Test
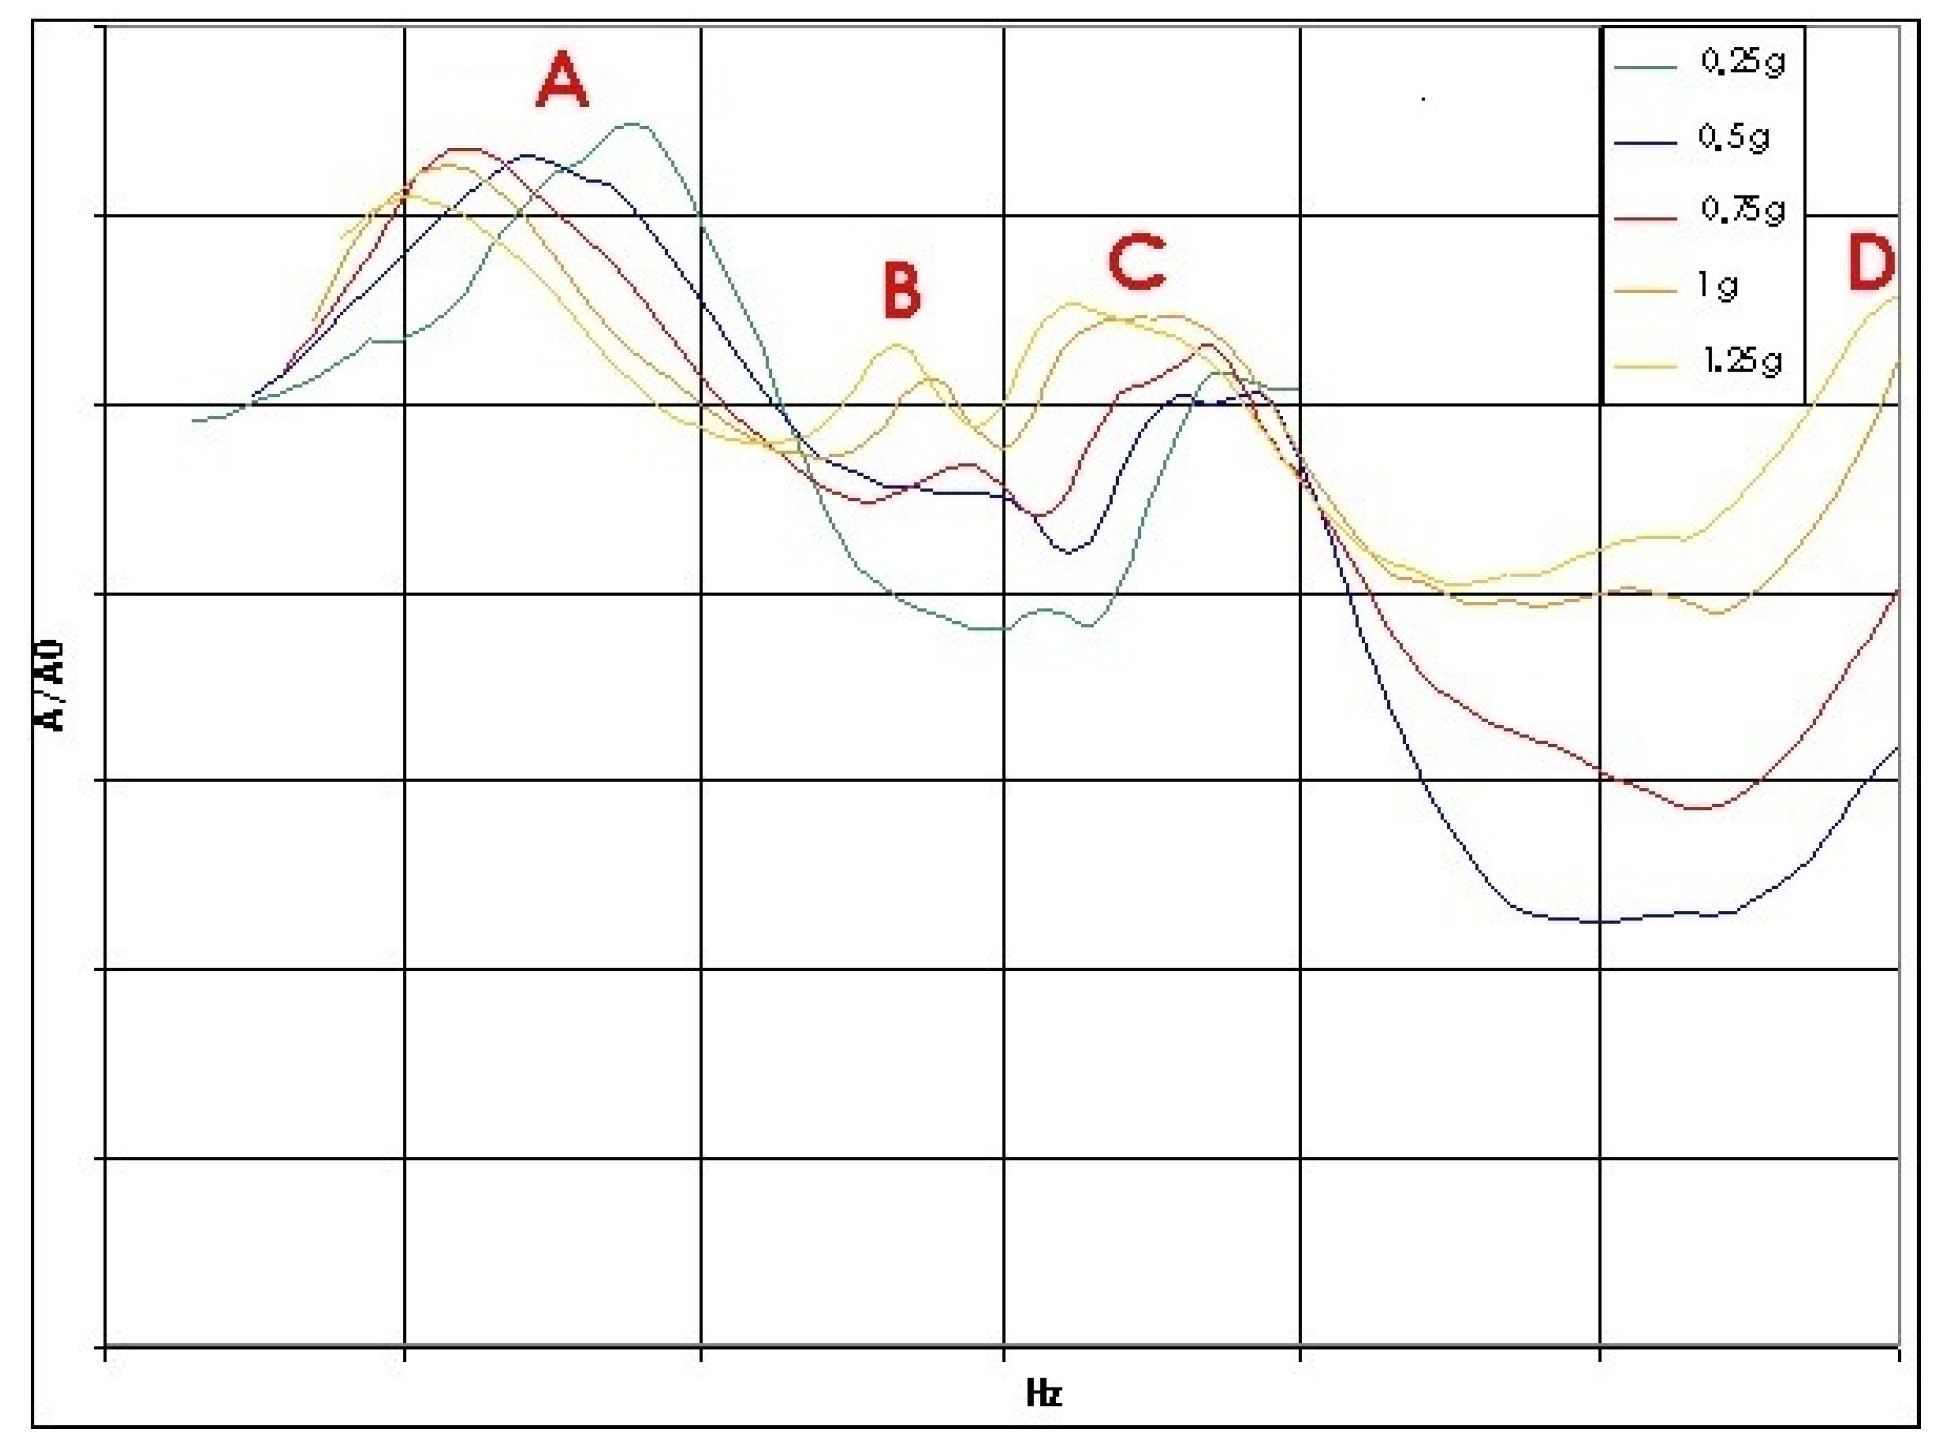
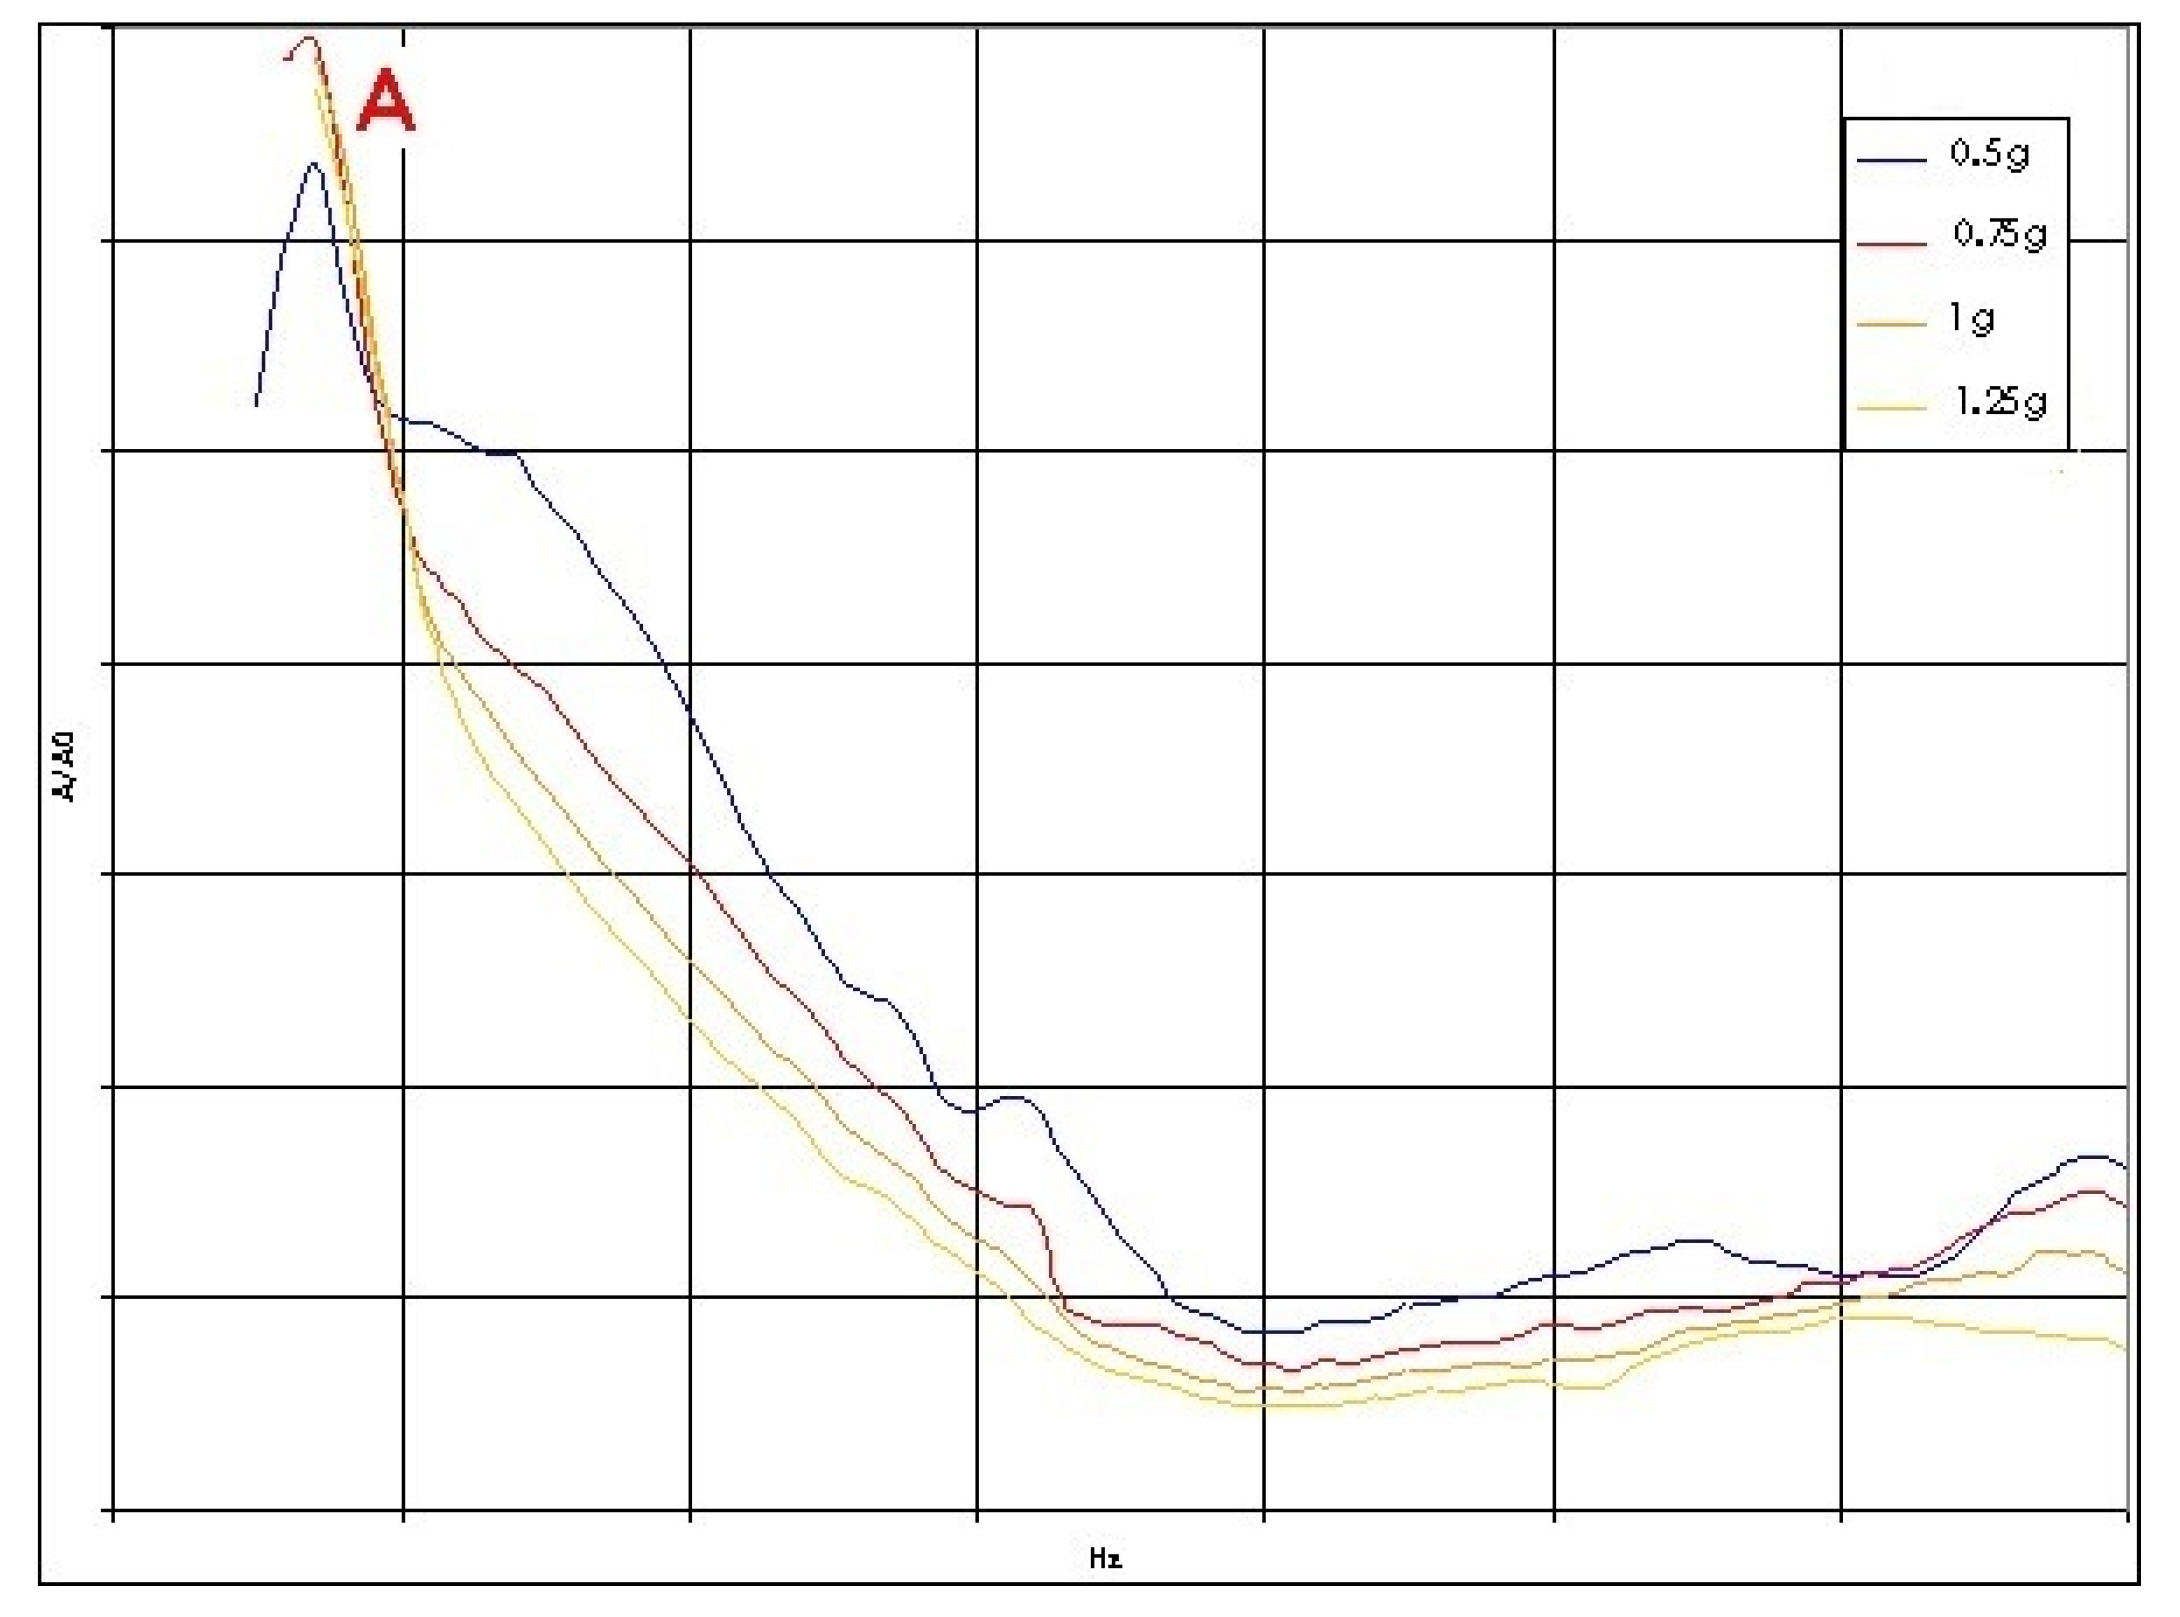
First of all, two tests have been performed in order to verify the proper functionality of the designed ride simulator. The frequency response has been evaluated for both front and rear unsprung masses as well as for the sprung mass of a test motorbike. Figure 13 shows the rear unsprung mass frequency response obtained with a frequency sweep at constant vertical acceleration while Figure 14 shows the sprung mass frequency response for a front wheel with the same kind of input (no quantitative results or comments are issued for confidentiality).
3.2. Road Surface Reproduction
The road surface reproduction control system has been used in order to test the system further. The four-poster itself features the possibility to reproduce any road surface accurately, starting from a real-world acquisition, and then using a complex iterative deconvolution process [18,19,20,21]. This controller is separate from the one employed to “play” standard waveforms and used to perform standard tests as reported in Section 3.1. Each actuator (i.e., each wheel) can be controlled independently.
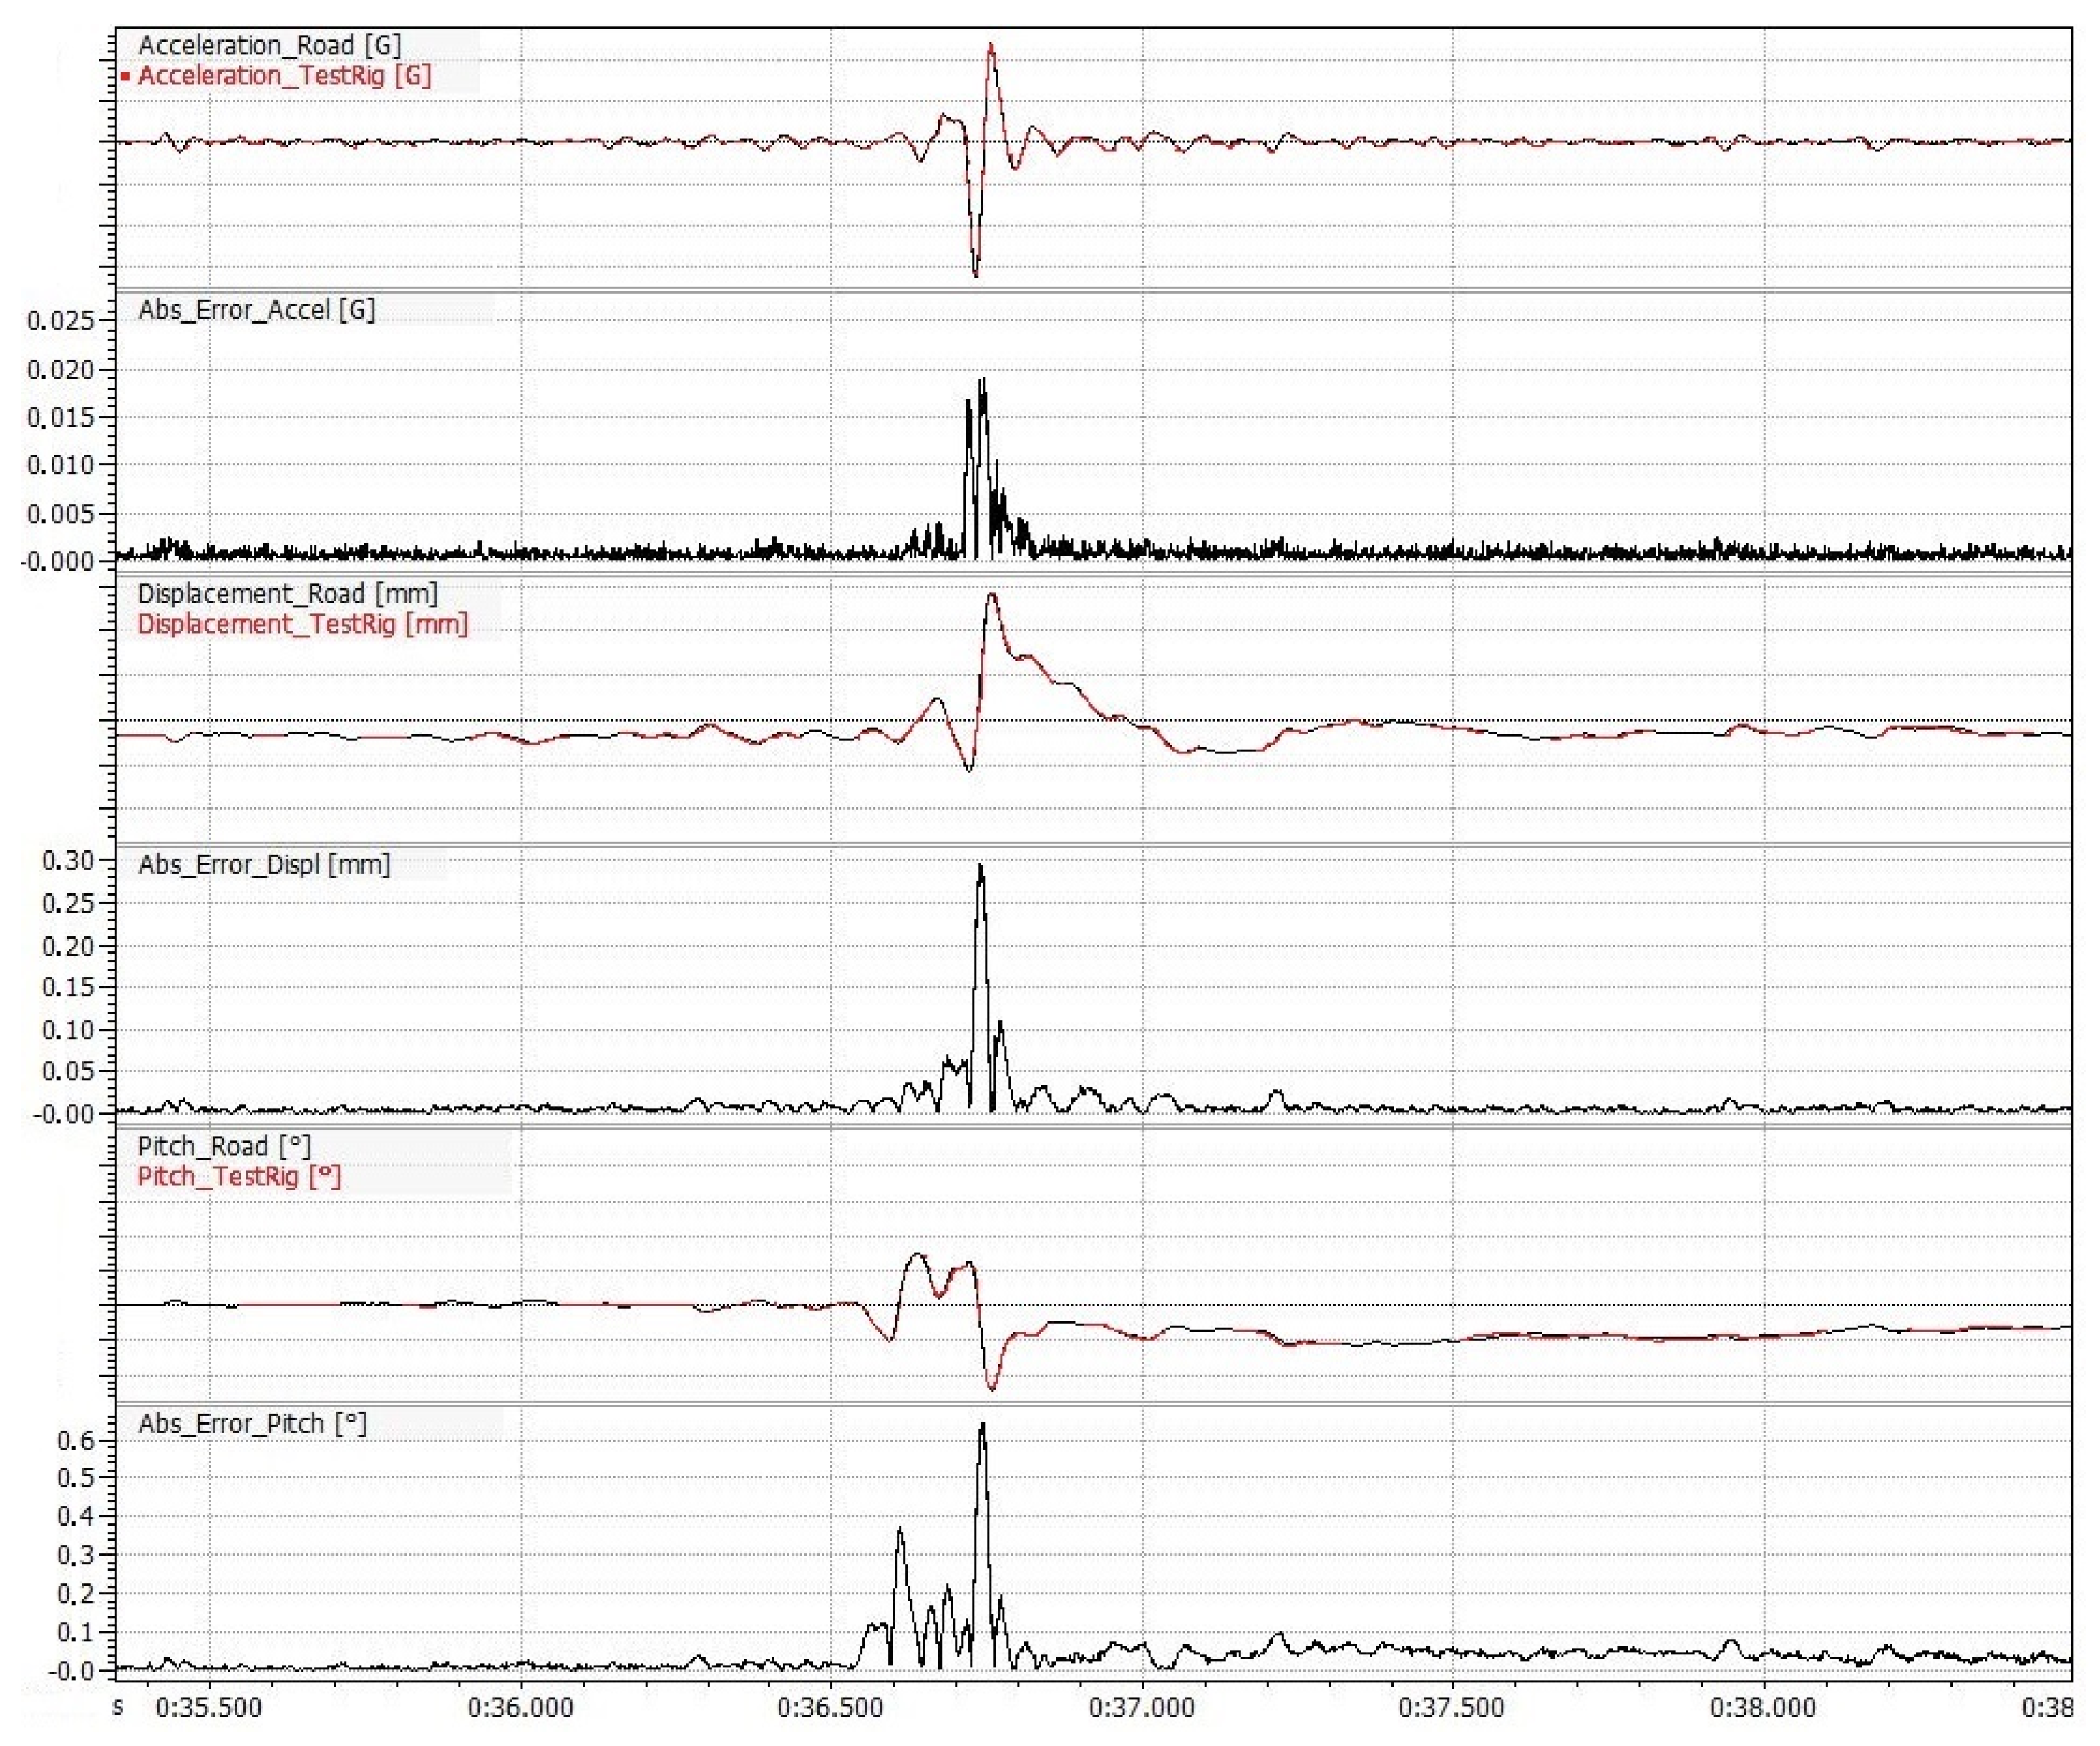
Two different tests at constant speed are shown here. The first one corresponds to a paved road at 100 km/h, while the second one corresponds to a speed hump taken at 30 km/h. Results are shown in Figure 15 and Figure 16. It is worth highlighting that the difference between time histories of road and rig profiles is not visible when overlapping the two data streams because the system performance is very good. Therefore, the absolute error has been reported for each sensor as well.
4. Discussion
Figure 13 and Figure 14 report the frequency responses of the rear wheel and the sprung mass under different constant acceleration frequency sweeps.
Figure 13 shows the influence of unsprung mass, front wheel, and pitch movement natural frequencies on the rear wheel frequency response. The low-frequency contribution to the response comes from the unsprung mass (A) with the highest module, as expected. Respectively, (B) and (C) are the frequency contribution due to front wheel and rear wheel natural frequencies while (D) is the pitch movement natural frequency.
In Figure 14 the sprung mass natural frequency is clearly visible at the same frequency of the one reported in Figure 13 (again, A). In this case, the frequency contribution coming from the front wheel and rear wheel natural frequencies are much less visible due to the filtering action achieved by the respective suspension systems.
All these results are in line with the expected frequency response characteristics computed with vehicle mass, inertia, and wheel rate data as input. They are also congruent with the theory of motorcycle vertical dynamics as outlined in [17], chapter 5 (In-Plane Dynamics), proving the ability of the system to reproduce the vertical response of an unrestrained bike during its straight-line motion. Similar considerations are also reported in [22].
Figure 15 and Figure 16 report comparisons between real-world and rig-generated road profiles. It is worth highlighting that the difference between time histories of real-world road and rig-generated profiles is not visible when overlapping the two data streams since it is very small. Therefore, the absolute error has been reported for each sensor as well. This is an indication of the effectiveness achieved with the system.
A test performed on good quality, smooth road pavement at 100 km/h is reported in Figure 15. It shows very low acceleration and wheel displacement levels. Under these conditions the system can replicate real-world road data very well, with a maximum absolute error value (MAE) of 0.32% for unsprung mass acceleration and 0.25% for suspension displacement. The RMS error is 0.20% in both cases.
Results of a test performed on a speed hump are shown in Figure 16. The road input is akin to an impulse. Under this condition the system is still able to simulate motorcycle dynamics accurately since the acceleration MAE is 0.95%, the suspension displacement MAE is 0.98%, the pitch angle MAE is 0.98% while the RMS error is 0.45%. It is worth noticing that the pitch angle does not return to zero after the speed hump because the motorcycle is accelerating.
5. Conclusions
A road simulator rig for motorcycles has been designed and built by the Vehicle Dynamics group of the University of Brescia. It is based on a dedicated restraint system conceived to support a real-world bike on a Servotest® four-poster without affecting its peculiar dynamics, since the bike mass and inertia properties have not been altered, together with the related dynamic response. In addition to the vertical action of the servo-hydraulic actuators a unique device for application of the braking and tractive forces has been added. The longitudinal force reproduction device is powered by two independent pneumatic actuators. The system has been successfully tested by performing some frequency sweep tests (among others) that provided a realistic dynamic response, as proven by the FFT plots reported in Section 3. As a further proof of the ability of the proposed system to accurately reproduce motorcycle dynamics during straight running, it has been tested on different road surfaces, using road reproduction control as featured by the original four-poster rig system. A comparison of real-world data with results obtained with the simulator showed negligible errors, as reported in Section 4.
The proposed motorcycle road simulator can be considered capable of providing reliable and effective reproduction of the actual motorbike behaviour in terms of vertical dynamics.
Author Contributions
M. Gadola and D. Armellin conceived and designed the experiment, F. Marchesin performed tests and experiments, D. Chindamo analysed data and wrote the paper.
Conflicts of Interest
The authors declare no conflict of interest.
References
- Spickenreuther, M.; Bersiner, F.; Fricke, E. Realistic driving experience of new vehicle concepts on the bmw ride simulator. In Proceedings of the 7th International Styrian Noise, Vibration and Harshness Congress: The European Automotive Noise Conference (SNVH 2012), Graz, Austria, 13–15 June 2012. [Google Scholar] [CrossRef]
- Wang, B.; Guo, X.; Li, M.; Yang, B.; Xu, Z. Road simulation algorithm based on iterative learning control. Quiche Gongcheng/Autom. Eng. 2010, 32, 686–689. [Google Scholar]
- Marchesin, F.P.; Barbosa, R.S.; Alves, M.A.L.; Gadola, M.; Chindamo, D.; Benini, C. Upright mounted pushrod: The effects on racecar handling dynamics, The Dynamics of Vehicles on Roads and Track. In Proceedings of the 24th Symposium of the International Association for Vehicle System Dynamics(IAVSD 2015), Graz, Austria, 17–21 August 2015; pp. 543–552. [Google Scholar]
- Jayasurya, H.P.W.; Sangpradit, K. Dynamic performance and ride comfort evaluation of the seat suspension system in a small agricultural tractor to attenuate low-frequency vibration transmission. Agric. Eng. Int. CIGR J. 2014, 16, 207–216. [Google Scholar]
- Uberti, S.; Gadola, M.; Chindamo, D.; Romano, M.; Galli, F. Design of a double wishbone front suspension for an orchard-vineyard tractor: Kinematic analysis. J. Terramech. 2015, 57, 23–39. [Google Scholar] [CrossRef]
- Kharul, R.; Balakrishnan, S.; Karedla, D.; You, S.S. Virtual testing and correlation for a motorcycle design. SAE Int. J. Mater. Manuf. 2010, 3, 541–549. [Google Scholar] [CrossRef]
- Benini, C.; Gadola, M.; Chindamo, D.; Uberti, S.; Marchesin, F.P.; Barbosa, R.S. The influence of suspension components friction on race car vertical dynamics. Veh. Syst. Dyn. 2017, 55, 338–350. [Google Scholar] [CrossRef]
- Uberti, S.; Gadola, M. Design of a new high-end street bike. In Proceedings of the 11th International Design Conference (DESIGN 2010), Dubrovnik, Croatia, 17–20 May 2010; pp. 1741–1752. [Google Scholar]
- Tuluie, R.; Ericksen, G.S. Racing motorcycle design process using physical and virtual testing methods. In Proceedings of the Motorsports Engineering Conference and Exposition, Dearborn, MI, USA, 13–16 November 2000. [Google Scholar]
- Nehaoua, L.; Hima, S.; Arioui, H.; Seguy, N.; Espié, S. Design and modeling of a new motorcycle riding simulator. In Proceedings of the IEEE American Control Conference, New York, NY, USA, 11–13 July 2007; pp. 176–181. [Google Scholar]
- Cossalter, V.; Lot, R.; Maso, M.; Massaro, M.; Sartori, R. A Motorcycle Riding Simulator for the Improvement of the Rider Safety; Proc. of FISITA World Automotive Congress: Munich, Germany, 2008. [Google Scholar]
- Cossalter, V.; Doria, A.; Lot, R. Development and Validation of a Motorcycle Riding Simulator. In Proceedings of the FISITA, Barcellona, Spain, 8–24 May 2004. [Google Scholar]
- Cossalter, V.; Lot, R.; Massaro, M.; Sartori, R. Development and validation of an advanced motorcycle riding simulator. J. Automob. Eng. 2011, 225, 705–720. [Google Scholar] [CrossRef]
- Cossalter, V.; Lot, R.; Rota, S. Objective and subjective evaluation of an advanced motorcycle riding simulator. Eur. Transp. Res. Rev. 2010, 2, 223–233. [Google Scholar] [CrossRef]
- Cossalter, V.; Lot, R.; Massaro, M.; Sartori, R. Development and Testing of Assistant Rider Systems with the UNIPD Motorcycle Riding Simulator; 19th Congress of Theoretical and Applied Mechanics: Ancona, Italy, 2009; ISBN 9788896378083. [Google Scholar]
- Previati, G.; Gobbi, M.; Mastinu, G. Measurement of the inertia tensor-A review. In Proceedings of the 73rd Annual Conference of the Society of Allied Weight Engineers, Inc., Long Beach, CL, USA, 17–24 May 2014. [Google Scholar]
- Cossalter, V. Cinematica e Dinamica Della Motocicletta; Edizioni Progetto: Padova, Italy, 1997. [Google Scholar]
- Chindamo, D.; Gadola, M. Reproduction of real-world road profiles on a four-poster rig for indoor vehicle chassis and suspension durability testing. Adv. Mechan. Eng. 2017, in press. [Google Scholar] [CrossRef]
- Plummer, A.R. Control techniques for structural testing: A review. J. Syst. Control Eng. 2007, 221, 139–169. [Google Scholar] [CrossRef]
- Hay, N.C.; Roberts, D.E. Iterative control in automotive testing. J. Syst. Control Eng. 2007, 221, 223. [Google Scholar]
- Dodds, C.; Plummer, A. Laboratory Road Simulation for Full Vehicle Testing: A Review. SAE Tech. Paper 2001. [Google Scholar] [CrossRef]
- Cossalter, V.; Doria, A.; Formentini, M.; Peretto, M. Experimental and numerical analysis of the influence of tyres properties on the straight running stability of a sport-touring motorcycle. Veh. Syst. Dyn. 2012, 50, 357–375. [Google Scholar] [CrossRef]
Figure 1.
Centre of mass location: motorbike only (Cm), with rider in straight (Cr), and braking position (Cb).
Figure 1.
Centre of mass location: motorbike only (Cm), with rider in straight (Cr), and braking position (Cb).

Figure 2.
How chain force can affect the suspension ride response.

Figure 3.
The three considered layouts.

Figure 4.
Schematic picture of the restraint system.
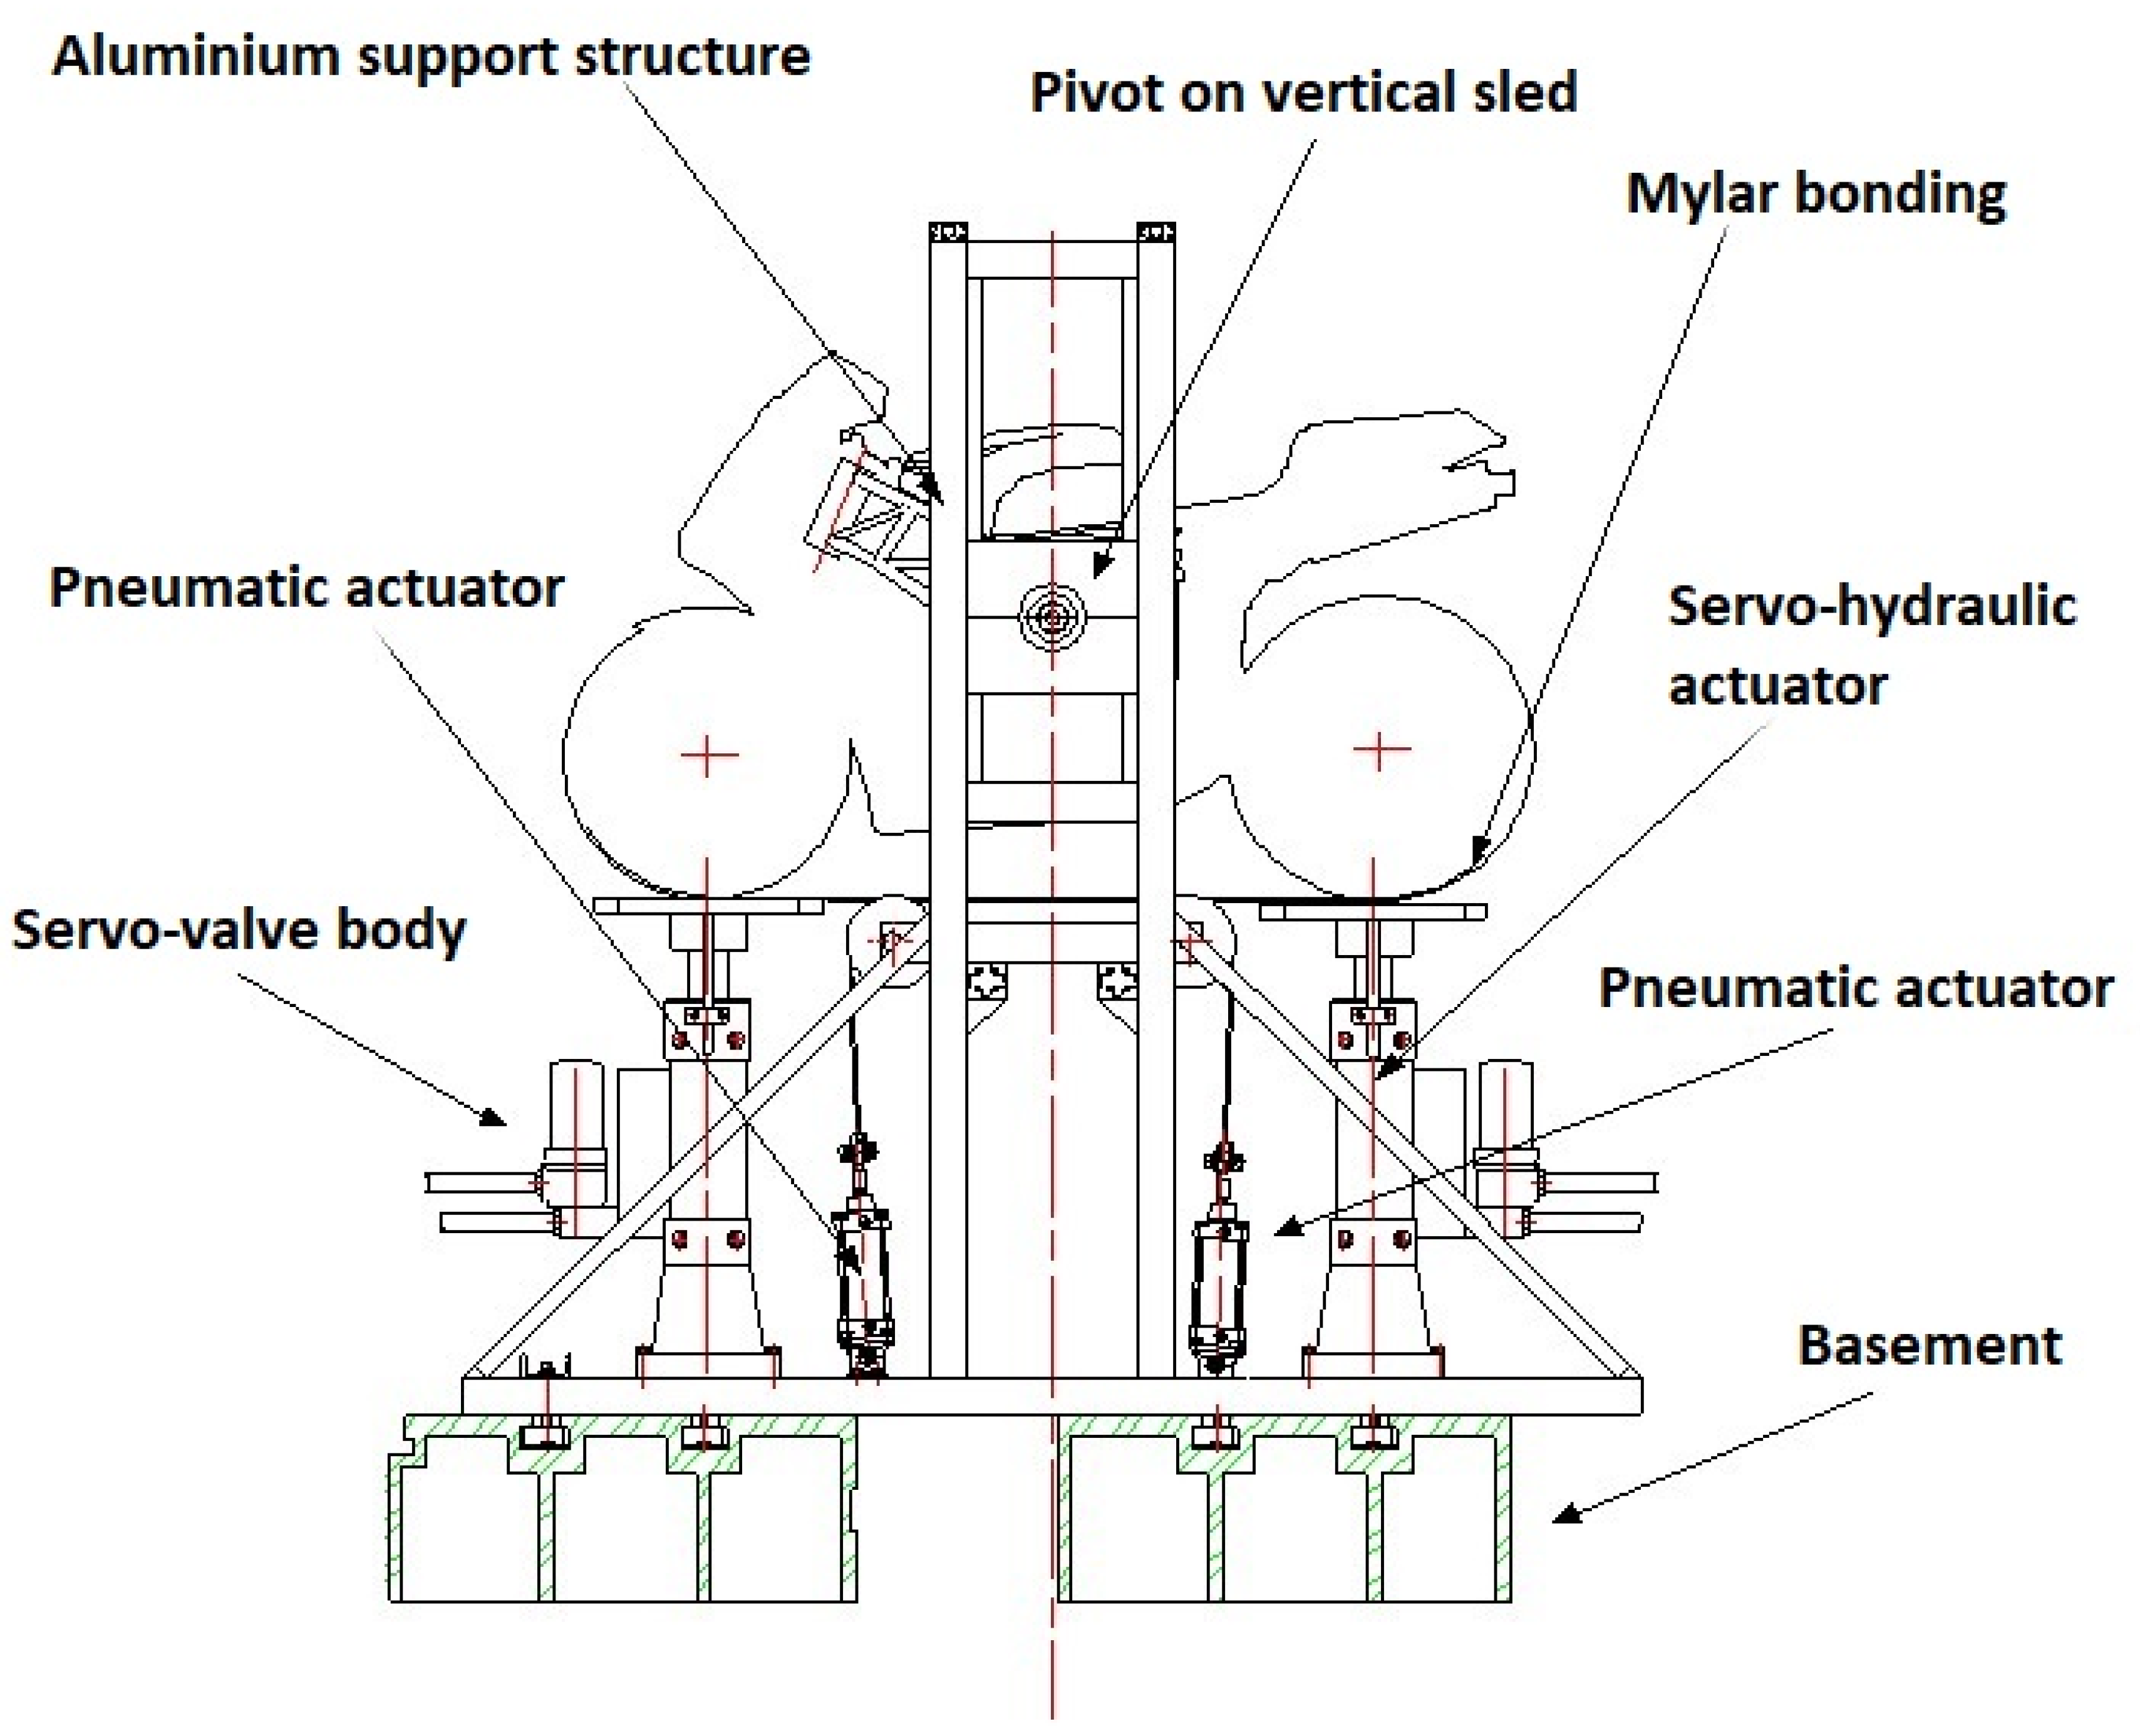
Figure 5.
Three conrods connect the bike main frame to the pivot on each side, providing an isostatic restraint. The centre of gravity of the bike is aligned with the pivot.
Figure 5.
Three conrods connect the bike main frame to the pivot on each side, providing an isostatic restraint. The centre of gravity of the bike is aligned with the pivot.
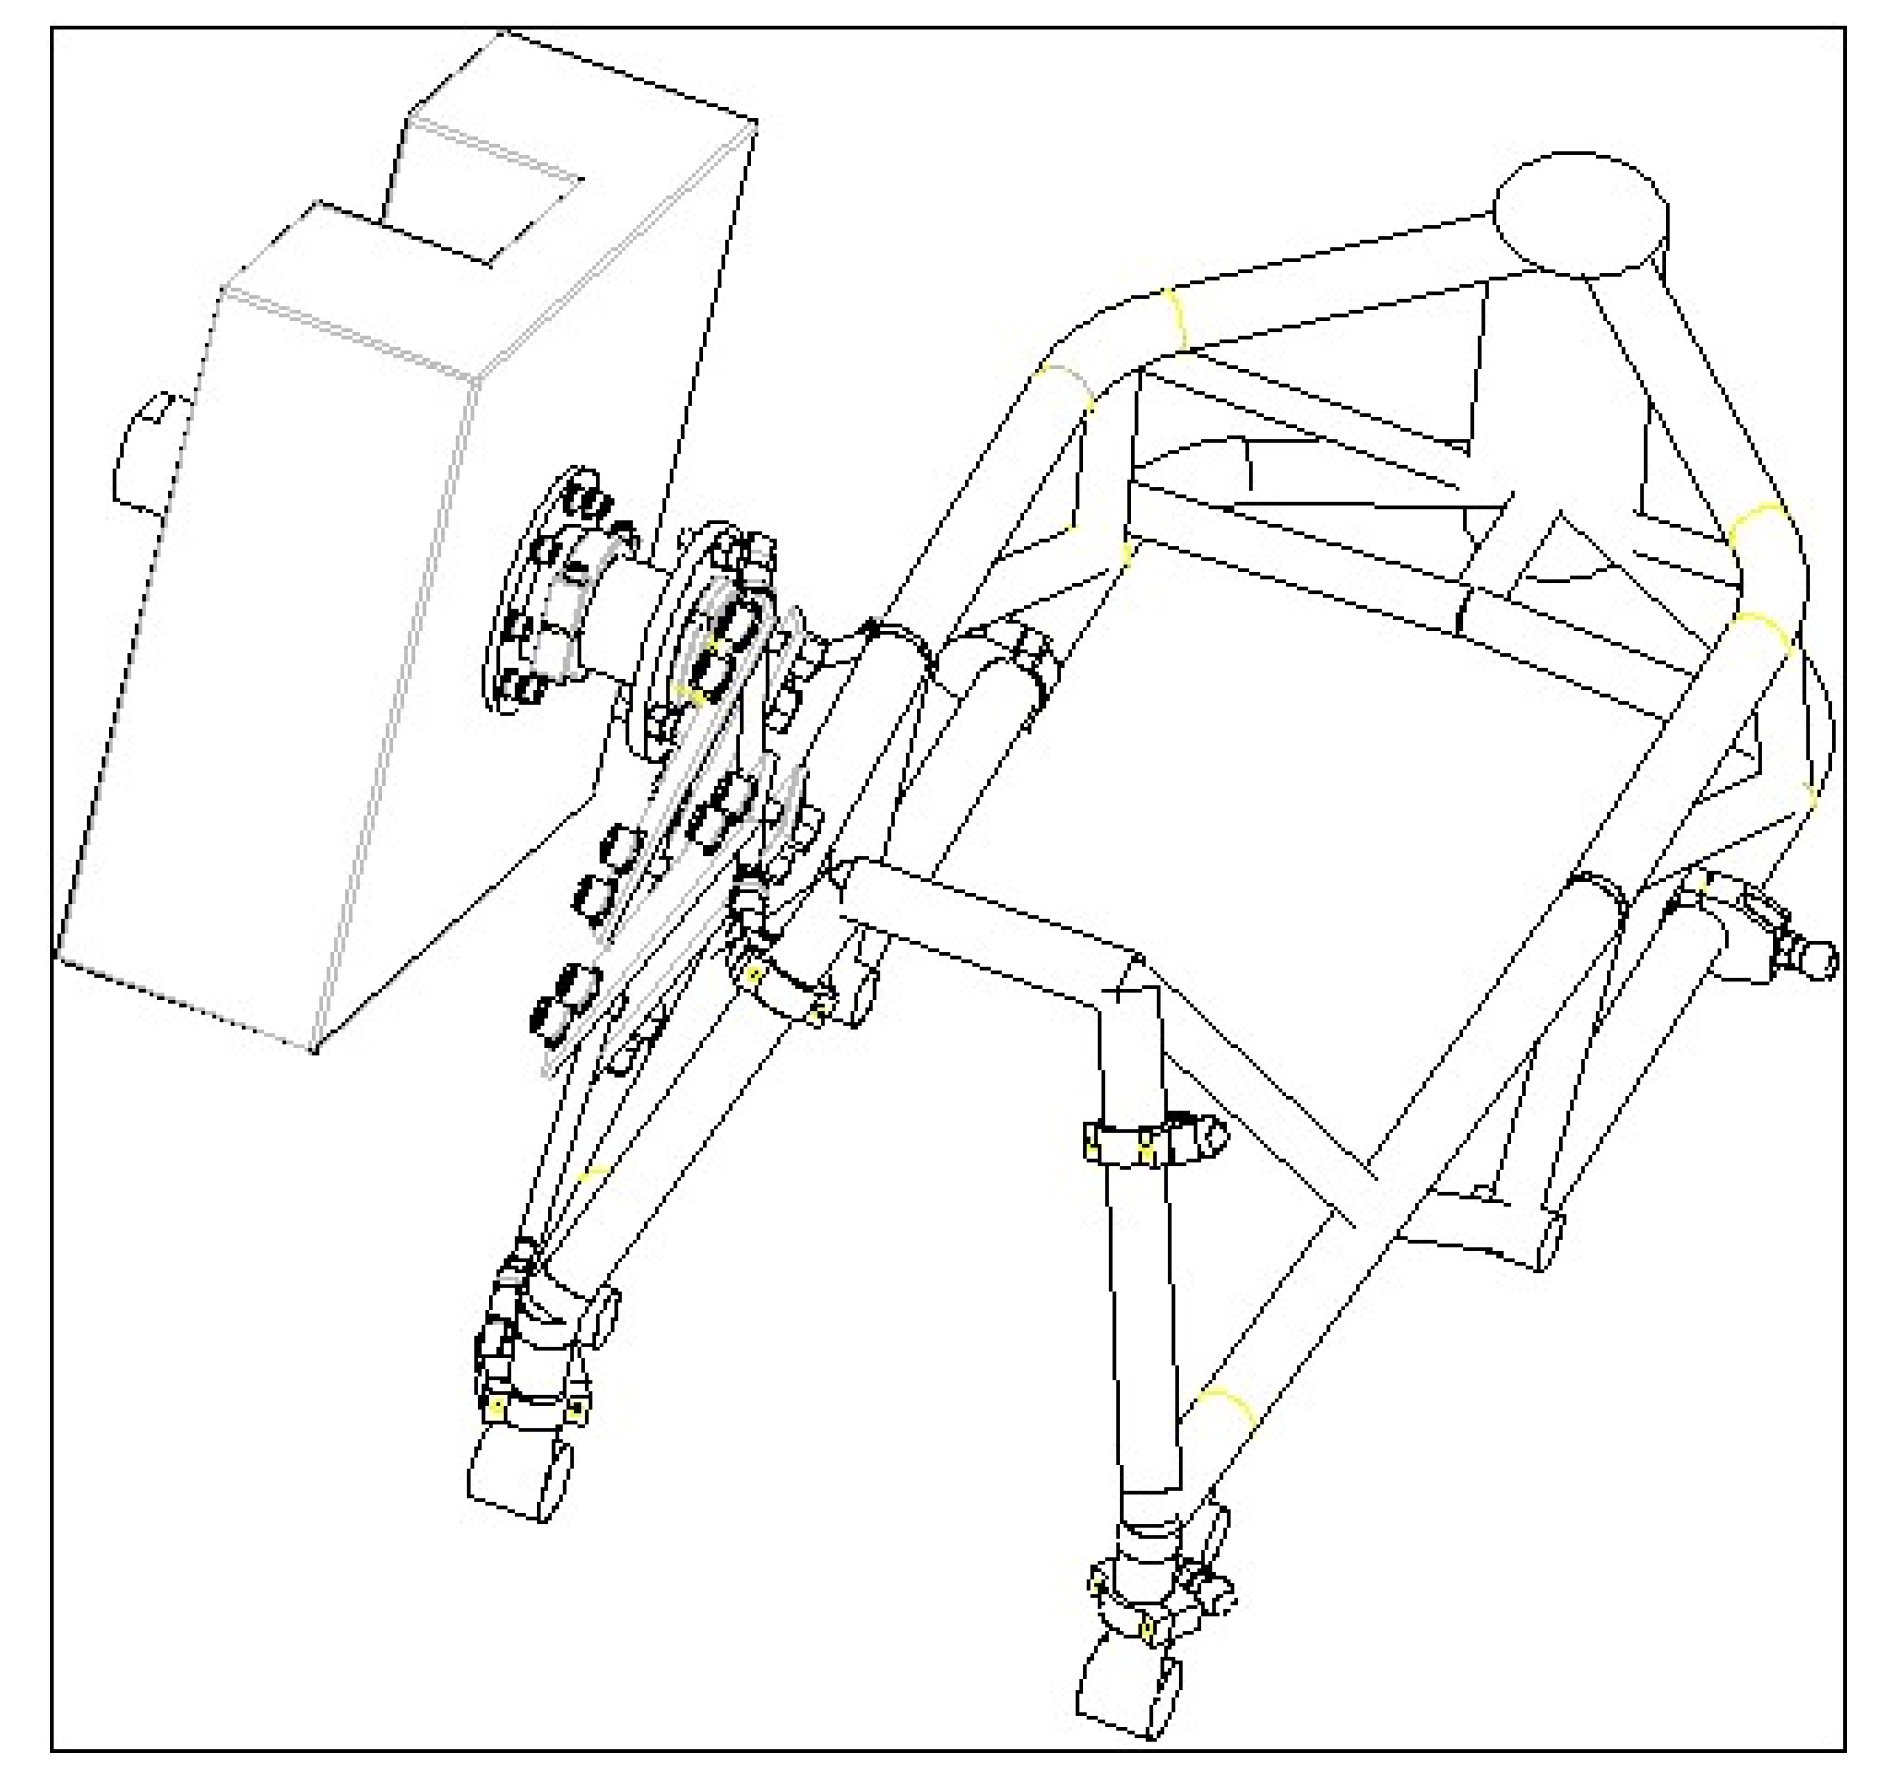
Figure 6.
The actual system with a test bike performing a frequency sweep test.
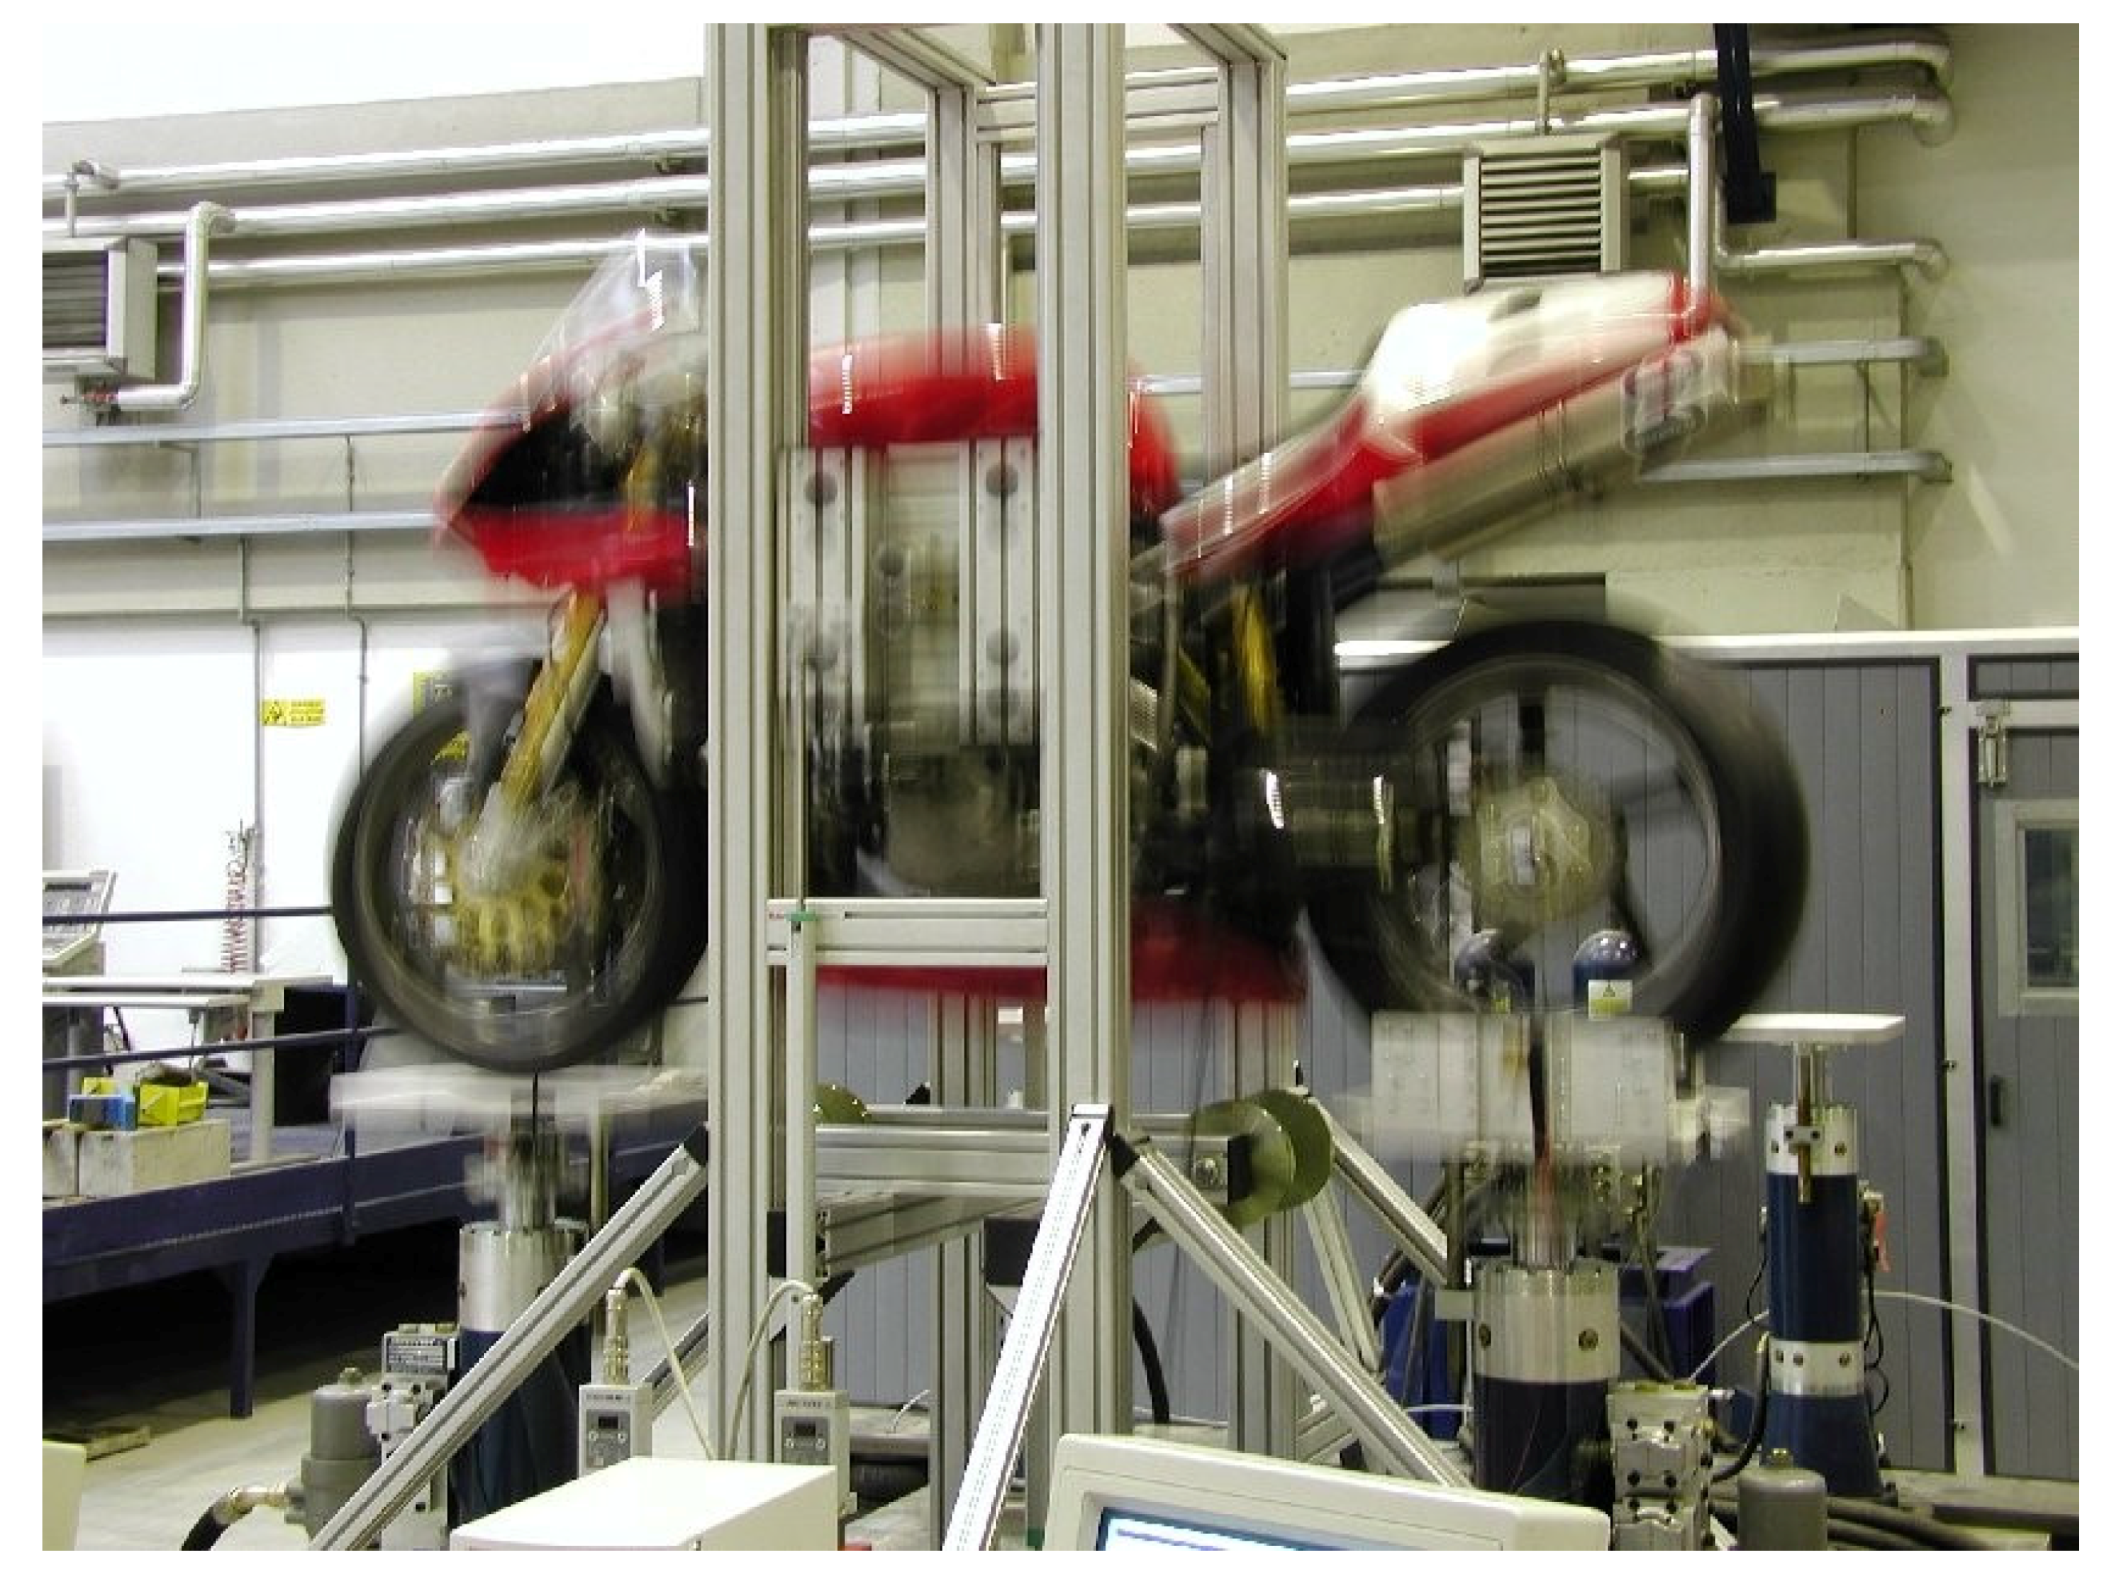
Figure 7.
The steel cable/fabric belt system kinematics. F1 is the pneumatic actuator force and F2 is the chain/front wheel hub reaction.
Figure 7.
The steel cable/fabric belt system kinematics. F1 is the pneumatic actuator force and F2 is the chain/front wheel hub reaction.

Figure 8.
Two separate Mylar belts are used to apply tractive and braking forces.
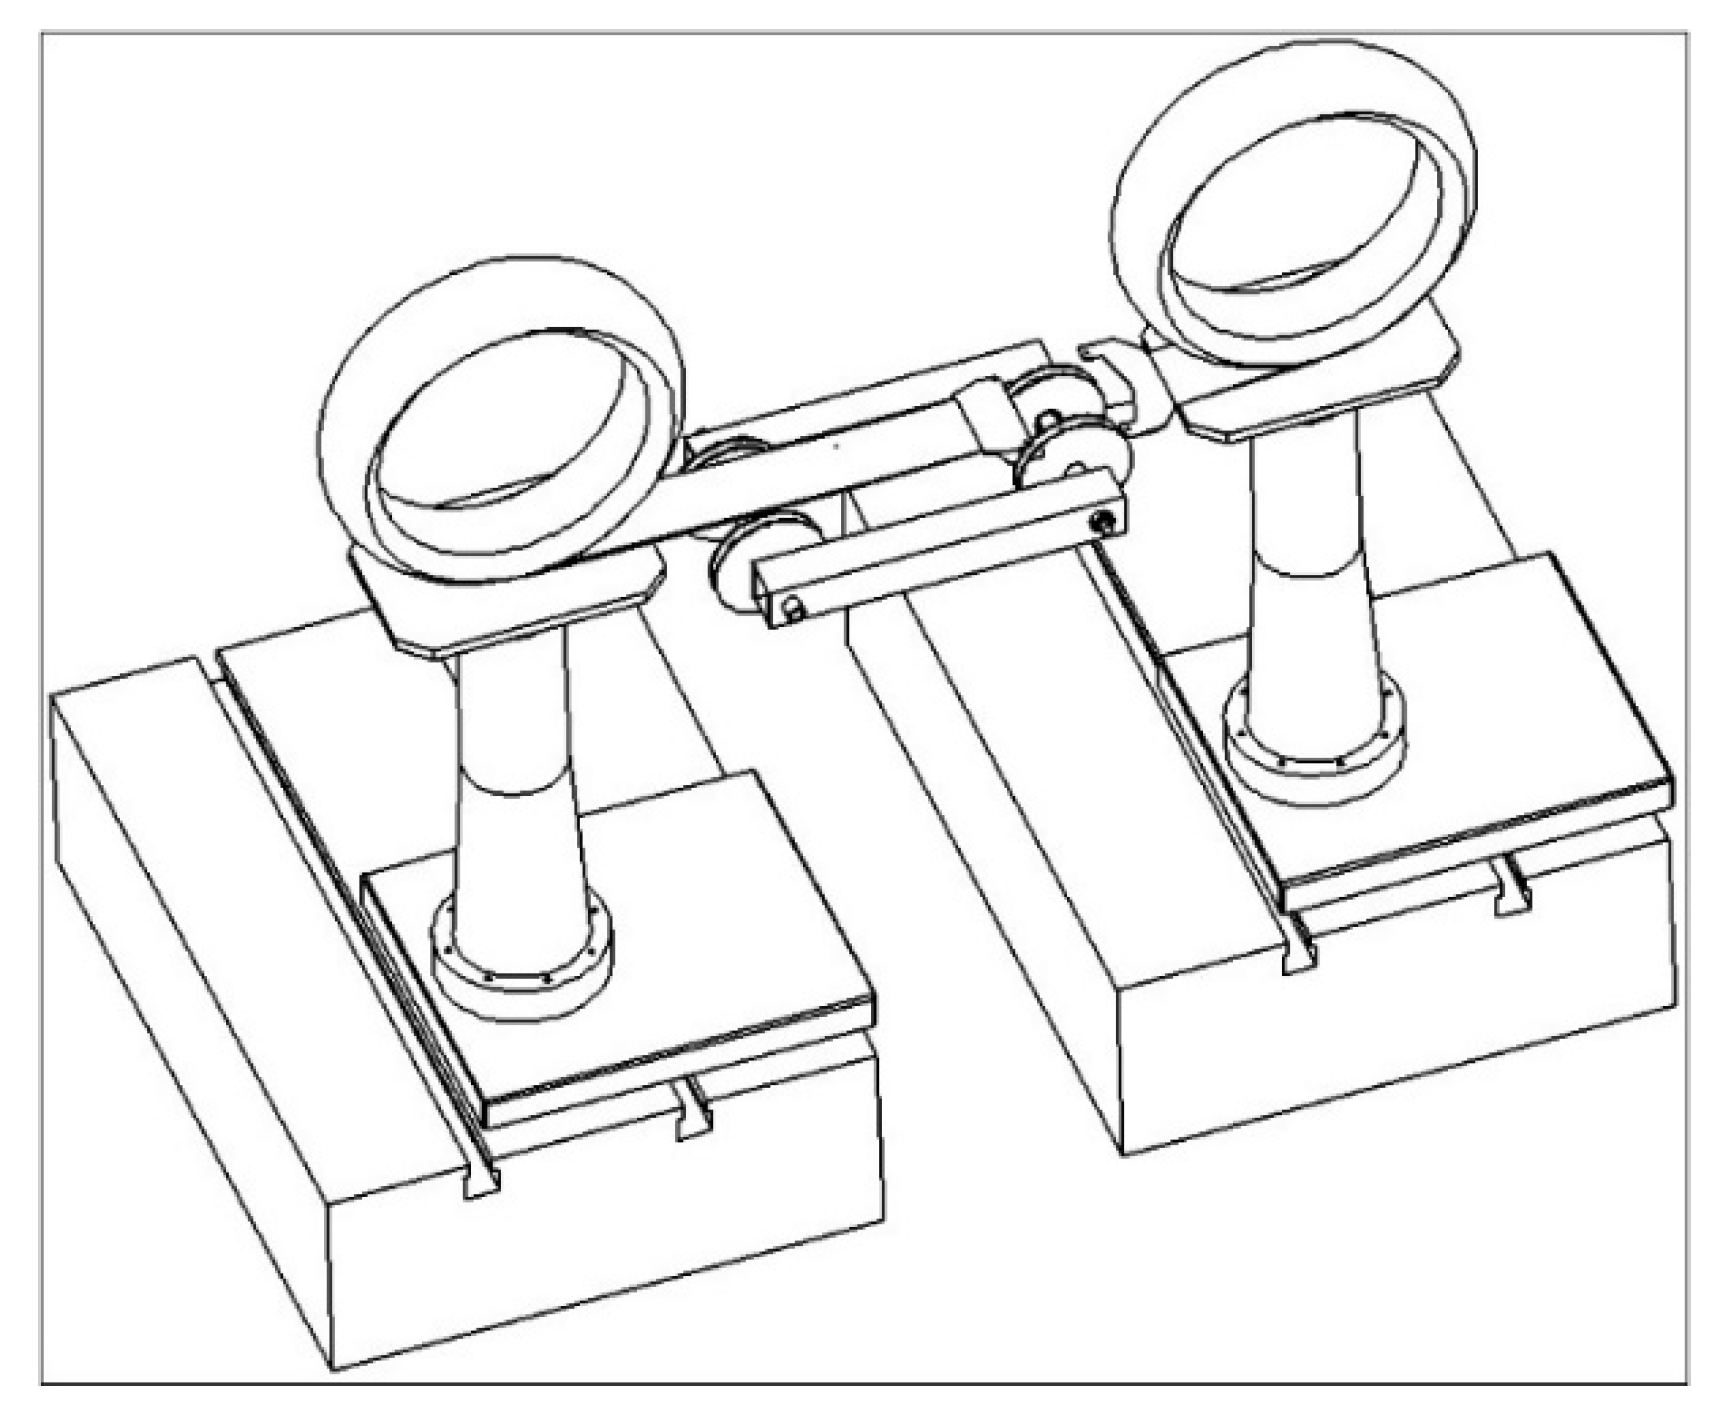
Figure 9.
The actual setup of the Mylar belt as bonded to one tyre.

Figure 10.
Shear force vs. elongation of a 41 mm Mylar belt bonded to the tyre tread. The test was performed on an Instron machine.
Figure 10.
Shear force vs. elongation of a 41 mm Mylar belt bonded to the tyre tread. The test was performed on an Instron machine.
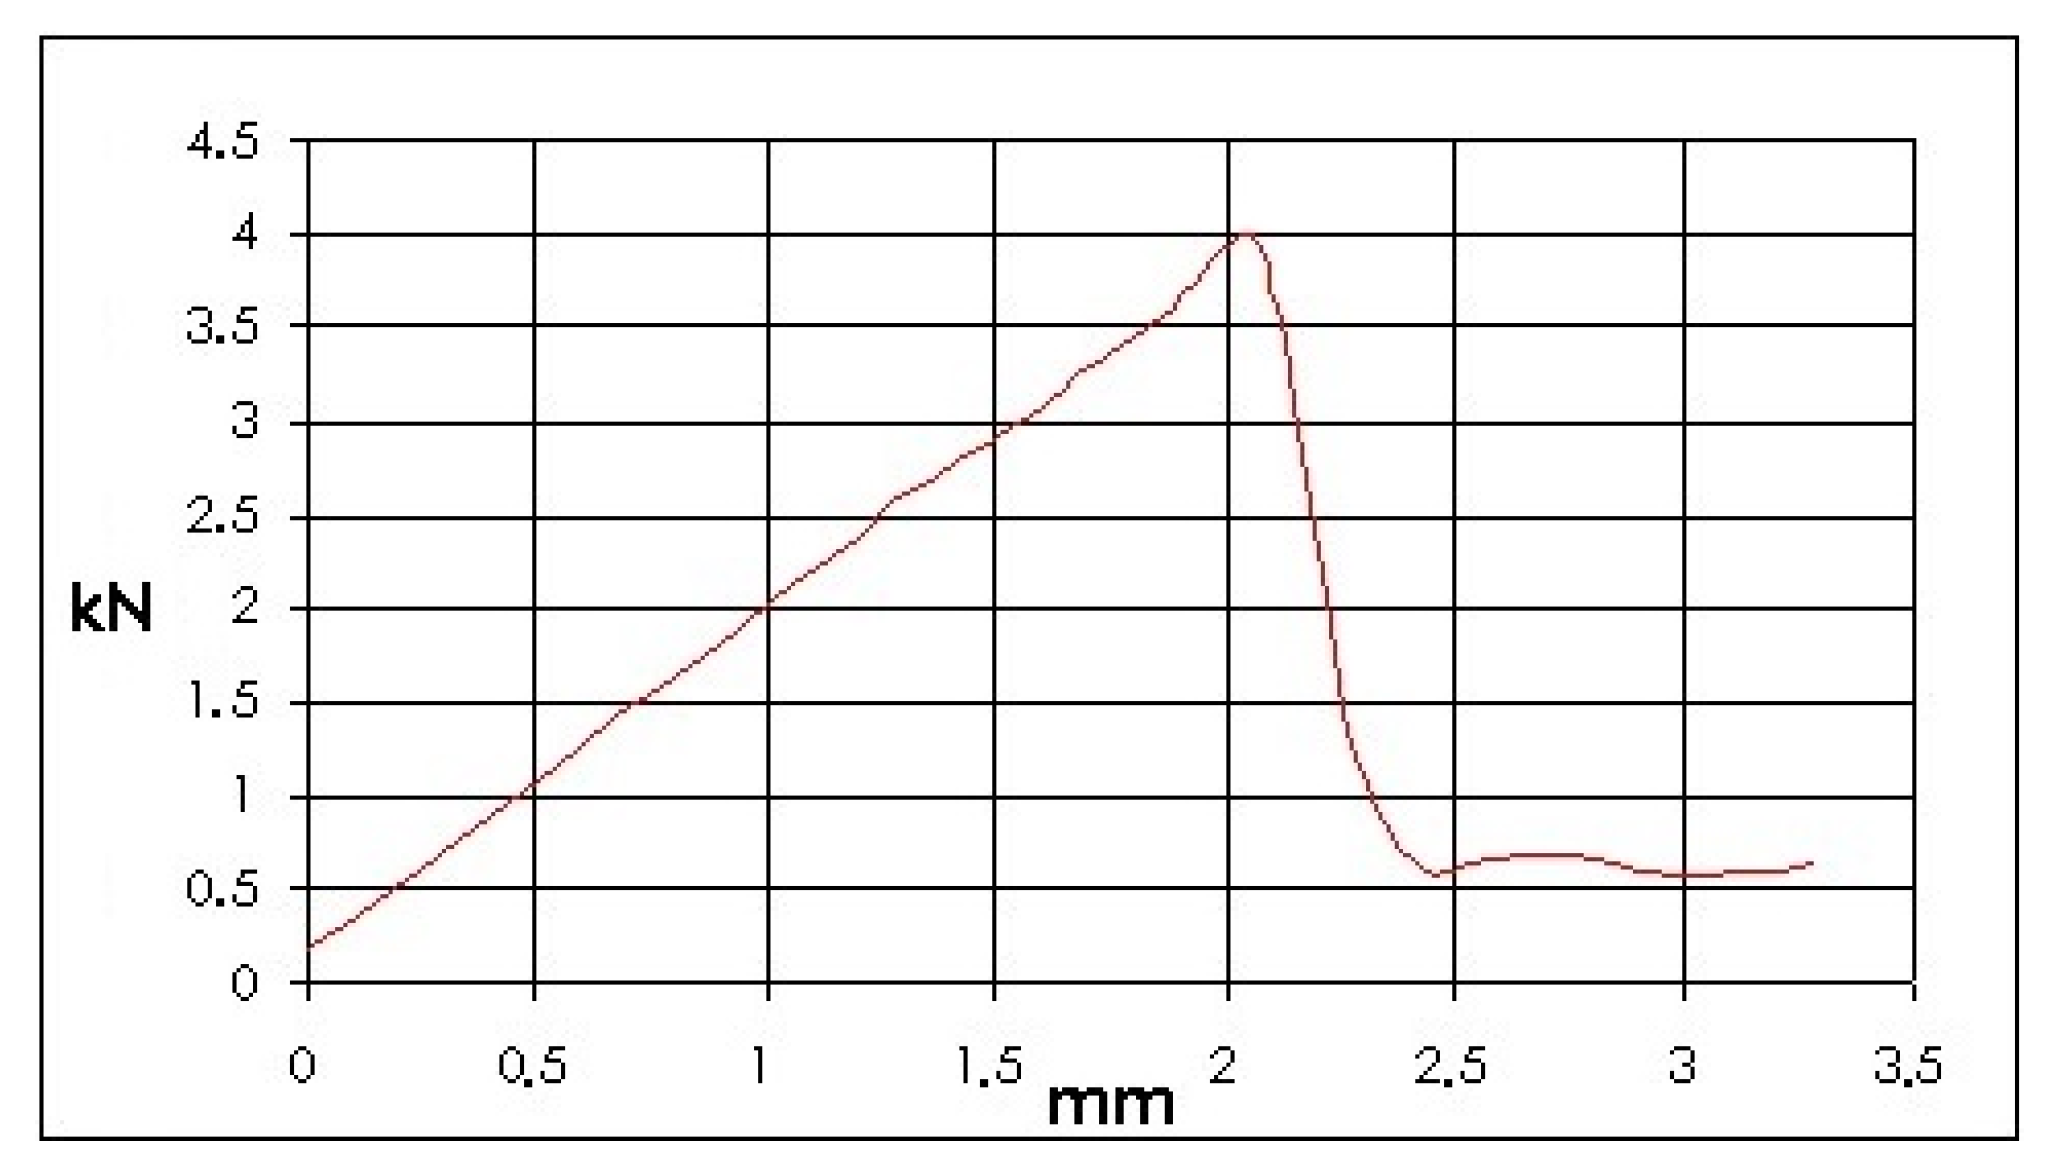
Figure 11.
A load cell was purposely designed to measure simulated braking and tractive forces.

Figure 12.
Power torque curves and transmission characteristics used to simulate the acceleration phase.
Figure 12.
Power torque curves and transmission characteristics used to simulate the acceleration phase.

Figure 13.
Rear unsprung mass frequency response. A piezometric accelerometer is fitted on the rear wheel hub. “A” is the sprung mass frequency contribution, “B” and “C” are the front and rear unsprung mass frequency contributions respectively while “D” is the contribution of the sprung mass pitch movement.

Figure 14.
Sprung mass frequency response due to the front wheel frequency sweep. A piezometric accelerometer is located at the centre of gravity.
Figure 14.
Sprung mass frequency response due to the front wheel frequency sweep. A piezometric accelerometer is located at the centre of gravity.

Figure 15.
Test performed on smooth paved road at 100 km/h.
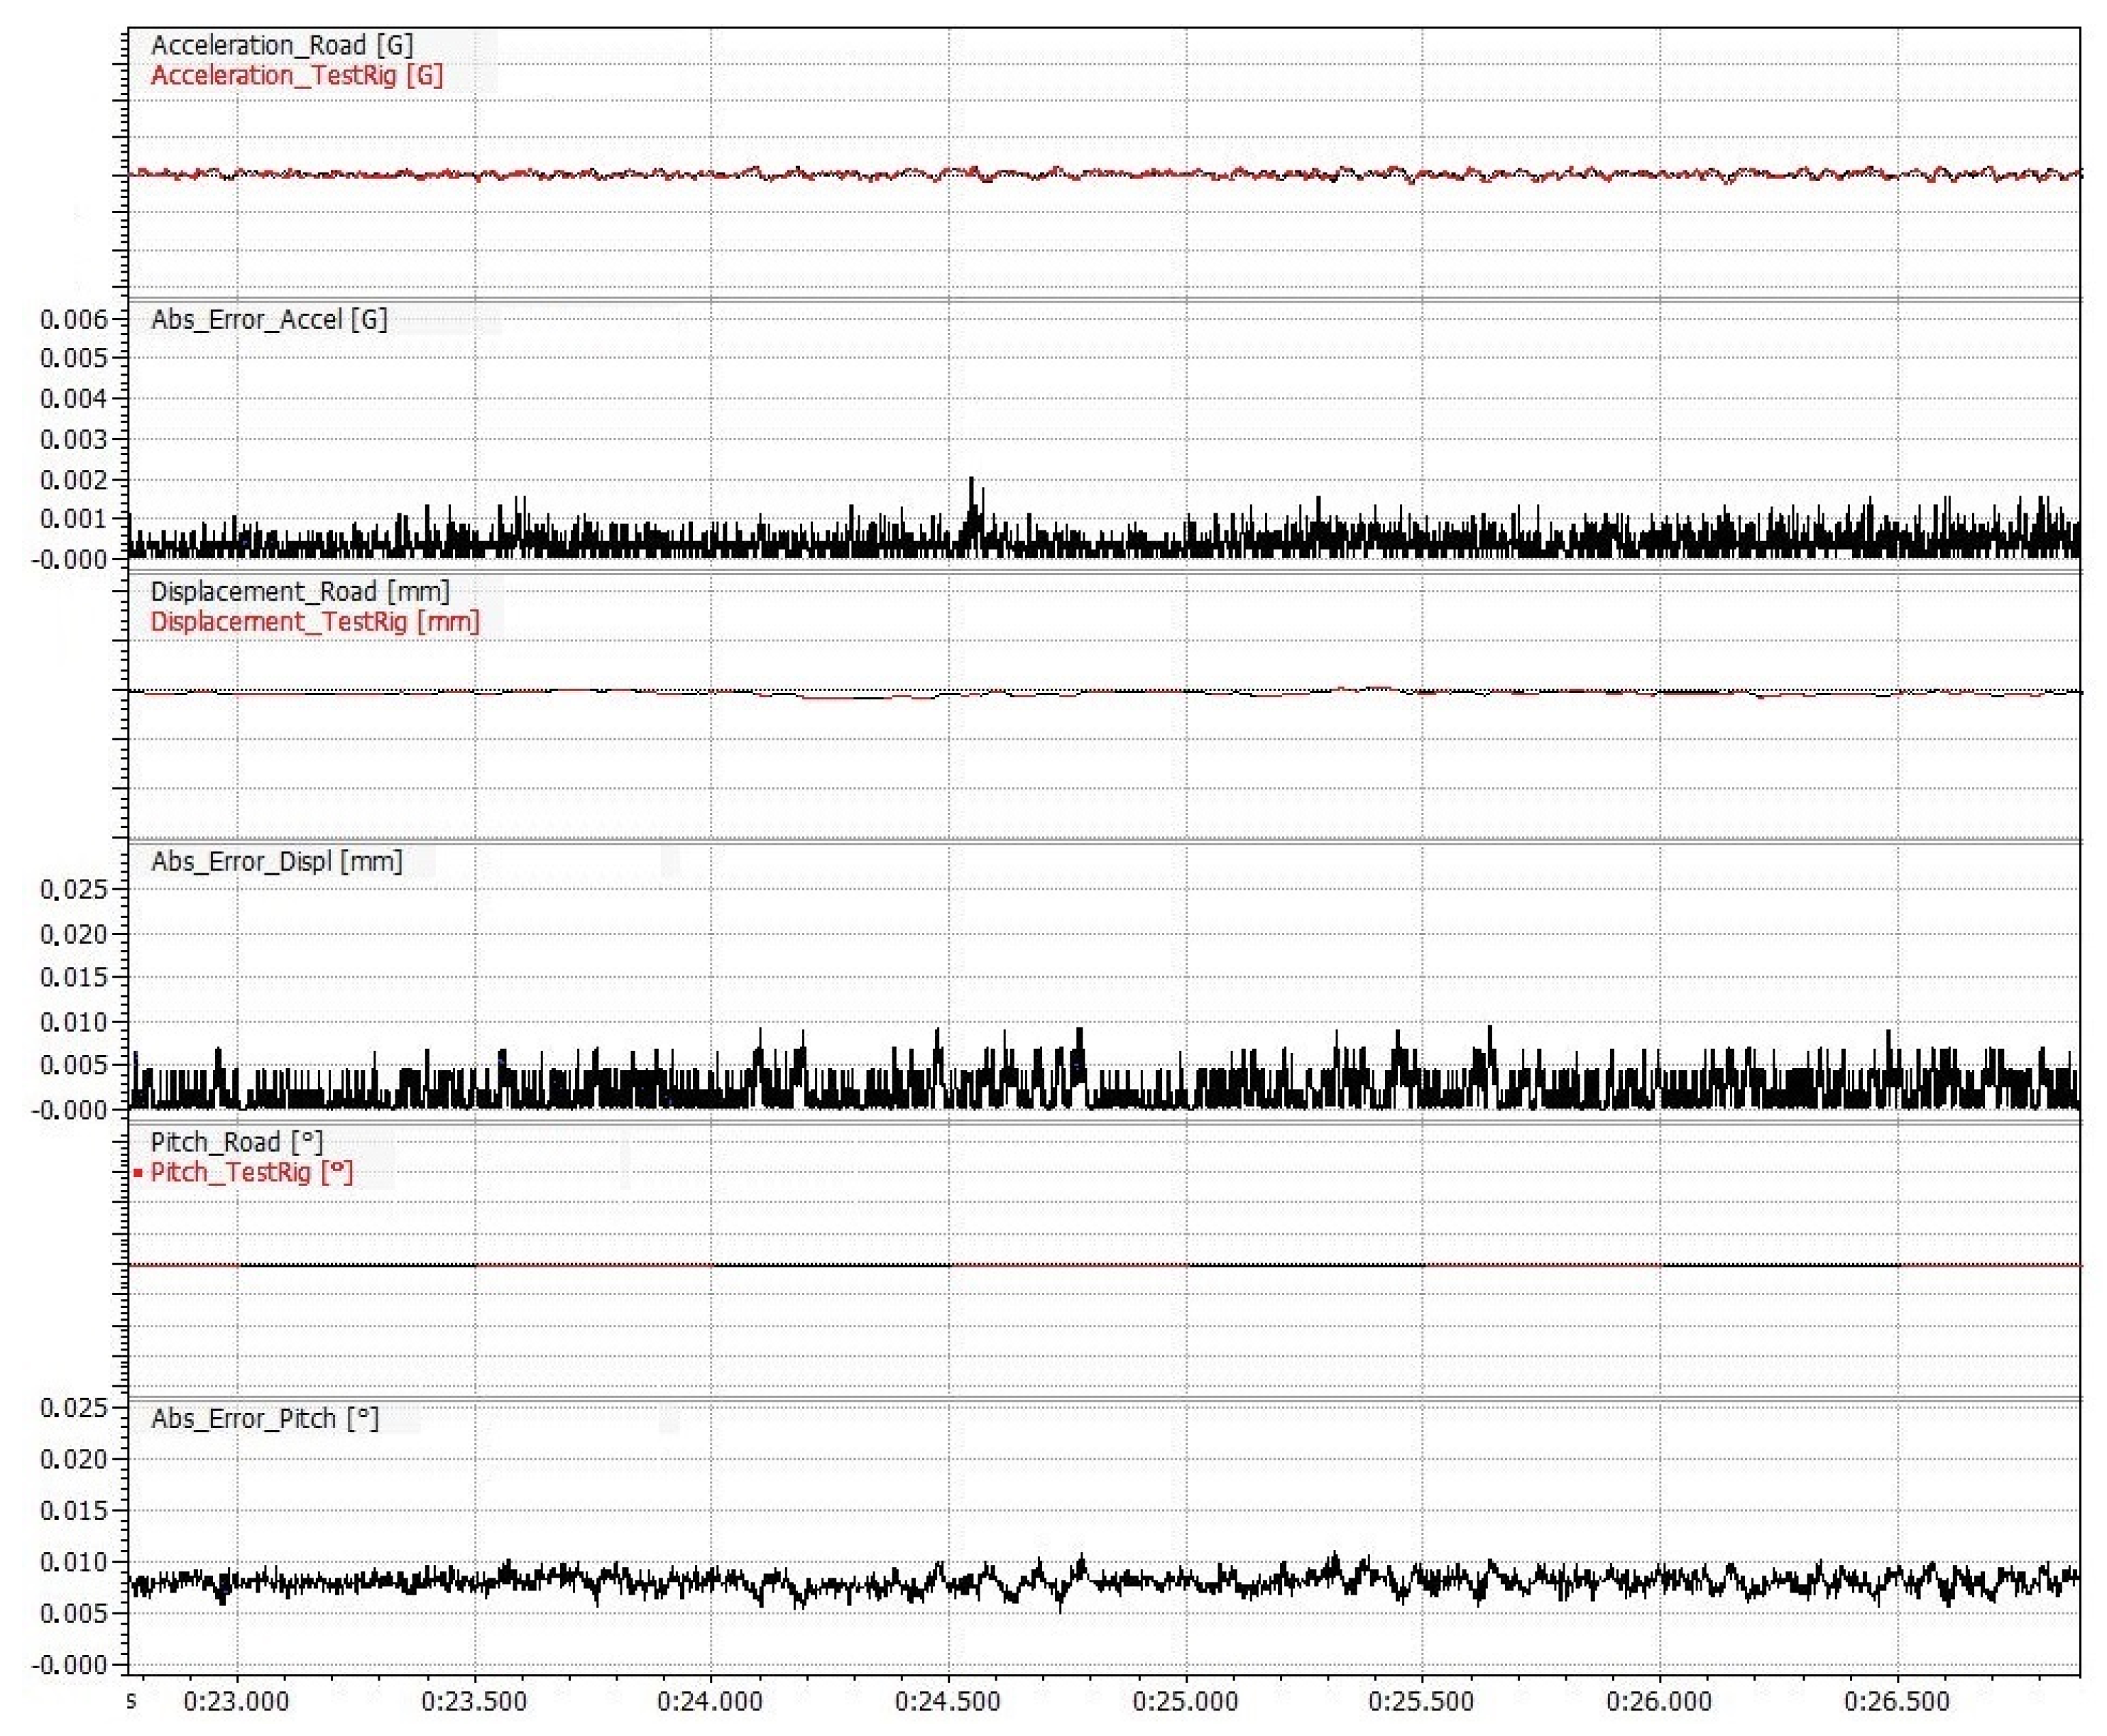
Figure 16.
Test performed on a speed hump at 30 km/h.

© 2017 by the authors. Licensee MDPI, Basel, Switzerland. This article is an open access article distributed under the terms and conditions of the Creative Commons Attribution (CC BY) license (http://creativecommons.org/licenses/by/4.0/).
Share and Cite
MDPI and ACS Style
Chindamo, D.; Gadola, M.; Armellin, D.; Marchesin, F. Design of a Road Simulator for Motorcycle Applications. Appl. Sci. 2017, 7, 1220. https://doi.org/10.3390/app7121220
AMA Style
Chindamo D, Gadola M, Armellin D, Marchesin F. Design of a Road Simulator for Motorcycle Applications. Applied Sciences. 2017; 7(12):1220. https://doi.org/10.3390/app7121220
Chicago/Turabian StyleChindamo, Daniel, Marco Gadola, Dario Armellin, and Felipe Marchesin. 2017. "Design of a Road Simulator for Motorcycle Applications" Applied Sciences 7, no. 12: 1220. https://doi.org/10.3390/app7121220
Note that from the first issue of 2016, this journal uses article numbers instead of page numbers. See further details here.