Genetic Algorithm-Based Optimization Methodology of Bézier Curves to Generate a DCI Microscale-Model

 ,
,
Abstract
:
1. Introduction
2. Background
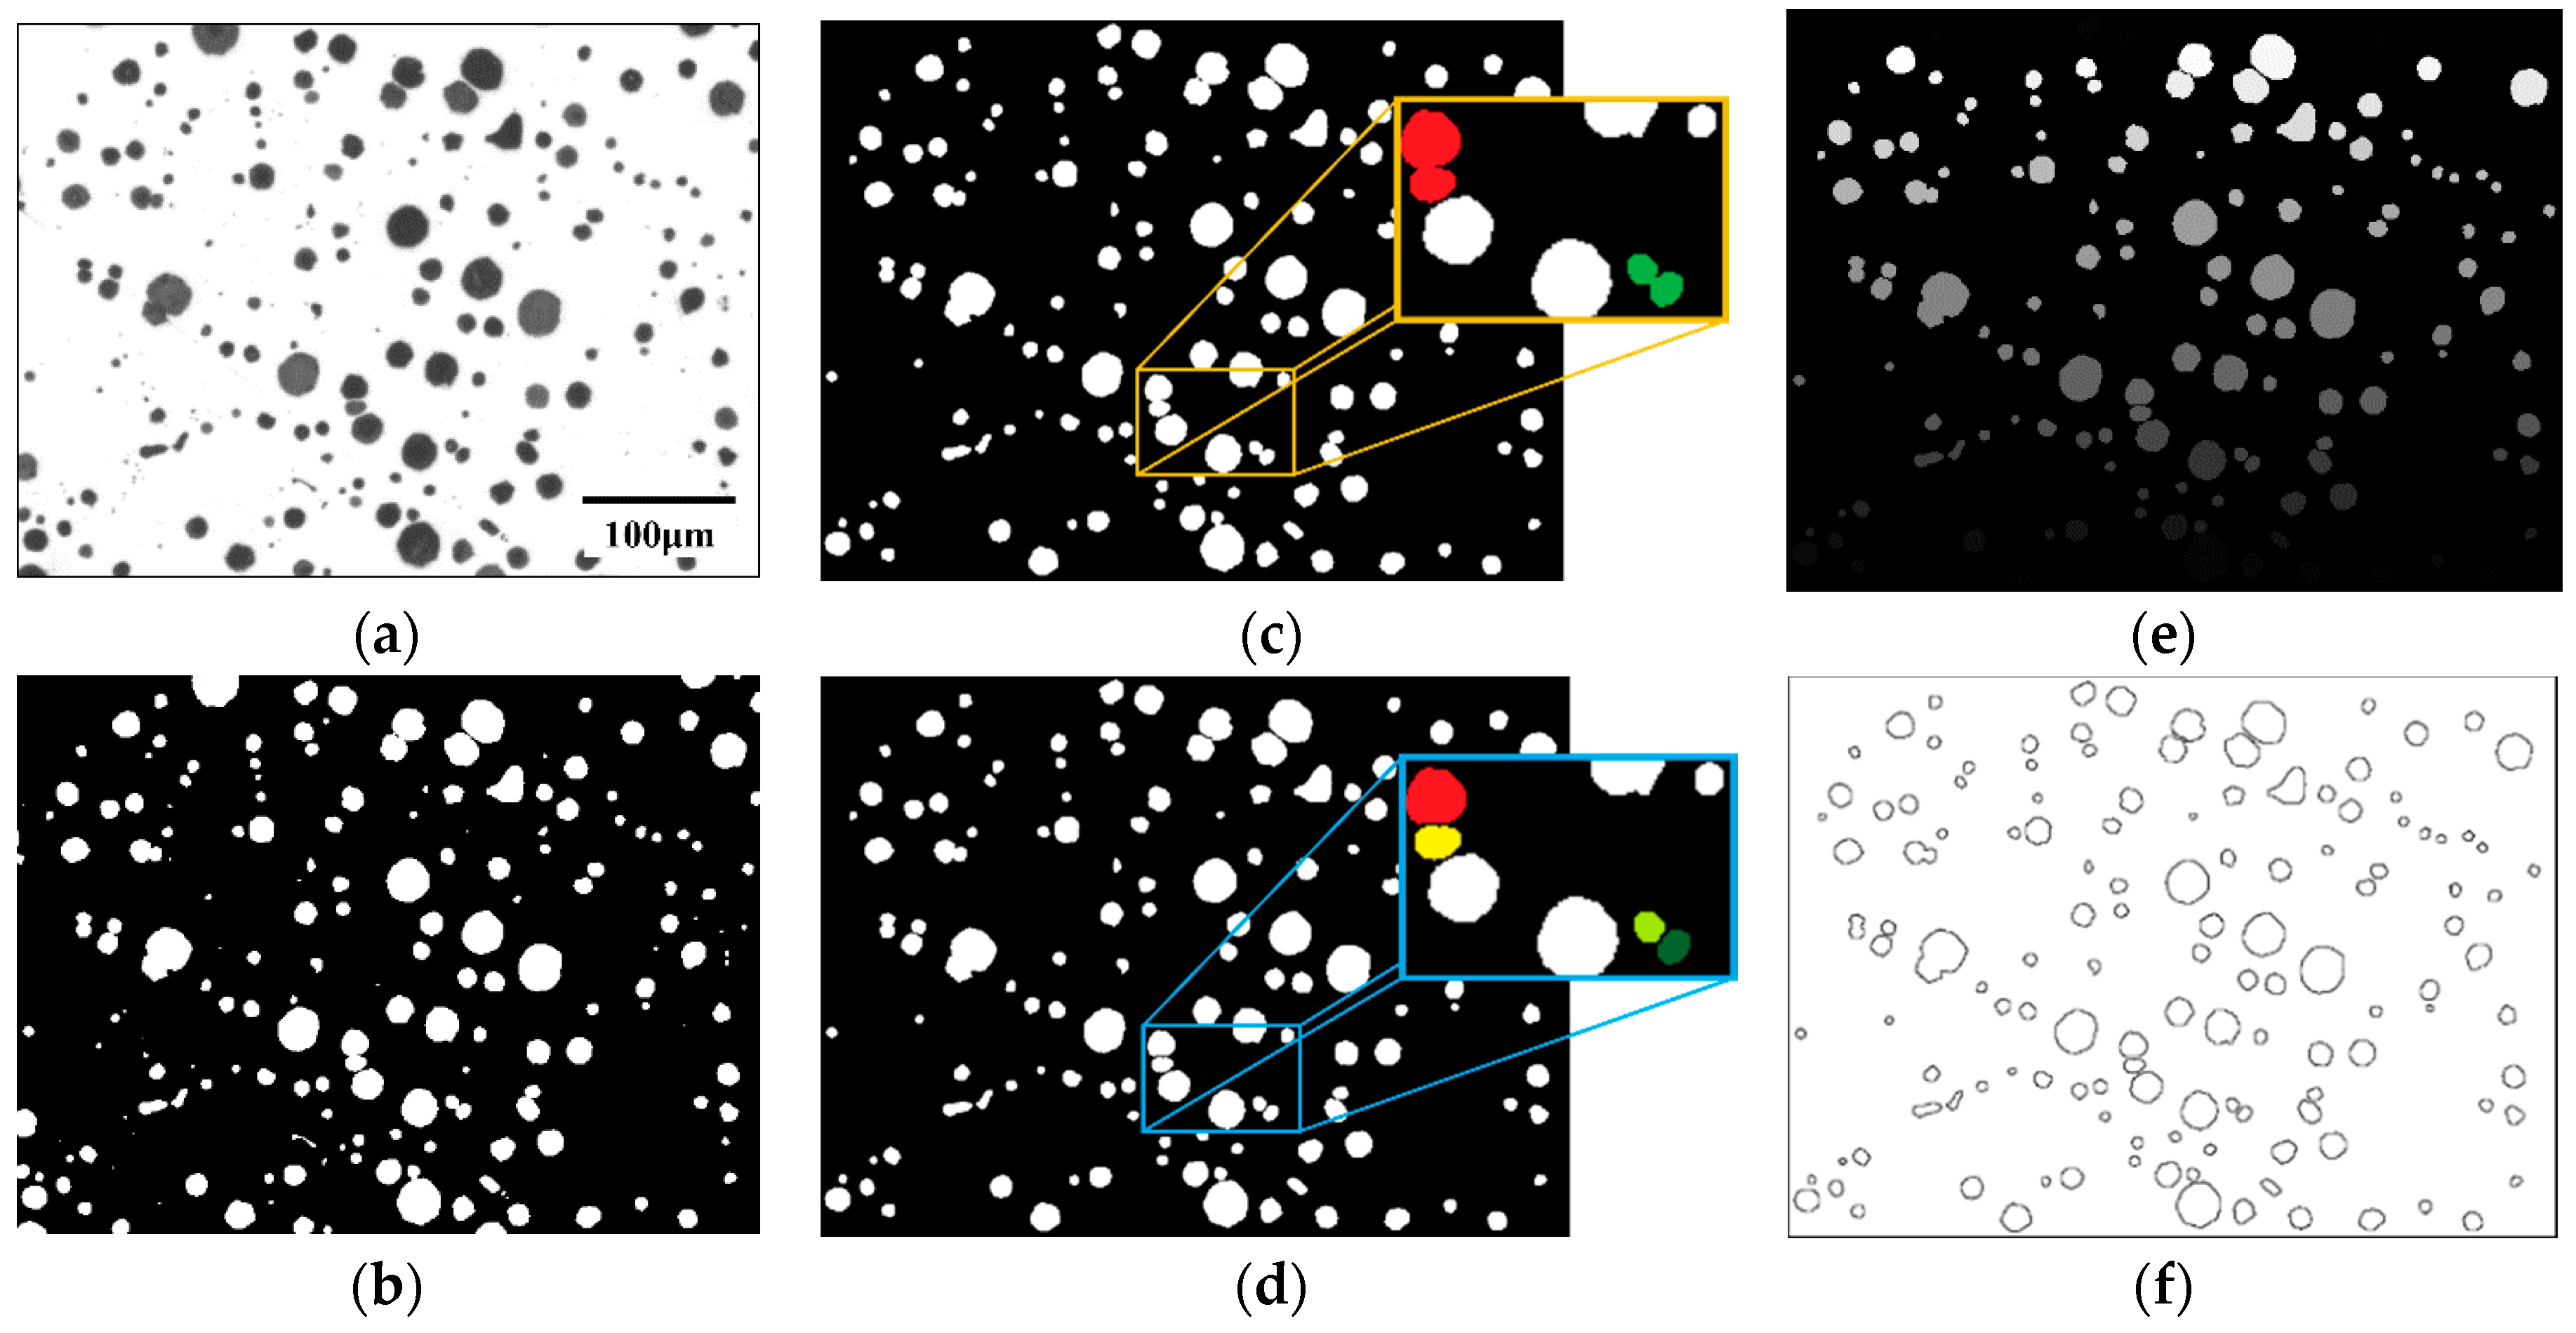
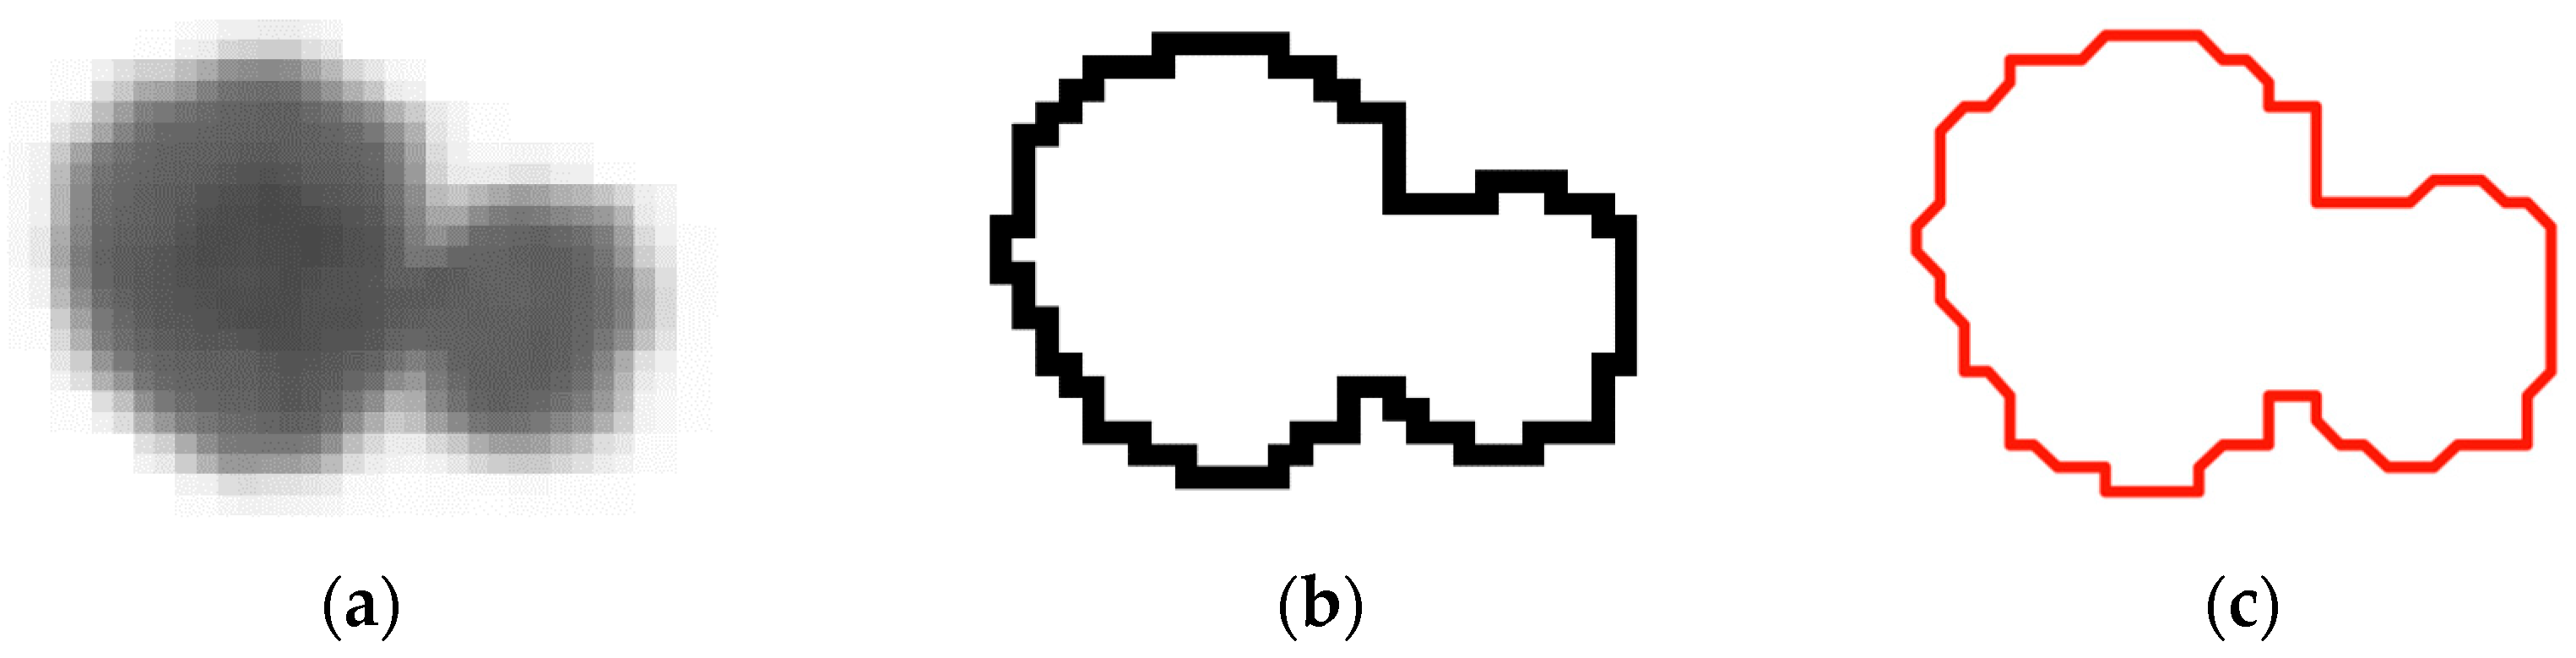
2.1. Discretization Error Due to Image Processing
2.2. Bézier Curves
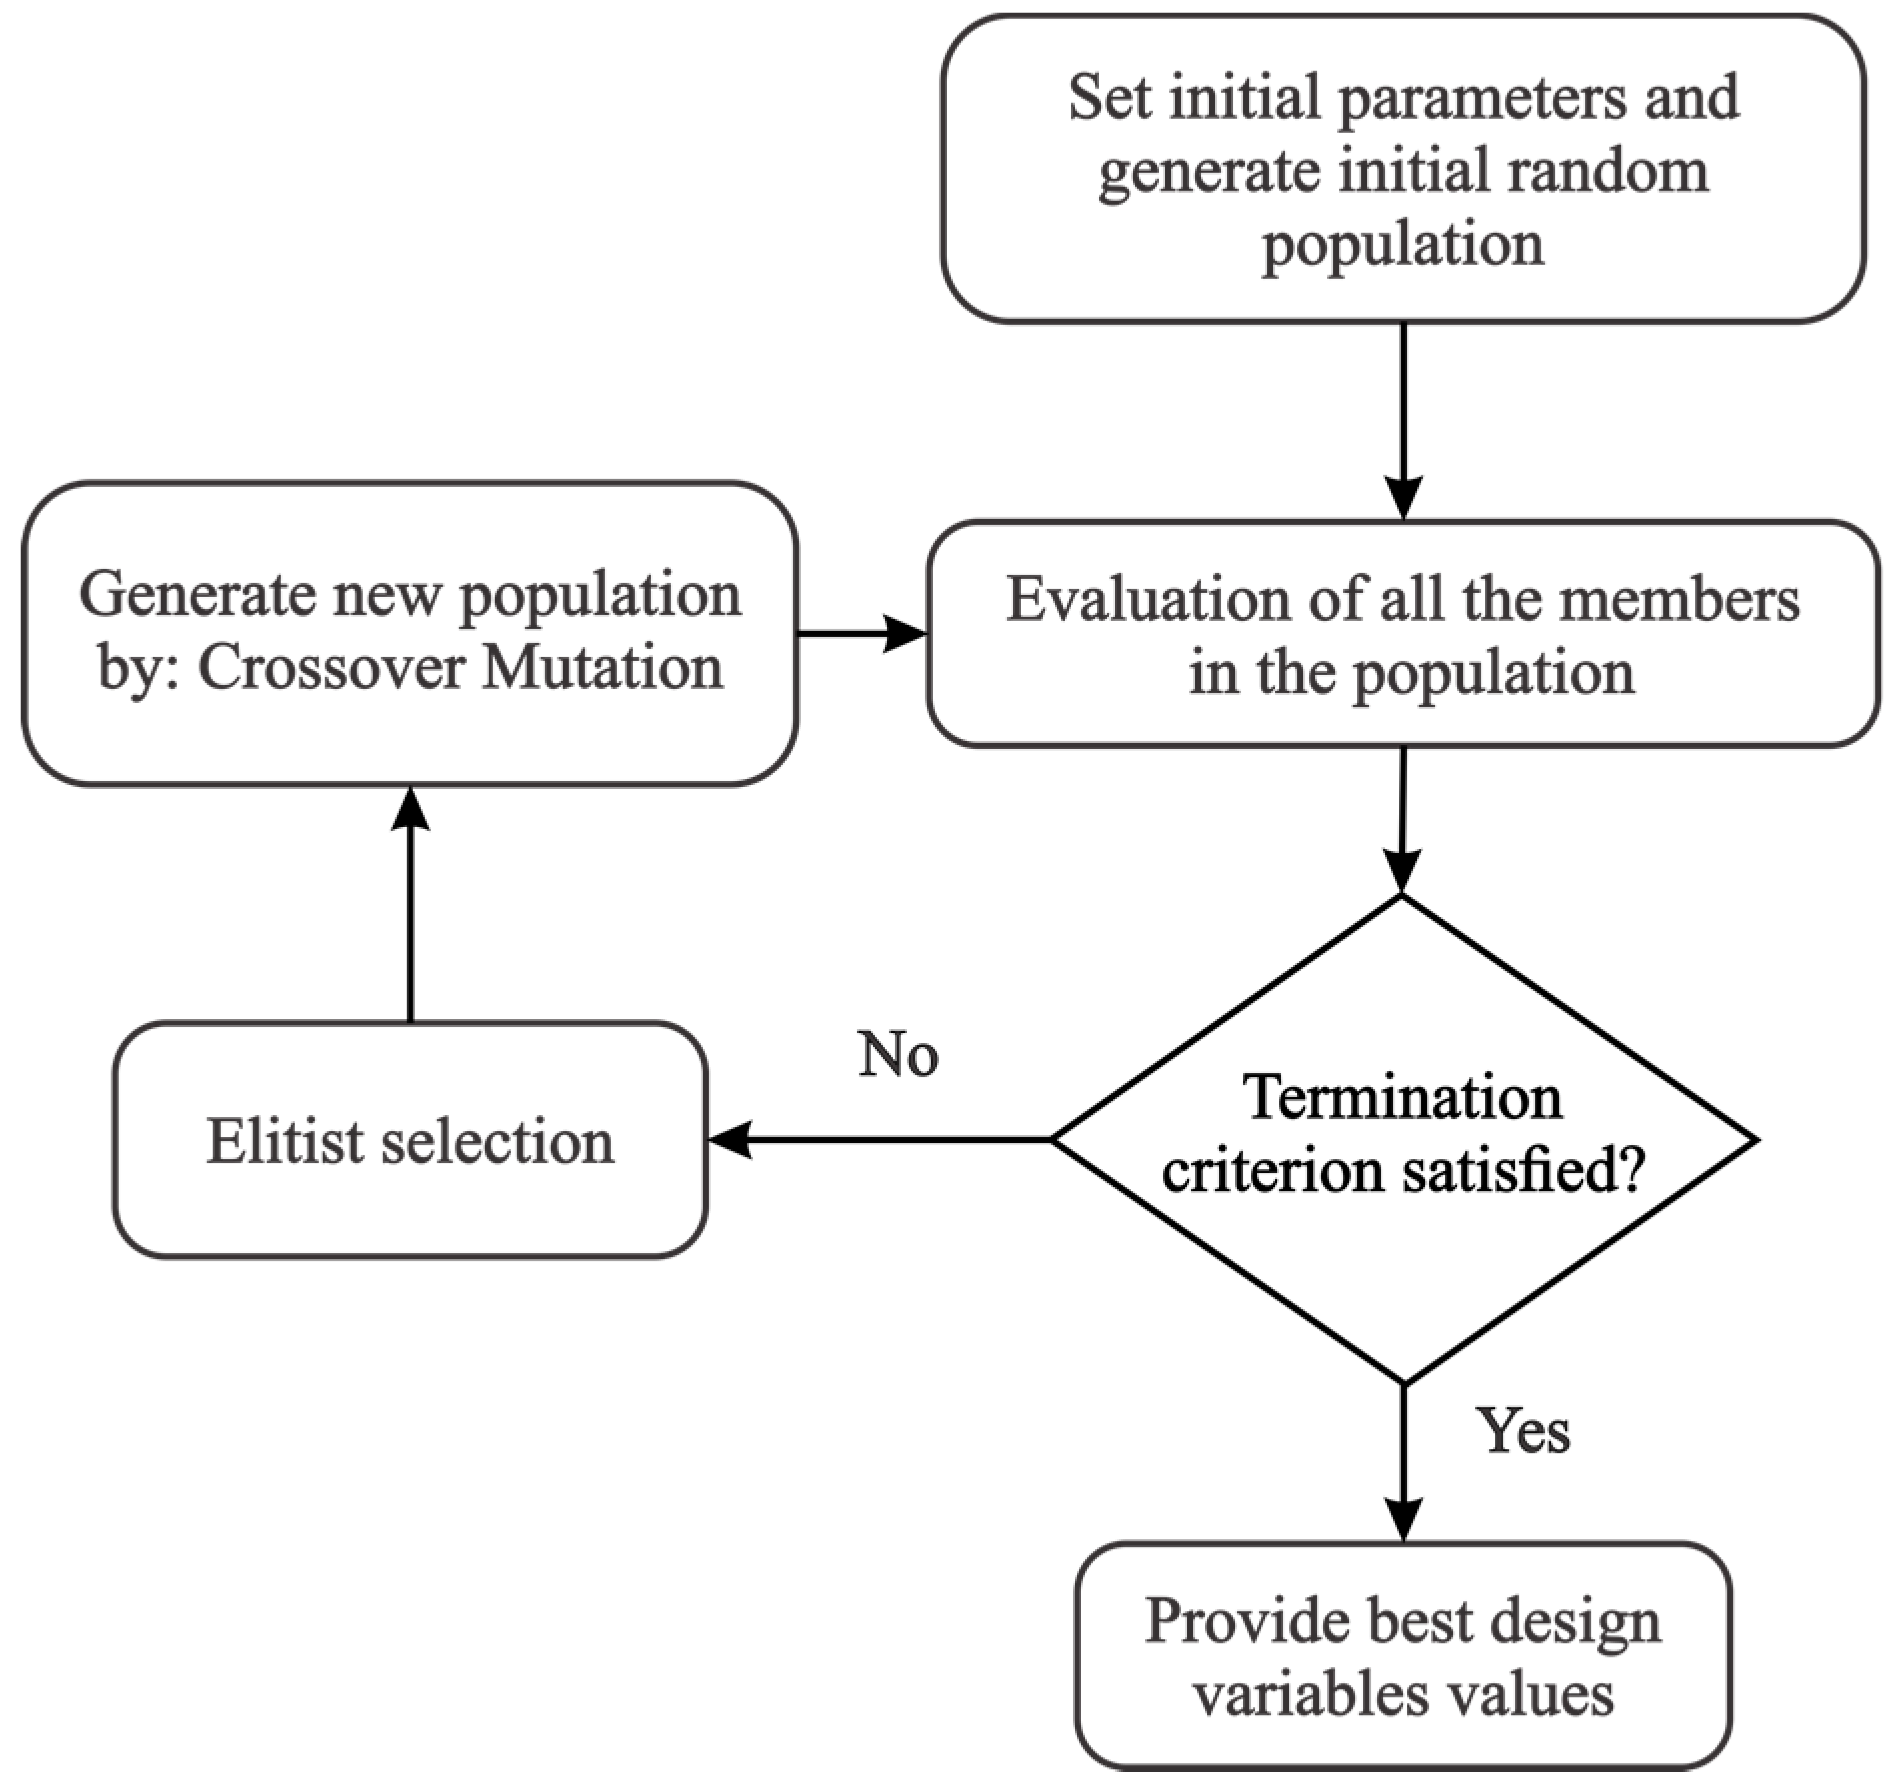
2.3. Standard Genetic Algorithms-Based Optimization
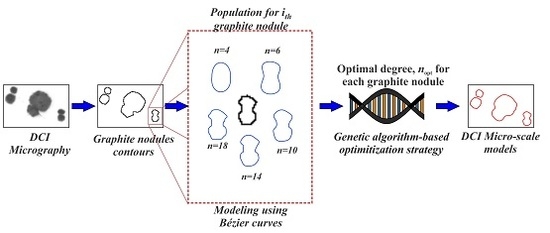
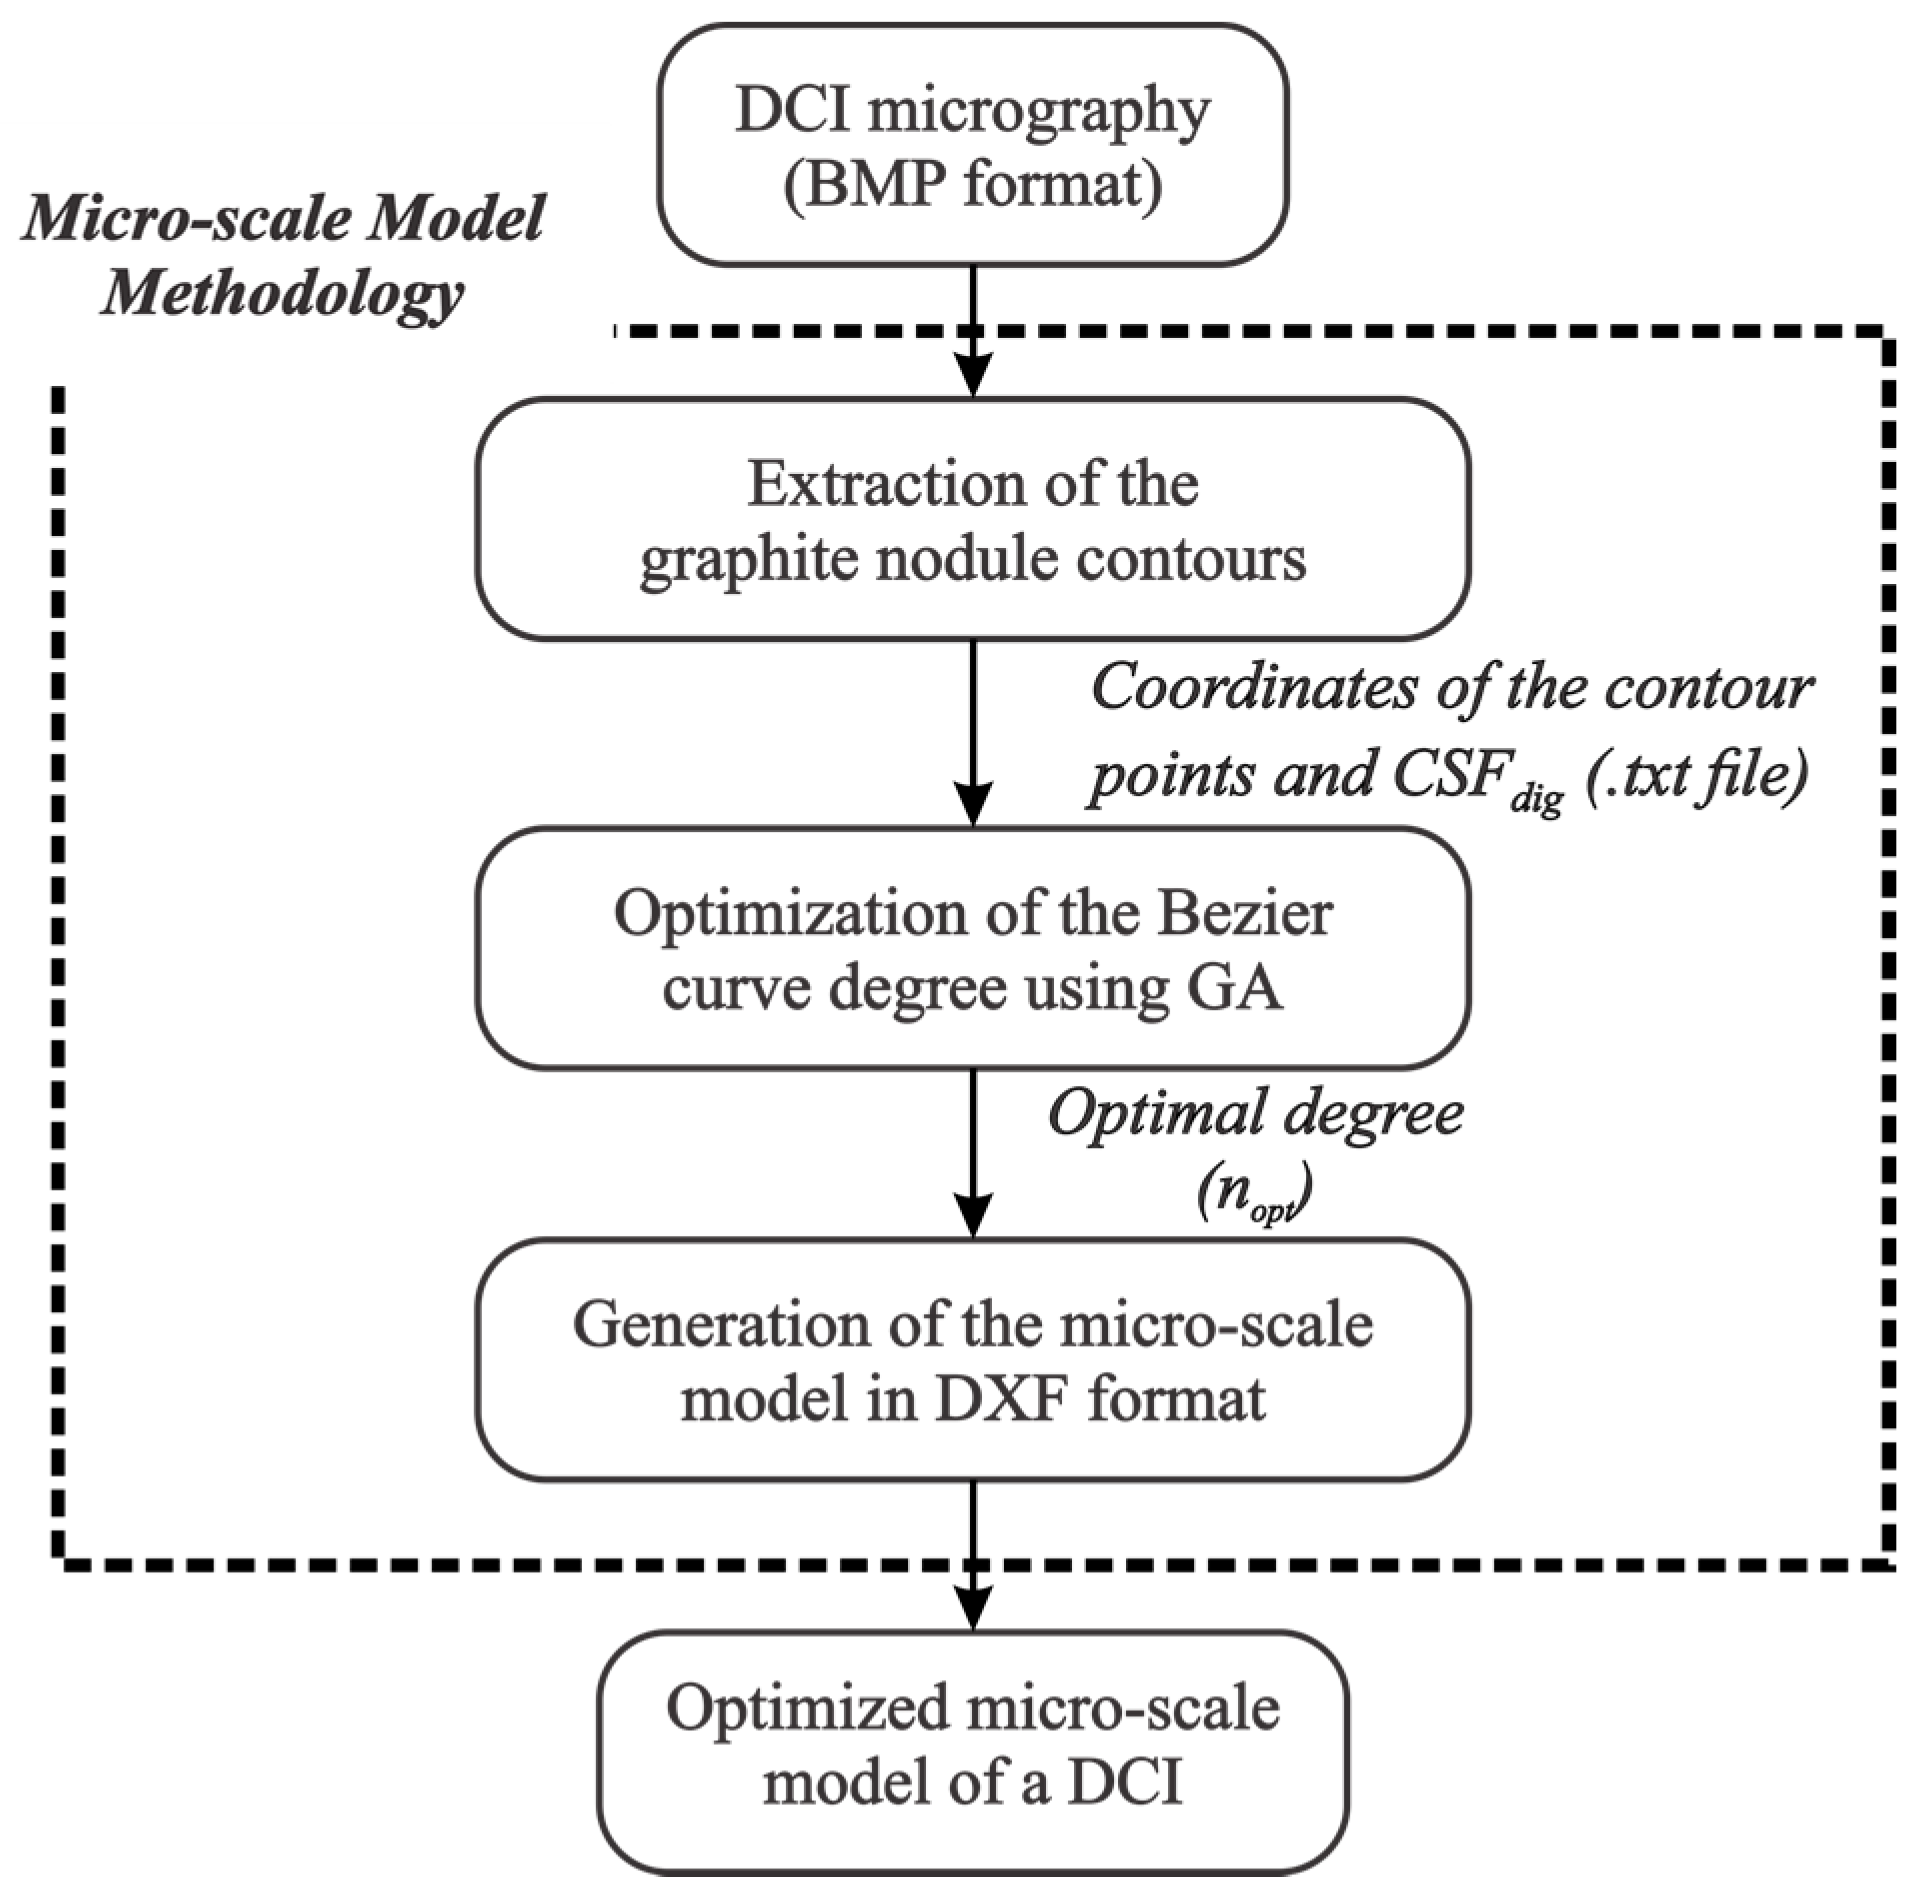
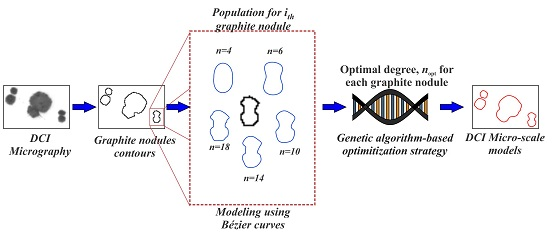
3. Methodology
3.1. Extraction of the Graphite Nodule Contours
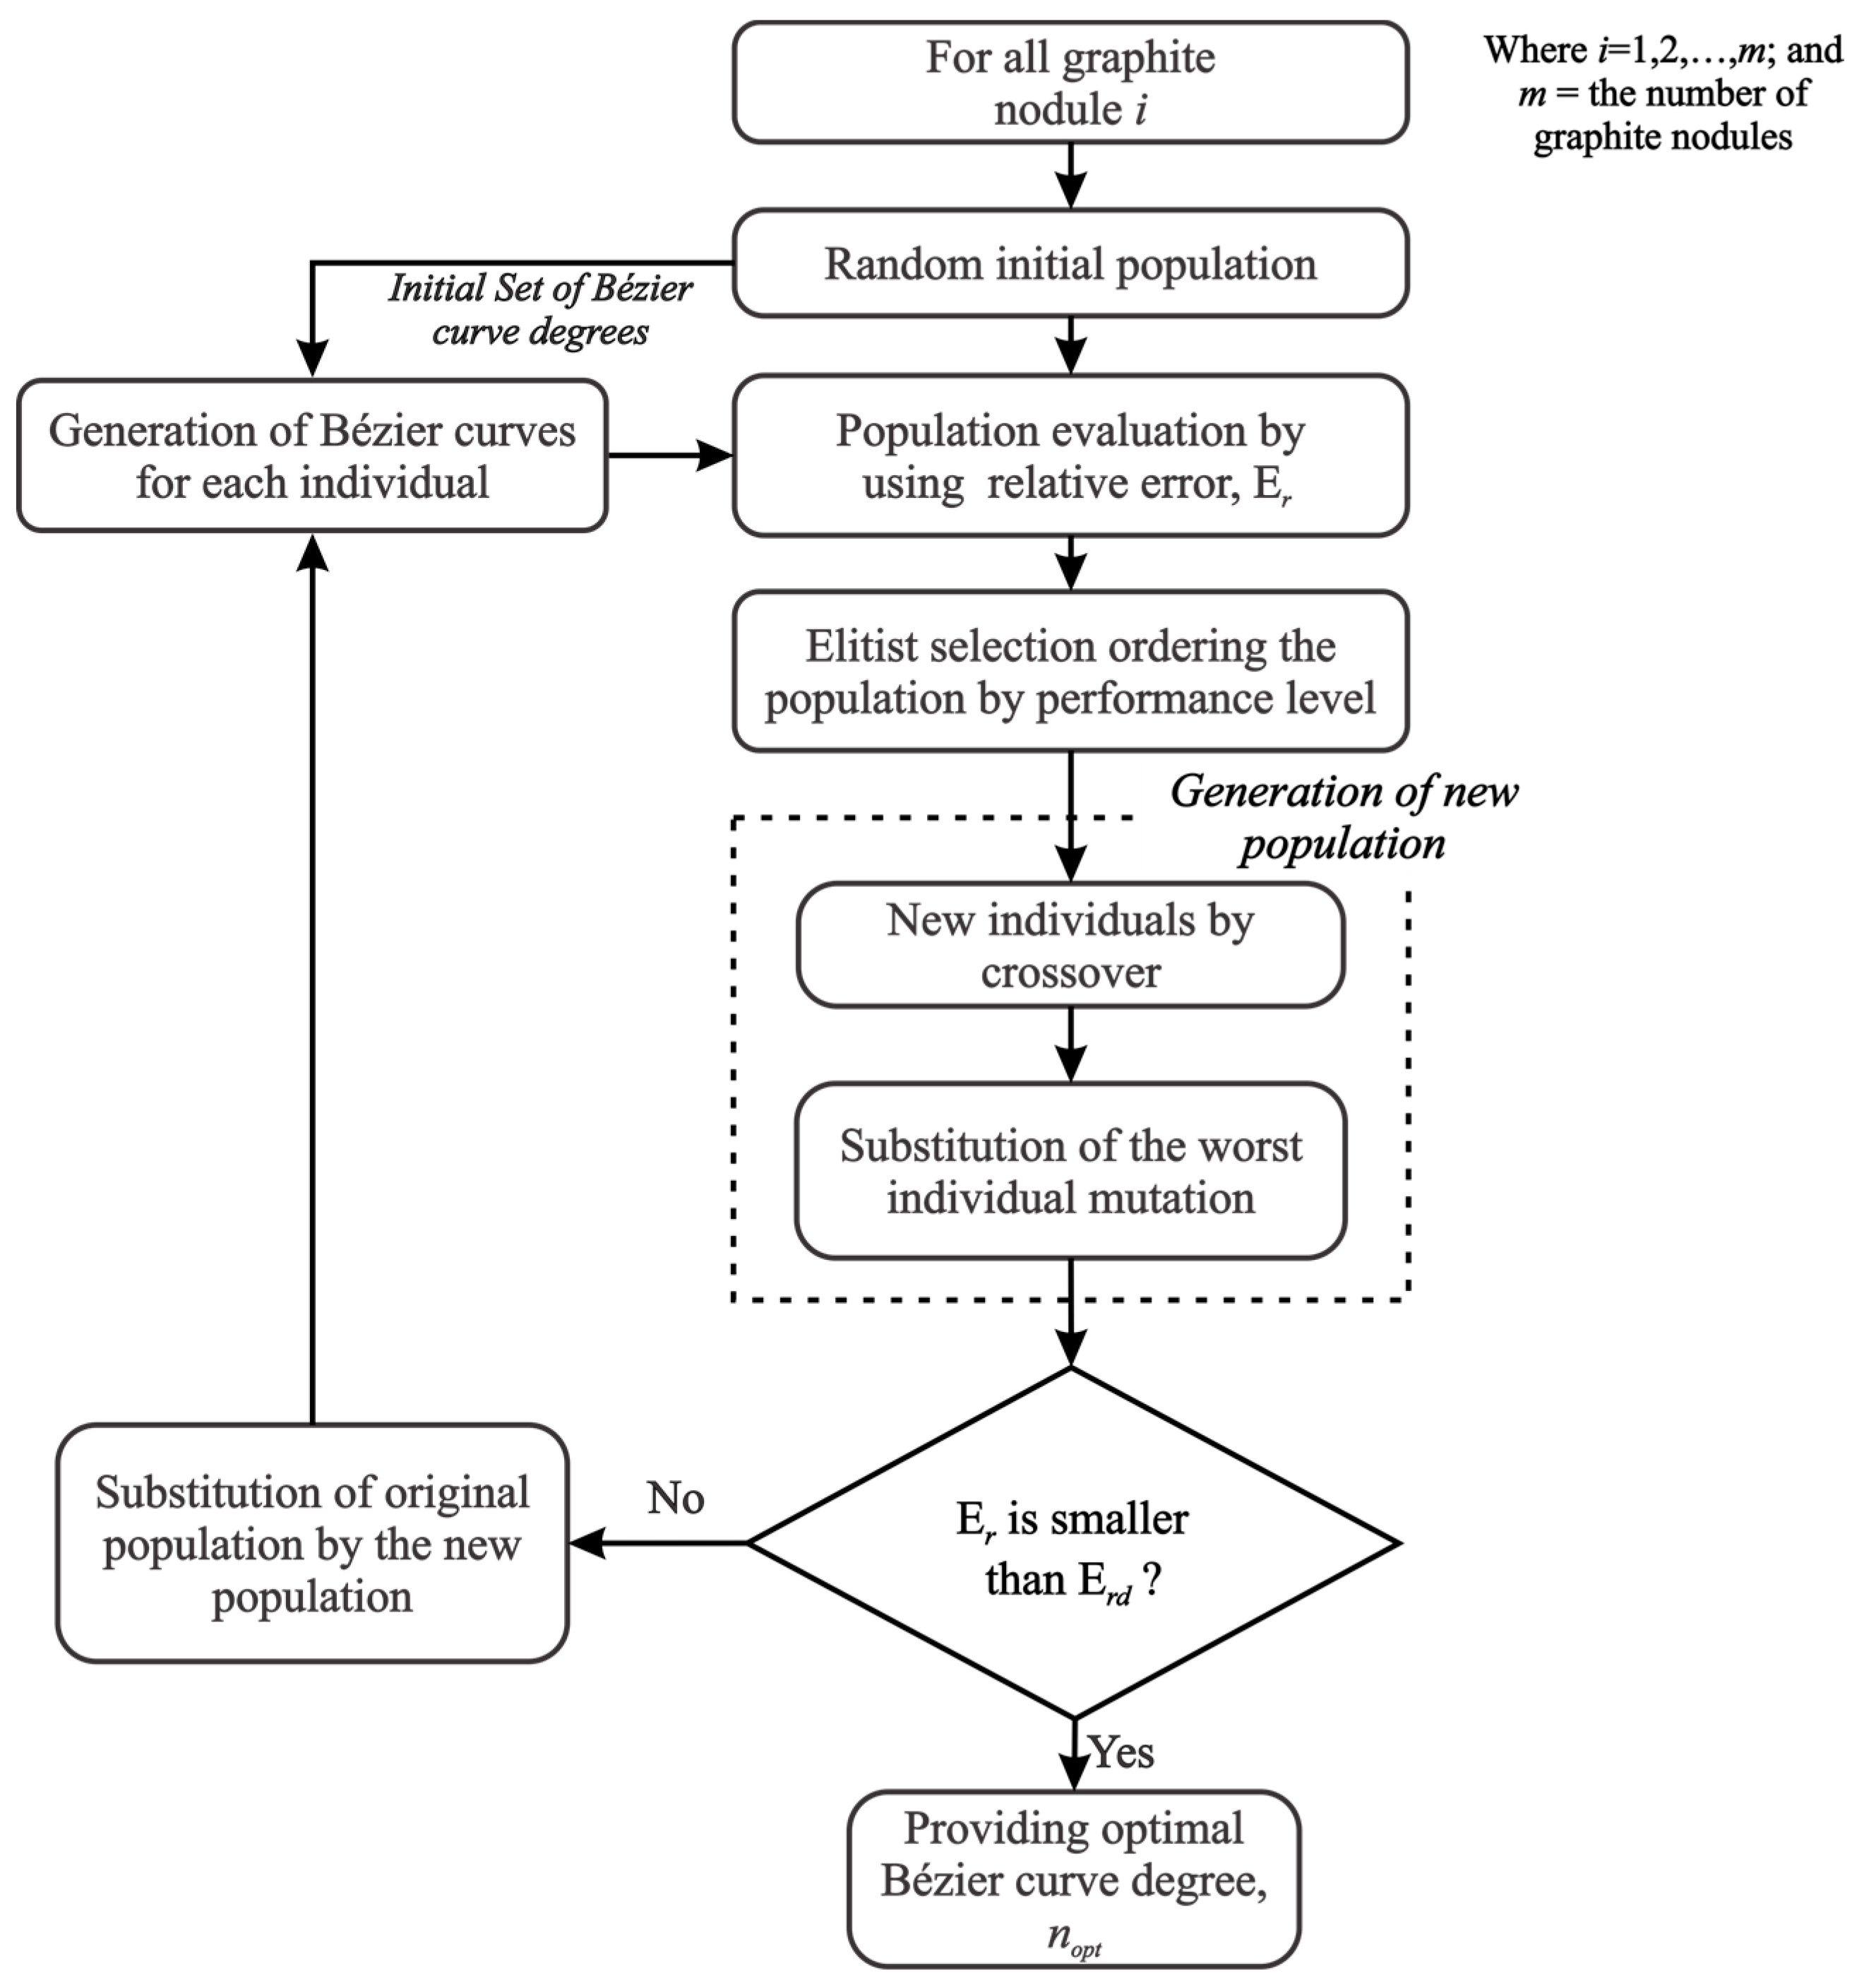
3.2. Optimization of the Bezier Curve Degree Using GA
3.3. Generation of the Micro-Scale Model in DXF Format
4. Results and Discussion
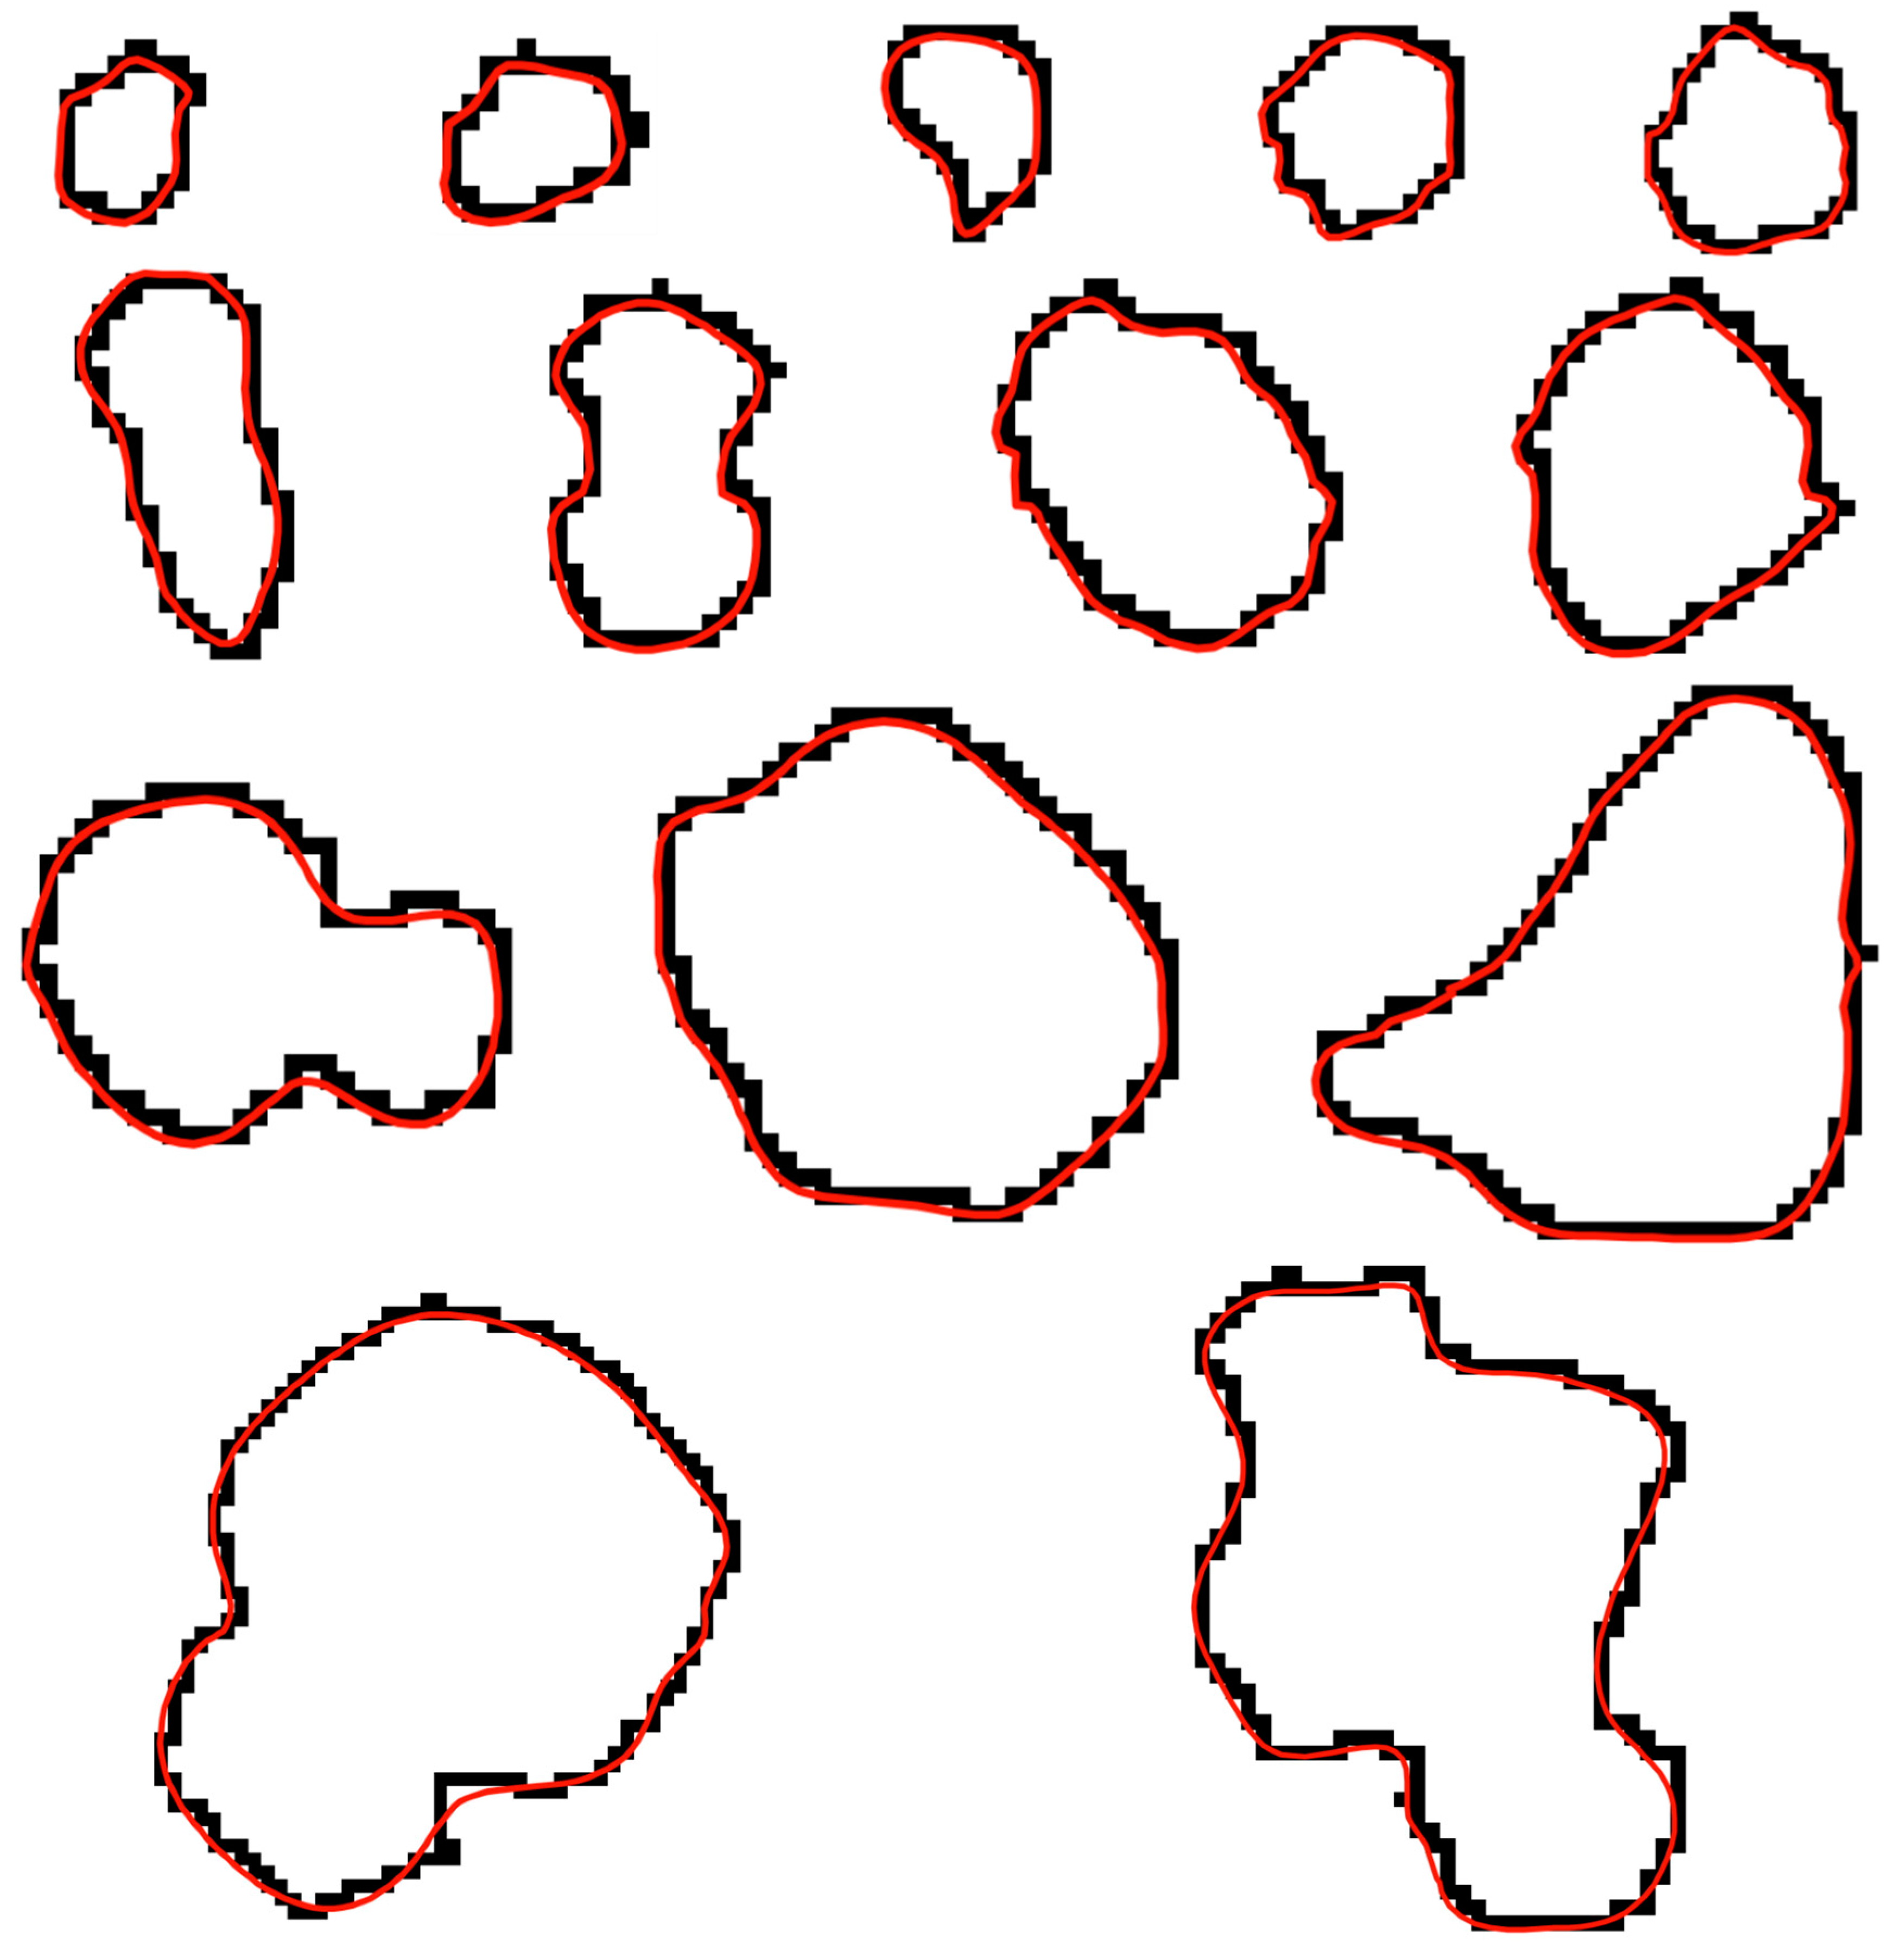
4.1. Graphite Nodules Contours
4.2. Optimized Micro-Scale Models through Genetic Algorithms
4.3. Geometric Comparison of the Obtained Models
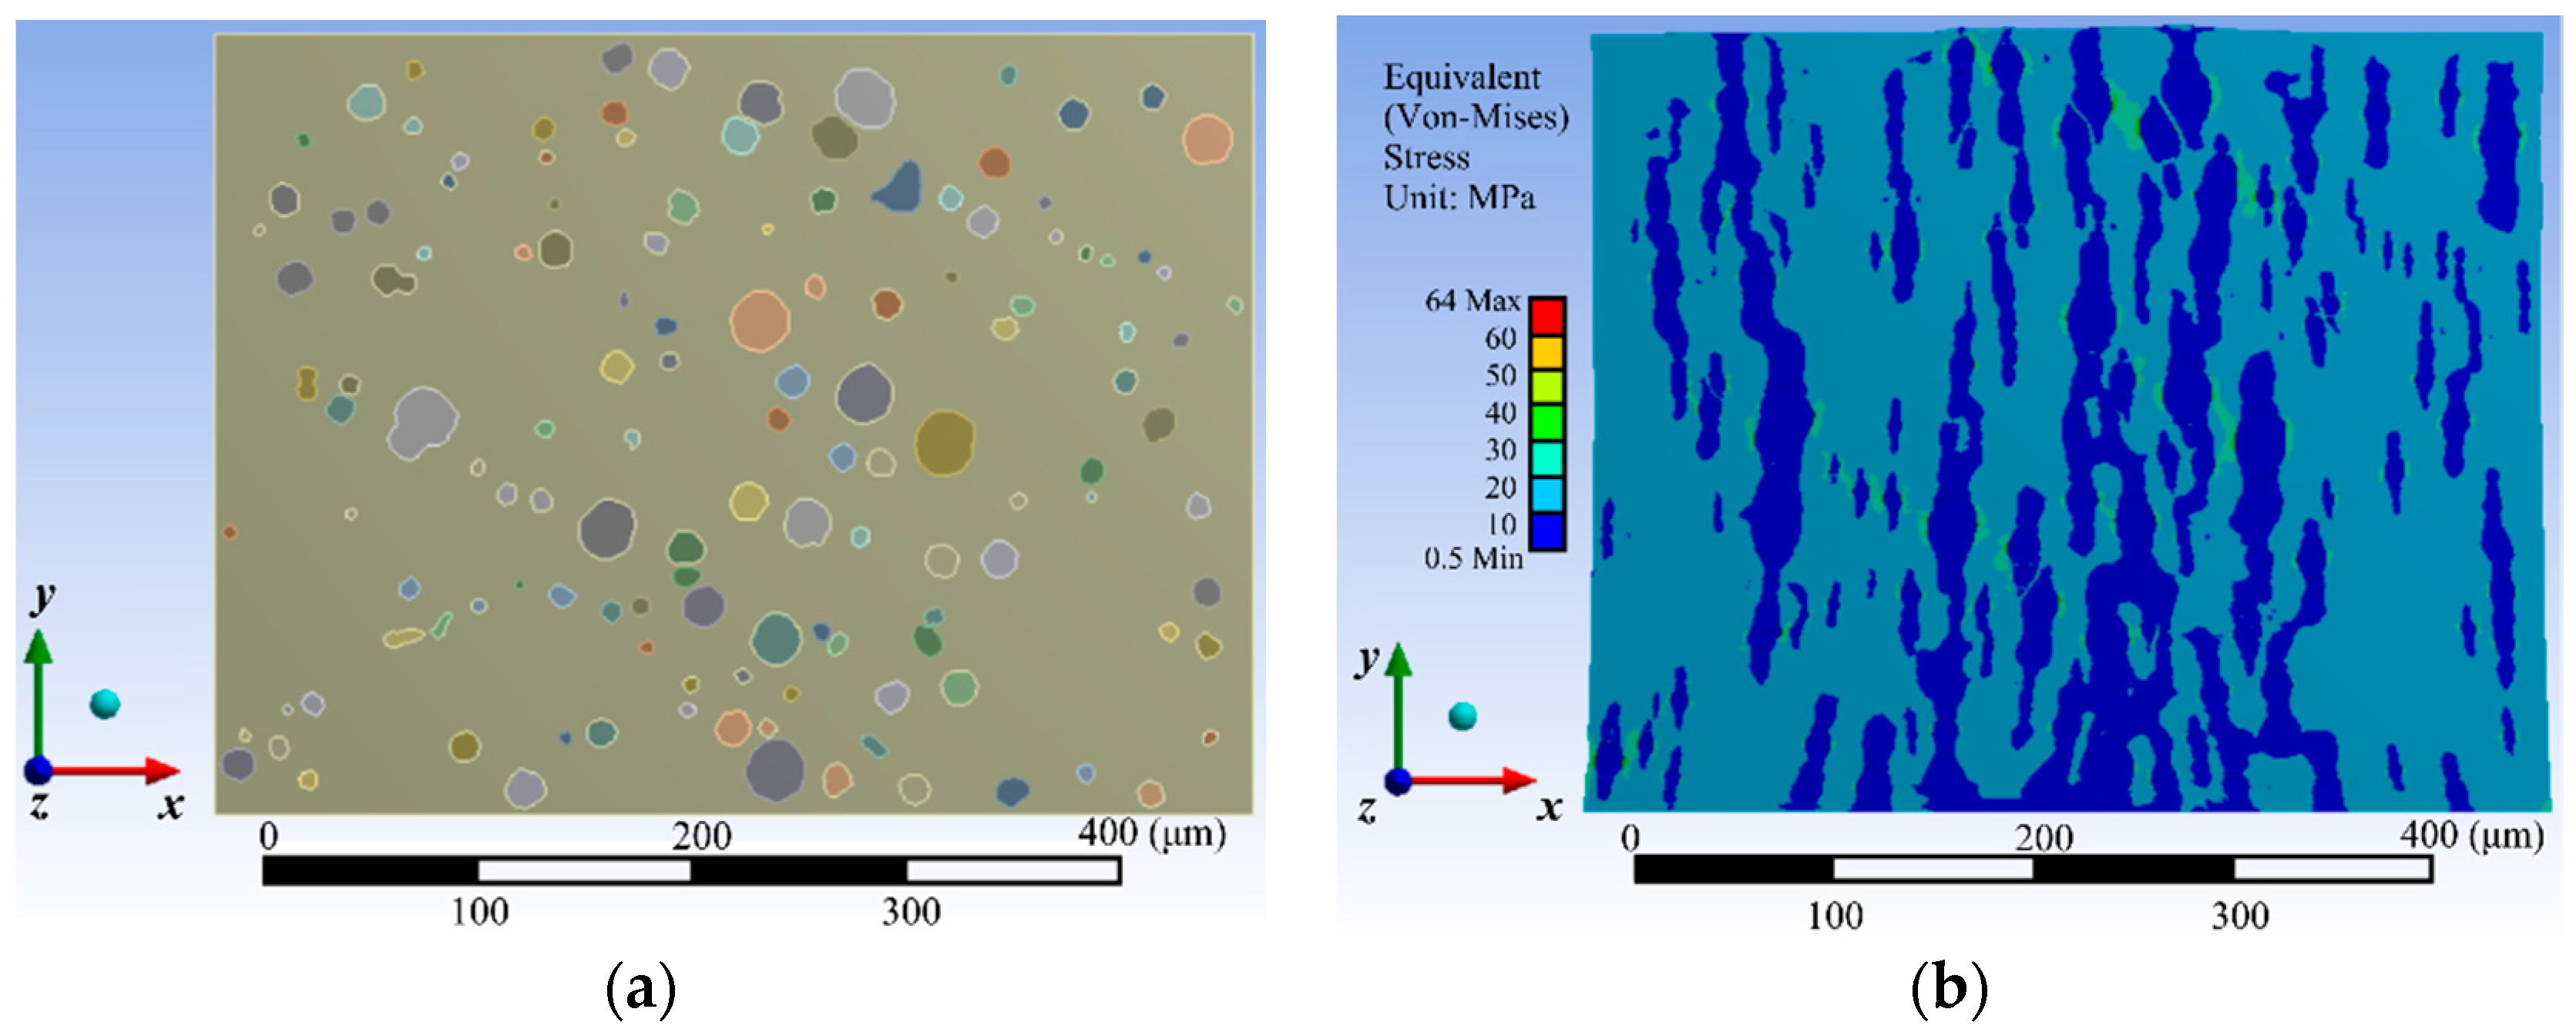
4.4. Validation Using a FEA
5. Conclusions
Acknowledgments
Author Contributions
Conflicts of Interest
References
- Benedetti, M.; Torresani, E.; Fontanari, V.; Lusuardi, D. Fatigue and Fracture Resistance of Heavy-Section Ferritic Ductile Cast Iron. Metals 2017, 7, 88. [Google Scholar] [CrossRef]
- Murcia, S.C.; Ossa, E.A.; Celentano, D.J. Nodule Evolution of Ductile Cast Iron during Solidification. Metall. Mater. Trans. B 2014, 45, 707–718. [Google Scholar] [CrossRef]
- Basso, A.; Caldera, M.; Massone, J. Development of High Silicon Dual Phase Austempered Ductile Iron. ISIJ Int. 2015, 55, 1106–1113. [Google Scholar] [CrossRef] [Green Version]
- Cardoso, P.H.S.; Israel, C.L.; Strohaecker, T.R. Abrasive wear in Austempered Ductile Irons: A comparison with white cast irons. Wear 2014, 313, 29–33. [Google Scholar] [CrossRef]
- Han, C.F.; Wang, Q.Q.; Sun, Y.F.; Li, J. Effects of Molybdenum on the Wear Resistance and Corrosion Resistance of Carbidic Austempered Ductile Iron. Metallogr. Micros. Anal. 2015, 4, 298–304. [Google Scholar] [CrossRef]
- Zhao, P.; Wang, J.; Hang, B.; Wang, Y.; Ma, J.; Zhao, X.; Wang, C. Effect of Quenching and Partitioning Heat Treatment on Ductile Cast Irons. In Proceedings of the International Symposium on Materials Application and Engineering, Chiang Mai, Thailand, 20–21 August 2016; Jawaid, M., Kenawy, E.-R., Eds.; [Google Scholar]
- Fragassa, C.; Pavlovic, A. Compacted and Spheroidal graphite irons: Experimental evaluation of Poisson’s ratio. FME Transl. 2016, 44, 327–332. [Google Scholar] [CrossRef]
- Čanžar, P.; Tonković, Z.; Kodvanj, J. Microstructure influence on fatigue behaviour of nodular cast iron. Mater. Sci. Eng. A 2012, 556, 88–99. [Google Scholar] [CrossRef] [Green Version]
- Tiedje, N.S. Solidification, processing and properties of ductile cast iron. Mater. Sci. Technol. 2010, 26, 505–514. [Google Scholar] [CrossRef]
- Andriollo, T.; Thorborg, J.; Tiedje, N.; Hattel, J. A micro-mechanical analysis of thermo-elastic properties and local residual stresses in ductile iron based on a new anisotropic model for the graphite nodules. Model. Simul. Mater. Sci. Eng. 2016, 24, 55012–55030. [Google Scholar] [CrossRef]
- Carazo, F.D.; Giusti, S.M.; Boccardo, A.D. Effective properties of nodular cast-iron: A multi-scale computational approach. Comput. Mater. Sci. 2014, 82, 378–390. [Google Scholar] [CrossRef]
- Rodríguez, F.J.; Dardati, P.M.; Godoy, L.A.; Celentano, D.J. Evaluación de propiedades elásticas de la fundición nodular empleando micromecánica computacional. Revista Internacional de Métodos Numéricos para Cálculo y Diseño en Ingeniería 2015, 31, 91–105. [Google Scholar] [CrossRef]
- Di Cocco, V.; Iacoviello, D.; Iacoviello, F. Graphite nodules influence on DCIs mechanical properties: Experimental and numerical investigation. In Proceedings of the XXIII Italian Group of Fracture Meeting, Favignana, Italy, 22–24 June 2015; Iacoviello, F., Ferro, G.A., Susmel, L., Eds.; pp. 135–143. [Google Scholar]
- Kasvayee, K.A.; Salomonsson, K.; Ghassemali, E.; Jarfors, A.E. Microstructural strain distribution in ductile iron; comparison between finite element simulation and digital image correlation measurements. Mater. Sci. Eng. A 2016, 655, 27–35. [Google Scholar] [CrossRef]
- Vaško, A. Evaluation of Shape of Graphite Particles in Cast Irons by a Shape Factor. In Proceedings of the 32nd DANUBIA ADRIA Symposium on Advanced in Experimental Mechanics, Žilina, Slovakia, 22–25 September 2016; Nicoletto, G., Pastrama, S.D., Emri, I., Eds.; Volume 3, pp. 1199–1204. [Google Scholar]
- Fernandino, D.O.; Cisilino, A.P.; Boeri, R.E. Determination of effective elastic properties of ferritic ductile cast iron by computational homogenization, micrographs and microindentation tests. Mech. Mater. 2015, 83, 110–121. [Google Scholar] [CrossRef]
- Carvalho, A.; Silva, T.; Loja, M.A.R.; Damásio, F.R. Assessing the influence of material and geometrical uncertainty on the mechanical behavior of functionally graded material plates. Mech. Adv. Mater. Struct. 2017, 24, 417–426. [Google Scholar] [CrossRef]
- Ahmadi, H.; Nejad, A.Z. Geometrical effects on the local joint flexibility of two-planar tubular DK-joints in jacket substructure of offshore wind turbines under OPB loading. Thin-Walled Struct. 2017, 114, 122–133. [Google Scholar] [CrossRef]
- Ceruti, A.; Marzocca, P. Heuristic optimization of Bezier curves based trajectories for unconventional airships docking. Aircr. Eng. Aerosp. Technol. 2017, 89, 76–86. [Google Scholar] [CrossRef]
- Hassan, A.; Abomoharam, M. Modeling and design optimization of a robot gripper mechanism. Robot. Comput.-Integr. Manuf. 2017, 46, 94–103. [Google Scholar] [CrossRef]
- Kouchmeshky, B.; Zabaras, N. Microstructure model reduction and uncertainty quantification in multiscale deformation processes. Comput. Mater. Sci. 2010, 48, 213–227. [Google Scholar] [CrossRef]
- Pal, S.; Ganguly, P.; Biswas, P.K. Cubic Bézier approximation of a digitized curve. Pattern Recognit. 2007, 40, 2730–2741. [Google Scholar] [CrossRef]
- Luo, Z.; LiWang, M.; Lin, Z.; Huang, L.; Du, X.; Guizani, M. Energy-Efficient Caching for Mobile Edge Computing in 5G Networks. Appl. Sci. 2017, 7, 557. [Google Scholar] [CrossRef]
- Morino, S.; Takahashi, M. Estimating Co-Contraction Activation of Trunk Muscles Using a Novel Musculoskeletal Model for Pregnant Women. Appl. Sci. 2017, 7, 1067. [Google Scholar] [CrossRef]
- Mohanty, D.; Chandra, A.; Chakraborti, N. Genetic algorithms based multi-objective optimization of an iron making rotary kiln. Comput. Mater. Sci. 2009, 45, 181–188. [Google Scholar] [CrossRef]
- Dugan, N.; Erkoç, Ş. Genetic algorithm–Monte Carlo hybrid geometry optimization method for atomic clusters. Comput. Mater. Sci. 2009, 45, 127–132. [Google Scholar] [CrossRef]
- Holland, J.H. Adaptation in Natural and Artificial Systems: An Introductory Analysis with Applications to Biology, Control, and Artificial Intelligence; The MIT Press: Cambridge, UK, 1992. [Google Scholar]
- Soille, P. Morphological Image Analysis: Principles and Applications, 2nd ed.; Springer: Berlin/Heidelberg, Germany, 2004. [Google Scholar]
- Morales-Hernández, L.A.; Terol-Villalobos, I.R.; Domínguez-González, A.; Manriquez-Guerrero, F.; Herrera-Ruiz, G. Spatial distribution and spheroidicity characterization of graphite nodules based on morphological tools. J. Mater. Process. Technol. 2010, 210, 335–342. [Google Scholar] [CrossRef]
- Talbot, H.; Terol-Villalobos, I.R. Binary image segmentation using weighted skeletons. In Proceedings of the Image Algebra and Morphological Image Processing III, San Diego, CA, USA, June 1992; pp. 393–404. [Google Scholar]
- Simba, K.R.; Uchiyama, N.; Aldibaja, M.; Sano, S. Vision-based smooth obstacle avoidance motion trajectory generation for autonomous mobile robots using Bézier curves. Proc. Inst. Mech. Eng. C J. Mech. Eng. Sci. 2017, 231, 541–554. [Google Scholar] [CrossRef]
- Luo, Z.; Wang, Q.; Fan, X.; Gao, Y.; Shui, P. Generalized rational Bézier curves for the rigid body motion design. Vis. Comput. 2016, 32, 1071–1084. [Google Scholar] [CrossRef]
- Reboucas, E.S.; Braga, A.M.; Marques, R.C.; Reboucas Filho, P.P. A new approach to calculate the nodule density of ductile cast iron graphite using a Level Set. Measurement 2016, 89, 316–321. [Google Scholar] [CrossRef]
- Philippine, M.A.; Sigmund, O.; Rebeiz, G.M.; Kenny, T.W. Topology optimization of stressed capacitive RF MEMS switches. J. Microelectron. Syst. 2013, 22, 206–215. [Google Scholar] [CrossRef]
- Sabzevari, M.; Teymoori, R.J.; Sajjadi, S.A. FE modeling of the compressive behavior of porous copper-matrix nanocomposites. Mater. Des. 2015, 86, 178–183. [Google Scholar] [CrossRef]


| Method | Model | Nodule A | Nodule B | Nodule C | Nodule D |
|---|---|---|---|---|---|
| (a) | n = 4 |  | 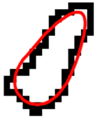 |  |  |
| CSFest Er | 0.9911 0.1203 | 0.7820 0.7019 | 0.9930 0.5465 | 0.9260 0.8376 | |
| n = 10 |  |  | 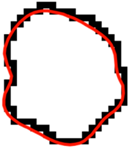 | 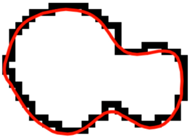 | |
| CSFest Er | 0.8902 0.0062 | 0.6239 0.3578 | 0.9348 0.4559 | 0.7879 0.5635 | |
| n = 18 |  | 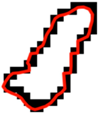 | 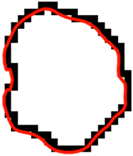 |  | |
| CSFest Er | 0.1231 0.8608 | 0.5158 0.1225 | 0.8858 0.3796 | 0.7871 0.5657 | |
| (b) | GA |  | 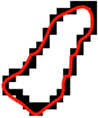 |  | 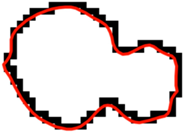 |
| nopt CSFest Er | 9 0.9247 0.0452 | 13 0.5764 0.2544 | 20 0.884 0.3769 | 24 0.7275 0.4437 | |
| (c) | Img2 CAD |  |  |  |  |
| CSFest Er | 0.8532 0.0354 | 0.46722 0.0168 | 0.6291 0.0201 | 0.5020 0.0037 |
| Geometric Models | Equivalent Stress (MPa) | Relative Error (%) | |
|---|---|---|---|
| Proposed methodology (GA) | 64 | Ref. | |
| Commercial software (SC) | 87 | −35.9 | |
| Fixed Bézier curve degree | 4 | 48 | 25.0 |
| 6 | 55 | 14.1 | |
| 8 | 56 | 12.5 | |
| 10 | 68 | −6.3 | |
| 12 | 86 | −34.4 | |
© 2017 by the authors. Licensee MDPI, Basel, Switzerland. This article is an open access article distributed under the terms and conditions of the Creative Commons Attribution (CC BY) license (http://creativecommons.org/licenses/by/4.0/).
Share and Cite
Basurto-Hurtado, J.A.; Osornio-Rios, R.A.; Jaen-Cuellar, A.Y.; Dominguez-Gonzalez, A.; Morales-Hernandez, L.A. Genetic Algorithm-Based Optimization Methodology of Bézier Curves to Generate a DCI Microscale-Model. Appl. Sci. 2017, 7, 1222. https://doi.org/10.3390/app7121222
Basurto-Hurtado JA, Osornio-Rios RA, Jaen-Cuellar AY, Dominguez-Gonzalez A, Morales-Hernandez LA. Genetic Algorithm-Based Optimization Methodology of Bézier Curves to Generate a DCI Microscale-Model. Applied Sciences. 2017; 7(12):1222. https://doi.org/10.3390/app7121222
Chicago/Turabian StyleBasurto-Hurtado, Jesus A., Roque A. Osornio-Rios, Arturo Y. Jaen-Cuellar, Aurelio Dominguez-Gonzalez, and L. A. Morales-Hernandez. 2017. "Genetic Algorithm-Based Optimization Methodology of Bézier Curves to Generate a DCI Microscale-Model" Applied Sciences 7, no. 12: 1222. https://doi.org/10.3390/app7121222