AIM: A Computational Tool for the Automatic Quantification of Scratch Wound Healing Assays


1
Laboratory of Cellular and Molecular Engineering “S. Cavalcanti”, Department of Electrical, Electronic and Information Engineering “G. Marconi” (DEI), Alma Mater Studiorum—University of Bologna, 47521 Cesena, Italy
2
Biosciences Laboratory, IRCCS Istituto Scientifico Romagnolo per lo Studio e la Cura dei Tumori (I.R.S.T.), 47014 Meldola, Italy
3
BioEngLab, Health Science and Technology, Interdepartmental Center for Industrial Research (HST-CIRI), Alma Mater Studiorum—University of Bologna, 40064 Ozzano Emilia, Italy
4
Advanced Research Center on Electronic Systems (ARCES), Alma Mater Studiorum—University of Bologna, 40126 Bologna, Italy
*
Author to whom correspondence should be addressed.
Appl. Sci. 2017, 7(12), 1237; https://doi.org/10.3390/app7121237
Submission received: 30 October 2017
/
Revised: 15 November 2017
/
Accepted: 20 November 2017
/
Published: 29 November 2017
Abstract
:Cell invasiveness quantification is of paramount importance in cancer research and is often evaluated in vitro through scratch wound healing assays that determine the rate at which a population of cells fills a gap created in a confluent 2D culture. The quantification of the results of this experiment, however, lacks standardization and is often highly time consuming and user dependent. To overcome these limitations, we have developed AIM (Automatic Invasiveness Measure), a freely-available software tool for the automatic quantification of the cell-free region in scratch wound healing assays. This study will completely describe AIM and will show its equivalence to three analysis methods commonly used for the quantification of the scratch area and the measure of true wound extension. Furthermore, the analysis time and the dependency of the results of these techniques on the structure of the time course (total duration and number of points) will be studied. To the best of our knowledge, AIM is the first entirely-automated analysis method for scratch wound healing assays and represents a significant improvement of this technique both in terms of results’ quality and reliability.

1. Introduction
An invasive and metastatic phenotype is a hallmark of metastatic cells; thus, quantification of cell invasiveness is a significant aspect of cancer research [1,2,3,4]. A number of in vitro assays was developed to investigate this issue and to study how standard or new therapeutic agents might impact on it.
The scratch wound healing assay [5] is the most widely used, as in this respect, it requires only an optical microscope and has a low technical complexity. It consists in scratching a wound in a confluent cell culture layer, by either using a silicone insert to prevent the culture from covering the entire plate or removing the cells from a specific area, through mechanical, thermal or chemical damage [6]. The invasiveness of the cell population is then evaluated as the rate at which the gap is filled, that is the variation over time of the cell-free area.
Despite being widely employed, the scratch wound healing assay is poorly standardized both in its execution (e.g., gap creating strategies and wound surface quantification protocols) and in the techniques used to quantify its results. These aspects significantly increase the variability and reduce the accuracy of the measure.
The main drawbacks of this technique are highlighted in [6], where are also suggested possible strategies to overcome them. Namely, specific care must be taken when scratching the wound, so that it shows an approximately constant width at the beginning of the assay and is devoid of debris. Furthermore, being able to track the same region of the wound over time is determined to be fundamental for the precise evaluation of cell invasiveness. The quantification strategy, finally, is shown to be a critical factor, and an edge detection routine implemented in Image-Pro Premier [7] is proposed as an accurate and objective alternative to the most widely-used analysis strategies.
These methods use regular polygons [8,9] to approximate the cell-free area or straight lines [10,11] to estimate the gap width. As a consequence, their accuracy decreases with the irregularity of the wound’s edges, and the results are heavily dependent on the operator and his/her ability of consistently evaluate all the images.
While being more objective, the analysis method proposed in [6] still requires the user to elaborate each image singularly; moreover, the segmentation strategy that they propose, i.e., edge detection, is prone to generating a large number of false positives. As such, it might require the user to adjust the procedure and its parameters to obtain an accurate evaluation of the result. This is associated with specific knowledge of image analysis techniques and thus might limit the usability of this approach.
A specific software tool for the automatic quantification of monolayer wound healing assay is presented in [12]. This approach, named TScratch, relies on the curvelet transform and has been shown to be effective in a number of conditions and independent of cellular morphology. Despite its availability and the presence of a graphical user interface for the selection of the images and the identification of the parameters, TScratch is still scarcely used. This might depend on the lack of maintenance of the software, which is not compatible with newer versions of MATLAB, thus generally not usable as it is.
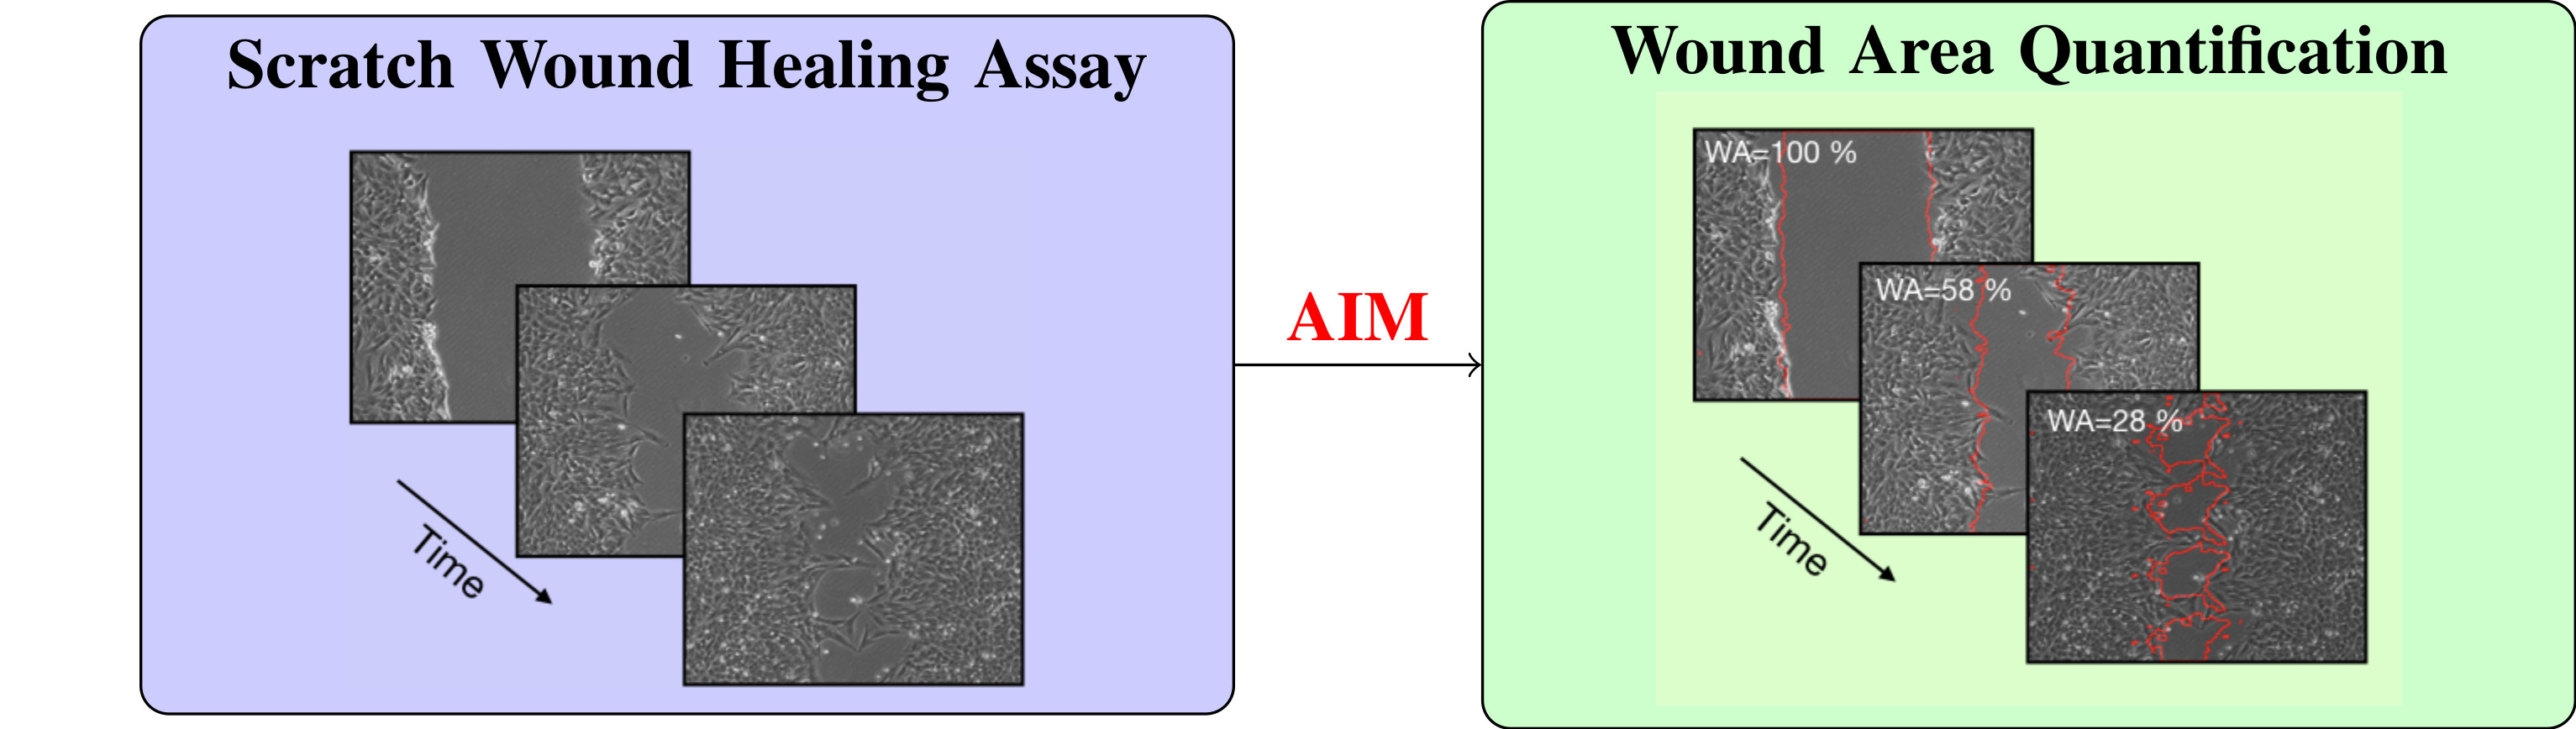
To overcome these limitations, we have developed Automatic Invasiveness Measure (AIM), a freely-available software for the automatic accurate quantification of the wound area and the direct comparison of different experimental conditions. To segment the wound, this both effective and intuitive method exploits the difference in local entropy between the cell-free area and the region containing the cells.
In this study, AIM will be completely described, both in terms of its technical details and its validation against commonly-used wound healing assay analysis techniques.
A population of cells undergoing epithelial to mesenchymal transition (EMT), will be used as an experimental model. This epigenetically-driven biological event, involved in several physiological and pathological processes, like metastasis formation, fibrosis and wound healing, is associated with a significant increase in cell motility and invasiveness, together with marked morphological changes [13,14,15,16]. These characteristics, combined with the possibility of easily replicating EMT in vitro and the importance of this phenomenon in cancer research, make it an ideal experimental framework for validating AIM.
Beside establishing the ability of the presented method to quantify the results of a scratch wound healing assay, we will also present a comparative analysis to highlight the advantages and disadvantages of the techniques most commonly used for the evaluation of cancer cell invasiveness in 2D.
2. Materials and Methods
2.1. Cell Culture and Scratch Wound Healing Assay
A human non-small cell lung cancer cell line (A549, American Type Culture Collection—ATCC, Manassas, VA, USA) was cultured in Dulbecco’s Eagle’s Modified Medium (DMEM, Pan-Biotech GmbH, Aidenbach, Germany) supplemented with 10% fetal bovine serum (EUROCLONE S.p.A., Pero, MI, Italy), 100 U/mL penicillin (EUROCLONE S.p.A., Pero, MI, Italy), 100 g/mL streptomycin (EUROCLONE S.p.A., Pero, MI, Italy) and 2 mM l-glutamine (EUROCLONE S.p.A., Pero, MI, Italy), at 37 C in a humidified 5% CO incubator (Thermo Fisher, Waltham, MA, USA). Cells were seeded at a density of 6 × 10 cells/cm, 24 h prior to the administration of transforming growth factor 1 (TGF-1). Cells were treated with 5 ng/mL TGF-1 (Peprotech, London, UK) or vehicle for 48 h to induce the EMT. After 48 h, a wound was scratched on the confluent monolayer of cells, using a p200 pipette tip. The medium was changed adding fresh TGF-1 or vehicle, and pictures were acquired at 0, 4, 8, 24, 32 and 48 h post-scratch.
Eight regions were uniquely identified through four parallel lines, which were carved perpendicular to the wound on the outer bottom of the Petri dish. This strategy allowed recovering the same fields of view throughout experiments performed in quadruplicate.
Images of the wound were acquired with a DS-Qi1Mc monochrome digital cooled camera (Nikon Instrument Inc., Melville, NY, USA) mounted on a Nikon optical inverted microscope (Eclipse TE2000-U, Nikon Instrument Inc., Melville, NY, USA).
The proprietary software NIS Elements Documentation (v. 4.20, Nikon Instrument Inc., Melville, NY, USA) was used both to operate the camera and to set the acquisition parameters (exposure time and gain). The resulting images were then converted to 8-bit RGB and exported in .tiff format before their elaboration.
2.2. Manual Analysis
The first method used to analyze the images of the wound is here referred to as manual. It consists in using the selection tool of the image analysis software to approximate the wound with a rectangle and then measuring its area [8,9].
To limit this technique’s variability and improve the quality of the results, all the data here presented were elaborated by the same user, and the width of the rectangle was set as the one best fitting the wound in the middle of the image.
Pictures where the cell front was not vertical were rotated until this condition was satisfied. Areas, in pixels, were obtained using the Measure function of ImageJ [17] and stored in a .csv file for further elaboration. The segmented masks of a selection of images, the same for which the ground truth was available (see below), were also saved.
2.3. ImageJ-Based Segmentation
Another method used to analyze the scratch wound healing assay relies on ImageJ [17], a freeware software for image analysis, and the development of a simple script (macro) that allows the repetition of a series of operations and, thus, the segmentation of the wound.
The procedure followed for the analysis of the data here presented is similar to the one described in [6] and relies on an edge detection algorithm followed by an area-based filter to isolate the cell-free area. To maximize the contrast of the wound edges, the segmentation is preceded by a pre-elaboration, which includes a background correction routine, realized with a bandpass fast fourier transform (FFT) filter (Table 1), a histogram equalization procedure and an average filtering, with a circular structuring element of radius 20 pixels.
After the edge detection, the image is binarized through an intensity thresholding procedure. This operation cannot be automated in ImageJ, and thus the user must choose a threshold selection method and a color space for every image. Furthermore, the automatically-detected value can be adjusted through a series of sliders. To limit the dependence of the results on the operator and maximize the standardization of the elaboration, all the images were segmented with the same method (percentile), in the same color space (RGB), and no manual adjustments of the thresholds were made.
Finally, the segmented wound is identified, by removing the regions with an area below 5 × 10 pixels, and its extension is quantified. The results obtained with this strategy were saved in .csv format. As for the manual method, the segmented mask of a subset of images (about 40% of the total) was also saved to be compared with the ground truth (see below).
2.4. TScratch
TScratch is a freely-available, semi-automatic, wound quantification software presented in [12] that exploits the discrete curvelet transform to extract a directional field representing the location and direction of the image’s edges [18]. It is implemented in MATLAB and released both as source code and a standalone application. The results here presented were obtained using the source code version of TScratch and its time series option. As in the ImageJ-based segmentation, the thresholds for the open area quantification were left to the values determined by the software. TScratch automatically saves all the elaborated images and the wound areas, expressed as the percentage of the image.
2.5. AIM
AIM is our freeware software tool for the automatic elaboration of the scratch wound healing assay. It is developed in MATLAB R2016a, using the image processing toolbox, and is available at http://www.mcbeng.it/en/category/software.html, both as source code and a standalone application (released under the GNU Public License, GPL v2).
Unlike the previously-described methods, AIM relies on the computation of the local entropy to identify the wound. This parameter quantifies the amount of information coded within the neighborhood of the current pixel, which can be computed applying Equation (1), where M is the total number of gray levels (256 for 8-bit images) and p is the probability of gray level k.
Indeed, the wound, due to its homogeneity, will be associated with a lower amount of information with respect to the regions containing the cells, thus providing an unambiguous criterion to identify the region of interest.
In AIM, a square neighborhood of a side of 19 pixels is considered, and the entropy calculation is implemented as a mex file in C language, for improved performances. The computation time is further reduced by the scaling of the original image to the format that is closer to 600 × 800 pixels and maintains the proportion between width and height. This operation was demonstrated to have a negligible effect on the results.
The successive step of the elaboration consists of applying a thresholding procedure (Otsu’s method [19]) on the local entropy image, to identify the regions devoid of cells.
A black and white morphological closing, using a rectangular structuring element of extension equal to 1/80 of that of the image, completes the segmentation procedure.
The areas of the cell-free regions are then clustered into two groups, through a thresholding procedure applied to their histogram [19], and the one with the largest average extension is identified as the wound. This strategy maintains its efficacy even when a number of regions must be identified, due to the fact that some cells have already bridged the gap between the two fronts.
Finally, the three outputs of AIM are produced. The first one consists of a text file in which the extension of the wound segmented in each image is reported, together with the uniformity index. This value, computed as in Equation (2), provides an indication of the variability of the initial wound area for each condition.
This document is saved in a folder, named “Experiment_name_Results/”, automatically created by the software in the same path as the dataset. In this case, Experiment_name is the name of the parent folder of the experiment.
Another output of AIM is a graphical representation, for the different conditions tested, of the change in average wound area over time. To eliminate the dependence on the initial wound extension, every wound is normalized with respect to the corresponding initial value.
Finally, a segmented version of all the images considered in the analysis is saved in the subdirectory of “Experiment_name_Results/” named “images”. These .png files allow the user to verify the software’s results, as the border of the region recognized as the wound is highlighted in red.
To improve its usability, AIM includes a simple graphical user interface (GUI) that allows one to easily select the images to be analyzed and start their segmentation.
In order to ensure that the software correctly elaborates the images and reports the results, it is important to organize the data according to a specific structure. In particular, the parent folder, which identifies the experiment, must contain one folder for every tested condition (i.e., control and TGF-1). In turn, each of these directories is expected to contain one folder for every time point in which the corresponding images are saved, as .tiff files. Since the structure of the time course is inferred from this organization, the time point folders must be named as “T = t”, where t is the post-scratch hour at which the images are acquired.
Finally, pictures captured at different time points in the same region of the wound must have the same name, in order to reconstruct the singular time courses correctly.
2.6. Area Analysis and Comparison
The results of the four methods here described were compared with the true wound areas, which have been determined by an expert user through the manual tracing of the edges of the cell-free region. As this operation is highly time consuming, only half of the images and three experiments were considered for the ground truth definition (about 40% of the total images available).
Prior to the comparison, all the results were normalized with respect to the initial extension of the corresponding cell-free region. This operation eliminates the wound area dependence on its initial extension and, thus, the effect on the results of the variability of the scratch area at time 0.
Besides comparing the average wound areas obtained with each method and presented as the mean and standard error, the percentage difference with respect to the ground truth was computed (Equation (3)).
This equation, where m represents one of the wound healing analysis strategies and GT, the ground truth, was solved for all the considered methods and every image for which the true wound area was available.
Furthermore, the average analysis time, recorded with a stopwatch, was studied. This aspect is often disregarded, but might influence the quality and the reliability of the results, especially when the assay includes a significant number of conditions and time points.
Finally, the differential invasiveness of the two populations was evaluated. This analysis consists of computing, for every tested condition, the angular coefficient of the linear function describing the wound area decrease over time and then dividing the value obtained for the treated condition by the one measured for the control. As the number of considered time points and the total experiment duration can vary significantly, depending on the experimental conditions, we have analyzed the effect of these factors on the result, by computing the differential invasiveness using all the possible combinations of 2, 3, 4, 5 and 6 time points and studying the resulting distribution.
3. Results
In this work, an automatic, reliable method for the quantification of the results of scratch wound healing assays is presented. Our AIM software relies on the computation of local entropy (Equation (1)), thus on the evaluation of the information encoded within the neighborhood of each pixel, to enhance the difference between the cell-free region and the areas containing the cells. Indeed, the wound is characterized by a higher uniformity of color and texture and, thus, by a lower information content that makes it clearly distinguishable through an automatic thresholding procedure. To evaluate the quality of this method and validate its results, a set of scratch wound healing assays was performed. These experiments studied the change in invasiveness, caused by TGF-1, a potent in vitro inducer of EMT, which is thus expected to accelerate the wound healing process, by increasing cell migration and proliferation.
The images acquired at different time points during these assays were analyzed with three alternative methods beside AIM, and the true wound area was determined for 40% of the images through a manual tracing of its edges by an expert user.
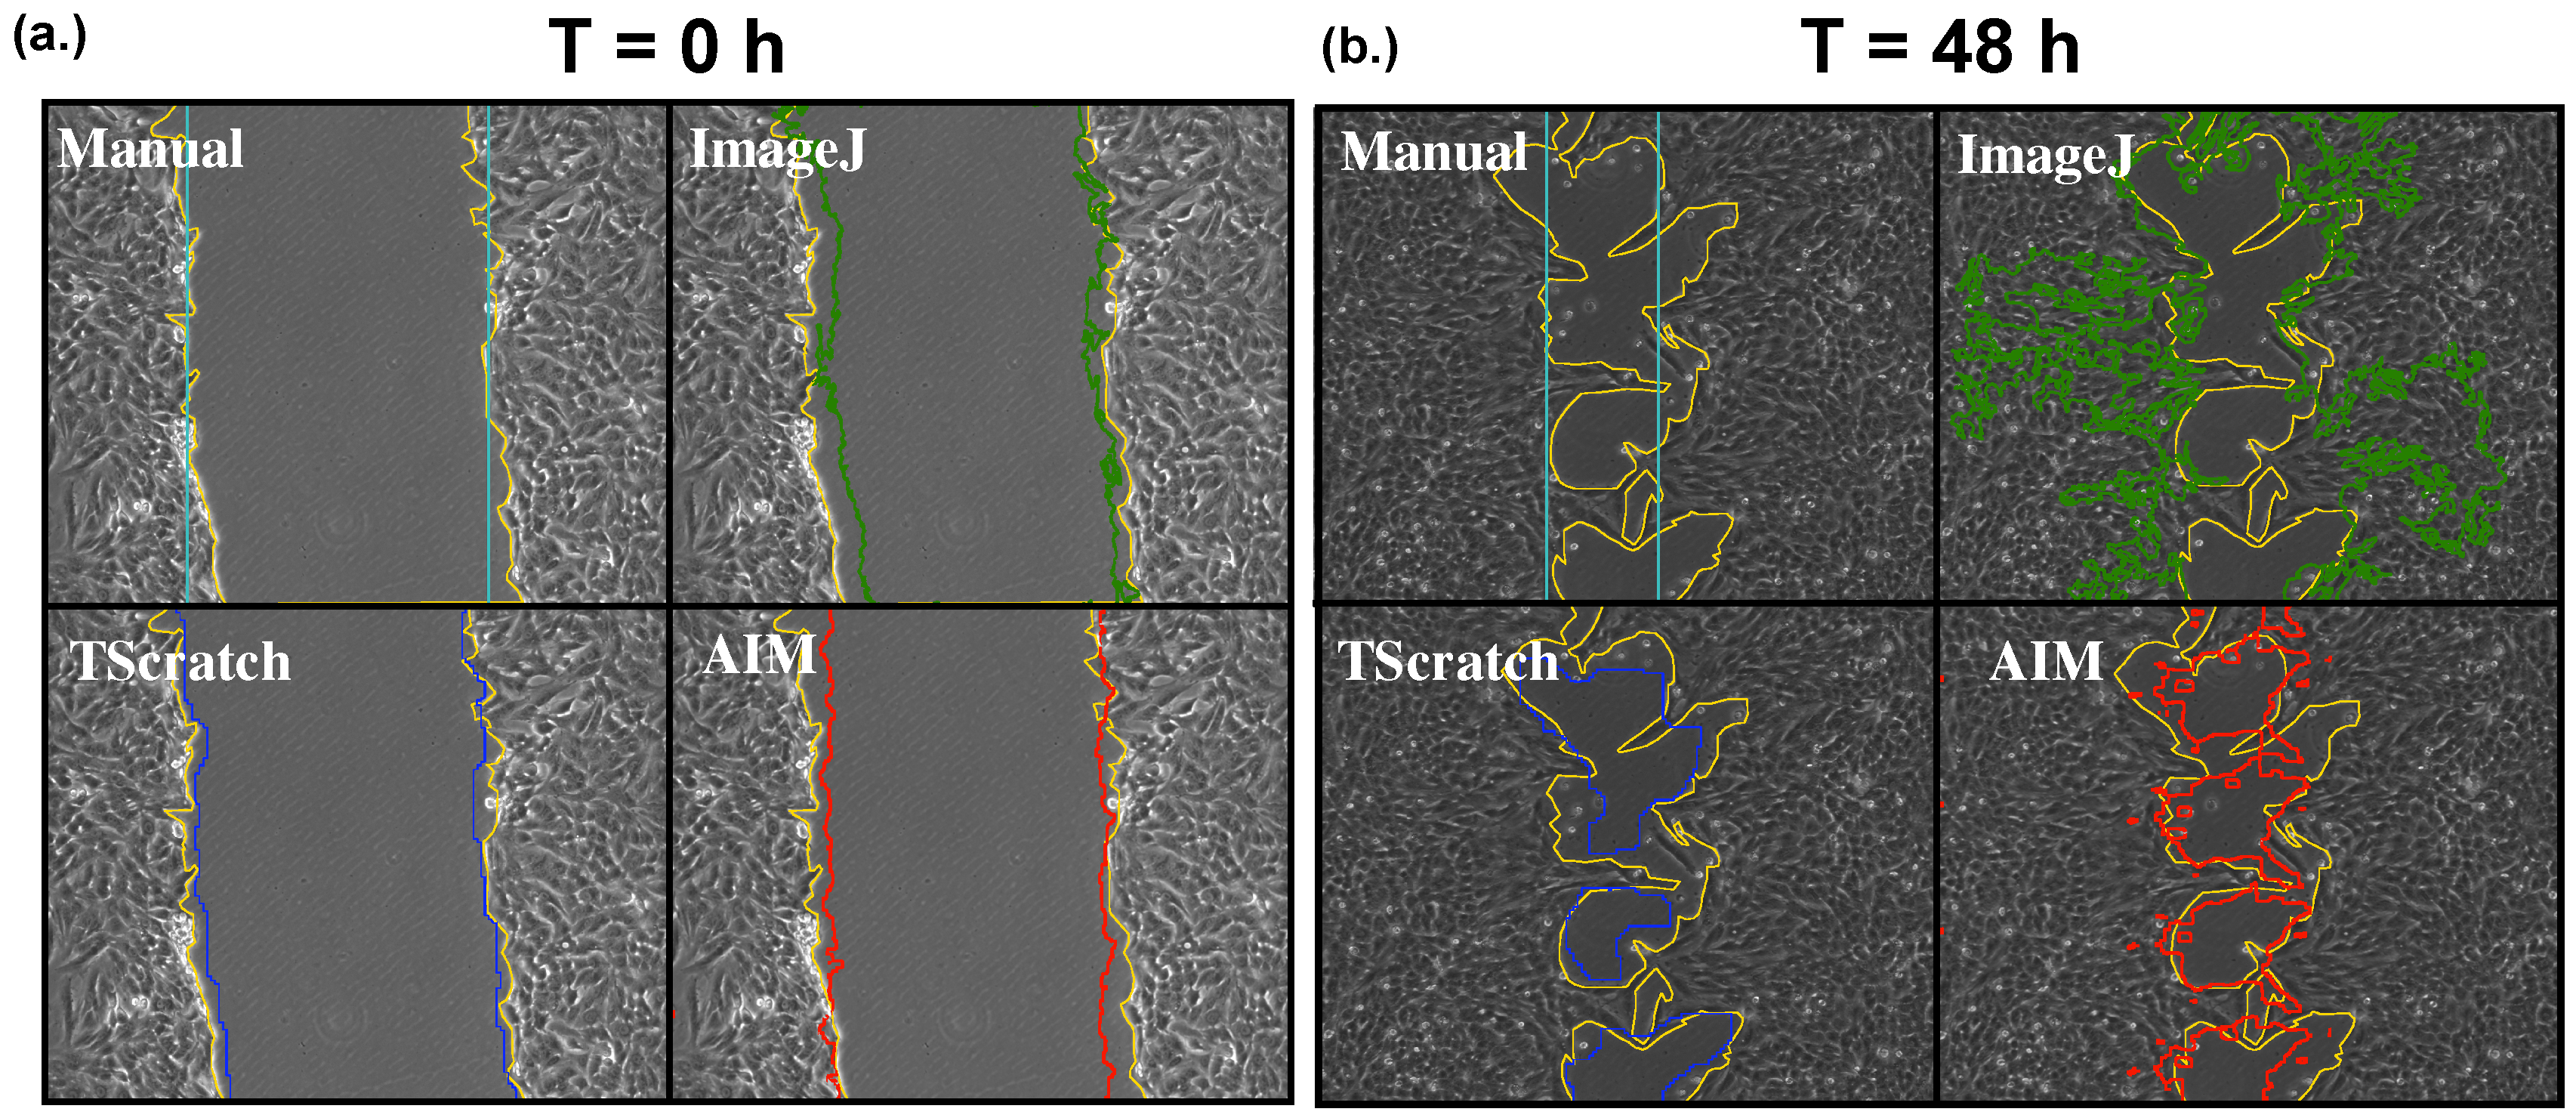
Figure 1 shows the segmentation, obtained with every considered method, of two representative images acquired at 0 and 48 h post scratch. While at the beginning of the experiment (Figure 1a), the results are equivalent and coherent with the ground truth (reported in yellow in Figure 1), at the end of the experiment (Figure 1b), there is a significant variability, with the wound area obtained with ImageJ being notably larger than the ground truth. This is caused by the loss of regularity of the cell front that leads to the generation of a large number of false positives in the analysis with this method.
The use of a regular polygon to approximate the wound is associated with a decrease in accuracy, which however does not impact significantly on the wound measure, as empty regions outside the rectangle seem to be compensated by patches of cells within the wound.
Both TScratch and AIM are associated with a significant improvement in accuracy and the ability of correctly recognizing the wound, even when it has been divided into a number of regions due to the conjunction of wound boundaries during cell migration. This allows one to extend the time course beyond the point at which traditional scratch wound healing assay analysis methods lose reliability. The result obtained with AIM, however, seems to slightly underestimate the region of interest. This is due to the fact that the computation of local entropy is carried out on a square of a side of 19 pixels centered on the one of interest. This leads to an increase of this parameter at the edges of the wound and to a slight loss of precision of the thresholding. The relevance of this aspect is nevertheless low, because the size of the neighborhood was maintained fixed, and thus, it can be considered as an offset that has no effect in the comparison between different conditions.
3.1. Wound Areas’ Comparison
The first step in AIM’s validation was the comparison of the average wound extension recorded over time with the different methods (Figure 2). For this analysis, the extension of each wound was normalized with respect to the area of the corresponding cell-free region at time T = 0. This procedure must be preferred to consider the average initial wound area as a normalizer, as it minimizes the effect of the width of the initial scratch on the results.
In Figure 2a, the decrease in average wound extension in the control condition is reported. While showing a limited dynamic range when compared with the TGF-1-treated population (Figure 2b), it is possible to notice how all the considered methods show comparable results. Specifically, untreated A549 cells exhibit limited invasive capabilities that are associated with a decrease in wound area of only about 10% after 48 h. The supplementation of TGF-1, on the other hand, leads to a marked increase in invasiveness and thus to a final wound extension that is approximately 60% smaller than the one at T = 0.
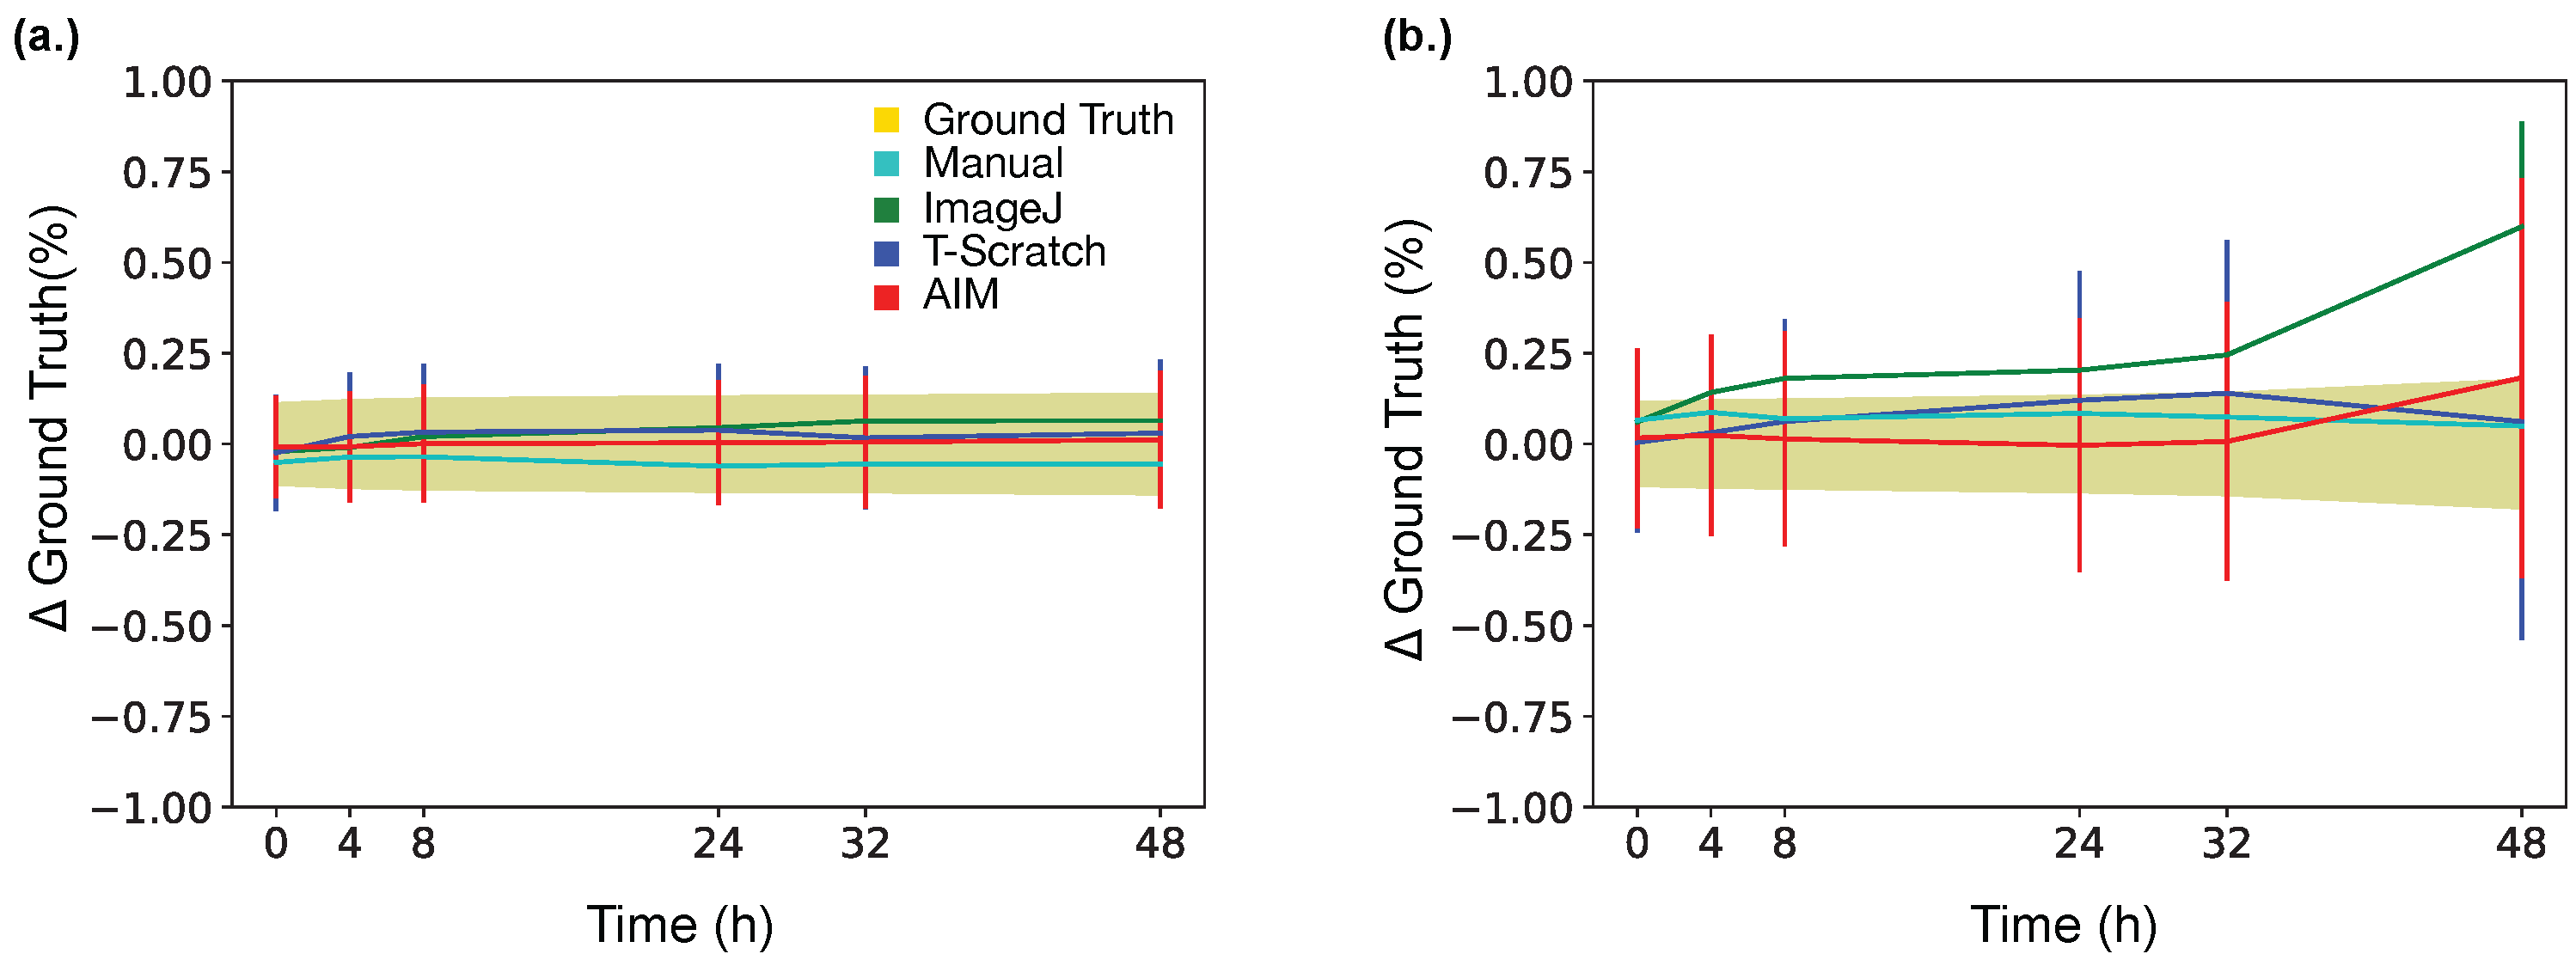
Notably, the wound area reduction is also associated with the increase in variability among the different methods. This is particularly accentuated for the ImageJ macro, shown in green, which has an average wound area at the end of the experiment that is almost 1/3 larger than the one obtained by the other techniques. In Panel (c) of Figure 2, the ratio between the areas reported in (b) and (a) is shown. This parameter, often considered when evaluating the differential invasiveness of two conditions, has a behavior similar to the one reported in (b), due to the modest changes in wound area of the control condition. It, however, assumes a greater importance when both tested conditions exhibit a significant variation with respect to the initial one. These considerations are also supported by the analysis of the percentage difference between each of the considered methods and the ground truth (Figure 3).
This quantity (Equation (3)) is a measure of the distance between the result of each method and the true wound area and thus was computed only considering the images for which this result was available (about 40% of the total). Again, we can notice that all the methods are equivalent for the control condition (Figure 3a), as both their average value and standard error are coherent with the intrinsic variability of the considered dataset. This was quantified as the standard deviation of the ground truth and is reported in Figure 3 as the shaded area. On the other hand, the TGF-1 condition (Figure 3b) is associated with an increase in variability both within each method and among them. In particular the mean percentage difference between the ImageJ macro and the ground truth exits the shaded area 8 h after the beginning of the assay, and 34 h later, the average wound extension recorded by this method is almost 1.5-fold larger than its true value.
With the other methods, the average remains within the shaded area throughout the whole experiment, and thus, the percentage difference from the ground truth remains below 10%. AIM, in particular, is associated with the ground truth closer to zero for all the time points except the last one (T = 48 h), suggesting that, on average, the wound area obtained with AIM is the most reliable and represents a closer approximation of the ground truth.
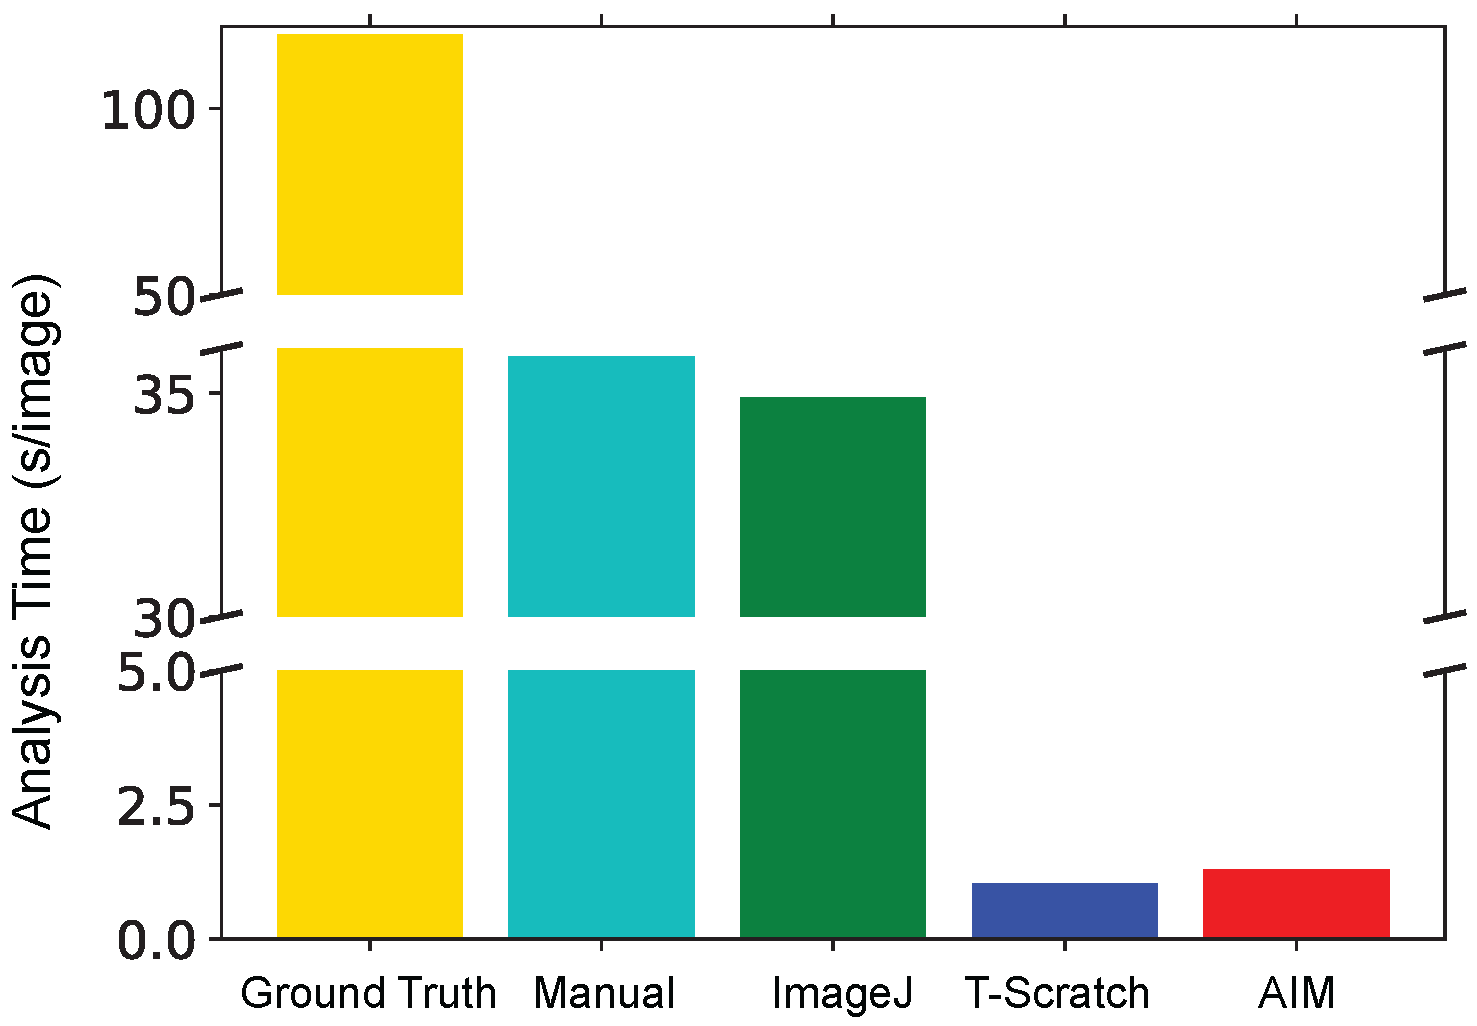
3.2. Analysis Time
Another fundamental aspect of the analysis of scratch wound healing assays is the elaboration time. This factor is often disregarded despite the fact that elaborating the images might be very time consuming, sometimes more than the experiment itself, and might have a non-negligible effect on the results.
In particular, if we consider the elaboration methods, which are highly dependent on the user, like the manual one, a long analysis time, combined with the repetitiveness of the task, might affect the quality and the reliability of the wound segmentation, especially when a large number of conditions and/or time points is considered.
In Figure 4, the average time required for the segmentation of an image and the quantification of the corresponding wound area is reported.
The manual analysis and the one based on the ImageJ macro were highly time consuming with an average of about 35 s/image, therefore resulting in a total elaboration time of about 10 h per method. The definition of the ground truth, the manual tracing of the wound edges, was more than three-times as expensive and thus was only applied to a subset of images corresponding to about 40% of the total (half of the images of three among the four replicates). TScratch and AIM are considerably faster than all the other techniques with an average analysis time between 1 and 2 s/image. These methods are also associated with an increased automation of the analysis and thus with a lower dependency on the user. This is a desirable characteristic especially when a large number of experimental conditions and time points must be considered.
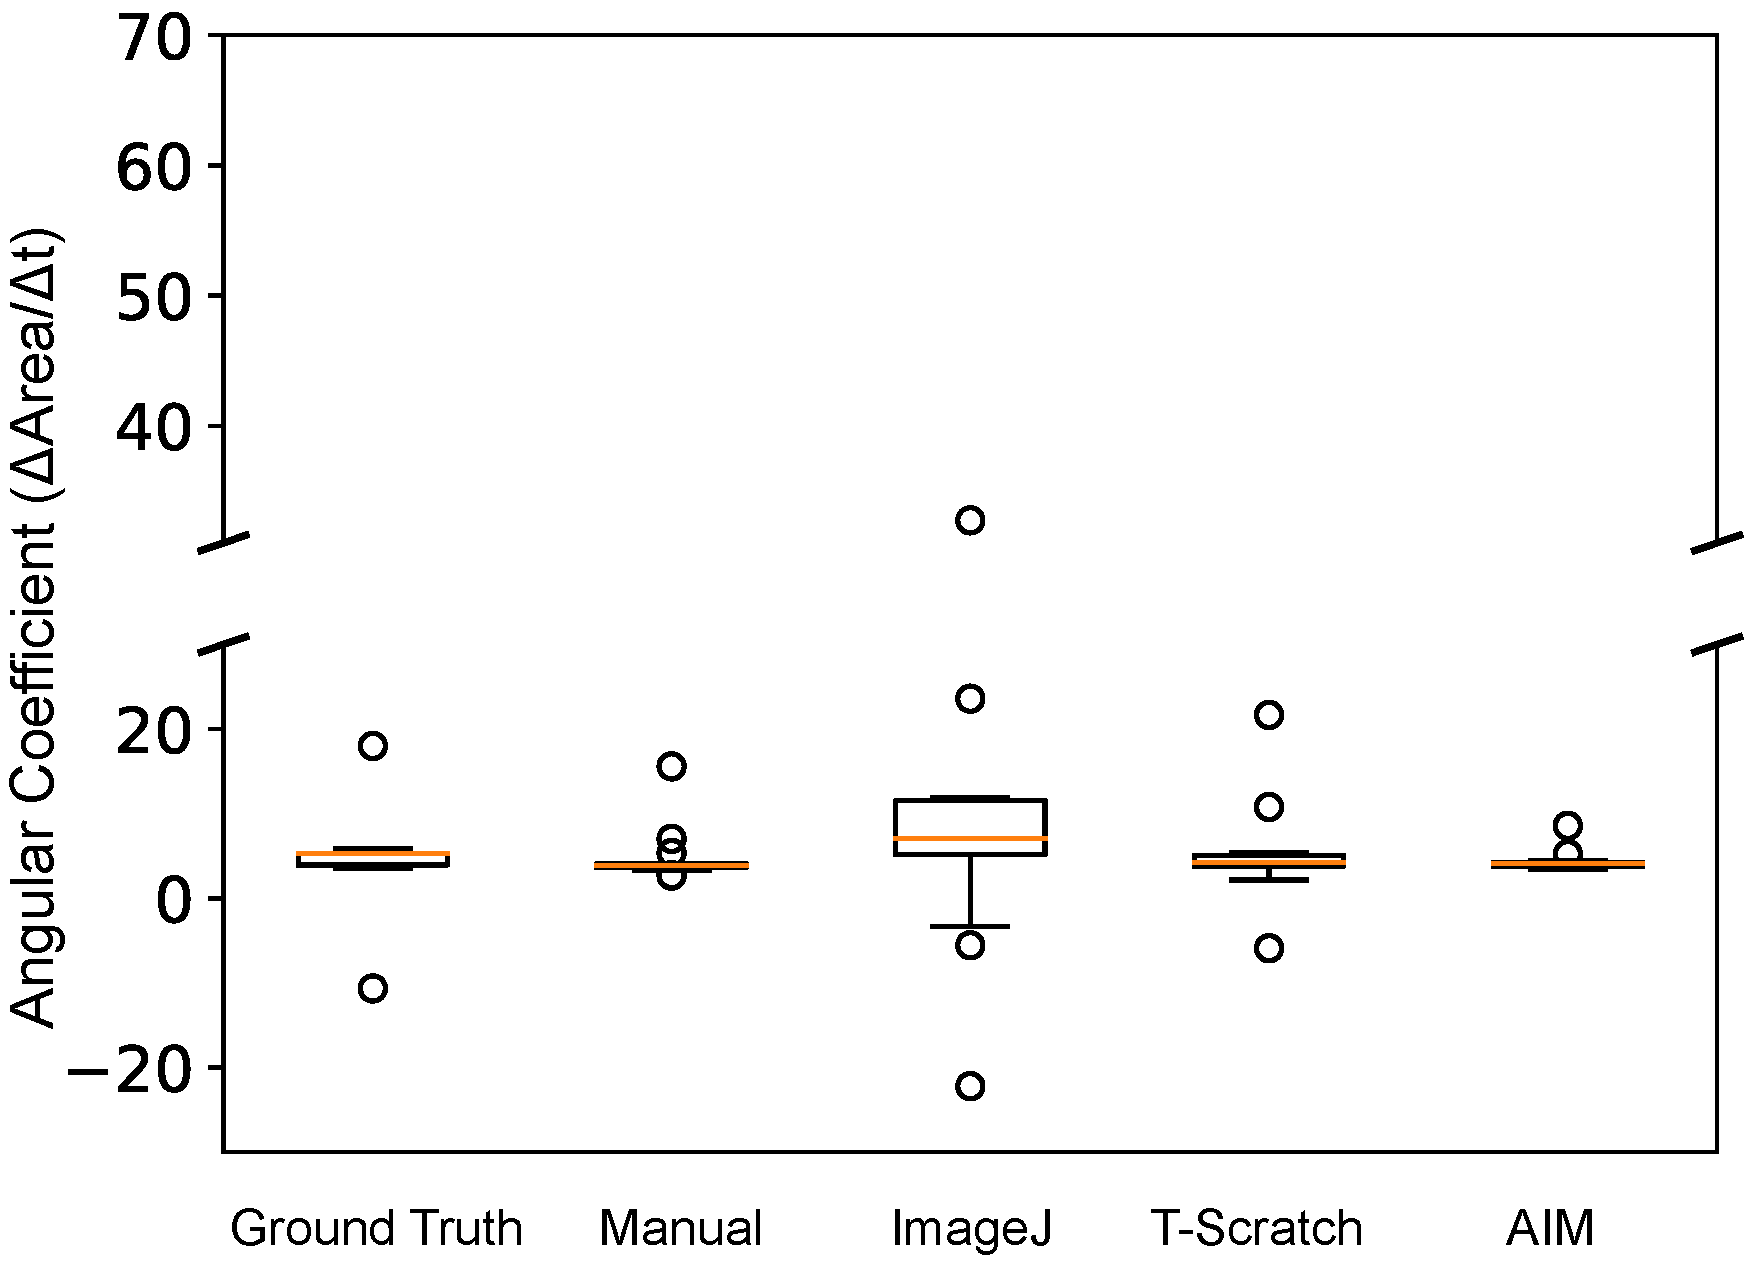
3.3. Angular Coefficient Analysis
A quantification of cell invasiveness often associated with scratch wound healing assays is the computation of the angular coefficient, which is the slope of the linear relation between average wound area and time. This simple calculation measures the closing rate of the scratch and thus summarizes in a single number the information of interest.
In the analysis here reported, the ability of the different methods of evaluating this parameter is explored, and particularly, the reliability of the measure as a function of the time course’s length and the number of time points is studied.
Indeed, the structure of the time course, which is highly dependent on the experimental conditions, can affect the result of the angular coefficient calculation, and thus, a desirable characteristic for an analysis method is the ability of reliably estimating this parameter, independently of the number of available time points.
Figure 5 reports, for each method, the distribution of the ratio between the invasiveness of the TGF-1-treated cells and that of the control population. These angular coefficients were calculated considering each one of the 57 possible combinations of the available time points and can thus be considered as a good benchmark for the reliability of the considered methods. Indeed, the invasiveness was evaluated with a number of time points ranging from 2–6, and the total time course duration was varied between 4 and 48 h.
The application of the ImageJ macro was determined to be the least reliable method due to its intrinsically higher variability and significant number of outliers. TScratch, the manual analysis and the ground truth were associated with a generally accurate estimation, despite the presence of a few outliers. As a consequence, with these methods, care must be taken when designing the experiments, as the chosen time course might alter the result.
On the other hand, AIM was characterized by a remarkable capacity of reliably estimating the angular coefficient independently of the time course. In this case, only two outliers were recorded, both very close to the narrow main distribution. This result is likely to be connected with the filtering effect of local operations, which assigns to each pixel the result of an operation on its neighborhood. The relation between wound area and time will thus be more linear and less dependent on factors such as cell density and the regularity of the cell front. This, in turn, will lead to a stable and reliable estimation of the angular coefficient.
4. Discussion
This paper presents AIM, a computational tool for the automatic quantification of the results of scratch wound healing assays. Besides the technical description of this method, its equivalence to commonly-used techniques for the analysis of wound images and the quantification of the extension of the scratch was shown. This comparison also allowed evaluating the advantages and disadvantages of each method and the conditions required to obtain reliable results.
In particular, the manual method, which consists in approximating the wound with a rectangle, was shown to be very time consuming, with an average analysis time of approximately 35 s/image. This characteristic, combined with the high dependence on the operator, makes this strategy potentially unreliable when a large number of images must be analyzed. Indeed, obtaining accurate results with this technique requires the cell front to be vertical and the user to be consistent when drawing the rectangle. This generally involves setting the width of the wound as the best fit in a particular point (e.g., the center of the image) that is maintained fixed throughout the analysis.
Another common analysis method for scratch wound healing assays involves the segmentation of the images through an ImageJ macro. While being less dependent on the user, this strategy was shown to be prone to generating a large number of false positives that led to a tendency of overestimating the wound area and to a higher percentage difference from the ground truth, when compared to the other methods (Figure 3). Furthermore, this sensitivity requires a careful planning of the experiment, which must include an adequate number of time points, but avoid images where the wound edges are highly irregular, as in Figure 1 at T = 48.
Furthermore, different microscopy setups might be associated with the necessity of adjusting the segmentation procedure and thus with the specific knowledge of image processing.
A third analysis strategy considered during AIM’s validation was TScratch, software for the semi-automatic analysis of scratch wound healing assays. It demonstrated a high accuracy and a good precision in all the tested conditions, despite showing a mild dependence on the structure of the time course, associated with some outliers in the distribution of the differential invasiveness (Figure 5). The average analysis time for this method was about 1 s/image, and it was mostly independent of the user. Its installation, however, required MATLAB and specific programming knowledge, characteristics that might limit its usability and represent the cause of its scarce diffusion and usage in cancer research.
For some of the images considered in this analysis, the ground truth was determined through the manual tracing of the wound’s edges. This method, while capable of accurately identifying the scratch and determining its area, is extremely time consuming, with an average analysis time of 120 s/image and highly dependent on the user’s ability of consistently elaborating all the images. Therefore, it cannot be considered as a feasible alternative for the quantification of the results of scratch wound healing assays.
Here, we have presented AIM, which to the best of our knowledge, is the first fully-automatic software for the segmentation and the quantification of cell invasiveness in a 2D framework. Beside showing its equivalence to the most commonly-used strategies for wound area quantification, AIM was demonstrated to be fast, with an average analysis time below 1.5 s/image, and able to accurately evaluate differential invasiveness independently of the structure of the time course (Figure 5). These characteristics make the presented tool very versatile and suitable for the study of a wide range of experimental conditions. Furthermore, AIM is fully automated, and thus, its results are independent of the operator and completely objective. As such, it is able to address one of the most important limitations of scratch wound healing assays, i.e., the lack of standardization and the scarce repeatability of the results.
Finally, AIM is freely available at http://www.mcbeng.it/en/category/software.html, both as MATLAB source code and a standalone application. This is expected to promote its diffusion, representing a more accurate and unbiased strategy for the quantification of cancer cell invasiveness. Indeed, results’ evaluation and data analysis should be considered as integral parts of the experiment and thus held to the same standards of rigor and precision.
Overall, cancer and biological research could greatly benefit from the automation of repetitive, monotonous tasks that are often associated with high result variability and are prone to user error. The widespread use of tools like AIM would both improve the quality of the data and increase the efficiency of the in vitro experiments, as the analysis would not require any direct user intervention. Furthermore, uniformity in the result quantification techniques would promote protocol standardization and generate more comparable data.
In conclusion, the software tool here presented is part of an increasingly widespread trend that aims to produce freely-available, accurate and quantitative tools for the analysis of biological data. These instruments are promoting an integration of different disciplines and the competences that are expected to contribute significantly to the advancement of basic research.
Acknowledgments
The authors would like to thank Cristiana Corsi PhD. and Joseph Lovecchio MS Eng. for helpful discussions and feedback. This work was developed within the frame of COST Action CM1406 (EpiChemBio) and was supported by the University of Bologna (funds of the “Ricerca Fondamentale Orientata”—RFO—to E.G.). A.P. and M.C.’s fellowships are partially funded by the Istituto Scientifico Romagnolo per lo Studio e la Cura dei Tumori (I.R.C.C.S.-I.R.S.T.).
Author Contributions
M.C. developed AIM, analyzed the data and drafted the manuscript. A.P. performed the scratch wound healing experiments, determined the true wound areas and edited the manuscript. A.T. assisted with the cell biology protocols. E.G. conceived of the study and finalized the manuscript. All the authors read and approved the final version of the manuscript.
Conflicts of Interest
The authors declare no conflict of interest.
References
- Leber, M.F.; Efferth, T. Molecular Principles of Cancer Invasion and Metastasis (Review). Int. J. Oncol. 2008, 34, 881–895. [Google Scholar] [CrossRef]
- Jiang, W.G.; Sanders, A.J.; Katoh, M.; Ungefroren, H.; Gieseler, F.; Prince, M.; Thompson, S.K.; Zollo, M.; Spano, D.; Dhawan, P.; et al. Tissue Invasion and metastasis: Molecular, biological and clinical perspective. Semin. Cancer Biol. 2015, 35, S244–S275. [Google Scholar] [CrossRef] [PubMed]
- Pasini, A.; Marchetti, C.; Sissi, C.; Cortesi, C.; Giordano, E.; Minarini, A.; Milelli, A. Novel Polyamine-Naphthalene Diimide Conjugates Targeting Histone Deacetylases and DNA for Cancer Phenotype Reprogramming. ACS Med. Chem. Lett. 2017. [Google Scholar] [CrossRef]
- Zhang, G.; Zhou, H.; Xiao, H.; Zhou, T. Up-regulation of miR-224 promotes cancer cell proliferation and invasion and predicts relapse in colorectal cancer. Cancer Cell Int. 2013, 13, 104. [Google Scholar] [CrossRef] [PubMed]
- Liang, C.C.; Park, A.Y.; Guan, J.L. In-vitro scratch assay: A convenient and inexpensive method for analysis of cell migration in-vitro. Nat. Protoc. 2007, 2, 329–333. [Google Scholar] [CrossRef] [PubMed]
- Jonkman, J.E.N.; Cathcart, J.A.; Xu, F.; Bartolini, M.E.; Amon, J.E.; Stevens, K.M.; Colarusso, P. An introduction to the wound healing assay using live-cell microscopy. Cell Adhes. Migr. 2014, 5, 440–451. [Google Scholar] [CrossRef] [PubMed]
- Image-Pro Premiere. Available online: http://www.mediacy.com/imagepropremier (accessed on 23 October 2017).
- Yahaya, E.S.; Cordier, W.; Steenkamp, P.A.; Steenkamp, V. Attenuation of oxidative stress and artificial wound closure in C2C12 myoblasts induced by sequential extracts of Boerhavia diffusa. J. Pharm. Pharmacol. 2017. [Google Scholar] [CrossRef] [PubMed]
- Ito, H.; Kanbe, A.; Sakai, H.; Seishima, M. Activation of NLRP3 signaling accelerates skin wound healing. Exp. Dermatol. 2017. [Google Scholar] [CrossRef] [PubMed]
- Kong, G.; Jiang, Y.; Sun, X.; Cao, Z.; Zhang, G.; Zhao, Z.; Zhao, Y.; Yu, Q.; Cheng, G. Irisin reverses IL-6 induced epithelial-mesenchymal transition in osteosarcoma cell migration and invasion through the STAT3/Snail signaling pathway. Oncol. Rep. 2017, 38, 2647–2656. [Google Scholar] [CrossRef] [PubMed]
- Pinto, B.I.; Tabor, A.J.; Stearns, D.M.; Diller, R.B.; Kellar, R.S. A Bench-Top In-Vitro Wound Assay to Demonstrate the Effects of Platelet-Rich Plasma and Depleted Uranium on Dermal Fibroblast Migration. Appl. In Vitro Toxicol. 2016, 2, 151–156. [Google Scholar] [CrossRef] [PubMed]
- Gebäck, T.; Schulz, M.M.P.; Koumoutsakos, P.; Detmar, M. TScratch: A novel and simple software tool for the automated analysis of monolayer wound healing assays. BioTechniques 2009, 46, 265–274. [Google Scholar] [CrossRef] [PubMed]
- Ye, X.; Weinberg, R.A. Epithelial-Mesenchymal Plasticity: A Central Regulator of Cancer Progression. Trends Cell Biol. 2015, 11, 675–686. [Google Scholar] [CrossRef] [PubMed]
- Kalluri, R.; Weinberg, R.A. The basics of epithelial-mesenchymal transition. J. Clin. Investig. 2009, 6, 1420–1428. [Google Scholar] [CrossRef] [PubMed]
- Nieto, M.A.; Huang, R.Y.; Jackson, R.A.; Thiery, J.P. EMT: 2016. Cell 2016, 166, 21–45. [Google Scholar] [CrossRef] [PubMed]
- Pasini, A.; Delmonte, A.; Tesei, A.; Calistri, D.; Giordano, E. Targeting Chromatin-Mediated Transcriptional Control of Gene Expression in Non-Small Cell Lung Cancer Therapy: Preclinical Rationale and Clinical Results. Drug 2015, 75. [Google Scholar] [CrossRef] [PubMed]
- ImageJ. Available online: https://imagej.net/Welcome (accessed on 23 October 2017).
- Gebäck, T.; Koumoutsakos, P. Edge detection in microscopy images using curvelets. BMC Bioinform. 2009, 10, 75. [Google Scholar] [CrossRef] [PubMed] [Green Version]
- Otsu, N. A threshold selection method from gray-level histograms. IEEE Trans. Sys. Man Cybern. 1979, 9, 62–66. [Google Scholar] [CrossRef]
Figure 1.
Schematization of the analysis here presented. The segmentation, with all the considered methods, of two representative images, acquired at T = 0 (a) and T = 48 h (b), is reported together with the true wound profile (in yellow). Cyan, green, blue and red represent the segmentations with, respectively, the manual method, imageJ, TScratch and AIM (Automatic Invasiveness Measure).

Figure 2.
Time course of the percentage of wound area over time. In (a), the control condition is reported; while (b) shows the data relative to the transforming growth factor 1 (TGF-1) treated cells; finally in (c), the ratio between the treatment and control condition is shown.
Figure 2.
Time course of the percentage of wound area over time. In (a), the control condition is reported; while (b) shows the data relative to the transforming growth factor 1 (TGF-1) treated cells; finally in (c), the ratio between the treatment and control condition is shown.

Figure 3.
Representation of the average percentage difference from the ground truth as a function of time. In (a), the data relative to the control condition are shown; while in (b), the values computed for the TGF-1-treated cells are reported. The yellow shaded area represents the dataset’s variability and was computed as the standard deviation of the wound area obtained at every time point with the gold standard method.

Figure 4.
Average time required for the analysis of an image with the different tested methods.

Figure 5.
Distribution of the differential invasiveness of TGF-1-treated cells and the control population computed using each one of the 57 different combinations of the acquired time points using all the considered methods. Among them, AIM is the one associated with the lowest variability of this parameter.

Table 1.
Characteristics of the fast fourier transform (FFT) bandpass filter used to correct the background. These parameters are the default ones for ImageJ version 1.49c.
Table 1.
Characteristics of the fast fourier transform (FFT) bandpass filter used to correct the background. These parameters are the default ones for ImageJ version 1.49c.
| Parameter | Value |
|---|---|
| Filter large structures down to | 40 pixels |
| Filter small structures down to | 3 pixels |
| Suppress stripes | None |
| Tolerance of detection | 5 % |
© 2017 by the authors. Licensee MDPI, Basel, Switzerland. This article is an open access article distributed under the terms and conditions of the Creative Commons Attribution (CC BY) license (http://creativecommons.org/licenses/by/4.0/).
Share and Cite
MDPI and ACS Style
Cortesi, M.; Pasini, A.; Tesei, A.; Giordano, E. AIM: A Computational Tool for the Automatic Quantification of Scratch Wound Healing Assays. Appl. Sci. 2017, 7, 1237. https://doi.org/10.3390/app7121237
AMA Style
Cortesi M, Pasini A, Tesei A, Giordano E. AIM: A Computational Tool for the Automatic Quantification of Scratch Wound Healing Assays. Applied Sciences. 2017; 7(12):1237. https://doi.org/10.3390/app7121237
Chicago/Turabian StyleCortesi, Marilisa, Alice Pasini, Anna Tesei, and Emanuele Giordano. 2017. "AIM: A Computational Tool for the Automatic Quantification of Scratch Wound Healing Assays" Applied Sciences 7, no. 12: 1237. https://doi.org/10.3390/app7121237
Note that from the first issue of 2016, this journal uses article numbers instead of page numbers. See further details here.