Effect of Equal Channel Angular Pressing (ECAP) on Erosion-Corrosion of Pure Copper


1
Mechanical Engineering Department, Qassim University, Buraidah 51452, Saudi Arabia
2
Production Engineering Department, Beni Suief University, Beni Suef 62764, Egypt
3
Mechanical Engineering Department, Prince Mohammed Bin Fahd University, Al Khobar 31952, Saudi Arabia
*
Author to whom correspondence should be addressed.
Appl. Sci. 2017, 7(12), 1250; https://doi.org/10.3390/app7121250
Submission received: 21 October 2017
/
Revised: 29 November 2017
/
Accepted: 30 November 2017
/
Published: 2 December 2017
(This article belongs to the Section Materials Science and Engineering)
Abstract
:During the past few decades, ultrafine-grained materials (UFG) have experienced rapid development. Enhanced mechanical and surface properties, such as strength, ductility and erosion-corrosion (E-C) resistance by refining the grain to ultra-fine/nanometer size has been achieved. The equal channel angular pressing (ECAP) is a popular severe plastic deformation (SPD) method to fabricate UFG bulk materials. In this research, the E-C behavior of commercial annealed pure copper subject to four passes of ECAP have been investigated. Hardness measurement of the copper specimen after four passes of ECAP showed an increase of 200% on the hardness value as compared with annealed condition. Simulated seawater was used as an E-C medium. The effect of different E-C parameters such as time, slurry flow velocity, impact angle, and solid particle concentration on ECAP process is studied. The results showed that ECAP enhances the E-C resistance of copper, and this behavior improves with increasing the pass number. Generally, a 30% rise in resistance to E-C was achieved after four ECAP passes as compared to coarse grain copper for the parameters studied in this work. Optical microscopy was used to examine the microstructure and material removal mechanism of the annealed copper. Scanning electron microscopy (SEM) was used to validate the reduction of grain size due to ECAP process. Furthermore, examination of the surface roughness of the copper at different ECAP passes showed that for the same E-C condition the increment of ECAP passes leads to a smoother surface.
1. Introduction
It is well known that the grain size affects the strength and mechanical behavior of the material [1]. Recently, ultrafine-grained (UFG) and nanostructured (NS) materials have attracted interest due to their distinguishing characteristic [2]. The schematic (Figure 1) illustrates the microstructural grain sizes of the materials.
Different severe plastic deformation (SPD) techniques are applied to refine the microstructure and produce (UFG) and (NS) materials [2,3,4]. There are three different SPD categories: bulk, sheet, and tube. Equal channel angular pressing (ECAP) is considered the most popular SPD technique used for bulk materials. It has gained much attention due to the simplicity of die design and manufacturing, as well as low cost. This method has been widely applied on different materials [5,6,7]. Many researchers investigated the effect of ECAP on the mechanical properties of various metals [8,9,10,11,12,13,14,15,16]. On the other hand, erosion-corrosion (E-C) is an interaction effect of erosion and corrosion, including liquid erosion and cavitation. The interaction of E-C leads to a metal loss that would increase significantly beyond that the separate effect of erosion or corrosion [17,18,19,20]. The E-C rate is measured in accordance with ASTM G119 [21]. The following equations relate the different parameters to total E-C rate [22]:
where T is the total E-C rate, Wo is the wear rate due to mechanical erosion, Co is the rate of corrosion, S is the combined effect of both erosion and corrosion, ΔWC is the change in erosion wear rate due to corrosion, and ΔCW is the change in corrosion rate due to erosion:
T = Wo + Co + S
S = ΔWC + ΔCW
ΔCW = WC − Co
Equations (1) and (3) can be combined as follows [22]:
ΔWc = T − Wo − CW
E-C was studied under various conditions on many materials such as steel, AISI 420 stainless steel, AISI 1020 carbon steel, cast iron, aluminum, and copper alloys [23,24,25,26]. The previous researchers found that the material loss due to E-C is mainly affected by experiment duration, slurry flow velocity, impacting angle, erodent particle size, and solid particles concentration [27,28,29,30,31,32,33]. It is reported that the combined effect of erosion and corrosion together represents almost 40 – 60% of the total weight loss [34]. Copper and its alloys are useful in many industrial applications, such as seawater piping, shipbuilding, fuel lines, and heat exchangers. There are many studies on UFG/NS copper to fully understand and determine the mechanical and surface properties. However, the available literature showed a lack of research on the effect of ECAP on the surface properties and E-C resistance of pure copper. The effect of the slurry velocity on ECAPed copper was studied previously [24]. The aim of the current work is to investigate the ECAP effects on the E-C resistance of copper under various conditions. Furthermore, improvements of the surface roughness and the E-C resistance of commercial pure copper are intended. For this purpose, four passes of ECAP were performed at room temperature to produce UFG copper samples. The hardness variation due to ECAP passes was investigated. Subsequently, the E-C experiments by the slurry pot method were conducted for parameters such as duration time, slurry flow velocity, impacting angle, and solid particle concentration. By studying the E-C behaviors of copper before and after ECAP, it is expected that the results will offer a solution to improve the E-C resistance of wide range of face centered cubic (FCC) materials, since the ECAP process can be applied on wide range of materials.
2. Materials and Experimental Procedure
2.1. Samples Preparation, Hardness Measurment, and the ECAP Process
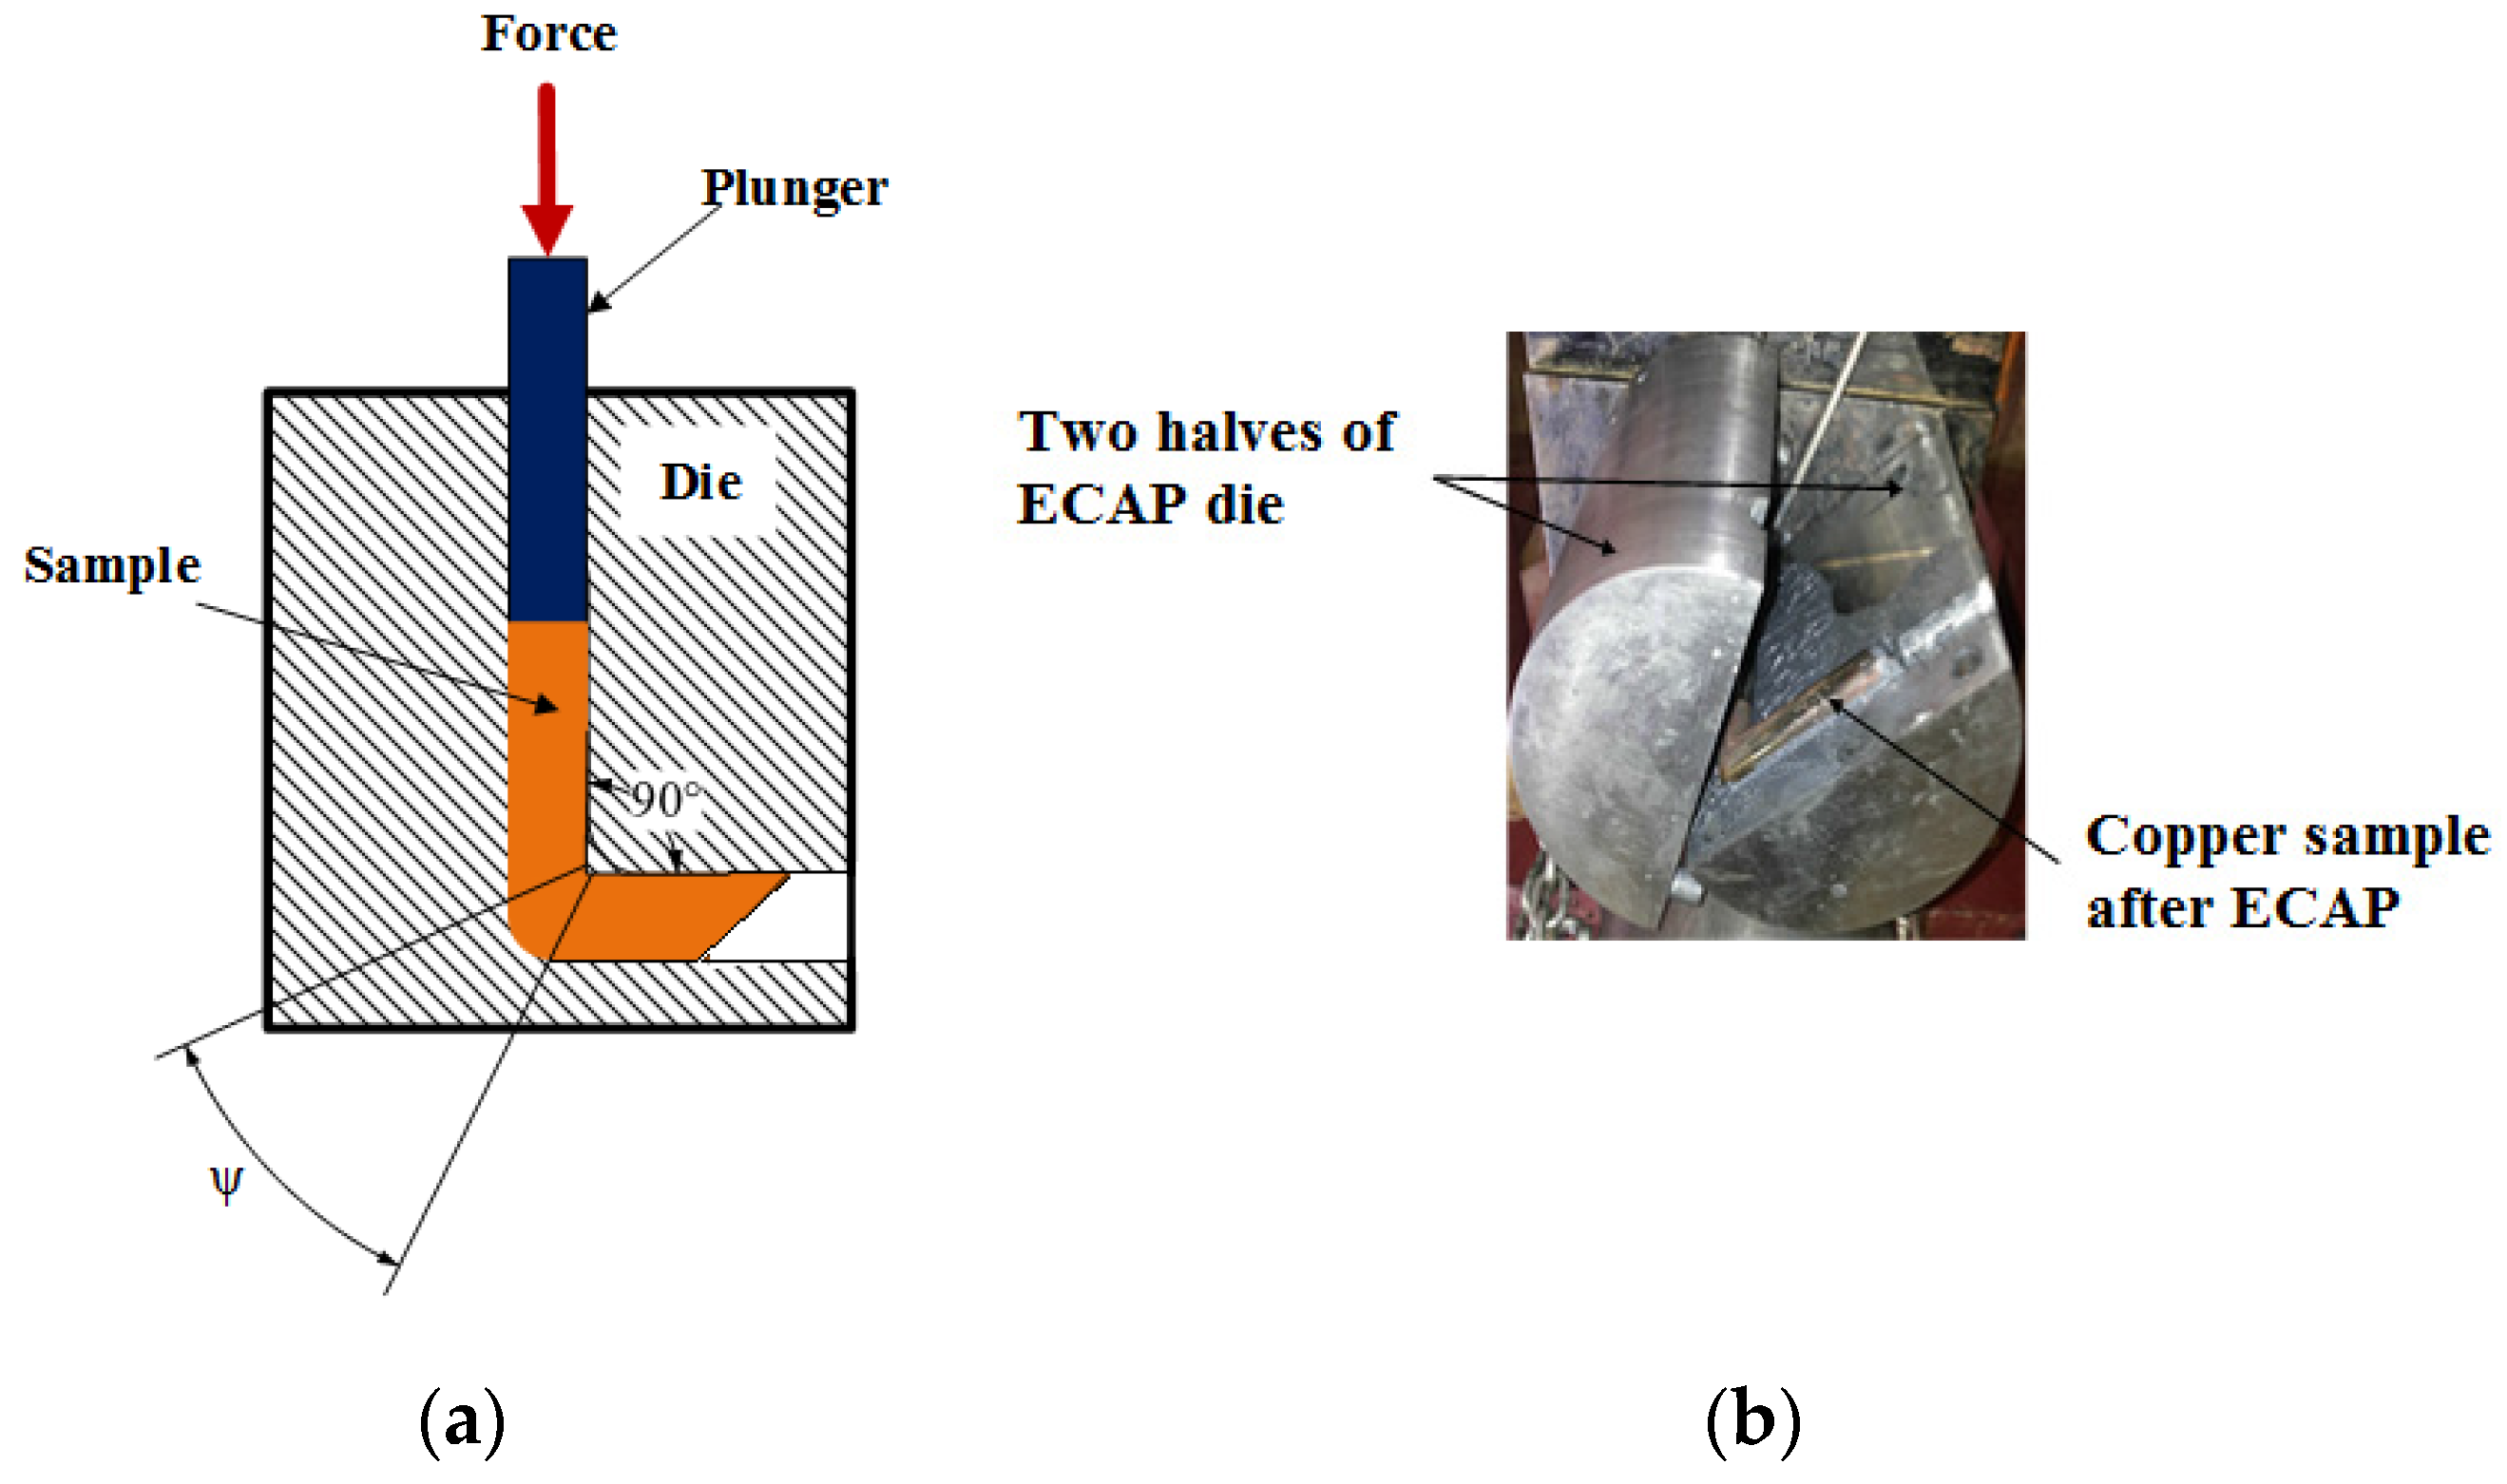
In the current research, commercial copper samples (Cu 99.95% purity) were used for testing. Specimens of 20 mm diameter and 140 mm length were prepared from extruded copper rods. The ECAP process (four passes) was conducted on the specimens at room temperature. A schematic of the ECAP process and details of the die are shown in Figure 2. The Vickers hardness (HV) of the copper samples before and after ECAP passes were measured according to ASTM E92-04 [35]. The hardness tests were carried out using a universal hardness tester (model: Zwick/ZHU 250, Ulm, Germany). The measurements were conducted along the cross-section and longitudinal planes of copper samples. Before carrying out the hardness test, the surfaces of copper samples were mechanically polished by using silicon carbide papers of 800 grit sizes and washed with ethanol. Then the samples were subjected to distilled water and dried in air.
At each position the Vickers hardness (HV) was measured at three adjacent points with a step of 3 mm using a load of 10 kgf and a dwell time of 10 s. The average values of hardness were recorded for each pass. An ECAP die with 90° channel was designed and made from H13 steel. Four passes of ECAP (route BC) was conducted by using a 160 ton hydraulic press. The setup and details of ECAP process were previously presented [9]. During the ECAP process, MoS2 lubricant was used to reduce the friction between the specimens and die walls. Small plungers made of H13 tool steel with 20 mm diameter and 25 mm height are used to push the specimen along the channel of the die. The tests were conducted at room temperature with a punch speed of about 2 mm/s. The ECAP parameters are presented in Table 1.
2.2. Slurry Pot Tester
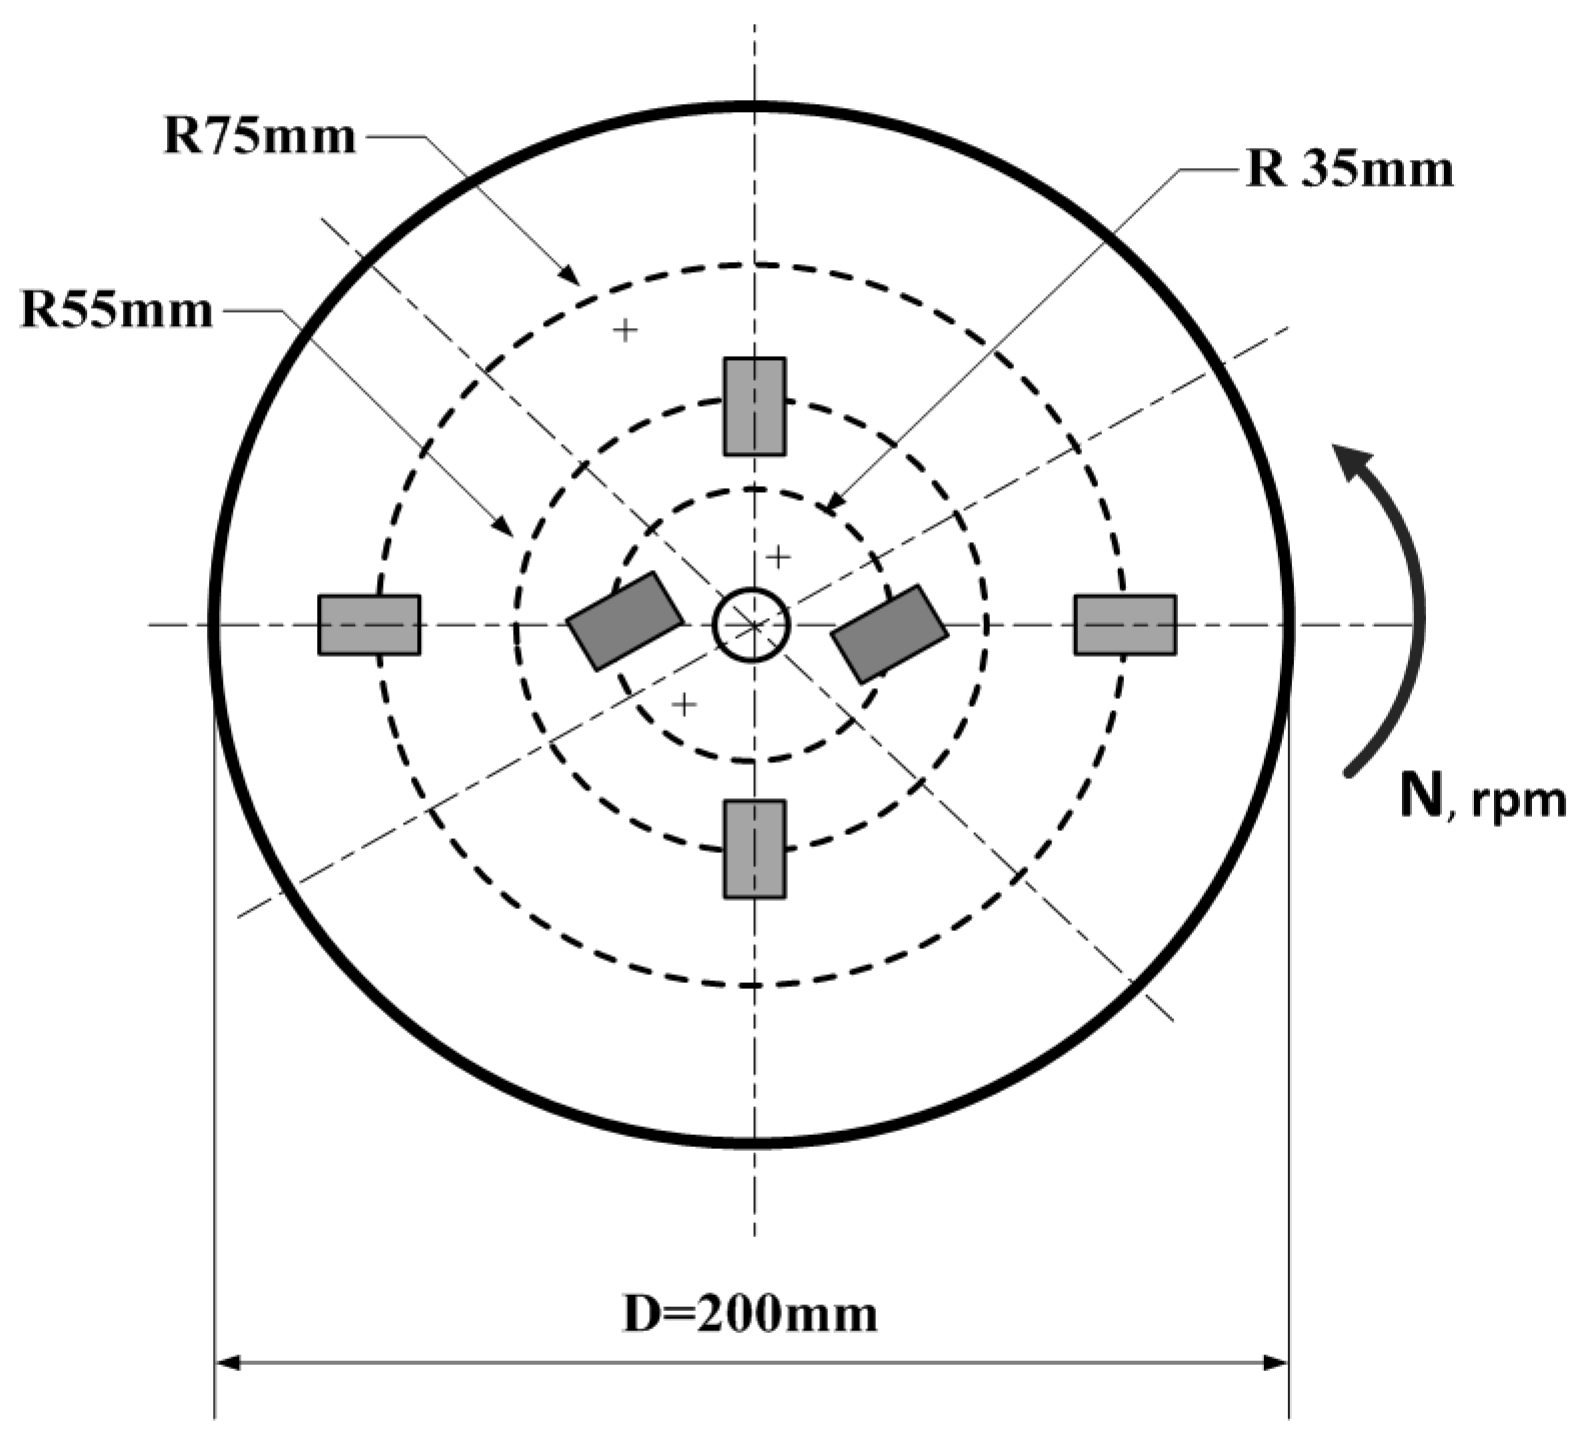
There are several types of E-C test rigs, including a slurry pot tester, rotating disc rig, slurry jet erosion wear test rig, and flow-through slurry wear tester. The slurry pot and jet impingement testers are the most commonly used rigs to test erosion and corrosion. A slurry pot tester is inexpensive and easy to operate [36,37,38]. A slurry pot tester was designed and fabricated to study the E-C of a variety of materials [9]. The setup for E-C experiments consists of a stainless steel cylindrical vessel to handle the slurry. A cylindrical disc with a diameter of 200 mm and thickness of 25 mm is fastened to a shaft and the entire assembly is attached to the mandrel of a drilling machine through a coupler. Both the disc and coupler were made of aluminum alloy. A 1.5 kW motor with varying speeds from 340 rpm to 1670 rpm is used for rotating the shaft. In order to have various linear velocities, the samples were mounted at different radial distances. The sample holder can be revolved to enable the slurry impacting the surface of the specimens at different angles. No interaction effects from multiple samples mounted on the disc at different radii. Figure 3 shows the details of the radial positioning of the samples on the disc. The turbulence, vortex, and leakages of liquid were prevented by fixing the cover of the pot tightly with a rubber “O” ring. Additionally, the pot was fully filled with the slurry erodent medium during the experiments.
2.3. Erosion-Corrosion Test
The purpose of the experiments is to investigate the effect of ECAP passes (pass 1 through pass 4) on E-C behavior of pure copper through measuring the weight loss per unit area of the tested samples. Circular samples of different ECAP passes were cut to dimensions of 20 mm diameter and 6 mm thickness using a wire cutting machining to avoid the changes in microstructure. The E-C tests were carried out using the slurry pot method. Prior the experiments, the samples were cleaned by using acetone. In order to determine the weight loss due to E-C effect, the samples were weighed before and after the experiment by using a digital balance of 0.01 mg accuracy. A slurry of 3.5 wt.% sodium chloride (NaCl) and solid particles of silica sand (SiO2) with an average size of 250–500 μm was used as an eroding medium. The tests were conducted according to ASTM G119 standard [21]. Each test was repeated three times. The average weight loss per unit area was calculated. A summary of the testing conditions and methodology are presented in Table 2.
2.4. Microstructural and Surface Roughness Evaluation
After conducting E-C experiments, the surface of copper samples was examined. Optical microscopy (Model Olympus, Olympus Corporation, Tokyo, Japan) “for annealed” and scanning electron microscope (SEM, JEOL–JSM 5510, JEOL, Ltd., Tokyo, Japan) “for ECAPed samples” were employed. The surface roughness of samples was evaluated by using an optical profiling system, manufactured by (Contour GT-K1, Bruker, Billerica, MA, USA). The profiling system works by a technique of streamlined interface and intuitive work flow. It utilizes white and green light interferometry. The profiling system can perform fast three-dimensional surface measurements from millimeter-scale, to nanometer scale with sub-nanometer resolution. The combination of the easy measurement setup, fast data acquisition, and small footprint allow the Contour GT-K1 to deliver 3D surface metrology performance. Furthermore, the roughness parameters of eroded surface at different ECAP passes were studied through measuring the parameters Ra, Rt, and Rq. The arithmetic average of the absolute value (Ra) was recorded and calculated by using the equation:
where L is the evaluation length and Z (x) is the profile height function. The maximum profile height Rt of copper through four passes of ECAP was also measured. Furthermore, the root mean square (Rq) which is the average between height deviations and mean line/surface, taken over the evaluation area. The roughness parameter Rq represents the standard deviation of the profile heights. The equations to calculate Rq in both two and three dimensions are as follows [39]:
where M and N are the data points in X, Y, and Z directions relative to the mean plane.
3. Results and Discussion
3.1. Microstructure Images
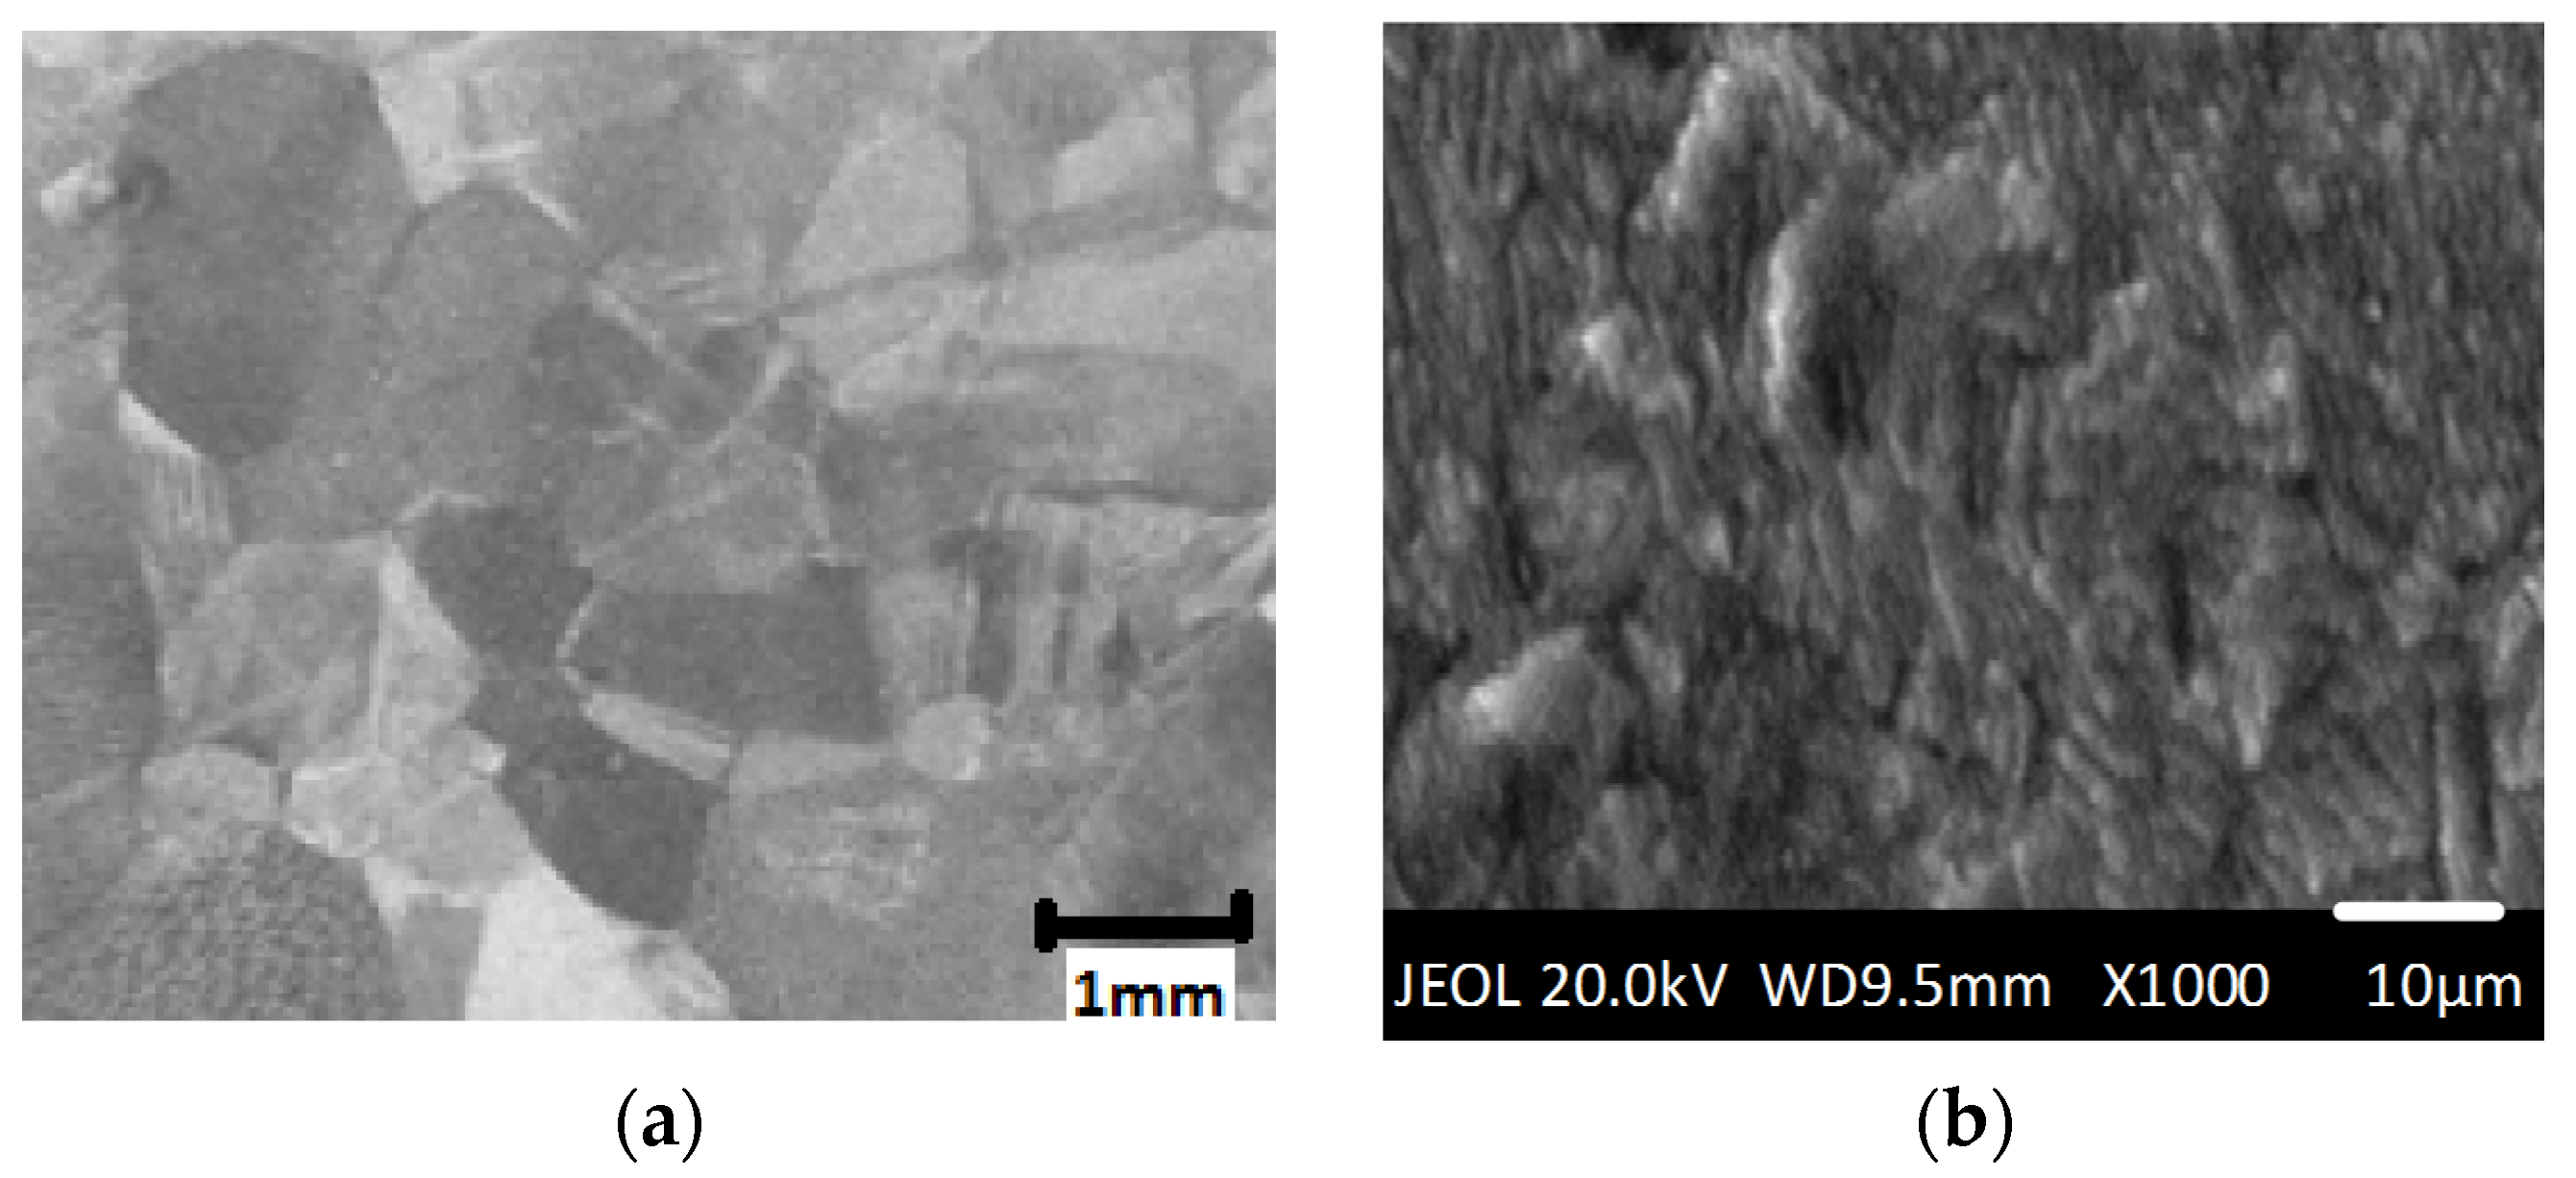
The microstructures of pure copper before and after four ECAP passes are shown in Figure 4. Figure 4a shows the optical micrograph (before ECAP) and Figure 4b shows the SEM image of ultrafine-grained copper (after ECAP). Approximately, a 100% reduction in grain size was observed after the ECAP process. The average grain size before and after ECAP was 1000 nm and 600 nm, respectively [9].
3.2. Hardness Results
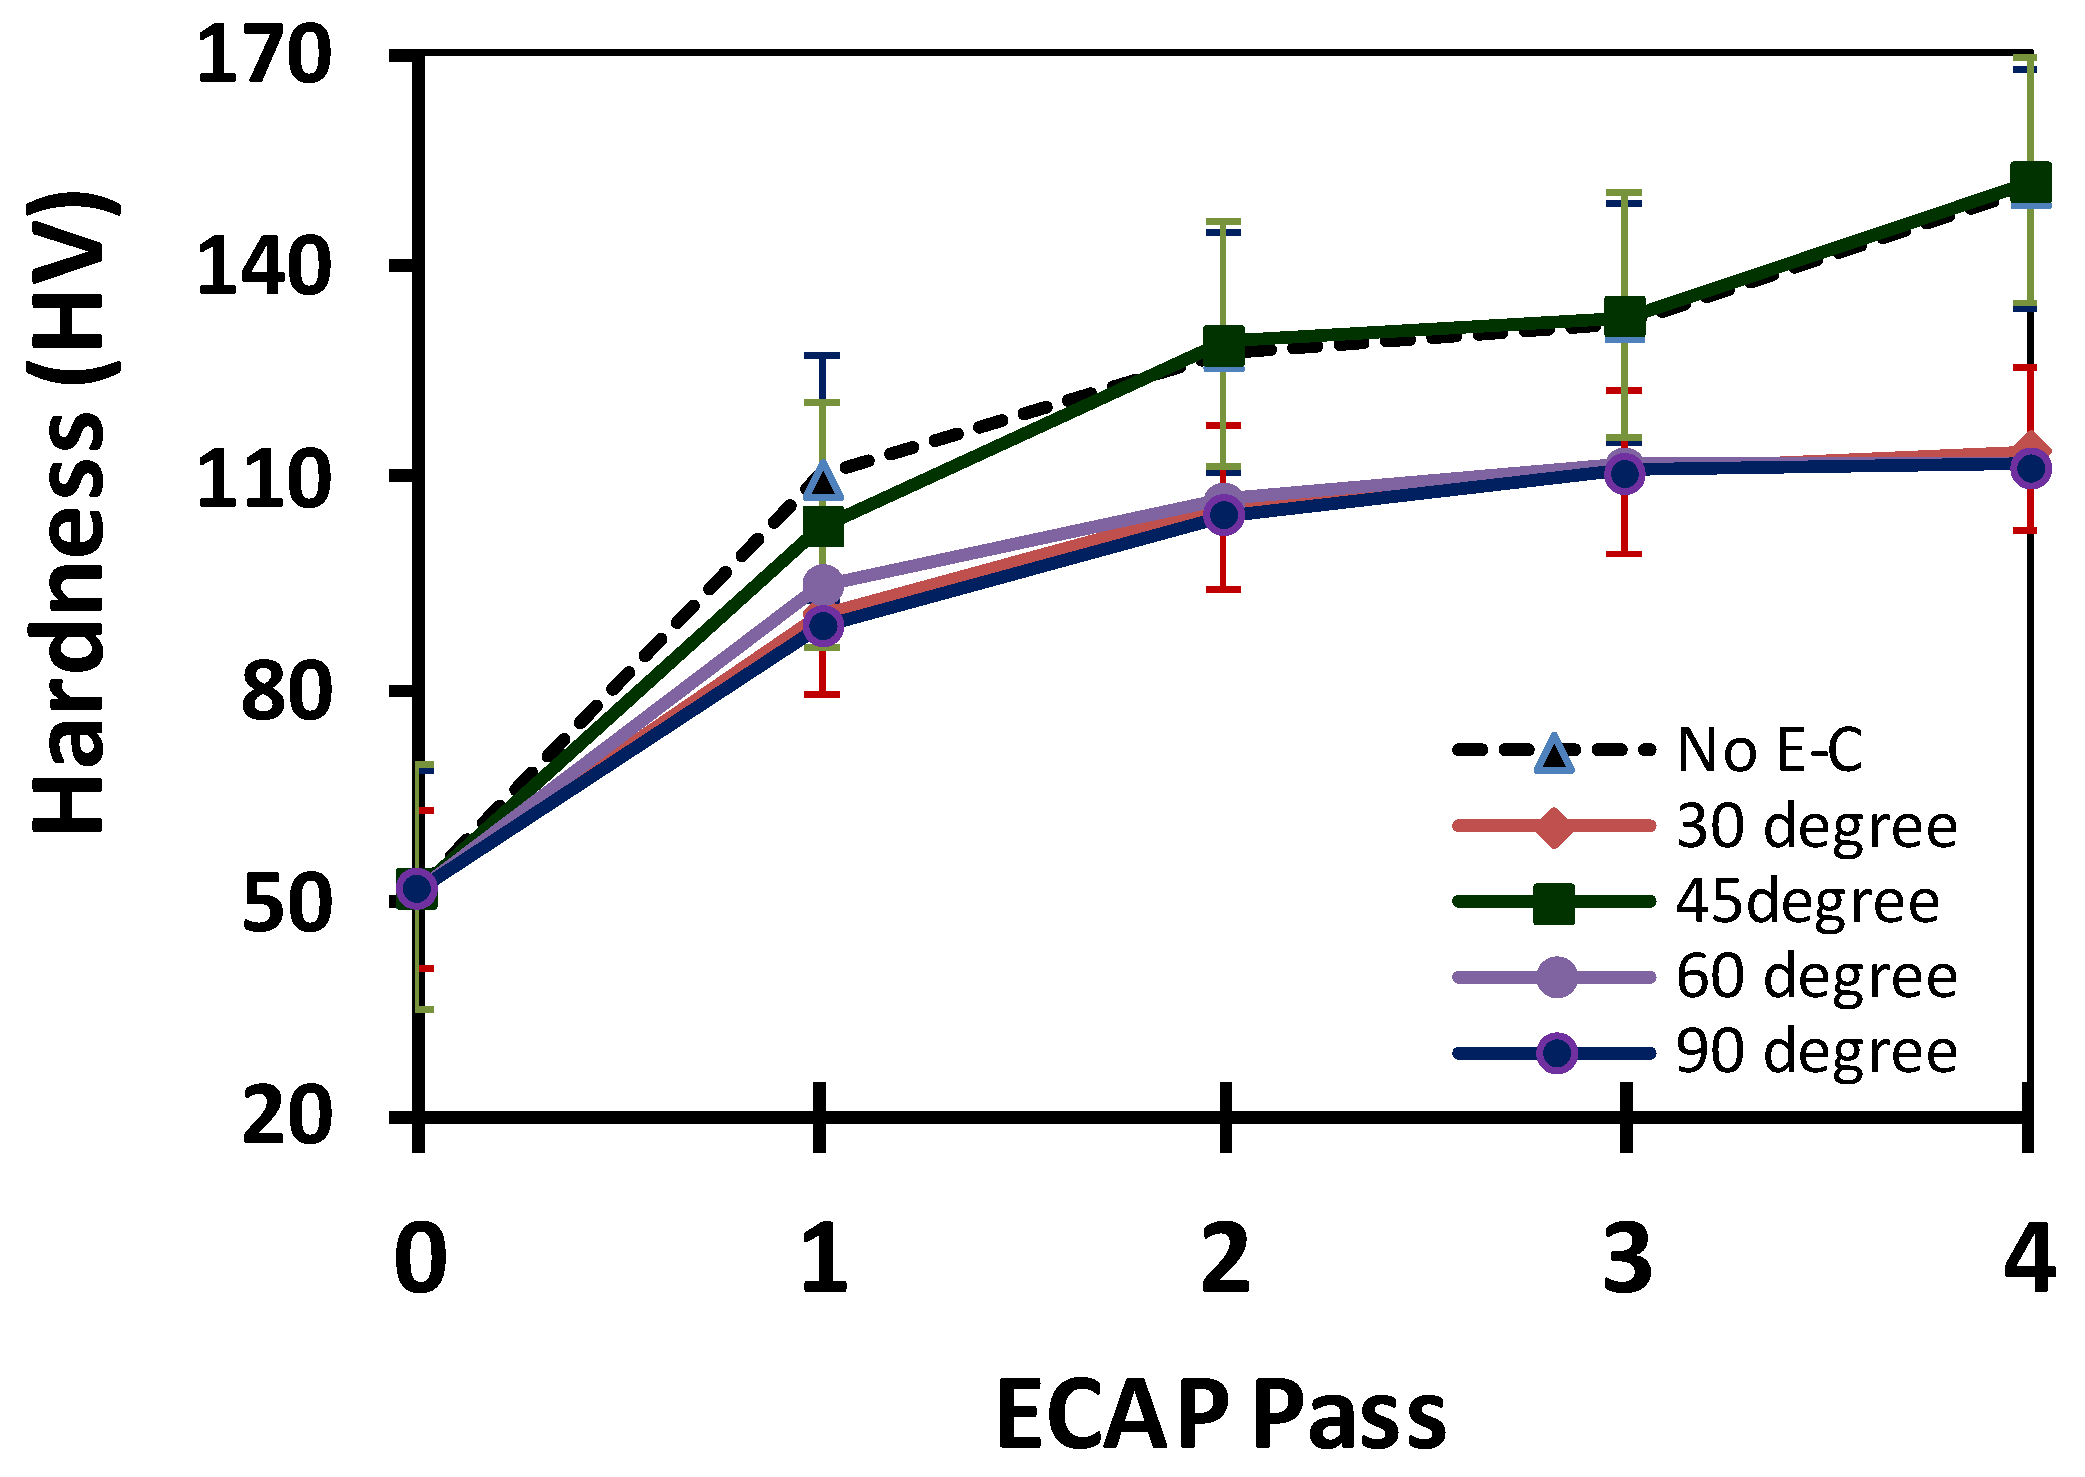
The hardness values (HV) of pure copper before and after ECAP passes as a function of ECAP passes is shown in Figure 5. Before ECAP process, the hardness was 51 HV for all slurry velocities. After the first pass of ECAP, the hardness values dramatically increased, but the rate of hardness decreased as the number of passes increased. After four ECAP passes for the samples subjected to low slurry velocities (2.7 m/s and 3.8 m/s) the maximum hardness value reached ~152 HV (enhancement of 198%) while, at high velocity (5.4 m/s), the maximum hardness was ~115 HV (125.5%).
The increases of HV values after the first ECAP pass are attributed to the generation of dislocations, increase of dislocation density and formation of the ultrafine-grained structure. At low velocities, the material loss due to E-C is low, so the resistance to penetration is high. More details of the mechanism of materials hardness and strength due to the severe plastic deformation for various materials are discussed in [11,12].
3.3. Effect of ECAP on Erosion-Corrosion at Different Test Durations
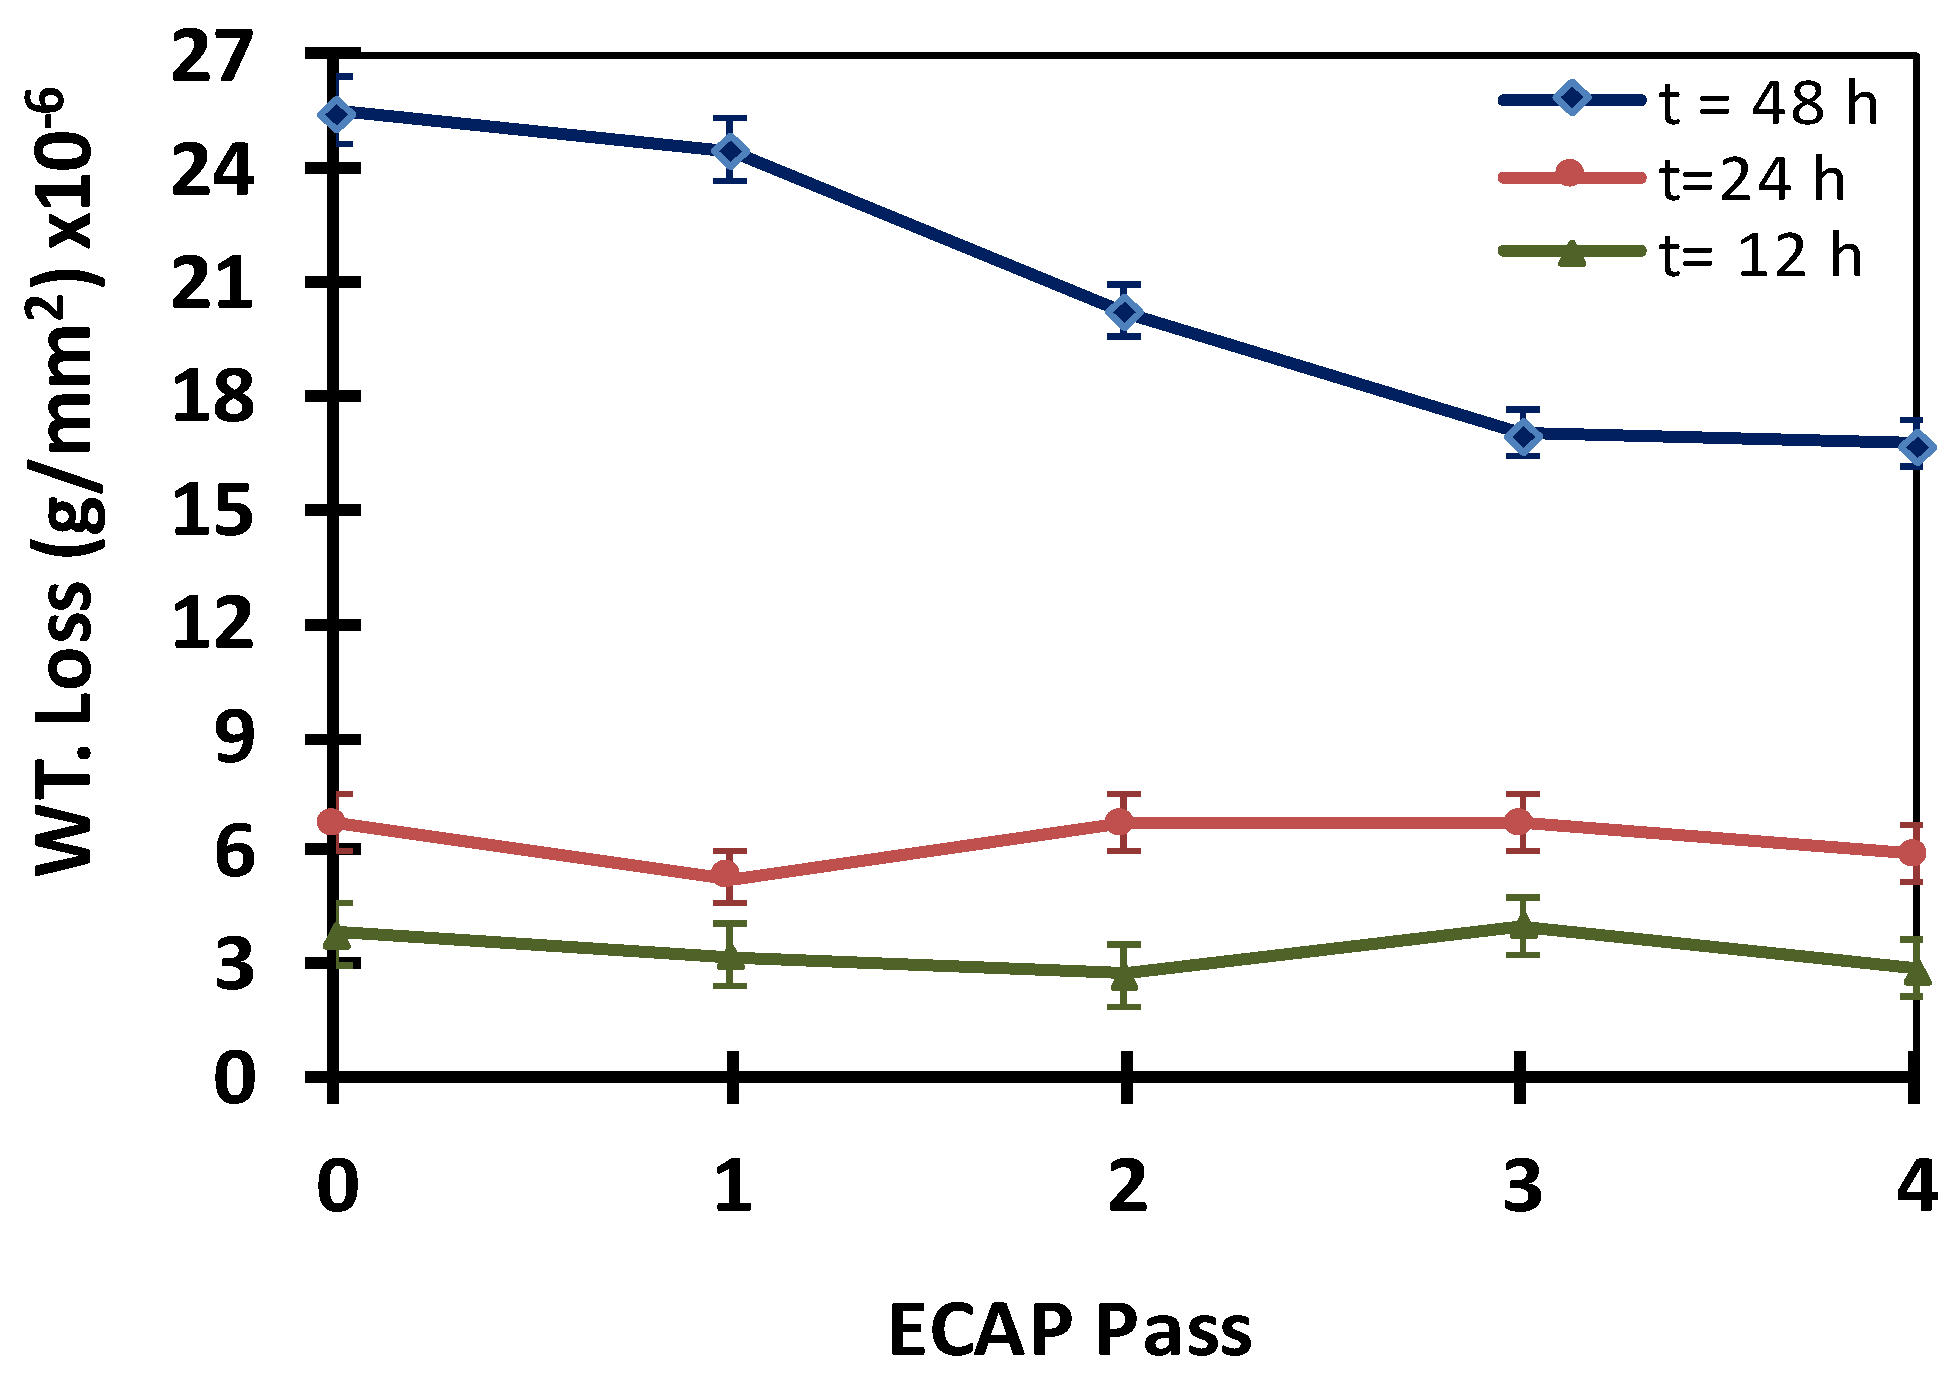
The weight loss per unit area due to E-C of copper with respect to ECAP passes at different test durations is shown in Figure 6. The tests were conducted at durations of 12 h, 24 h, and 48 h at constant conditions: Velocity of 3.8 m/s, impacting angle 45°, and sand slurry in water 20 wt.%. The results revealed that the experimental time has a substantial effect on E-C of copper at different ECAP passes. For annealed copper samples (pass 0), the weight losses were ~3.8 × 10⁻⁶ m/mm2, 6.7 × 10⁻⁶ g/mm2, and 25.5 × 10⁻⁶ g/mm2 at durations of 12, 24, and 48 h, respectively.
Figure 6 shows no significant difference in the weight loss for 12 and 24 h tests while a noticeable difference was observed for the 48 h test (16.8 × 10⁻⁶ m/mm2). This corresponds to a 34% rise in resistance to E-C after four ECAP passes. The hardness of the annealed copper specimens before ECAP was 51 HV. After first, second, third, and fourth ECAP passes, the hardness increased to 110 HV, 130 HV, 131 HV, and 152 HV, respectively. The ECAP introduces surface compressive stresses that increases the incubation period of the material. The incubation period is the time needed for the initiation of new grains and generation of high-angle boundaries so that the new grains appear and can be observed [40]. The increase in hardness increases the resistance to solid particles penetration. Therefore, a lower E-C rate is obtained. Additionally, the materials with high work hardening capacity and low stacking energy were found to be useful for E-C resistance. Low stacking fault energy implies a wide separation of dislocations to cross-slipping. This difficulty interprets the relatively lower recovery rates, which results in lower erosion rates [41,42,43].
3.4. Effect of ECAP on Erosion-Corrosion at Different Flow Velocities
Figure 7 shows the variation of weight loss with ECAP passes as a function of slurry velocity. A slurry of 3.5 wt.% sodium (NaCl) and solid particles of silica sand (SiO2) with an average size of 250–500 μm was used in the tests. The test duration was 48 h with impact angel of 45°. According to the results, the weight loss due to E-C increases with increasing the impact velocities. At low velocities the weight loss is minimal. However, higher increase in weight loss occurred at the velocities of 3.8 m/s and 5.4 m/s, respectively. The largest weight losses for all ECAP passes occurred at a velocity of 5.4 m/s. These results can be attributed to the effect of flow field in the container of the slurry. At low velocities, the erodent is not completely suspended in the fluid; therefore, the erosion is unable to occur. It is recognized that erosion is a function of the fluid velocity (v) and it and be calculated by the nonlinear formula: Erosion = K·(v)n, where K is a constant depends upon particle size and impacting angle, and n is the velocity exponent [41,42]. Comparing the weight losses for pass zero (annealed copper) and four pass ECAP at different velocities it is observed that E-C resistances increased by 0%, 14%, 31.8%, and 13% at 1.4 m/s, 2.7 m/s, 3.8 m/s, and 5.4 m/s, respectively. The improvement increased to 31.8% at the speed of 3.8 m/s and then it has dropped to 13% at the speed of 5.4 m/s. One possible reason can be due to the decrease of hardness at a higher velocity.
After both ECAP and E-C experiments, the hardness (HV) of the specimens were measured as presented previously in Figure 5. It can be observed that the weight loss at a higher slurry velocity is more than at lower velocities. The decrease of the hardness at higher velocity can be attributed to the increase of the degradation of the surface. Other researchers investigating the erosion resistance, with alumina, silicon carbide, and quartz particles [44] reported similar results. It is believed that work hardening due to ECAP enhances the E-C resistance of copper. It is also concluded that, at higher velocity, the elastic strain energy would exceed the strain energy of the tested material and the plastic deformation leads to micro cutting zones on the surface. Furthermore, optical microscopy to study the effect of flow velocity was employed to examine the surface of selected E-C samples. The obtained results will be presented and discussed in (Section 3.7) later in this work. The increasing of the slurry velocity resulted in increasing the kinetic energy of the erosive solid particles. This yields to more weight loss appears as a pitting on the surface. The micrographs of optical microscope showed the same findings (Section 3.7). For the ECAPed samples that were subjected to higher impact velocities, the damage on the impact areas are more clearly compared with the same sample subjected to lower velocities.
3.5. Effect of ECAP on Erosion-Corrosion at Different Impacting Angles
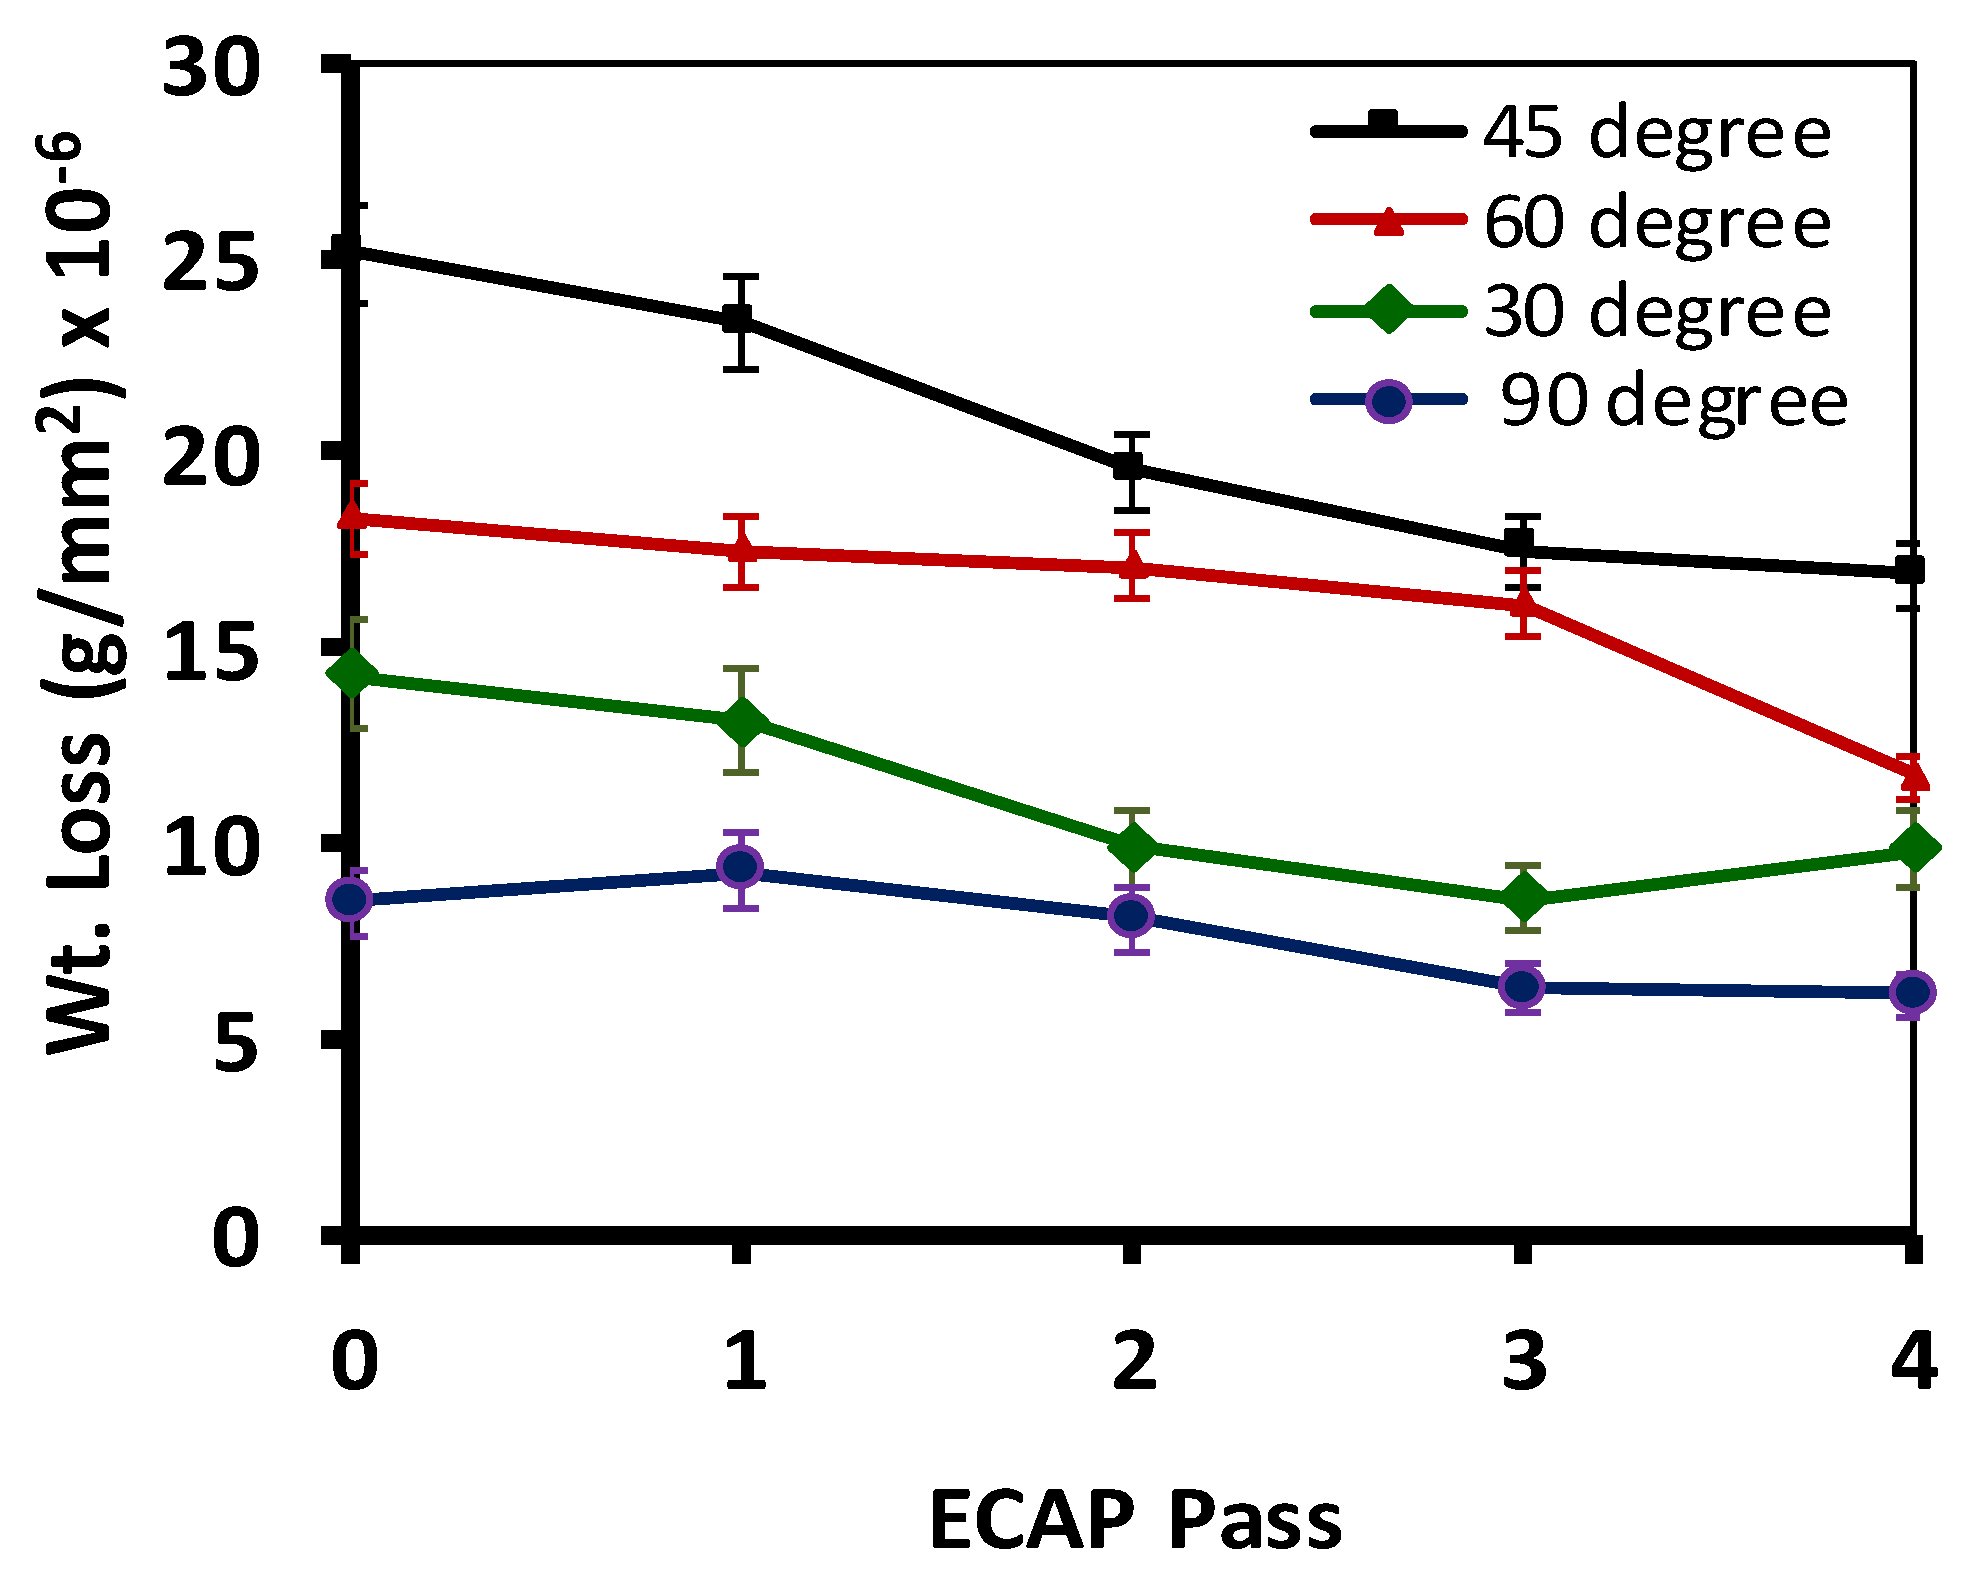
The impacting angle plays a major role in E-C behaviors of copper as shown in Figure 8 below. The highest E-C rates were obtained at an impacting angle of 45° in all ECAP passes. This result is consistent with the findings reported by the other previous studies [26]. It is reported that the maximum E-C rate were obtained with impact angle ranges from 30° to 50° for a range of materials such as pure iron, 304 stainless steel and aluminum [26,27,28,29]. The lowest values of weight loss due to E-C were recorded at an impacting angle of 90°. Comparing the E-C rate for annealed copper and four ECAPed passes specimens at impacting angles of 90° and 45° the weight losses decreased by 28.2% and 32.7%, respectively. Additionally, the hardness value after E-C tests for different impact angles are shown in Figure 9. A drop of hardness values is reported with impact angles of 30°, 60°, and 90°, whereas at the impact angle of 45° no changes in the hardness of the copper specimen were observed. A probable reason can be that the ductile materials show maximum erosion rate at 30°–50° (45° for the ECAPed copper). Furthermore, the impact angle plays a major role in material removal whereas the maximum value of erosion rate arises at normal angle 90° with micro fractures. With a further increase of the impacting angle, the tangential force component will be very low compared with the normal component.
When the impacting energy exceeds the elastic strain energy of the material, the plastic deformation takes place in the indentation form as shown schematically in Figure 10. The cold work generated by the impacting particle would have a stress relaxation effect on the surface of the specimen after ECAP. This effect results in the reduction of hardness. On the other hand, at 45° the normal and tangential components of the impacting force are equal and the rate of material removal is maximized. In case of pure copper samples, it is found that the impact angle has the major effect on the erosion mechanism of solid particles [26]. Further studies are needed to understand and verify this point.
3.6. Effect of ECAP on Erosion-Corrosion at Different Sand Concentrations
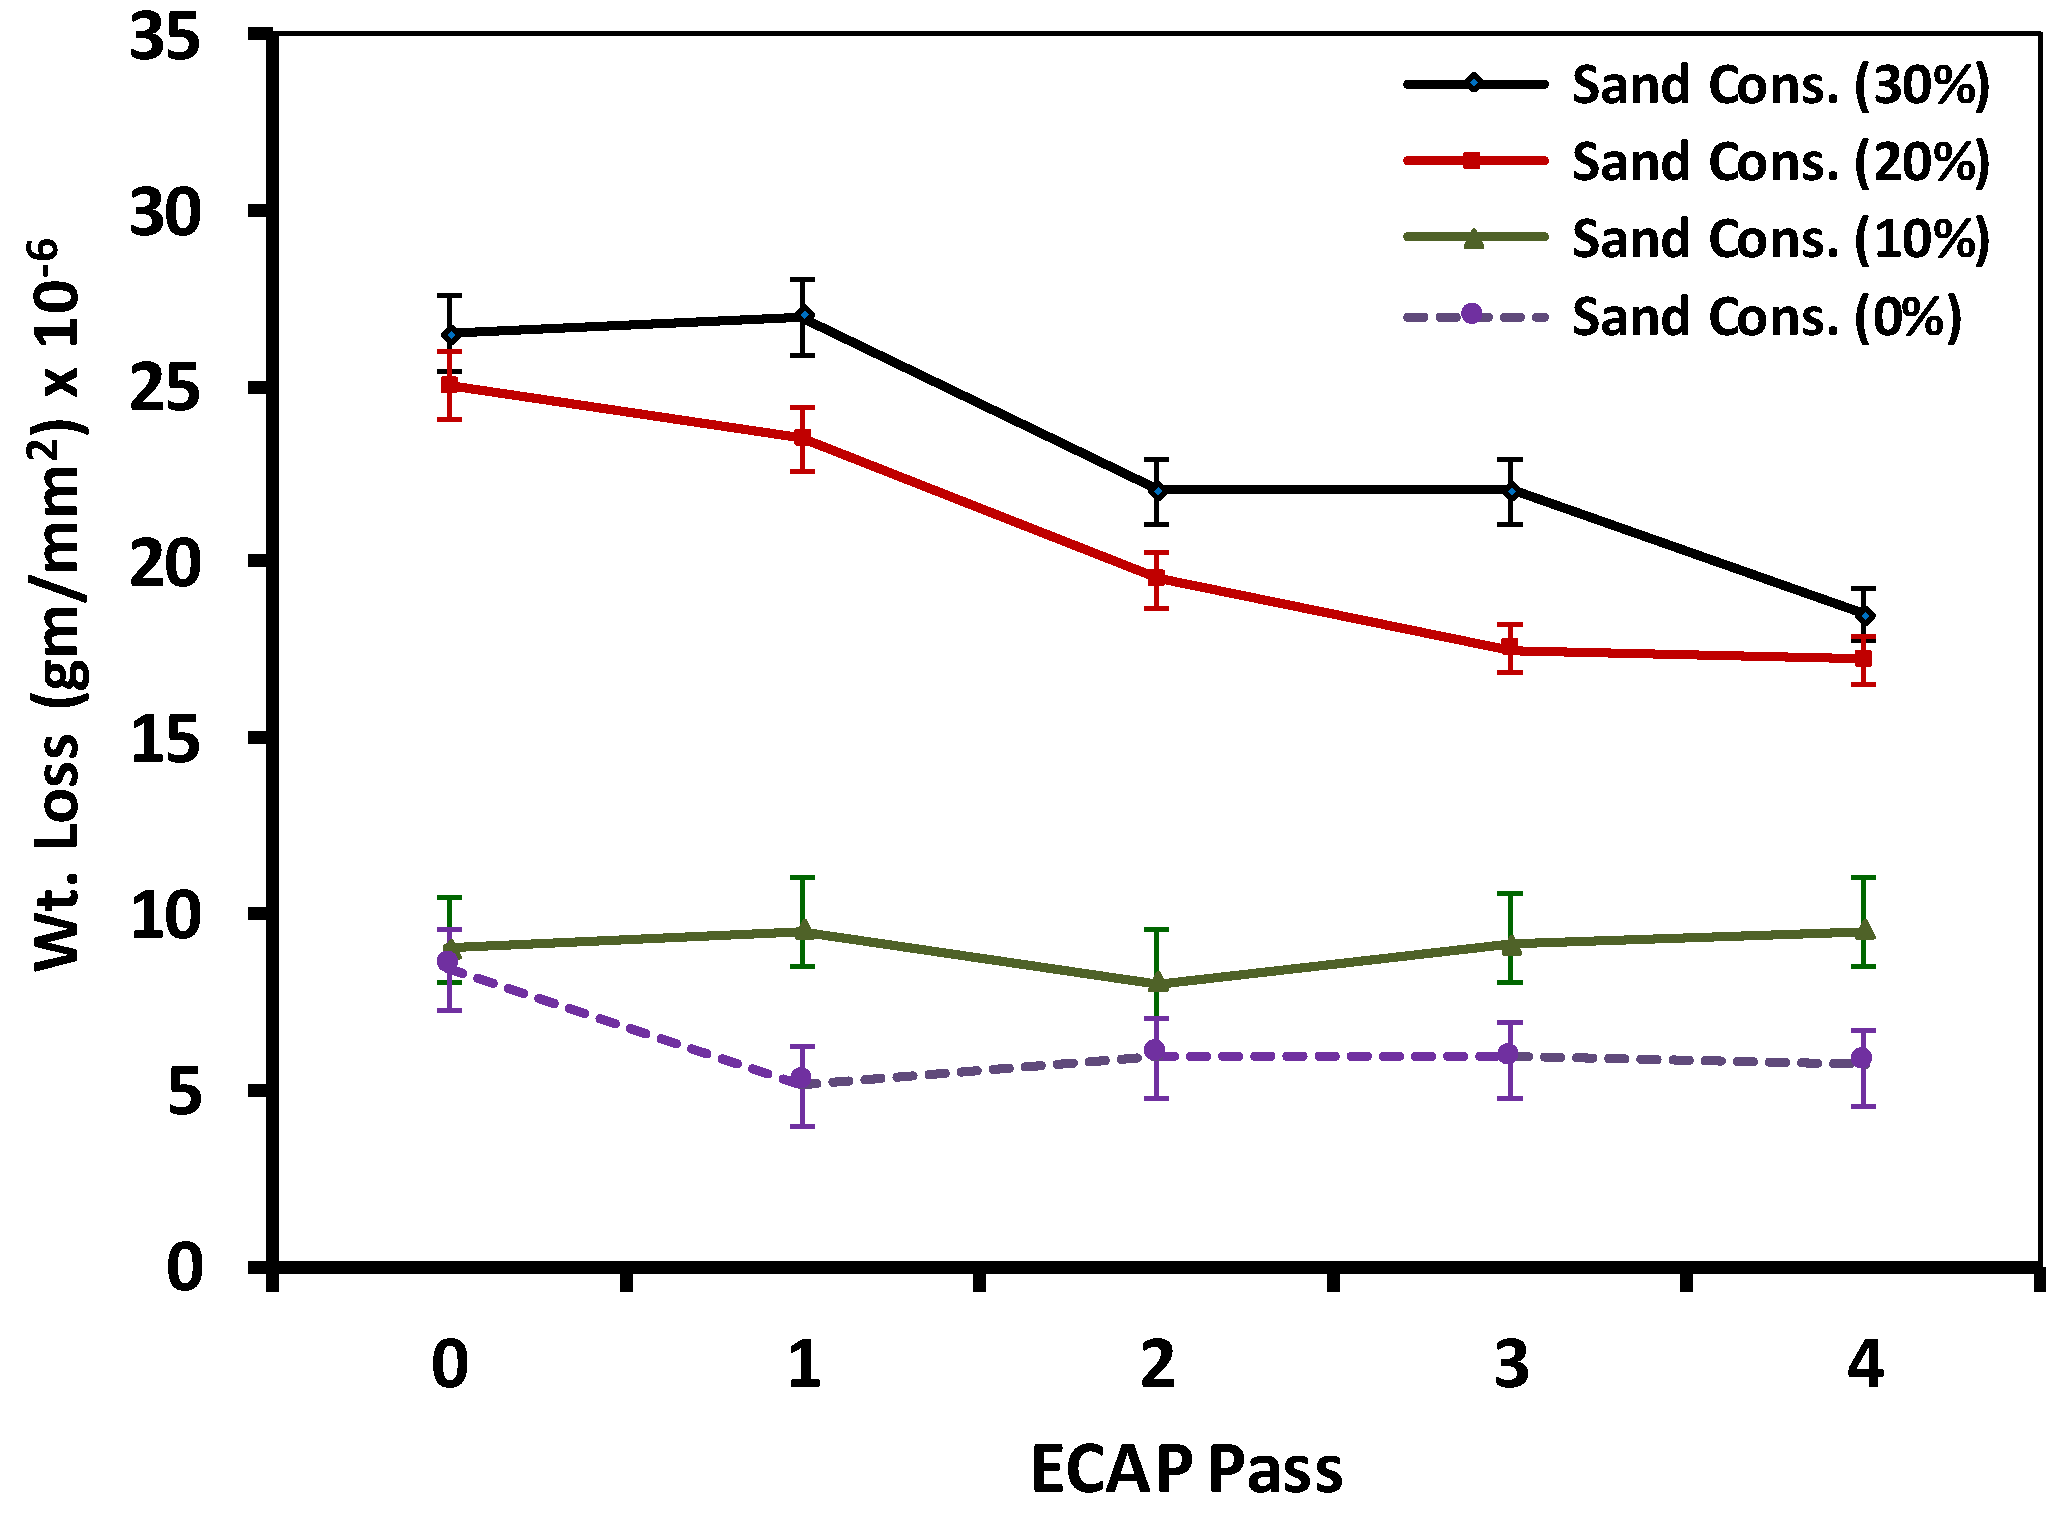
The effect of ECAP passes on E-C of copper at different sand concentrations is depicted in Figure 11. The tests were performed at 0, 10, 20, and 30 wt.% of sand in the slurry. It is observed that the increment of sand concentration resulted in an increase in material weight loss. The increase of weight loss is attributed to the enormous number of solid particles impacting the surface and causing material removal [39]. In the absence of sand, the improvement of corrosion resistance due to four ECAP passes was 17%. On the other hand, with sand concentration of 30%, there is a 28% improvement in E-C resistance of copper. In addition, comparing 0% and 30% sand concentration for copper at annealed condition (0 ECAP pass), it can be seen that the increase in weight loss is about 250% (i.e., corrosion condition). However, after four ECAP passes with similar sand concentration an increase of 200% is achieved.
3.7. Metallography and Surface Roughness Observations
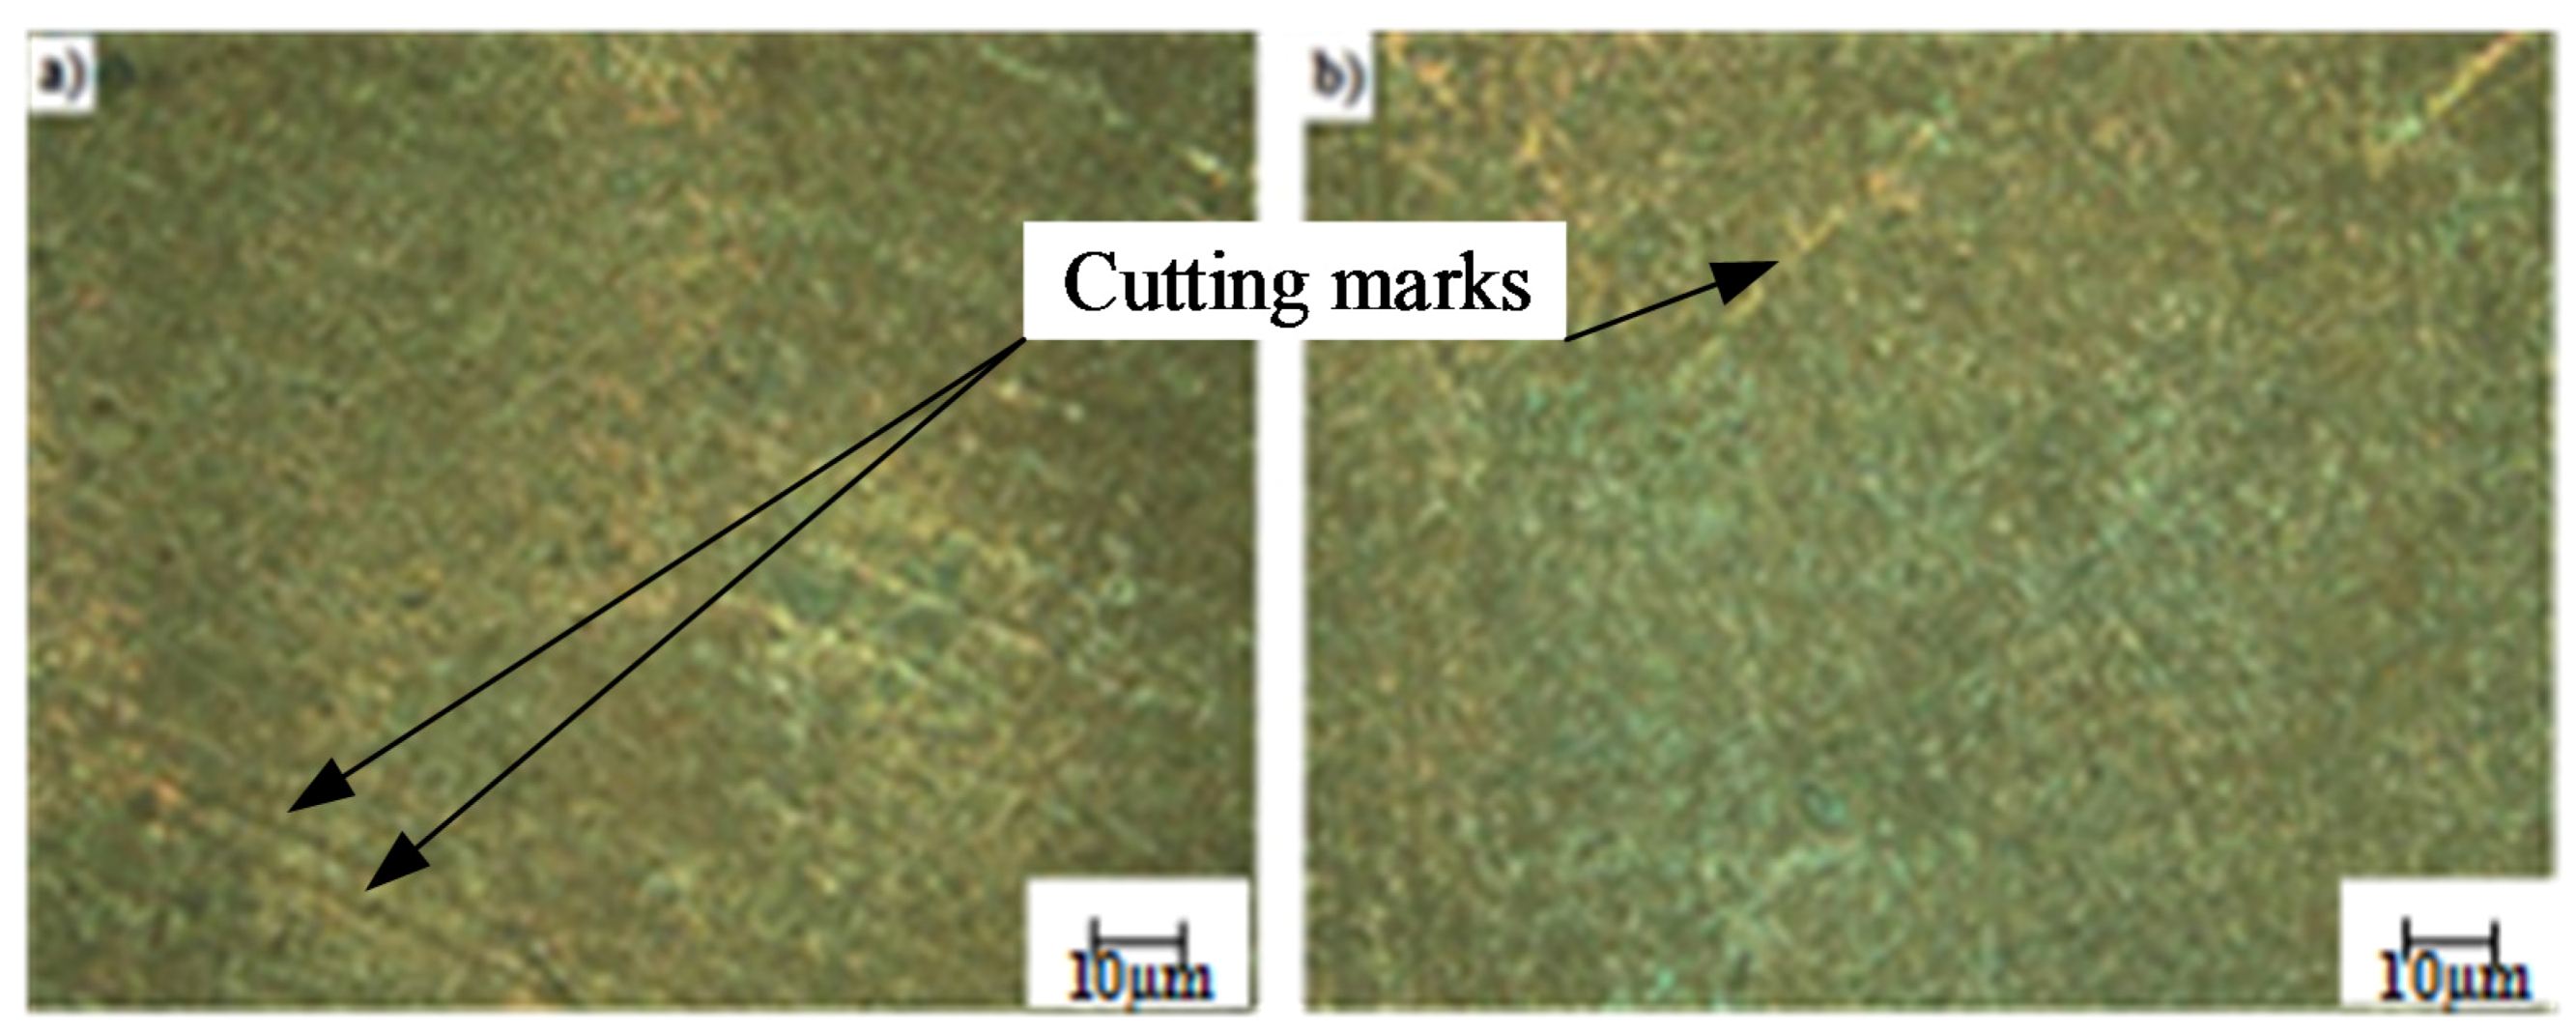
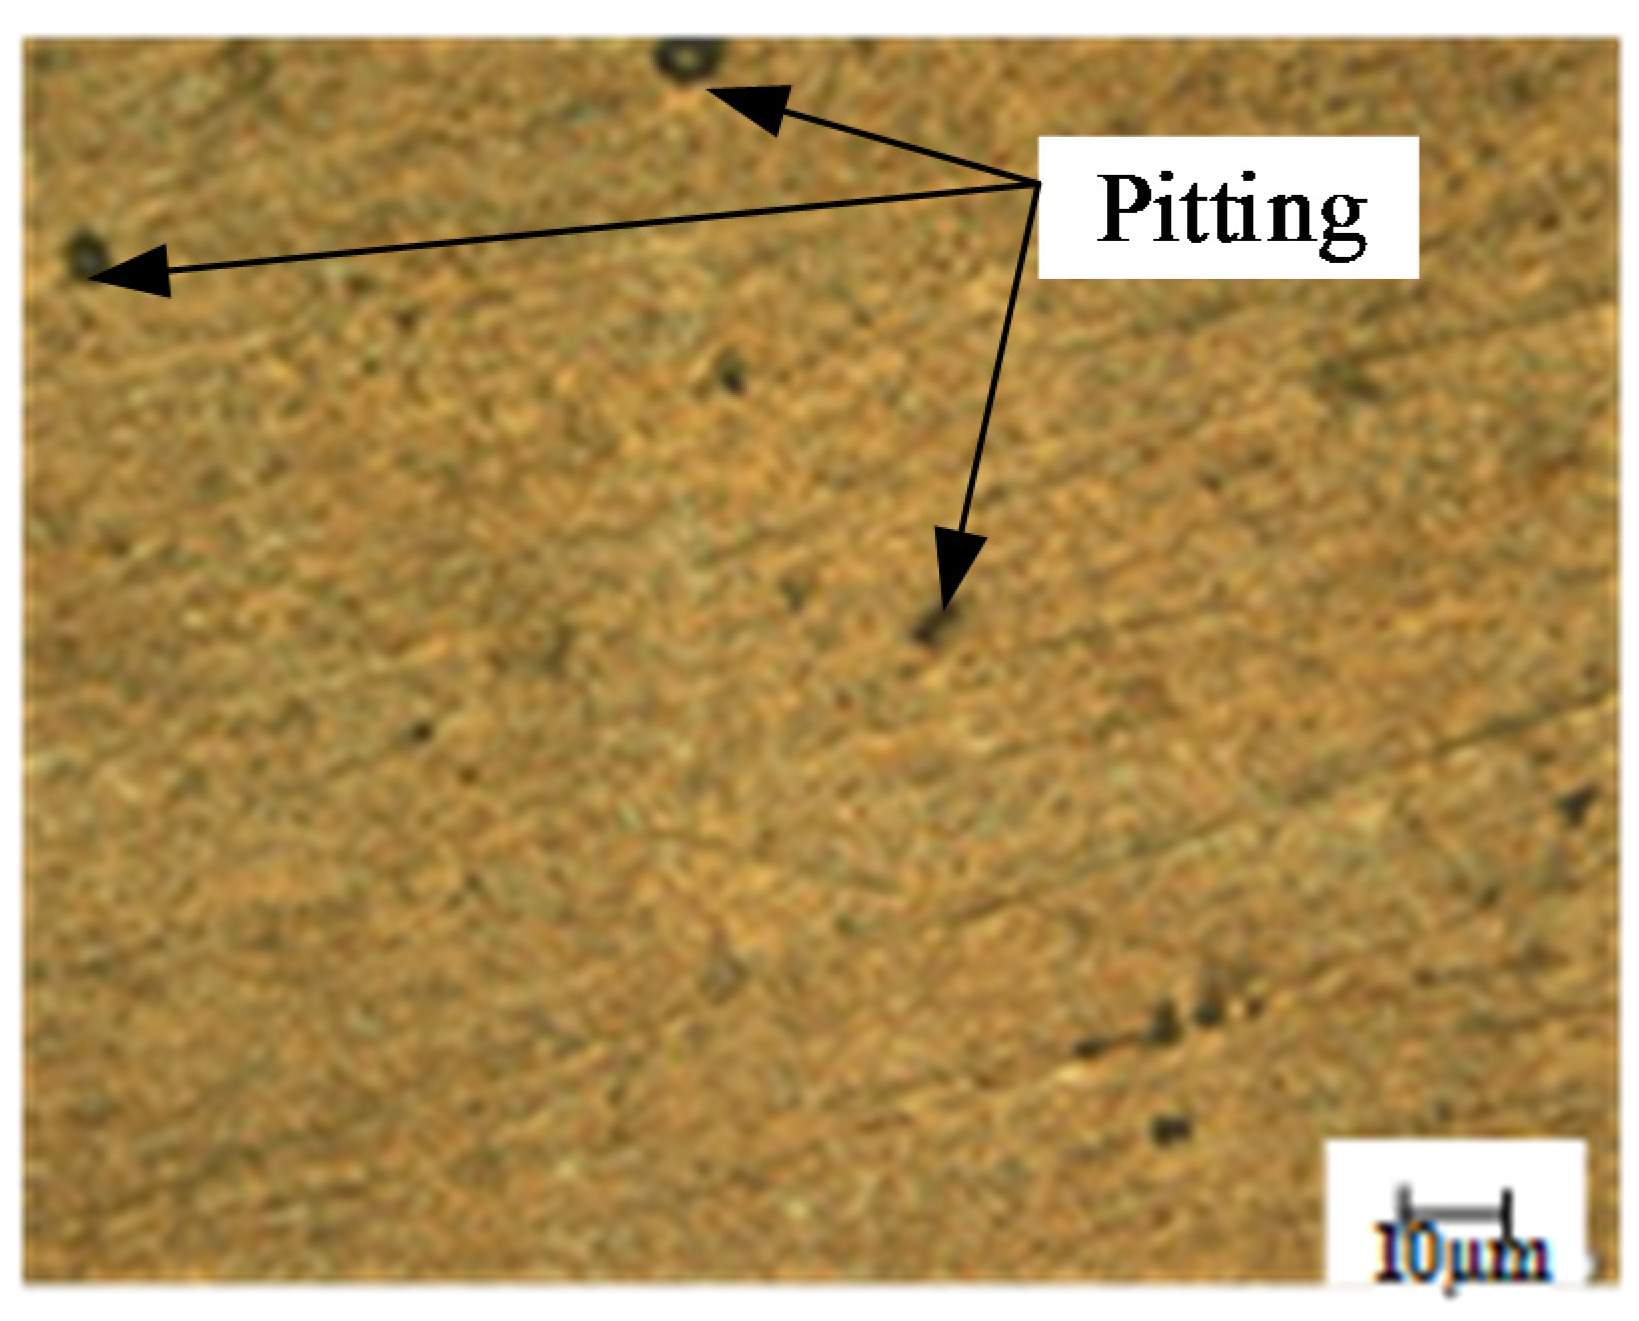
Numbers of eroded surfaces were investigated by an optical microscope to gain more insight of the material removal mechanisms. The test conditions were a slurry of 3.5 wt.% sodium (NaCl) and solid particles of silica sand (SiO2) with an average size of 250–500 μm, 20% concentration as erodent and a 45° impacting angle. Typical position near the center on the test specimens was selected. Figure 12 and Figure 13 show the eroded surface of copper samples before and after ECAP. As it can be seen in Figure 12a; for low velocity (1.4 m/s), cutting marks represent the material removal and indicates a ductile fracture of the material. Micrograph in Figure 12b shows the eroded copper surface after four passes of ECAP. Fewer cutting marks were noticed. The E-C is less as compared with the previous one, which is supported by the results. At higher velocity (5.4 m/s), pitting was observed on the surface. In Figure 13, the shapes of eroded zone are rectangular and elliptical similar to sand particles suspended to the slurry. This occurred because of high particle impact on the copper surface at high velocity.
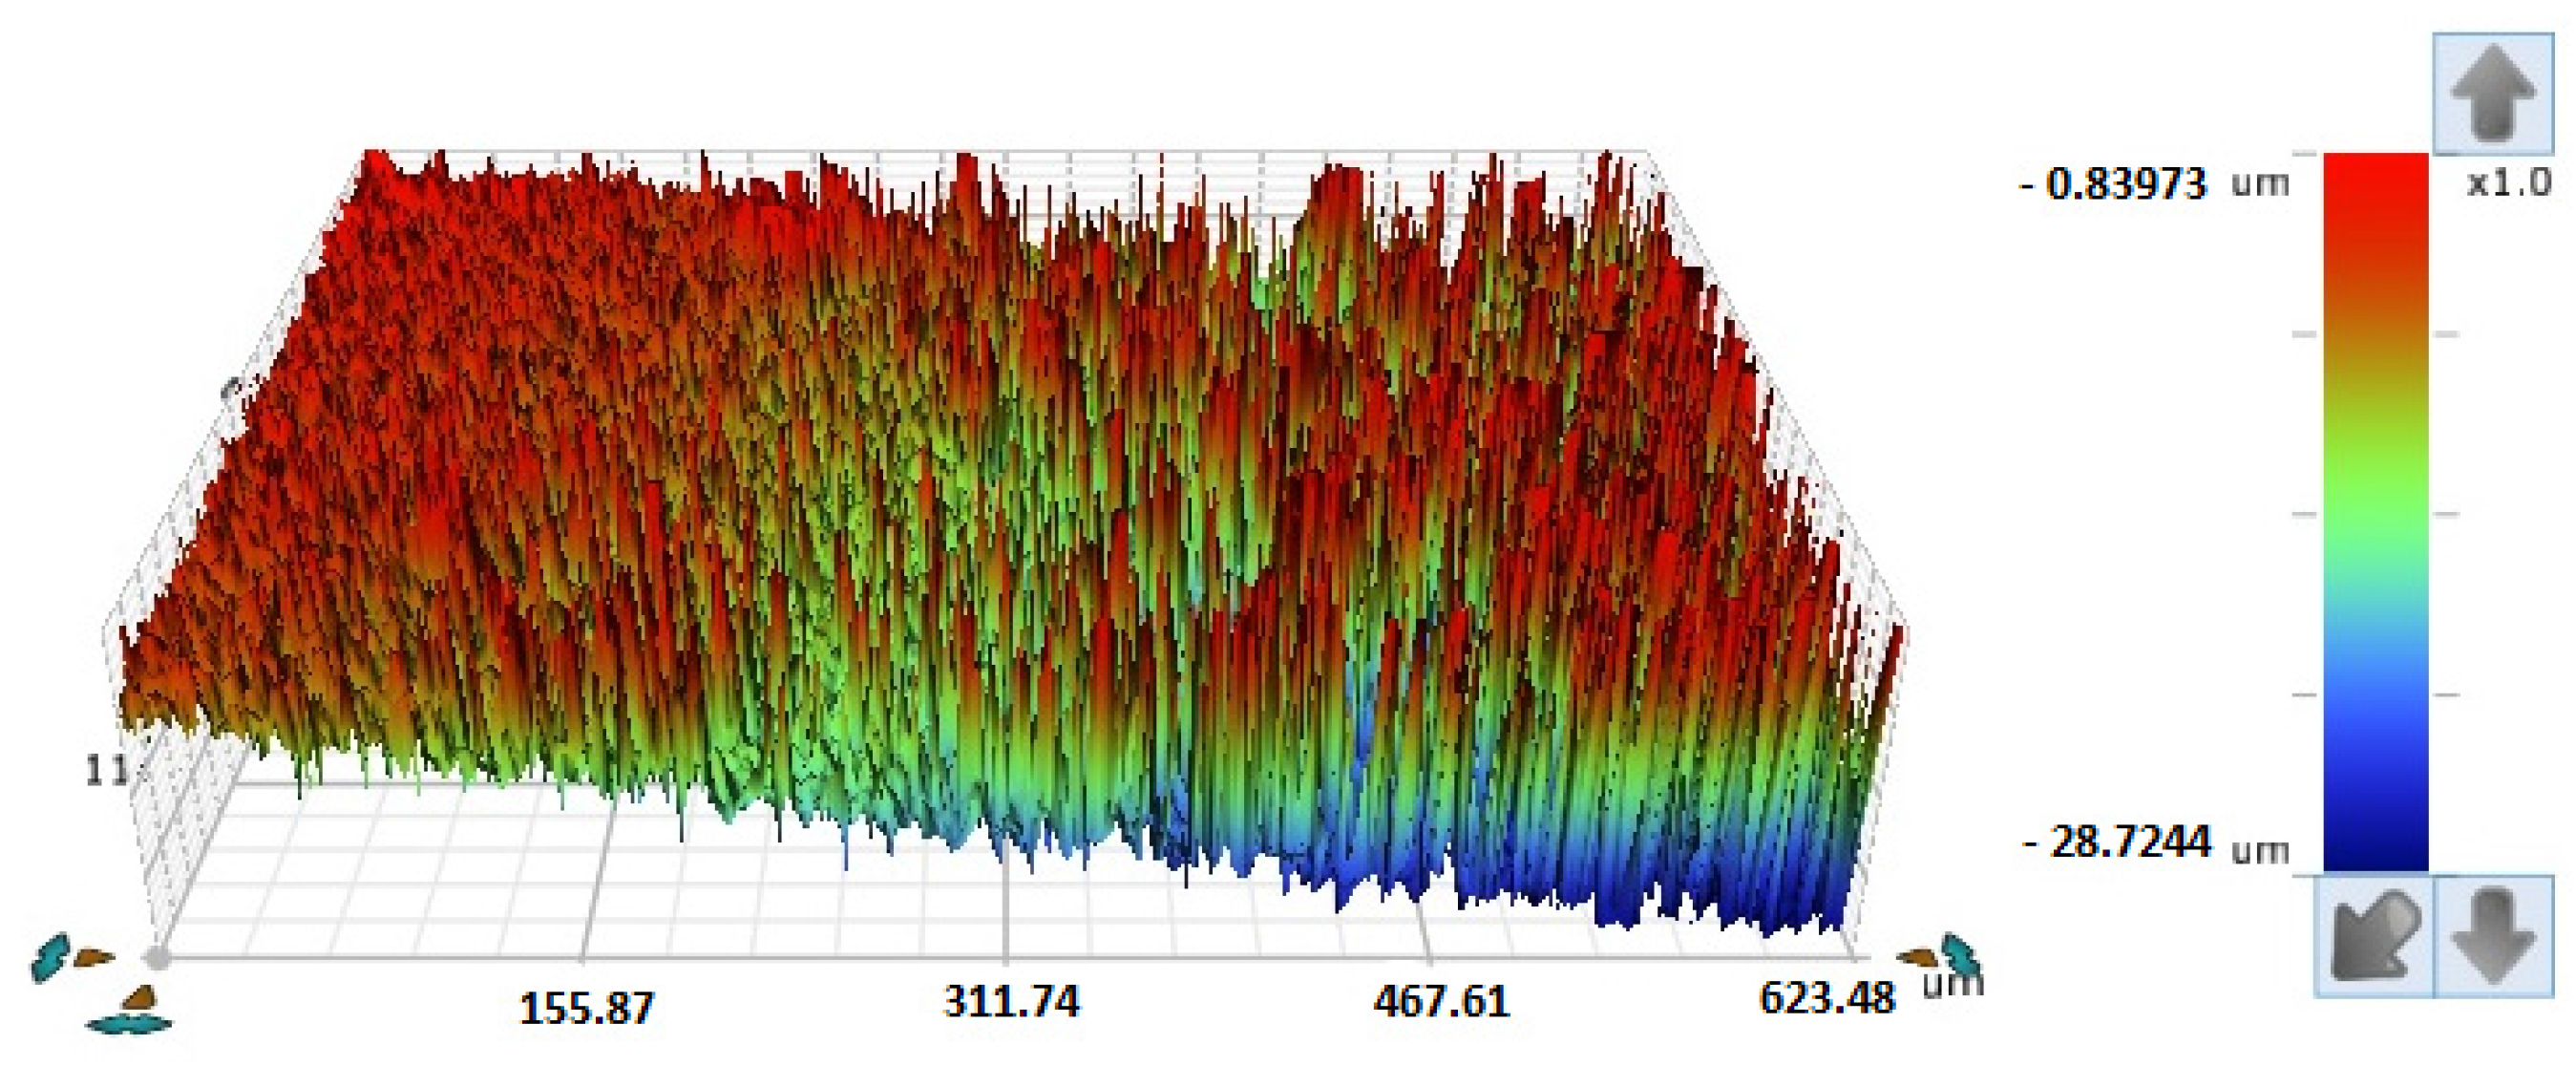
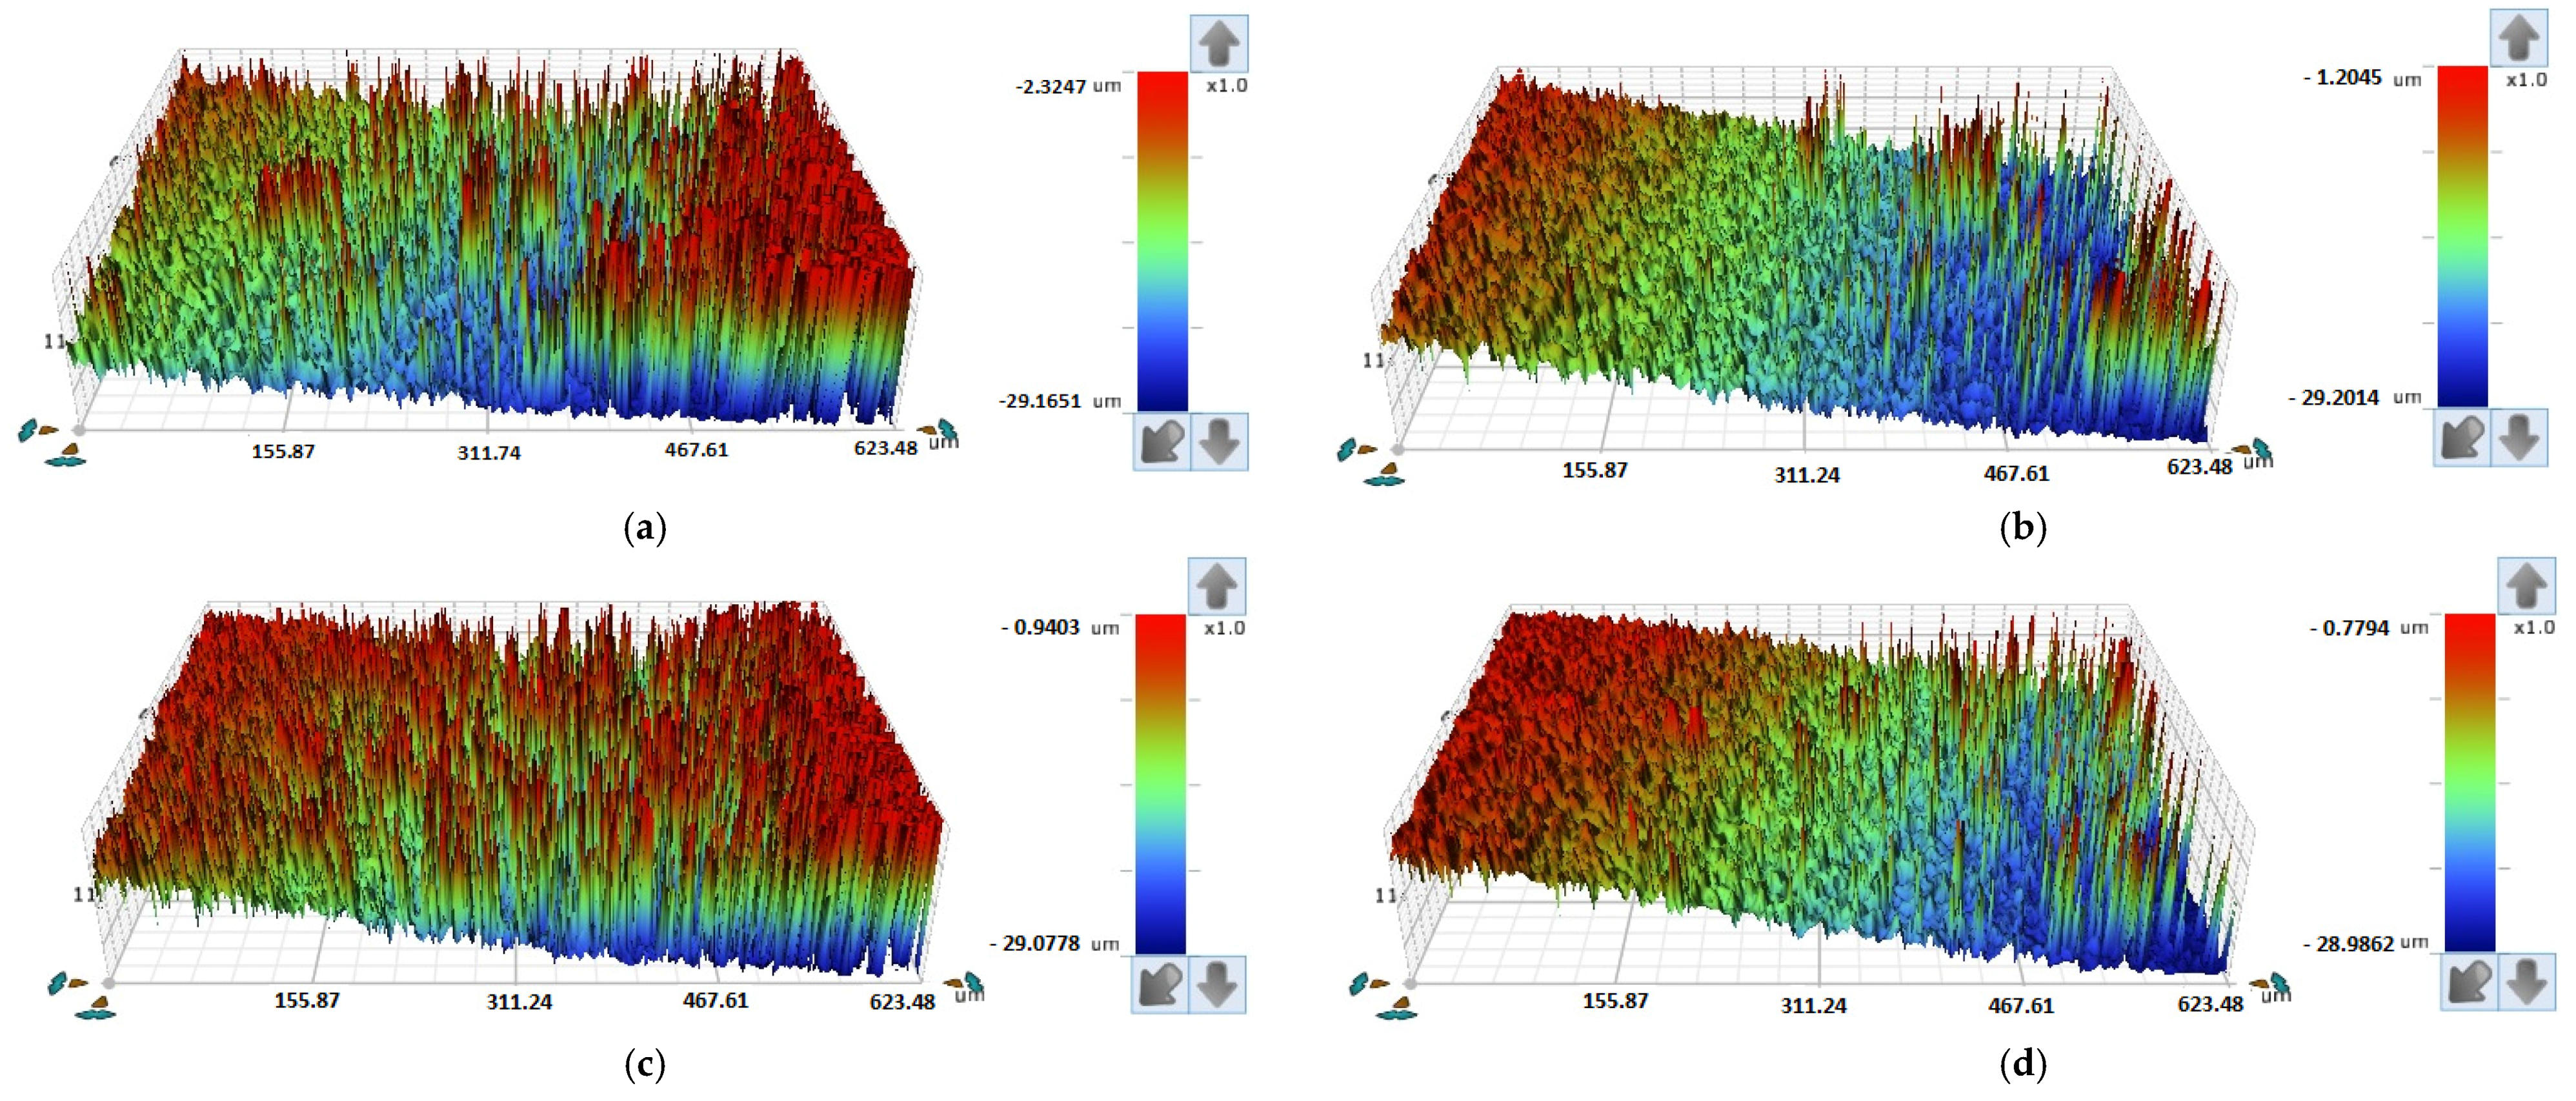
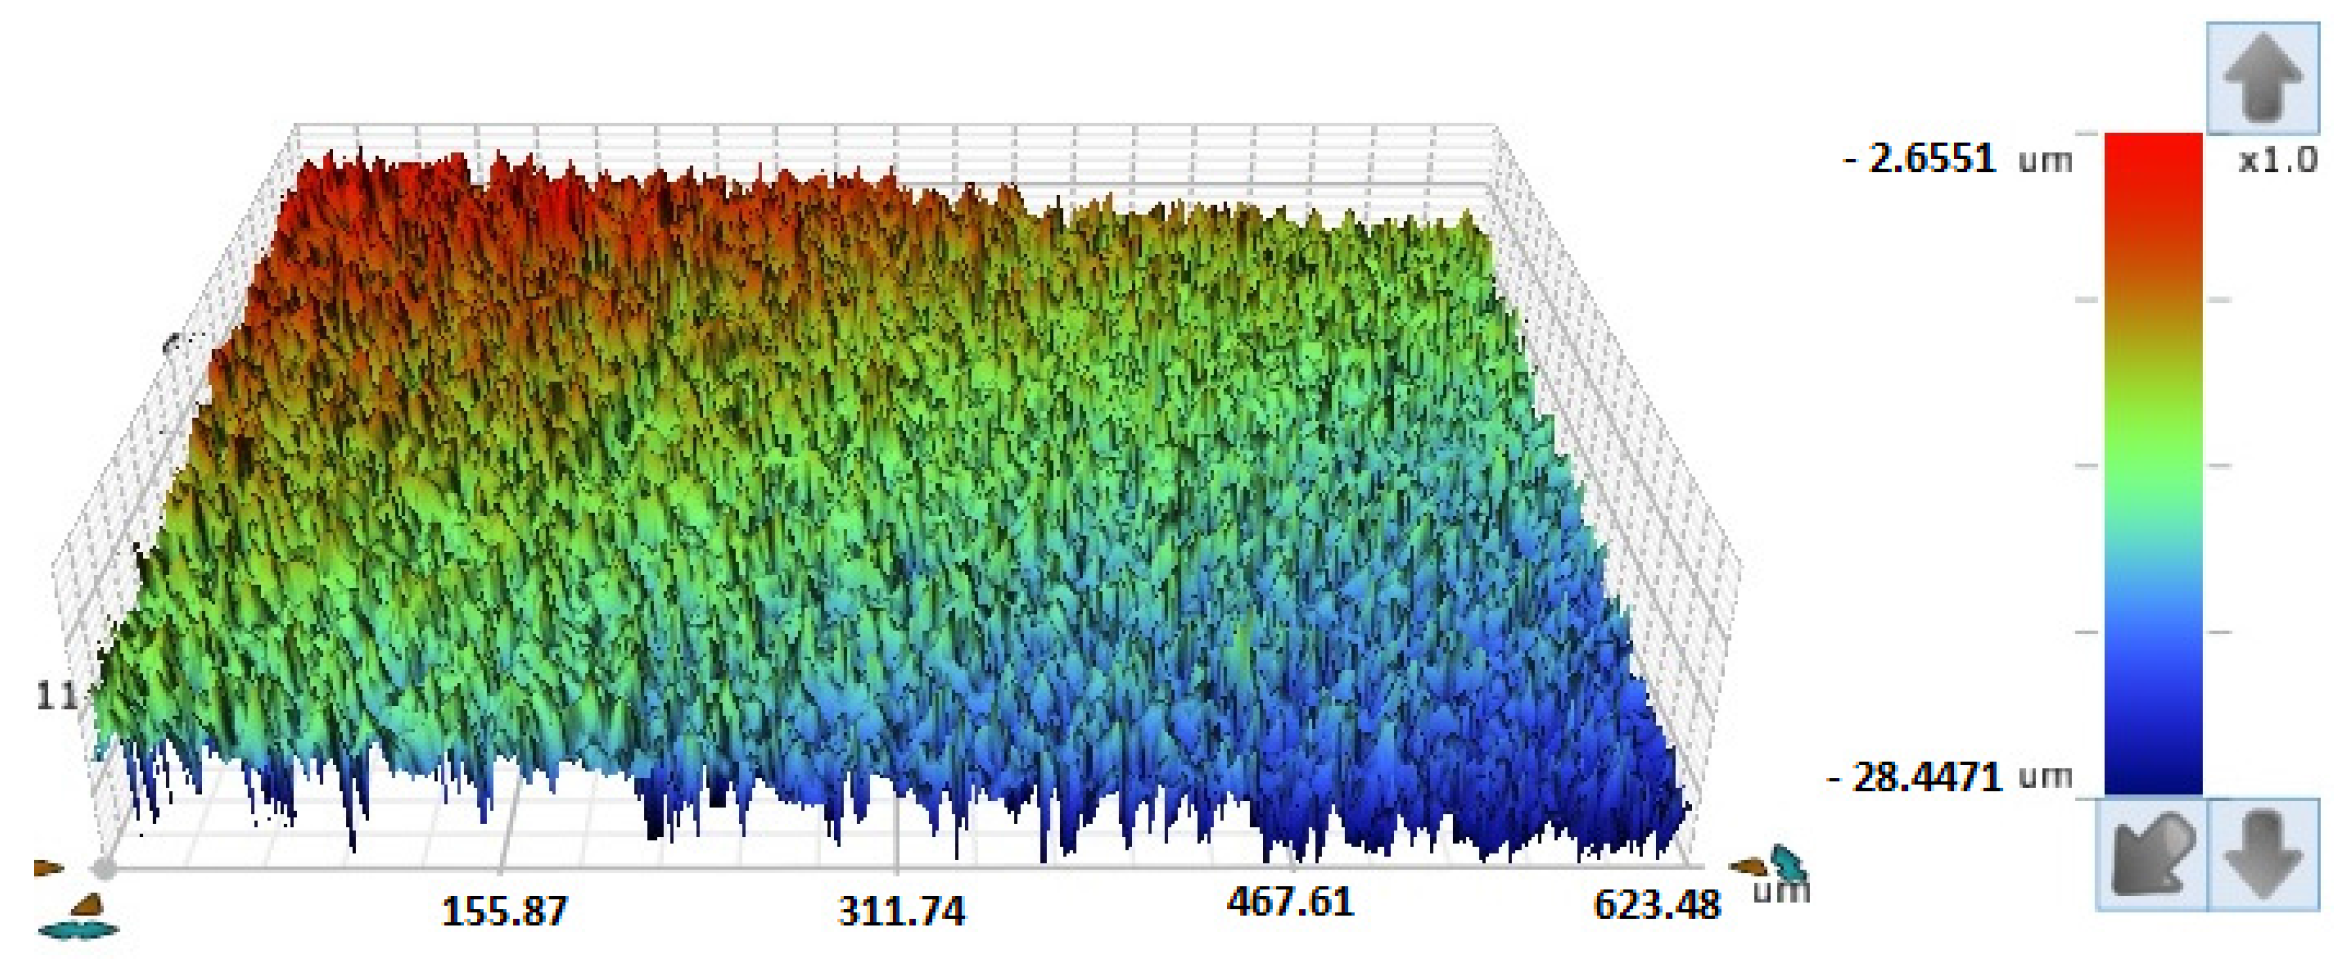
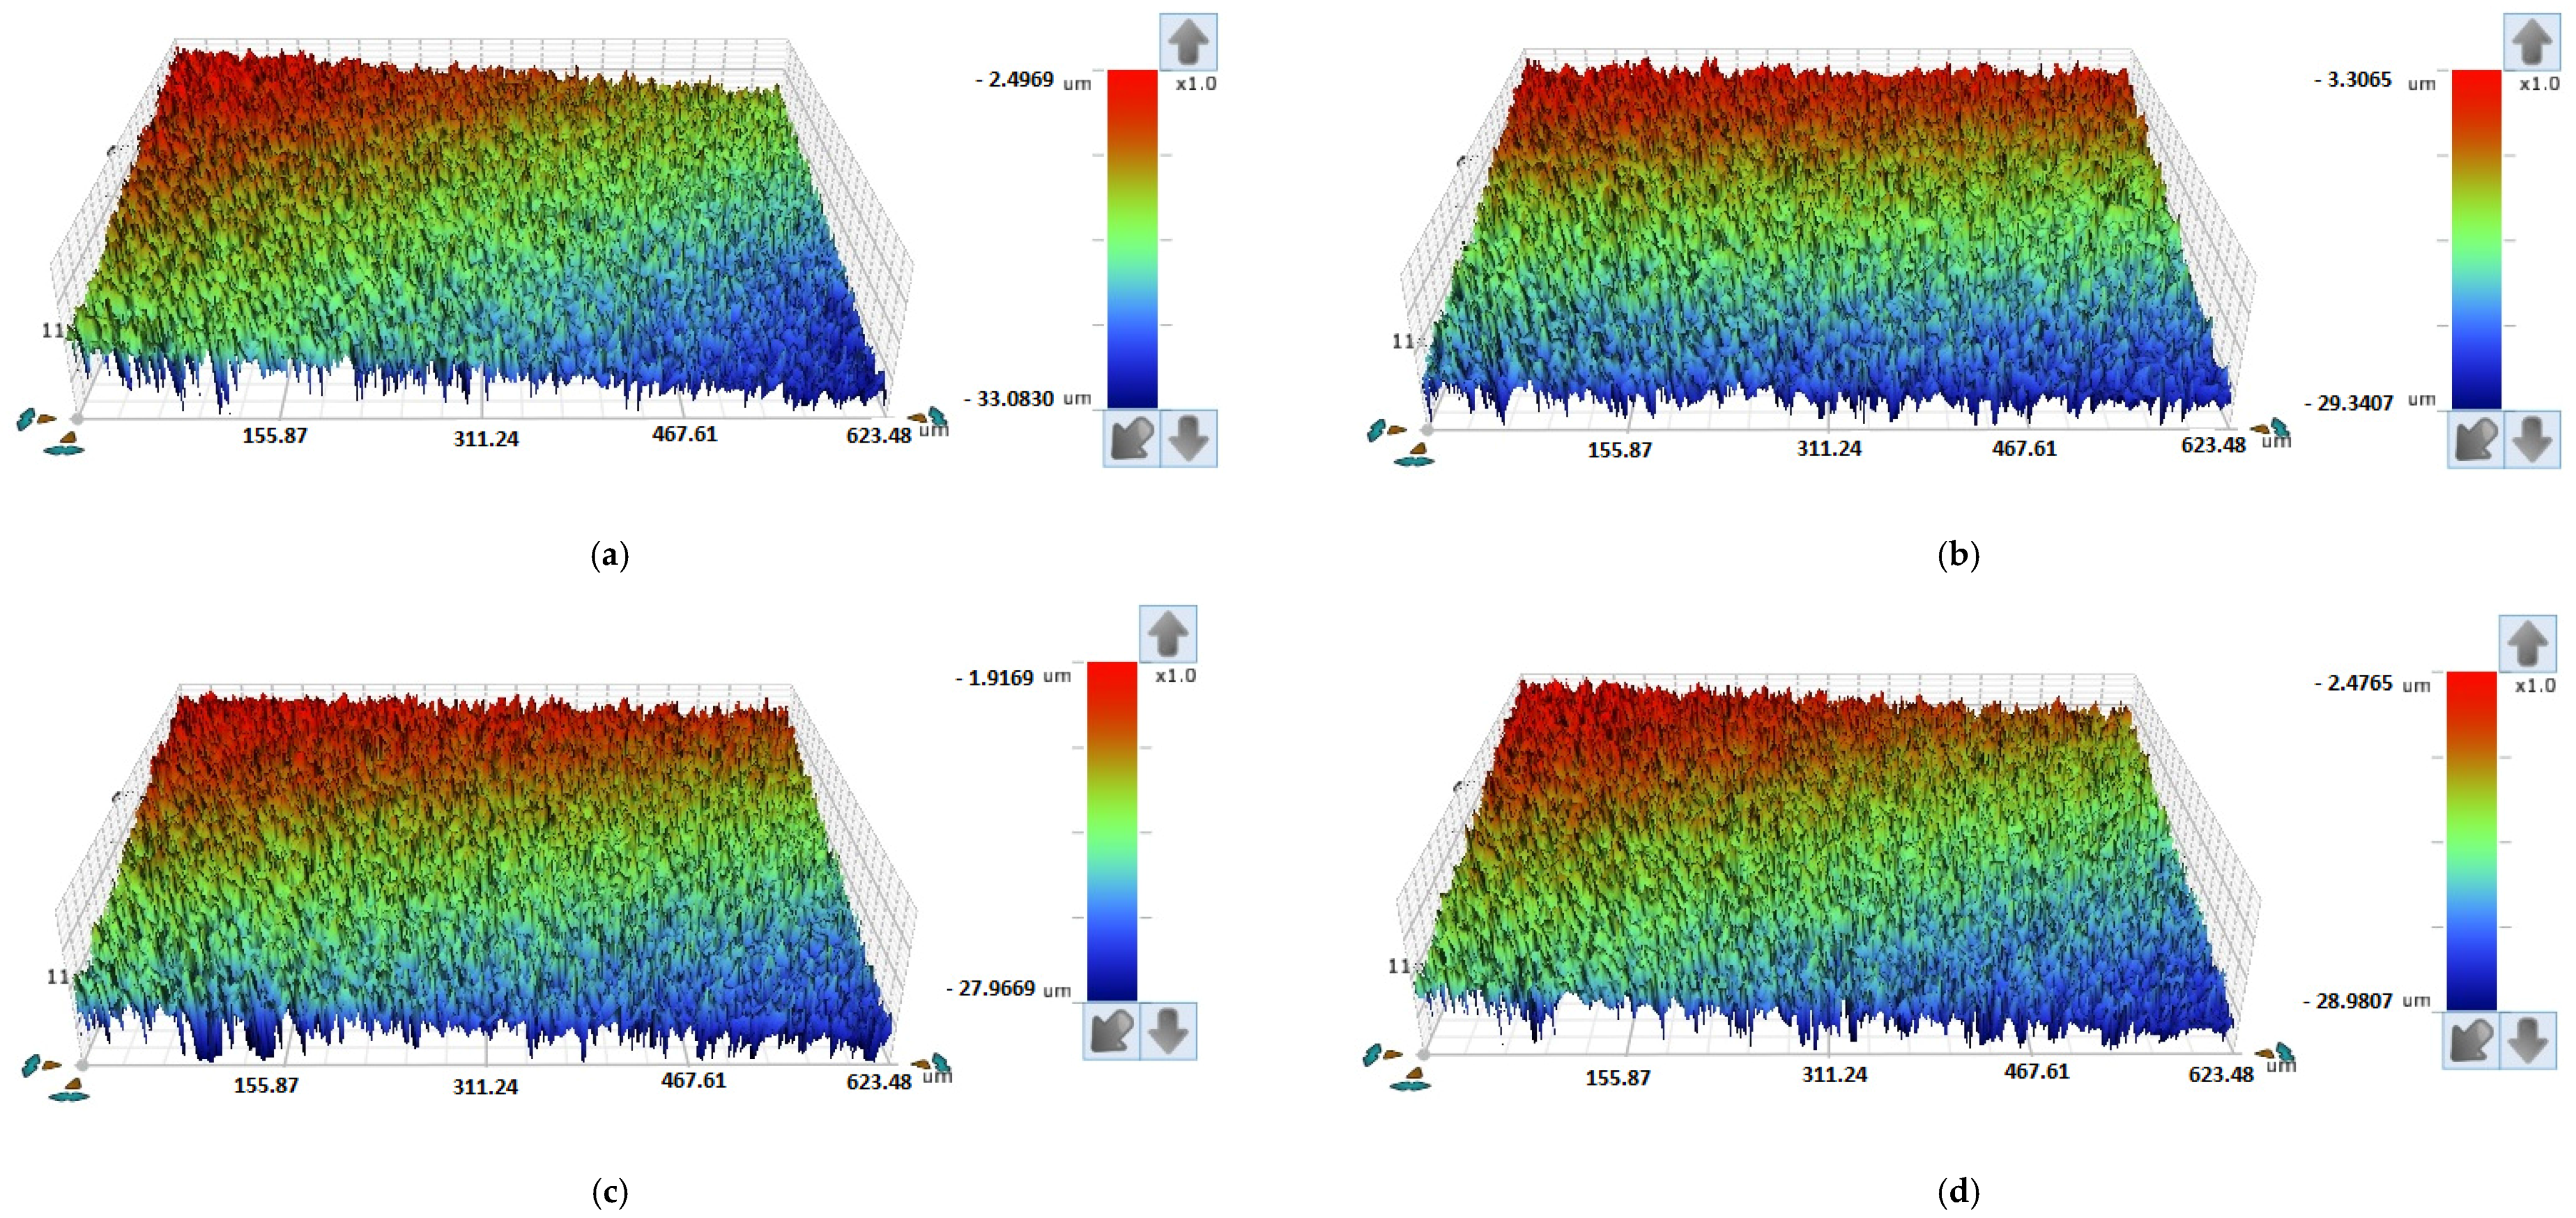
Figure 14, Figure 15, Figure 16 and Figure 17 show the surface texture images (obtained by Bruker profiler, Billerica, MA, USA) of copper samples subjected to four ECAP passes and different E-C conditions. Figure 14 shows the surface texture of annealed copper subjected to corrosion before ECAP. Figure 15a–d reveals the variation of surface texture of eroded copper surface after ECAP passes. Figure 16 presents the surface texture of as-annealed copper samples (before ECAP) subjected to E-C. Figure 17a–d shows the surface texture of copper samples subjected to E-C after four ECAP passes. It is observed that the surface texture enhances with increasing the number of ECAP passes. This can be seen clearly through the red color zones that reduce with increasing ECAP passes. In addition, the combined effect of E-C on surface texture is more profound than the contribution of corrosion only.
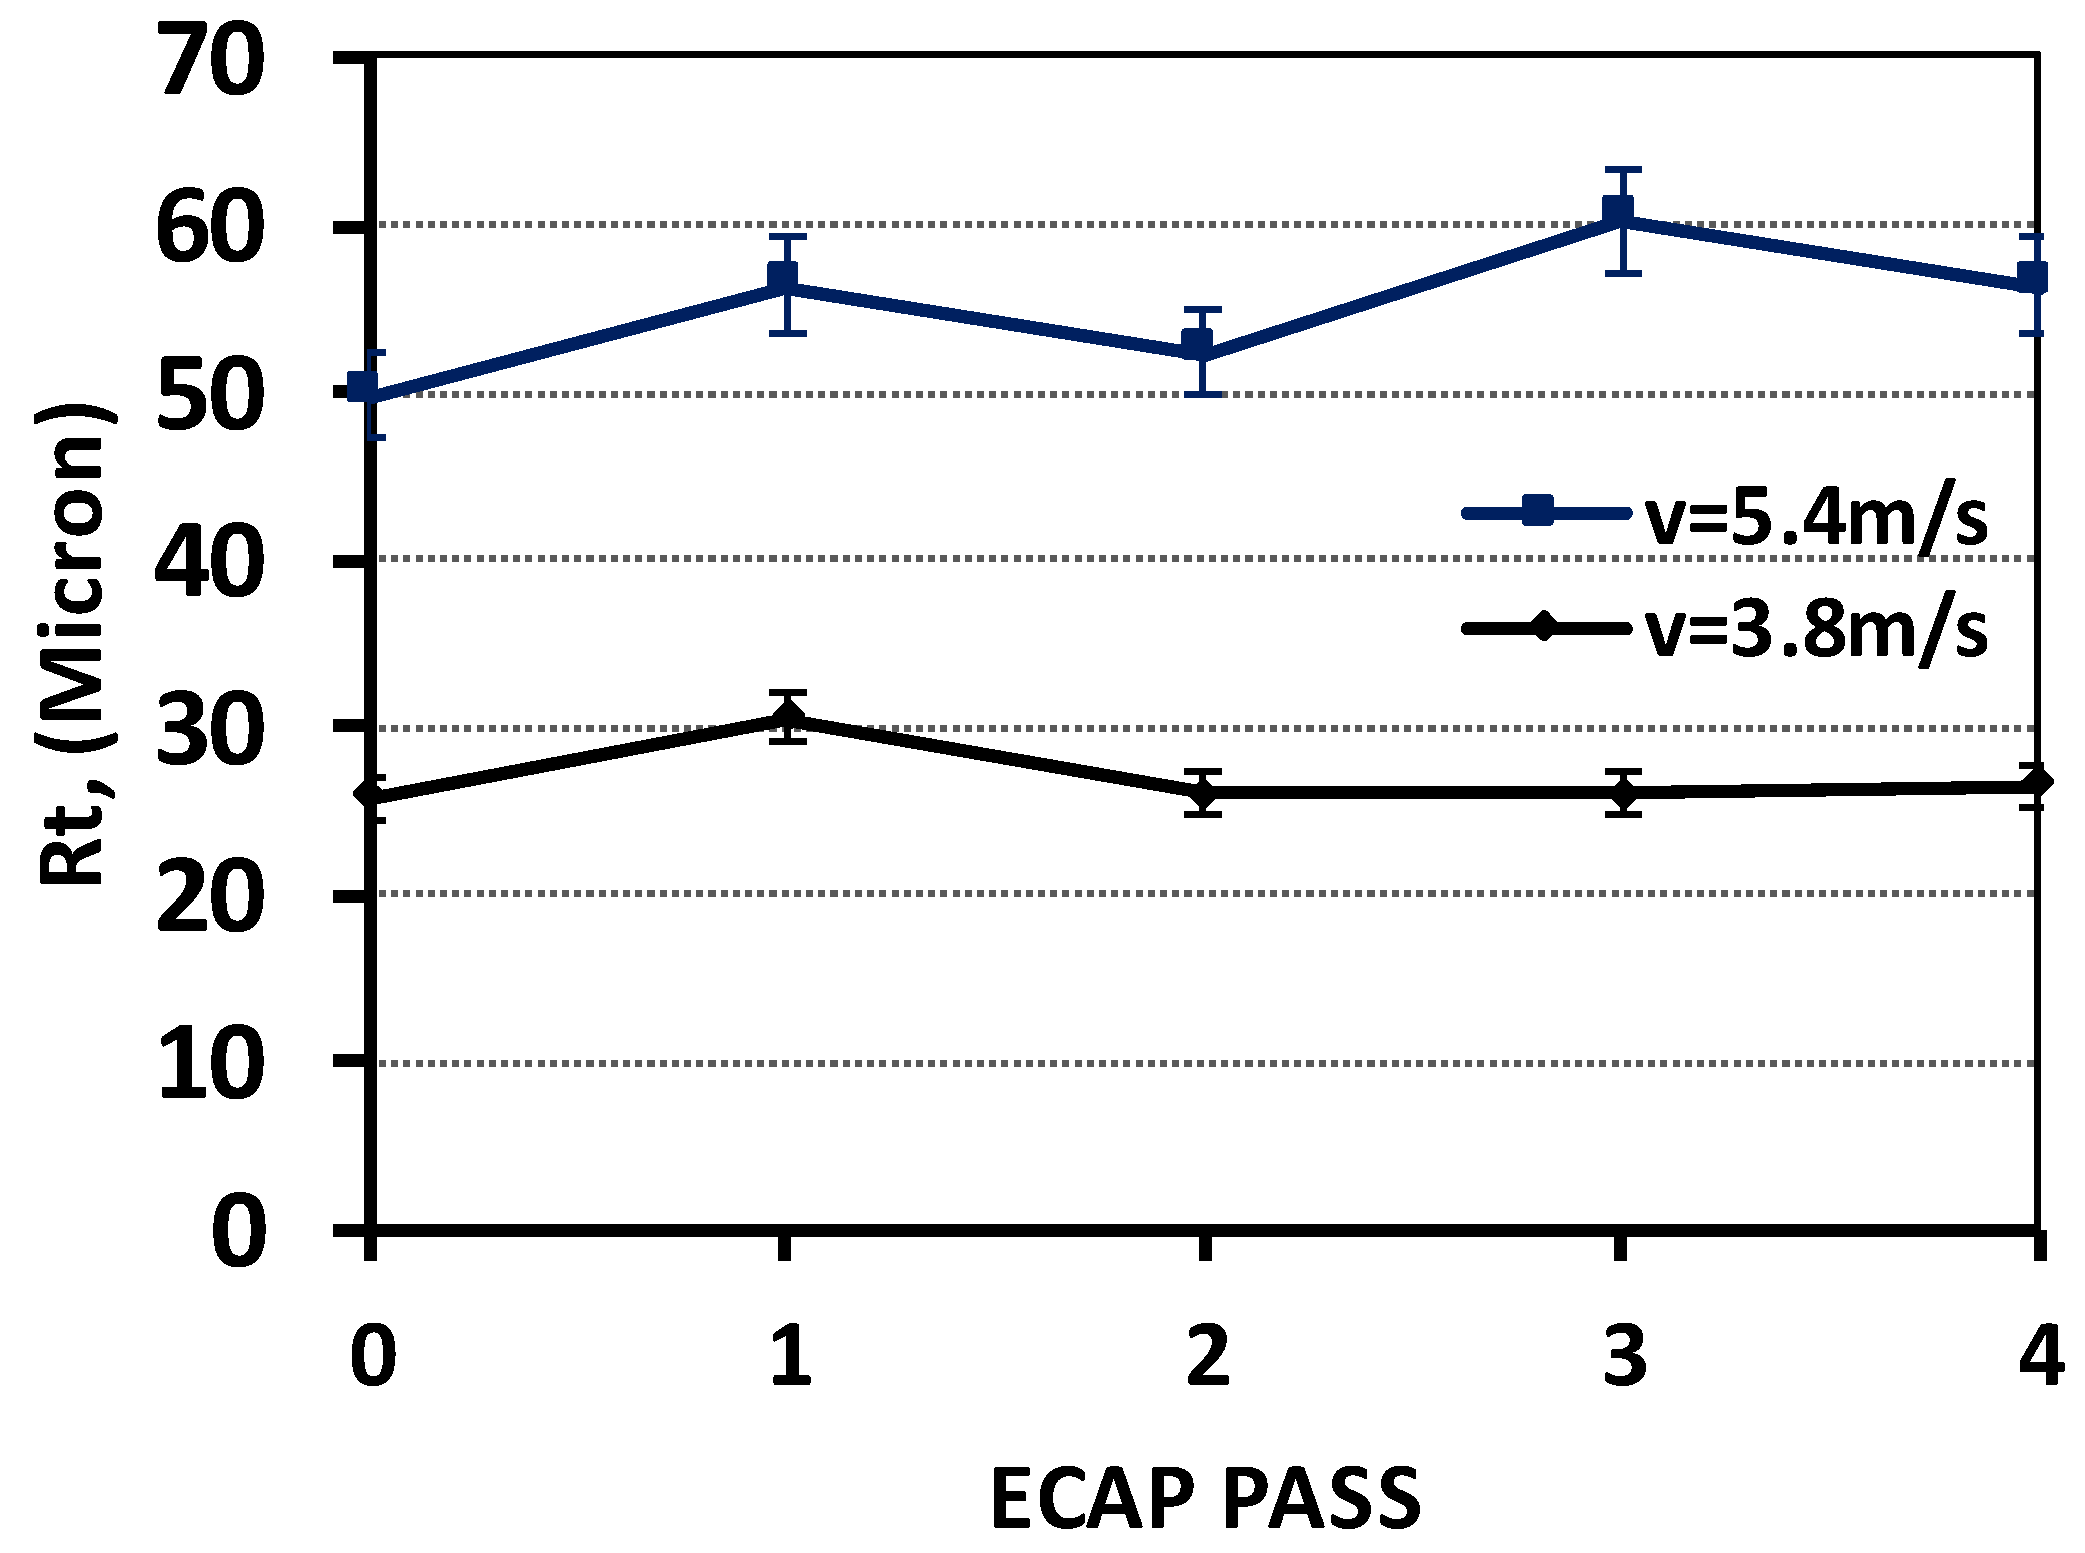
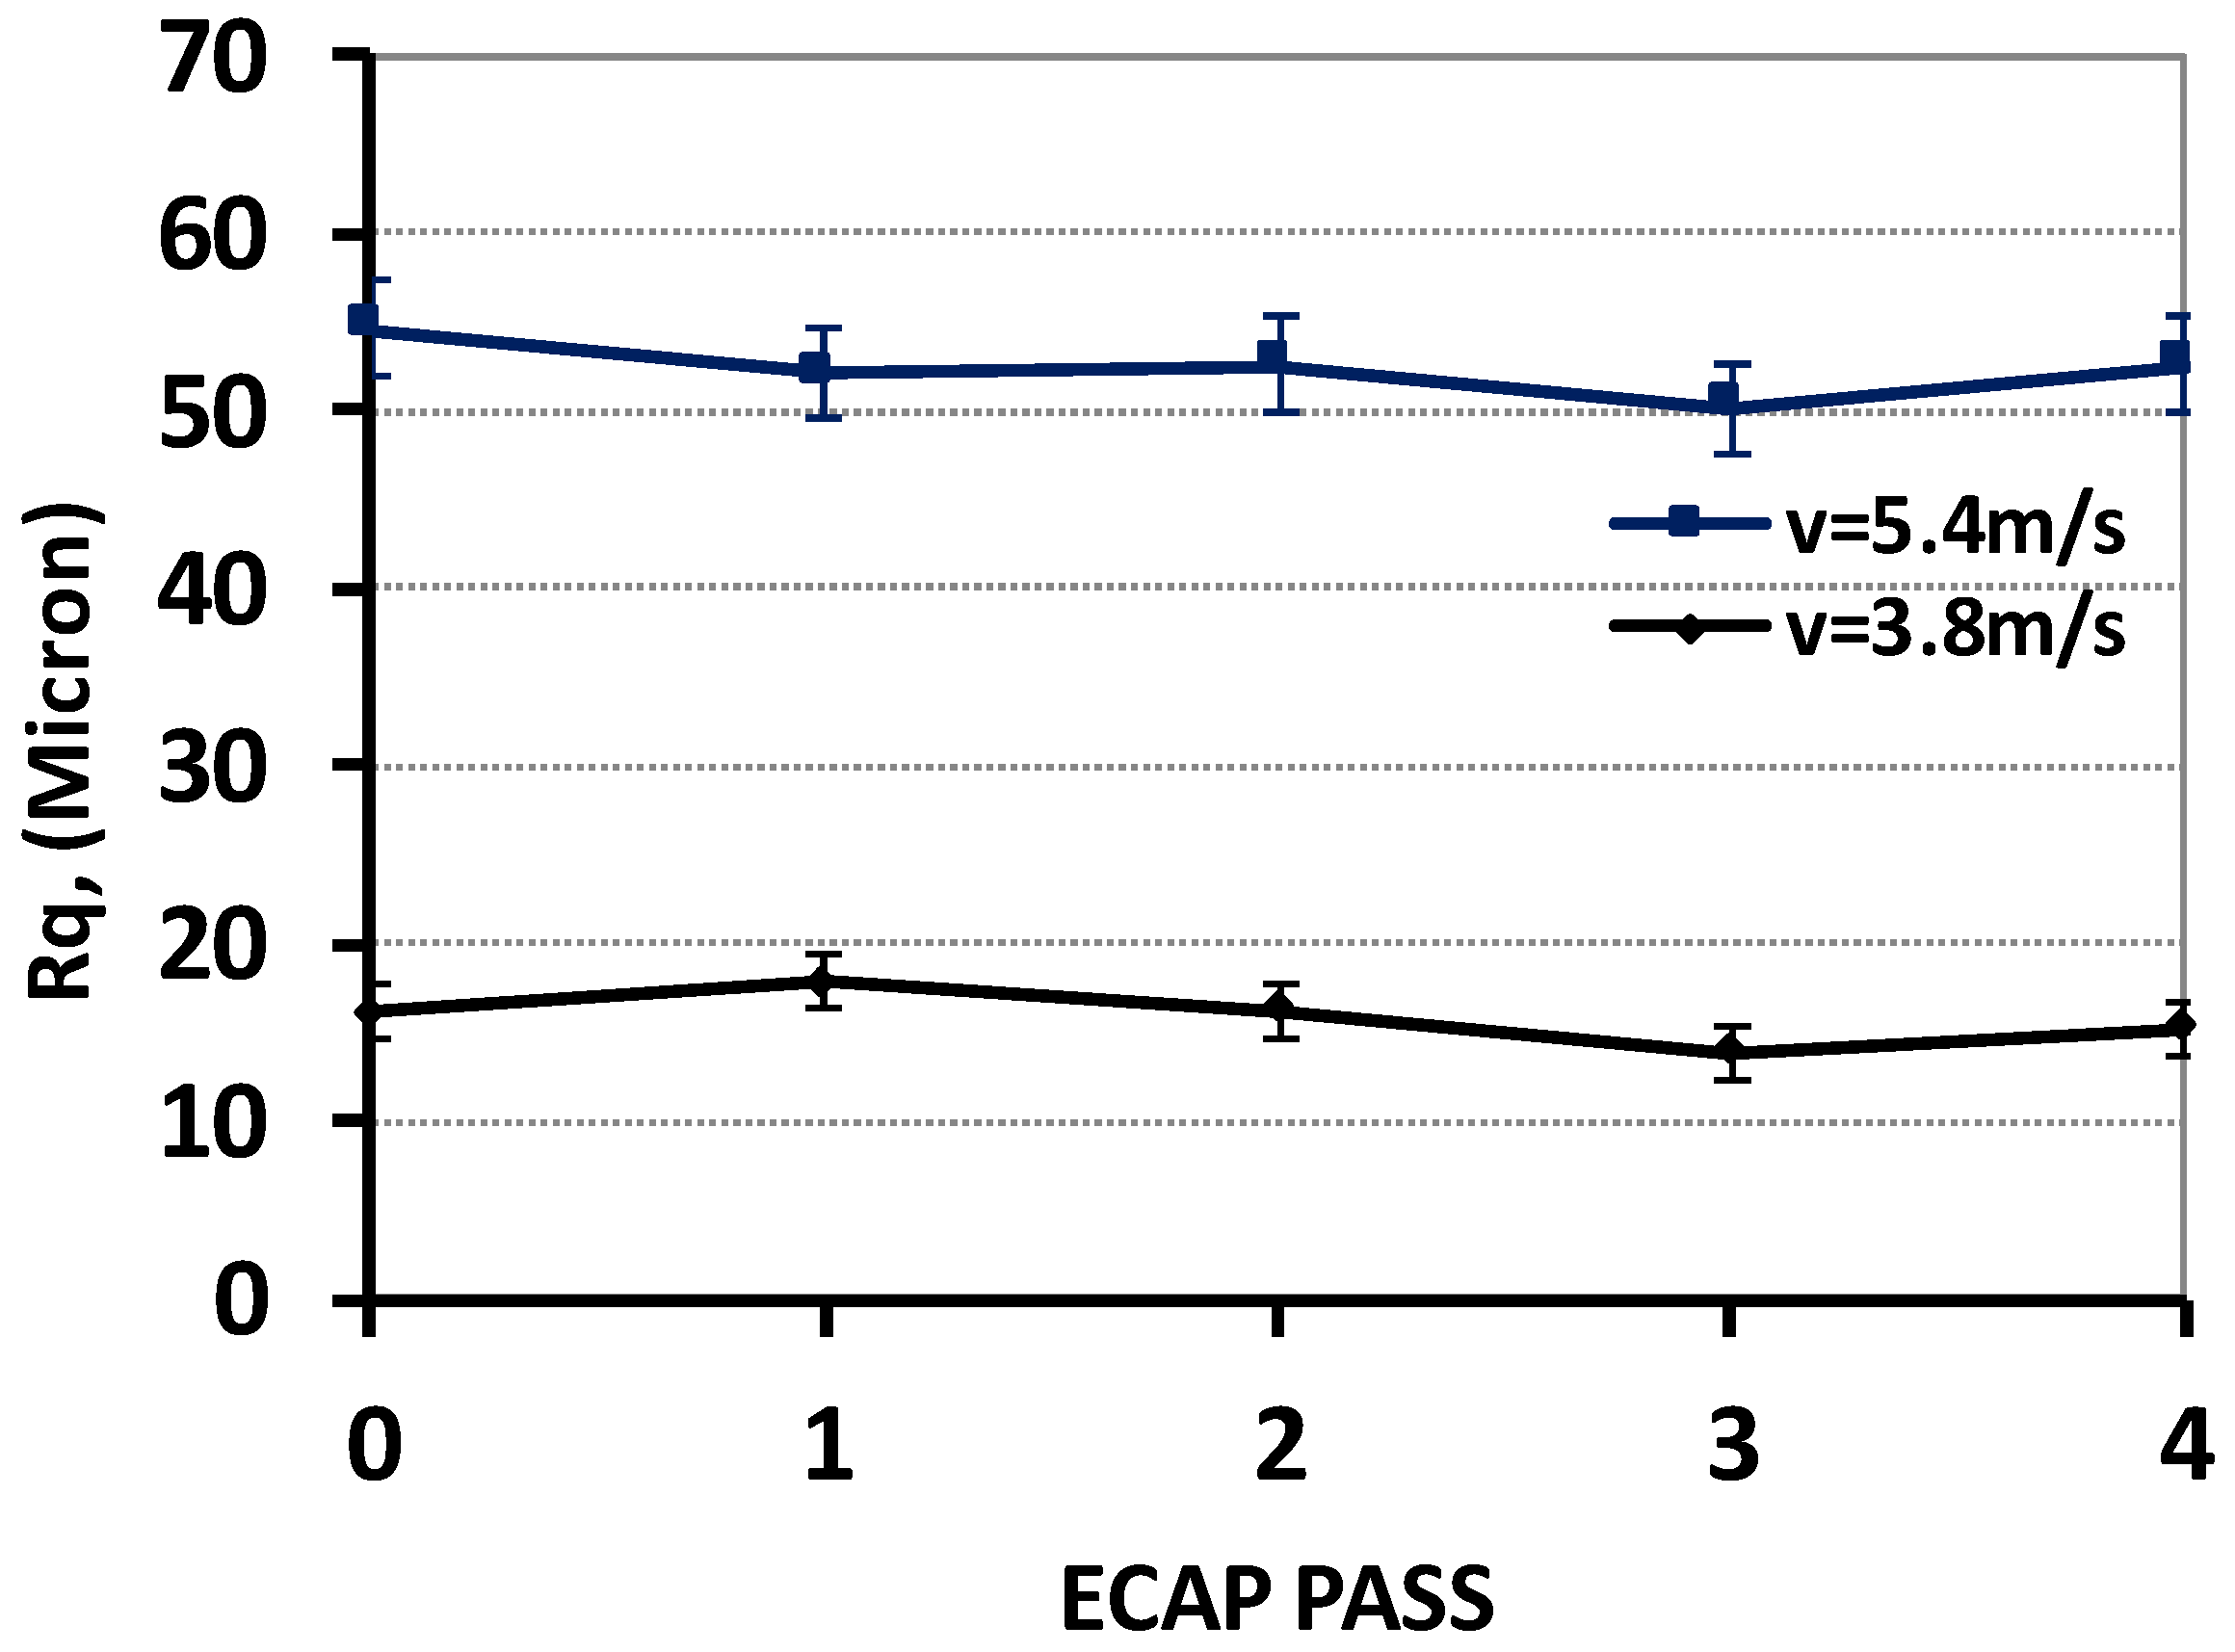
In this part of the research, the surface roughness parameters Ra, Rt, and Rq were studied as a function of ECAP passes at two different slurry velocities; v = 3.8 m/s and 5.4 m/s. Other experimental parameters were kept at constant values of: t = 48 h, impact angle = 45°, and erodent (sand) concentration = 20 wt.%. Figure 18 shows the variation in Ra values with respect to number of ECAP passes. It is noticed that the slurry flow velocity significantly affects the surface roughness parameter Ra. For annealed copper (before ECAP), the Ra value increased from 15.62 µm to 54.34 µm at v = 3.8 m/s and v = 5.4 m/s, respectively.
After four passes of ECAP it is observed that the Ra value decreased by 7.8% and 4.1% with v = 3.8 m/s and 5.4 m/s, respectively. This means that increment of ECAP passes leads to smoother surface. Figure 19 revealed that slurry flow velocity has a considerable effect on the surface roughness parameter Rt. For velocities of 3.8 m/s and 5.4 m/s, the parameter Rt of ECAPed copper increased by 2.6% and 13.25%, respectively, as compared to annealed copper. Figure 20 show that parameters Rq is sensitive to slurry flow velocity, similar behavior to parameter Ra have been observed for parameters Rq along the four passes of ECAP.
4. Conclusions
In this work, experiments were conducted to investigate the effect of ECAP passes on E-C behavior of commercially-pure copper at different parameters. Copper samples were pressed up to four passes by the BC route to obtain the UFG material. The following summary and conclusions can be made from the current work:
- The hardness magnitude of the ECAPed pure Cu is 200% higher than un-ECAP material.
- The impacting velocity has a significant effect on the E-C of copper. The results showed that the E-C rate increases with increasing the slurry velocity. In addition, the work hardening due to ECAP improved the E-C resistance. More damage is observed in the samples that were subjected to higher velocity compared to the lower velocities.
- The impacting angle plays a major role in the E-C behaviors of copper. The highest E-C rates were observed at an impacting angle of 45° in all ECAP passes.
- The ECAP process improved the surface roughness of the E-C copper samples.
- Generally, a 30% rise in resistance to E-C was achieved after four ECAP passes as compared to coarse-grain copper for the parameters studied in this work.
- Generally, severe plastic deformation processing is likely to improve the E-C resistance of all FCC metals and alloys.
Acknowledgments
On behalf of all teamwork of this research, the corresponding author wishes to thank Qassim University for all funding and support required to carry out this research.
Author Contributions
Osama M. Irfan, Faramarz Djavanroodi, and Fahad Al-Mufadi created the idea of this work, and conceived and design the experiments; Osama M. Irfan and Yaser Al-Shataif performed the experiments; Osama M. Irfan, Fahad Al-Mufadi, and Faramarz Djavanroodi analyzed the data and interpreted the results; Osama M. Irfan and Fahad Al-Mufadi contributed materials and tools; and Osama M. Irfan and Faramarz Djavanroodi wrote the paper, and Fahad Al-Mufadi reviewed it.
Conflicts of Interest
The authors declare no conflict of interest.
References
- Maoqiao, X.; Yingchun, Z.; Yun, Z.; Chaofu, W.; Wei, L.; Yonghong, Y. Effects of grain size and porosity on strength of Li2TiO3 tritium breeding pebbles and its grain growth behavior. J. Nucl. Mater. 2016, 482, 163–169. [Google Scholar]
- Azushima, A.; Kopp, R.; Korhonen, A.; Yang, D.Y.; Micari, F.; Lahoti, G.D.; Groche, P.; Yanagimoto, J.; Tsuji, N.; Rosochowski, A.; et al. Severe plastic deformation (SPD) processes for metals. CIRP Ann. Manuf. Technol. 2008, 57, 716–735. [Google Scholar] [CrossRef]
- Aliofkhazraei, M.; Ravisankar, B. Handbook of Mechanical Nano Structuring; Wiley-VCH: Weinheim, Germany, 2015; ISBN 978-3-527-33506-0. [Google Scholar]
- Ebrahimi, M.; Djavanroodi, F.; Nazari Tiji, S.; Gholipour, H.; Gode, C. Experimental Investigation of the Equal Channel Forward Extrusion Process. Metals 2015, 5, 471–483. [Google Scholar] [CrossRef]
- Shaeri, M.H.; Salehi, M.T.; Seyyedein, S.H.; Djavanroodi, F. Microstructure and texture evolution of Al-7075 alloy processed by equal channel angular pressing. Trans. Nonferrous Met. Soc. China 2015, 25, 1367–1375. [Google Scholar] [CrossRef]
- Djavanroodi, F.; Zolfaghari, A.A.; Ebrahimi, M.; Nikbin, K. Route effect on equal channel angular pressing of copper tube. Acta Metall. Sin. Engl. Lett. 2014, 27, 95–100. [Google Scholar] [CrossRef]
- Li, J.H.; Yu, Z.J.; Zhang, L.P. Effect of Channel Inner Angle on Aluminum ECAP Plastic Deformation. Appl. Mech. Mater. 2014, 442, 27–31. [Google Scholar] [CrossRef]
- Djavanroodi, F.; Omranpour, B.; Sedighi, M. Artificial neural network modeling of ECAP process. Mater. Manuf. Process. 2011, 28, 276–281. [Google Scholar] [CrossRef]
- Valiev, R. Nano structuring of metals by severe plastic deformation for advanced properties. Nat. Mater. 2004, 3, 511–516. [Google Scholar] [CrossRef] [PubMed]
- Osama, M.I.; Saad, M.S.; Mukras, F.A.; Al-Mufadi, F.D. Surface Modelling of Nanostructured Copper Subjected to Erosion-Corrosion. Metals 2017, 7, 155. [Google Scholar] [CrossRef]
- Sabirov, I.; Murashkin, M.Y.; Valiev, R.Z. Nanostructured aluminum alloys produced by severe plastic deformation: New horizons in development. Mater. Sci. Eng. A 2013, 560, 1–24. [Google Scholar] [CrossRef]
- Wei, K.X.; Wei, W.; Wang, F.; Du, Q.B.; Alexandrov, I.V.; Hu, J. Microstructure, mechanical properties and electrical conductivity of industrial Cu-0.5% Cr alloy processed by severe plastic deformation. Mater. Sci. Eng. A 2011, 528, 1478–1484. [Google Scholar] [CrossRef]
- Ma, A.; Zhu, C.; Chen, J.; Jiang, J.; Song, D.; Ni, S.; He, Q. Grain Refinement and High-Performance of Equal-Channel Angular Pressed Cu-Mg Alloy for Electrical Contact Wire. Metals 2014, 4, 586–596. [Google Scholar] [CrossRef]
- Shokuhfar, A.; Nejadseyfi, O. A comparison of the effects of severe plastic deformation and heat treatment on the tensile properties and impact toughness of aluminum alloy 6061. Mater. Sci. Eng. A 2014, 594, 140–148. [Google Scholar] [CrossRef]
- Al-Mufadi, F.; Djavanroodi, F. Effect of Equal Channel Angular Pressing Process on Impact Property of Pure Copper. Int. J. Chem. Nucl. Mater. Metall. Eng. 2014, 8, 30–34. [Google Scholar]
- Al-Mufadi, F.; Djavanroodi, F. Equal-Channel Angular Pressing of Thin-Walled Copper Tube. Arab. J. Sci. Eng. 2015, 40, 2785–2794. [Google Scholar] [CrossRef]
- Wang, Y.; Lapovok, R.; Wang, J.T.; Estrin, Y. Effect of back pressure on the thermal stability of severely deformed copper. Mater. Sci. Eng. 2015, 628, 21–29. [Google Scholar] [CrossRef]
- Zhao, Y.; Zhou, F.; Yao, J.; Dong, S.; Li, N. Erosion–corrosion behavior and corrosion resistance of AISI 316 stainless steel in flow jet impingement. Wear 2015, 328–329, 464–474. [Google Scholar] [CrossRef]
- Paulraj, P.; Garg, R. Effect of intermetallic phases on corrosion behavior and mechanical properties of duplex stainless steel and super-duplex stainless steel. Adv. Sci. Technol. Res. J. 2015, 9, 87–105. [Google Scholar] [CrossRef]
- Abouel-Kasem, A.; Abd-elrhman, Y.M.; Emara, K.M.; Ahmed, S.M. Design and performance of slurry erosion tester. J. Tribol. 2010, 132, 1–10. [Google Scholar] [CrossRef]
- Barik, R.C.; Wharton, J.A.; Wood, R.J.K.; Tan, K.S.; Stokes, K.R. Erosion and erosion-corrosion performance of cast and thermally sprayed nickel–aluminum bronze. Wear 2005, 259, 230–242. [Google Scholar] [CrossRef]
- ASTM G119-09. In Standard Guide for Determining Synergism Between Wear and Corrosion; ASTM International: West Conshohocken, PA, USA, 2009.
- Azarian, N.S.; Ghasemi, H.M.; Monshi, M.R. Synergistic Erosion and Corrosion Behavior of AA5052 Aluminum Alloy in 3.5 wt% NaCl Solution under Various Impingement Angles. J. Bio Tribo Corros. 2015, 1, 10. [Google Scholar] [CrossRef]
- Wang, S.-H.; Jiang, J.; Stack, M.M. Methodology Development for Investigation of Slurry Abrasion Corrosion by Integrating an Electrochemical Cell to a Miller Tester. J. Bio Tribo Corros. 2015, 1, 9. [Google Scholar] [CrossRef] [Green Version]
- Irfan, O.M. Erosion-corrosion behavior of nano-structured pure copper under different flowing velocities. Int. J. Mech. Mech. Eng. 2015, 15, 48–52. [Google Scholar]
- Hassani, S.; Roberts, K.P.; Shirazi, S.A.; Shadley, J.R.; Rybicki, E.F.; Joia, C. Characterization and prediction of chemical inhibition performance for erosion-corrosion conditions in sweet oil and gas production. Corrosion 2012, 68, 885–896. [Google Scholar] [CrossRef]
- Ranjbar, M.; Ghasemi, H.M.; Abedini, M. Effect of Impact Angle on the Erosion–Corrosion Behavior of AISI 420 Stainless Steel in 3.5 wt.% NaCl Solution. J. Tribol. 2015, 137, 3. [Google Scholar] [CrossRef]
- Tian, B.R.; Cheng, Y.F. Electrolytic deposition of Ni-Co-Al2O3 composite coating on pipe steel for corrosion/erosion resistance in oil sand slurry. Electrochim. Acta 2007, 53, 511–517. [Google Scholar] [CrossRef]
- Islam, M.A.; Farhat, Z.N. Mechanical and electrochemical synergism of API X42 pipeline steel during erosion-corrosion. J. Bio Tribo Corros. 2015, 1, 26. [Google Scholar] [CrossRef]
- Buszko, M.H.; Krella, A.K. Slurry Erosion—Design of Test Devices. Adv. Mater. Sci. 2017, 17, 5–17. [Google Scholar] [CrossRef]
- Wang, Q.-Y.; Bai, S.-L.; Liu, Z.-D. Study on Cavitation Erosion–Corrosion Behavior of Mild Steel under Synergistic Vibration Generated by Ultrasonic Excitation. Tribol. Lett. 2014, 57, 603–612. [Google Scholar] [CrossRef]
- Malik, J.; Toor, I.H.; Ahmed, W.H.; Gasem, Z.M.; Habib, M.A.; Ben-Mansour, R.; Badr, H.M. Investigations on the Corrosion-Enhanced Erosion Behavior of Carbon Steel AISI 1020. Int. J. Electrochem. Sci. 2014, 9, 6765–6780. [Google Scholar]
- Erfan, O.; Abo El-Nasr, A.-B.A.; Al-mufadi, F. Erosion-corrosion behavior of AA 6066 aluminum alloy. IJME 2014, 3, 15–24. [Google Scholar]
- Sakamoto, A.; Yamasaki, T.; Matsumura, M. Erosion-corrosion tests on copper alloys for water tap use. Wear 1995, 186–187, 548–554. [Google Scholar] [CrossRef]
- ASTM E92–04. In ASTM Hardness Standards Reference Guide; ASTM International: West Conshohocken, PA, USA, 2011.
- Al-Bukhaiti, M.A.; Ahmed, S.M.; Badran, F.M.F.; Emara, K.M. Effect of impingement angle on slurry erosion behaviour and mechanisms of 1017 steel and high-chromium white cast iron. Wear 2007, 262, 1187–1198. [Google Scholar] [CrossRef]
- McIClark, H. A comparison of particle impact in gas-solid and liquid-solid erosion. Wear 1995, 186–187, 465–472. [Google Scholar]
- Das, S.; Saraswathi, Y.L.; Mondal, D.P. Erosive-corrosive wear of aluminum alloy composites: Influence of slurry composition and speed. Wear 2006, 261, 180–190. [Google Scholar] [CrossRef]
- Shitole, P.P.; Gawande, S.H.; Desale, G.R.; Nandre, B.D. Effect of Impacting Particle Kinetic Energy on Slurry Erosion. Wear 2015, 1, 29. [Google Scholar] [CrossRef]
- Rajahram, S.S.; Harvey, T.J.; Wood, R.J.K. Evaluation of a semi-empirical model in predicting erosion–corrosion. Wear 2009, 267, 244–254. [Google Scholar] [CrossRef]
- Jiang, J.; Zhang, F.; Ma, A.; Song, D.; Chen, J.; Liu, H.; Qiang, M. Biodegradable Behaviors of Ultrafine-Grained ZE41A Magnesium Alloy in DMEM Solution. Metals 2016, 6, 3. [Google Scholar] [CrossRef]
- Divakar, M.; Agarwal, V.K.; Singh, S.N. Effect of the material surface hardness on the erosion of AISI316. Wear 2005, 259, 110–117. [Google Scholar] [CrossRef]
- Dular, M.; Osterman, A. Pit clustering in cavitation erosion. Wear 2008, 265, 811–820. [Google Scholar] [CrossRef]
- Sansui, K.O.; Oliver, G.J. Effects of grain size on mechanical properties of nanostructured copper alloy by severe plastic deformation (SPD) process. J. Eng. Des. Technol. 2009, 7, 335–341. [Google Scholar] [CrossRef]
Figure 1.
Illustration of terminology and grain size ranges for Ultrafine-grained (UFG) and Nanostructured (NS) materials [2].
Figure 1.
Illustration of terminology and grain size ranges for Ultrafine-grained (UFG) and Nanostructured (NS) materials [2].
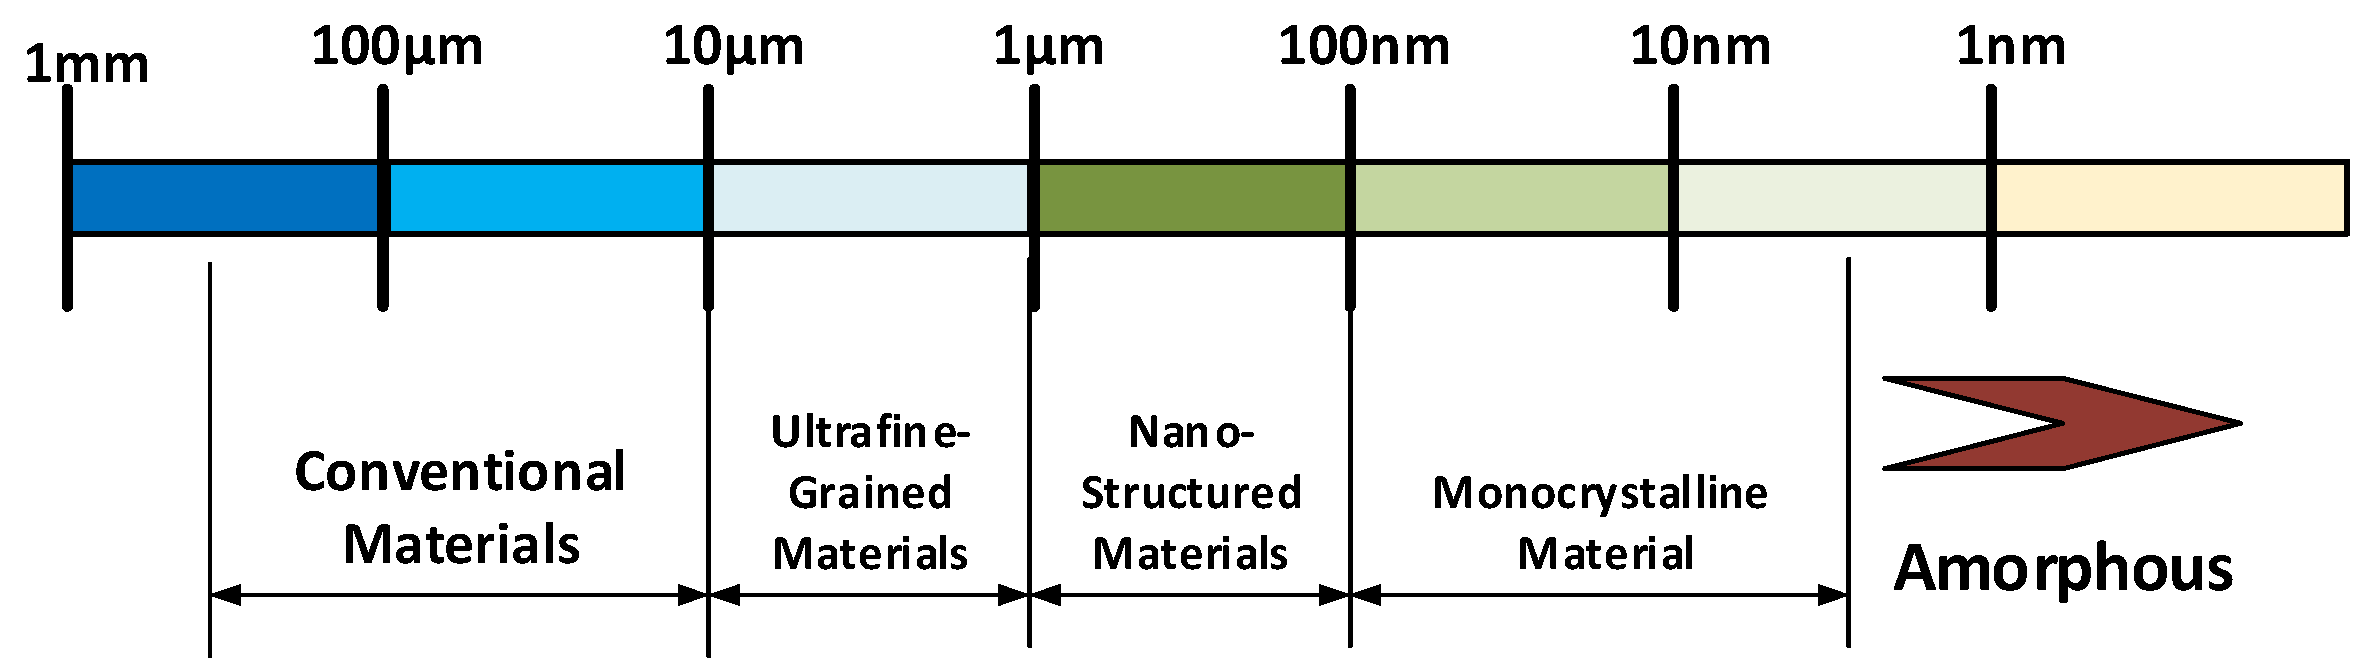
Figure 2.
Setup of equal channel angular pressing (ECAP). (a) Schematic of ECAP process; and (b) two halves of die and sample after ECAP.
Figure 2.
Setup of equal channel angular pressing (ECAP). (a) Schematic of ECAP process; and (b) two halves of die and sample after ECAP.

Figure 3.
Positioning of erosion-corrosion (E-C) samples on the disc.

Figure 4.
Microstructure of coarse grained copper (before ECAP) and ultrafine grain copper (after four passes) [9]. (a) Optical microscope image; and (b) Scanning electron microscope (SEM) image.
Figure 4.
Microstructure of coarse grained copper (before ECAP) and ultrafine grain copper (after four passes) [9]. (a) Optical microscope image; and (b) Scanning electron microscope (SEM) image.

Figure 5.
Hardness measurement along cross section versus ECAP passes at different E-C velocities (t = 48 h, impacting angle = 45°, 3.5% NaCl, and sand concentration = 20 wt%).
Figure 5.
Hardness measurement along cross section versus ECAP passes at different E-C velocities (t = 48 h, impacting angle = 45°, 3.5% NaCl, and sand concentration = 20 wt%).
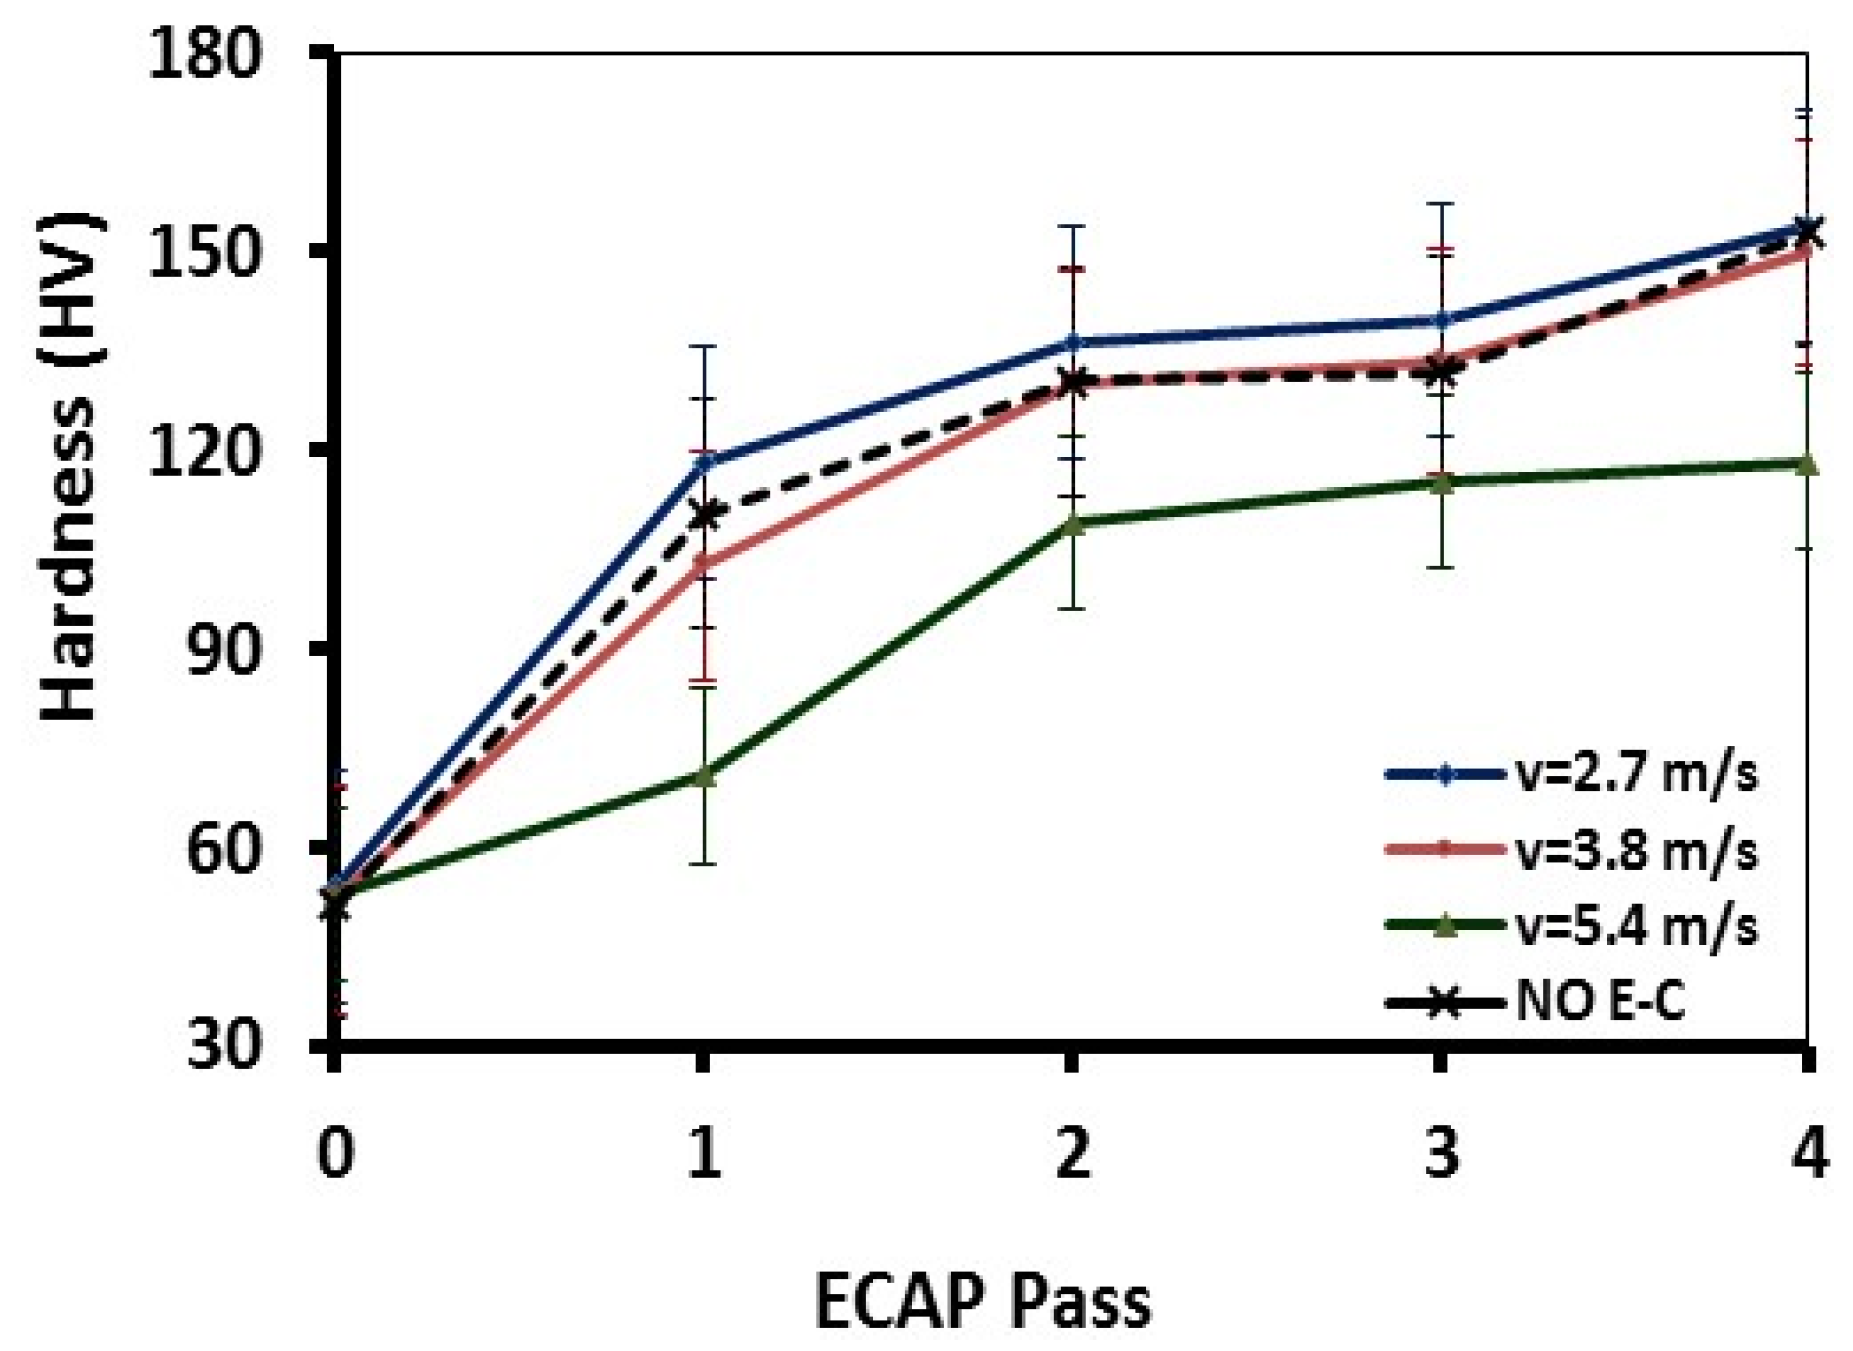
Figure 6.
Variation of weight loss with ECAP passes at different times. (v = 3.8 m/s, impacting angle = 45°, 3.5% NaCl, and sand concentration = 20 wt%).
Figure 6.
Variation of weight loss with ECAP passes at different times. (v = 3.8 m/s, impacting angle = 45°, 3.5% NaCl, and sand concentration = 20 wt%).

Figure 7.
Variation of weight loss with ECAP passes at different velocities. (t = 48 h, impacting angle = 45°, 3.5% NaCl, and sand concentration = 20 wt.%).
Figure 7.
Variation of weight loss with ECAP passes at different velocities. (t = 48 h, impacting angle = 45°, 3.5% NaCl, and sand concentration = 20 wt.%).
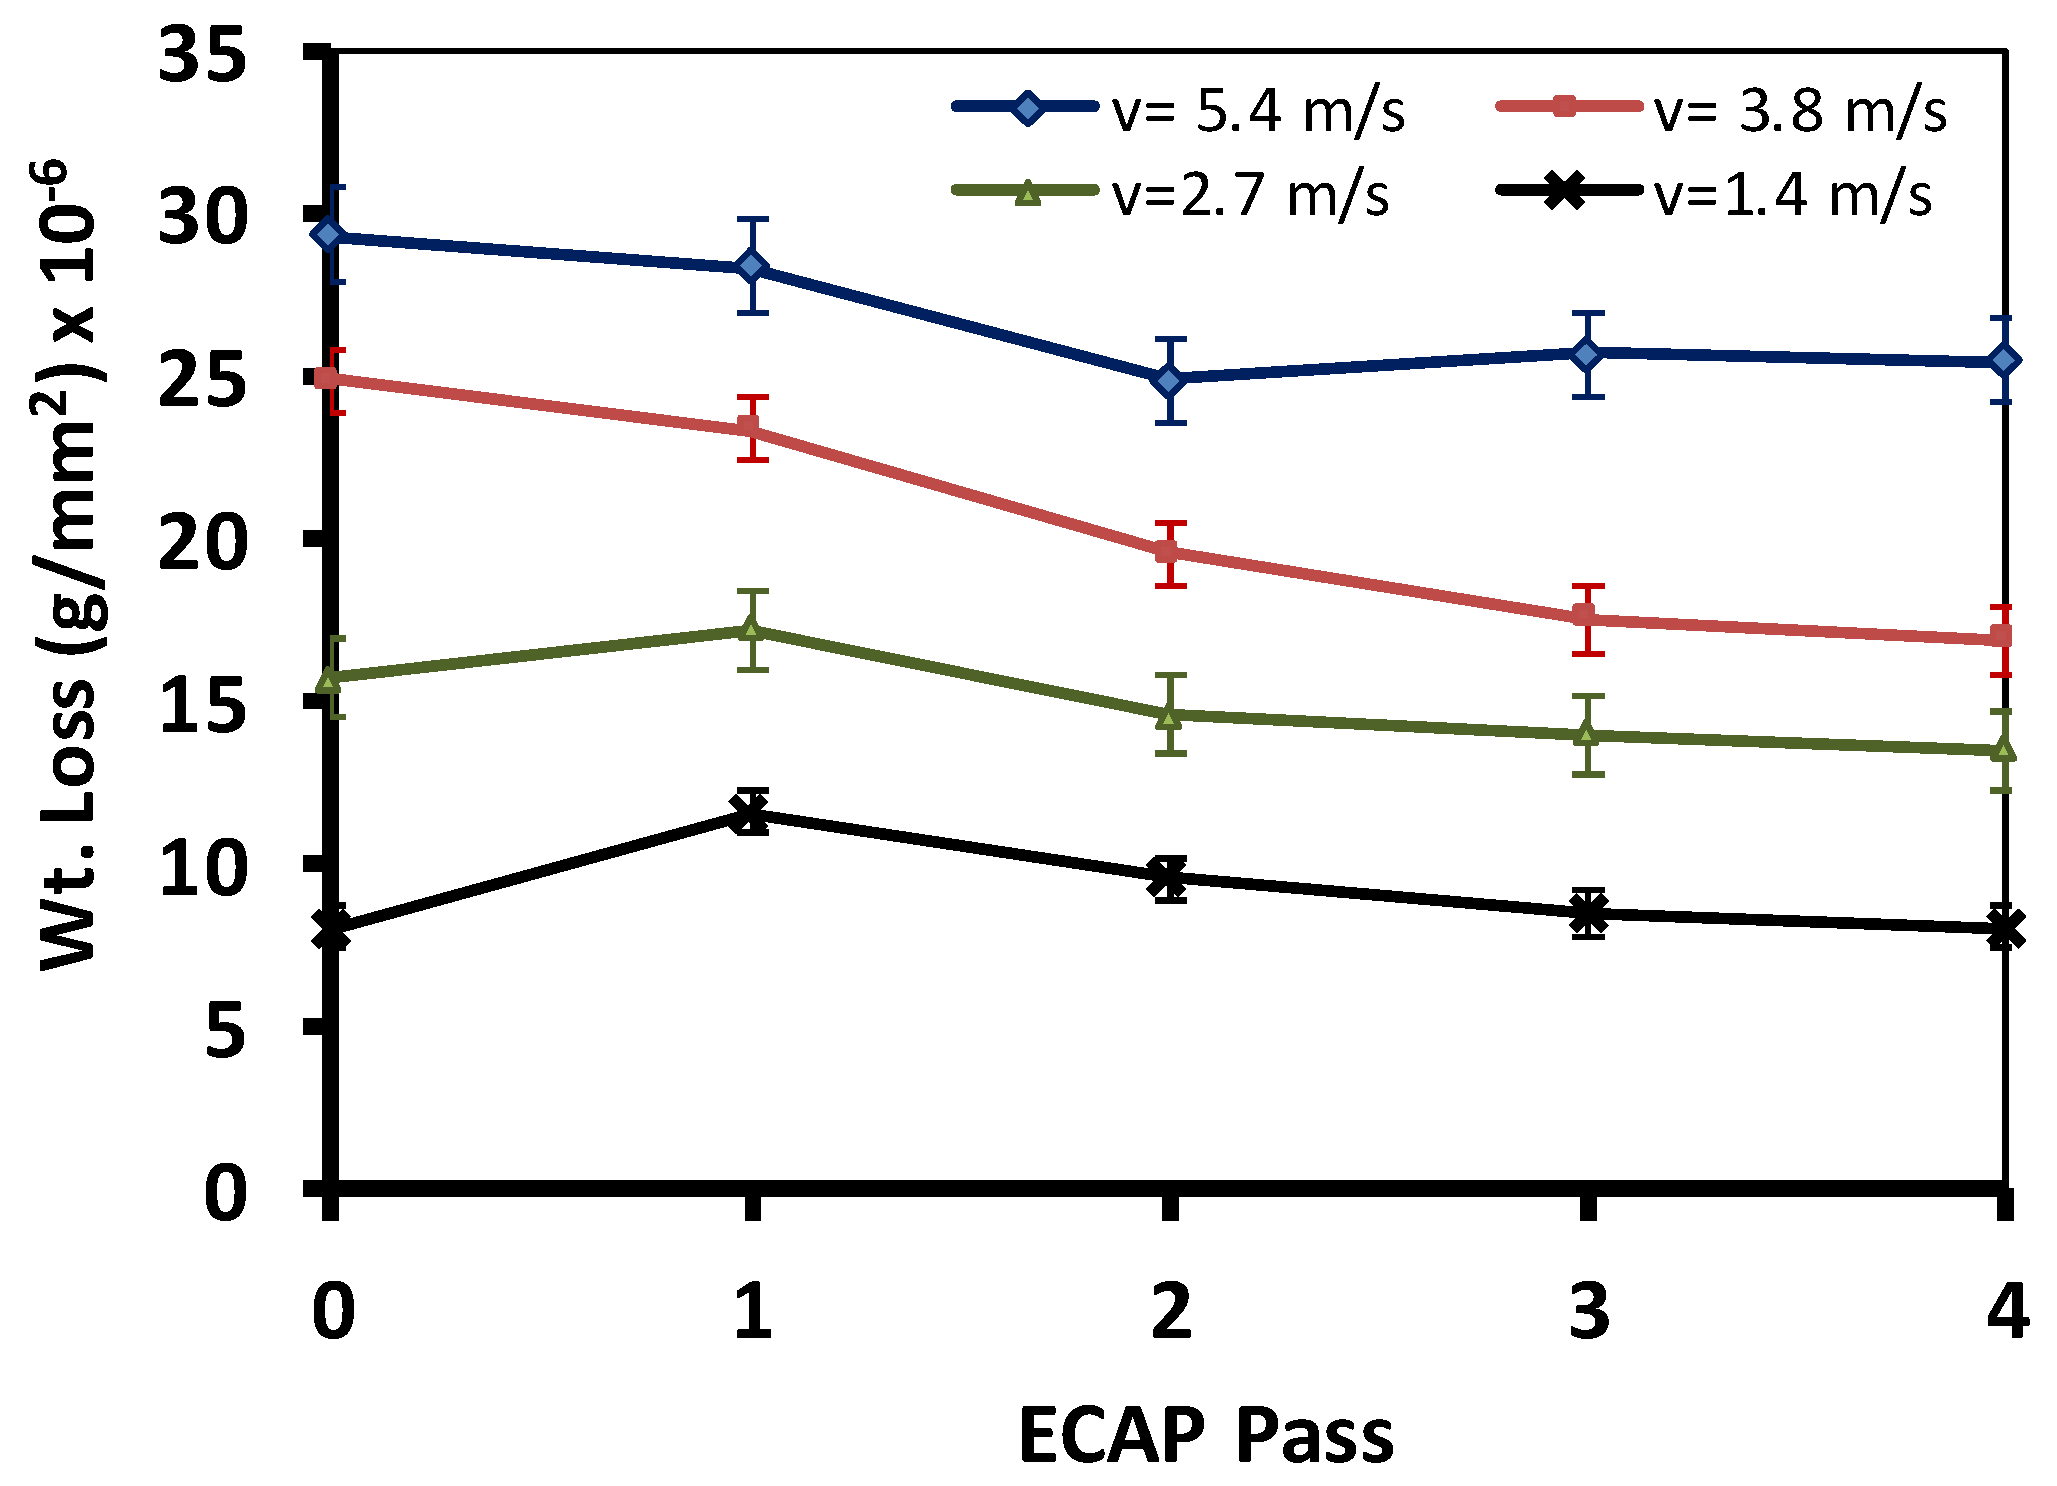
Figure 8.
Variation of weight loss with ECAP passes at different impacting angles (v = 3.8 m/s, 3.5% NaCl, and sand concentration = 20 wt.%).
Figure 8.
Variation of weight loss with ECAP passes at different impacting angles (v = 3.8 m/s, 3.5% NaCl, and sand concentration = 20 wt.%).

Figure 9.
Hardness measurements versus ECAP passes at different impacting angles (v = 3.8 m/s, 3.5% NaCl, and sand concentration = 20 wt.%).
Figure 9.
Hardness measurements versus ECAP passes at different impacting angles (v = 3.8 m/s, 3.5% NaCl, and sand concentration = 20 wt.%).

Figure 10.
Schematic diagrams showing the effect of impact angle on formation of surface plastic deformation. (a) 90°; (b) oblique angle cutting; and (c) shallower impact angle.
Figure 10.
Schematic diagrams showing the effect of impact angle on formation of surface plastic deformation. (a) 90°; (b) oblique angle cutting; and (c) shallower impact angle.
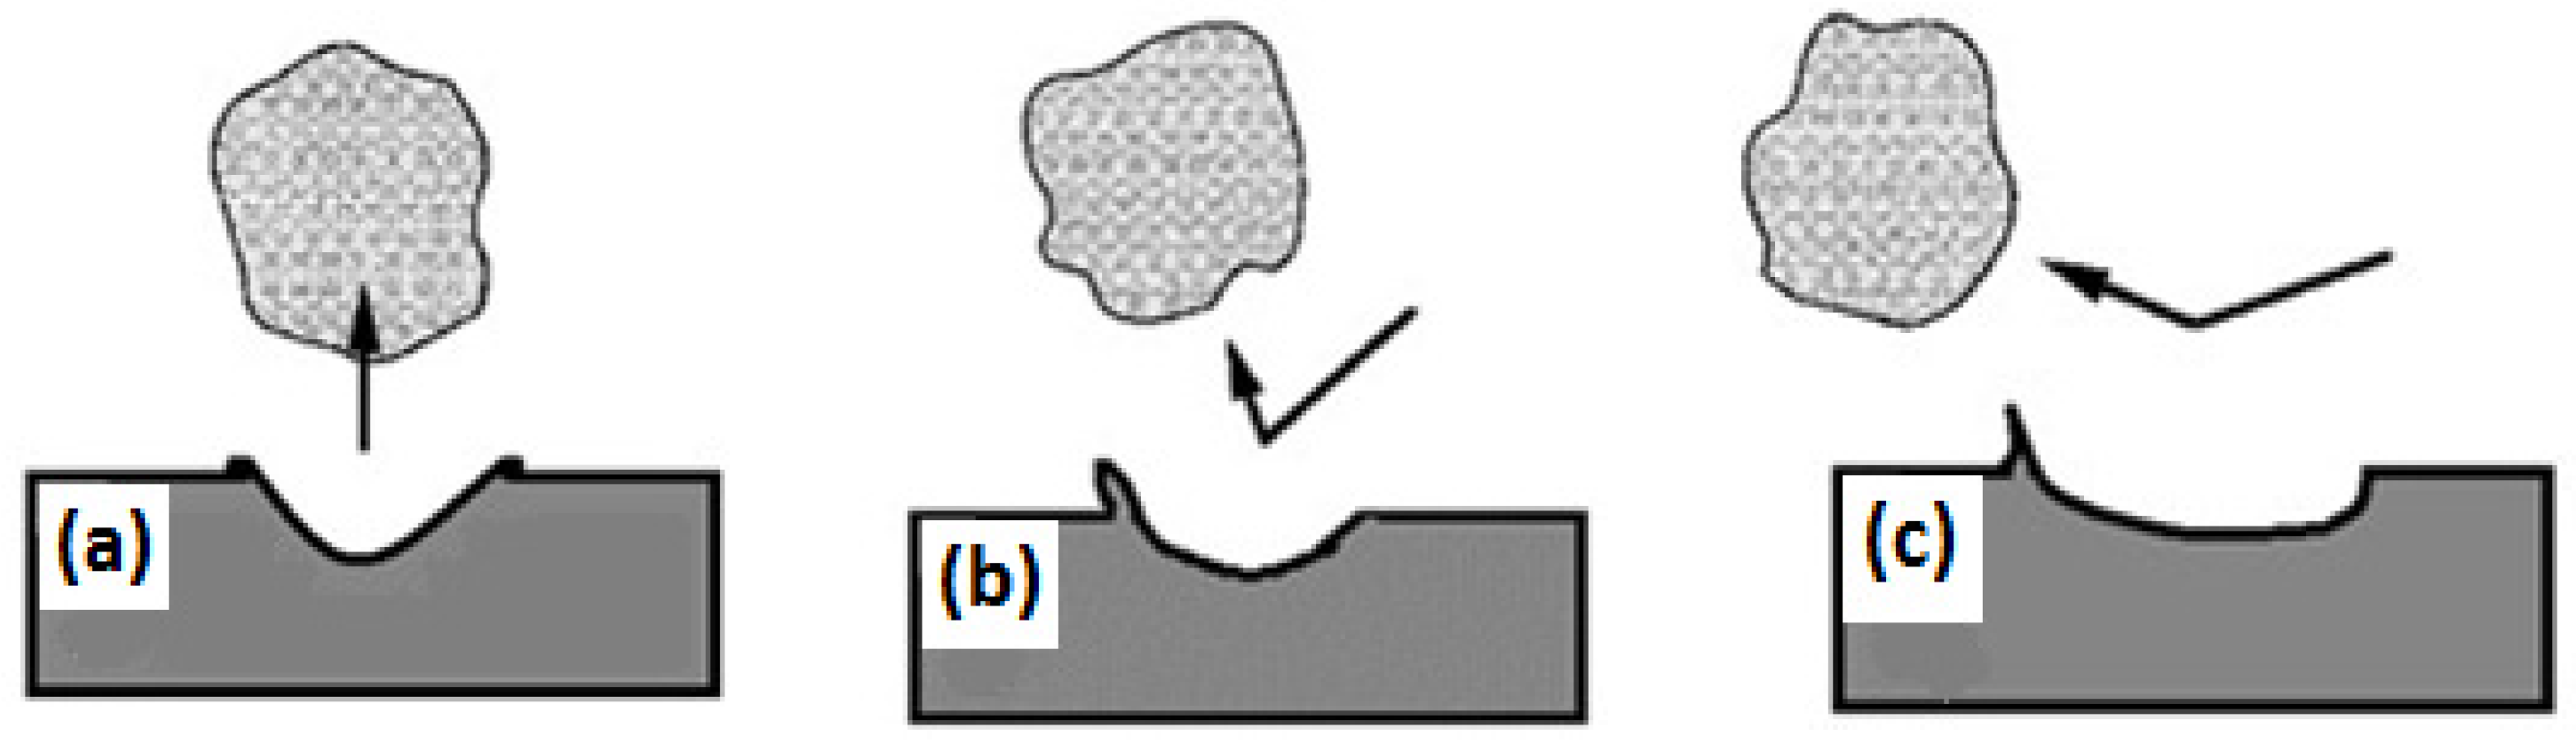
Figure 11.
The variation of weight loss with ECAP passes at different sand concentrations (v = 3.8 m/s, impacting angle = 45°, 3.5% NaCl, and t = 48 h).
Figure 11.
The variation of weight loss with ECAP passes at different sand concentrations (v = 3.8 m/s, impacting angle = 45°, 3.5% NaCl, and t = 48 h).

Figure 12.
Optical micrograph of the E-C samples. (a) before ECAP; (b) after four passes of ECAP (impact velocity = 1.4 m/s, sand concentration = 20 wt.%, time = 48 h and impact angle = 45°).
Figure 12.
Optical micrograph of the E-C samples. (a) before ECAP; (b) after four passes of ECAP (impact velocity = 1.4 m/s, sand concentration = 20 wt.%, time = 48 h and impact angle = 45°).

Figure 13.
Optical micrograph of the E-C samples after four passes of ECAP (impact velocity = 5.4 m/s, sand concentration = 20 wt.%, time = 48 h and impact angle = 45°).
Figure 13.
Optical micrograph of the E-C samples after four passes of ECAP (impact velocity = 5.4 m/s, sand concentration = 20 wt.%, time = 48 h and impact angle = 45°).
Figure 14.
Surface texture of annealed copper subjected to corrosion before ECAP (time = 48 h, velocity = 3.8 m/s, impact angle = 45°, and sand = 0 wt.%).
Figure 14.
Surface texture of annealed copper subjected to corrosion before ECAP (time = 48 h, velocity = 3.8 m/s, impact angle = 45°, and sand = 0 wt.%).

Figure 15.
Surface texture of copper subjected to corrosion only after ECAP (time = 48 h, velocity = 3.8 m/s, impact angle = 45°, and sand = 0 wt.%). (a) After ECAP pass 1; (b) after ECAP pass 2; (c) after ECAP pass 3; and (d) after ECAP pass 4.
Figure 15.
Surface texture of copper subjected to corrosion only after ECAP (time = 48 h, velocity = 3.8 m/s, impact angle = 45°, and sand = 0 wt.%). (a) After ECAP pass 1; (b) after ECAP pass 2; (c) after ECAP pass 3; and (d) after ECAP pass 4.

Figure 16.
Surface texture of copper subjected to E-C before ECAP (time = 48 h, velocity = 3.8 m/s, impact angle= 45°, and sand = 20 wt.%).
Figure 16.
Surface texture of copper subjected to E-C before ECAP (time = 48 h, velocity = 3.8 m/s, impact angle= 45°, and sand = 20 wt.%).

Figure 17.
Surface texture of copper subjected to E-C after four ECAP passes (time = 48 h, velocity = 3.8 m/s, impact angle = 45°, and sand = 20 wt.%). (a) After ECAP pass 1; (b) after ECAP pass 2; (c) after ECAP pass 3; and (d) after ECAP pass 4.
Figure 17.
Surface texture of copper subjected to E-C after four ECAP passes (time = 48 h, velocity = 3.8 m/s, impact angle = 45°, and sand = 20 wt.%). (a) After ECAP pass 1; (b) after ECAP pass 2; (c) after ECAP pass 3; and (d) after ECAP pass 4.

Figure 18.
Variation of Ra with respect to ECAP passes at two different velocities.
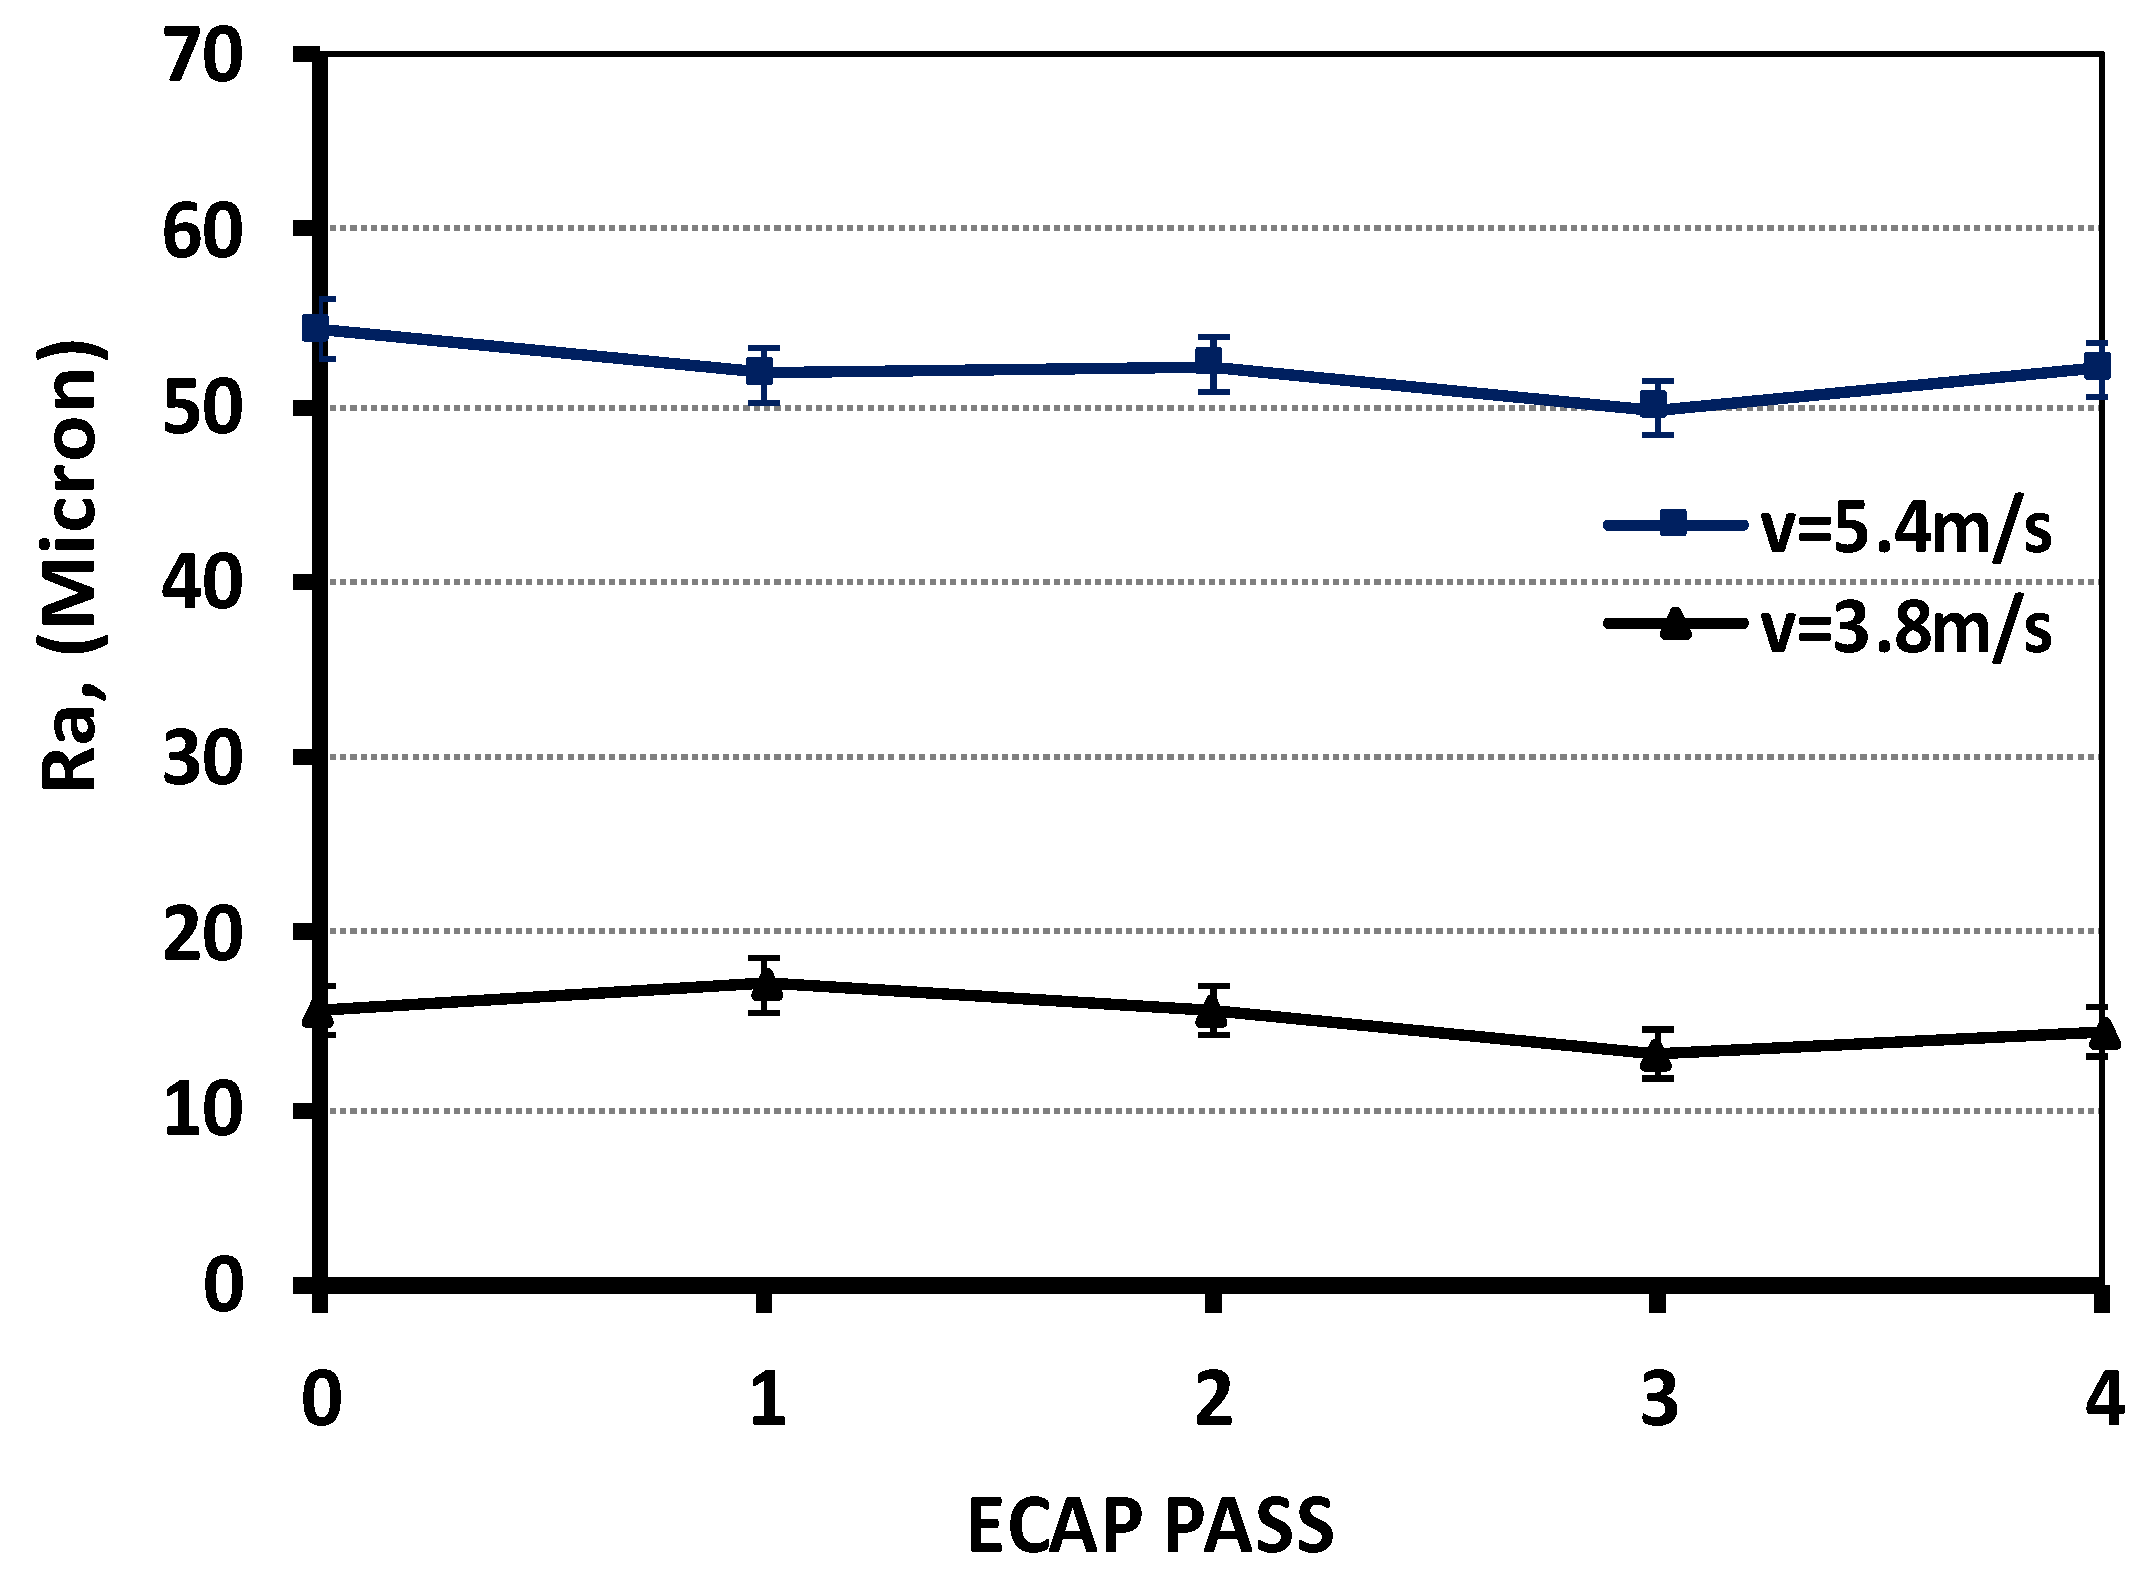
Figure 19.
Variation of Rt with respect to ECAP passes at two different velocities.

Figure 20.
Variation of Rq with respect to ECAP passes at two different velocities.


Table 1.
ECAP conditions.
| Channel Diameter, mm | Lubricant | Temperature °C | Channel Angle | Outer Corner Angle | Ram Speed, mm/s | Route |
|---|---|---|---|---|---|---|
| 20 | MoS2 | 28 ± 3 | 90° | 17° | 2 | BC |
Table 2.
Experimental erosion-corrosion conditions and methodology.
| Experimental Time, h | Linear Velocity, m/s | Impacting Angle, Degree | Solid Particles Concentration, wt.% | |
|---|---|---|---|---|
| Time Effect | 12 | 3.8 | 45 | 20 |
| 24 | ||||
| 48 | ||||
| Velocity Effect | 48 | 1.4 | 45 | 20 |
| 2.7 | ||||
| 3.8 | ||||
| 5.4 | ||||
| Impacting Angle Effect | 48 | 3.8 | 30 | 20 |
| 45 | ||||
| 60 | ||||
| 90 | ||||
| Solid Particles Effect | 48 | 3.8 | 45 | 0 |
| 10 | ||||
| 20 | ||||
| 30 |
© 2017 by the authors. Licensee MDPI, Basel, Switzerland. This article is an open access article distributed under the terms and conditions of the Creative Commons Attribution (CC BY) license (http://creativecommons.org/licenses/by/4.0/).
Share and Cite
MDPI and ACS Style
Irfan, O.M.; Al-Mufadi, F.; Al-Shataif, Y.; Djavanroodi, F. Effect of Equal Channel Angular Pressing (ECAP) on Erosion-Corrosion of Pure Copper. Appl. Sci. 2017, 7, 1250. https://doi.org/10.3390/app7121250
AMA Style
Irfan OM, Al-Mufadi F, Al-Shataif Y, Djavanroodi F. Effect of Equal Channel Angular Pressing (ECAP) on Erosion-Corrosion of Pure Copper. Applied Sciences. 2017; 7(12):1250. https://doi.org/10.3390/app7121250
Chicago/Turabian StyleIrfan, Osama M., Fahad Al-Mufadi, Yaser Al-Shataif, and Faramarz Djavanroodi. 2017. "Effect of Equal Channel Angular Pressing (ECAP) on Erosion-Corrosion of Pure Copper" Applied Sciences 7, no. 12: 1250. https://doi.org/10.3390/app7121250
Note that from the first issue of 2016, this journal uses article numbers instead of page numbers. See further details here.