Structural Health Monitoring of a Road Tunnel Intersecting a Large and Active Landslide


CNR-IRPI—National Research Council of Italy, Research Institute for Geo-Hydrological Protection, Corso Stati Uniti 4, 35127 Padova, Italy
*
Author to whom correspondence should be addressed.
Appl. Sci. 2017, 7(12), 1271; https://doi.org/10.3390/app7121271
Submission received: 10 October 2017
/
Revised: 13 November 2017
/
Accepted: 1 December 2017
/
Published: 5 December 2017
Abstract
:Dealing with engineering structures that are not easily replaceable requires frequent assessment of the damage state of the construction in order to estimate its durability and reliability. The procedures that allow damage to be detected and identified are broadly defined as Structural Health Monitoring (SHM). In this work, a SHM network has been deployed in a road tunnel that intersects a massive landslide, whose movements are causing the formation of cracks along the tunnel lining. The monitoring system measures in real time the displacements across major cracks and the rotation of the tunnel segments; data are gathered and made easily accessible through a web-based platform. The mechanisms by which the tunnel deforms under the landslide-induced stress have been defined through the analysis of three years of monitoring data. The factors triggering an increase in deformation rates and causing damage to the structure have also been investigated. This evidence will support the design of mitigation works to extend the life-span of the tunnel.
1. Introduction
Structural Health Monitoring (SHM) focuses on damage identification, detection and quantification in engineering structures [1]. For large constructions such as bridges, dams, skyscrapers and tunnels, SHM has become more widespread [2,3,4], and is currently implemented starting with the early design process. However, for medium-size constructions, proper SHM is rarely conducted, even though progressive damage is present. The definition of the degree of safety and reliability over time of such structures still relies more on expert judgement of inspectors rather than actual monitoring data. Nevertheless, Damage Prognosis (DP), which is the assessment of the remaining useful life of an engineered system, supported by SHM [5], should be pondered when the risk associated with failure is elevated and when measures to mitigate the progression of damage may be implemented. The advantages of SHM should also be considered with respect to the costs associated with the maintenance, traffic disruption and eventual replacement [6].
SHM of tunnels is particularly important since these structures are not easily replaceable [7]; it has been applied at various sites, especially for large projects in urban areas [8] or complex geotechnical conditions [9]. However, SHM has rarely been used to study the effect of the interaction between a slow-moving landslide and a tunnel, which may induce the accumulation of stresses and displacements, developing cracks and then collapsing under the unremitting movements of the slope instability [10]. In this situation, the monitoring effort most often focuses on the landslide since monitoring networks following the evolution of natural hazards are widespread [11,12]. However, the dynamic of the interaction between the structure and the slope instability phenomenon is far from linear and finding a system that would measure the actual damage within a tunnel is crucial for DP and for providing data useful for the design of effective mitigation works.
This paper describes a real-time monitoring network deployed in 2014 in a road tunnel in Italy where cracks are developing at its intersection with the slip surface of a large landslide.
2. Study Area
In the northeastern Italian Alps, in the upper valley of the Tagliamento River, a narrow gorge called Passo della Morte (46°23′49.7″ N, 12°42′45.7″ E) is affected by several slope instabilities. The main valley road, a national road following the Italian classification, has to cross the area since no other route is possible due to the constricted geomorphological setting.
In Passo della Morte, four landslides have been investigated through monitoring and modelling for more than a decade since their movements are interfering with the road network [13,14]. Also the damming of the Tagliamento River due to a secondary landslide may occur [15]. The largest landslide is a 24 × 106 m3 block slide [16] that accounts for a large portion of Mount Tinisa’s (2120 m a.s.l.) southern slope, covering an area of about 400,000 m2.
2.1. The Landslide
The block slide develops between 970 m and 640 m a.s.l.; on the eastern side, its boundary coincides with a small stream called Rio Verde (Figure 1). The dynamic of the landslide is determined by the presence of rigid dolomitic rock masses over more plastic clay-rich units and it is closely controlled by the structural setting of the area. Likely, in its first stages of evolution, the landslide moved in an eastern direction as a sackung and then subsequently evolved towards the south, heading to the valley bottom. The scarp of the first movement phase coincides with the SE–NW fault connected with the Alpine overthrusts of the area.
The Passo della Morte block slide has been investigated for more than a decade using several techniques. Numerous boreholes had been drilled in the area, and bore−core analysis had been carried out along with geological surveys, allowing the stratigraphy of the slope to be described. The investigation also involved a secondary, shallow earth slide located at the eastern entrance of the tunnel (Figure 2).
Geomorphological evidence coupled with Ground-Based SAR [17] supported the assessment of the contour of the area subject to landslide. Then a long series of GNSS (Global Navigation Satellite System) surveys followed the displacement rate of some selected superficial points of interest. From December 2002 to July 2016, the GNSS benchmarks located on the block slide PM15 and PM13 measured a horizontal displacement of 215 mm (1.5 cm/year in average) and 277 mm (almost 2 cm/year in average), respectively. Their corresponding direction can be observed in Figure 1.
Periodic inclinometric surveys had allowed the location of the slip surface to be detected and then in-place inclinometers were deployed to monitor in real time the displacements at depth (Figure 3). The displacement pattern of the block slide at depth is influenced by extreme rainfall events or rapid snow-melt.
Piezometers, also working in real-time mode, were coupled with inclinometers to monitor the variation of groundwater head within the slope. The small variation of the water level recorded in the piezometers associated with inclinometer I16 is not correlated with the change of the displacement pattern of the landslide. This is due to the fact that the borehole is located in the medium–low part of the block slide, where low permeability clay-shales are present and therefore the oscillation of data recorded by the instrument is lower than 1 m. The effect of extreme rainfall and snowmelt events on the mobility of the landslide is therefore linked to the saturation of the highly fractured dolomitic rock mass located behind and above the landslide body.
Despite this significant amount of data, it was necessary to install instruments that would continuously monitor the tunnel to better understand the non-linear interaction between it and the slow-moving landslide, and determine the damage prognosis.
2.2. The Tunnel
The valley road formerly crossing the Passo della Morte gorge was tortuous and threated by rock falls, avalanches and shallow landslides. Therefore, in 1992, a double-lane tunnel that would cut off these hazards was designed. The tunnel, called San Lorenzo, started to be constructed in 1994 following the New Austrian Tunnelling Method (NATM) and is 2213 m long with both entrances at about 730 m a.s.l. and a maximum rock cover of approximately 370 m.
During construction, significant water inrush was recorded between 470 m to 730 m from the eastern entrance and around 300 m from the same portal. The water discharge between 470 m and 730 m occurs where the tunnel cuts through the highly fissured dolomitic rock mass. At 300 m from the eastern tunnel entrance, however, the tunnel is crossing the block slide slip surface, which acts as a preferential groundwater path within the clay-shales. Moreover, near the entrance the superficial landslide had been reactivated (Figure 2).
During a rainy period between October and November 1996 (680 mm in 10 days), the tunnel was flooded due to water inrush in the same areas. Concurrently, both landslides had been deforming significantly. Due to these instabilities, the tunnel was severely damaged and closed. However, since no alternative track is available, the tunnel and the landslides need to coexist.
In 2005–2008 the tunnel was rebuilt in the first 370 m from the eastern entry. Tests had been performed on the chemical characteristics of the groundwater and a high content of sulphate was detected. This is due to the presence of gypsum-rich rock units in the area, inducing an extremely aggressive environment for standard concrete. Pozzolanic cement (CEM IV−EN 197 norm) had been used to guarantee resistance to sulphate attacks and ensure the durability of the structure.
The new design of this section of the tunnel had prescribed the use of independent segments of 12 m to allow deformations due to the slow but unremitting movements of the block slide to be dissipated. Concurrently, a drainage tunnel had been built below the road tunnel to collect the water within the rock mass in order to reduce the landslides’ displacements. The drainage tunnel is T-shaped, reaching the road tunnel at 320 m from the eastern entrance and elongating under the superficial landslide, draining in the direction of the Tagliamento River.
The adopted technical solutions, with independent segments, have been effective as almost 10 years later the road tunnel is still in use. However, the drainage tunnel has been significantly reducing the displacements of the superficial landslide but not those of the block slide. In fact, the discharge from the block slide sector is scarce since the drainage tunnel is located in the clay-shales domain below the slip surface. For this reason, the strain induced on the structure by the movements of the block slide is causing the formation of some cracks in the concrete lining, where the slip surface of the block slide is located. Over the years, some small pieces of concrete have spalled and the fall of little slabs is posing a significant hazard for traffic.
3. The Tunnel Monitoring System
Starting in 2014, following the request of the Italian Road Authority (ANAS), which is responsible for the maintenance and safety of the tunnel, a monitoring system has been running in the tunnel. The main aim of the system is to control the evolution of the cracks on the vault and assist with periodic inspections (Figure 4). Data would also be used to define effective mitigation strategies to reduce stresses on the structure and increase the life span of the tunnel.
Figure 5 represents the layout of the monitoring system. It consists of a datalogger recording the data from four clinometers and 24 crackmeters using 4–20 mA direct current loop transmission protocol. The datalogger digitises the analogue signal with a sampling period of 30 min and 16 bits of accuracy. The crackmeter and clinometer employed in this monitoring system are shown in Figure 6. The crackmeter is a standard resistive bar displacement transducer made of stainless steel. According to the datasheet, it operates from –20 °C to +80 °C with a thermal drift <10 ppm. The clinometer, made of aluminium, has a resolution of 0.001°, a measurement range of ±2°, and operates from –20 °C to +60 °C. The data output from the datalogger is transmitted to an industrial media converter and then routed through a multimode optical cable link to the entrance of the tunnel, where the optical signal is converted back into an electric serial signal using an additional media converter, before being transmitted to the remote web-portal server using a machine-to-machine modem. The choice of an optical cable link, 400 m long, instead of a more common Ethernet link, avoids the use of signal boosters/repeaters that require access to the electric line to be powered. Furthermore, only two of the eight fibres inside the optical cable are used for transmitting the data from the sensors, while the other six are at our disposal for any system upgrade.
As to the installed sensors, 16 of the 24 crackmeters are installed across some major cracks near the slip surface on the vault and the other eight across the tunnel lining segments. Concerning the clinometers, three are located on the uphill side of the tunnel; the last one is in the downhill part of segment 28 at the tunnel pillar’s head. Figure 4 shows the approximate positions of these sensors.
In addition to these sensors, the underground drainage system of the tunnel is equipped with two thin-plate weirs to measure the water discharge. Eventually, the precipitation in the site is measured using a rain gauge installed at the eastern entrance. The aim is to investigate a possible correlation between meteoric events, the hydrogeological behaviour of the rock masses and structure strain. The monitoring system was also used to identify the factors influencing the landslide/tunnel dynamics and to provide tailored options for mitigation works, such as the extension of the drainage tunnel.
Sensor recording started in April 2014. No malfunctions occurred, except that the water discharge probe deployed in August 2014 failed between 26 March and 14 May 2015.
The Web-Based Platform
A web-based LAMP platform (Linux, Apache, MySQL and PHP) was implemented for real-time data management and analysis, which also allows users, upon authentication, to interactively query the raw and processed data.
The website architecture is composed of a framework of automatic scripts for data management, implementing the following functions:
- -
- data gathering: data from all the sensors are automatically acquired at customised intervals;
- -
- data storage: raw data are collected, upon proper normalisation, in a relational database;
- -
- data analysis: raw data are analysed to produce additional information like displacement rate, sensors whose signal is above a certain threshold, abnormal peaky behaviour, sensors whose data is missing, etc.;
- -
- data visualisation: a set of Java script codes based on Dygraphs’ charting library (http:///dygraphs.com) constitutes the backend for the interactive plots of displacement evolution, rain and water discharge.
Along with these scripts, additional codes have been developed for alarm triggering in the case of system malfunctioning (e.g., network failure, sensor failure) and anomalous data (excessive displacement or inclination) and to communicate via email the occurrence of such situations. Other communication tools are also available, such as SMS, Twitter and Facebook, but they are not activated at the moment.
The platform is highly scalable and permits us to integrate several sensors with different sampling times. This capability of integrating and managing many different sensors improves resiliency by device redundancy in the monitoring system.
The web interface makes it possible to produce graphs of the displacements or rotations measured by instrument vs. time. Single extensometer or clinometer measurements can be visually compared to the rainfall or discharge in the tunnel drainage system in real time. The time range is customisable, so that zooming to particular phenomena within the three-year dataset is straightforward. Another useful feature allows us to linearly interpolate the data over a selected time span to estimate the deformation rate.
In another page, the displacements recorded by the crackmeters are also plotted as a colour map, while the cumulative inclination of the clinometers is plotted on an arrow map (Figure 7). For enhanced clarity, crackmeters have been clustered into two groups, with different magnitude ranges, one for the instruments located along cracks and one for the instruments located at hinges between two tunnel segments. This is because the displacements recorded at the hinges are one order of magnitude larger than those measured over the cracks.
In another page, data from crackmeters deployed along the lining cracks (1–16) and exceeding the threshold crack size of 0.3 mm are shown. The threshold value of 0.3 mm was chosen considering the Eurocode directive and Bastidas-Arteaga et al. [18].
4. Results
Data have been collected through the monitoring system for three years; each year is considered to run from April to the following March since monitoring started in April 2014. During the first year, the cumulated rainfall was 1926 mm, exceeding the site average of 1700 mm/year as there were some intense rainfall events (e.g., in November 2014 the cumulated rainfall reached 700 mm in 20 days). Rainfall was lower in the second (1512 mm) and third years (1190 mm/year), with no significant rainstorms. The fact that we have been able to observe the landslide/tunnel dynamic over three years under different climate conditions permitted the analysis of the effect of water inputs on the system.
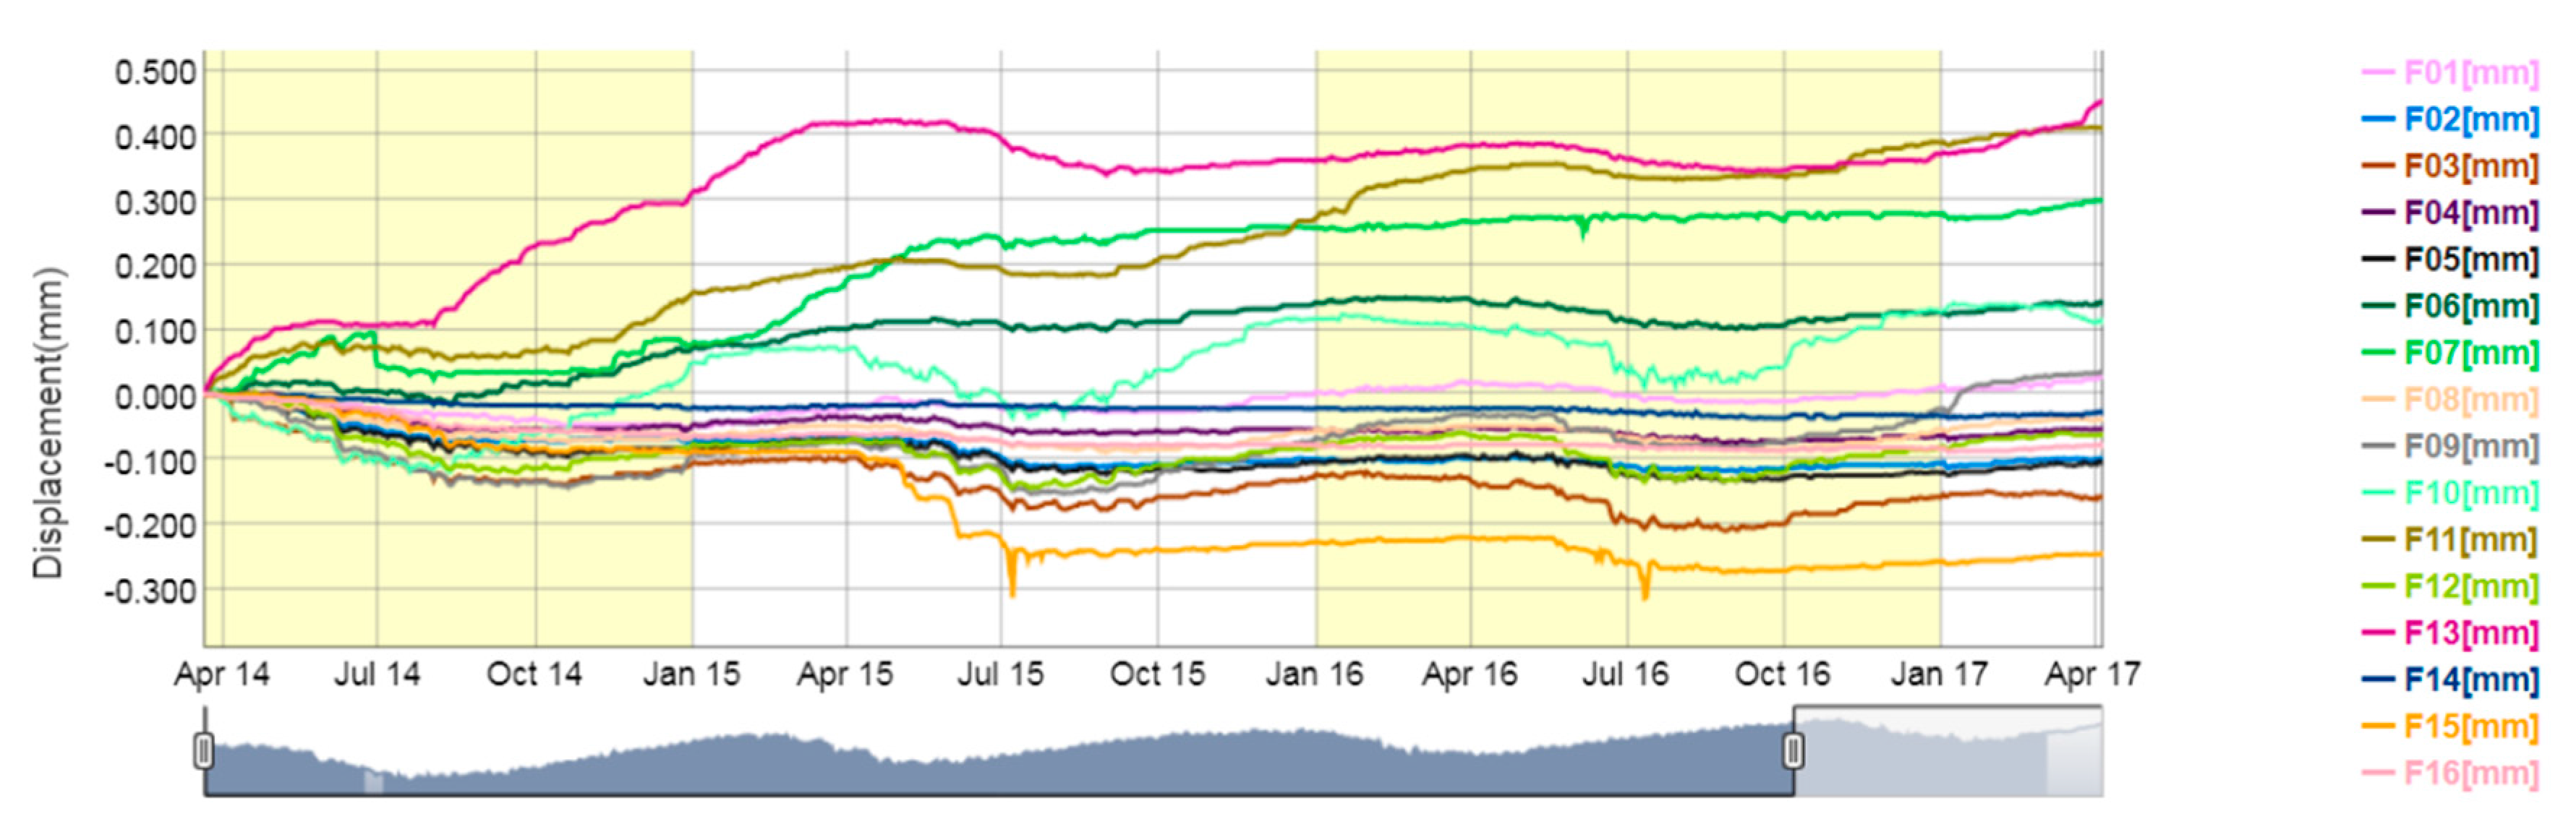
Twenty-two out of the 24 crackmeters have measured higher cumulative absolute displacements in the first year (Figure 8). The remaining two instruments recorded higher cumulative absolute displacement in the second year, but the magnitude of the displacement and the difference between the two rates is small. Most of the instruments showed a seasonal signal overlapping the widening trend. Since the declared thermal drift of the deployed sensors is extremely small, we suppose that this behaviour is linked to the response of the concrete to variations in temperature and humidity, with little dilatation during the summer.
Among the crackmeters installed on the cracks of the vault (1–16), three have been accumulating displacements above the 0.3 mm threshold in the three-year monitoring period, namely F07 (0.36 mm), F11 (0.42 mm) and F13 (0.47 mm). For all sensors, the majority of the displacement was recorded during the first year: the greater deformation rates reached 12 µm/day in F13 and 9.2 µm/day in F11 between November 2014 and March 2015, a period with significant rainfall events. In Figure 9 displacements of three sensors, all located in segment 28, are plotted with the water discharge of the drainage system within the road tunnel.
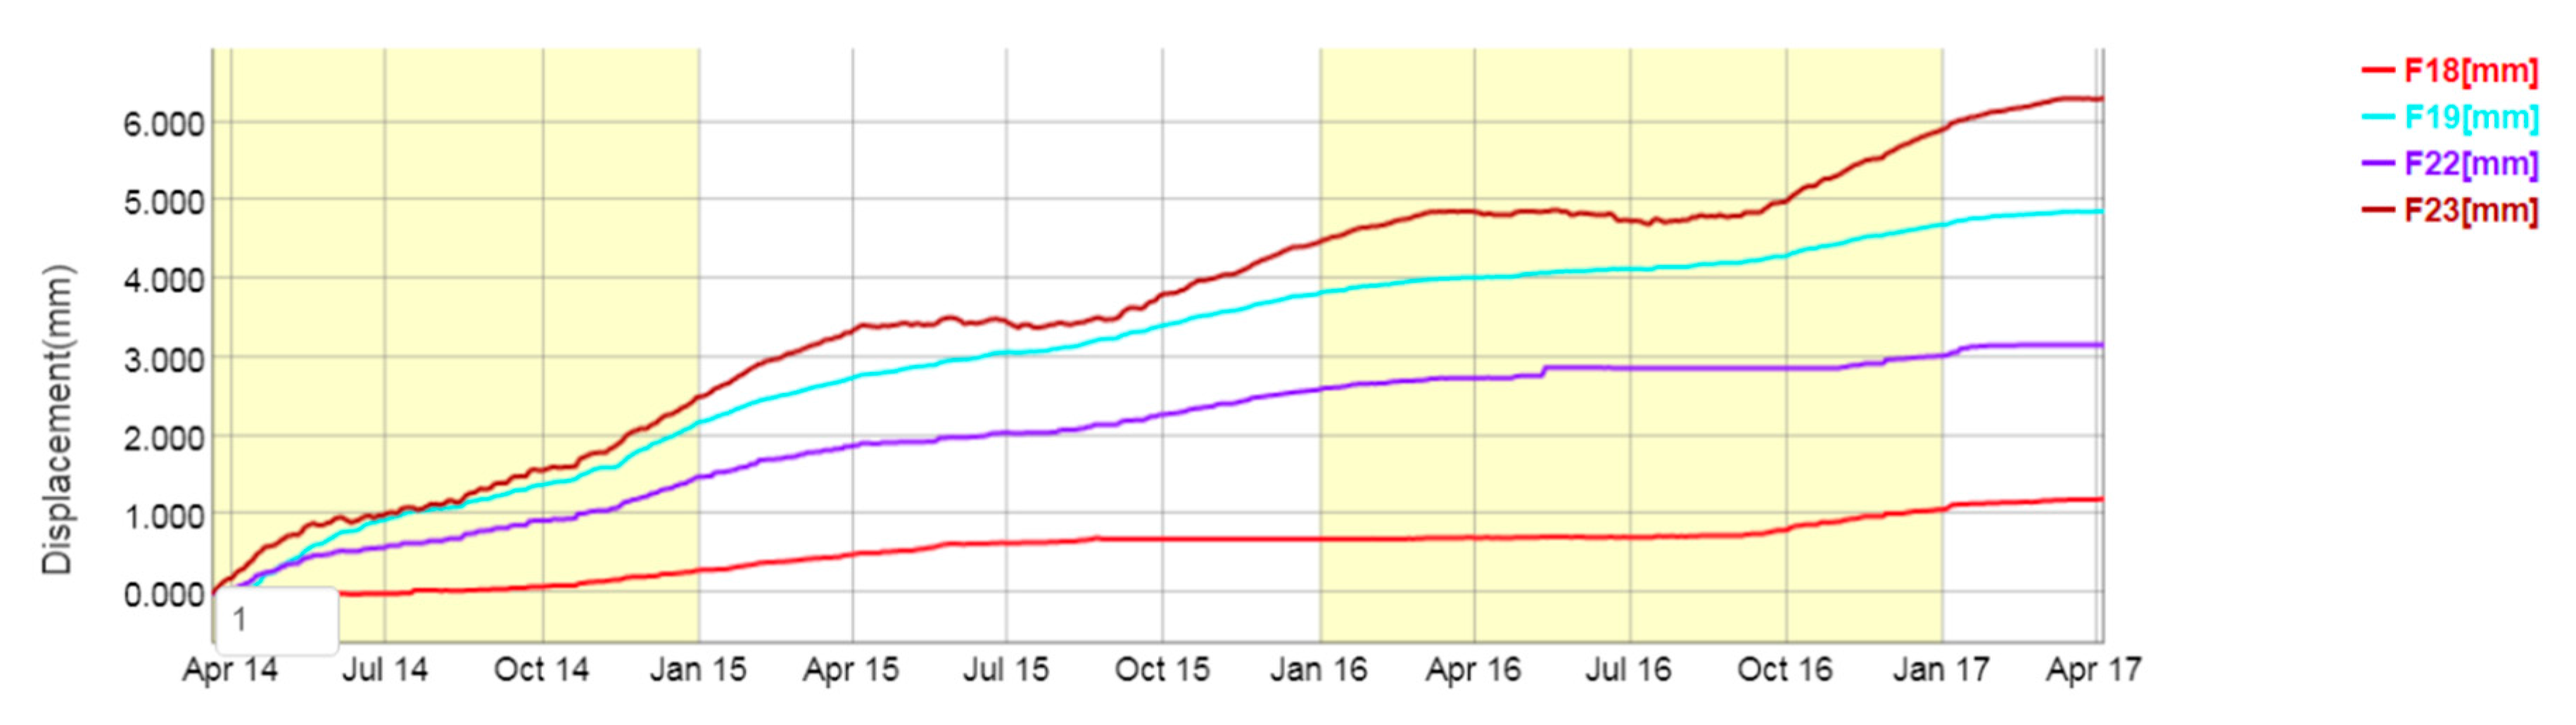
The eight crackmeters installed between the tunnel segments have been measuring larger displacements, as expected. Based on the collected data, these sensors could be grouped into two clusters: the first comprising the crackmeters in the external segments (F17, F24, F20 and F21) and the second comprising the crackmeters in the internal segments (F18, F19, F22 and F23). About the first group, the maximum cumulated displacement recorded in the three-year period is relatively small, with a maximum displacement of 0.19 mm measured by F17, while for the second the displacement is significantly higher, with a maximum displacement of 6.47 mm measured by F23. Data regarding the internal segments extensometer group are shown in Table 1 and displacements over time can be found in Figure 10.
The two-axis clinometers show bimodal behaviour, with periods of dormancy followed by sudden onset of activity lasting for months. The first change of pattern dates back to 5 May 2015; unfortunately, no water discharge measures inside the road tunnel are available due to the malfunction of the instruments on this date. The sensor was repaired in 14 May 2015 and Figure 11 shows that the water discharge was in fact above average and even increasing.
In the seven days before 5 May 2015, only 20 mm of rain fell but a nearby snow cover measuring station (Malga Cjampiuz; 46°21′04.0″ N, 12°40′43.2″ E) recorded the melting of 55 cm of a densely packed old snow cover. This value, according to Meløysund et al. [19], can be considered equivalent to 165 mm of rain. The second, smaller, change of trend was recorded on 9 June 2016 after a long period of above-average water discharge in the drainage system of the road tunnel.
5. Discussion
The monitoring system was able to detect and follow three different types of dynamic within the San Lorenzo tunnel.
The cumulated rainfall/snowmelt influences the evolution of the cracks on the tunnel lining, with larger activity in the rainiest year. However, the brittle nature of the concrete does not allow monitoring to predict precisely when widening will occur and, more importantly, when spalling would endanger traffic. Nevertheless, since the activity of the landslide is correlated with the meteoric events and in particular with the accumulation of water in the highly fissured dolomitic rock mass, it is advisable to extend the drainage tunnel reaching the dolomitic rock. Draining this rock mass would have an effect on the slip surface of the block slide, which is the only region along the tunnel where water is present within the clay-shales domain. The slip surface serves as a preferential flow path from the dolomitic rock aquifer and the Tagliamento River. Reducing the storing capacity could reduce the lubrication associated with softening and variation of the pore pressure regime along the block slide slip surface, thus lowering displacement and damage along the tunnel.
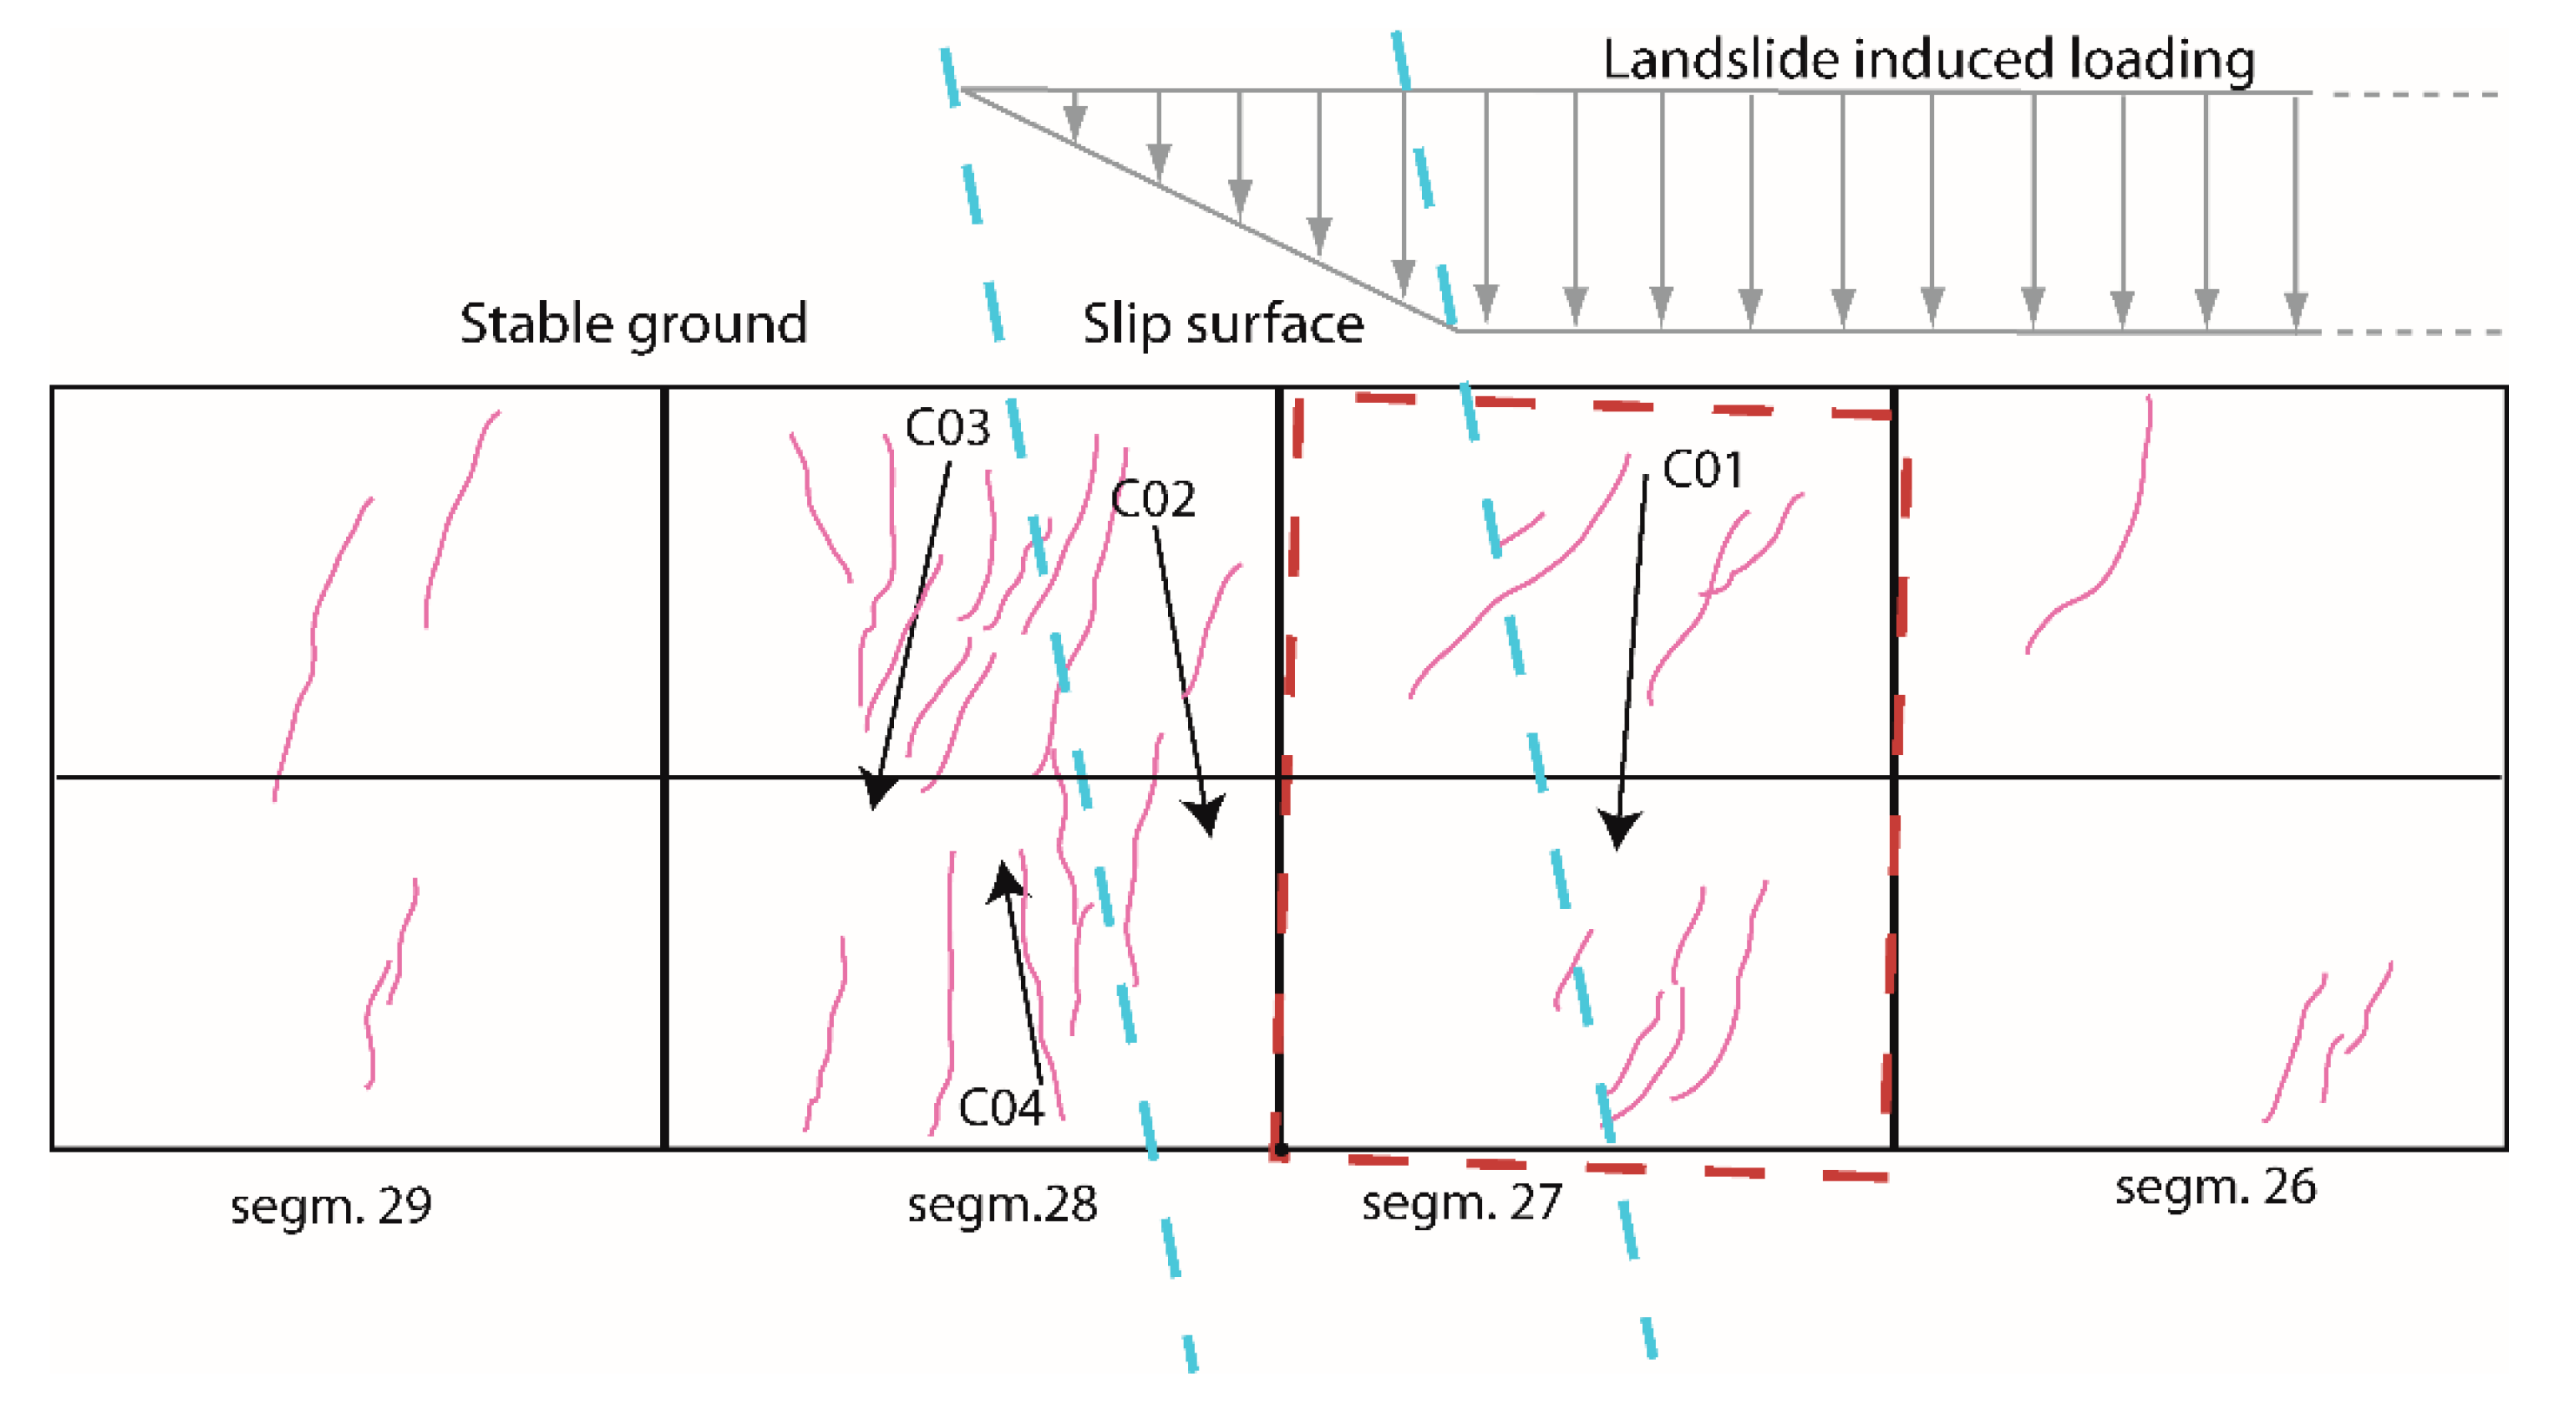
The overall dynamic of the sensors shows that some fissure are widening while others are closing. The widening cracks are all located in segment 28 because on the left segment 28 is constrained to the stable slope and on the right it is loaded by the movements of the landslide. This induces a bending moment in the segment that opens the cracks. The distribution and direction of the cracks are compatible with those described by Wang [20] in Case IV, with a similar relative geometry of slope instability phenomenon and tunnel.
The displacement recorded by the crackmeters deployed between the lining segments allows us to delineate the interaction between the landslide and the tunnel. While the sensors in the left part of segment 28 (F17 and F24) show negligible displacement, the crackmeters in the right part close to segment 29 are widening with 1.2 mm of cumulative displacement for F18 (located downhill) and 6.3 mm for F23 (located uphill). The sensors on the other side of segment 27 measure positive displacements of 4.88 mm (F19, downhill) and 3.17 mm (F22, uphill). These data suggest that while segment 28 is constrained on the left and works as a cantilever under the loading induced by the landslide displacement, segment 27 takes advantage of the design choice of independent segments and undergoes roto-translation (Figure 12). The slip surface of the landslide, which is about 10 m wide, is therefore localised in the area between segment 27 and 28. Direction of the cracks in segment 28 suggests that load is applied directly to such segment. The diagonal cracks of the adjacent segments are due to the shear stress distribution, as described by Poisel et al. [21].
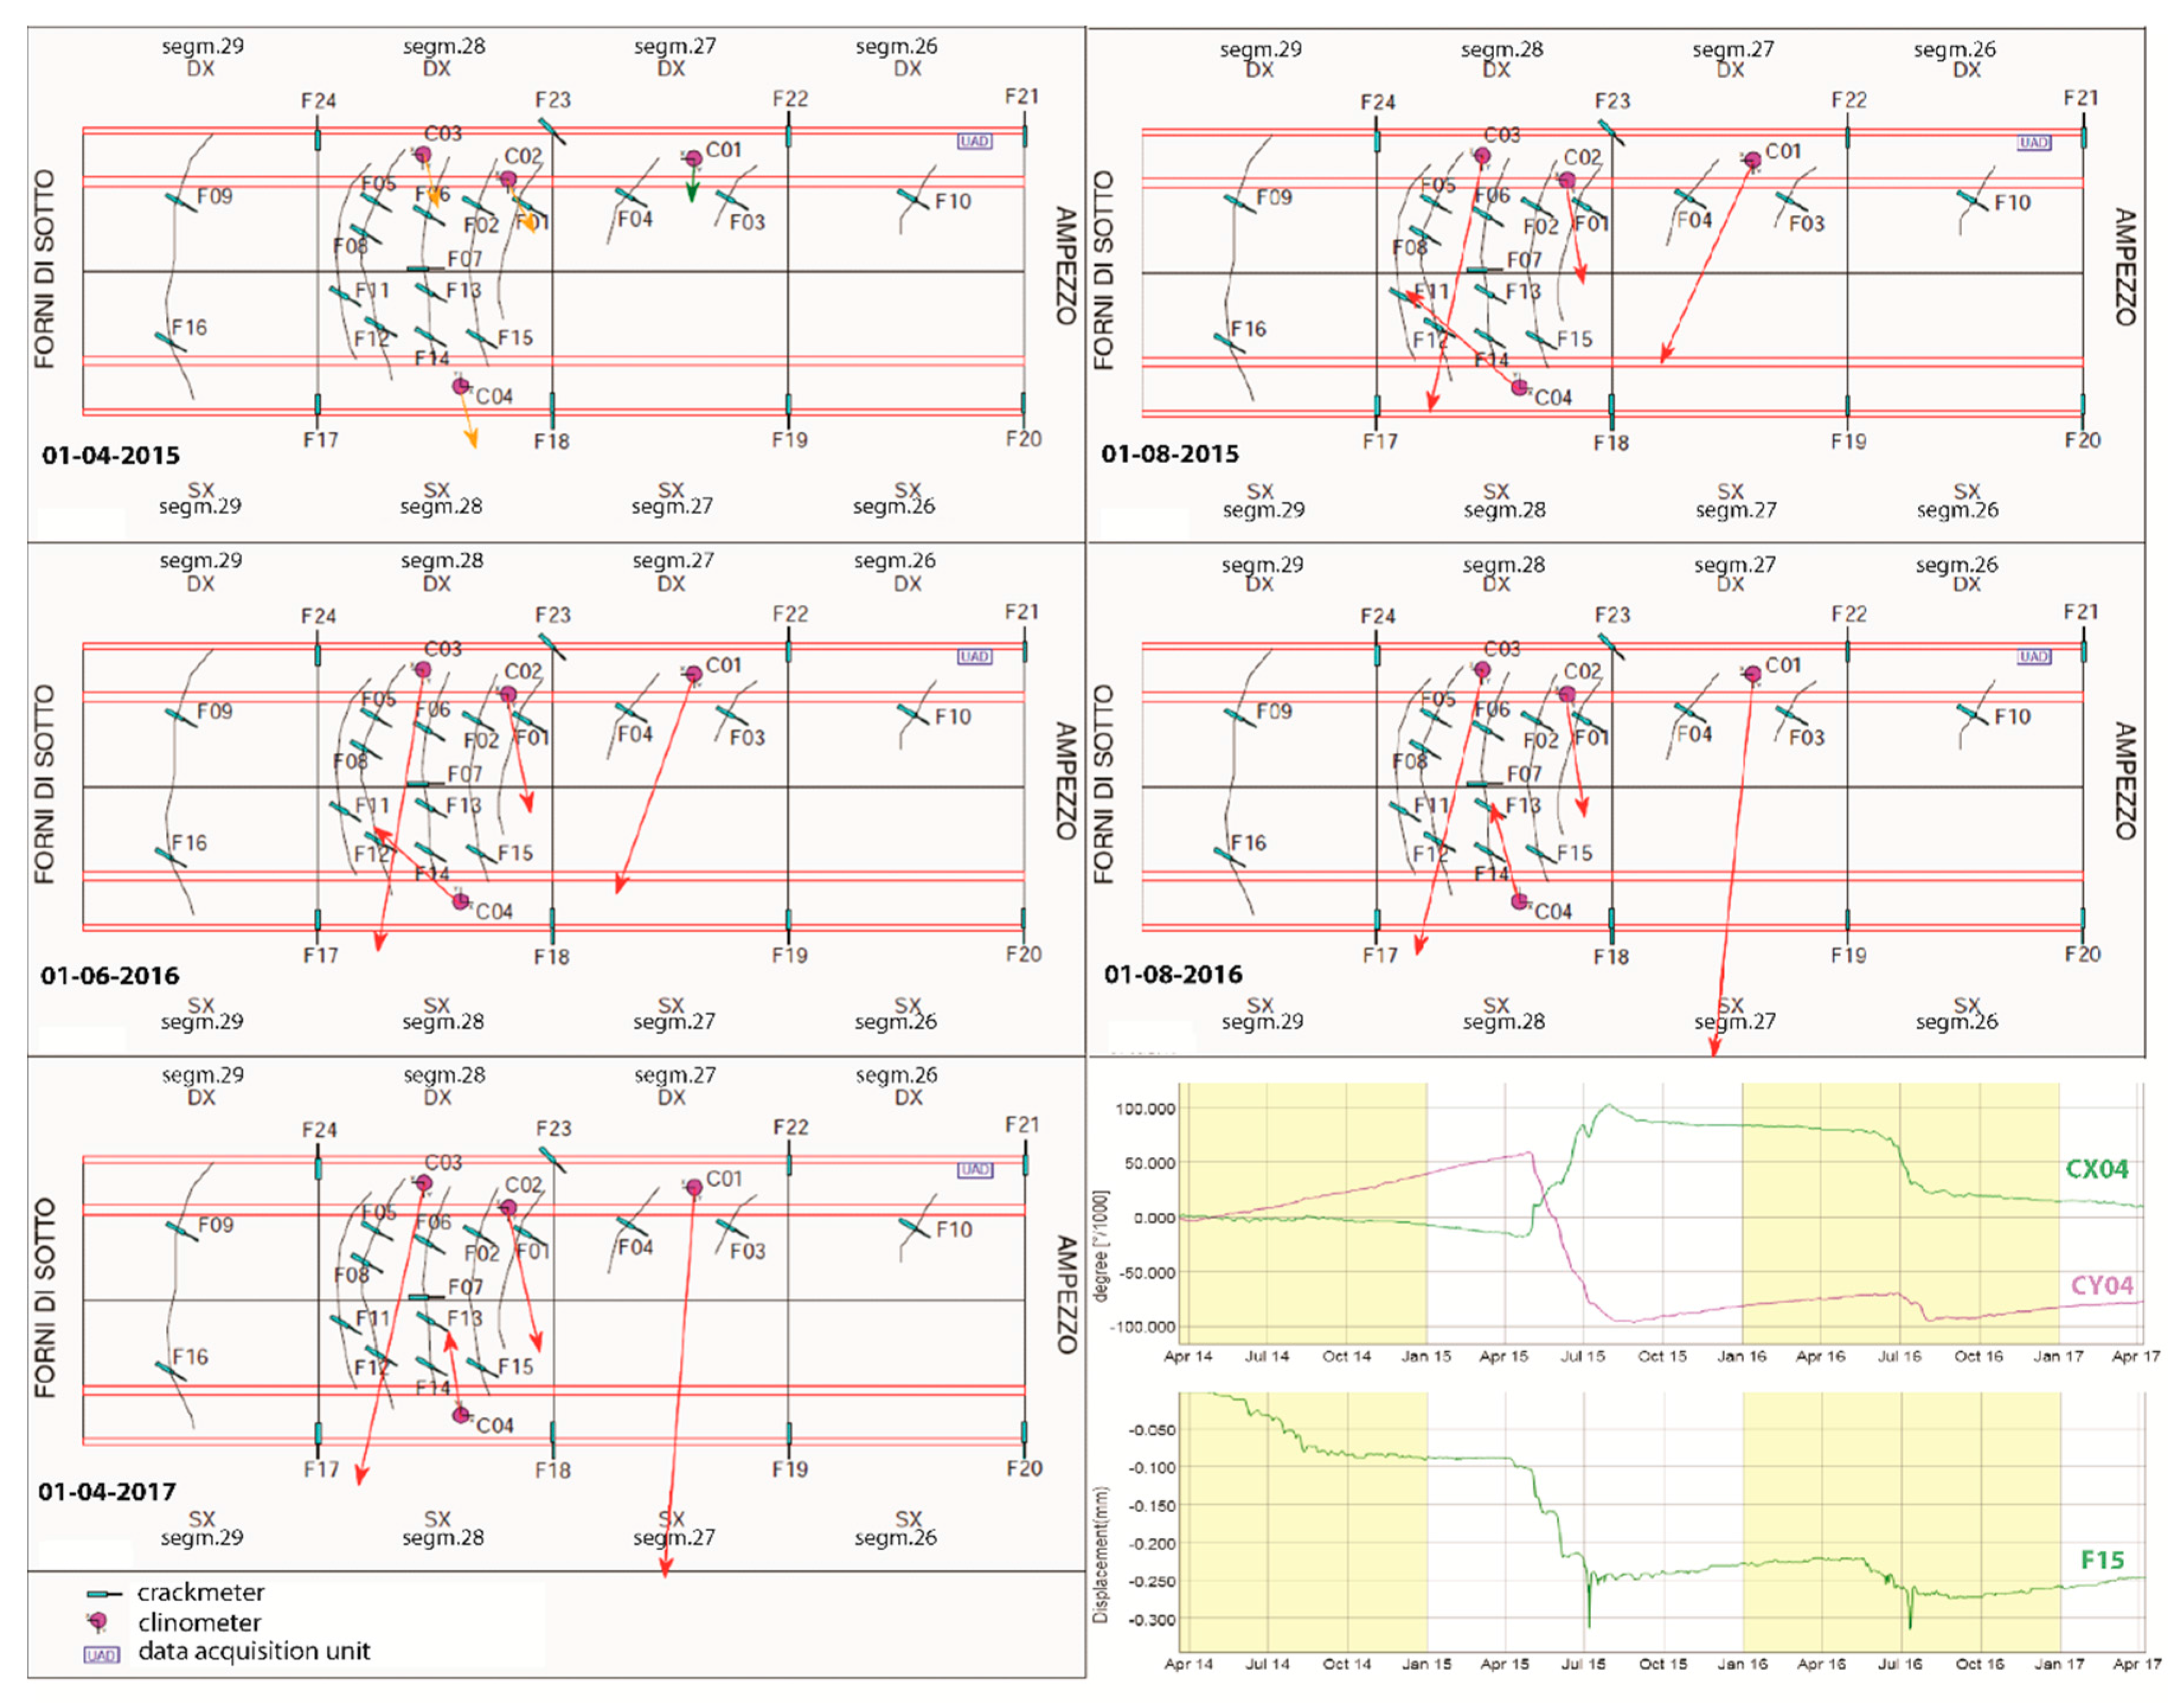
The behaviour of clinometer C04 is characterised by the inversion of the vector of projected direction that was initially directed mildly downhill, subsequently rotated in two phases (May–June 2015 and May–July 2016), and is currently directed uphill (Figure 13). These results are linked to the two-phase dynamic of the interaction between the tunnel and landslide (compression and dissipation). The compression phases (April 2014–May 2015, August 2015–July 2016 and September 2016–April 2017) consist of a loading of the tunnel due to the landslide. In these phases, rotation entity and velocity are smaller and the vectors indicating the direction of the clinometers converge towards the centre of the tunnel. The dissipation phases have a more impulsive nature, through the liberation of the energy accumulated by the soil and the structure. This phenomenon corresponds to the sudden downhill rotation of C04 and the contemporary contraction of F15 (Figure 13). In the third year, the dissipation phase is less pronounced due to little precipitation.
Since no other clinometer is located downhill, it is not possible to unquestionably determine whether the behaviour of C04 represents a local state of a small portion of the lining between cracks or is representative of the whole deformation activity of the downhill part of segment 28. However, in the same periods the other uphill clinometers also show increased activity; this supports the hypothesis that measures from C04 could reflect the dynamic of the whole segment. In this case, the segment is currently contracting, as shown by the fissure monitored by F15, and the disposition of the resultant vectors is coherent with the cantilever scheme hypothesis.
Summarising, according to this analysis, the tunnel responds to the landslide-induced stress in two phases: first, when stresses cause displacements between segments 27–28 or through the expansion of major cracks along the lining; and second, when stresses cause vault contraction in segment 28. In segment 27, clinometer C01 is rotating downhill with a cumulative rotation of almost 0.4° in three years. Since in this segment cracks are rarer and sparser, it is possible to directly associate the measurements of the sensor with the overall behaviour of the tunnel segment. However, this extent of rotation, accumulated over just three years of monitoring, is not negligible if projected over the expected operating life of the structure, which was completed in 2008. Still, no major crack widening has been measured in segment 27, further proof of the suitability of the independent segments design solution.
6. Conclusions
The SHM system illustrated in this paper represents a low-impact solution for monitoring the structural status of a road tunnel damaged by a large landslide. Moreover, it was deployed on an existing structure without significant works for implementation. The monitoring network provides real-time measurements every half hour and does not interfere with traffic; in three years the tunnel was closed only on the day of installation.
The collected data allow us to delineate the interaction between the tunnel and the landslide and permit us to consider future scenarios for the tunnel durability and serviceability. Measuring crack widening increases the overall resilience of the structure by indicating the areas where maintenance work should focus. Moreover, the determination of a causal relationship between the tunnel lining displacements and possible triggering factors is essential to design effective countermeasures.
Water from rainfall and snowmelt percolates easily within the slope through the highly fractured dolomitic rock and the very coarse dolomitic deposit near the crown. The effect is the accumulation of water at the contact between the low permeability clay-shales and the dolomite. The change in the water pressure regime and the softening of the clay-shales along the slip surface trigger displacements in the block slide. It is therefore advisable to extend the drainage tunnel until it reaches the dolomitic domain to properly drain the system and reduce landslide displacement.
The independent segments design has proven to be able to sustain small landslide-induced displacements. However, if the slip surface cuts through one segment, some damage may eventually arise. In this case, a SHM could be implemented to support tunnel management by providing data about the rate of expansion of cracks, the convergence of the lining, and responses to triggering factors in real time. Finally, a web-based platform could support data analysis and a prompt response in the case of parossistic phenomena.
Acknowledgments
We thank ANAS Compartimento di Trieste and in particular Claudia Tirelli. ANAS Compartimento di Trieste funded the deployment of the monitoring system. Other resources already available at CNR-IRPI provided the funds for the research activity. ANAS Compartimento di Trieste was not directly involved in the manuscript design and production.
Author Contributions
G.M. conceived the monitoring system and supervised its installation with the contribution of L.S.; G.B. and G.M. analysed data; L.S. designed the web-based platform; G.B. wrote the paper, G.M. and L.S. revised it.
Conflicts of Interest
The authors declare no conflict of interest.
References
- Brownjohn, J.M.W. Structural health monitoring of civil infrastructure. Philos. Trans. A Math. Phys. Eng. Sci. 2007, 365, 589–622. [Google Scholar] [CrossRef] [PubMed] [Green Version]
- Ko, J.M.; Ni, Y.Q. Technology developments in structural health monitoring of large-scale bridges. Eng. Struct. 2005, 27, 1715–1725. [Google Scholar] [CrossRef]
- Xia, Y.; Ni, Y.; Zhang, P.; Liao, W.; Ko, J. Stress Development of a Supertall Structure during Construction: Field Monitoring and Numerical Analysis. Comput. Civ. Infrastruct. Eng. 2011, 26, 542–559. [Google Scholar] [CrossRef]
- Wang, B.; Zhang, Z.; He, C.; Zheng, H. Implementation of a long-term monitoring approach for the operational safety of highway tunnel structures in a severely seismic area of China. Struct. Control Health Monit. 2017, 24, e1993.2016. [Google Scholar] [CrossRef]
- Farrar, C.R.; Lieven, N.A. Damage prognosis: The future of structural health monitoring. Philos. Trans. R. Soc. Lond. A Math. Phys. Eng. Sci. 2007, 365, 623–632. [Google Scholar] [CrossRef] [PubMed]
- Richards, J.A. Inspection, maintenance and repair of tunnels: International lessons and practice. Tunn. Undergr. Space Technol. 1998, 13, 369–375. [Google Scholar] [CrossRef]
- Bhalla, S.; Yang, Y.W.; Zhao, J.; Soh, C.K. Structural health monitoring of underground facilities—Technological issues and challenges. Tunn. Undergr. Space Technol. 2005, 20, 487–500. [Google Scholar] [CrossRef]
- Bennett, P.J.; Kobayashi, Y.; Soga, K.; Wright, P. Wireless sensor network for monitoring transport tunnels. Proc. Inst. Civ. Eng. Geotech. Eng. 2010, 163, 147–156. [Google Scholar] [CrossRef]
- Rainieri, C.; Fabbrocino, G.; Santucci de Magistris, F. An Integrated Seismic Monitoring System for a Full-Scale Embedded Retaining Wall. Geotech. Test. J. 2013, 36, 20120067. [Google Scholar] [CrossRef]
- Chiu, Y.-C.; Lee, C.-H.; Wang, T.-T. Lining crack evolution of an operational tunnel influenced by slope instability. Tunn. Undergr. Space Technol. 2017, 65, 167–178. [Google Scholar] [CrossRef]
- Lacasse, S.; Nadim, F. Landslide risk assessment and mitigation strategy. In Landslides—Disaster Risk Reduction; Springer Science and Business Media, LLC: New York, NY, USA, 2009; pp. 31–62. [Google Scholar]
- Jiao, Y.-Y.; Wang, Z.-H.; Wang, X.-Z.; Adoko, A.C.; Yang, Z.-X. Stability assessment of an ancient landslide crossed by two coal mine tunnels. Eng. Geol. 2013, 159, 36–44. [Google Scholar] [CrossRef]
- Bossi, G.; Zabuski, L.; Pasuto, A.; Marcato, G. Capabilities of Continuous and Discontinuous Modelling of a Complex, Structurally Controlled Landslide. Geotech. Geol. Eng. 2016, 34, 1677–1686. [Google Scholar] [CrossRef]
- Schenato, L.; Bossi, G.; Marcato, G.; Pasuto, A. Cumulative monitoring of strain in concrete structures with polymer optical fibers. Rend. Online Soc. Geol. Ital. 2016, 39, 19–22. [Google Scholar] [CrossRef]
- Codeglia, D.; Dixon, N.; Bossi, G.; Marcato, G. Alpine landslide risk scenario: Run-out modelling using a 3D approach. Rend. Online Soc. Geol. Ital. 2017, 42, 14–17. [Google Scholar] [CrossRef]
- Ibsen, M.L.; Brunsden, D.; Bromhead, E.; Collison, A. Block slide. In Landslide Recognition, Identification, Movement and Causes; Wiley: Hoboken, NJ, USA, 1996; pp. 64–77. [Google Scholar]
- Noferini, L.; Pieraccini, M.; Mecatti, D.; Macaluso, G.; Atzeni, C.; Mantovani, M.; Marcato, G.; Pasuto, A.; Silvano, S.; Tagliavini, F. Using GB-SAR technique to monitor slow moving landslide. Eng. Geol. 2007, 95, 88–98. [Google Scholar] [CrossRef]
- Bastidas-Arteaga, E.; Sánchez-Silva, M.; Chateauneuf, A.; Silva, M.R. Coupled reliability model of biodeterioration, chloride ingress and cracking for reinforced concrete structures. Struct. Saf. 2008, 30, 110–129. [Google Scholar] [CrossRef] [Green Version]
- Meløysund, V.; Leira, B.; Høiseth, K.V.; Lisø, K.R. Predicting snow density using meteorological data. Meteorol. Appl. 2007, 14, 413–423. [Google Scholar] [CrossRef]
- Wang, T.-T. Characterizing crack patterns on tunnel linings associated with shear deformation induced by instability of neighboring slopes. Eng. Geol. 2010, 115, 80–95. [Google Scholar] [CrossRef]
- Poisel, R.; Am Tinkhof, K.M.; Preh, A. Landslide Caused Damages in a Gallery. Rock Mech. Rock Eng. 2016, 49, 2301–2315. [Google Scholar] [CrossRef]
Figure 1.
Study area with cross sections A−A’ and B−B’ for the geological model; in the photograph on the right the eastern entrance of the tunnel is indicated by a white arrow. GPS: Global Positioning System; PM: name of the GPS benchmark.
Figure 1.
Study area with cross sections A−A’ and B−B’ for the geological model; in the photograph on the right the eastern entrance of the tunnel is indicated by a white arrow. GPS: Global Positioning System; PM: name of the GPS benchmark.
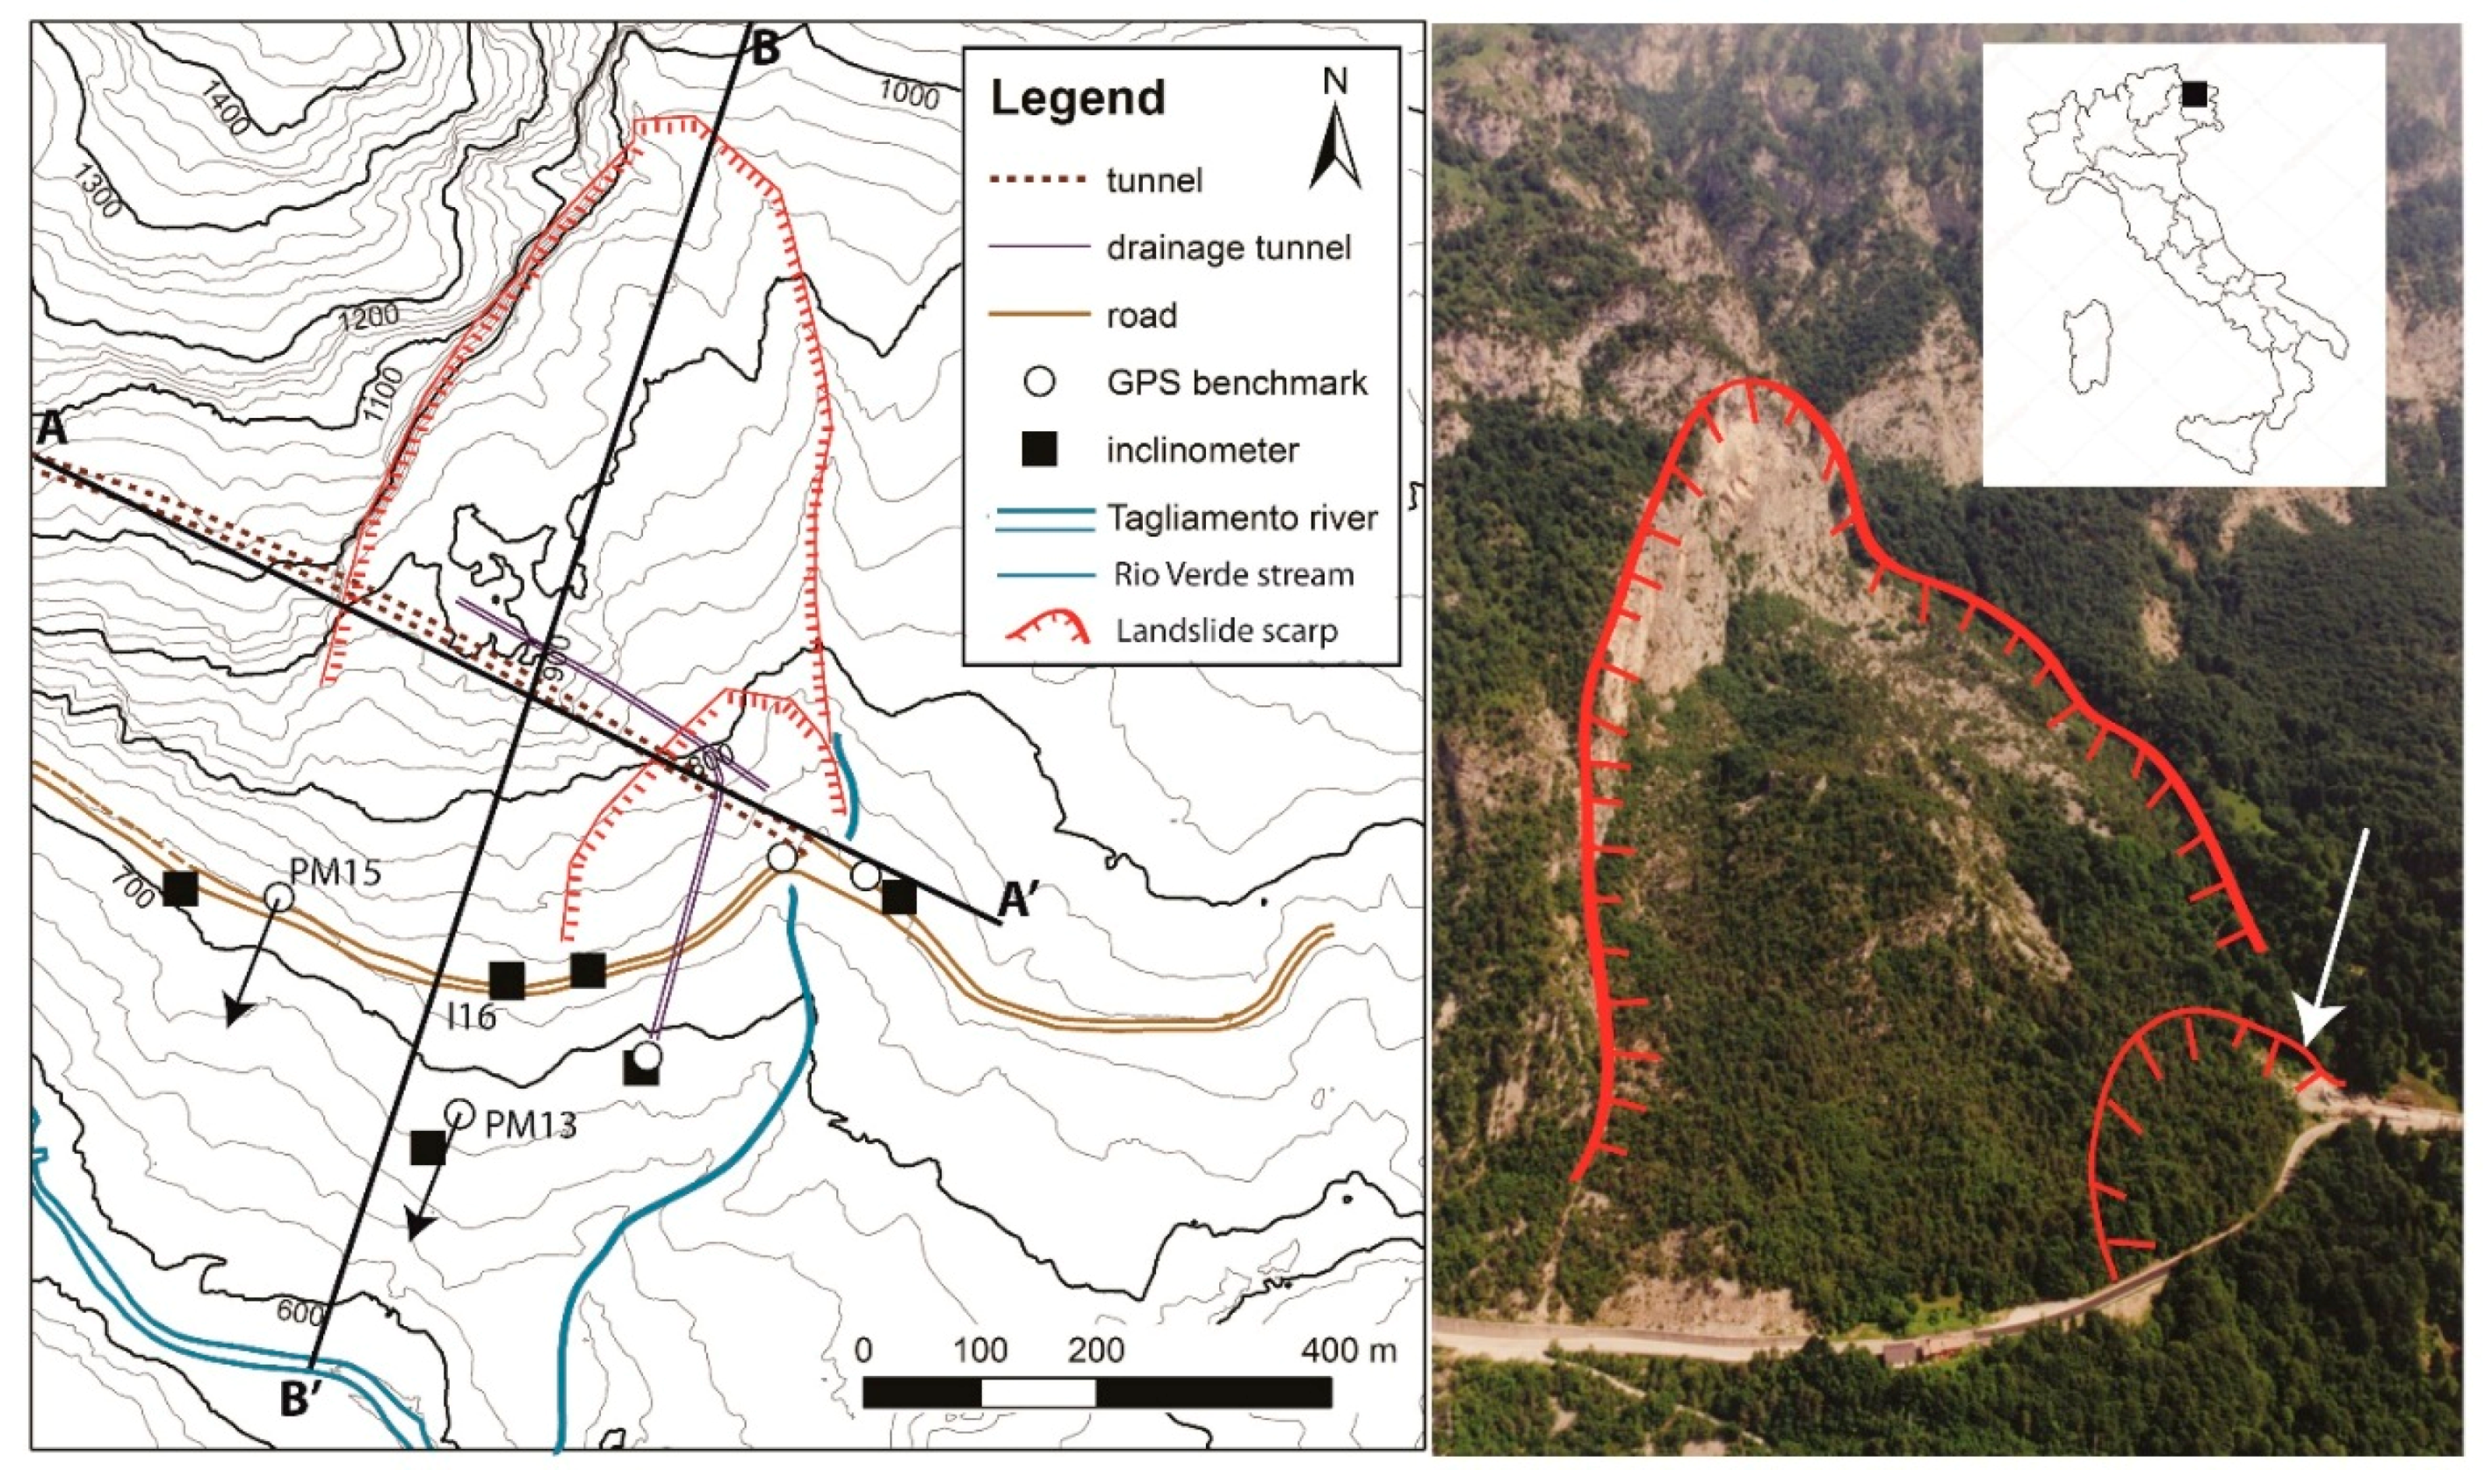
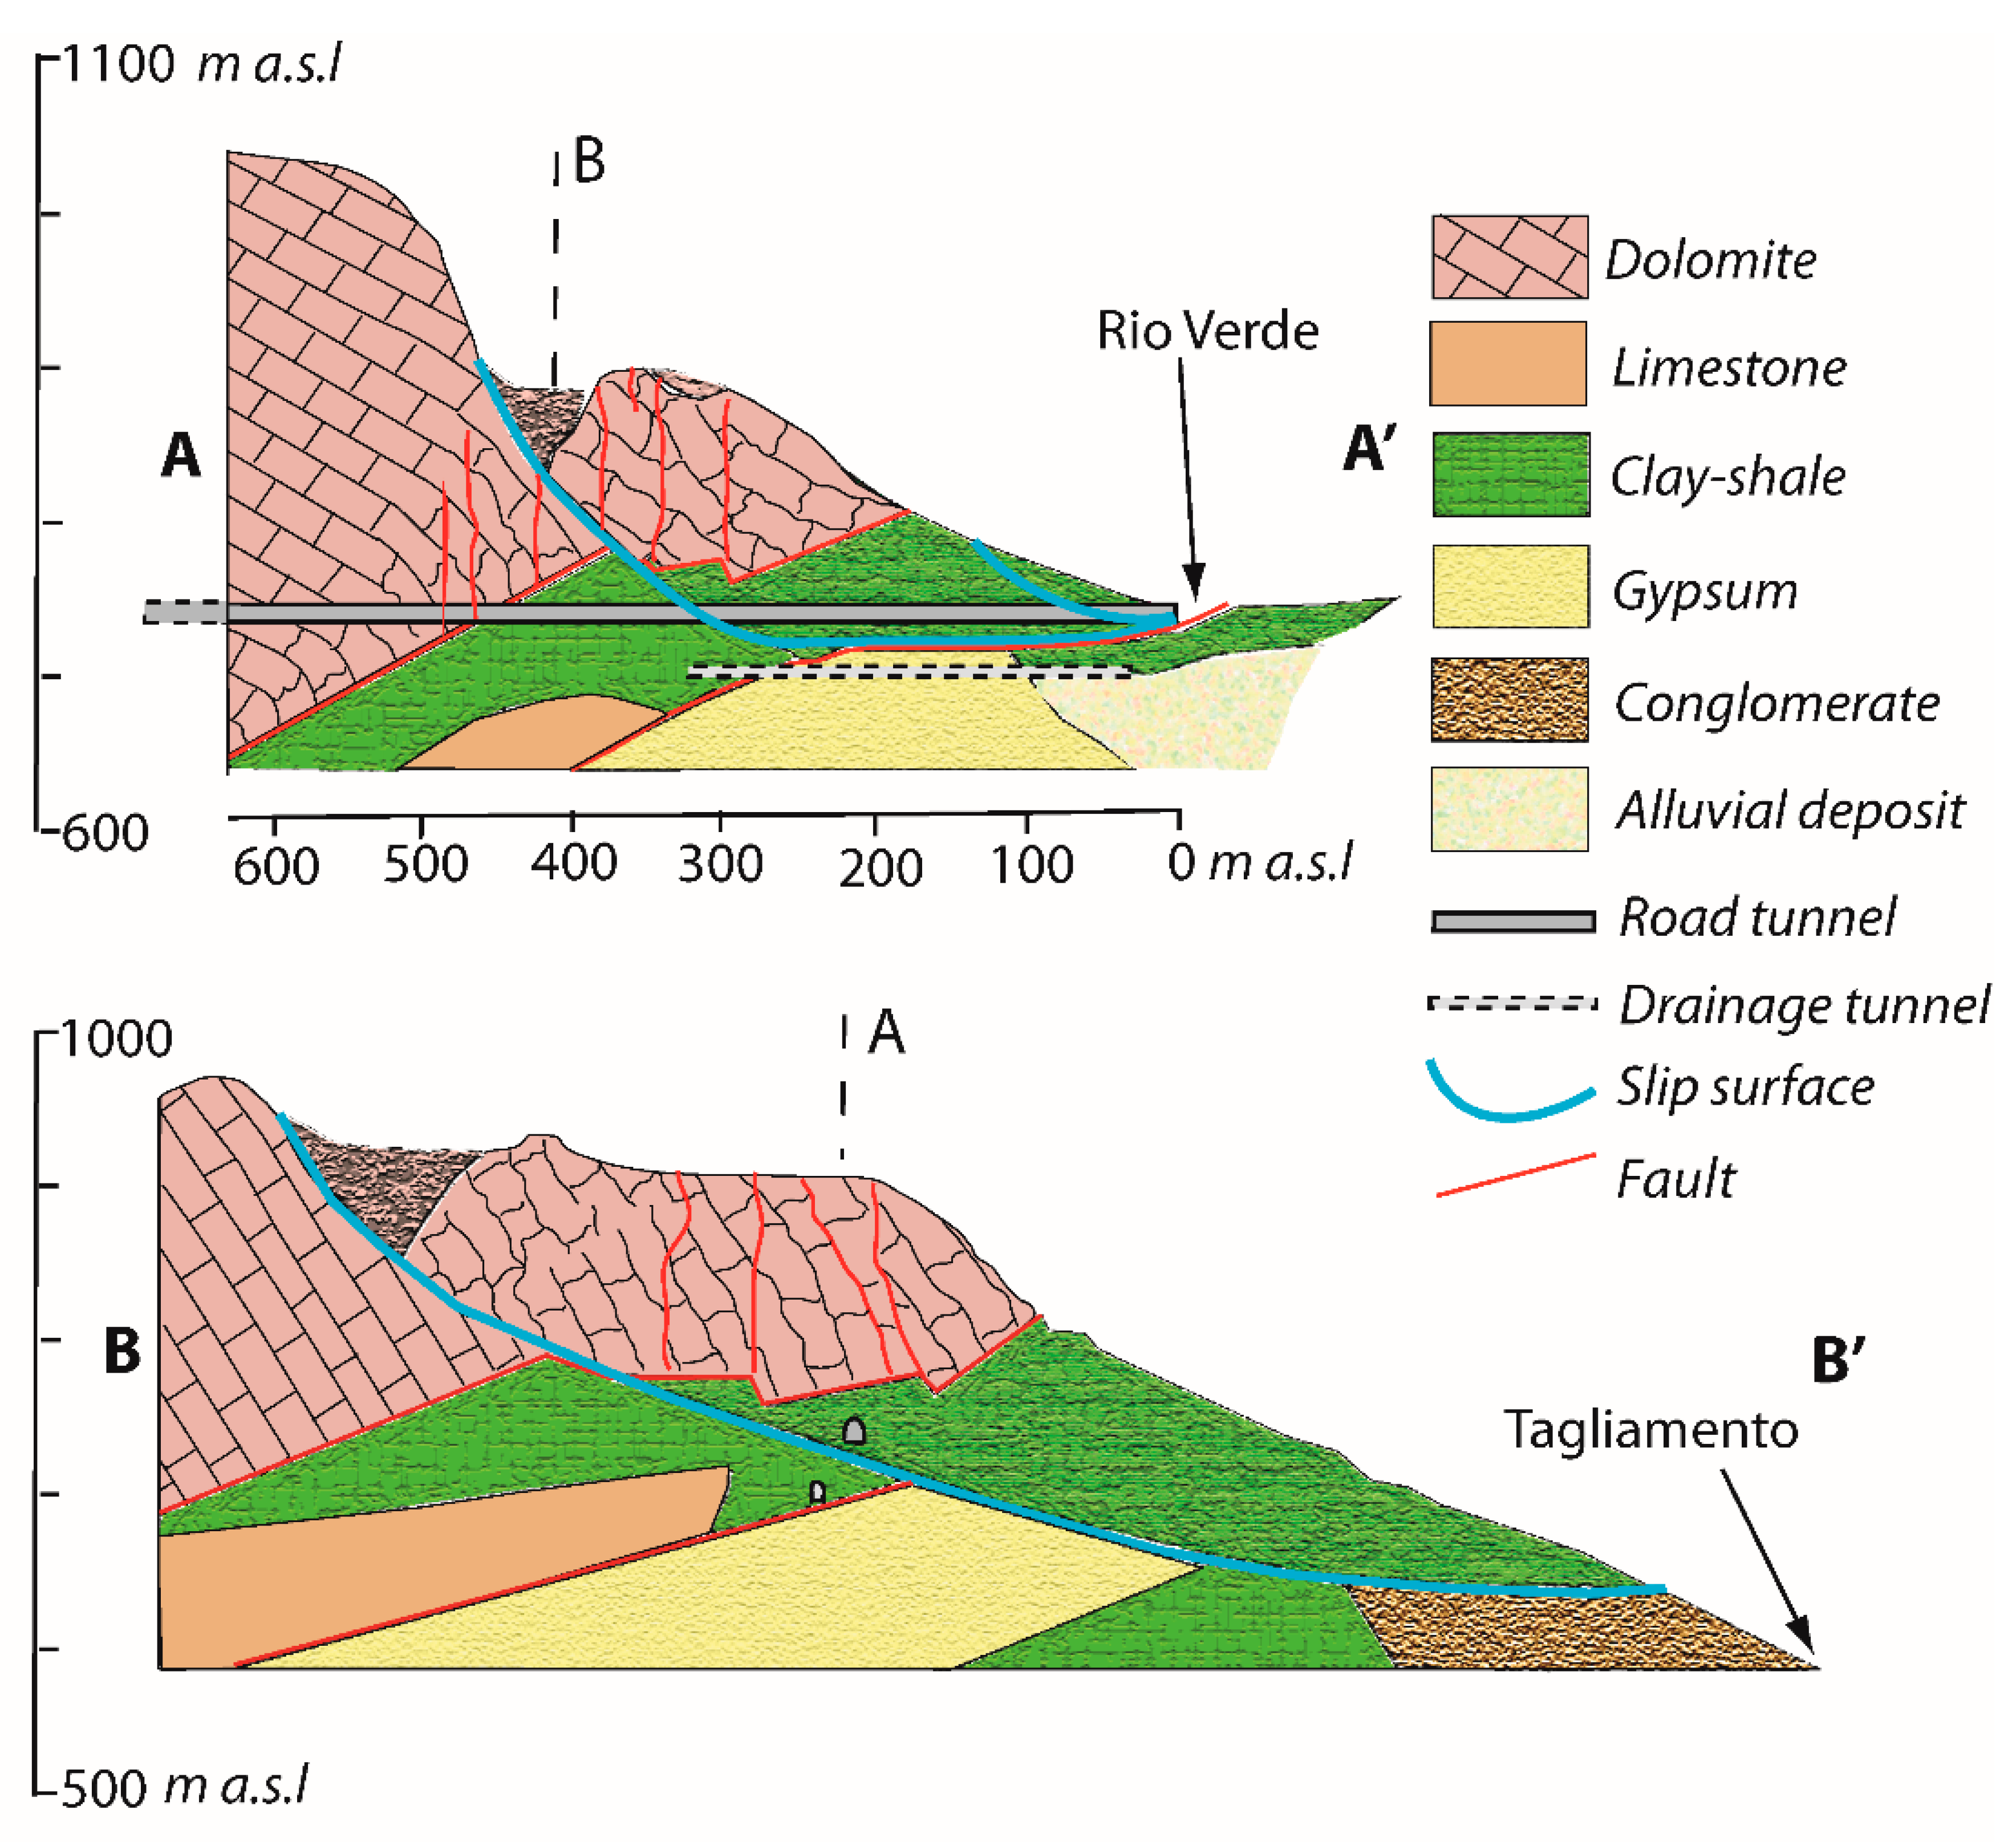
Figure 2.
Geological section of the block slide.

Figure 3.
Displacement recorded through periodic inclinometric surveys at the I16 borehole location (left); once the slip surface was identified (58 m below ground surface), in-place inclinometers were installed to monitor the displacement evolution (right).
Figure 3.
Displacement recorded through periodic inclinometric surveys at the I16 borehole location (left); once the slip surface was identified (58 m below ground surface), in-place inclinometers were installed to monitor the displacement evolution (right).
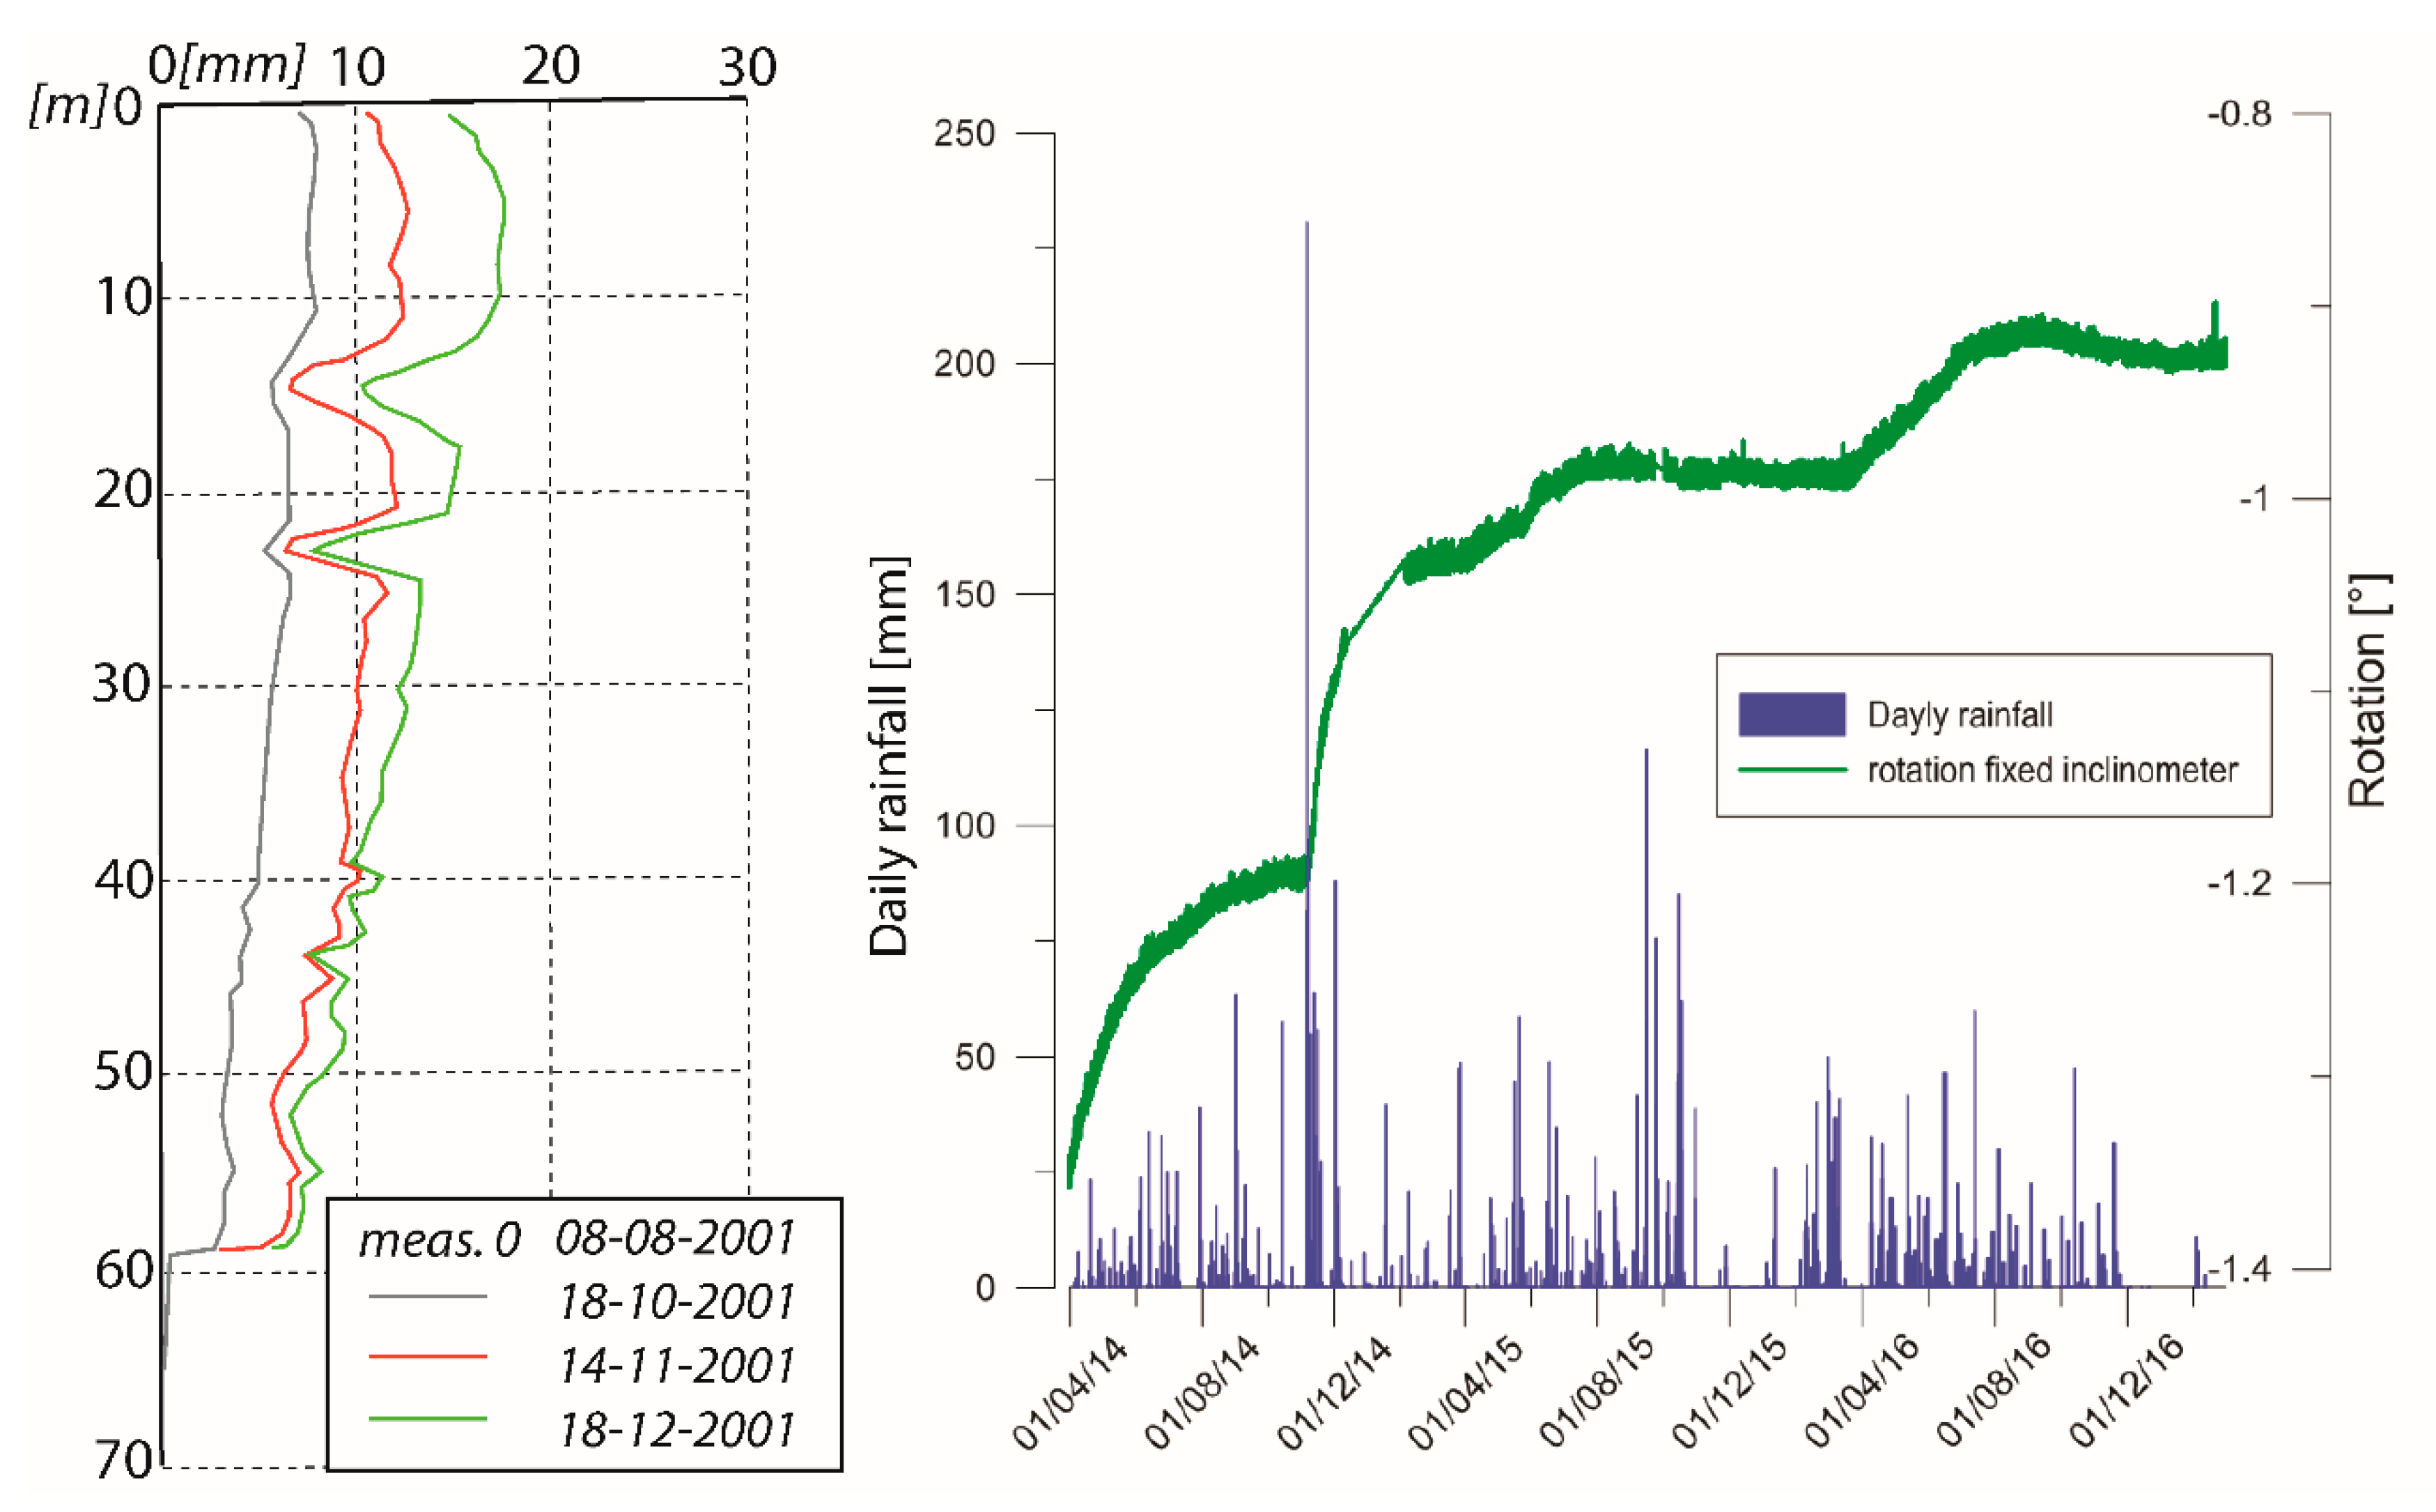
Figure 4.
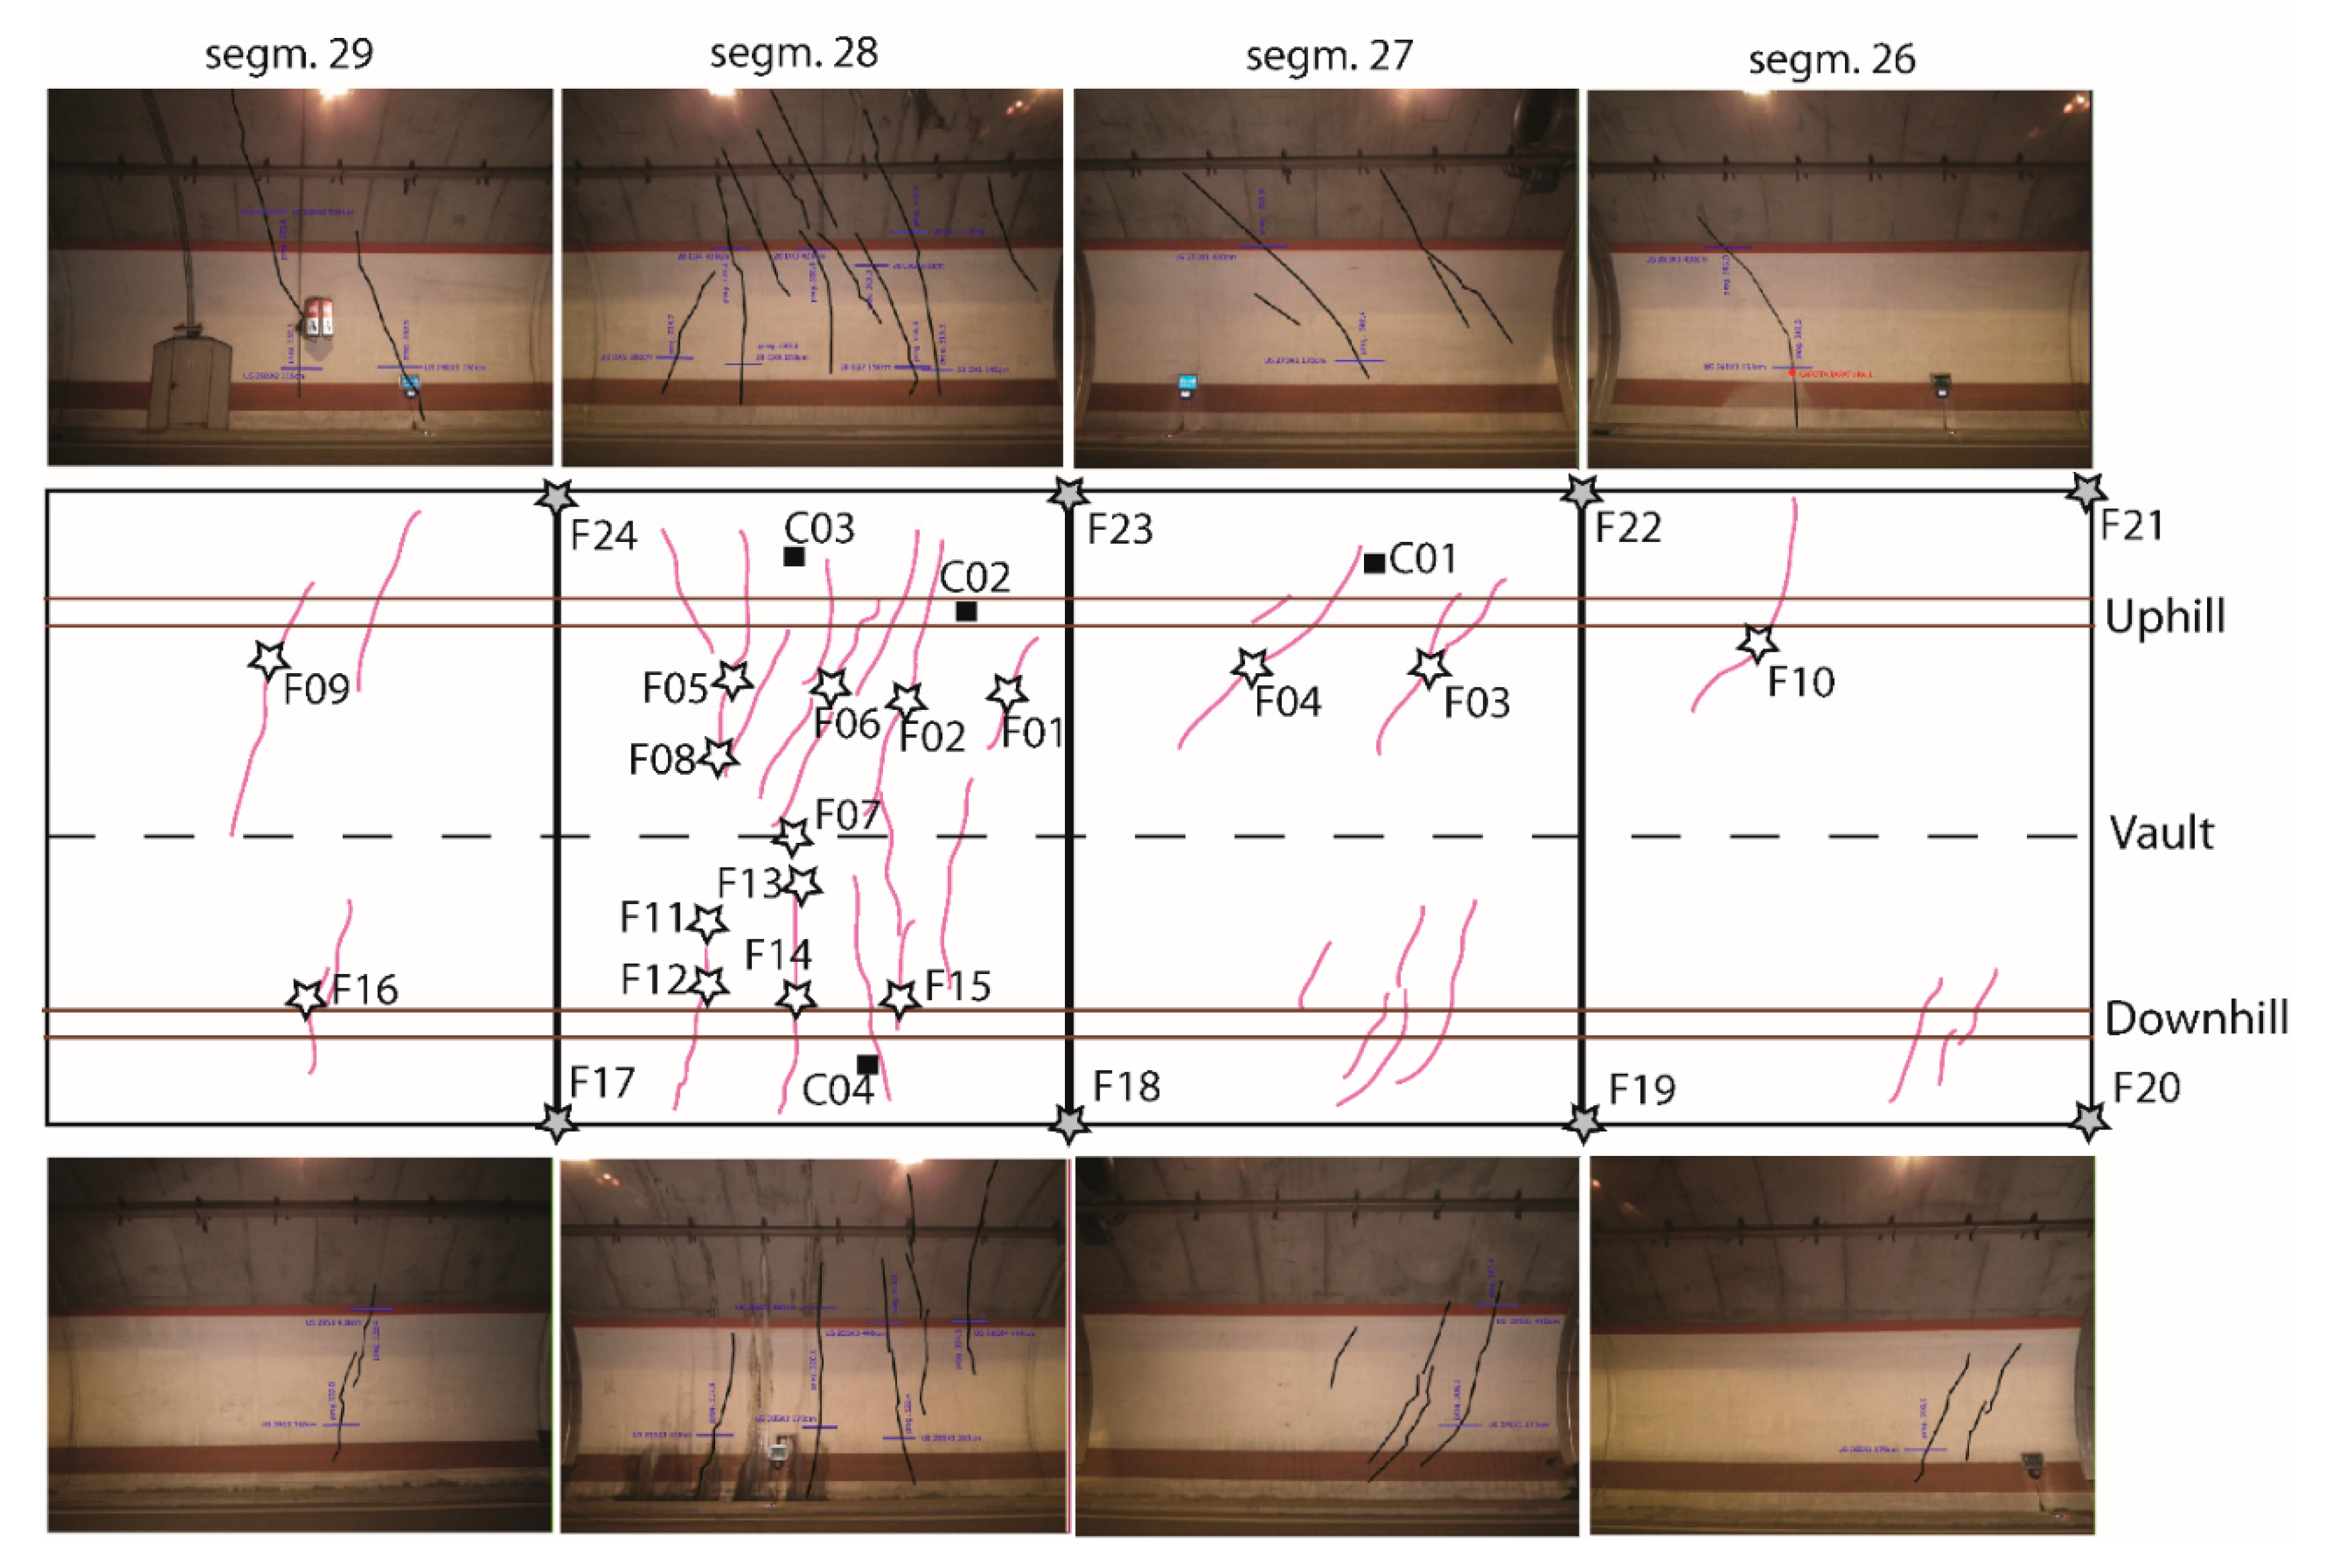
Distribution of tension cracks along the tunnel: the white stars refer to the crackmeters deployed along cracks, the grey stars to the crackmeter deployed between the segments and the black squares to the two-axis clinometers. The area comprises the section of the tunnel between 261 m and 309 m from the eastern entrance.
Figure 4.
Distribution of tension cracks along the tunnel: the white stars refer to the crackmeters deployed along cracks, the grey stars to the crackmeter deployed between the segments and the black squares to the two-axis clinometers. The area comprises the section of the tunnel between 261 m and 309 m from the eastern entrance.

Figure 5.
Scheme of the sensor sensing system. Each node of the sensing system indicates the need for the power supply and the data protocol used at each input port (2 G M2M: machine-to-machine modem enabling data transfer over a 2 G cellular network; MMF: multimode optical fibre; RS232: serial data protocol). Furthermore, the lengths of each link are reported.
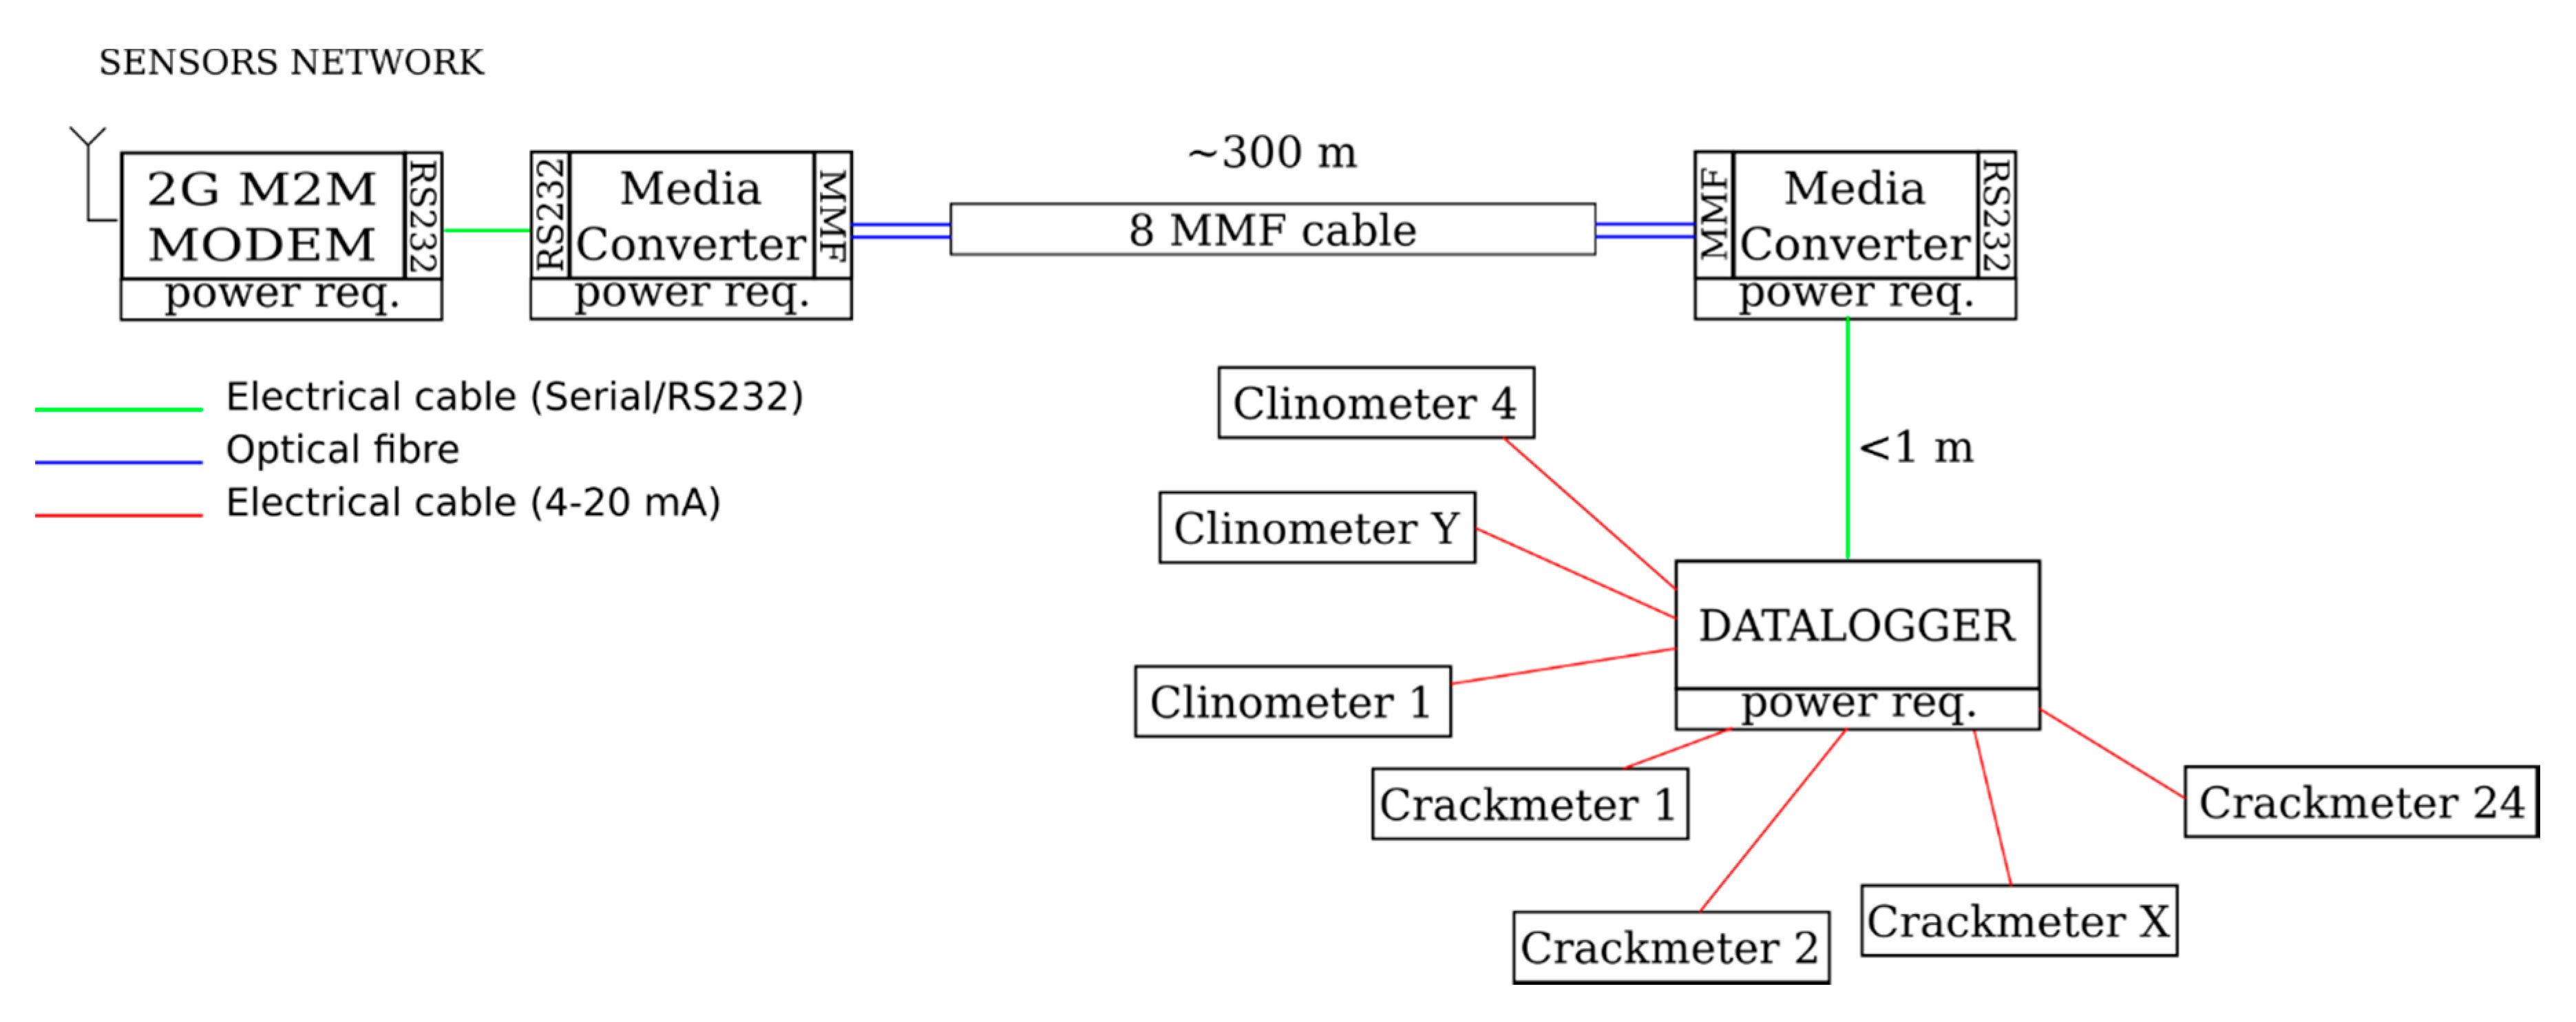
Figure 6.
An extensometer (A) and a clinometer (B) installed in the tunnel.
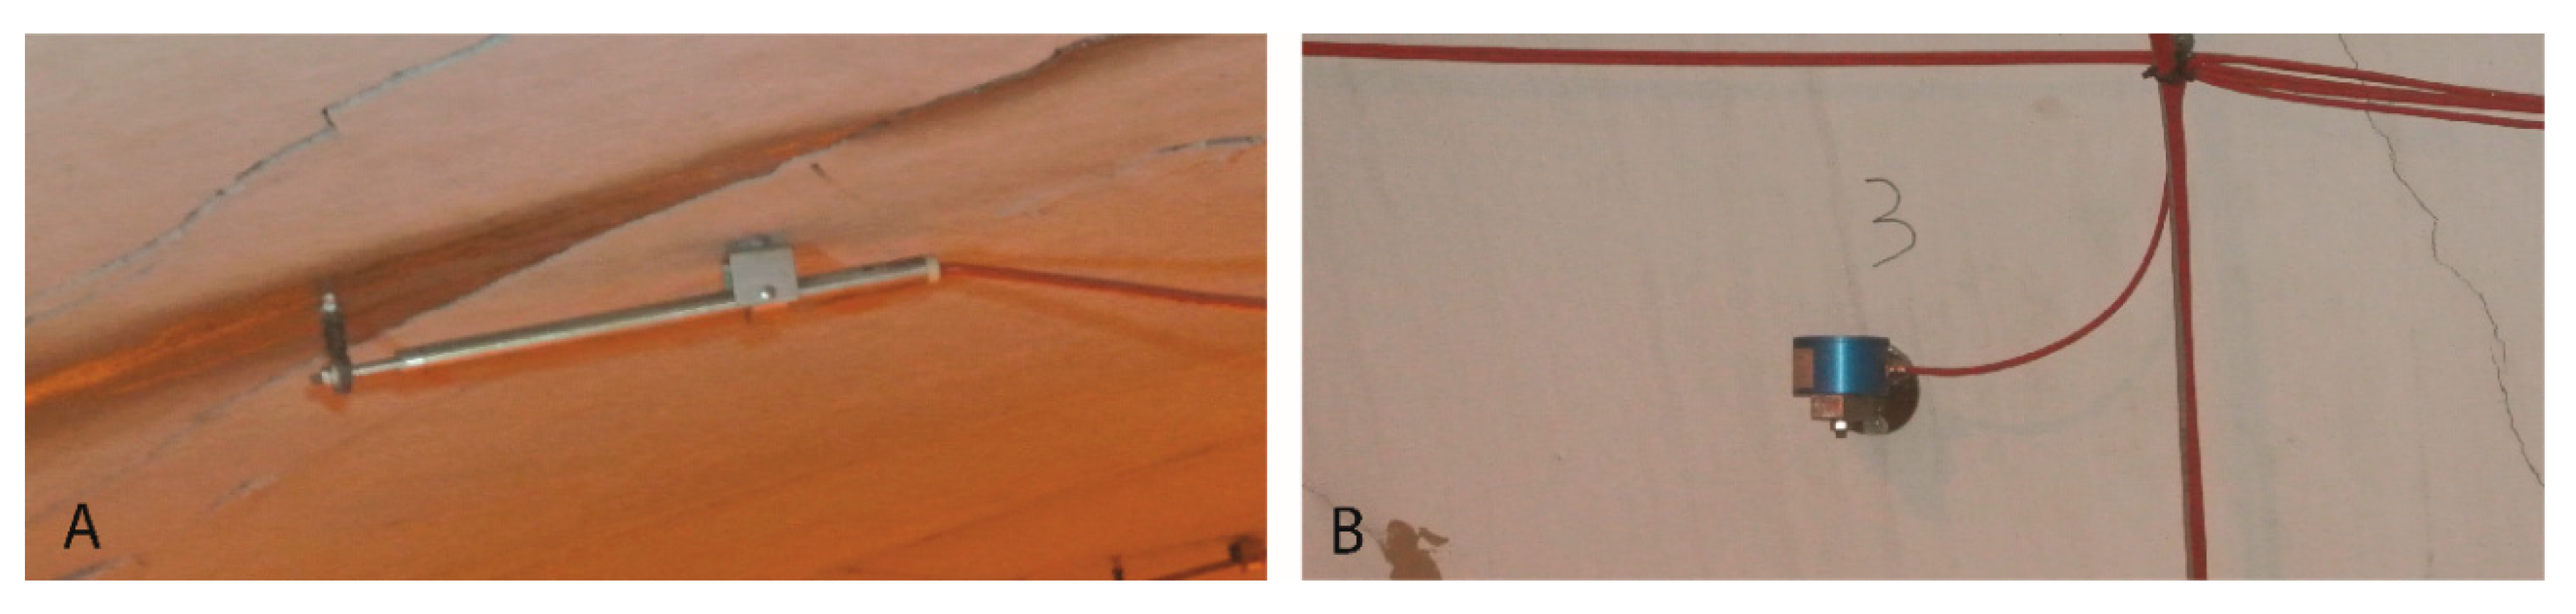
Figure 7.
Screenshot of the colour/arrow map for the tunnel monitoring system in the web-based platform.
Figure 7.
Screenshot of the colour/arrow map for the tunnel monitoring system in the web-based platform.
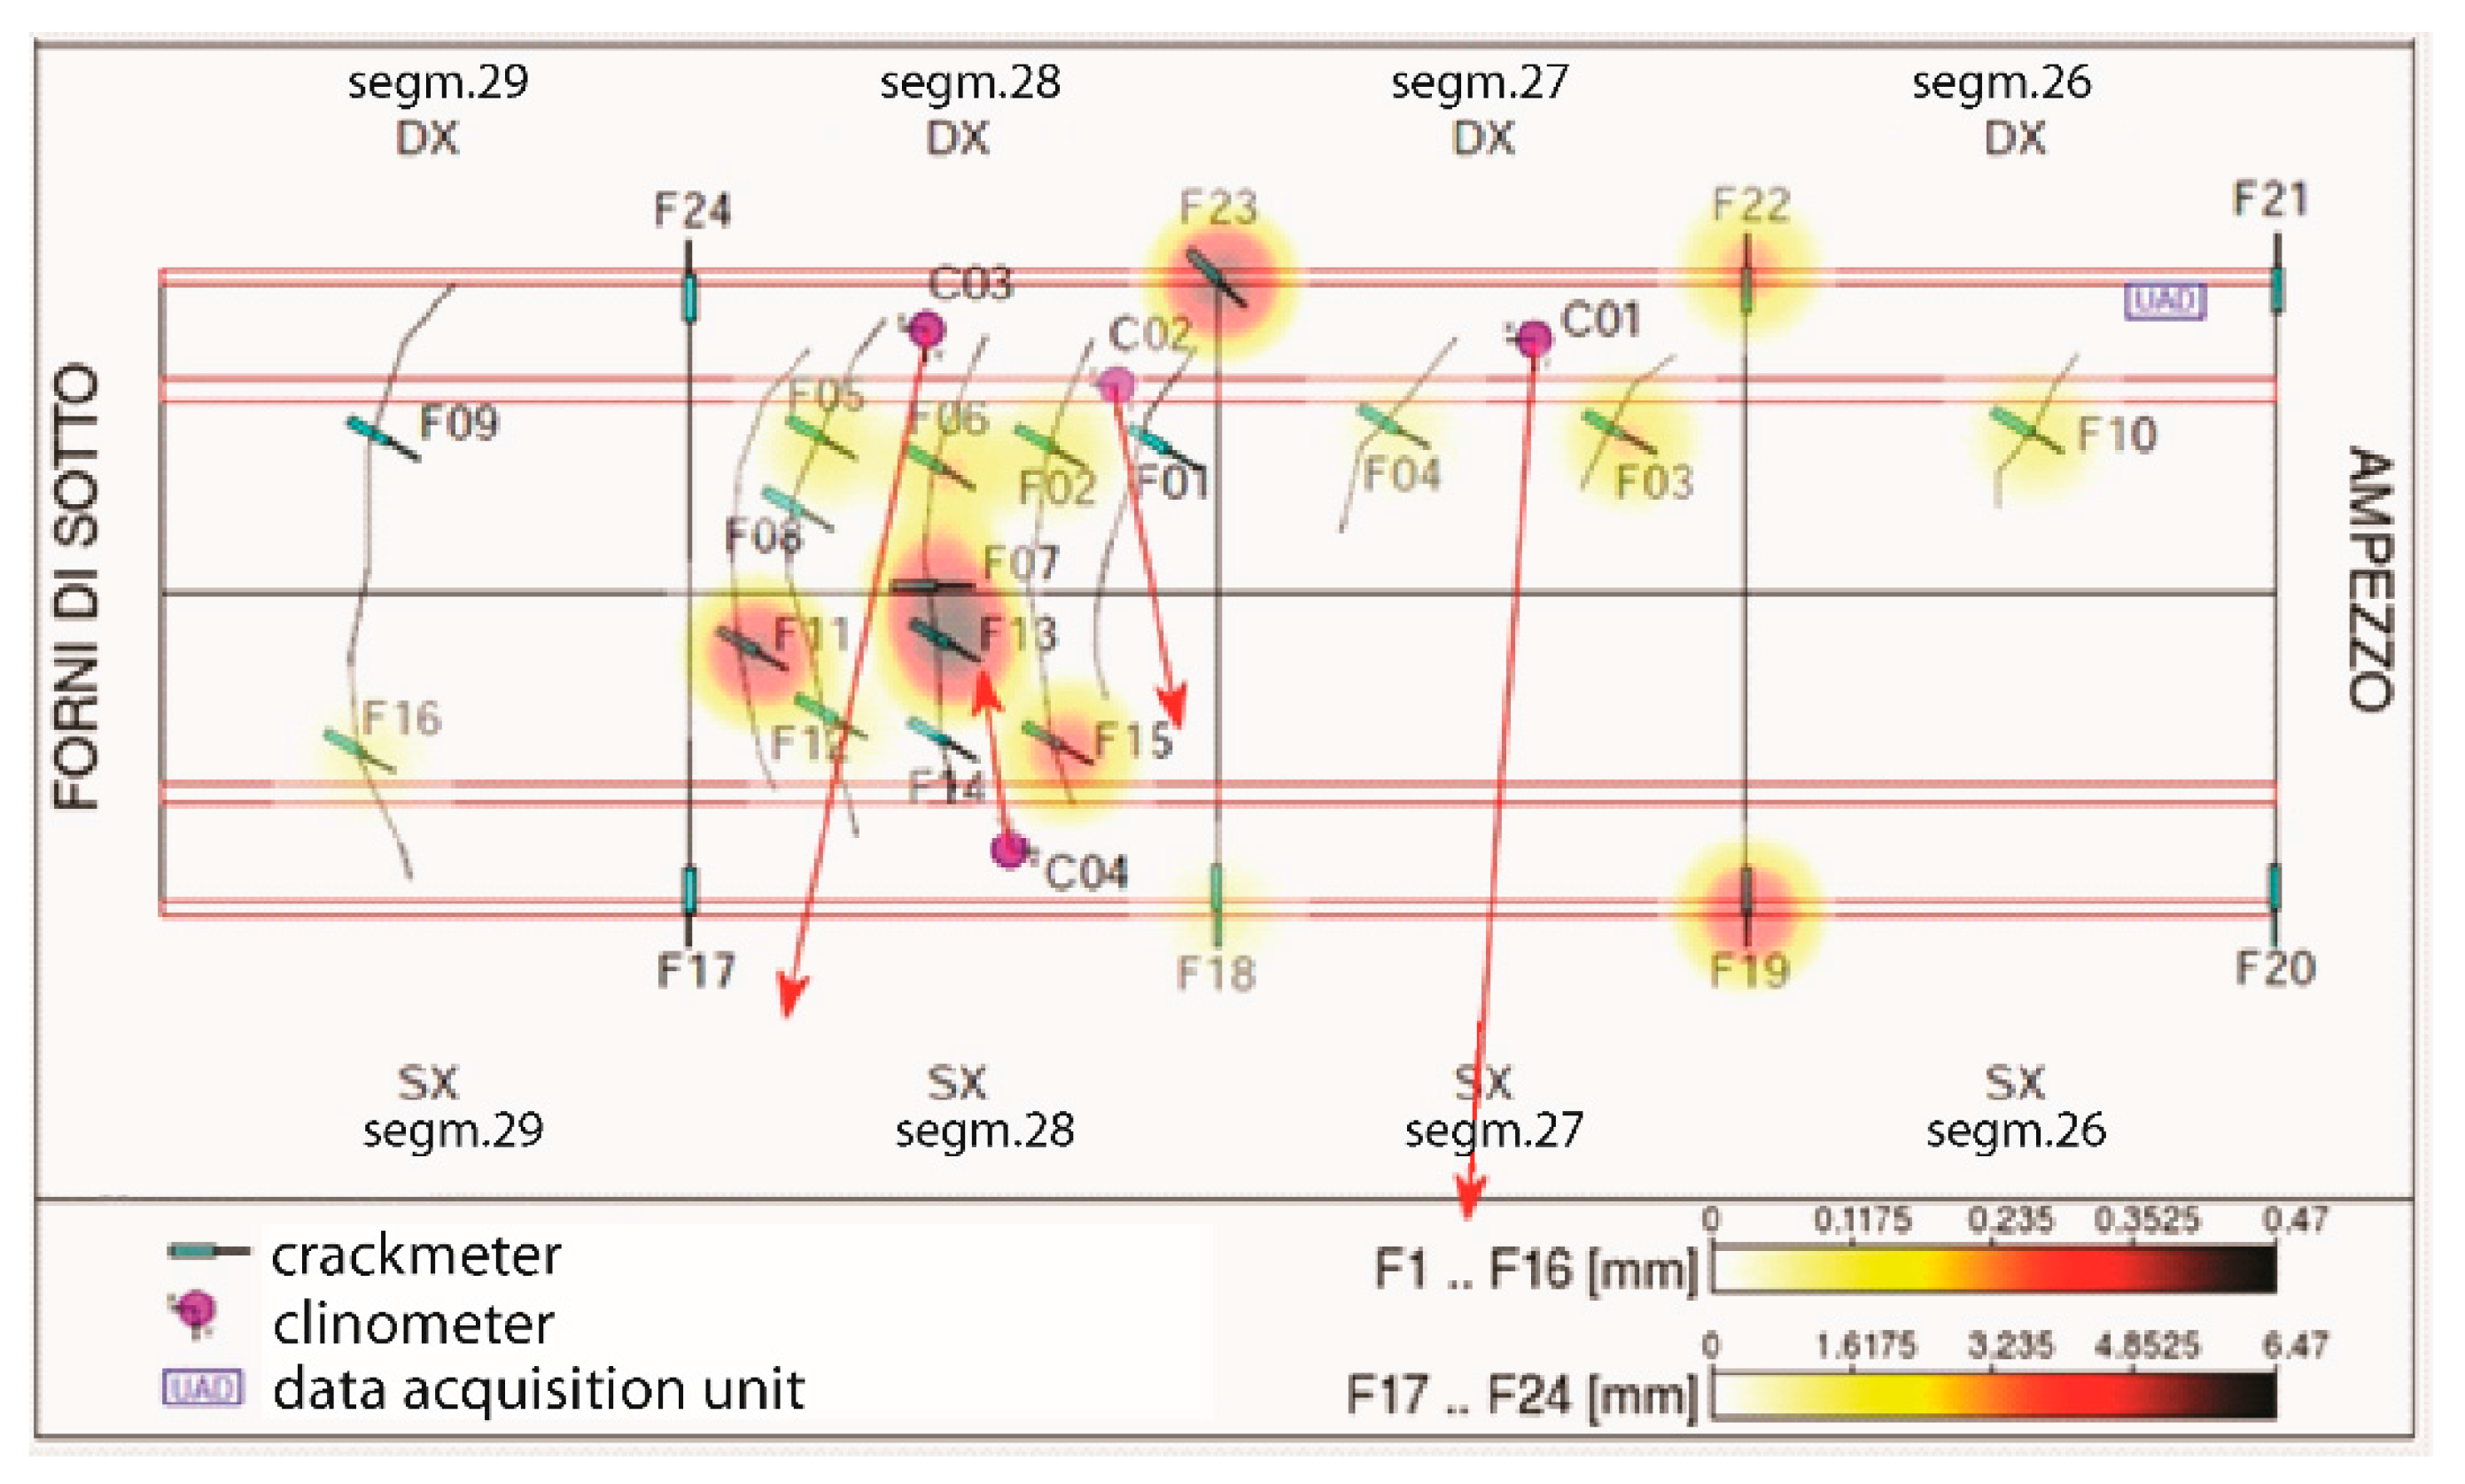
Figure 8.
Displacement recorded by the crackmeters deployed across the tunnel cracks—the graph has been produced directly through the web-based platform.
Figure 8.
Displacement recorded by the crackmeters deployed across the tunnel cracks—the graph has been produced directly through the web-based platform.

Figure 9.
Displacement recorded by crackmeters F07, F11 and F13 plotted with the water discharge recorded in the drainage system within the road tunnel—the graph has been produced directly from the web-based platform.
Figure 9.
Displacement recorded by crackmeters F07, F11 and F13 plotted with the water discharge recorded in the drainage system within the road tunnel—the graph has been produced directly from the web-based platform.
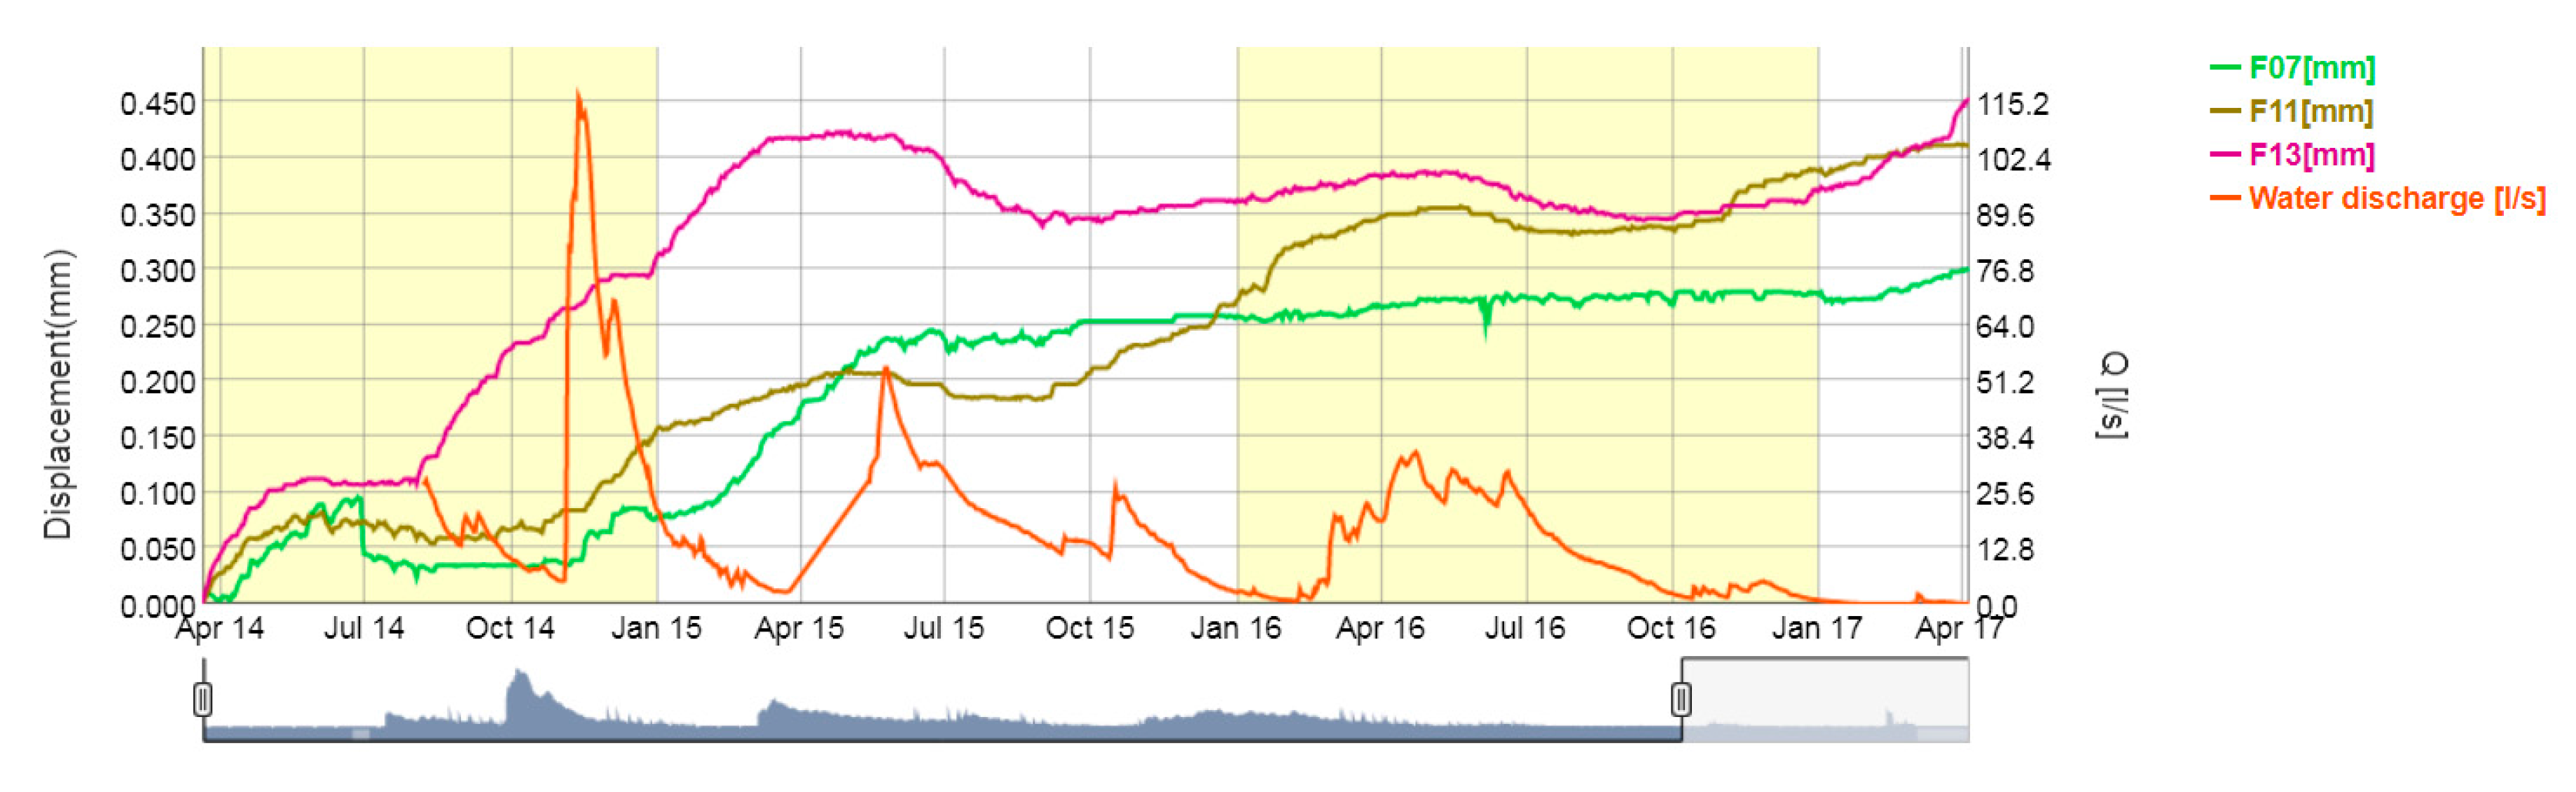
Figure 10.
Displacements recorded by the internal segments crackmeters in the three-year period—the graph has been produced directly through the web-based platform.
Figure 10.
Displacements recorded by the internal segments crackmeters in the three-year period—the graph has been produced directly through the web-based platform.

Figure 11.
Rotation of the two-axis clinometers plotted with the water discharge inside the drainage system within the road tunnel—the graph has been produced directly through the web-based platform.
Figure 11.
Rotation of the two-axis clinometers plotted with the water discharge inside the drainage system within the road tunnel—the graph has been produced directly through the web-based platform.

Figure 12.
Landslide: estimated loading scheme and tunnel response.

Figure 13.
Vector representation of the rotation of the clinometers in the tunnel; bottom left: the rotation recorded by clinometer C04 associated with the displacements recorded by crackmeter F15.
Figure 13.
Vector representation of the rotation of the clinometers in the tunnel; bottom left: the rotation recorded by clinometer C04 associated with the displacements recorded by crackmeter F15.


Table 1.
Data for internal segments group of crackmeter.
| F18 | F19 | F22 | F23 | |
|---|---|---|---|---|
| Cumulative displacement over three years | 1.25 mm | 4.88 mm | 3.17 mm | 6.47 mm |
| Displacement rate over three years | 10.5 µm/day | 37.30 µm/day | 24.24 µm/day | 48.34 µm/day |
| Displacement rate between November 2014 and March 2015 | 23.44 µm/day | 89.04 µm/day | 63.17 µm/day | 115.09 µm/day |
© 2017 by the authors. Licensee MDPI, Basel, Switzerland. This article is an open access article distributed under the terms and conditions of the Creative Commons Attribution (CC BY) license (http://creativecommons.org/licenses/by/4.0/).
Share and Cite
MDPI and ACS Style
Bossi, G.; Schenato, L.; Marcato, G. Structural Health Monitoring of a Road Tunnel Intersecting a Large and Active Landslide. Appl. Sci. 2017, 7, 1271. https://doi.org/10.3390/app7121271
AMA Style
Bossi G, Schenato L, Marcato G. Structural Health Monitoring of a Road Tunnel Intersecting a Large and Active Landslide. Applied Sciences. 2017; 7(12):1271. https://doi.org/10.3390/app7121271
Chicago/Turabian StyleBossi, Giulia, Luca Schenato, and Gianluca Marcato. 2017. "Structural Health Monitoring of a Road Tunnel Intersecting a Large and Active Landslide" Applied Sciences 7, no. 12: 1271. https://doi.org/10.3390/app7121271
Note that from the first issue of 2016, this journal uses article numbers instead of page numbers. See further details here.