Fatigue Analysis of Greenhouse Structure under Wind Load and Self-Weight


Research & Business Cooperation Center, Institute for Advanced Engineering, 175-28, Goan-ro 51, beon-gil, Baegam-myeon, Yongin-si KS009, Korea
*
Author to whom correspondence should be addressed.
Appl. Sci. 2017, 7(12), 1274; https://doi.org/10.3390/app7121274
Submission received: 7 November 2017
/
Revised: 28 November 2017
/
Accepted: 29 November 2017
/
Published: 7 December 2017
Abstract
:The design strength of a greenhouse structure is generally determined by analyzing strength after applying wind load using the wind pressure coefficient according to a design guide. Until now, the stability analysis for wind load has been performed through static structural analysis. However, a greenhouse is subjected to dynamic wind loads of various amplitudes, and it is reasonable to judge stability through fatigue analysis. For fatigue analysis, a stress-normalized model was constructed based on the square of wind speed, and the value obtained by squaring wind speed was used as dynamic load time data. Life cycle was calculated under stress generated by self-weight by compensating fatigue estimation stress. Furthermore, the effect of self-weight was examined and errors of up to 21% were obtained depending on the configuration of the stress-normalized model. When self-weight and wind speed were applied simultaneously, the effect of self-weight reduced when the stress-normalized model was used at high wind speed. Therefore, it is appropriate that the fatigue analysis is based on the fatigue stress model normalized by the square of wind speed, fatigue estimation stress is corrected to the static stress due to self-weight, and the square of wind speed is used as the dynamic load.
1. Introduction
In recent years, the greenhouse structures used in horticulture facilities have become larger and lighter. Climate is changing rapidly owing to global warming, and the damage caused by wind, heavy snow, and heavy rain is increasing. Several researchers are investigating the stability of greenhouse structures. Julio Soriano et al. calculated wind load at the maximum wind speed, performed structural analysis using the wind load factor according to the standards of Brazil and the EU (European Union), and they evaluated stability by considering the moment and maximum stress distribution in columns [1]. Park Choon-Wook et al. conducted an analytical investigation using the optimal design technique [2,3]. Tong Lewei compared wind loads according to the standards of Europe and China and compared the stress distribution of main materials with respect to static load [4]. In addition, Ajit K. Nayak evaluated the wind load on greenhouses, in addition to their structural stability [5]. Furthermore, A. J. Bronkhorst et al. investigated wind load for the stability design of a duo-pitch-shaped greenhouse [6]. B. von Elsner et al. examined the structural and functional characteristics of greenhouses based on the design requirements of the EU [7]. José Gabriel Vieira Neto et al. applied wind load and evaluated the frame stress of various structural forms of the single-span pitch roof type to evaluate the effect of pressure coefficients according to European standards and the Brazilian standard ABNT [1]. Seung-Hyeon Jung et al. analyzed the wind profile to calculate the wind pressure of a greenhouse to study the characteristics of wind speed [8]. Young-duk et al. investigated the wind speed distribution in South Korea. In particular, Camilo Carrillo et al. investigated the determination of the Weibull parameter for wind energy [9]. Frank W. Kan et al. conducted a study on the classification and distribution of wind speed and on the wind spectrum [10]. The fatigue analysis for wind load was also carried out in various ways [11]. Zhao Fang et al. conducted a wind-induced fatigue analysis of high-rise steel structures using an equivalent structural stress method [12]. In addition, Basaran C. et al. have been studying the fatigue analysis by applying thermodynamic theory, but it is still difficult to apply to complex objects. Therefore, in this study, the existing fatigue analysis method is applied and analyzed [13,14,15,16].
However, these studies in greenhouses did not reflect the characteristics of wind load for a simple model or the dynamic characteristics of wind load as a method of evaluating the maximum stress of frame. They only compared the degree of the experiment and analysis of wind pressure coefficients and evaluated the appropriateness of applying the result to the design of wind load, or evaluated the maximum stress of the frame at the maximum wind speed through static structural analysis of a simple model. These studies were conducted for only one dynamic load or one static load. No study has been conducted yet on the stability of a structure due to the complex loads in which both dynamic loads and static loads are simultaneously applied—such as wind and self-weight—to a detailed model of the structure.
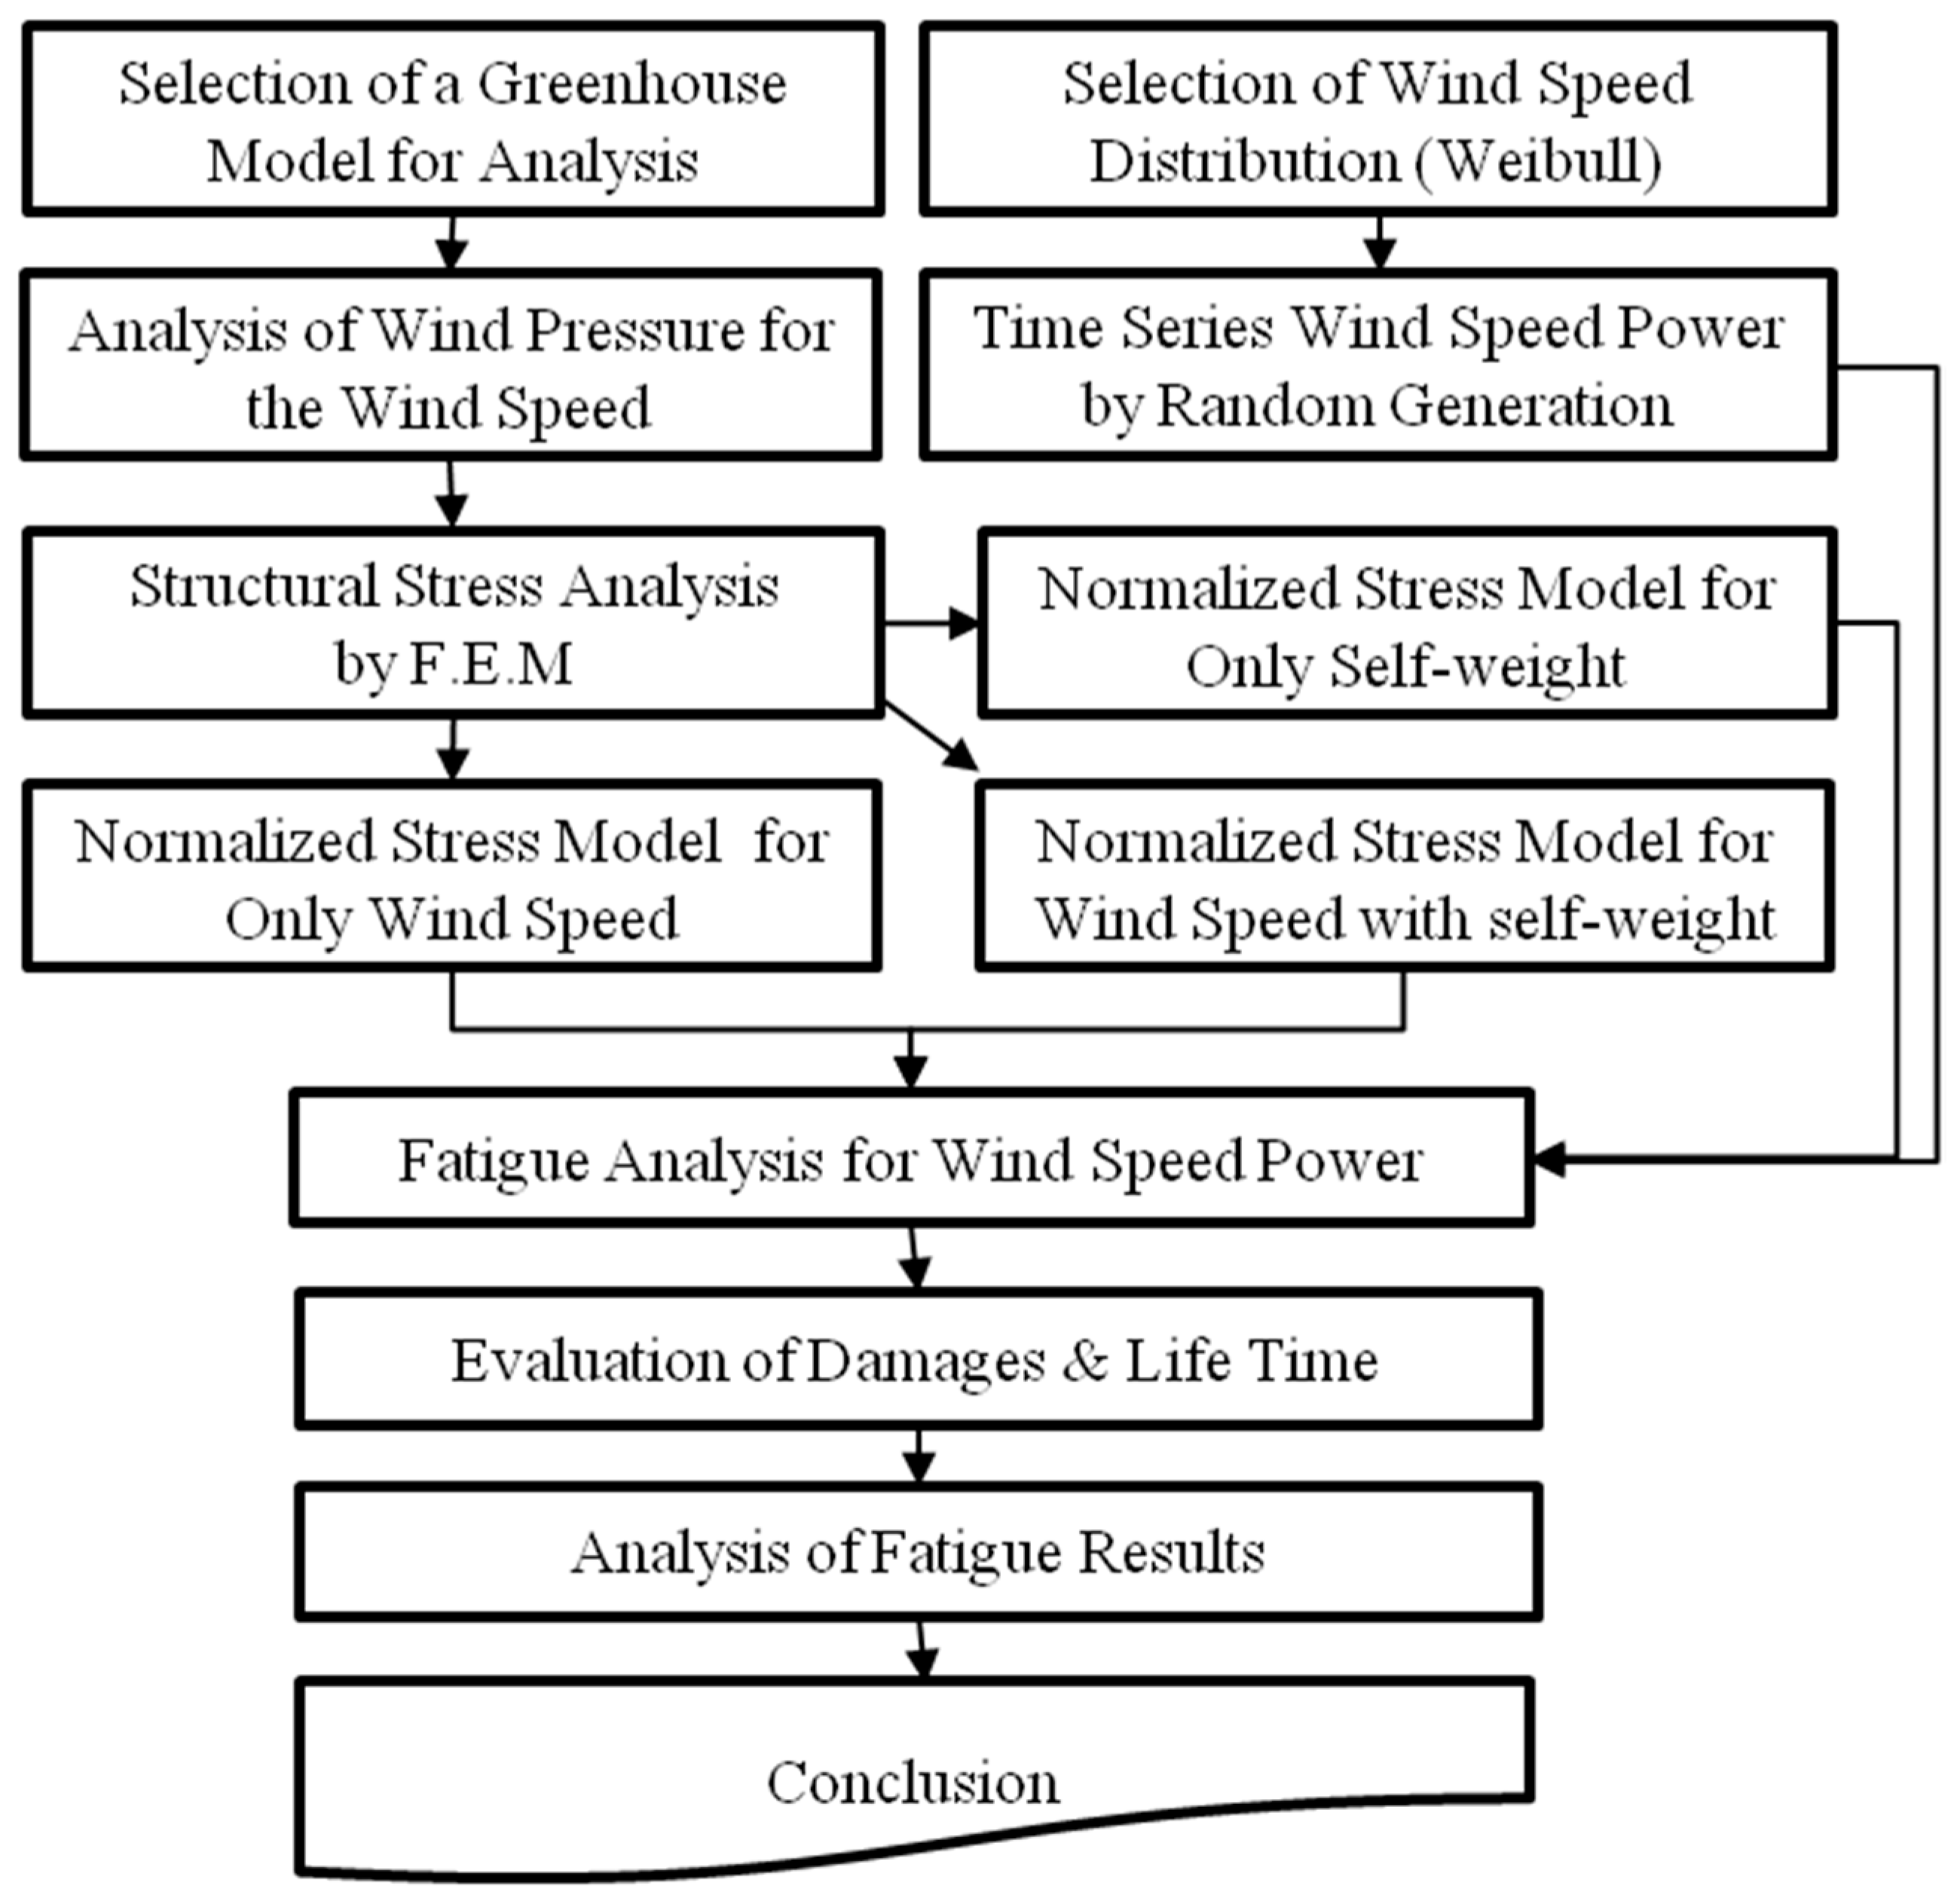
In this study, the changes in the stress distribution of structures were examined under a combination of self-weight and wind loads, and fatigue life was predicted by creating time series data for wind speed through the random generation of the Weibull distribution. The wind pressure on the exterior of a greenhouse was calculated through fluid dynamics analysis and applied as wind load. Furthermore, for the stress model of fatigue analysis, stress, which was obtained through structural analysis based on wind load, was normalized by the square of wind speed. Various analyses were performed for investigating the effectiveness of self-weight, including the compensation of fatigue estimation stress and neglecting self-weight. An appropriate fatigue analysis methodology was proposed by comparing the fatigue analysis results with those of the stress-normalized model. Figure 1 shows the flowchart of this process.
2. Description of Model and Analysis Method
2.1. Time Series Data of Wind Speed
The most widely used probability density function for fitting wind data is the Weibull distribution, which is defined as [17]
where k is the shape parameter, c is the scale parameter, and v is wind speed.
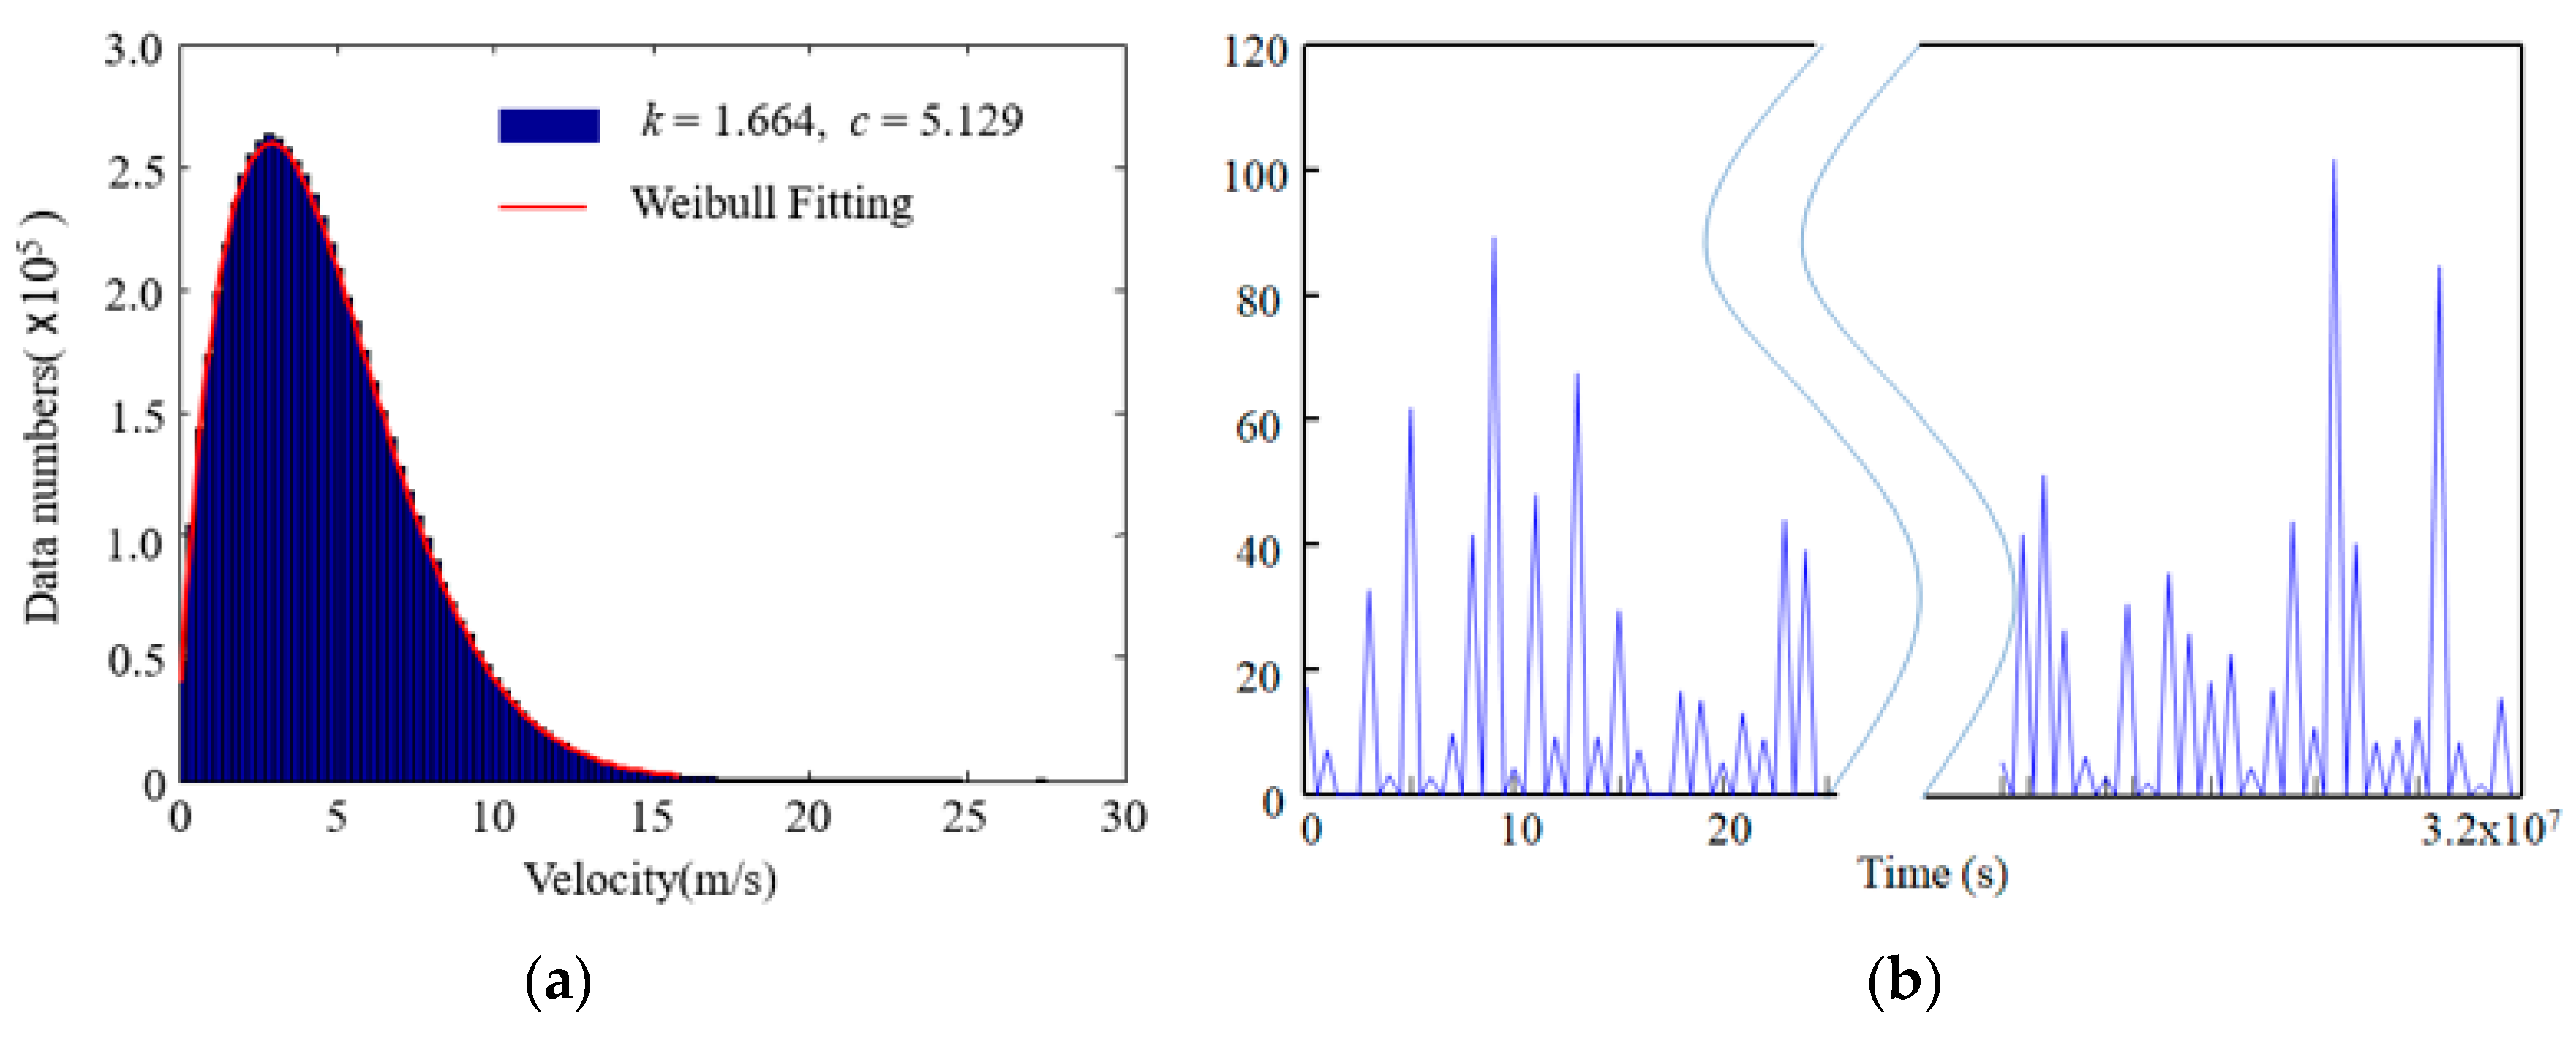
Therefore, wind speed was assumed to follow the Weibull distribution. Based on the reference [18], a shape parameter (k) of 1.664 and a scale parameter (c) of 5.129 were selected as the Weibull parameters; these parameters are appropriate for the island regions in Korea. For the time series data required for fatigue analysis, wind speed was generated randomly below 2 Hz in approximately 3.2 × 10⁷ data using the probability density of the Weibull distribution [10]. This corresponds to half-year data in 0.5 s intervals. Furthermore, the maximum wind speed was set as 30 m/s or lower because the greenhouse structure is designed such that its safety is ensured at these speeds. The frequency and time data of the wind data of these conditions are shown in Figure 2.
2.2. Description of Model and Analysis Condition
In this study, a three-span Venlo-peach-type ventilated greenhouse with a floor area of approximately 560 m2 is used, as shown in Figure 3 [19]. This model is designed to withstand a wind speed of 30 m/s. The detailed dimensions are shown in Table 1. The dimensions of the flow field domain for fluid dynamics analysis are shown in Figure 3 and Table 1. The flow analysis space is configured to have least eight times the length and at least four times the height of the greenhouse to minimize the effects of interfaces. The mass and momentum equations were solved for flow analysis, and the standard κ-ε model was solved to consider the turbulence model analysis with a high Reynolds number [20,21]. The air temperature in the flow field was assumed to be 20 °C, the density of air was set as 1.207 kg/m3, and the viscosity of air was set as 1.85 × 10⁻⁵ kg/ms. As the boundary conditions of the analytical model, the entrance was selected as a velocity inlet, the outlet was selected as a pressure outlet, and non-slip conditions were applied to the bottom area. Inlet velocity varied with height to reflect the fact that wind speed varies according to the roughness of the ground surface. The average velocity distribution according to the height of the entrance is
where u is the inlet velocity at a point and h is the height of fluid domain.
u = 0.186 × log (100 × h) + 2.393
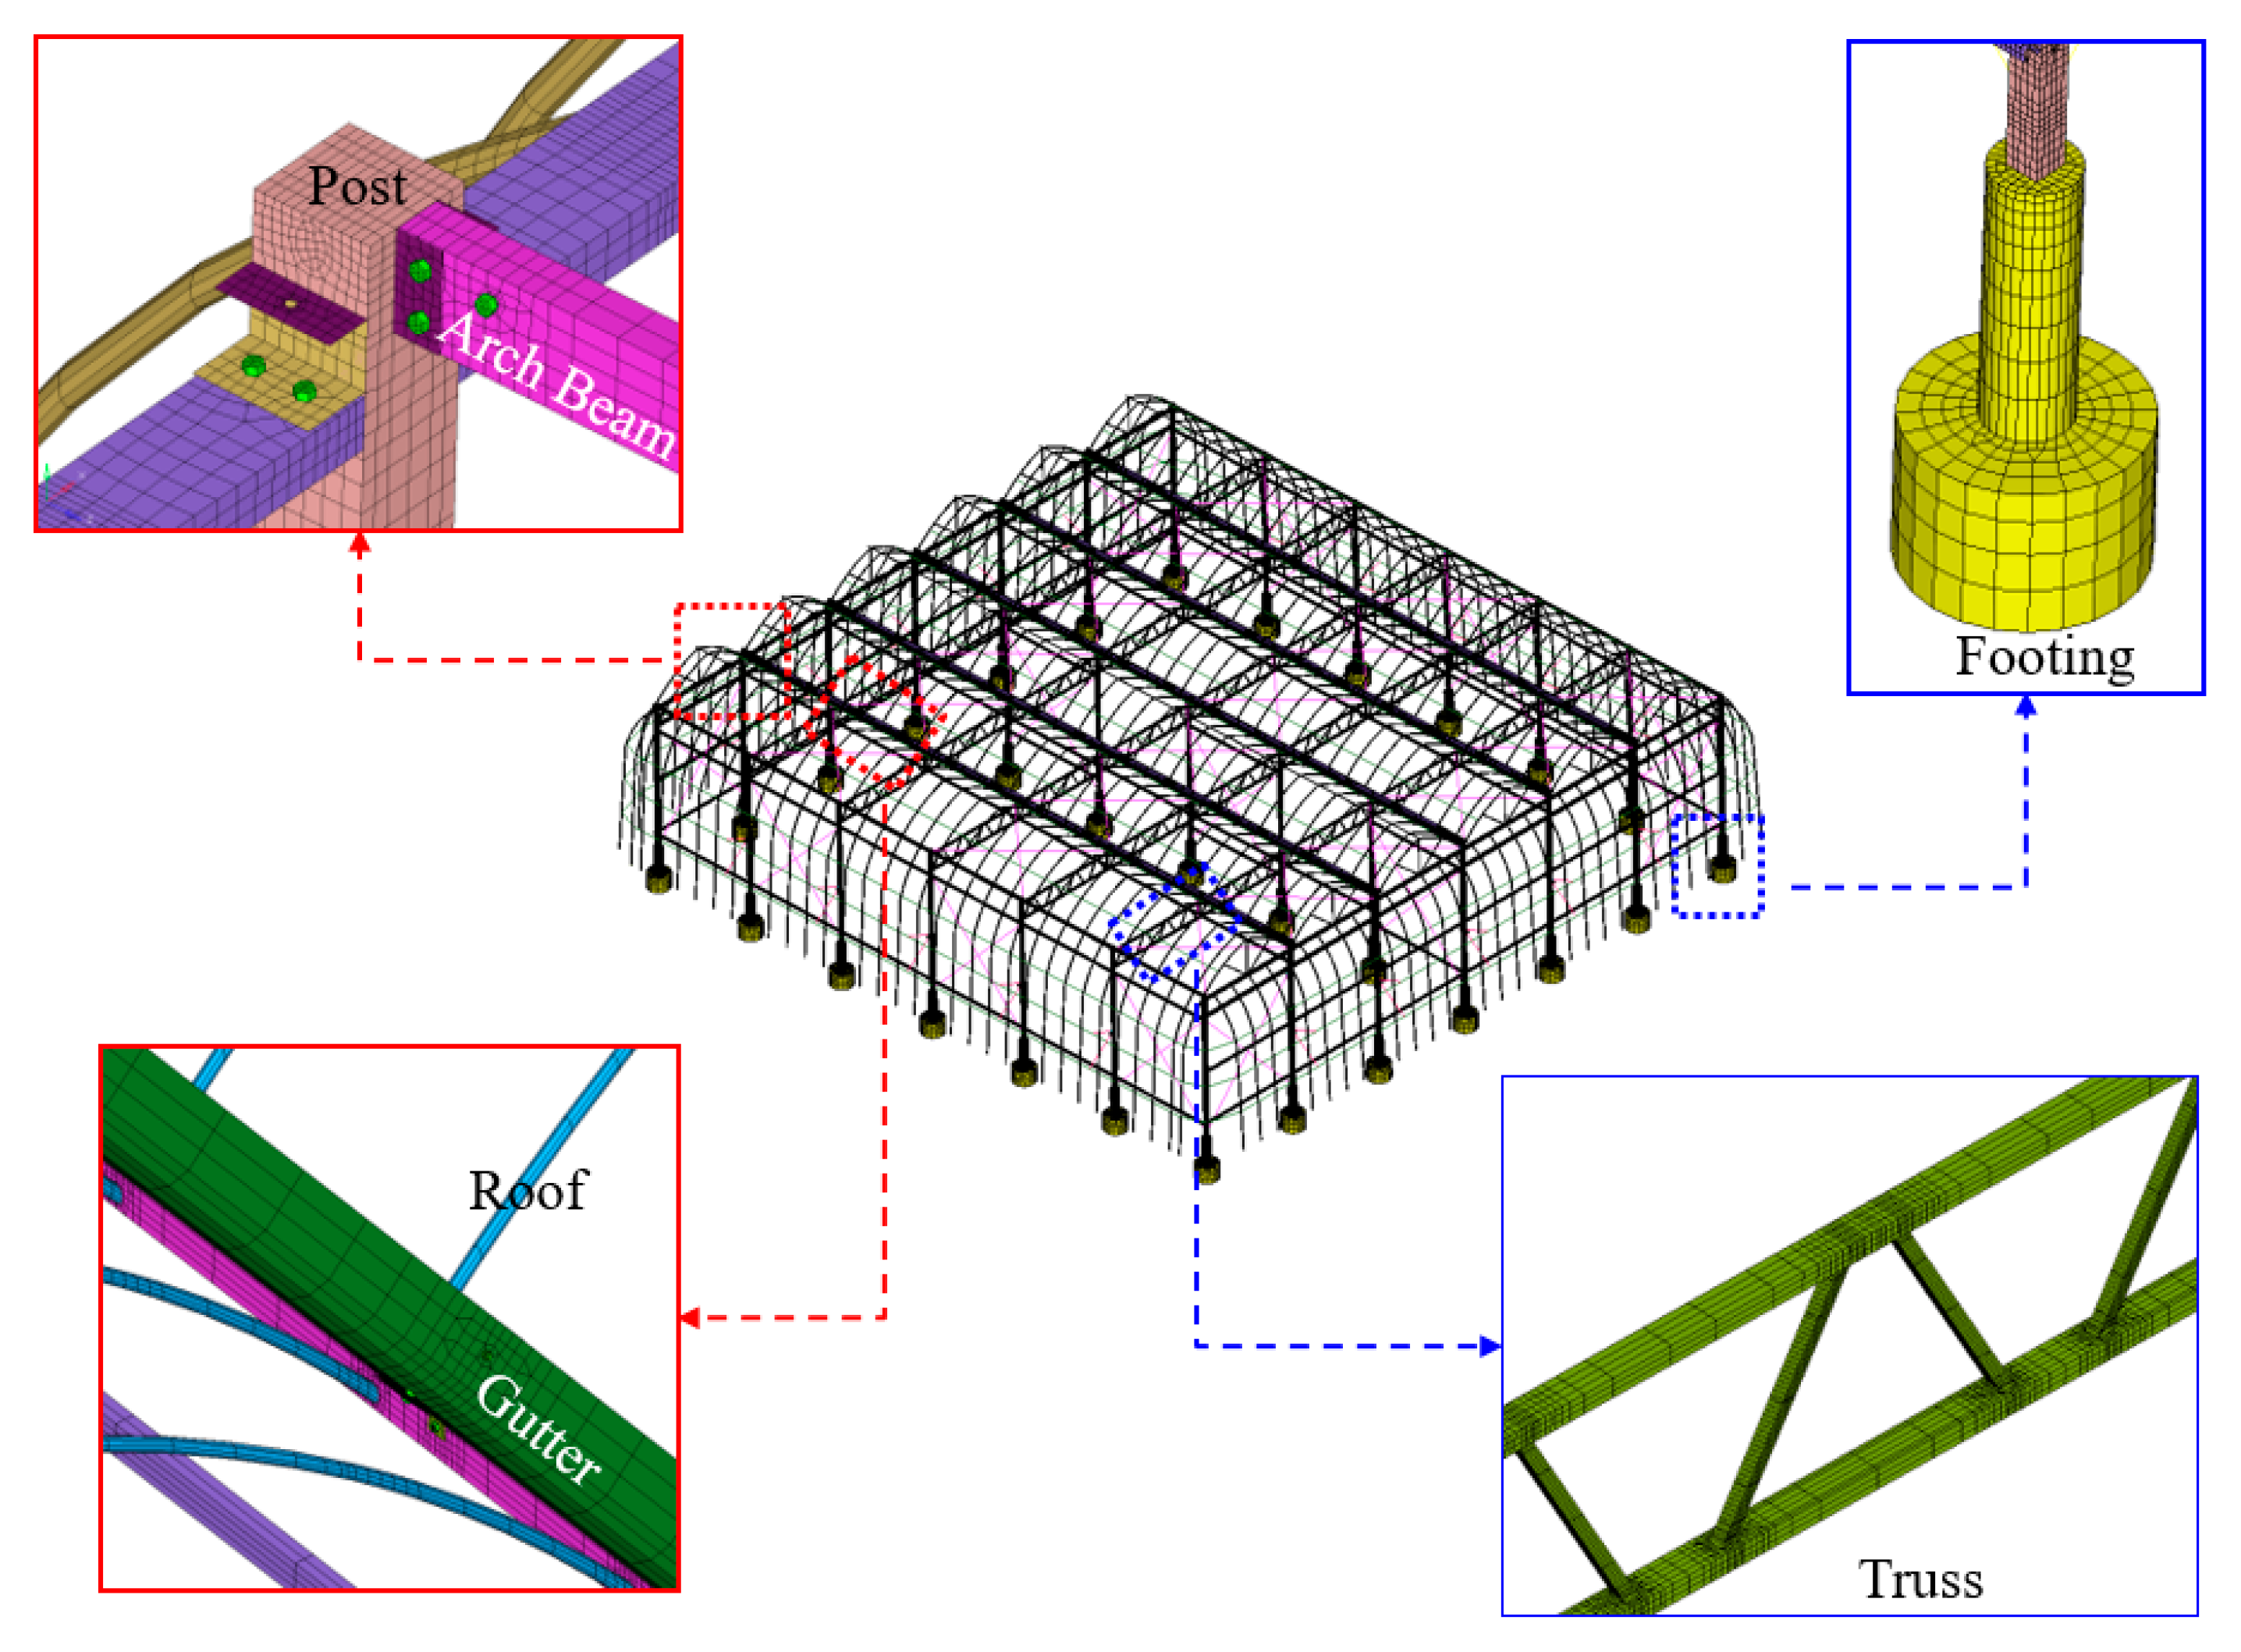
As the boundary condition of the structure model, the part in contact with the ground is fixed. The finite element model and material properties of the structure are shown in Figure 4 and Table 2, respectively. The pressure obtained through flow analysis is mapped to the finite elements of the greenhouse surface in contact with wind to apply wind load to the structure.
Structural analysis is performed by applying self-weight and wind load independently and by applying self-weight and wind load simultaneously. Here, self-weight is a static load and wind is a dynamic load. When the combined force of wind and self-weight is applied, the stress generated in each can be written in the principle of superposition as
where is compensated stress to fatigue estimation, is stress due to self-weight, is stress due to wind load. The stress due to the self-weight () has a constant static stress, independent of time. Wind load, on the other hand, is a dynamic load () that varies with time. Therefore, it is reasonable to compensation the stress due to the self-weight () to the pre-stress because it is independent of the fatigue load data when the stress due to the dynamic load and the stress due to the static load act simultaneously.
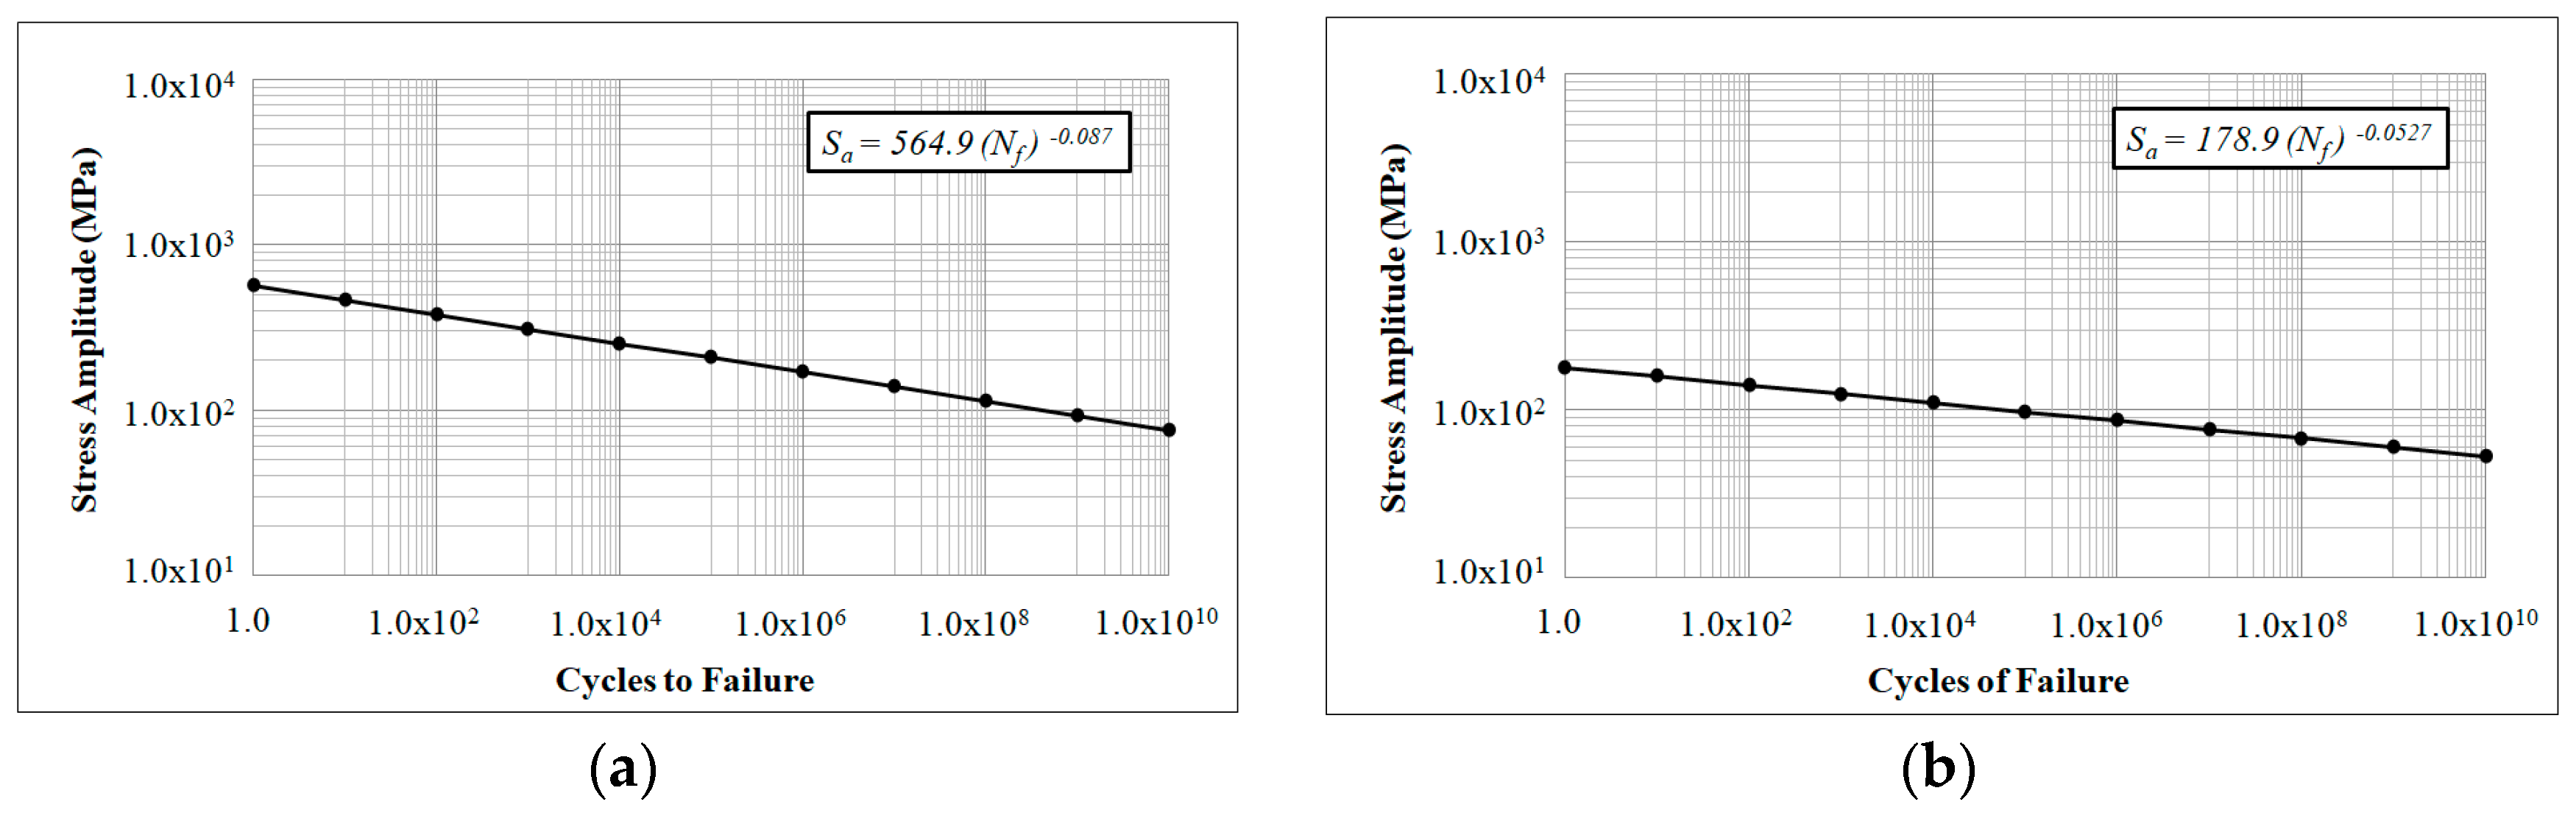
The structural stress model for fatigue analysis is configured by normalizing the structural analysis results by the square of wind speed. Fatigue is analyzed using the S–N (Stress versus the Number of cycles to failure) curve, which consists of a log–log plot. The S–N curve of zinc-plated SPSR 400, which is used in this study, is shown in Figure 5 [22]. Furthermore, the Goodman method is used for mean stress compensation [23]. Typically, residual stress and local pre-stress are modified using material properties; however, this method is inappropriate when stress is distributed in a broad range, such as self-weight. In life estimation analysis, the wind induced stress can directly effect on calculate the damage by rainflow counting of varying dynamic load. However, the static load such as self-weight induced stress is indirectly influenced. Therefore, in this study, the static stress due to self-weight is directly compensated to fatigue estimation stress. This analysis can be performed for the following three stress models: The first stress model applies only wind speed and consists of the dynamic load of the square of wind speed. The second stress model applies only wind speed and consists of the stress due to self-weight and the dynamic load of the square of wind speed. The third stress model applies wind speed and self-weight simultaneously and consists of the dynamic load of the square of wind speed. Five cases of fatigue analysis are defined to examine the effect of wind speed and self-weight, as shown in Table 3. In addition, the load configured in Section 2.1 is used as the dynamic load of wind speed. The results are compared to examine the effect of self-weight and the appropriateness of the greenhouse fatigue analysis method for wind load.
3. Results and Discussion
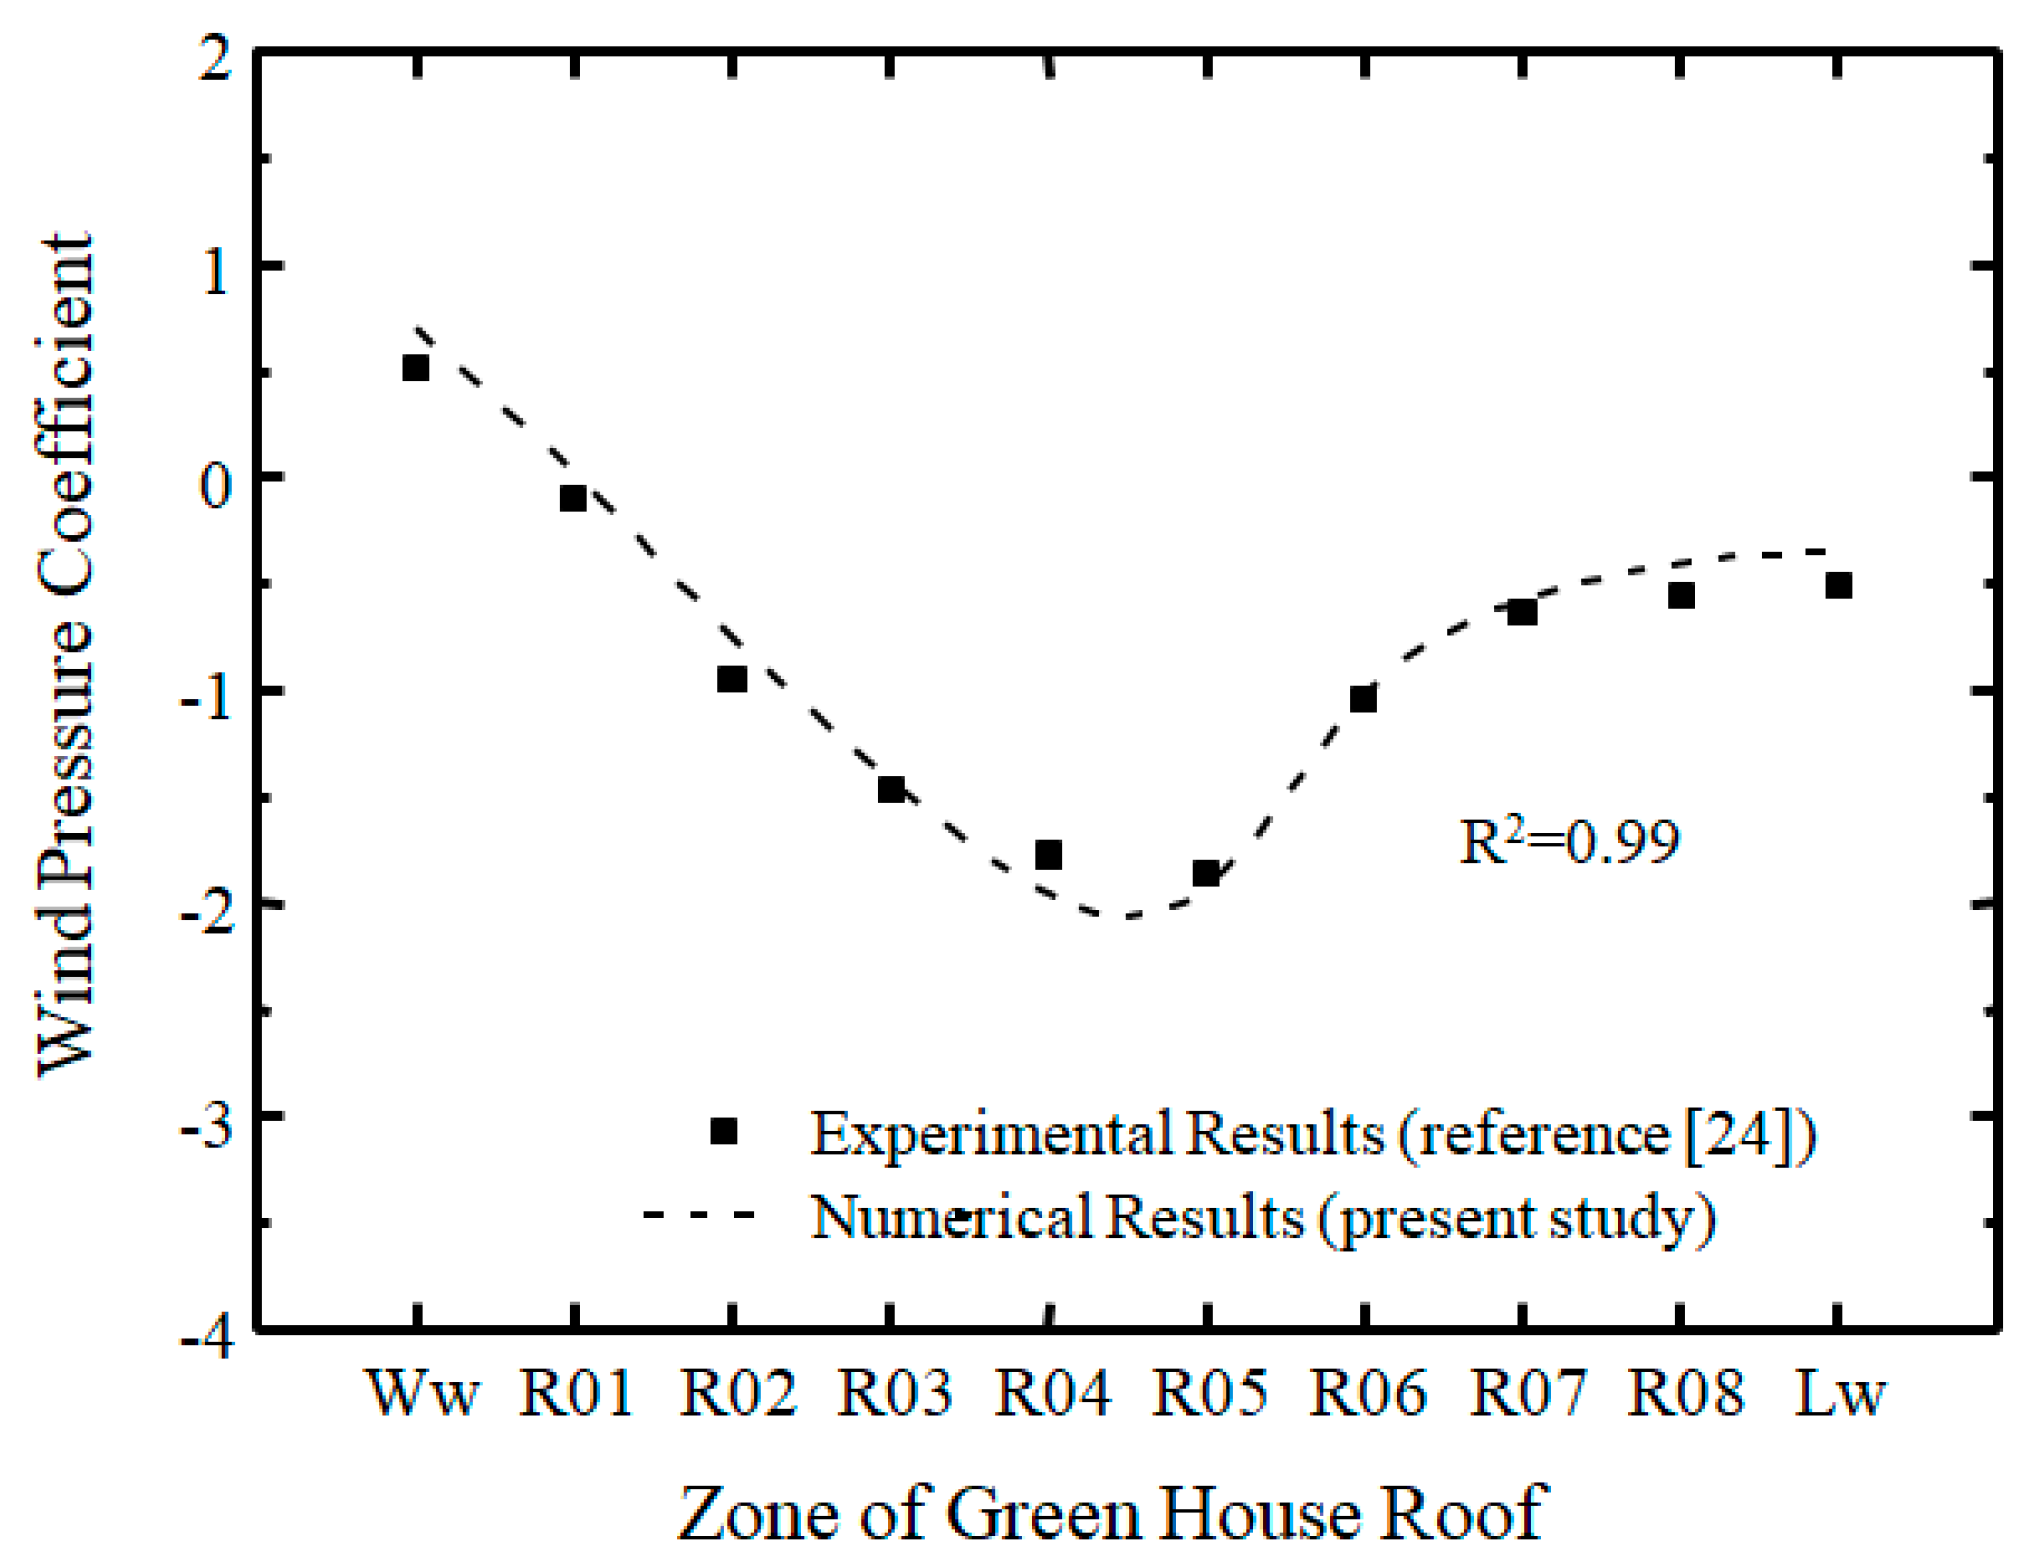
To verify the accuracy of fluid dynamics analysis, the pressure coefficients obtained through experiments [24] and the analysis of a single-span greenhouse with the dimensions provided in Table 1 are compared as shown in Figure 6. As shown in this figure, the experimental and analysis results are in good agreement, with a correlation coefficient of 0.99. Furthermore, a fluid dynamics analysis is conducted for the actual model, and the pressure coefficient for wind load is compared with the EN1991-1-4 standard, as shown in Table 4. The pressure coefficient is calculated using Equation (4) [6]
where is the pressure coefficient, is pressure, ρ is air density, and is the reference velocity at ridge height.
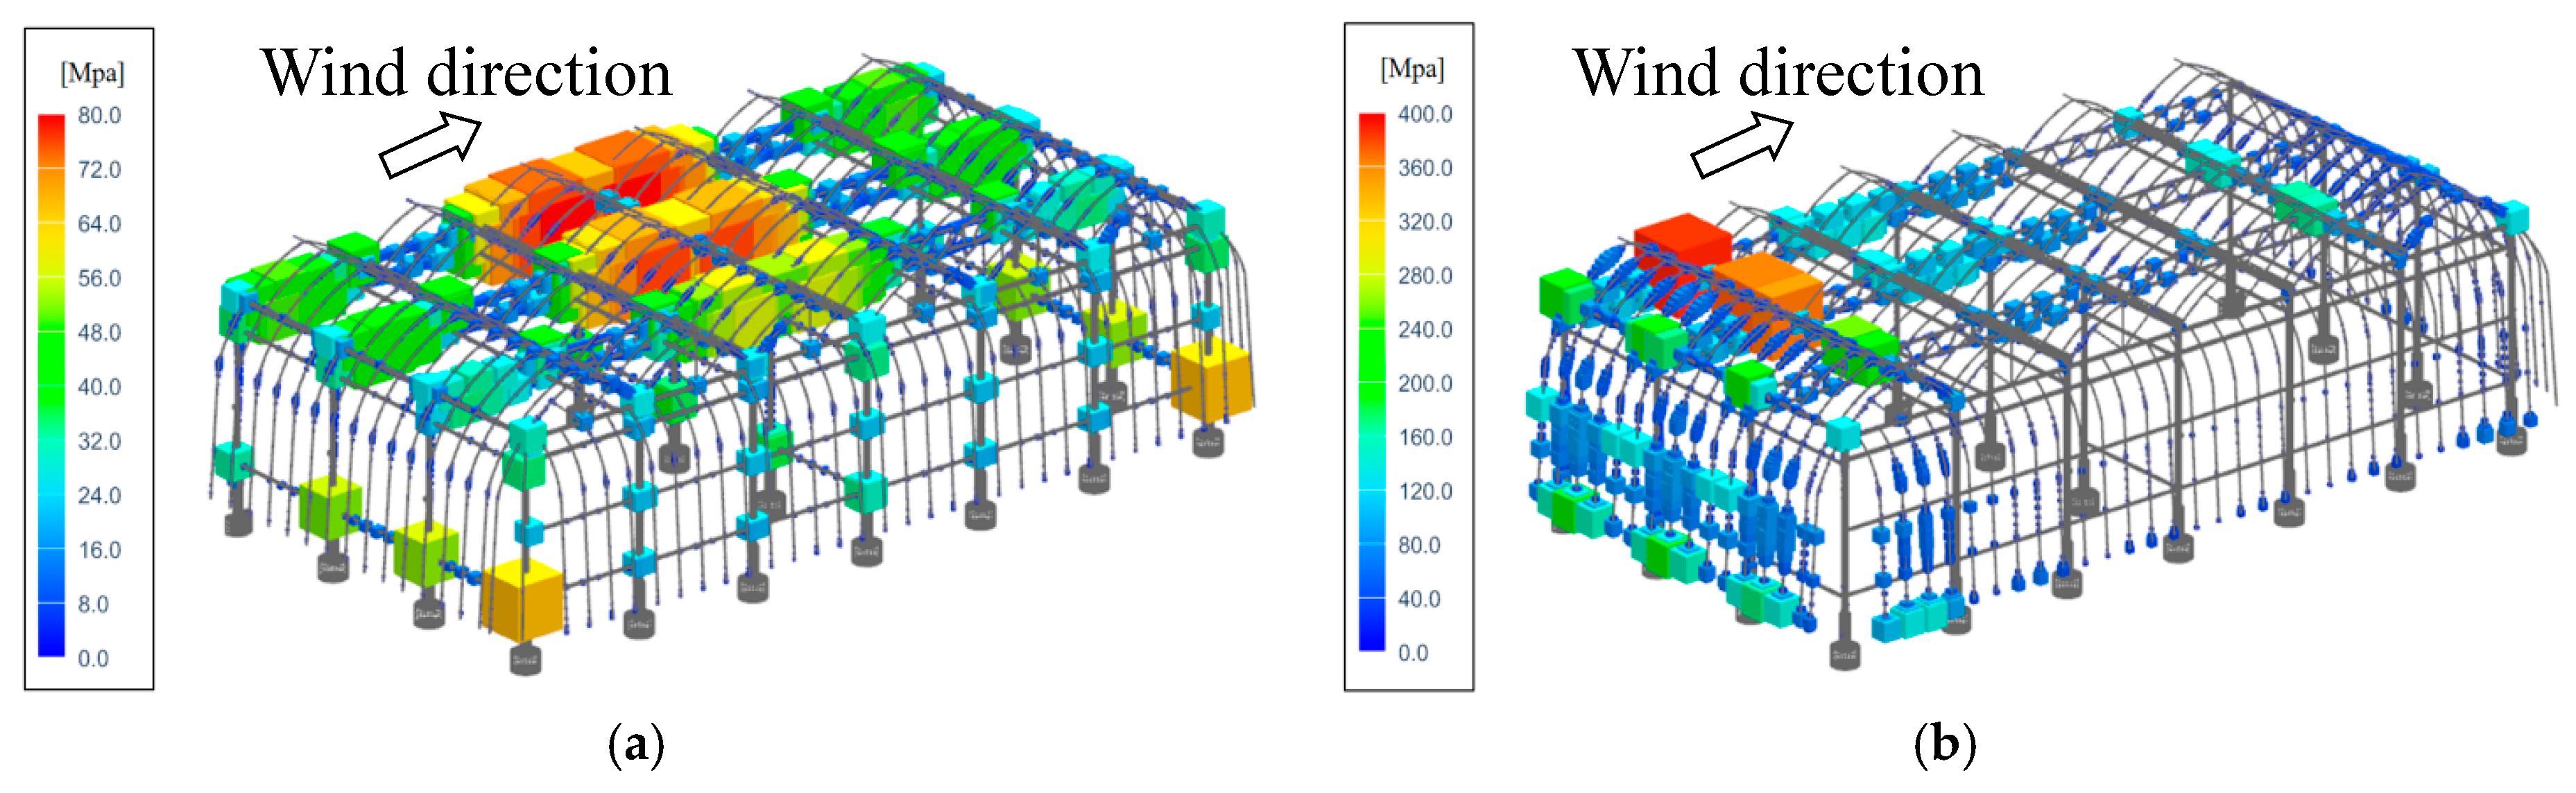
As shown in Table 4, the pressure coefficient is similar to that in the EN1991-1-4 design guide. Thus, the analysis results can be considered to be reasonable. Figure 7 shows the strain and stress obtained through structural analysis under each load condition of self-weight and wind load. The effects of self-weight show a horizontally symmetrical shape, where stress is large at the center of the greenhouse structure, and the maximum stress is 85.9 MPa. In addition, owing to the effect of wind at 30 m/s, stress is high at the front of the greenhouse under upwind conditions and at the first and second roofs, where the speed is the highest.
To examine the relationship with stress when self-weight and wind speed are applied simultaneously, the changes in stress were examined according to wind speed. Figure 8 shows the stress distribution according to wind speed. As wind speed increases, the part with concentrated stress moves to the front of the greenhouse under upwind conditions. In other words, as wind speed increases, the contribution ratio of self-weight decreases.
Figure 9 shows the changes in stress according to wind speed and the square of wind speed. Stress is proportional to the square of wind speed when only wind load is applied. However, when self-weight and wind load are applied simultaneously, nonlinear characteristics appear if the wind speed is low and linear characteristics appear when the wind speed is high. This is because the effect of self-weight is negligible compared to that of wind load at high wind speed.
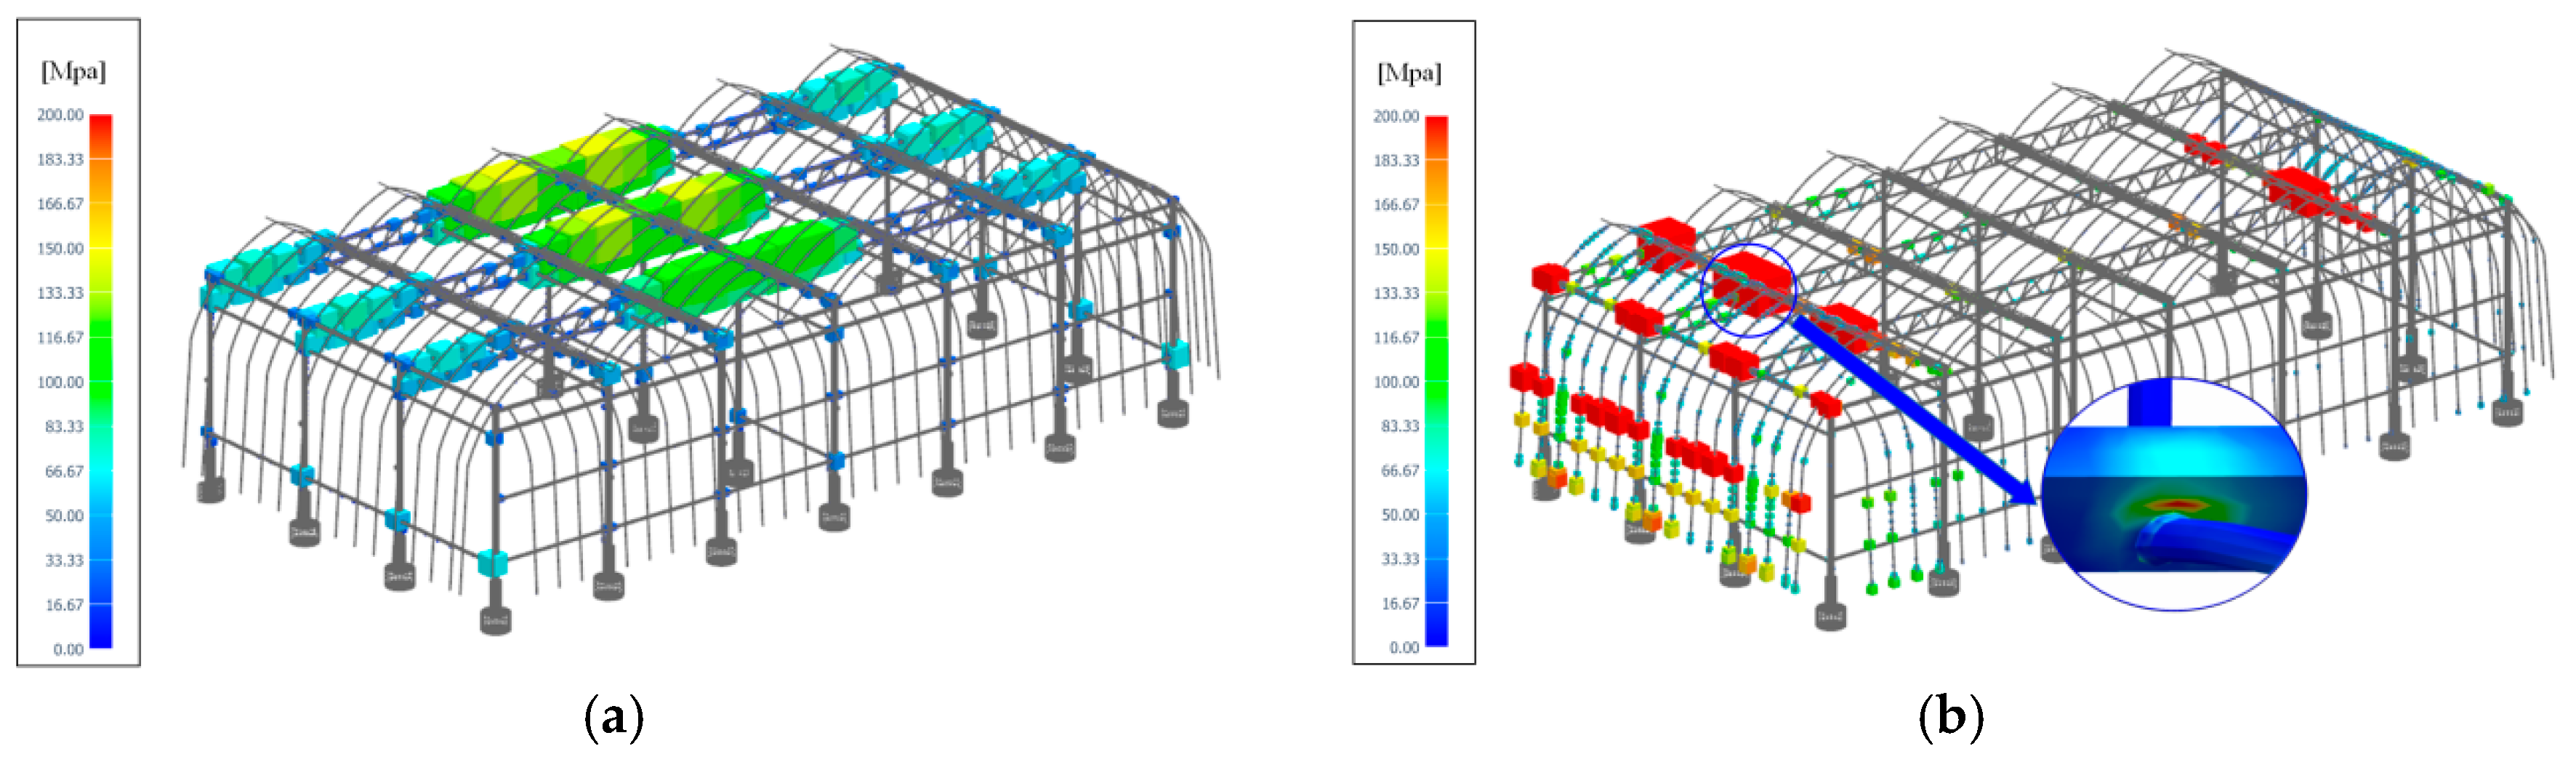
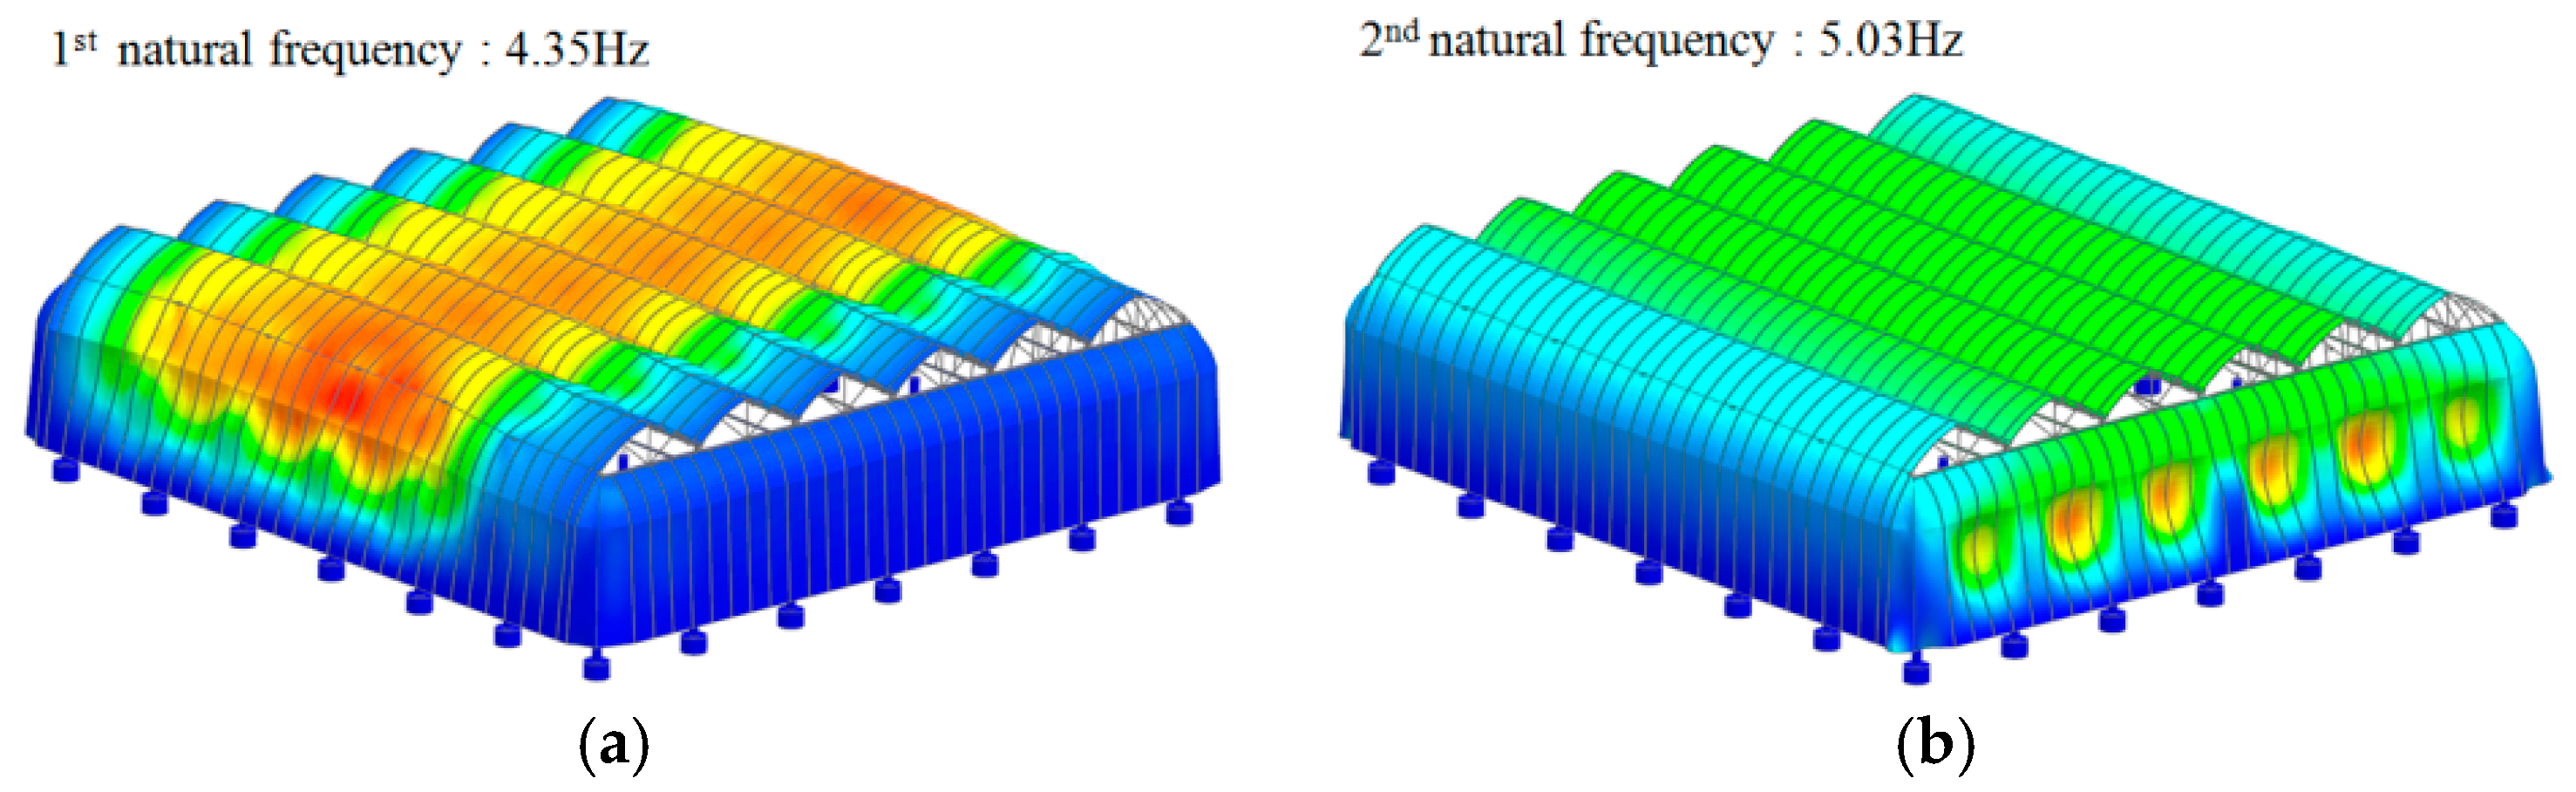
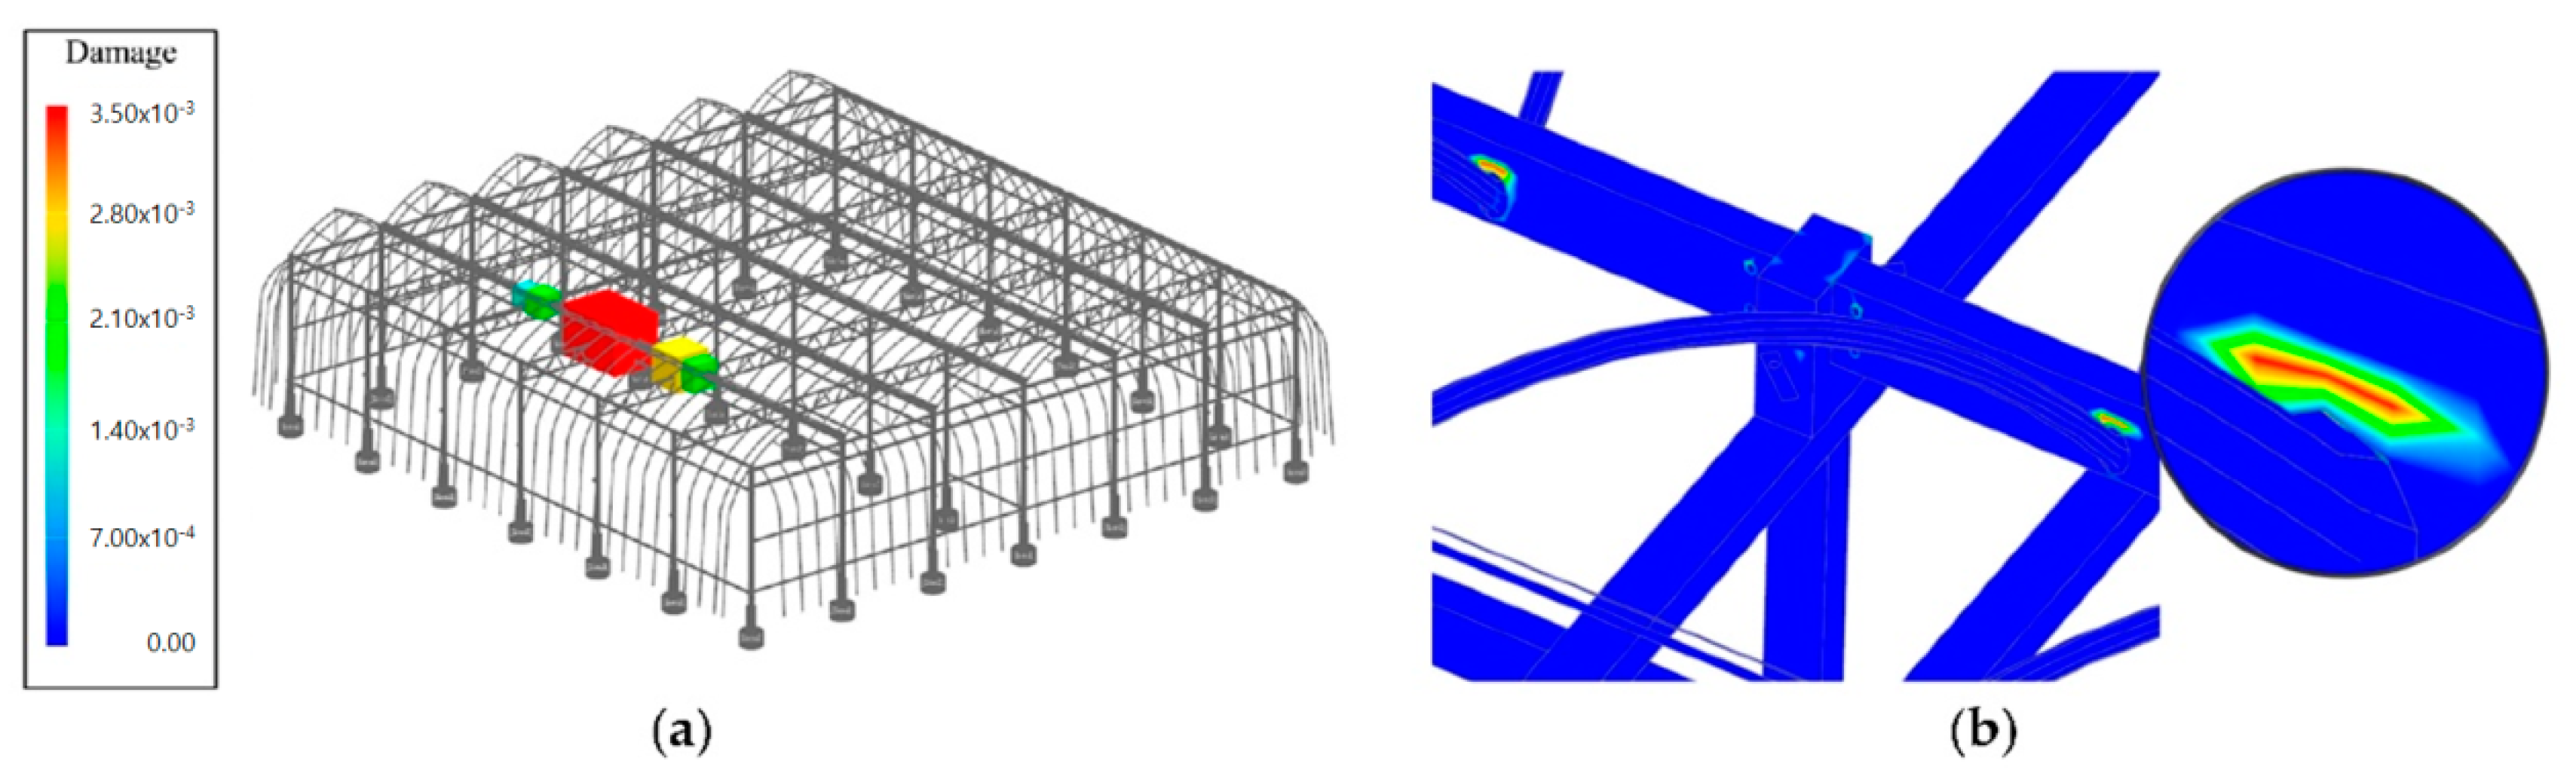
First, normal mode analysis was performed to check if resonance occurs for the dynamic load of the structure to determine whether the dynamic characteristics of the structure should be considered in the fatigue analysis. The result is shown in Figure 10. As seen in the figure, the fundamental mode appears above 4 Hz. This is higher than 2 Hz, which is the frequency band for wind speed. Thus, the effect of resonance on fatigue life can be considered to be negligible. Fatigue analysis was conducted using the S–N curve for three models considering the combination of self-weight and wind load characteristics and the time series data of dynamic wind load. The results are shown in Figure 11 and Table 5. As shown in Figure 8 and Figure 11, the maximum stress concentration occurred at the surface of the truss material above the weld, not at the weld location. Also, the maximum damage was appearing to be consistent with the stress concentration location. The frequency of winds exceeding 20 m/s is 2065 numbers for 0.5 year of time series data, and for this relationship the damage is accumulate on the first roof due to wind loads. As shown in Table 5, fatigue life increased by 21% under self-weight, in the island region of Korea. Damage is overestimated if the effect of self-weight is not considered. This is because a part of the stress is offset when self-weight and wind load are in opposite directions. Furthermore, if the stress analysis result at high wind speed is used with the fatigue stress-based model where self-weight and wind load are applied simultaneously, the effect of self-weight decreases, resulting in a shorter life cycle. This is because the stress caused by self-weight is normalized by the square of speed so that the effect of self-weight decreases as wind speed increases, and it converges to a life cycle with no compensation of stress due to self-weight. Therefore, the prediction of the life of greenhouse structures must consider the effect of self-weight, and it is reasonable to compensate static load in the analysis of fatigue estimation stress generated by dynamic load.
4. Conclusions
In this study, fluid dynamics analysis, structural analysis, and fatigue analysis were conducted to investigate the structural safety of a Venlo-peach-type greenhouse under dynamic wind load. The reliability of the fluid dynamics analysis results was proven by comparing them with experimental results, and the validity of the analytical model was verified with a correlation coefficient of R2 = 0.99. The following conclusions can be drawn based on the stress-normalized model for fatigue analysis and the method of considering the influence of self-weight: In the case of the greenhouse fabricated from zinc-plated SPSR 400, a maximum stress of 85.9 MPa was observed under self-weight. This stress cannot be neglected. The fatigue life cycle increased by 21% under self-weight, based on the wind speed distribution in the island region of Korea. In addition, the effect of self-weight decreased at high wind speeds when the fatigue model was used without stress compensation while self-weight and wind load were applied simultaneously. Furthermore, the changes in stress with wind speed were proportional to the square of wind speed. Thus, fatigue analysis can be simplified if the stress-based model is normalized by the square of wind speed and fatigue loading data are generated using the square of wind speed. Therefore, the life of greenhouses can be predicted more accurately and easily by correcting the static stress generated by self-weight to fatigue estimation stress, normalizing the stress model by the square of wind speed, and using the time series data for the square of wind speed.
Acknowledgments
This research was supported by export promotion technology development program (114083-03), Ministry of Agriculture, Food, and Rural Affairs.
Author Contributions
All authors discussed and agreed on the idea and scientific contribution and contributed to the writing. Deog-jae Hur did the mathematical modeling, performed the composition and organization of the paper, Sang-youp Kwon contribution to the computational simulation and discussion of results.
Conflicts of Interest
The authors declare no conflict of interest.
References
- Soriano, J.; Neto, J.G.V. Distribution of stress in greenhouses frames estimated by aerodynamic coefficients of Brazilian and European standards. Sci. Agric. 2016, 73, 97–102. [Google Scholar]
- Park, C.W.; Lee, J.W.; Lee, H.W.; Lee, S.G.; Suk-Gun, L. Optimum Design of Greenhouse Structures Using Continuous and Discrete Optimum Algorithms. J. Korean Assoc. Spat. Struct. 2001, 5, 61–70. [Google Scholar]
- Park, C.W.; Lee, H.W.; Yu, B.Y.; Lee, H.W.; Lee, S.G. Optimum Design Greenhouse Structures Using Genetic Algorithms. J. Korean Soc. Steel Constr. 2007, 19, 171–177. [Google Scholar]
- Lewei, T.; Jian, J.; Feng, Z. Comparative study on calculation of wind loads on greenhouse structures between codes of China and Europe. Trans. Chin. Soc. Agric. Eng. 2012, 29, 174–181. [Google Scholar]
- Nayak, A.K.; Ramana Rao, K.V. Estimation of wind load on a greenhouse and evaluation of its structural stability. Int. J. Agric. Eng. 2014, 7, 461–466. [Google Scholar] [CrossRef]
- Bronkhorst, A.J.; Geurts, C.P.W.; van Bentum, C.A.; van der Knaap, L.P.M.; Pertermann, I. Wind Loads for Stability Design of Large Multi-Span Duo-Pitch Greenhouses. Front. Built Environ. 2017, 3, 1–21. [Google Scholar] [CrossRef]
- Von Elsner, B.; Briassoulis, D.; Waaijenberg, D.; Mistriotis, A.; von Zabeltitz, C.; Gratraud, J.; Russo, G.; Suay-Cortes, R. Review of Structural and Functional Characteristics of Greenhouses in European Union Countries: Part I, Design Requirements. J. Agric. Eng. Res. 2000, 75, 1–16. [Google Scholar] [CrossRef]
- Jung, S.H.; Lee, J.W.; Lee, S.Y.; Lee, H.W. Analysis of wind velocity profile for calculation of wind pressure on greenhouse. Prot. Hortic. Plant Fact. 2015, 24, 135–146. [Google Scholar] [CrossRef]
- Kim, Y.D.; Cabardo, C. Yearly Maximum Wind Speed Distributions of Daily Maximum Data Generated by Monte Carlo Simulation. Wind Eng. Inst. Korea 2008, 11, 26–31. [Google Scholar]
- Frank, W.; Daniel, K.; Eggers, W. Wind vibration analyses of Giant Magellan Telescope. Proc. SPIE 2006, 6271, Q2710. [Google Scholar]
- Reprtto, M.P.; Solari, G. Wind-induced fatigue collapse of real slender structures. Eng. Struct. 2010, 32, 3888–3898. [Google Scholar] [CrossRef]
- Fang, Z.; Li, A.; Li, W.; Shen, S. Wind-Induced Fatigue Analysis of High-Rise Steel Structures Using Equivalent Structural Stress Method. Appl. Sci. 2017, 7, 71–89. [Google Scholar] [CrossRef]
- Basaran, C.; Yan, C.Y. A Thermodynamic Framework for Damage Mechanics of Solder Joints. J. Electron. Packag. 1998, 120, 379–384. [Google Scholar] [CrossRef]
- Basaran, C.; Nie, S. An Irreversible Thermodynamic Theory for Damage Mechanics of Solids. Int. J. Damage Mech. 2004, 13, 205–224. [Google Scholar] [CrossRef]
- Temfack, T.; Basaran, C. Experimental Verification of a Thermodynamic Fatigue Life Prediction Model. Mater. Sci. Technol. 2015, 31, 1627–1632. [Google Scholar] [CrossRef]
- Sosnovskiy, L.A.; Sherbakov, S.S. Mechanothermodynamic Entropy and Analysis of Damage State of Complex Systems. Entropy 2016, 18, 268. [Google Scholar] [CrossRef]
- Costa Rocha, P.A.; Coelho de Sousa, R.; Freitas de Andrade, C.; Vieira da Silva, M. Comparison of seven numerical methods for determining Weibull parameters for wind energy generation in the northeast region of Brazil. Appl. Energy 2012, 89, 395–400. [Google Scholar] [CrossRef]
- Ko, D.H.; Shin, T.J.; Kang, K.S. Assessment of Offshore Wind Power Potential in the Western Seas of Korea. J. Korean Soc. Coast. Ocean Eng. 2015, 27, 266–273. [Google Scholar] [CrossRef]
- Von Elsner, B.; Briassoulis, D.; Waaijenberg, D. Review of Structural and Functional Characteristics of Greenhouses in European Union Countries: Part II, Typical Designs. J. Agric. Eng. Res. 2000, 75, 111–126. [Google Scholar] [CrossRef]
- Kande, D.K. A CFD Analysis oh Heat and Mass Tranfer in Greenhouses: An Introduction. Math. Model. Appl. 2017, 2, 17–20. [Google Scholar]
- Hur, D.J.; Jeong, S.H.; Noh, J.H. Investigation into the Internal Flow and Temperature Characteristics for Greenhouse Ventilation Patterns using Computation Analysis. Int. J. Eng. Res. Appl. 2017, 7, 1–8. [Google Scholar]
- Hsiao, P.-C. Seismic Performance Evaluation of Concentrically Braced Frames. Ph.D. Thesis, University of Washington, Seattle, WA, USA, 2012. [Google Scholar]
- Grover, H.G. Fatigue of Aircraft Structures; NAVAL Air Systems Command, Department of the Navy: Washington, DC, USA, 1966; pp. 38–43. [Google Scholar]
- Kwon, K.S.; Kim, D.W.; Kim, R.W.; Ha, T.W.; Lee, I.B. Evaluation of wind pressure coefficients of single-span greenhouse built on reclaimed coastal land using a large-sized wind tunnel. Biosyst. Eng. 2016, 141, 58–81. [Google Scholar] [CrossRef]
Figure 1.
Flowchart of fatigue analysis process. F.E.M: Finite Element Method.

Figure 2.
Probability density function and time series data of Korean island wind speeds: (a) frequency of wind speed with Weibull distribution (k is 1.664, c is 5.129); (b) time series data of wind speed (0.5 year data).
Figure 2.
Probability density function and time series data of Korean island wind speeds: (a) frequency of wind speed with Weibull distribution (k is 1.664, c is 5.129); (b) time series data of wind speed (0.5 year data).

Figure 3.
Schematic object dimensions of three-span Venlo-type ventilated greenhouse with a floor area of approximately 560 m2 for fluid and structural analysis modelling, (Detail dimension: Table 1): (a) isometric view of greenhouse, (b) front view of greenhouse, (c) side view of greenhouse structure, (d) isometric view of fluid filed for CFD (Computational Fluid Dynamics).
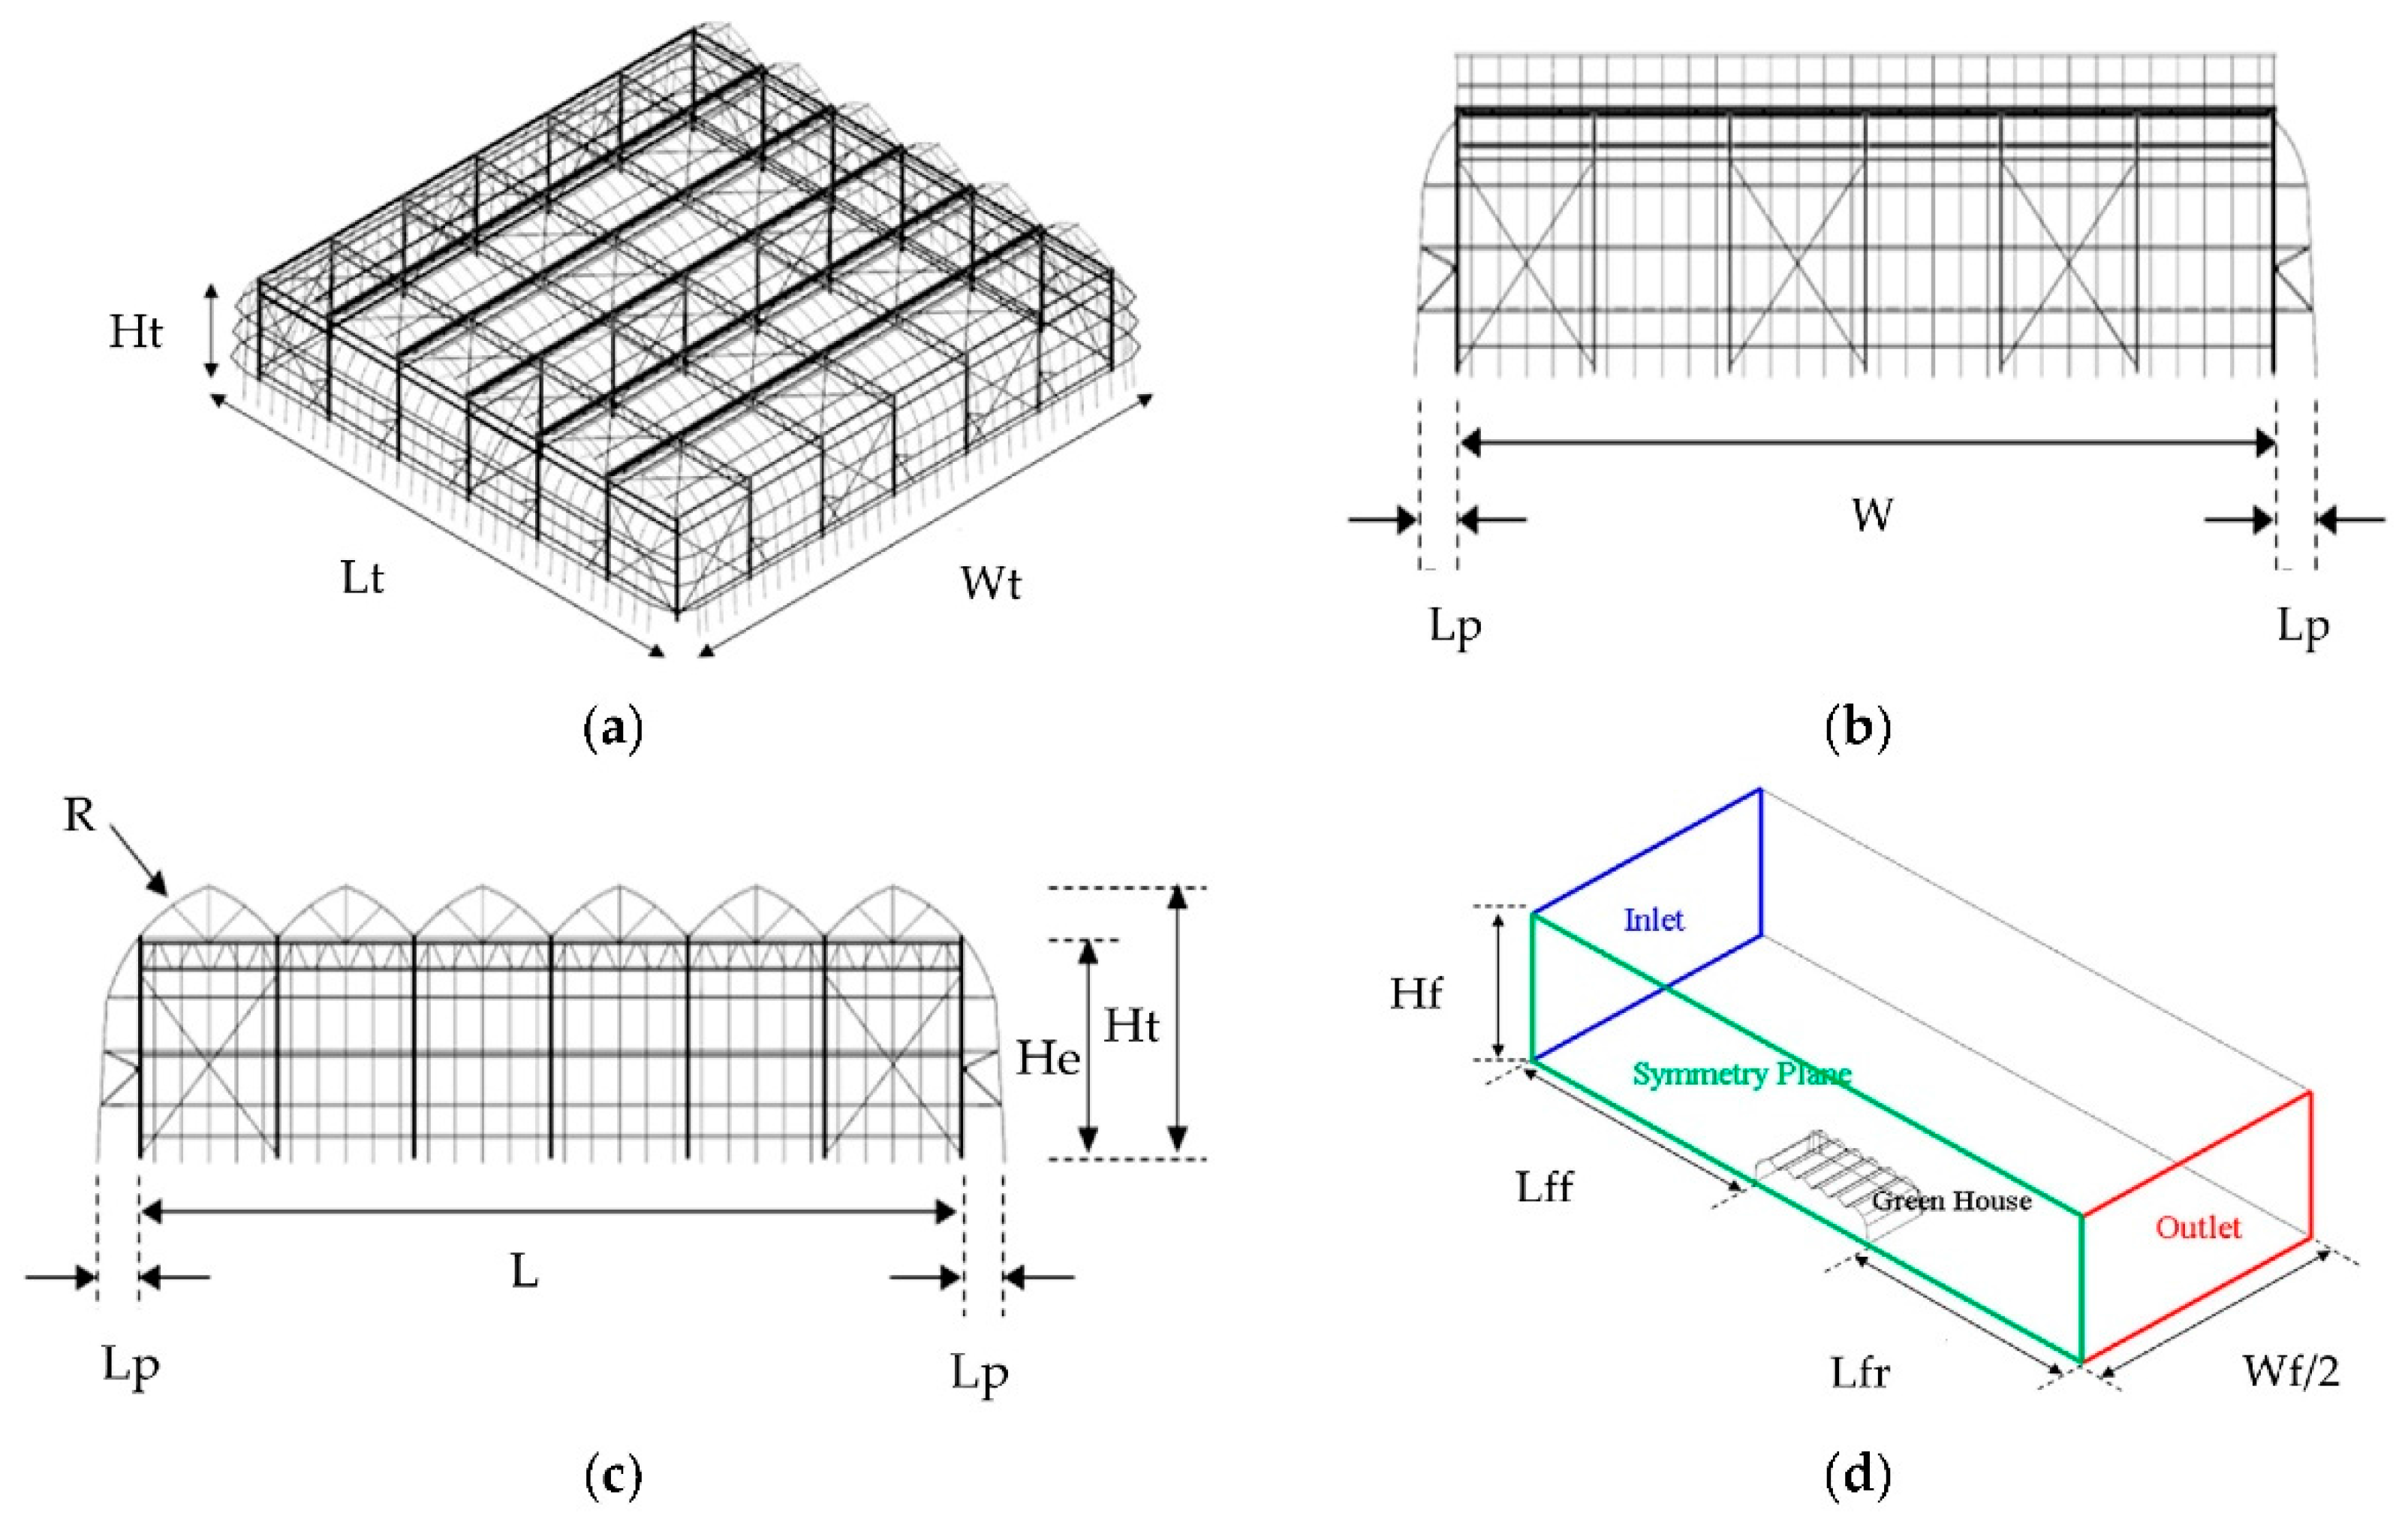
Figure 4.
Finite element model of baseline design the three-span Venlo-peach-type greenhouse.

Figure 5.
S–N curve of greenhouse structure: (a) S–N curve of SPSR400, (b) S–N curve of aluminum. Sa: an applied alternating stress; Nf: cycles of failure.
Figure 5.
S–N curve of greenhouse structure: (a) S–N curve of SPSR400, (b) S–N curve of aluminum. Sa: an applied alternating stress; Nf: cycles of failure.

Figure 6.
A Comparison of experimental and analytical values of wind pressure coefficient in a single peach-type roof greenhouse (Correlation coefficient R2 = 0.99). Ww: roof first face; Lw: roof end face.
Figure 6.
A Comparison of experimental and analytical values of wind pressure coefficient in a single peach-type roof greenhouse (Correlation coefficient R2 = 0.99). Ww: roof first face; Lw: roof end face.

Figure 7.
Stress distribution contour for self-weight and wind load: (a) stress distribution on self-weight; (b) stress distribution on wind load at wind speed 30 m/s.
Figure 7.
Stress distribution contour for self-weight and wind load: (a) stress distribution on self-weight; (b) stress distribution on wind load at wind speed 30 m/s.

Figure 8.
Stress distribution contour for variation wind load: (a) wind speed—6 m/s, (b) wind speed—30 m/s.
Figure 8.
Stress distribution contour for variation wind load: (a) wind speed—6 m/s, (b) wind speed—30 m/s.

Figure 9.
Stress variation according to wind speed and square of wind speed at maximum stress point: (a) stress via wind speed; (b) stress via the square of wind speed.
Figure 9.
Stress variation according to wind speed and square of wind speed at maximum stress point: (a) stress via wind speed; (b) stress via the square of wind speed.

Figure 10.
Natural frequency and mode shape of greenhouse by Normal model analysis: (a) first model shape and natural frequency (4.35 Hz), (b) second model shape and natural frequency (5.03 Hz).
Figure 10.
Natural frequency and mode shape of greenhouse by Normal model analysis: (a) first model shape and natural frequency (4.35 Hz), (b) second model shape and natural frequency (5.03 Hz).

Figure 11.
Fatigue life time distribution due to analysis case: (a) life cycle distribution for Case 1, (b) detail view of maximum damage location, Case 1: structure analysis stress model by wind load and weight stress without compensation.
Figure 11.
Fatigue life time distribution due to analysis case: (a) life cycle distribution for Case 1, (b) detail view of maximum damage location, Case 1: structure analysis stress model by wind load and weight stress without compensation.


Table 1.
Dimension for the fluid and structural analysis model of three-span Venlo-peach-type greenhouse (unit: m).
Table 1.
Dimension for the fluid and structural analysis model of three-span Venlo-peach-type greenhouse (unit: m).
| Parameter | Parameter Description | Sing Roof | 3-Span |
|---|---|---|---|
| Hf | Height of fluid domain | 2.5 | 60.0 |
| Wf | Width of fluid domain | 8.0 | 310.0 |
| Lff | Front Length of fluid domain | 7.83 | 99.7 |
| Lfr | Rear Length fluid domain | 15.0 | 99.7 |
| Hg | Height of greenhouse | 0.175 | 6.3 |
| He | Height of eave | 0.08 | 5.1 |
| Hp | Height of straight wind pipe | - | 3.7 |
| Lg | Length of greenhouse | 0.33 | 23.2 |
| Lp | Length of wind pipe | 0.01 | 1.2 |
| Wg | Width of green house | 1.1 | 24.1 |
| R | Radius of roof curvature | 3.0 | 4.0 |
Table 2.
Material properties of greenhouse structure.
| Part | Material | Density (kg/m3) | Elastic Modulus (MPa) | Poisson’s Ratio |
|---|---|---|---|---|
| Frame | SPSR400 | 7.85 × 10⁻⁶ | 203,000 | 0.30 |
| Al-Frame | Al alloy (BS1490) | 2.70 × 10⁻⁶ | 72,000 | 0.33 |
| Footing | Concrete | 2.40 × 10⁻⁶ | 28,600 | 0.15 |
Table 3.
Fatigue analysis model construction case of stress normalized and wind load condition.
| Case | Loading Condition for Stress Normalized Model | Stress Compensate for Self-Weight | Wind Speed Distribution | Remark |
|---|---|---|---|---|
| 1 | Only wind load | X | k = 1.664, = 5.129 | Korea island wind speeds data |
| 2 | Only wind load | O | k = 1.664, = 5.129 | |
| 3 | Wind load with self-weight at 12 m/s | X | k = 1.664, = 5.129 | |
| 4 | Wind load with self-weight at 21 m/s | X | k = 1.664, = 5.129 | |
| 5 | Wind load with self-weight at 30 m/s | X | k = 1.664, = 5.129 |
Remark: X: No apply, O: apply.
Table 4.
Comparison between CFD modeling results and corresponding EN-1991-1-4 specification for design terms of wind pressure coefficients.
Table 4.
Comparison between CFD modeling results and corresponding EN-1991-1-4 specification for design terms of wind pressure coefficients.
| Roof Face | Front Face | Rear Face | Side Face | ||||||||||||
|---|---|---|---|---|---|---|---|---|---|---|---|---|---|---|---|
| A | B | C | D | E | F | G | H | I | J | K | L | M | N | O | |
| EN | −1.1 | −1.0 | −0.7 | −0.5 | −0.4 | −0.5 | −0.4 | −0.4 | −0.4 | −0.4 | −0.4 | −0.4 | 0.6 | −0.6 | −0.4 |
| CFD | −0.9 | −1.1 | −0.7 | −0.5 | −0.3 | −0.4 | −0.2 | −0.3 | −0.2 | −0.3 | −0.2 | −0.5 | 0.8 | −0.3 | −0.4 |
EN: EN1991-1-4, CFD: Computational fluid Dynamic of Pitch-type roof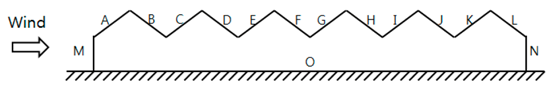 | |||||||||||||||
Table 5.
Fatigue analysis results for stress normalized and wind load conditions.
| Case | Loading Condition of Structure Analysis | Stress Compensate | Damage | Life Cycle | Life Years |
|---|---|---|---|---|---|
| 1 | Only wind load | X | 3.88 × 10⁻³ | 25.8 | 12.9 |
| 2 | Only wind load | O | 3.05 × 10⁻³ | 32.8 | 16.4 |
| 3 | Wind load with self-weight at 12 m/s | X | 9.36 × 10⁻³ | 107.0 | 53.4 |
| 4 | Wind load with self-weight at 21 m/s | X | 2.46 × 10⁻³ | 40.6 | 20.3 |
| 5 | Wind load with self-weight at 30 m/s | X | 3.13 × 10⁻³ | 32.0 | 16.0 |
© 2017 by the authors. Licensee MDPI, Basel, Switzerland. This article is an open access article distributed under the terms and conditions of the Creative Commons Attribution (CC BY) license (http://creativecommons.org/licenses/by/4.0/).
Share and Cite
MDPI and ACS Style
Hur, D.-J.; Kwon, S. Fatigue Analysis of Greenhouse Structure under Wind Load and Self-Weight. Appl. Sci. 2017, 7, 1274. https://doi.org/10.3390/app7121274
AMA Style
Hur D-J, Kwon S. Fatigue Analysis of Greenhouse Structure under Wind Load and Self-Weight. Applied Sciences. 2017; 7(12):1274. https://doi.org/10.3390/app7121274
Chicago/Turabian StyleHur, Deog-Jae, and Sangyoup Kwon. 2017. "Fatigue Analysis of Greenhouse Structure under Wind Load and Self-Weight" Applied Sciences 7, no. 12: 1274. https://doi.org/10.3390/app7121274
Note that from the first issue of 2016, this journal uses article numbers instead of page numbers. See further details here.