Article

High Power Fiber Laser Welding of Single Sided T-Joint on Shipbuilding Steel with Different Processing Setups

Laboratory of Laser Materials Processing, Lappeenranta University of Technology, Skinnarilankatu 34, Lappeenranta 53850, Finland
*
Author to whom correspondence should be addressed.
Appl. Sci. 2017, 7(12), 1276; https://doi.org/10.3390/app7121276
Submission received: 2 November 2017 / Revised: 29 November 2017 / Accepted: 4 December 2017 / Published: 8 December 2017
(This article belongs to the Special Issue Solid State Lasers Materials, Technologies and Applications)

Abstract

:
Laser welding of thick plates in production environments is one of the main applications of high power lasers; however, the process has certain limitations. The small spot size of the focused beam produces welds with high depth-to-width aspect ratio but at times fails to provide sufficient reinforcement in certain applications because of poor gap bridging ability. The results of welding shipbuilding steel AH36 with thickness of 8 mm as a single-sided T-joint using a 10 kW fiber laser are presented and discussed in this research paper. Three optical setups with process fibers of 200 µm, 300 µm and 600 µm core diameters were used to study the possibilities and limitations set by the beam delivery system. The main parameters studied were beam inclination angle, beam offset from the joint plane and focal point position. Full penetration joints were produced and the geometry of the welds was examined. It was found that process fibers with smaller core diameter produce deeper penetration but suffer from sensitivity to beam positioning deviation. Larger fibers are less sensitive and produce wider welds but have, in turn, lower penetration at equivalent power levels.

1. Introduction

Laser welding with multi-kilowatt fiber lasers is fast becoming a highly advantageous joining technology in manufacturing industries such as shipbuilding, where it saves production time and cost compared to conventional arc based welding processes [1]. The growing acceptance and adoption of laser technology can be seen, for example, in sales statistics, which show an annual growth rate of over 10% for the last few years [2,3]. Modern high power fiber lasers are low maintenance, easy to integrate with production robots, and produce welds with deep penetration and low heat input at high throughput rates [4,5]. High beam quality at high power levels and the decreasing price per kilowatt of laser power are enabling previous limitations to be overcome and opening up new possibilities, especially in keyhole welding. The main limiting factor hindering more extensive utilization of laser welding is its demand for high accuracy in joint fit-up tolerances. A common way to compensate gap fluctuations and ensure welds of acceptable quality is to add an arc process working in synergy with the laser. While such hybrid laser-arc welding allows control of weld bead formation through adjustment of the arc parameters and extends the gap bridging ability of the welding system, it increases process complexity and production costs.
One of the most important characteristics of a laser welding system is the beam quality that the lasers deliver. The beam quality affects the power density of the beam, which has a direct effect on the penetration depth and geometry of the weld [6,7]. High power density of the beam means deeper penetration for the same level of power and welding speed. Single-sided welding of T-joints with fiber lasers is not an entirely novel concept, and its applicability and key parameters have been studied, for example, for aluminum welding in the aircraft industry [4]. The high depth-to-width aspect ratio of typical fiber laser welds can be a drawback in medium and thick section welding of T- and fillet joints. Space and maneuverability restrictions on the welding head can cause the laser beam to cross the joint plane at a certain angle, and a narrow melt pool may easily partially miss the joint plane and produce incomplete fusion. In addition, T-joint welds can be several meters long and heat-induced distortions during welding can thus cause variations in joint fit-up regardless of the accuracy of the original setup.
Classification societies such as DNV (Det Norske Veritas) and IIW (International Institute of Welding) suggest avoiding fillet welds in parts of a construction that are subjected to fatigue, because partial penetration creates a possible crack initiation point at the root of the weld [8,9]. Nevertheless, more than 80% of welded joints are fillet welds, because one of the plates serves as backing during the welding process and less post-welding correction is required. Figure 1 illustrates the principal differences in the geometry and location of the stress concentration of arc, laser and hybrid welded joints.
The key problem with T-joints is ensuring fusion throughout the whole joint plane, preferably with single-sided welding. In autogenous laser welding, avoidance of the possible occurrence of underfill or undercut due to an absence of filler material is important, because throat thickness and shape of the weld toe influence the fatigue performance of the joint. In thin materials and flat assembly joints, this problem can be addressed by increasing weld width through wider distribution of the beam energy. Approaches used include but are not limited to: manipulation of the focal point position [10], and usage of dual focal point setups [11,12,13] and beam oscillation techniques [14,15,16,17]. Scanning is also beneficial for bringing more heat into the material, which decreases the cooling rate and keeps the hardness of the weld at acceptable levels. Unfortunately, this procedure is not applicable in thick section welding, where the typical weld length is several meters, because scanning mirrors are unable to handle the power levels needed [14,18]. Large components such as scanning optics also limit the degree of freedom and flexibility of the welding process as regards positioning.
Determining the operational window for a good quality weld accounts for three main process parameters: laser power, welding speed and focal point position. These three easily adjustable parameters affect the power density at the top of workpiece, and therefore melt flow and distribution of the energy inside the keyhole, which have a major influence on the geometry of the weld. A certain threshold value of power density must be reached in order to be able to form the keyhole [19]. The threshold is typically defined as 106 W/cm2, or more commonly 103 W/mm2, with typical dimensions of laser beam focal point. The power density is calculated as follows:
E = P π r 2 ,
where P is laser power and r radius of the beam on the surface of the workpiece. The above-mentioned power density threshold is valid for CO2 laser welding, whereas when using solid state lasers with wavelengths around 1000 nm the threshold is lower [20,21]. The lower threshold is a result of higher absorption of shorter wavelengths, and it gives extra flexibility to parameter selection and greater freedom to tailor parameters to specific applications, for example, with static or dynamic beam formation.
Suder and Williams et al. [22] developed the concept of Specific Point Energy (ESP). In addition to energy density (power density × interaction time), ESP includes also beam diameter on the surface:
E SP = ρ P T i A = P L T i = P d v ,
where ρP is average power density of the beam (mW/cm2), Ti is interaction time (s), A is area of the beam on the surface (mm2), PL is laser power (W), d is beam diameter on the surface (mm), and v is welding speed (mm/s). Experiments performed with bead-on-plate joints have shown that power density and ESP control the depth of penetration and interaction time controls the bead width [22,23,24]. ESP has also been shown to be suitable for evaluating the efficiency of laser cutting [25,26].
The relationship between spot size and welding performance in steel and aluminum welding has been addressed in several studies [27,28,29,30], and it has been found that small spot size produces deeper welds yet is accompanied by defects such as undercut and porosity. A study by Vänskä [14] showed that in some cases the keyhole welding mode changes between selected parameter values, resulting in different weld cross section shape in butt joint welding of stainless steel with a disk laser. Lap and butt joints produced with CO2 and solid-state laser sources have been characterized and compared [20]; for example, Kawahito et al. [28] addressed the effect of focal spot size on weld defects and showed that, of the four sizes studied, welds with highest quality were obtained using the two larger spot sizes.
The effect of focal point diameter on beam intensity on surface is much stronger than the effect via laser power. A simple way to manipulate the focal point diameter is to change the focal length of the focusing lens. A problem with this approach is that the focusing angle, i.e., the angle at which the beam enters the keyhole, changes as the focal length is changed, and the effect of focal point diameter is influenced by the effect of focusing angle and changes in the shielding gas arrangement. Change in the beam feeding fiber can only increase the diameter of the raw beam and the beam parameter product. This paper addresses the issue of weld quality of high power fiber laser welded T-joints of shipbuilding steel AH36 by comparing welds produced with three optical set-ups having beam transfer fibers of different diameters.

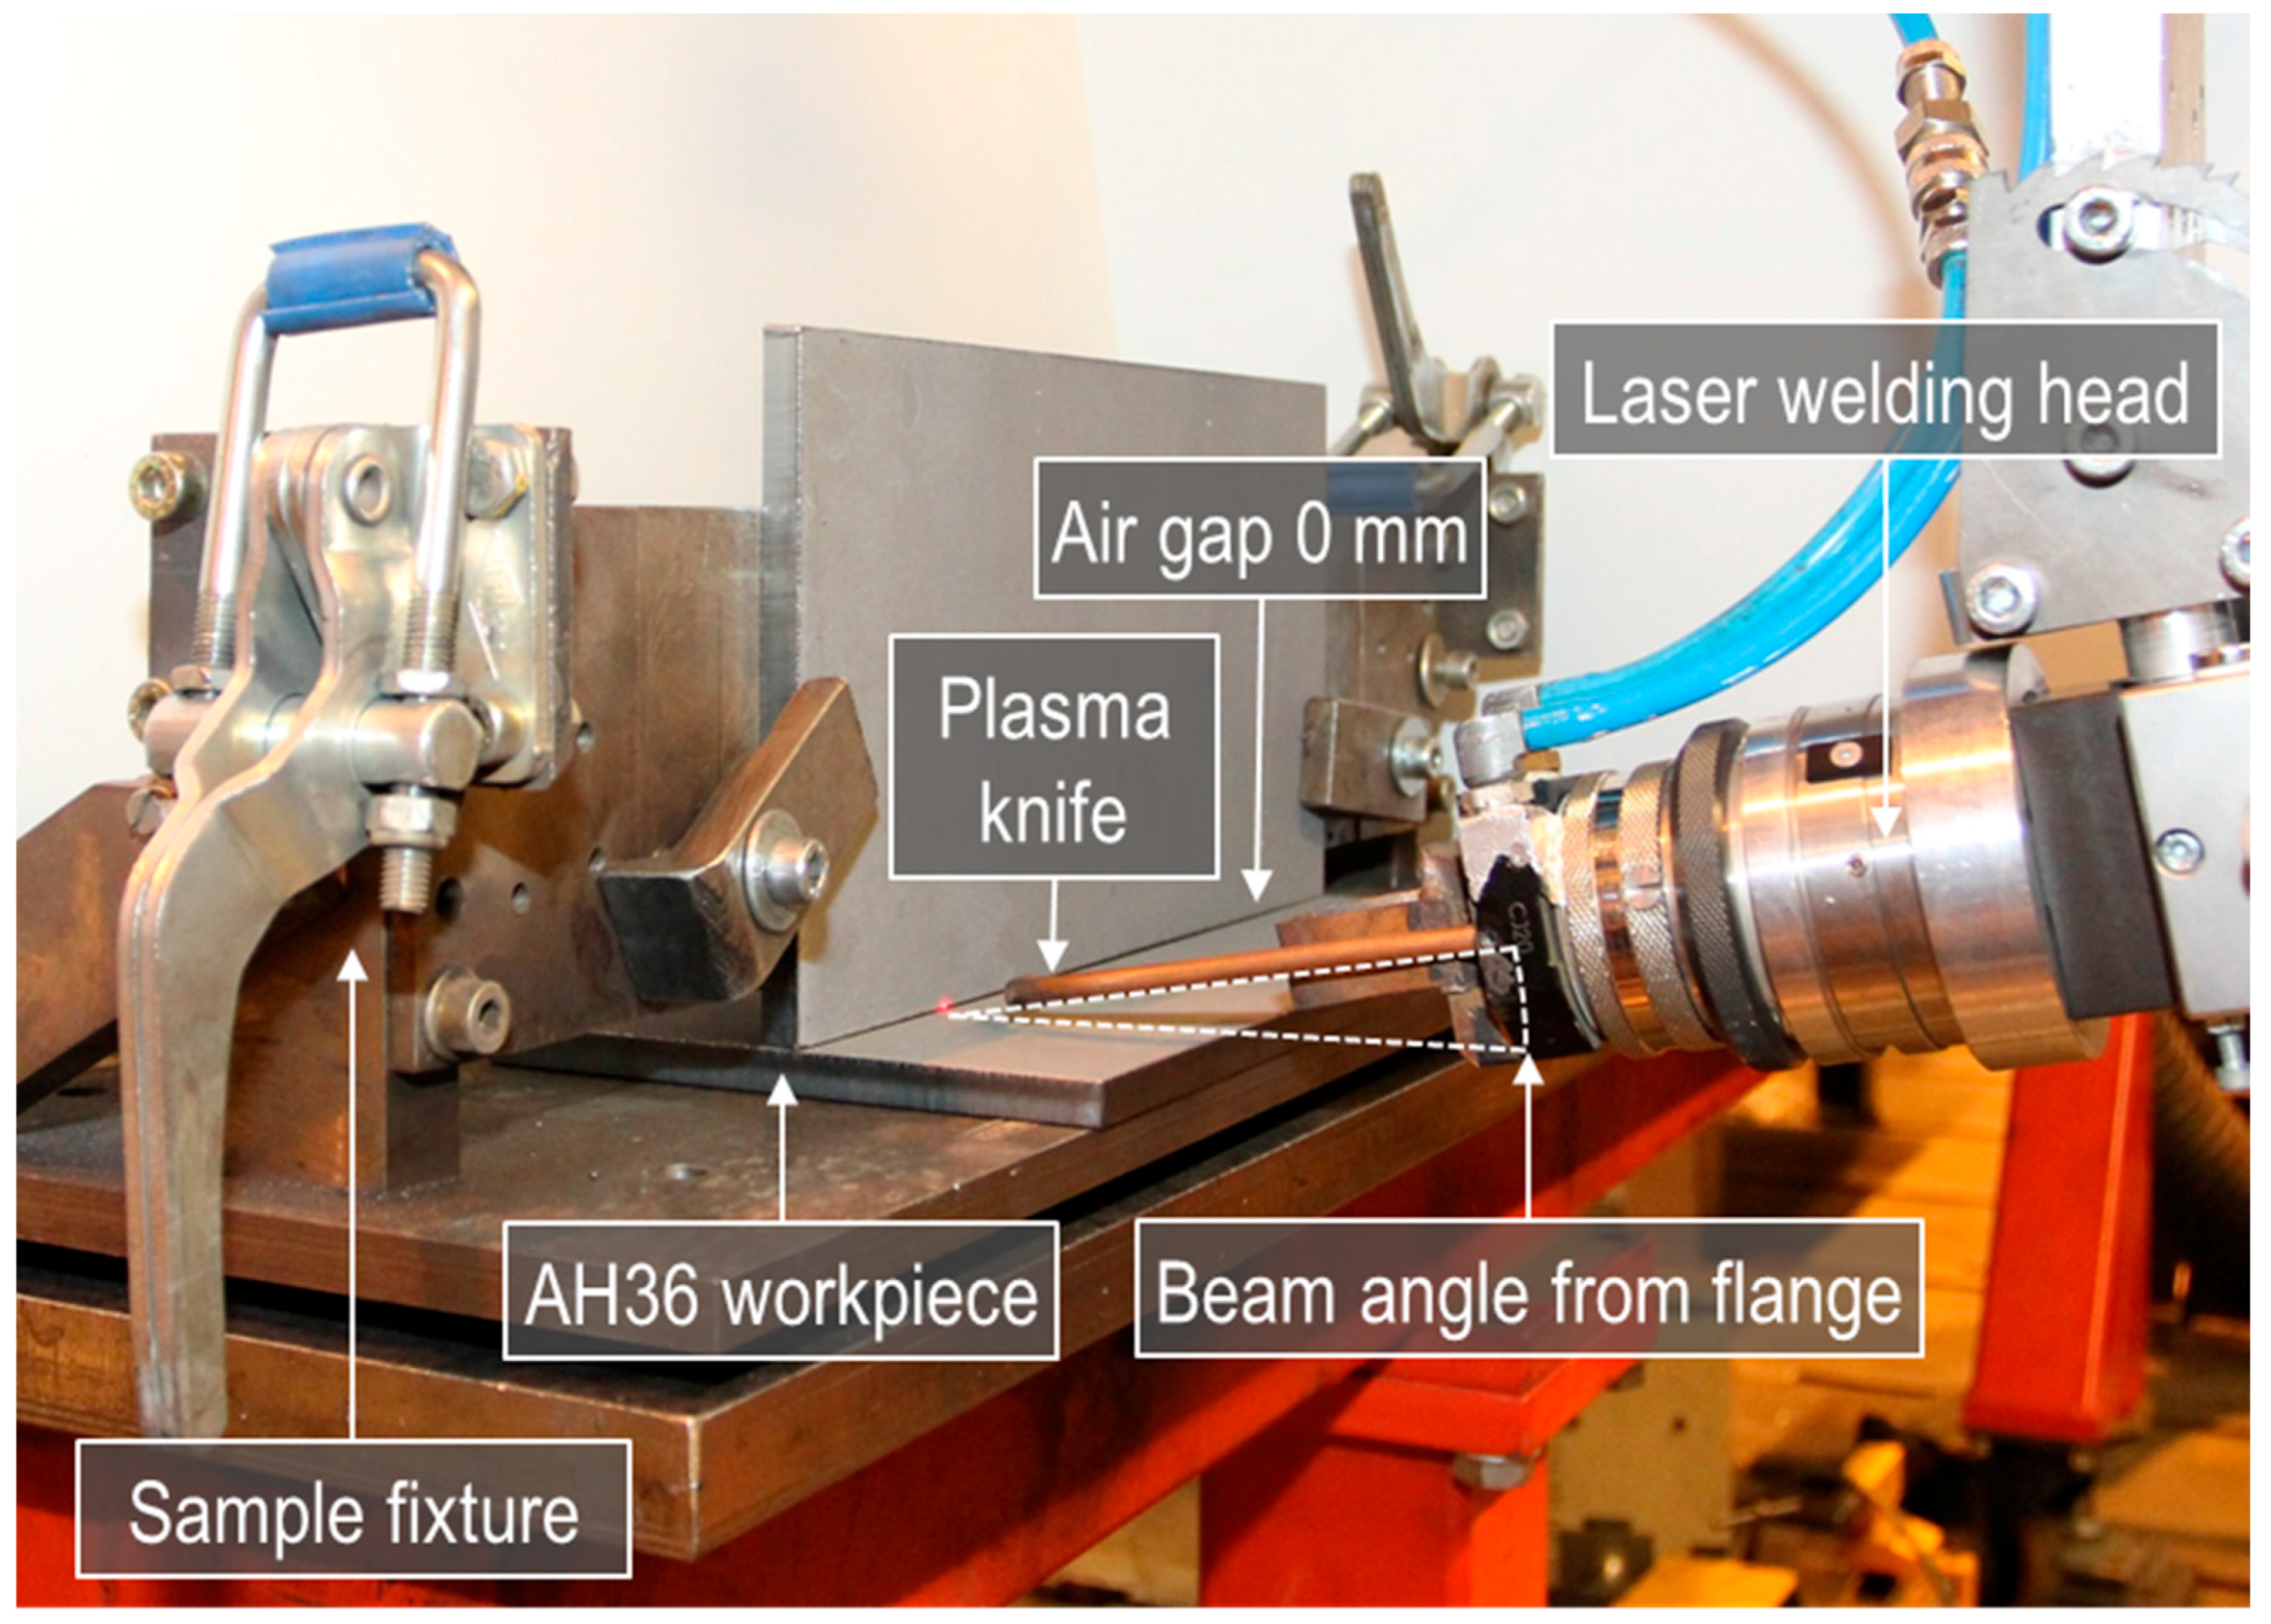
2. Materials and Methods

Shipbuilding steel AH36 is commonly used for shipbuilding and offshore structures. Hot rolled steel plates of AH36 have excellent weldability with a CEV (carbon equivalent value) of 0.248, calculated based on the chemical composition presented in Table 1. The yield strength of AH36 is 355 MPa.
Test specimens (100 mm × 350 mm × 8 mm) were cut with a CO2 laser using oxygen-assisted cutting. The edges were grid blasted with aluminum oxide and cleaned with acetone to remove possible contaminants. The plates were tack welded from the root side from the ends and the middle using gas metal arc welding. The workpiece was fixed in the flat (1F) position using stiff fixtures to avoid heat-induced air gap fluctuations during the welding. Single-sided welds with a length of 165 mm were performed. The experimental setup is shown in Figure 2.
All welding experiments were made with a continuous wave fiber laser IPG YLS-10000 having wavelength of 1070 nm and a top-hat focused beam profile. A Kugler LK190 mirror optics laser welding head was used. An air knife protected the focusing system from contamination with fumes and spatter, and no additional shielding gas was used. When comparing a T-joint with a butt joint, a further parameter, called offset, describing the distance of the beam center from the joint at the flange front edge, must be added. This parameter has a crucial effect on weld quality and must be considered for thick section joints of the type studied in this work. The experimental parameters of the welding process are presented in Table 2.
The beam was delivered by a system consisting of a beam transfer fiber (with core diameters of either 200, 300 or 600 μm), 120 mm collimating length optics, and a 300 mm focal length mirror. The properties of the laser beam emitted from each transport fiber were measured using a laser beam analyzer from Primes GmbH and are shown in Table 3.
The bead surface and root of each weld were visually evaluated based on standard EN ISO 13919-1, which classifies welds into three quality levels based on the type and severity of the imperfections that are present. The categories from best to worst are: B, stringent; C, intermediate; and D, moderate [31]. Metallographic preparation of the samples was carried out according to SFS-EN ISO 17639 [32]. The welds were transversely sectioned at the middle of the joint length, and polished and etched using a 2% Nital solution. Macrographs of the weld cross sections were taken for inspection of penetration, defects, and dimensions and shape of the fusion zone and HAZ (heat affected zone).

3. Results

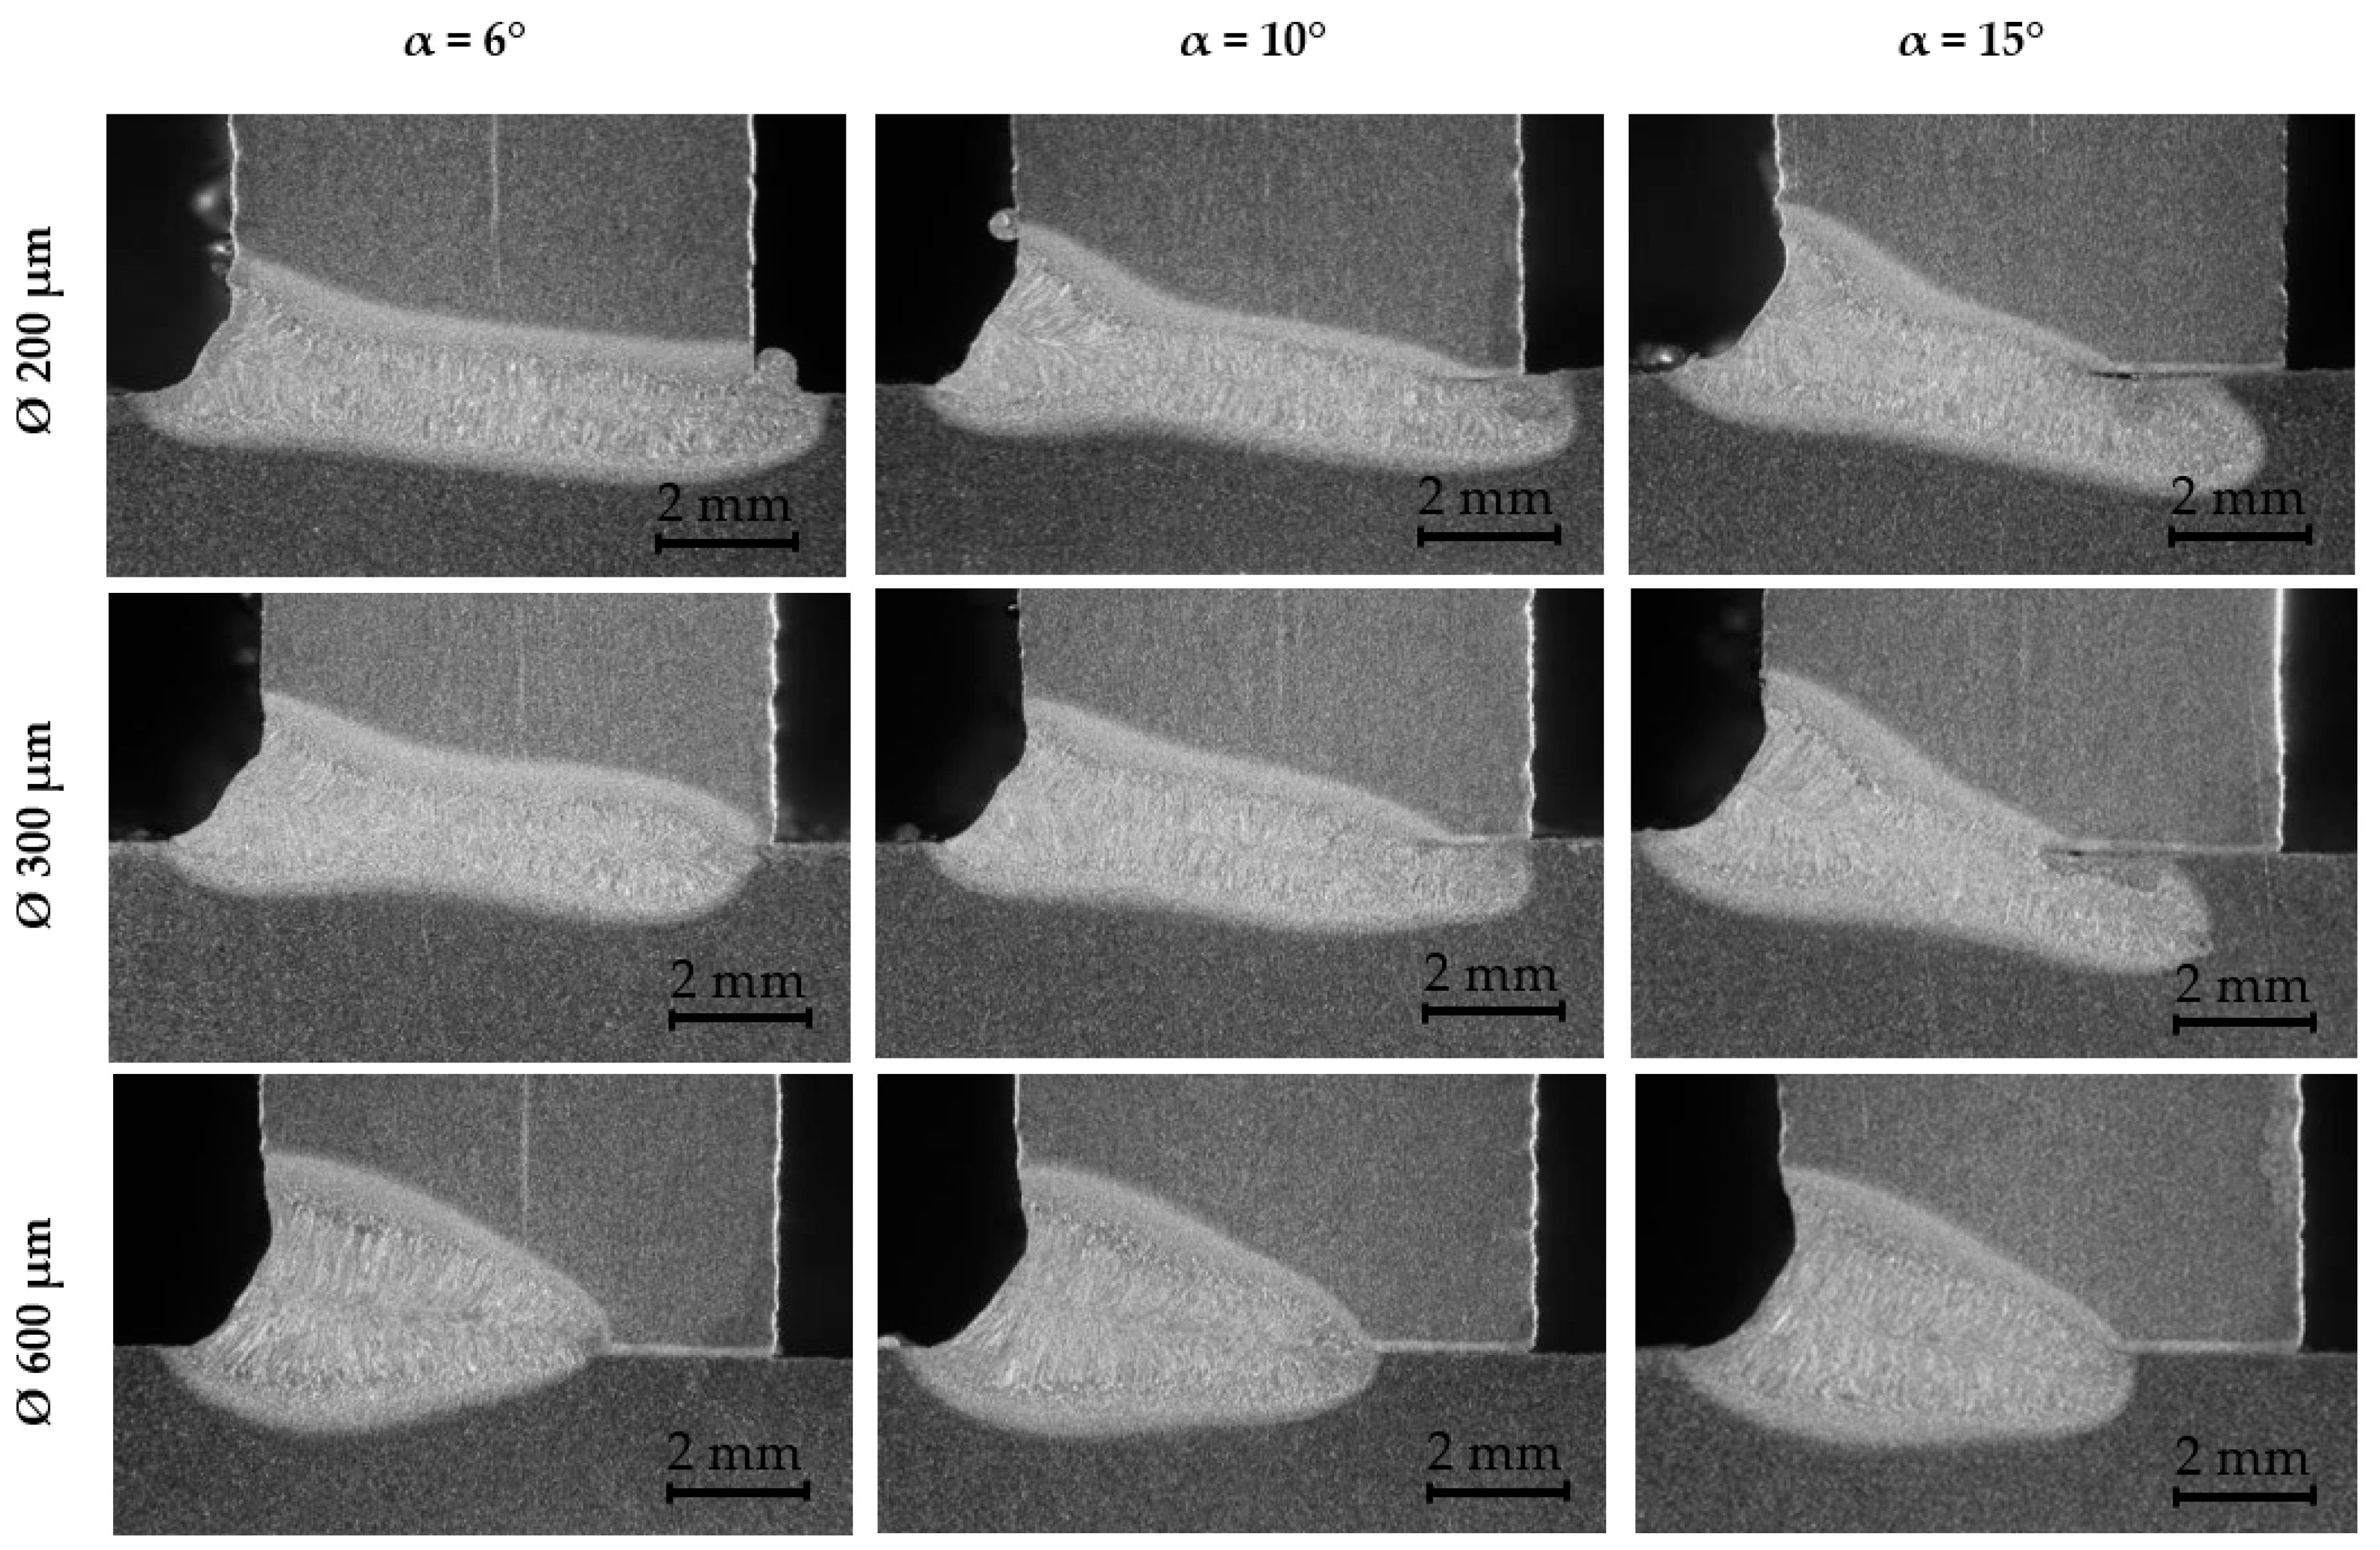
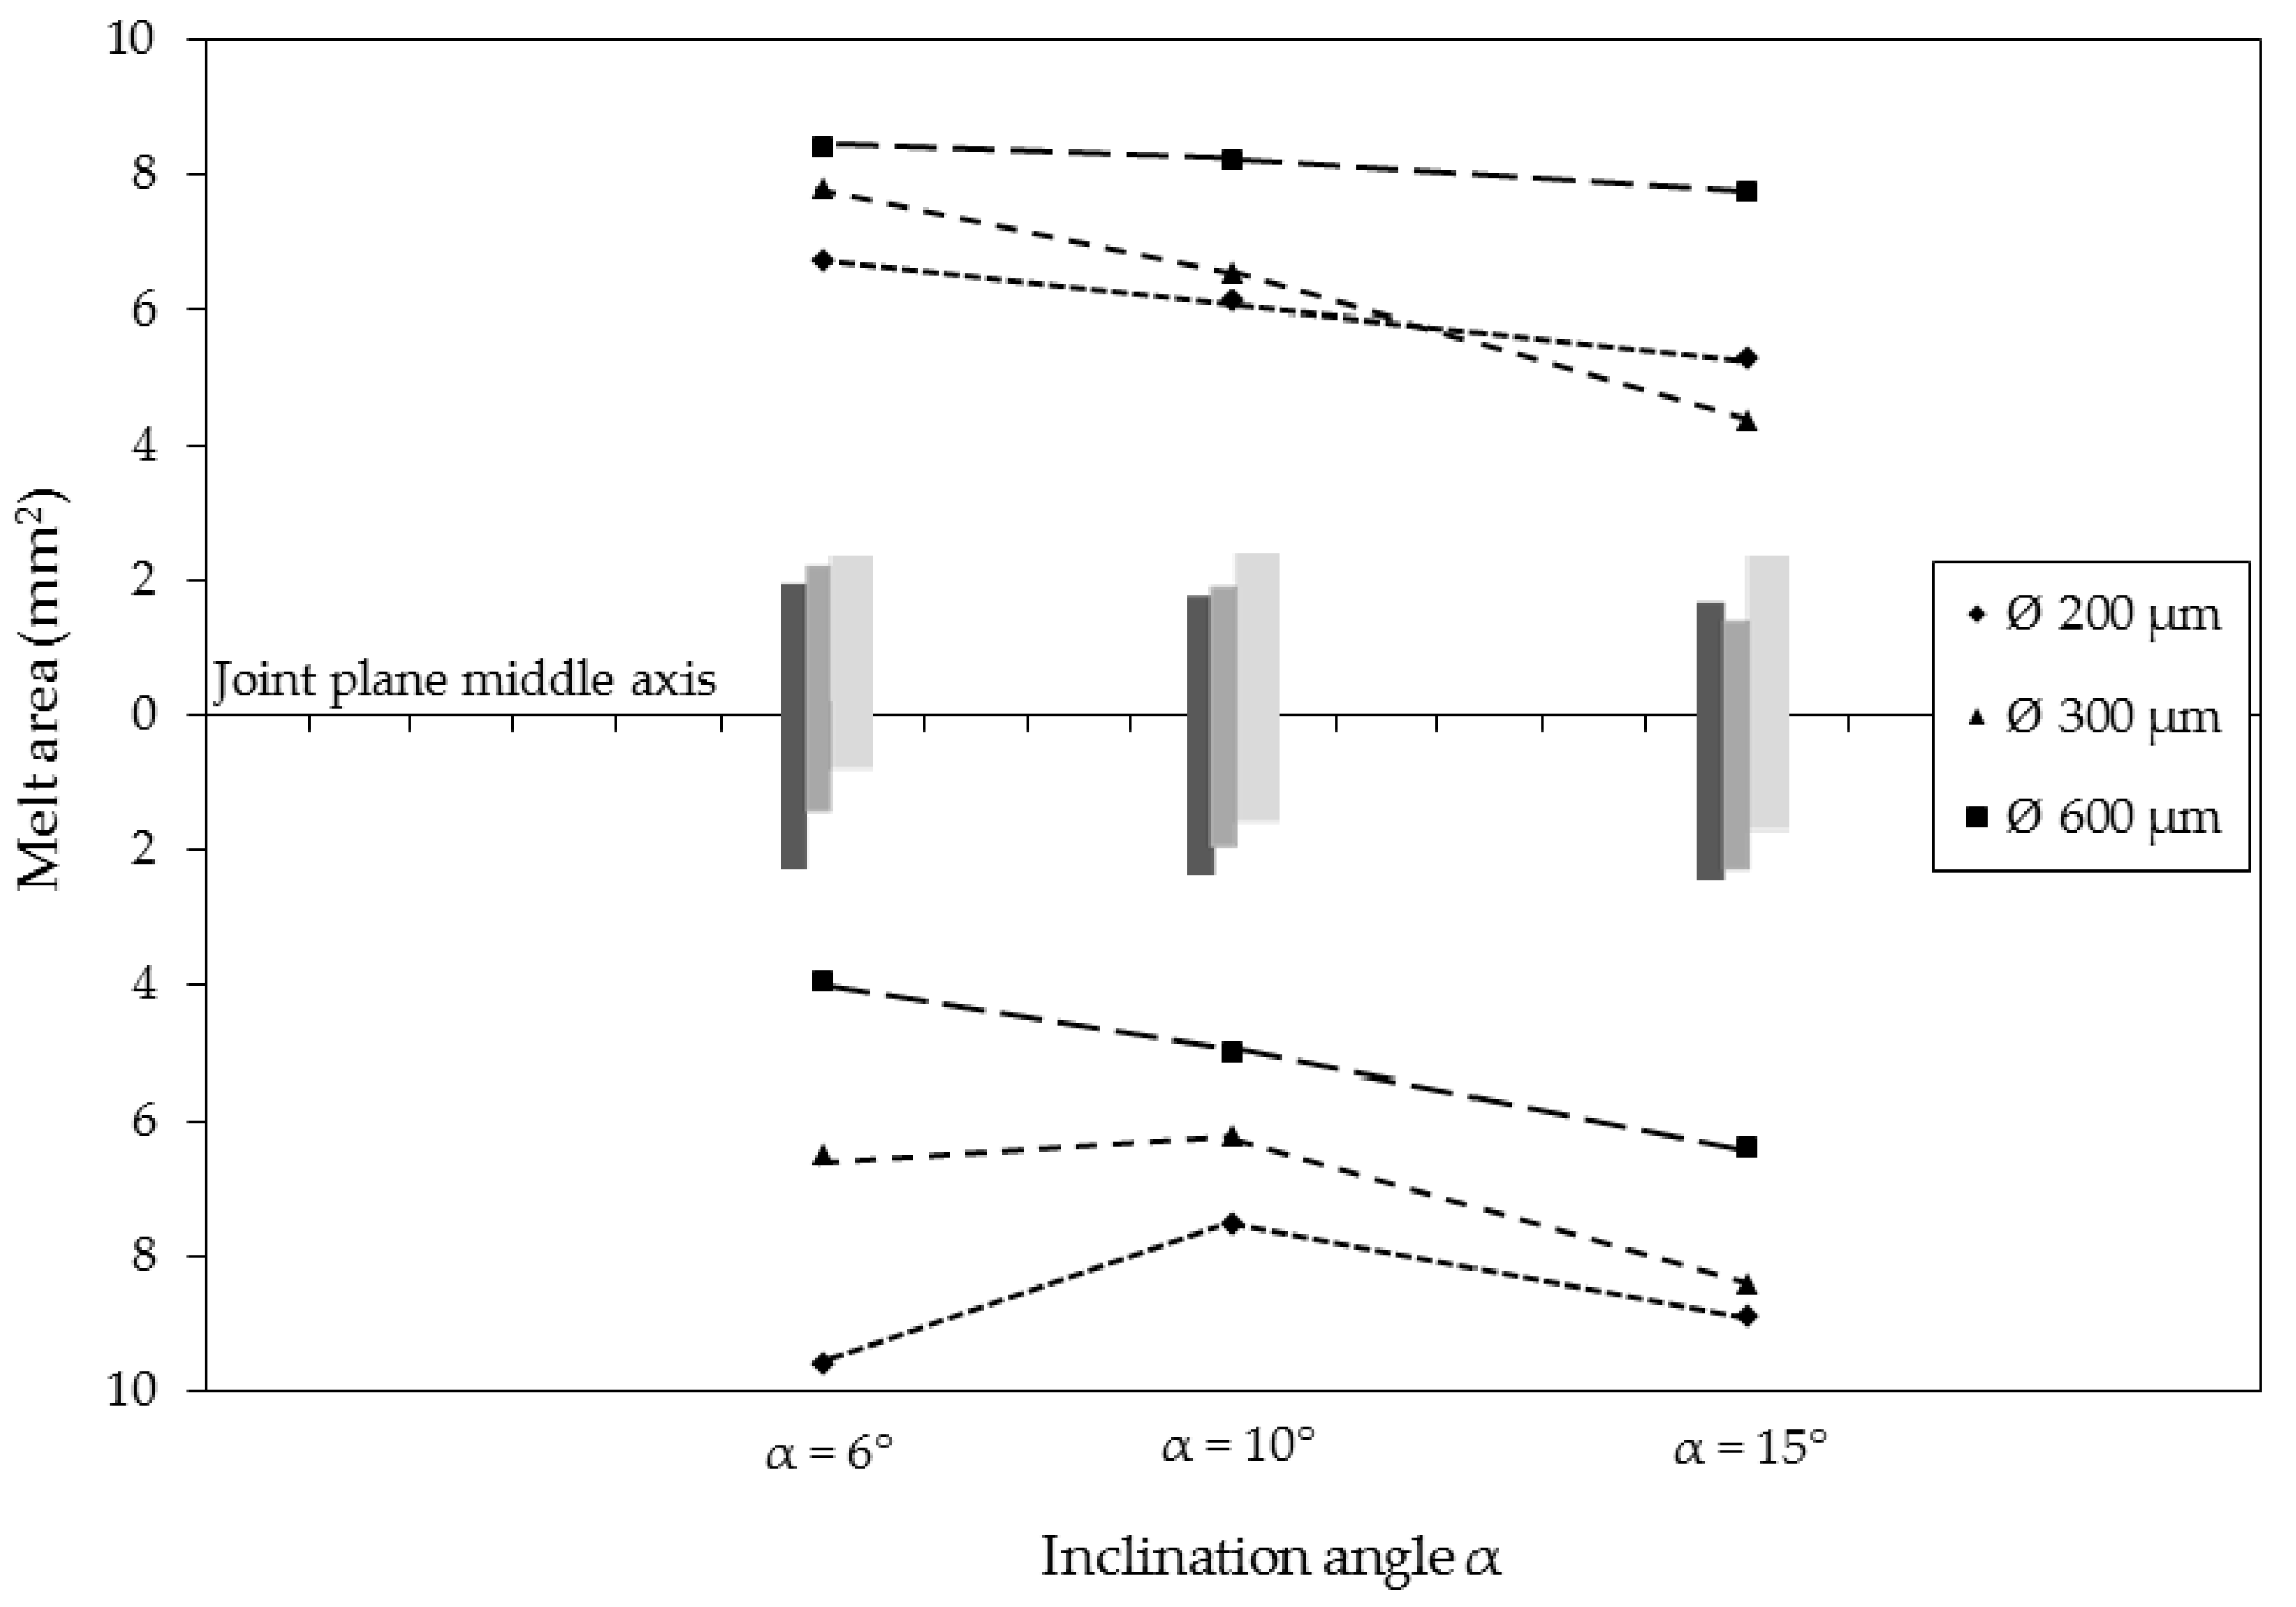
3.1. Effect of Beam Inclination Angle α

To study the effect of beam inclination angle α on the morphology/geometry of the weld, all other process parameters were kept constant. The beam was positioned 0.5 mm above the joint plane on the flange and focused 2 mm below the surface of the material. Focal point diameters on the surface were 0.82 mm, 1.00 mm and 1.61 mm for the 200 µm, 300 µm and 600 µm process fibers, respectively. The cross sections of the welds are shown in Figure 3.
It can be seen in Figure 3 that the penetration depth (measured from top of the weld) and the length of the joint fusion along the intersection decreased as the inclination angle increased. It can also be noticed that the penetration depth and area of the fusion zone correlate with the energy density of the beam. A full penetration weld was obtained only with the 200 µm process fiber and 6° inclination angle. All of the joints followed the axis of beam propagation. Averaged dimensions from three welds produced with each inclination angle are shown in Table 4.

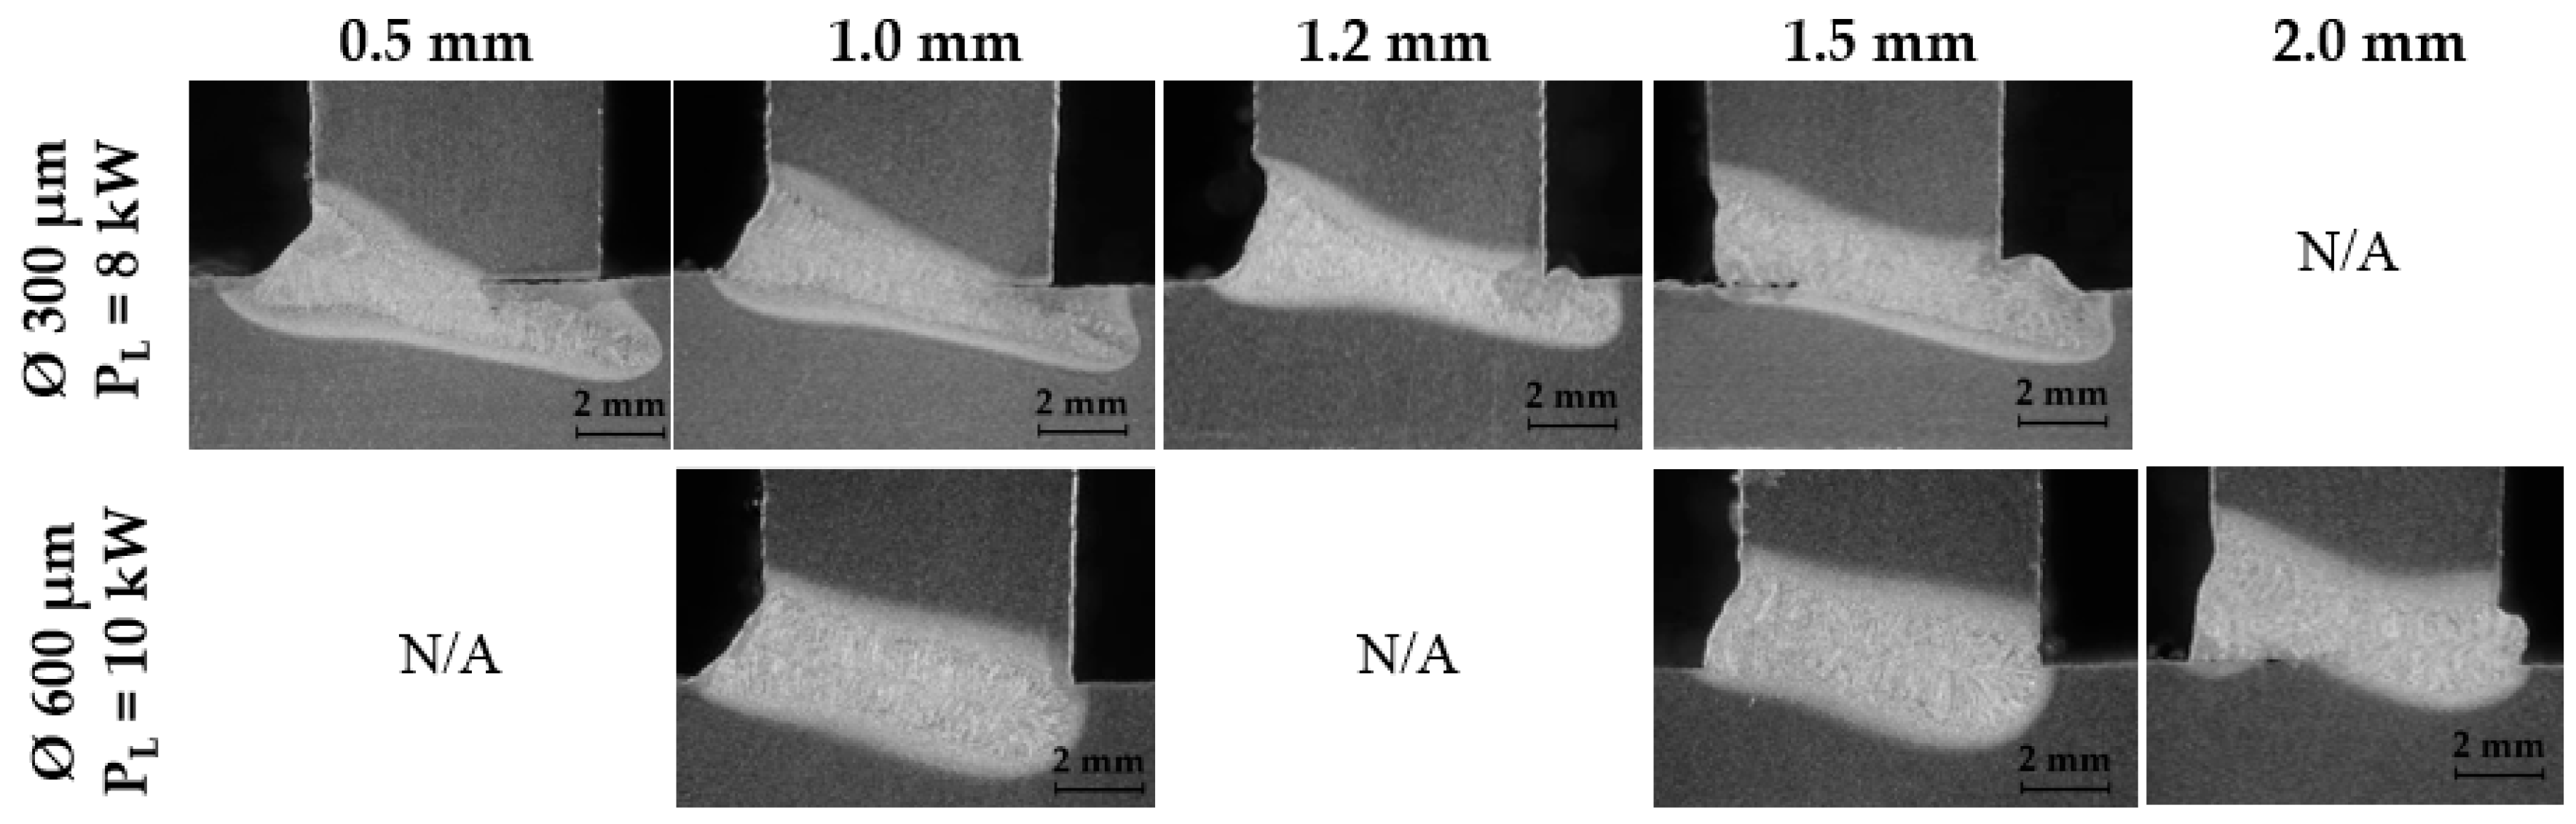
3.2. Effect of Beam Offset from the Flange

The effect of the beam offset from the flange was studied only with 300 µm and 600 µm process fibers. Based on the very narrow bead width produced earlier with the 200 µm process fiber and an assumption that the weld width largely determines the tolerance limits, the 200 µm process fiber was not included in the experiments. The laser power needed for full penetration was first calculated using the Power Factor Model developed by Suder et al. [23] and subsequently determined experimentally. The calculated values exceeded the real power requirement by at least 30% (less than 8 kW vs. 9.7 kW, FPP −2 mm, beam Ø on surface 1.0 mm; 10 kW vs. 13 kW, FPP −2 mm, beam Ø on surface 1.6 mm). Macrographs showing beam offsets from 0.5 mm to 2.0 mm are presented in Figure 4.
As shown in Figure 4, despite similar width of weld bead, there was a significant difference in the geometry of the fusion area. Welds produced with the 300 µm process fiber had a deep and narrow profile with a slightly wider top typical of high power laser welds. The setup with the 600 µm process fiber produced welds that were wide throughout the whole fusion area, resulting in a more acceptable weld profile for a T-joint.

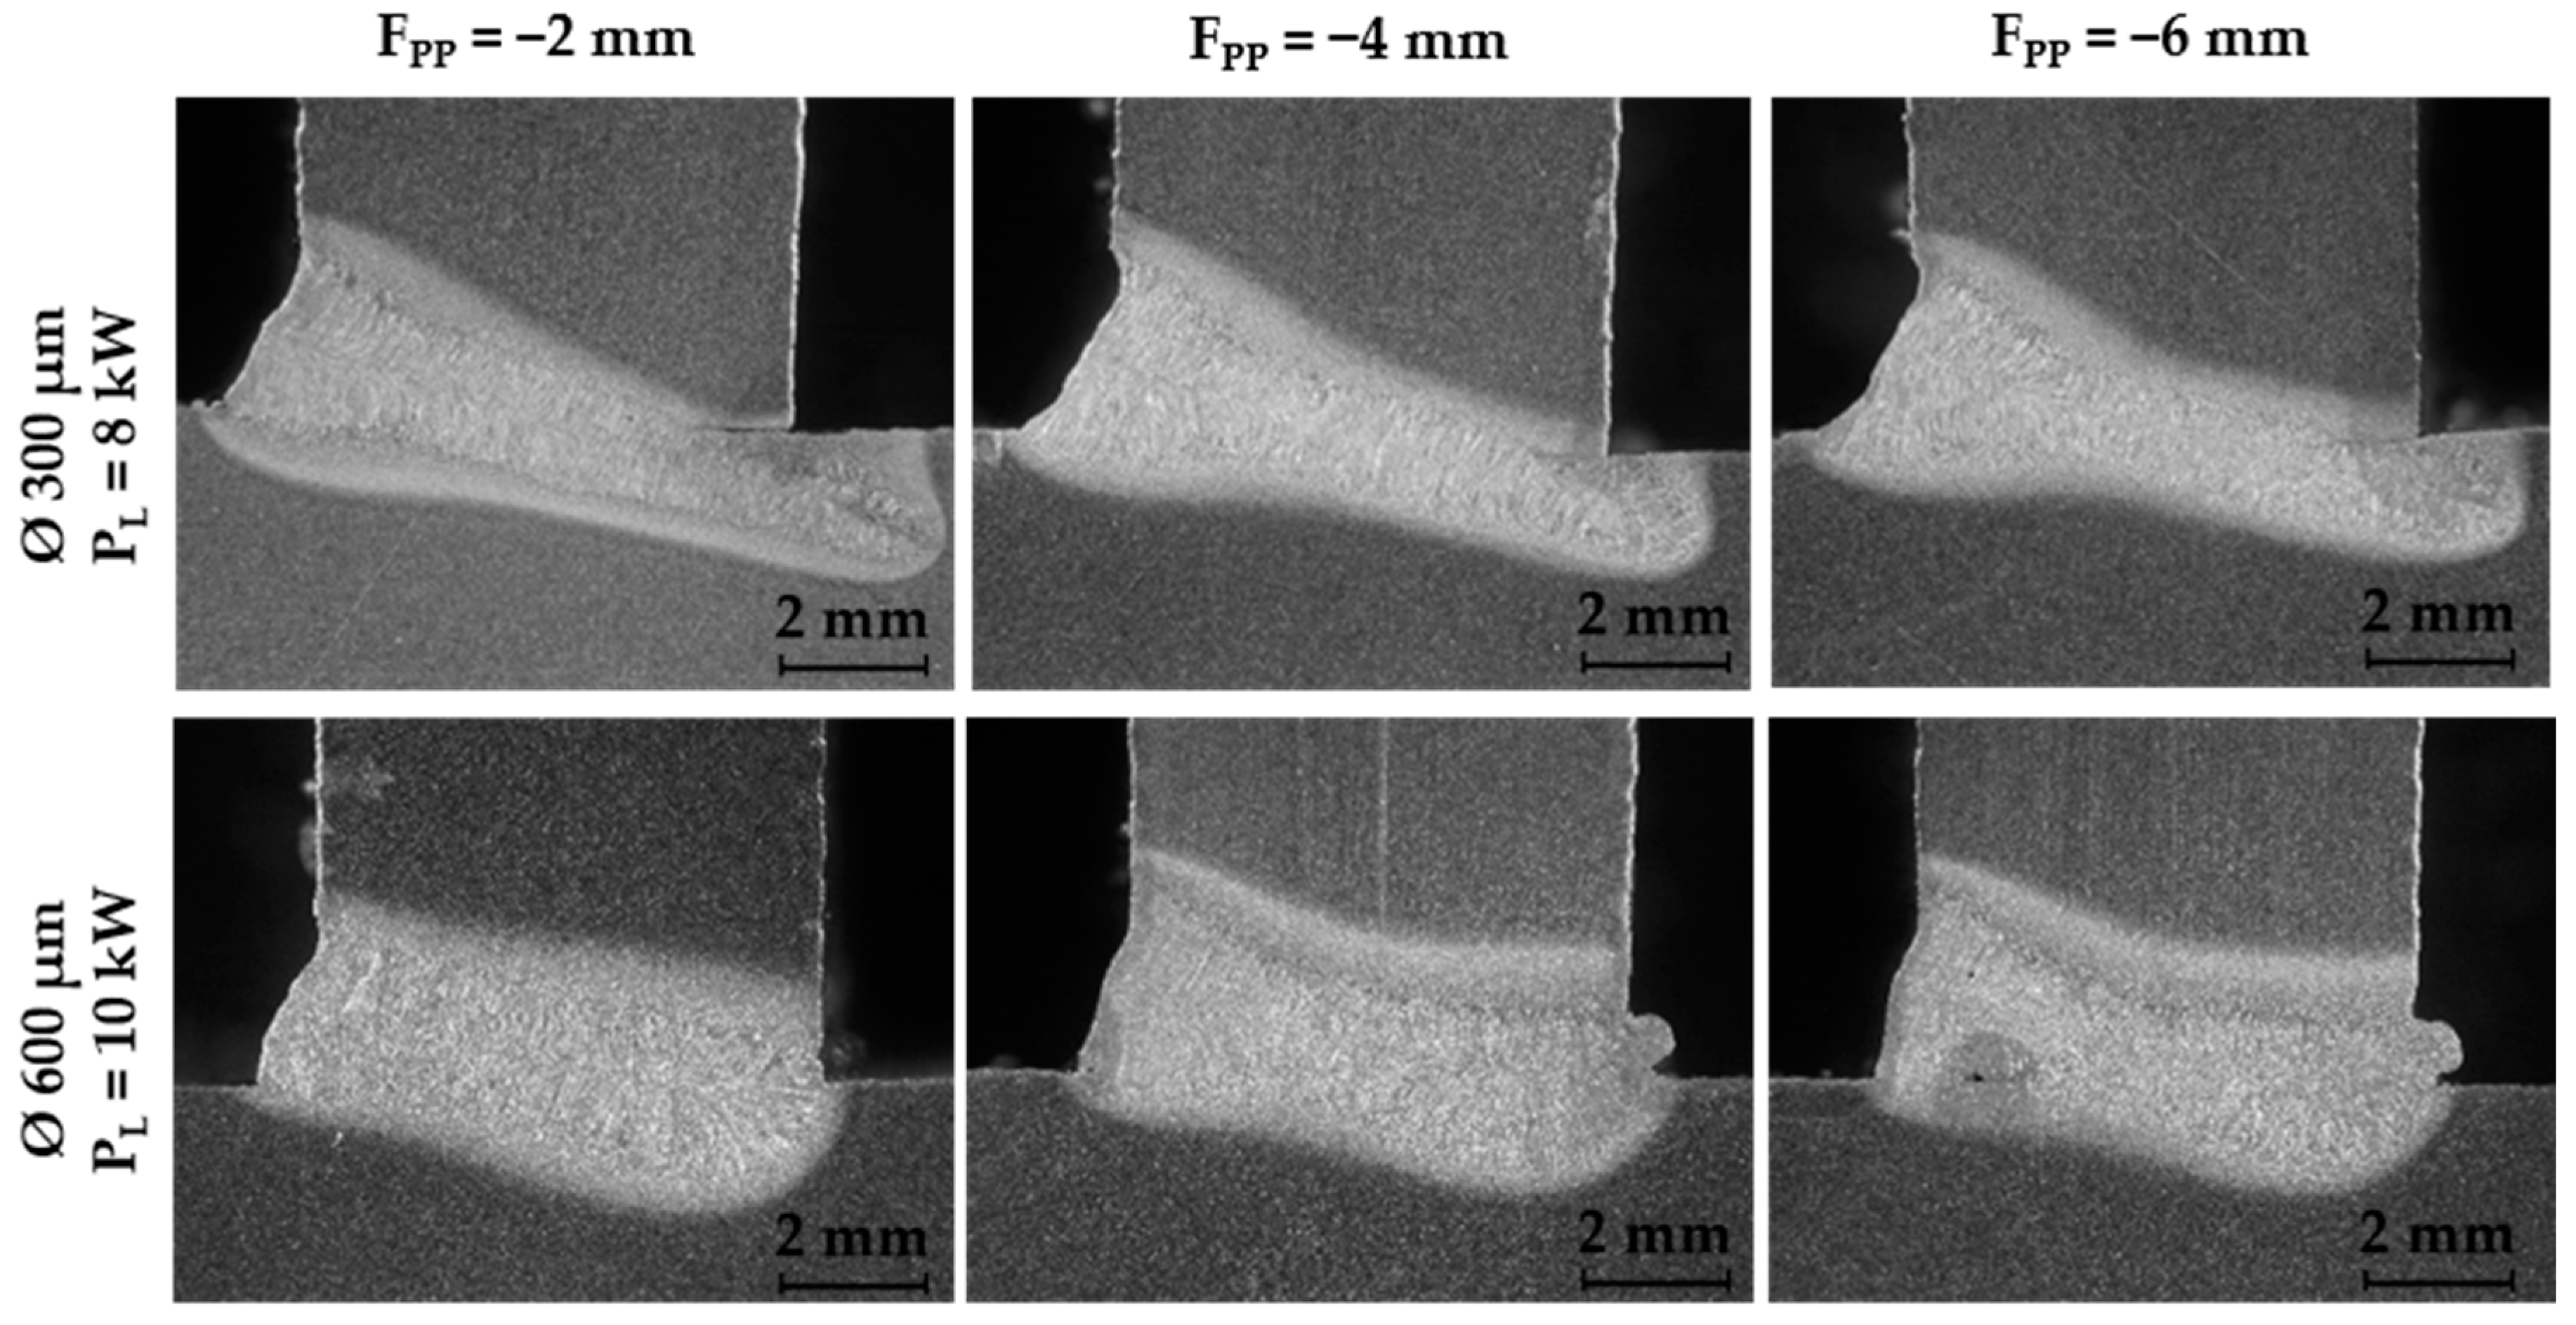
3.3. Effect of Focal Point Position

Negative defocusing was used to study whether decrease in beam density at the workpiece surface has a favorable effect on the formation of the weld bead. The influence of focal point position on the weld profile was investigated by changing the defocusing distance in steps of 2 mm. Beam offset from the flange was selected as 1 mm and 1.5 mm (for the 300 µm and 600 µm setups, respectively) to increase the likelihood of full penetration. The focal point was moved along the beam propagation direction inside the material in 2 mm steps. Figure 5 shows cross-sectional macrographs of the welds produced.
It can be seen from the images presented in Figure 5 that decreasing the focal point position leads to a slight decrease in penetration. FPP −4 mm resulted in full penetration in the set-up with the 600 µm process fiber, while none of the welds produced with the 300 µm fiber had complete penetration at the weld root.

4. Discussion

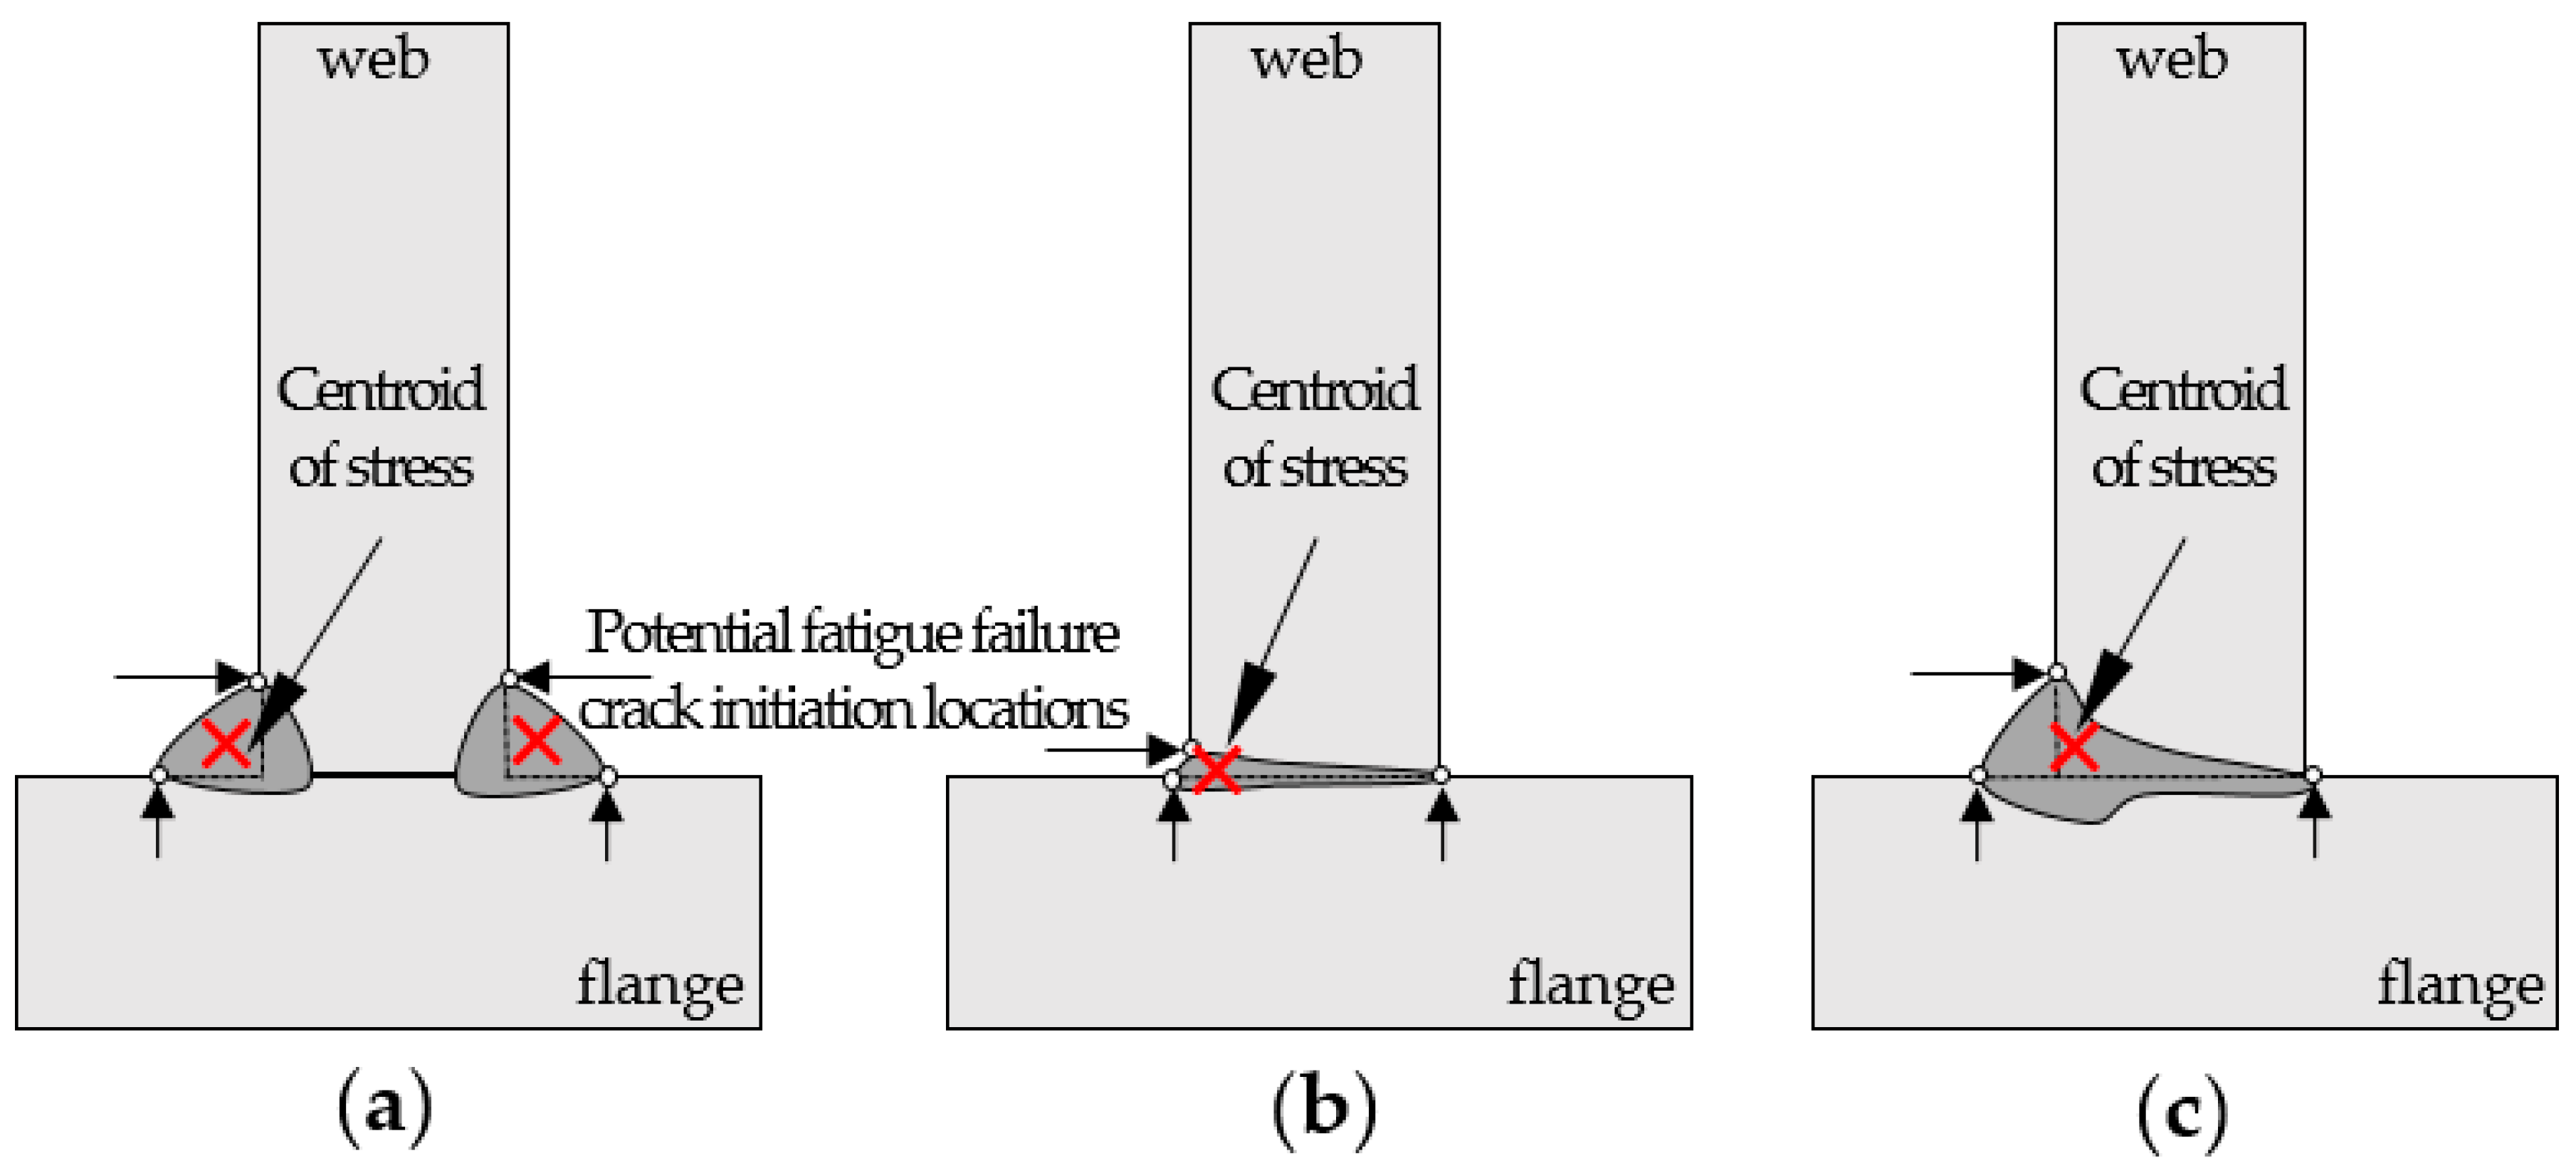
4.1. Geometry of the Welds

The purpose of this study was to investigate geometrical differences in welds produced with three different beam delivery fibers and to determine the effect of process parameters on T-joint welds. Thirty welds were produced, evaluated, and their cross-sections analyzed. The acceptance criteria in visual inspection were smooth and plain face and root sides of the weld seam, lack of spatter, cracks or other defects listed in the Standard EN ISO 13919-1, and full visible penetration on the root side. Cracks or porosity were not present, qualifying the welds for class C of ISO 13919-1. Obvious undercut and lack of fusion produced by an inappropriately positioned beam or a lack of laser power were causes of rejection.
The width of the weld fusion zone determines the largest acceptable inclination angle for producing full penetration at a given web thickness. It can be seen in Figure 3 that compared to the other set-ups studied, the process fiber with a core diameter 600 µm was least sensitive to increase of α. However, at given thickness of 8 mm, α = 6° produced the largest weld throat in all set-ups, regardless of the diameter of the beam, since the keyhole formed strictly along the axis of beam propagation. Figure 6 illustrates the effect of beam inclination angle on melt distribution relative to the middle axis of the joint.
Figure 6 shows the size of the melt area above and below the middle axis of the joint of the welds presented earlier in Figure 3. The bars illustrate the proportions of the melt area above (web) and below (flange) the joint plane, and the lines show the area of the melt. Process fibers with core diameters of 200 µm and 300 µm produced welds with similar properties: the melt area decreased with increase of inclination angle. The 600 µm diameter process fiber produced welds in which the melt area increased while simultaneously keeping the same proportions of the fusion zone above and below the joint axis. The fiber producing the largest focal point diameter was least sensitive to change of inclination angle.
From an engineering point of view, beam offset is an important parameter affecting the weld quality of fillet welds, where joint bridging ability and ensuring complete fusion are more important than the penetration depth itself. As can be observed in Figure 4, tolerance to beam offset is also determined by the width of the weld. An inclination angle of 15° was chosen over two smaller angles tested based on the width of the weld bead and possible accessibility restrictions of the welding head. Optimal offsets for acceptable top bead and full fusion at the root are: 1.0 mm with the 300 µm transfer fiber, and, 1.0 mm and 1.5 mm with the 600 µm transfer fiber. The diameters of the beams on the surface were 1.0 mm and 1.6 mm, respectively.
When the 300 µm fiber was used, deviation to either side from the 1.0 mm offset produced either lack of fusion at the root or undercut and lack of penetration at the face of the weld. Due to the small width of the weld/fusion zone, higher offset resulted in formation of severe undercut on the top of the weld, while part of the melt was pushed through the weld root. The transfer fiber with 600 µm core diameter had a wider positioning tolerance window because the width of the weld throughout the fusion area is also wider. All of the welds produced with the 600 µm process fiber had a smooth bead and root sides, complete penetration, and class B quality according to EN-ISO 13919-1. It seems that a change in the keyhole process, noticed earlier by [14], can be seen in the case of fillet welds in low alloyed steel. It is logical that power density has an effect on the process mechanism while still producing weld shape that is similar but wider than in the case of higher power density.
The focal point position has the same effect on T-joints as any other weld. Comparing the setups studied, an insignificant increase in bead width in correlation with an increase in beam dimension on the surface of material was noticed. FPP of −2 mm produced welds with a larger weld toe radius than FPP −6 mm. When FPP was positioned at −4 mm, that is, at half of the thickness of the web, the setup produced fully fused welds lacking porosity or other defects on both sides of the joint.

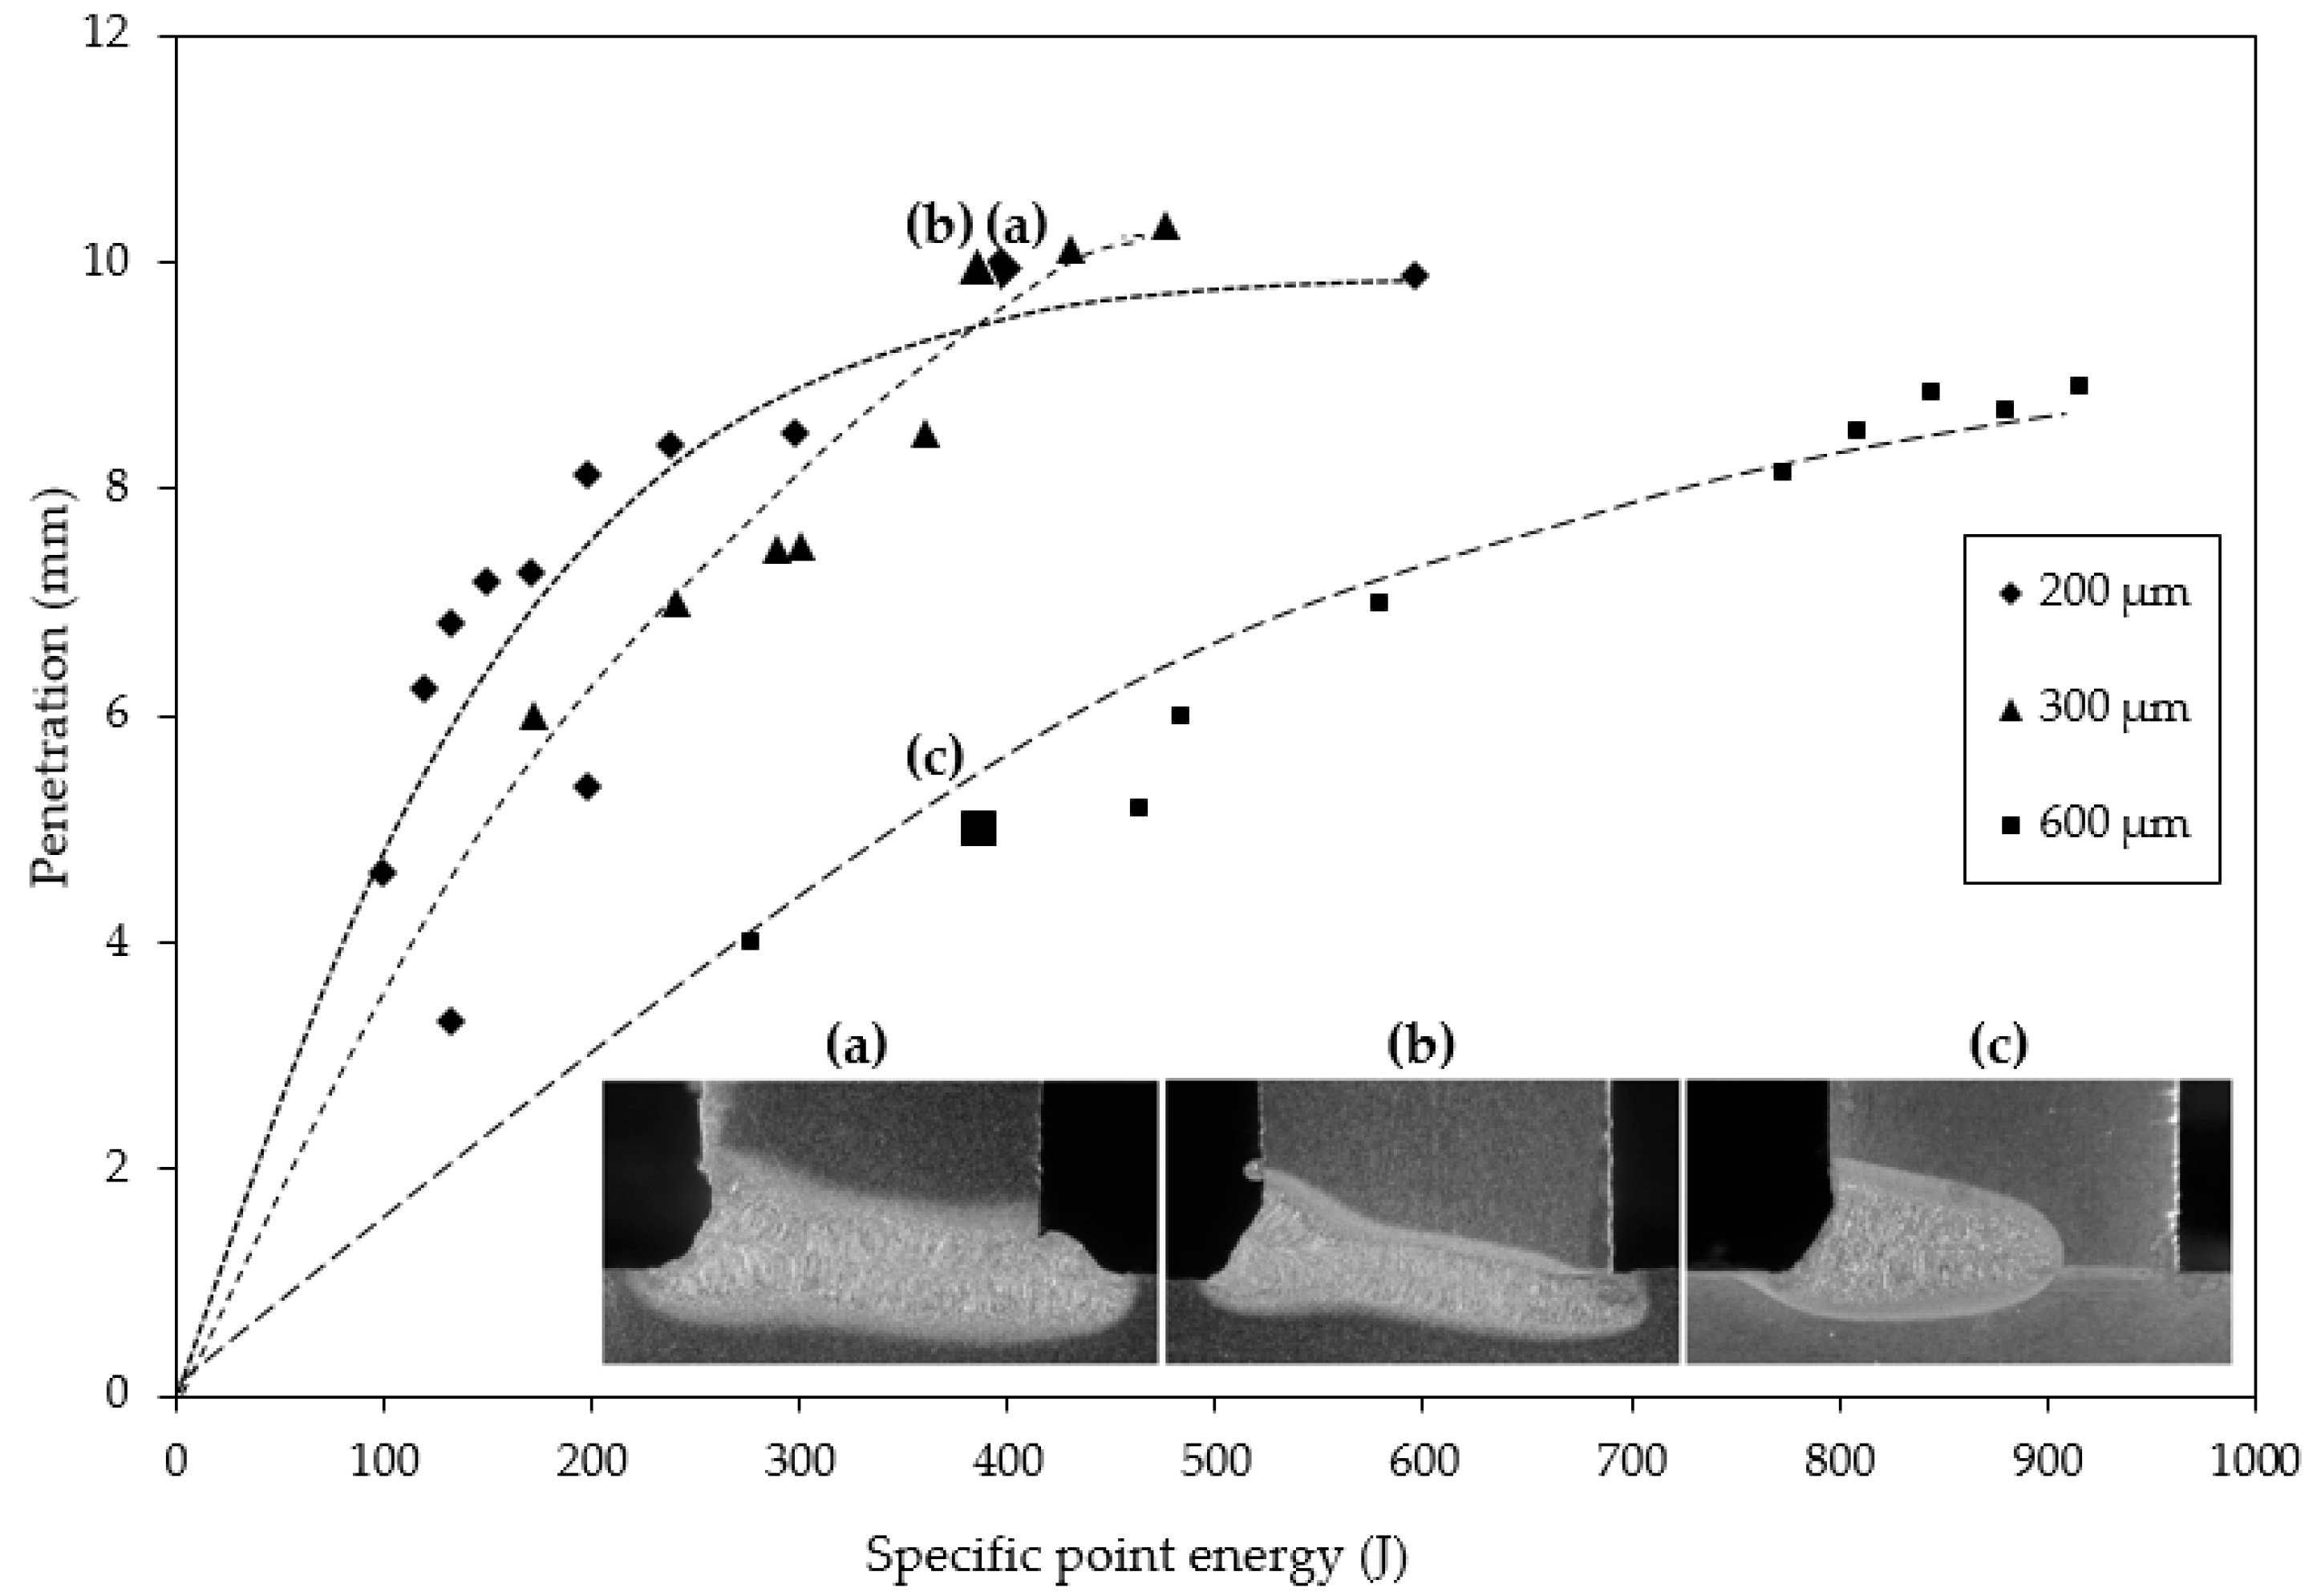
4.2. Application of Specific Point Energy to Welding of T-Joints

Traditionally, the depth of penetration has been characterized through the concept of heat input, also called line energy, which describes the energy available for producing the weld through the relationship of available laser power and welding speed. ESP also considers the diameter of the beam on the surface of the specimen and therefore provides higher accuracy in definition of the penetration depth and weld geometry [23]. Suder and Williams [22] have shown that, in the case of bead-on-plate welds, the penetration depth is defined by power density and specific point energy, and the width of the weld by interaction time, regardless of the optical setup used. T-joint fillet welds follow the same analytical model regarding the penetration depth as bead-on-plate welds; in this work, however, there was a deviation at larger beam diameters produced with the 600 µm process fiber. The relationship between ESP and penetration depth for all three setups is summarized in Figure 7.
Figure 7 shows curves for penetration depth produced with each of the process fibers and macrographs of three welds obtained at similar ESP using different process fibers. Beam diameters on the surface of the welds shown in Figure 7 were 0.82 mm, 1.00 mm and 1.61 mm (FPP −2 mm). The following laser power and welding speed combinations were used: (a) PL = 6 kW, vw = 0.75 m/min; (b) PL = 8 kW, vw = 1.25 m/min; and (c) PL = 4 kW, vw = 1 m/min. Welds (a) and (b) both had penetration depths close to 10 mm, when measured from the top of the bead, thus exceeding the thickness of the material, while weld (c) had only partial penetration. At similar ESP, the 200 µm process fiber produced the weld with the deepest penetration and largest melt area (a). Full penetration was not obtained with the 300 µm process fiber despite sufficient penetration depth, and the weld produced with the 600 µm fiber was noticeably shallower.
It is known that the diameter of the beam governs the dimensions of the keyhole, which in turn define the depth and width of the weld. As expected, beams with smaller diameters produced deeper penetrations at any given ESP. Within each setup, it can be seen that an increase in ESP also increases the penetration depth, but comparison of all three setups shows that the power density of the beam has a more pronounced effect on the morphology of the weld than ESP. A possible explanation for this might be that the heat conduction in T-joints is different than in butt joints or bead on plate joints. Distribution of energy over a larger area leads to a slight decrease in molten area and reduced penetration depth. The power density of the beam determines the depth of the weld, while the width of the weld is determined by the diameter of the focused beam on the surface of the specimen.

4.3. Optimal Welding Conditions for T-Joint

The effects of beam inclination angle, beam offset from the flange and the focal point position relative to the surface of the material were studied to gain insight into the applicability of each setup under industrial conditions. Table 5 summarizes the findings.
The optimal parameters for all set-ups were inclination angle 6°, beam offset from the flange 1 mm, and focal point position −4 mm below the surface of the material. In all of the setups, the axis of the weld was aligned along the direction of the beam propagation. For this reason, when the beam was aimed past the root of the joint, the formed molten pool did not follow the joint plane, resulting in a lack of fusion at the back of the weld. However, the applicability of a beam inclination angle of 6° in industrial applications may be limited because of a danger of collision of the laser welding head while maneuvering in restricted space, especially in situations where the incident beam side of the flange exceeds the focal length of the laser.
From the industrial point of view, the most versatile solution for T-joints of the three process fibers tested would be the fiber with a core diameter of 600 µm. This setup produced top beads superior in quality to the two other setups studied. The welds made with the 200 µm and 300 µm process fibers were deep yet extremely narrow at the deepest section of the weld and prone to undercut at the surface. A setup with a 600 µm fiber results in a more stable process that has a greater tolerance for beam displacement and smaller probability for seam imperfections.

5. Conclusions

The present work reported welding of single-sided T-joints of 8 mm thick AH36 shipbuilding steel with three optical setups using process fibers with core diameters of 200 µm, 300 µm and 600 µm. The current study found that:
(1)
Full fusion in one welding pass was produced with all three process fibers studied.
(2)
Penetration depth and width of the weld both primarily depend on the beam diameter. The parameter with the greatest influence on the depth of the weld is the power density of the beam, while the width of the weld is determined by the diameter of the focused beam. The width of the weld bead only has a minor correlation to the diameter of the beam on the surface.
(3)
Smaller spot sizes provide an advantage in penetration depth at the same welding speed and power but are prone to producing undercuts. Due to the narrowness of the weld, the positioning of the beam has to be extremely accurate to avoid the weld missing the root of the joint.
(4)
Welds produced with 600 µm process fiber were less prone to undercut formation and had more favorable shape of the weld toe than welds produced with 200 µm and 300 µm process fibers.
(5)
Process fiber with core diameter 600 µm produced welds with the highest quality and was least sensitive to changes in beam positioning.
(6)
Using beam delivery fibers with larger core diameters has a favorable effect on achieving full fusion in T-joints. Reduced energy density on surface increases the width of the weld throughout the penetration and produces smoother junctions of weld bead and base material.

Acknowledgments

Authors gratefully acknowledge Pertti Kokko for assistance with the experiments and Antti Heikkinen for the help with the metallography. Authors would like to thank the project PAMOWE of Academy of Finland for financial support.

Author Contributions

Anna Unt, Ilkka Poutiainen and Antti Salminen conceived and designed the experiments; Anna Unt and Ilkka Poutiainen performed the experiments; Anna Unt, Stefan Grünenwald, Mikhail Sokolov and Antti Salminen analyzed the data; Antti Salminen and Ilkka Poutiainen contributed materials/analysis tools; and Anna Unt and Antti Salminen wrote the paper.

Conflicts of Interest

The authors declare no conflicts of interest.

References

  1. Grupp, M.; Klinker, K.; Cattaneo, S. Welding of high thicknesses using a fibre optic laser up to 30 kW. Weld. Int. 2013, 27, 109–112. [Google Scholar] [CrossRef]
  2. Belforte, D. Laser Market Results Confound the Experts. Available online: http://www.industrial-lasers.com/articles/2017/01/laser-market-results-confound-the-experts.html (accessed on 16 August 2017).
  3. Thoss, A.F. Four laser companies to exceed $1 billion revenue in 2016. Adv. Opt. Technol. 2017, 6, 13–16. [Google Scholar] [CrossRef]
  4. Enz, J.; Khomenko, V.; Riekehr, S.; Ventzke, V.; Huber, N.; Kashaev, N. Single-sided laser beam welding of a dissimilar AA2024–AA7050 T-joint. Mater. Des. 2015, 76, 110–116. [Google Scholar] [CrossRef]
  5. Liu, S.; Mi, G.; Yan, F.; Wang, C.; Jiang, P. Correlation of high power laser welding parameters with real weld geometry and microstructure. Opt. Laser Technol. 2017, 94, 59–67. [Google Scholar] [CrossRef]
  6. Sokolov, M.; Salminen, A. Improving laser beam welding efficiency. Engineering 2014, 6, 559–571. [Google Scholar] [CrossRef]
  7. Kuryntsev, S.V.; Gilmutdinov, A.K. Welding of stainless steel using defocused laser beam. J. Constr. Steel Res. 2015, 114, 305–313. [Google Scholar] [CrossRef]
  8. Hobbacher, A. Recommendations for Fatigue Design of Welded Joints and Components; Springer: Berlin, Germany, 2015. [Google Scholar]
  9. Det Norske Veritas. Fatigue Design of Offshore steel Structures, Recommended Practice; DNV-RP-C203; DNV GL: Oslo, Norway, 2008. [Google Scholar]
  10. Matsumoto, N.; Kawahito, Y.; Nishimoto, K.; Katayama, S. Effects of laser focusing properties on weldability in high-power fiber laser welding of thick high-strength steel plate. J. Laser Appl. 2017, 29, 012003. [Google Scholar] [CrossRef]
  11. Grajcar, A.; Morawiec, M.; Różański, M.; Stano, S. Twin-spot laser welding of advanced high-strength multiphase microstructure steel. Opt. Laser Technol. 2017, 92, 52–61. [Google Scholar] [CrossRef]
  12. Morawiec, M.; Różański, M.; Grajcar, A.; Stano, S. Effect of dual beam laser welding on microstructure–property relationships of hot-rolled complex phase steel sheets. Arch. Civ. Mech. Eng. 2017, 17, 145–153. [Google Scholar] [CrossRef]
  13. Shen, J.; Li, B.; Hu, S.; Zhang, H.; Bu, X. Comparison of single-beam and dual-beam laser welding of Ti–22Al–25Nb/TA15 dissimilar titanium alloys. Opt. Laser Technol. 2017, 93, 118–126. [Google Scholar] [CrossRef]
  14. Vänskä, M. Defining the Keyhole Modes—The Effects on the Weld Geometry and the Molten Pool Behaviour in High Power Laser Welding of Stainless Steels. Ph.D. Thesis, Lappeenranta University of Technology, Lappeenranta, Finland, 2014. [Google Scholar]
  15. Müller, A.; Goecke, S.F.; Sievi, P.; Albert, F.; Rethmeier, M. Laser beam oscillation strategies for fillet welds in lap joints. Phys. Proc. 2014, 56, 458–466. [Google Scholar] [CrossRef]
  16. Wang, L.; Gao, M.; Zhang, C.; Zeng, X. Effect of beam oscillating pattern on weld characterization of laser welding of AA6061-T6 aluminum alloy. Mater. Des. 2016, 108, 707–717. [Google Scholar] [CrossRef]
  17. Hao, K.; Li, G.; Gao, M.; Zeng, X. Weld formation mechanism of fiber laser oscillating welding of austenitic stainless steel. J. Mater. Process. Technol. 2015, 225, 77–83. [Google Scholar] [CrossRef]
  18. Zhang, M.; Chen, G.; Zhou, Y.; Liao, S. Optimization of deep penetration laser welding of thick stainless steel with a 10 kW fiber laser. Mater. Des. 2014, 53, 568–576. [Google Scholar] [CrossRef]
  19. Ion, J. Laser Processing of Engineering Materials: Principles, Procedure and Industrial Application; Butterworth-Heinemann: Oxford, UK, 2005; p. 179. ISBN 0-7506-6079-1. [Google Scholar]
  20. Zou, J.L.; He, Y.; Wu, S.K.; Huang, T.; Xiao, R.S. Experimental and theoretical characterization of deep penetration welding threshold induced by 1-μm laser. Appl. Surf. Sci. 2015, 57, 1522–1527. [Google Scholar] [CrossRef]
  21. Courtois, M.; Carin, M.; Le Masson, P.; Gaied, S.; Balabane, M. A new approach to compute multi-reflections of laser beam in a keyhole for heat transfer and fluid flow modelling in laser welding. J. Phys. D Appl. Phys. 2013, 46, 505305. [Google Scholar] [CrossRef]
  22. Suder, W.J.; Williams, S.W. Investigation of the effects of basic laser material interaction parameters in laser welding. J. Laser Appl. 2012, 24, 032009. [Google Scholar] [CrossRef]
  23. Suder, W.J.; Williams, S. Power factor model for selection of welding parameters in CW laser welding. Opt. Laser Technol. 2014, 56, 223–229. [Google Scholar] [CrossRef]
  24. Ayoola, W.A.; Suder, W.J.; Williams, S.W. Parameters controlling weld bead profile in conduction laser welding. J. Mater. Process. Technol. 2017, 249, 522–530. [Google Scholar] [CrossRef]
  25. Nikhare, N.B.; Arakerimath, R.R. Parametric analysis and heat transfer enhancement of laser welding for different material. Int. J. Eng. Manag. Res. 2015, ICRAME-2015, 92–96. [Google Scholar]
  26. Hashemzadeh, M.; Suder, W.; Williams, S.; Powell, J.; Kaplan, A.F.H.; Voisey, K.T. The application of specific point energy analysis to laser cutting with 1 μm laser radiation. Phys. Proc. 2014, 56, 909–918. [Google Scholar] [CrossRef]
  27. Verhaeghe, G. The effect of spot size and laser quality on welding performance when using high-power continuous wave solid-state lasers. In Proceedings of the ICALEO’2005 Conference, Miami, FL, USA, 31 October–3 November 2005; pp. 264–271. [Google Scholar]
  28. Kawahito, Y.; Mizutani, M.; Katayama, S. Investigation of high-power fiber laser welding phenomena of stainless steel. Trans. JWRI 2007, 36, 11–15. [Google Scholar]
  29. Bhargava, P.; Paul, C.P.; Mundra, G.; Premsingh, C.H.; Mishra, S.K.; Nagpure, D.; Kumar, A.; Kukreja, L.M. Study on weld bead surface profile and angular distortion in 6 mm thick butt weld joints of SS304 using fiber laser. Opt. Laser Eng. 2014, 53, 152–157. [Google Scholar] [CrossRef]
  30. Katayama, S.; Kawahito, Y.; Mizutani, M. Elucidation of laser welding phenomena and factors affecting weld penetration and welding defects. Phys. Proc. 2010, 5, 9–17. [Google Scholar] [CrossRef]
  31. International Organization for Standardization. EN ISO 13919-1: Welding—Electron and Laser-Beam Welded Joints—Guidance on Quality Levels for Imperfection—Part 1: Steel; ISO: Geneva, Switzerland, 1996; 9p. [Google Scholar]
  32. International Organization for Standardization. EN ISO 17639 Destructive Tests on Welds in Metallic Materials—Macroscopic and Microscopic Examination of Welds; ISO: Geneva, Switzerland, 2003. [Google Scholar]
Figure 1. Comparison of weld joint geometries produced with: (a) arc welding; (b) autogenous laser welding; and (c) laser-arc hybrid welding, and stress concentration locations.
Applsci 07 01276 g001
Figure 2. Experimental setup for laser welding of T-joints. Beam is positioned at the joint plane (offset 0 mm).
Applsci 07 01276 g002
Figure 3. Macrographs of weld samples at different beam inclination angles: AH36, t = 8 mm, PL = 6 kW, vw = 1.25 m/min, beam offset from flange 0.5 mm, FPP = −2 mm.
Applsci 07 01276 g003
Figure 4. Macrographs of weld cross-sections when beam position from the flange was varied: material = AH36, t = 8 mm, vw = 1.25 m/min, FPP = −2 mm, α = 15°.
Applsci 07 01276 g004
Figure 5. Weld profiles at various focal point positions: AH36, t = 8 mm, vw = 1.25 m/min, beam offset from flange 1.0 mm (up) and 1.5 mm (down), α = 15°.
Applsci 07 01276 g005
Figure 6. Proportions of the weld and melt area distribution differences at three inclination angles tested. AH36, t = 8 mm, PL = 6 kW, vw = 1.25 m/min, FPP = −2 mm.
Applsci 07 01276 g006
Figure 7. Penetration depth plotted as a function of specific point energy. ESP values of the three welds shown: (▲a) 396 J; (♦b) 384 J; and (∎c) 386 J.
Applsci 07 01276 g007
Table 1. Chemical composition of AH36 steel (wt %).
MaterialCSiMnPSCrMoNiCuAlV
AH360.1110.1490.7110.0350.1500.0510.010.0410.0310.0300.008
Table 2. Welding process parameters.
ParameterUnitParameter Range
Fiber diameter[µm]200; 300; 600
Laser power, PL[kW]6.0; 8.0; 10.0
Welding speed, vw[m/min]0.75; 1.0; 1.25; 1.5; 1.75
Focal point position, FPP[mm]−2.0; −4.0; −6.0
Beam angle from flange α[°]6; 10; 15
Beam offset from flange[mm]0.5; 1.0; 1.2; 1.5; 2.0
Table 3. Beam properties.
Delivery Fiber Diameter (μm)200300600
Beam profile Applsci 07 01276 i001 Applsci 07 01276 i002 Applsci 07 01276 i003
Nominal beam waist (mm)0.500.751.50
Measured beam waist (86% pts) (mm)0.7100.8821.460
BPP (mm∙mrad)9.07912.00023.800
Rayleigh length (mm)13.8616.1822.38
PL at workpiece (kW)6.06.06.0
Beam area at surface (mm2)0.3960.6111.674
Table 4. Effect of fiber diameter on the weld dimensions.
Fiber Diameter [µm]Penetration Depth [mm]Bead Width [mm]Fusion Zone [mm2]HAZ Area [mm2]Depth to Width RatioMax Hardness HV5 [FZ 1/HAZ]
2008.72.313.26.54.0386/373
3007.82.412.66.03.3392/359
6005.62.712.05.52.0393/365
1 FZ = fusion zone.
Table 5. Acceptable limits for beam positioning for producing full penetration.
Parameter200 µm Process Fiber300 µm Process Fiber600 µm Process Fiber
α6°; 10°
Beam offset1 mm1 mm1−1.5 mm
FPP−4 mm−4 mm−2–−6 mm

