Experimental Investigation on the Influence of a Double-Walled Confined Width on the Velocity Field of a Submerged Waterjet


1
School of Power and Mechanical Engineering, Wuhan University, Wuhan 430072, China
2
Hubei Key Laboratory of Waterjet Theory and New Technology, Wuhan University, Wuhan 430072, China
3
College of Power Engineering, Chongqing University, Chongqing 400044, China
*
Author to whom correspondence should be addressed.
Appl. Sci. 2017, 7(12), 1281; https://doi.org/10.3390/app7121281
Submission received: 7 November 2017
/
Revised: 30 November 2017
/
Accepted: 6 December 2017
/
Published: 8 December 2017
(This article belongs to the Section Mechanical Engineering)
Abstract
:The current research on confined submerged waterjets mainly focuses on the flow field of the impinging jet and wall jet. The double-sided wall vertically confined waterjet, which is widely used in many fields such as mining, cleaning and surface strengthening, has rarely been studied so far. In order to explore the influence of a double-sided wall confined width on the velocity field of submerged waterjet, an experiment was conducted with the application of 2D particle image velocimetry (PIV) technology. The distribution of mean velocity and turbulent velocity in both horizontal and vertical planes was used to characterize the flow field under various confined widths. The results show that the vertical confinement has an obvious effect on the decay rate of the mean centerline velocity. When the confined width changes from 15 to 5, the velocity is reduced by 20%. In addition, with the decrease of the confined width, the jet has a tendency to spread horizontally. The vertically confined region induces a space hysteresis effect which changes the location of the transition region moving downstream. There are local negative pressure zones separating the fluid and the wall. This study of a double-walled confined jet provides some valuable information with respect to its mechanism and industrial application.
1. Introduction
Waterjet technology has achieved obvious progress in recent decades due to its incomparable destructive power, cold working and pollution-free processing characteristics [1,2]. These unique advantages of waterjet technology led to the wide applications in machining, cleaning, mining, and food processing fields [3,4,5,6]. For instance, LI, et al. [7,8] most recently studied the influence of the nozzle inner surface roughness and the nozzle inlet area discontinuity on the performance of free waterjets. In addition, Guha et al. [9] have experimentally, numerically and theoretically investigated the waterjet cleaning process. Hu, et al. [10] applied waterjet technology to rubber cutting and concluded that the pump pressure had a more significant effect on cutting depth compared with nozzle transverse and stand-off distance.
According to the different exit boundary conditions, waterjets are divided into free and confined jets [11,12,13]. For confined jets, the external flow field is confined by solid walls. Thus, the solid walls can restrict the flow development of the jet and change the working methods. More specifically, based on the location of the solid wall, the confined jets can be divided into impinging jets, wall jets and double-walled jets [14,15]. The impinging jet is a free waterjet that impacts solid walls or liquid surfaces directly [16] as a classical wall-bounded shear flow; the wall jet is obtained by injecting fluid from a long slot parallel to a wall [17]. A double-walled confined jet refers to a jet form in which two solid walls are placed in the nozzle exit space so that the jet beam cannot sufficiently diffuse [18]. In order to understand the working mechanism and flow field of the confined jet, researchers have done a number of studies.
The impinging jet is gaining more attention by researchers recently because of the common characteristics of the free waterjet and wall jet [19]. In a typical flow, the jet impinges directly onto a target surface and the flow field is basically categorized by three broad regions: the free jet region, the stagnation or impingement region and the wall jet region according to the research of Tani, et al. [20]. Kyosung, et al. [21] studied the influence of the nozzle diameter on the hydraulic jump of liquid jet impingement. They found that the dimensionless hydraulic jump radius depends on jet Reynolds and Froude numbers rather than on just one of them. Moreover, Icardi, et al. [22] provided a method of observing micro flow field in a three-dimensional confined impinging jet reactor by means of micro particle image velocimetry (PIV) and direct numerical simulations (DNS). In addition, Rothenfluh, et al. [23] conducted experimental research on impinging, turbulent, near-critical waterjets which indicated that the surface temperature had a significant effect on heat transfer coefficients.
Experiments and theory analysis paved the way for the study of wall jets. In more specific terms, the vortex formation and entrainmental characteristics of a round transverse jet in shallow water were experimentally investigated by Fang, et al. [24] based on a combination of laser-induced fluorescence (LIF) flow visualization and PIV measurement. Also, Adane, et al. [25] analyzed the structure of three-dimensional laminar wall jet flows of various Reynold numbers by means of numerical simulation and the application of three-dimensional PIV. The distributions of the velocities, jet spread rates, and vorticity were used to provide insight into the characteristics of three-dimensional laminar wall jet flows. Craft, et al. [26] simulated a 3D turbulent wall jet flow field by means of a turbulent closure model and found the reason for the high lateral diffusion rate during the experiment. Shinneed, et al. [27,28,29] investigated the characteristics of round jet flow when the confined wall and the liquid surface were at different levels. In addition, Matteo, et al. [30,31] investigated the properties of materials using scanning electron microscope (SEM) and X-ray diffraction (XRD), which are instructive in the study of internal nozzle wear by severe waterjets. Their efforts laid the foundation for the wide application of impinging jets and wall jets in industrial production.
With respect to double-walled confined jets, most investigations focus on air jets. For example, Wang et al. [32] investigated the heat transfer and flow characteristics of a rectangular channel with a small scale slit-vent circular cylinder by Large Eddy Simulation (LES). In addition, Vinze, et al. [33] studied the influence of impinging under expanded jets on local heat transfer with a nozzle pressure ratio ranging from 2.4 to 5.1. The flow structure distributions captured with the shadowgraph technique were compared with the local Nusselt number. Proposed correlations for the local heat transfer showed a good agreement with the experimental results for larger nozzle to plate distances.
However, as a typical kind of confined jet, a double-walled waterjet is rarely studied in the literature. This type of waterjet is widely used in coal seam cutting, deep cutting and other field applications [34,35]. Compared with free waterjets, double-walled confined jets produce impact and shear effects [36,37] and have a tensile effect which is closely related to the flow field. Therefore, a study of the double-walled jet flow can both clarify its internal velocity distribution and provide a theoretical guidance for its engineering applications.
In the present work, the mean velocity and turbulent intensity of double-walled confined waterjet are measured by means of particle image velocimetry (PIV). Considering the extremely complex velocity features of the flow field, PIV represents an excellent tool, given its capacity to fully reconstruct volumetric data of the target flow field. In order to measure the velocity of double-walled confined waterjets, experimental research is carried out. The distribution of mean velocity and turbulent intensity on both horizontal and vertical planes is used to characterize the flow field. Moreover, the present paper has analyzed the influence of a confined width on the submerged waterjet velocity distribution.
2. Experimental Setup and Procedures
2.1. Facilities and Setup
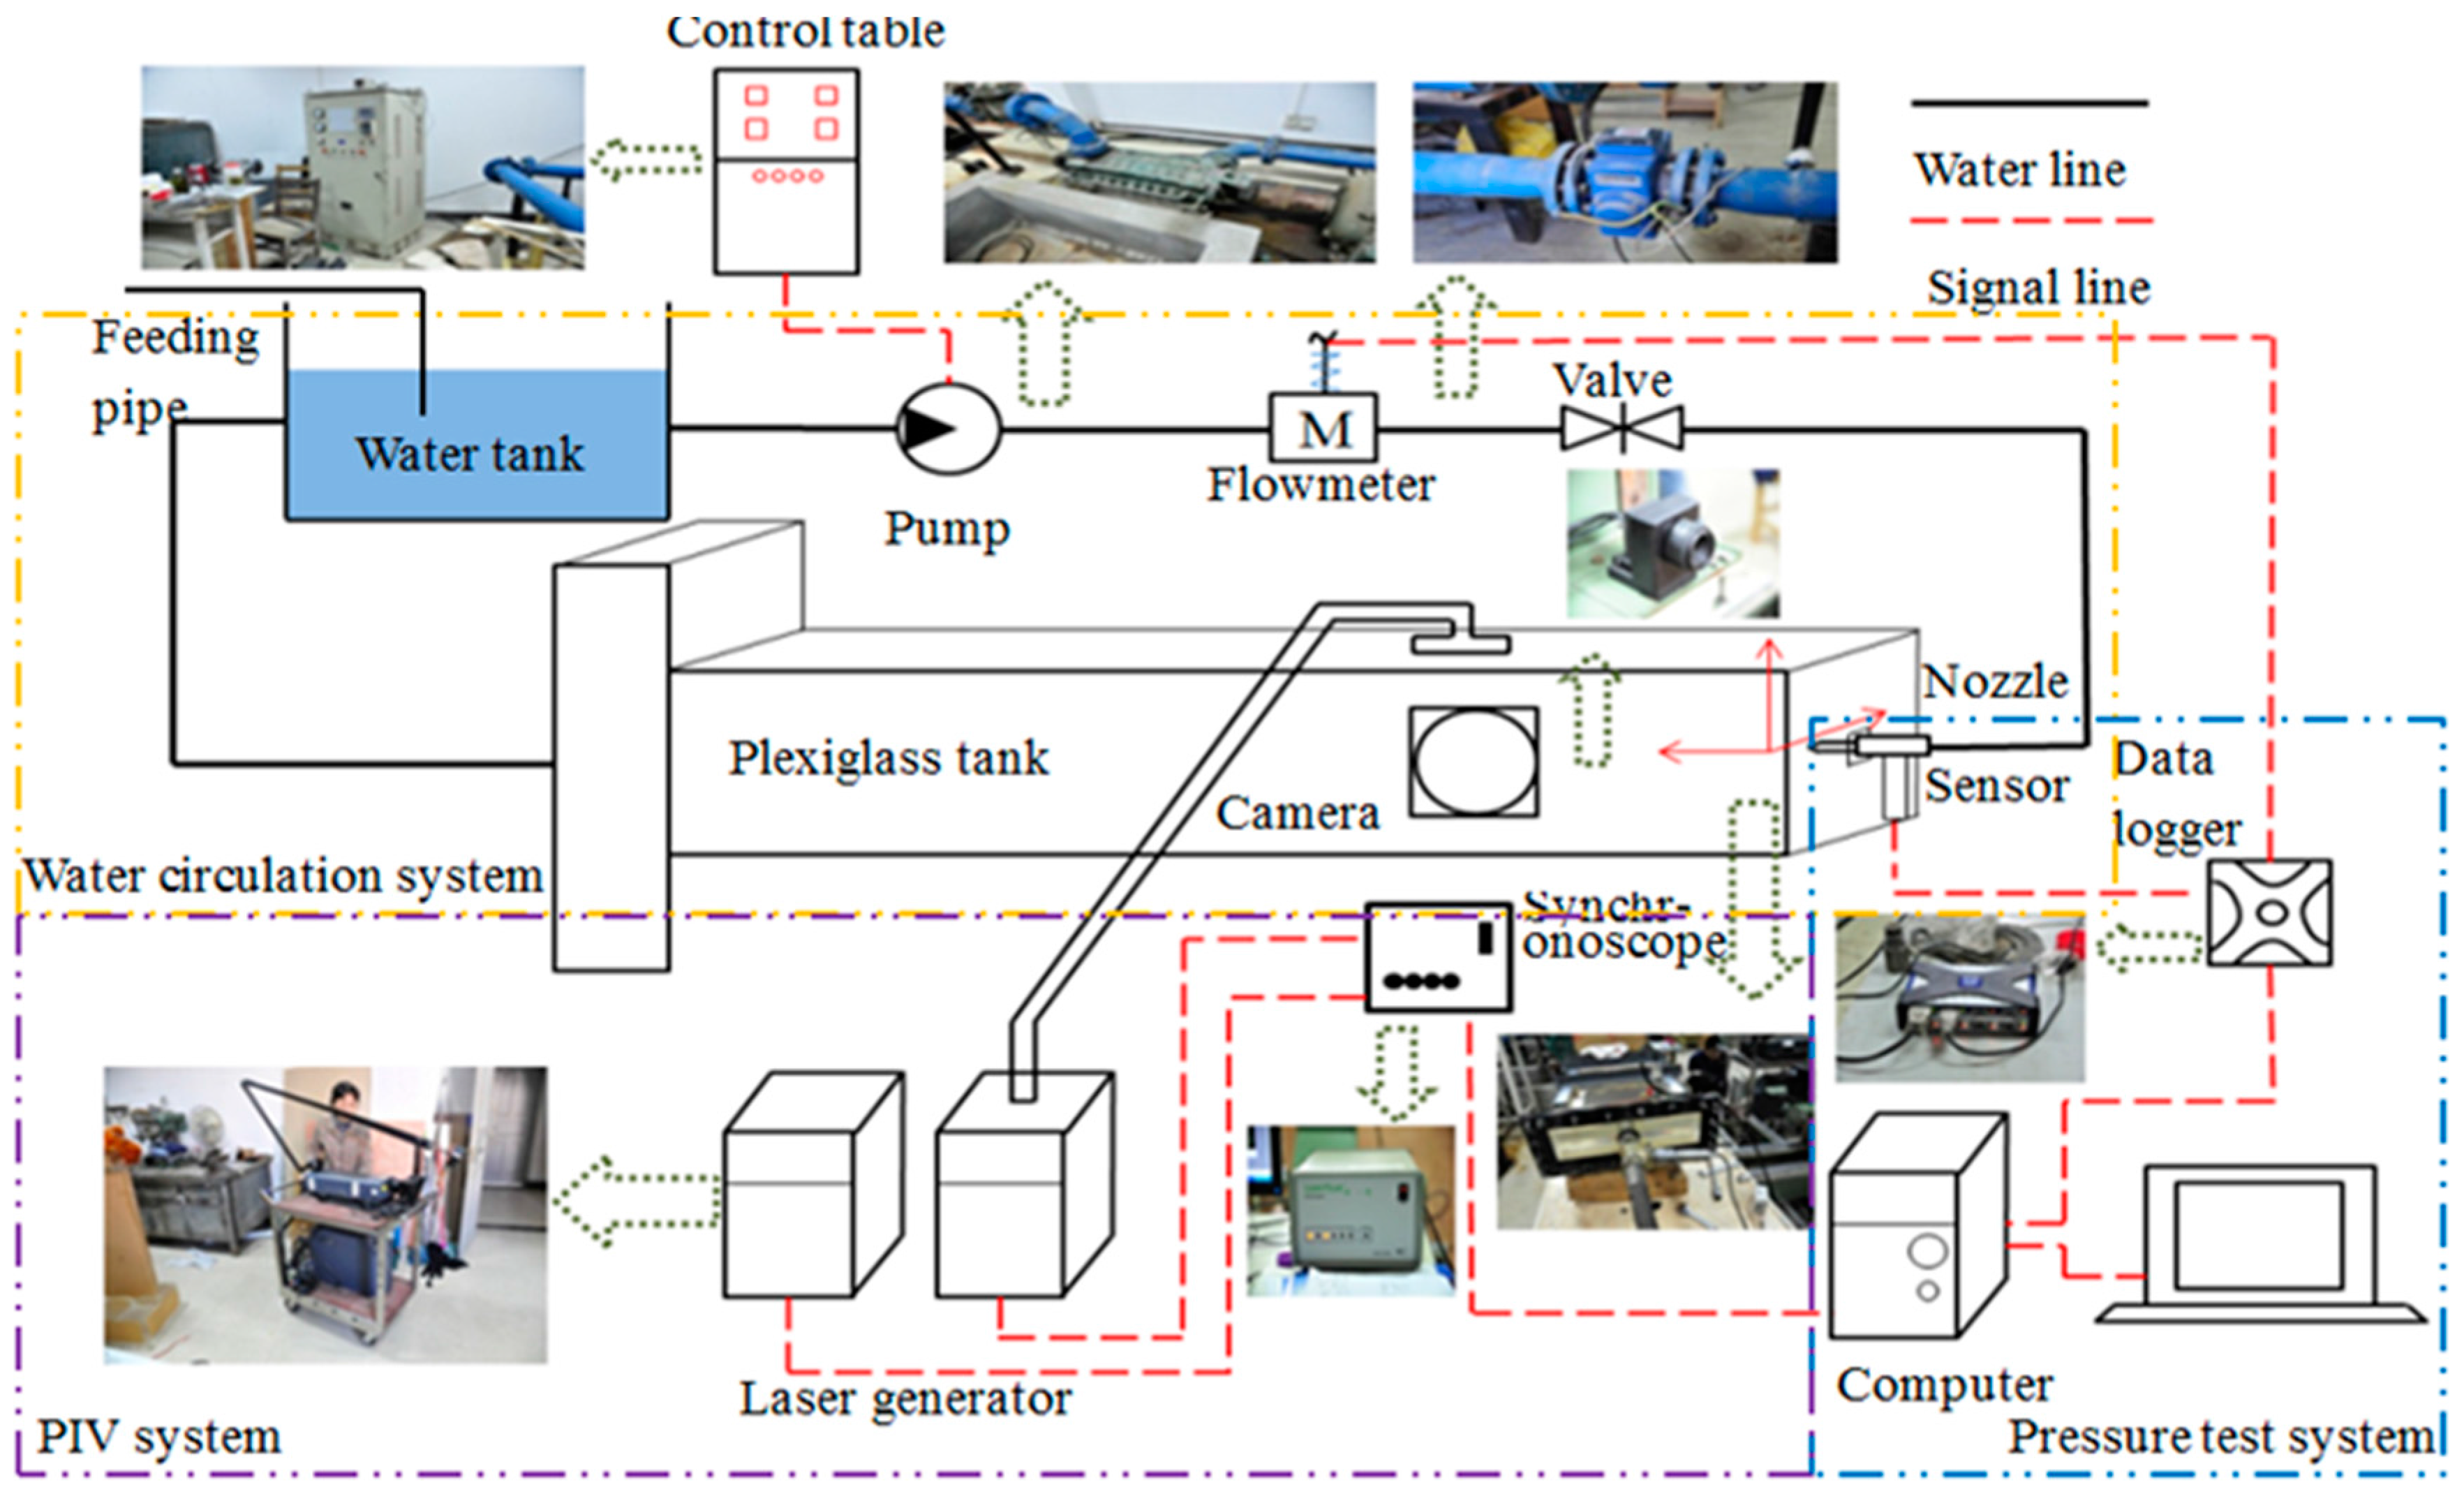
In order to measure the velocity of the flow field under the condition of double-walled confinement, an experiment was conducted and the results could clearly show the development and transformation of liquid flow. As is shown in Figure 1, a diagram was used to illustrate the experimental setups, which included three parts: water circulation system, PIV system and pressure test system.
In the water circulation system, the pressurized tap water was supplied from a centrifugal pump that has a pump head of 250 m and pump capacity of 46 m3/h. In the experiment, the operating pressure of the centrifugal pump could be continuously regulated through the control table by changing the working frequency of the motor powering the pump. The flow rate of the pump could be directly read out from the pipeline flowmeter. Considering the limitation of the pump head, the strength of the plexiglass tank and the accuracy of the PIV, the operating pressure was 0.34 MPa in this experiment.
The water tank had a volume of 3 m3. Taking a small amount of water consumption and pipe or connections leakage in the course of the experiment into consideration, the volume of the water tank was sufficient to meet the qualification of the operation. In addition, another feeding pipe was used.
As illustrated in Figure 1, the facilities of the measuring pressure and flow rate were applied in the water line. To be more specific, the pressure was monitored by a dynamic pressure transducer DMP 333 (BD Sensors, Thierstein, Germany) that had been calibrated by the manufacturer with an accuracy of ±0.5% FS in advance. Further, the flow rate was measured by an electromagnetic flowmeter Optiflux 4100 C (Krohne, Krohne, Germany) that had an accuracy of ±0.3%, velocity error of ±1 mm/s and repeatability error less than 0.1%.
The PIV system, Ultra-II (TSI, Knoxville, USA), was employed to measure the velocity field of the double-walled confined waterjet. The basic premise of PIV is to measure the velocity of makers or seed particles in the flow within a plane. PIV provides an Eulerian description of the velocity, since the velocity vector is obtained by calculating correlations for interrogation areas. Specifically, the velocity is determined by using the basic definition.
where V(X, t) is the particle velocity vector at position X and time t, and ∆S is the displacement vector of the seeding particle during the elapsed time ∆t.
In order to create a plane through the flow field, a pulsed laser generation device, YAG (TSI, Knoxville, TN, USA), was applied and the detailed information is shown in Table 1. The speed information of the measurement area is mainly from pictures taken by the charge-coupled device camera and the detailed information is shown in Table 2. The velocity range of the PIV was about 1–100 m/s. In this experiment, the region of 90 × 130 mm was large enough for our measurement. To make the results more reliable, each testing section comprised 160 series of instantaneous data to analyze the characteristics of mean velocity and turbulence intensity.
2.2. Nozzles and Flow Conditions
The experiment was aimed at analyzing the influence of a double-walled confined width on the waterjet flow field through measuring the mean velocity and turbulent intensity.
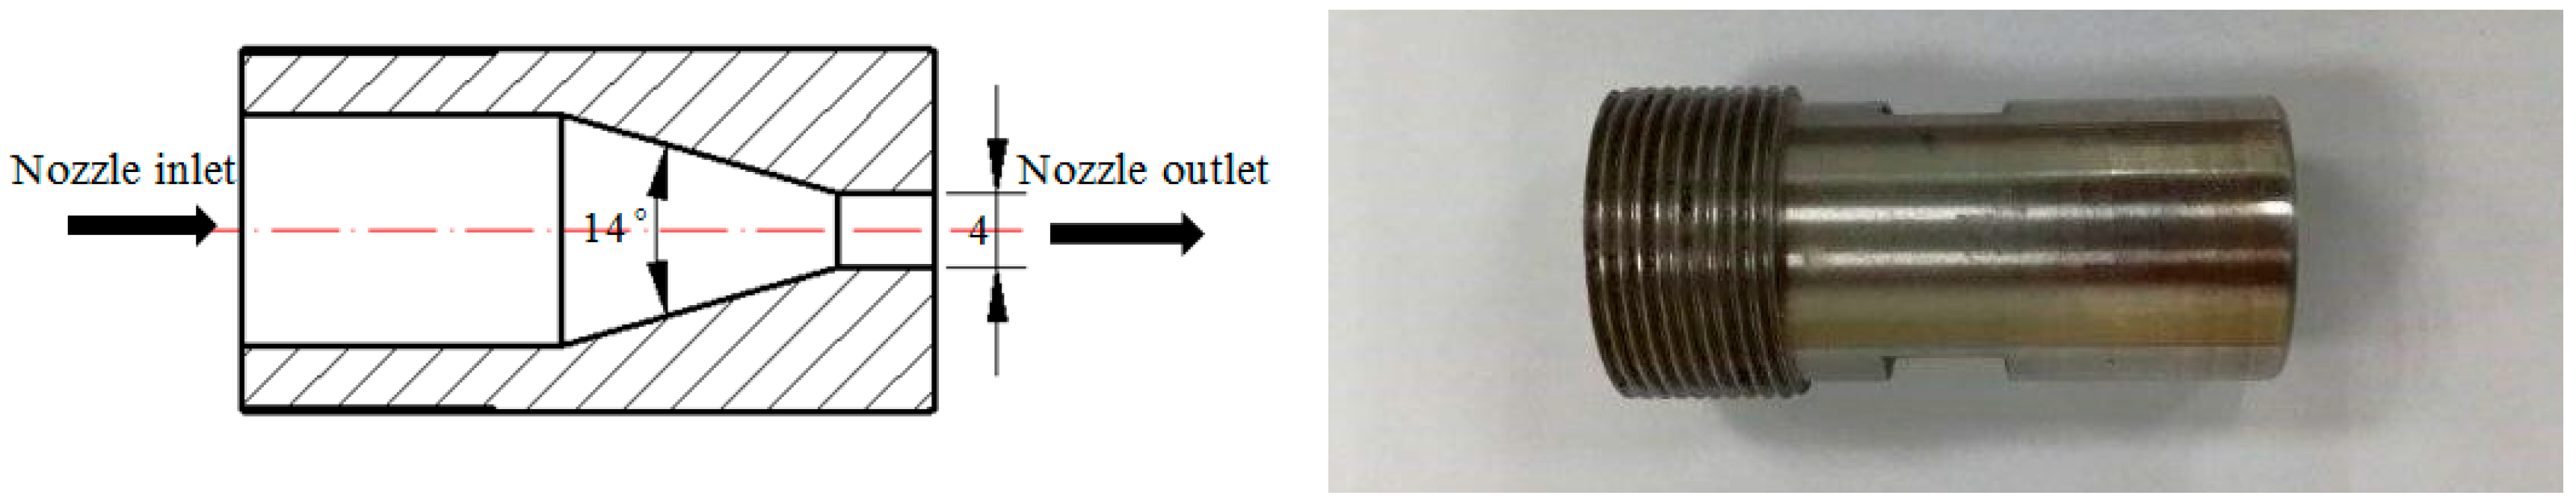
As the velocity and turbulent intensity of waterjet had a close relation with the structure of nozzle, the nozzle was designed based on previous literature [38]. The nozzle that had been used in the experiment is illustrated in the Figure 2. The contraction angle is α = 14° which could reduce the pipeline pressure loss as much as possible. The exit diameter is 4 mm. The jet velocity is 26 m/s, corresponding the operating pressure of 0.34 MPa.
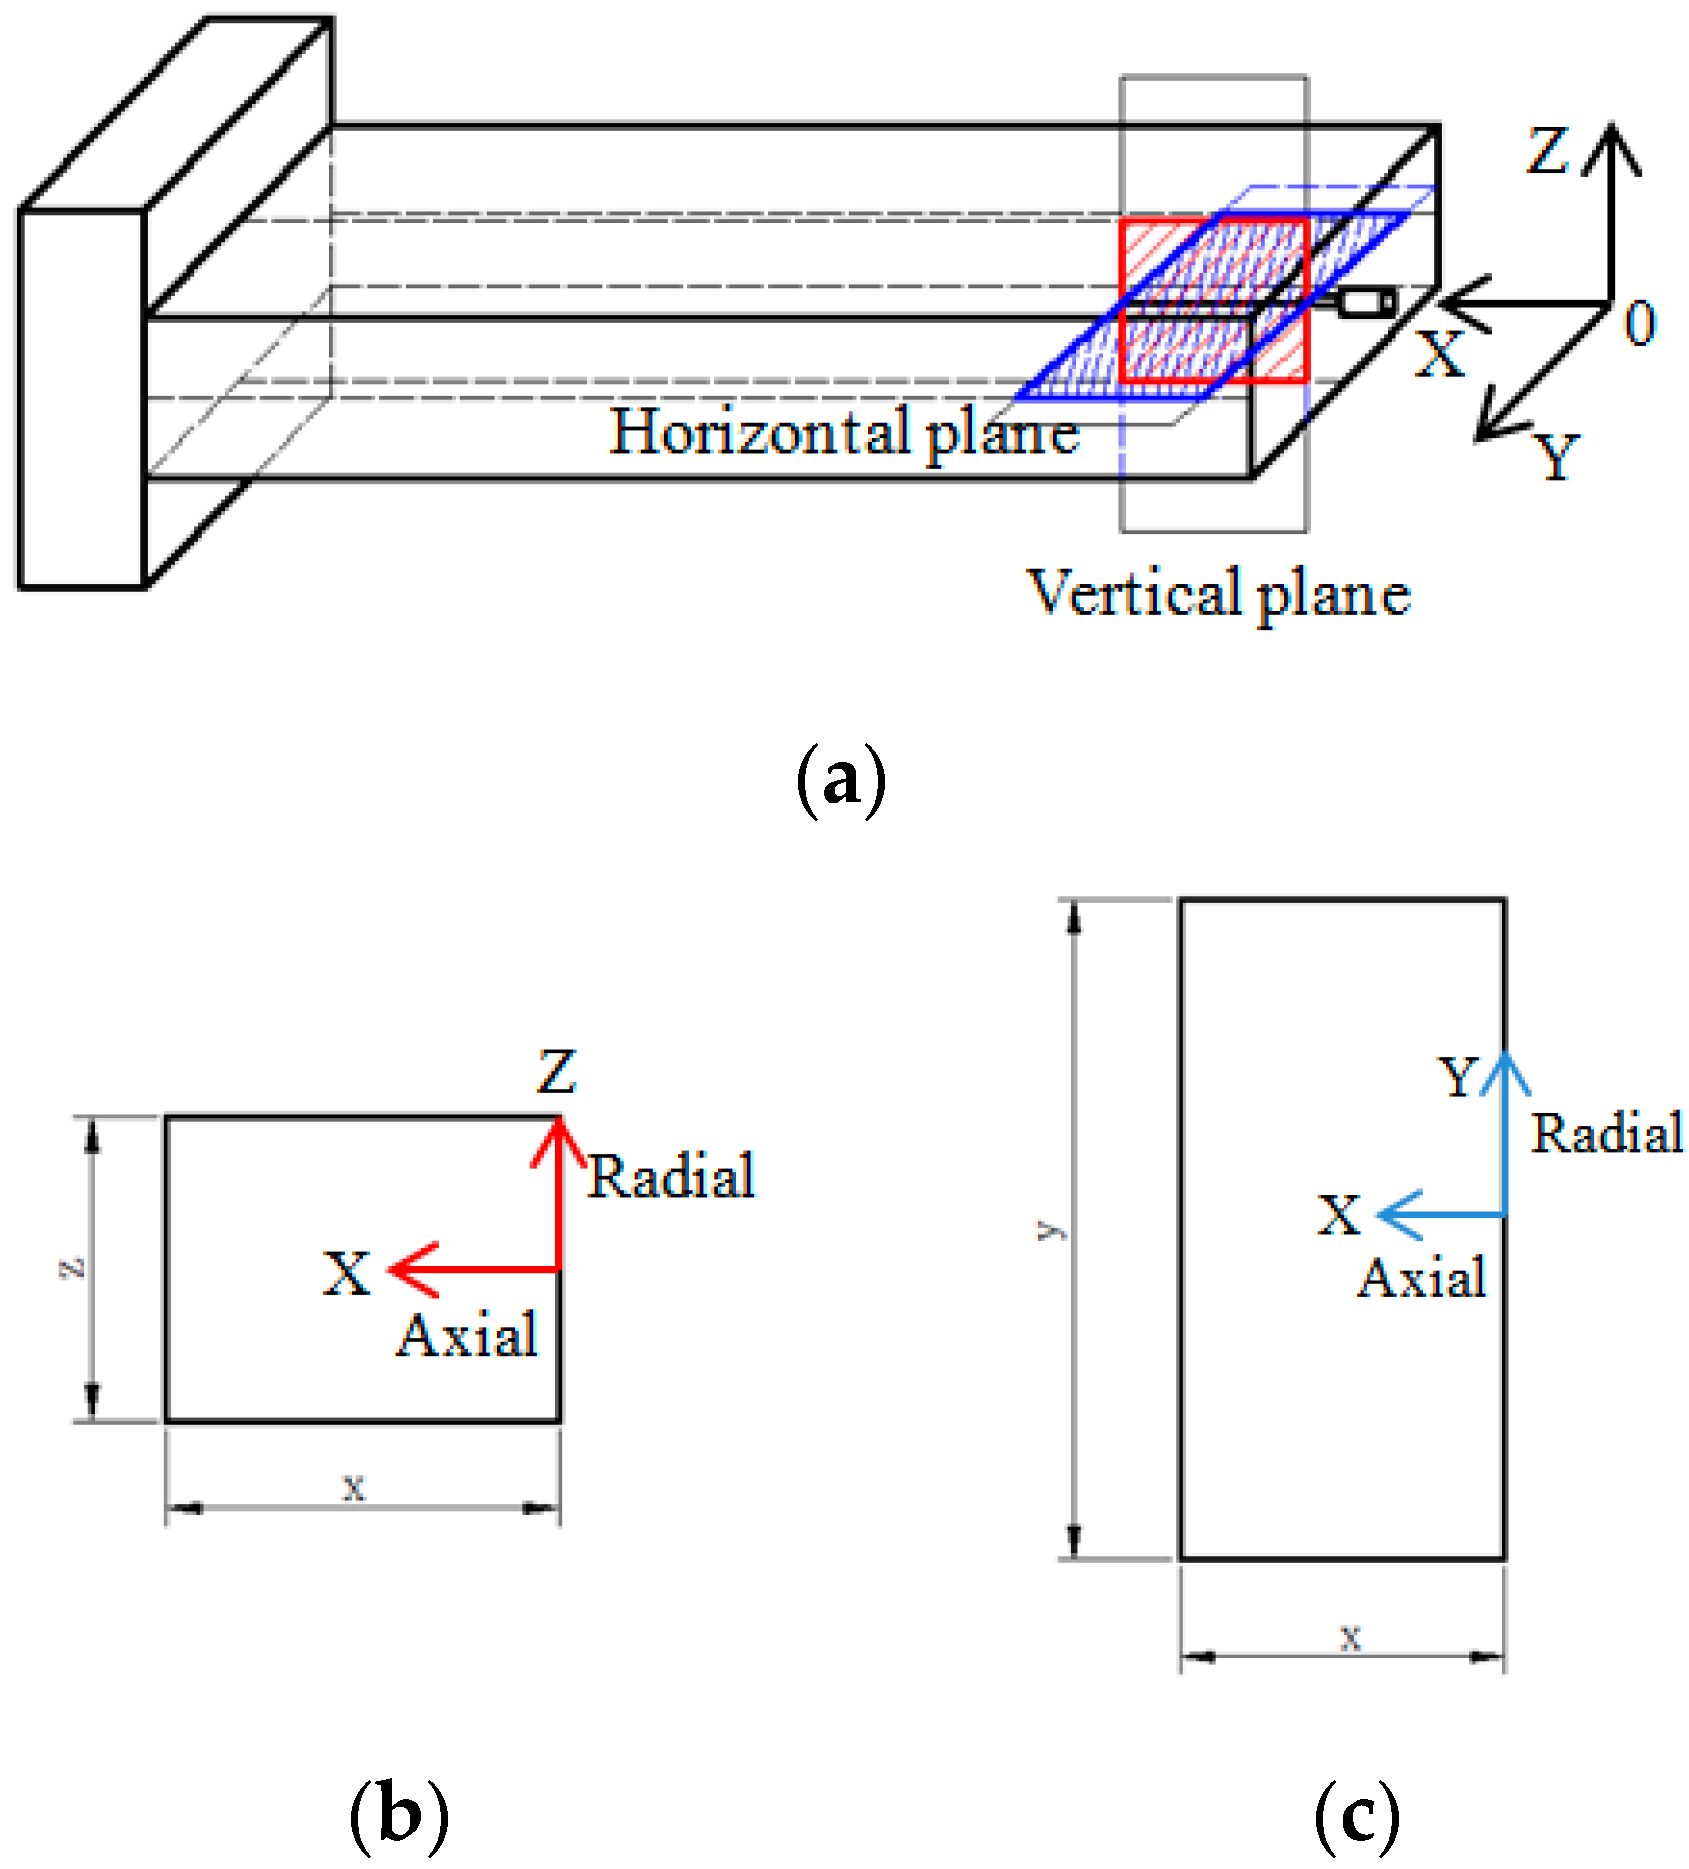
Figure 3 shows the generation method of the double-walled confined waterjet in a plexiglass tank as well as the measuring region. The pipe and nozzle were connected by a metallic flange through the baffle at the water tank inlet, and it was sealed by a rubber blanket to prevent water leakage. In order to minimize the influence of the right wall and left wall, the water tank was designed as a 1 × 1 m horizontal square. The measuring regions of the flow field are marked in the Figure 3a. Four plexiglass water tanks were used in the experiment with the distance between the upside wall and the downside wall (called the confined width) being: 20, 40, 52 and 60 mm. The dimensionless width was defined as the ratio of the actual width to the diameter of the nozzle exit. Therefore, the dimensionless widths were 5, 10, 13 and 15, respectively, as shown in Table 3. Figure 3a,b show the profile section of the horizontal and vertical planes in the three-dimensional coordinate.
At the beginning of the experiment, the plexiglass tank was filled with water to eliminate air bubbles that attached to the upside wall since the air bubbles dramatically affect the accuracy of the PIV. Then, the mean velocity and the turbulent intensity of the horizontal plane X-Y and the vertical plane X-Z was measured in the direction of axis X and radius Y or Z. Each test of each section of 160 sets of instantaneous data was acquired and averaged in order to minimize the adverse effect of single measurements and poor data points.
2.3. Analysis of the Experimental Uncertainty
Error quantification is generally a function of the experimental conditions and the particle displacement detection algorithms. Three forms of errors are present in the PIV data. They are outliers, systematic errors and random errors. The measurement uncertainty is an assessment of the degree to which a measurement is representative of the true value and is usually expressed at the 95% confidence level. A complete uncertainty analysis of the PIV technique would involve identifying and quantifying both the system and random uncertainties. The uncertainty Etotal may be written as
where B is the bias limit, t95 is the value of the t distribution at the 95% level of confidence, and σ is the standard deviation.
According to the research results from Bugg, et al. [39], a more reliable method that compared synthetic images of the real images was used in this paper. The size of the simulated images was 1600 × 1200 pixels, the same as the real images. Each pixel was represented by 8 bits corresponding to 256 levels of grey. Also, the outliers were removed during the experiment. By calculating using the method mentioned above, the max velocity of the nozzle outlet was 26 m/s, the quantity of tracer particles was less than 70,000, and the displacement of particles was no more than 10 pixels. Therefore, the error of the corresponding instantaneous velocity was 3.5%, and the average error was less than 2.1%.
3. Results and Discussion
As the mean velocity and turbulent intensity were used to characterize the flow field, the velocity distribution was plotted against its location. In order to make units the same for simplifying discussion, all the length units and speed units were transformed into dimensionless units. To be more specific, the horizontal axis unit is defined as the ratio of the location X or Z to the diameter of nozzle D or the width of the double-walled H. The vertical axis unit is defined as the ratio of the local speed U or V to the speed of nozzle outlet Uc or Vc.
3.1. The Flow Field Characteristics of the Double-Walled Confined Waterjet
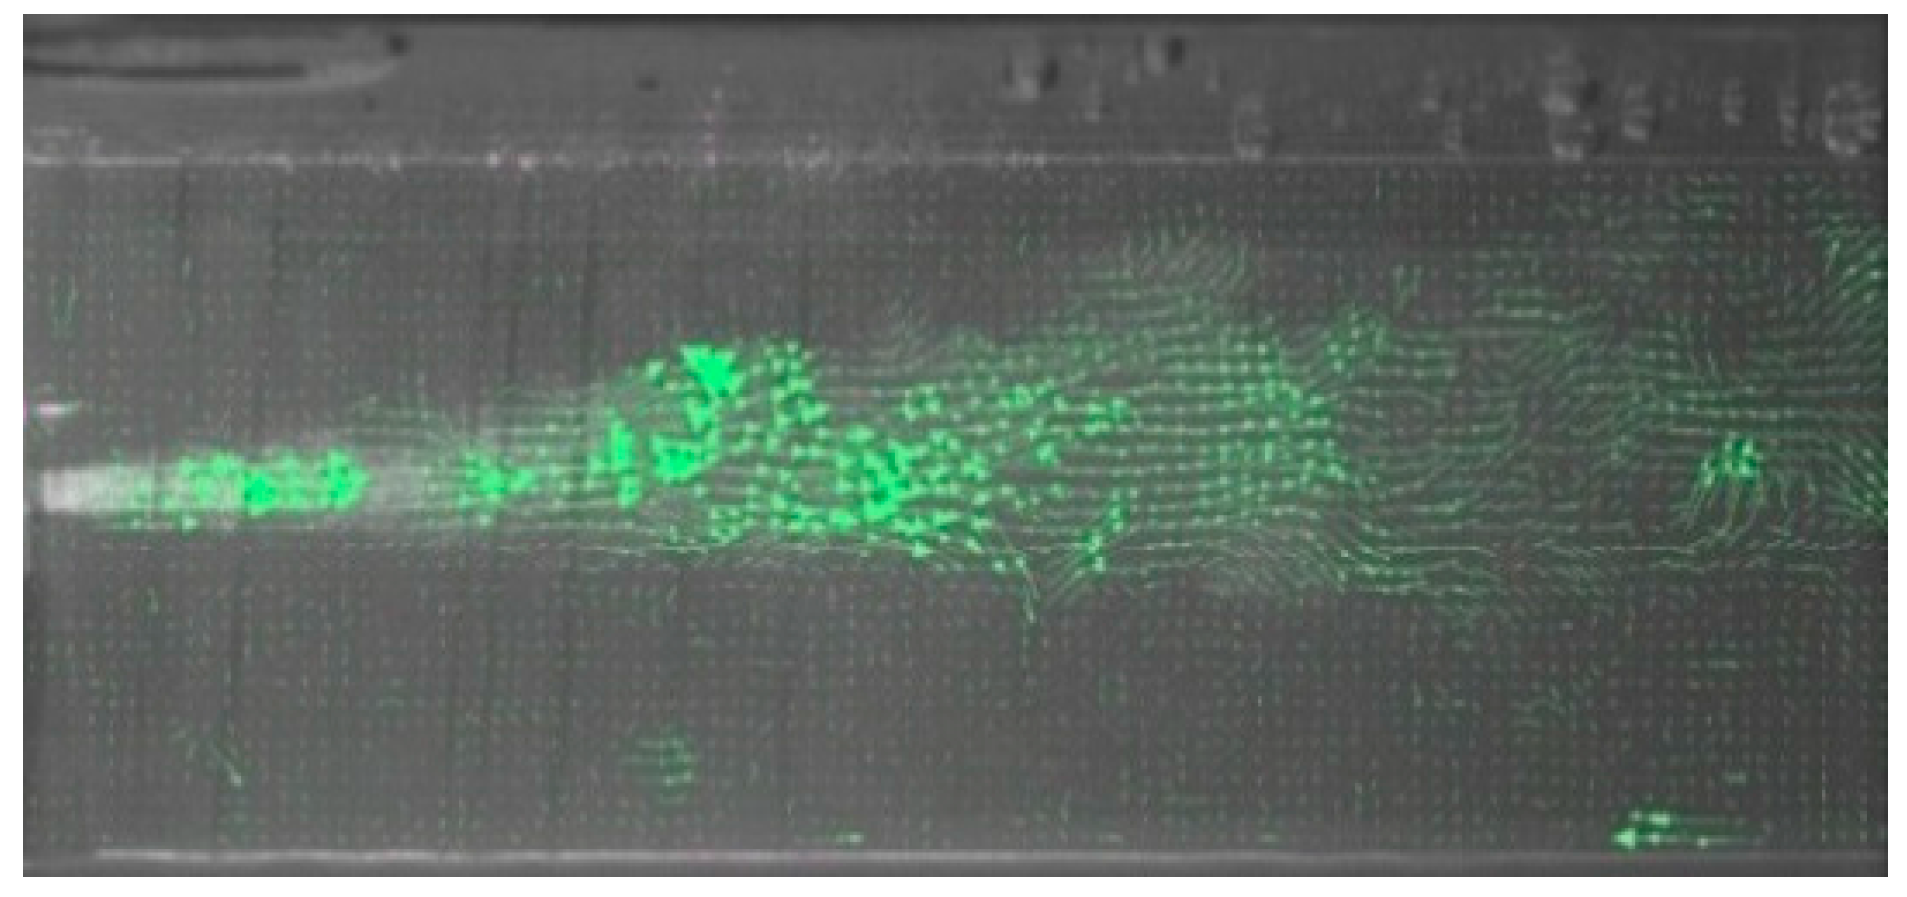
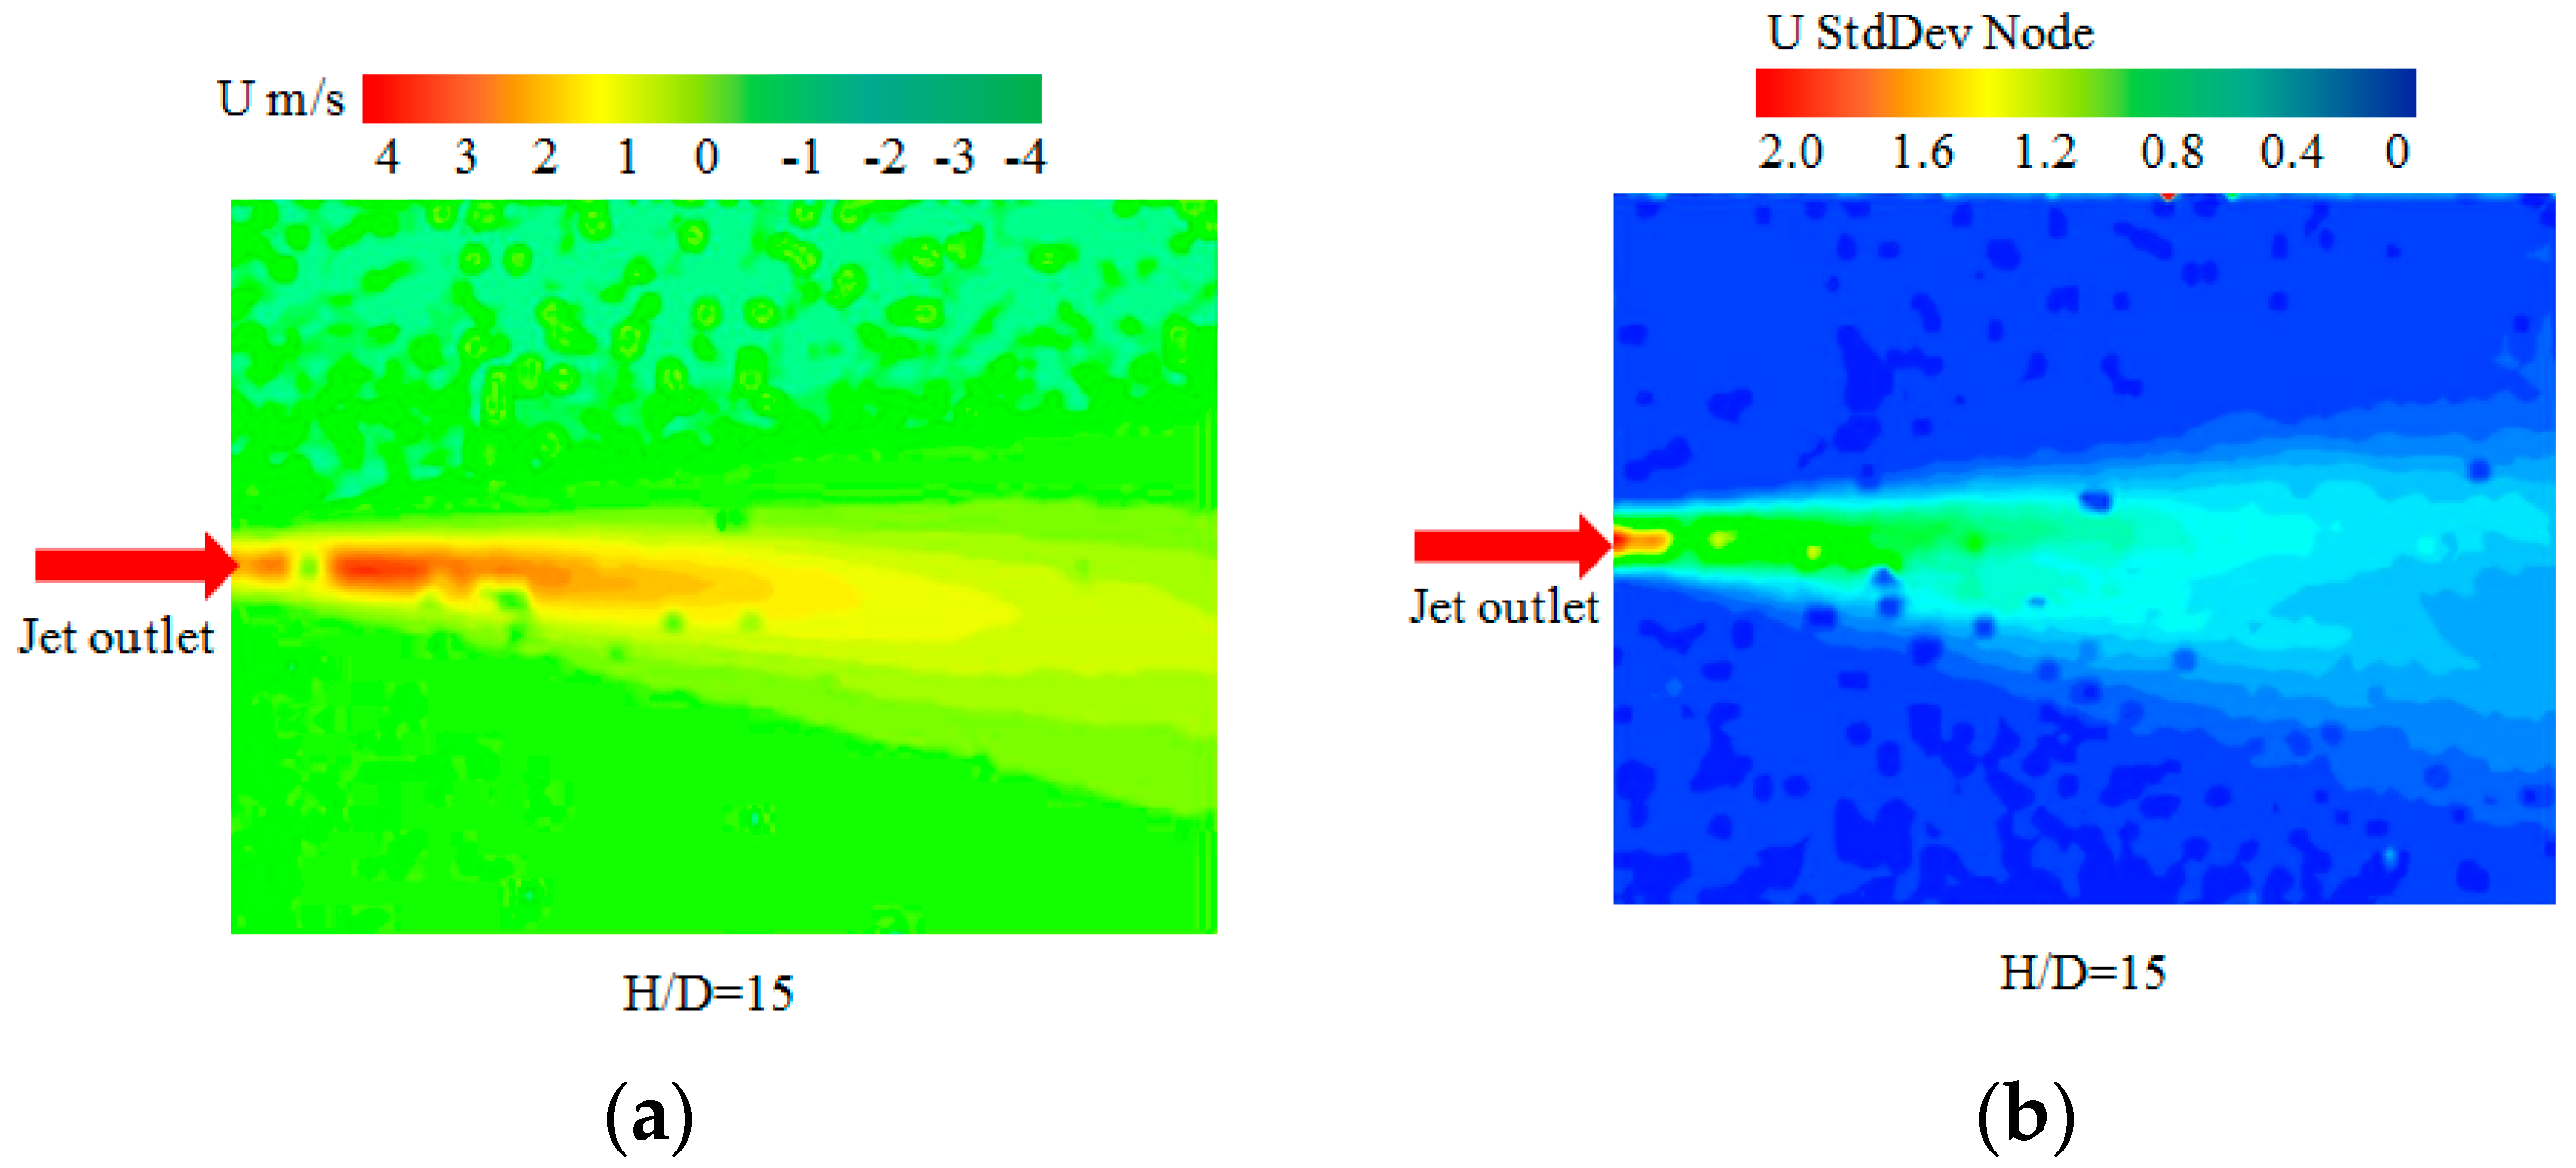
Among enormous quantities of images that the PIV collects, typical vector diagram and cloud pictures were selected to illustrate the velocity characteristics. Figure 4 is the velocity vector diagram in the vertical plane that was processed from an actual testing photograph by post-processing software, Insight 3G. Figure 5 shows the cloud images of average velocity and turbulent intensity in the vertical plane.
As shown in the Figure 4, a couple of facts can be inferred from the vector diagram. First of all, the maximum concentration of tracer particle appears at the exit of the nozzle. The concentration of the tracer particles is decreased as the jet moves downwards. Then, from Figure 5, the distribution of the velocity is concentrated around the exit of the nozzle, and the maximum velocity of the waterjet flow appears at the same place. In the meantime, the distribution of mean velocity presents decentralization and homogenization characteristics in the downstream area. Moreover, the flow generates numbers of vortexes in the boundary of moving fluids and static fluids due to its high velocity gradient and the developing and transforming of the vortex with the afflux of the fluid. Last but not least, we identify characteristics of unsymmetrical distribution of the velocity from Figure 5a,b, which will be explained in the following section.
A brief summary of the flow field characteristic of the double-walled confined waterjet could be concluded according to the images above. When fluid entered into the double-walled confined space, the initial phase of the waterjet was not impacted by the walls. Then, the vertical diffusion of the waterjet was limited due to the confinement with the downstream development of fluid, as Figure 5a implies. As a result, the angle of diffusion was minified with respect to the free jet. The diffusion caused the generation of a velocity gradient, which was the precondition of the vortex. The velocity of downstream fluid pulsed because of the generation of a vortex. As is shown in Figure 5b, the maximum turbulent intensity of the fluid appears on the axial side of the jet, and the turbulent intensity decreases with the position moving on both sides. Therefore, under the condition of double-walled confinement, the flow field presents numerous features: flattening, instability and fluctuation.
3.2. The Axial Velocity of the Double-Walled Confined Waterjet
Figure 6 shows the variation of the mean centerline velocity in the axial direction for the free and double-wall confined waterjet cases. In this figure, the vertical axis represents the mean centerline velocity Uc, which appears in the denominator, normalized by the jet exit velocity Ue. The centerline velocity Uc was obtained by curve fitting the mean axial velocity profiles measured on the horizontal plane using the following equation
where U is the mean axial velocity, Uc is the mean centerline velocity, y is the vertical coordinate, yc is the vertical position of the centerline, and r1/2 is the jet half-width measured at U = Uc/2, yc and r1/2 were calculated using the non-linear, least-squares Levengerg-Marquardt algorithm.
It is clear that the centerline velocity measurements for all cases matched very well onto a straight line in the beginning. Then, the centerline velocity for the H/D = 5 started decaying at a lower rate at x/D = 15, compared to the free jet case. This is clearly affected by the vertical confinement. This may be explained by the conservation of mass which demands an increase in the jet velocity because the cross-sectional area of the jet becomes constrained by the boundaries compared to the free jet case. However, the H/D = 10, 13, 15 cases seem to follow the free jet and are expected to decay at a slower rate at farther downstream locations. It can be concluded that the degree of confinement affects the location at which the centerline velocity deviates from the free jet case.
When x/D = 20, there is a significant difference between the axial velocity in various confined widths, so we can use x/D = 20 as the reference position for the velocity analysis. In this position, there is a slight difference between the various speeds. Thus, it can reduce the speed measurement error and contribute to the analysis of the results in different directions.
3.3. The Mean Velocity of the Double-Walled Confined Waterjet
Profiles of the mean velocity at selected downstream locations x/D = 20 on the vertical (X-Y) and horizontal (X-Z) planes for four double-walled confined cases are presented in this section.
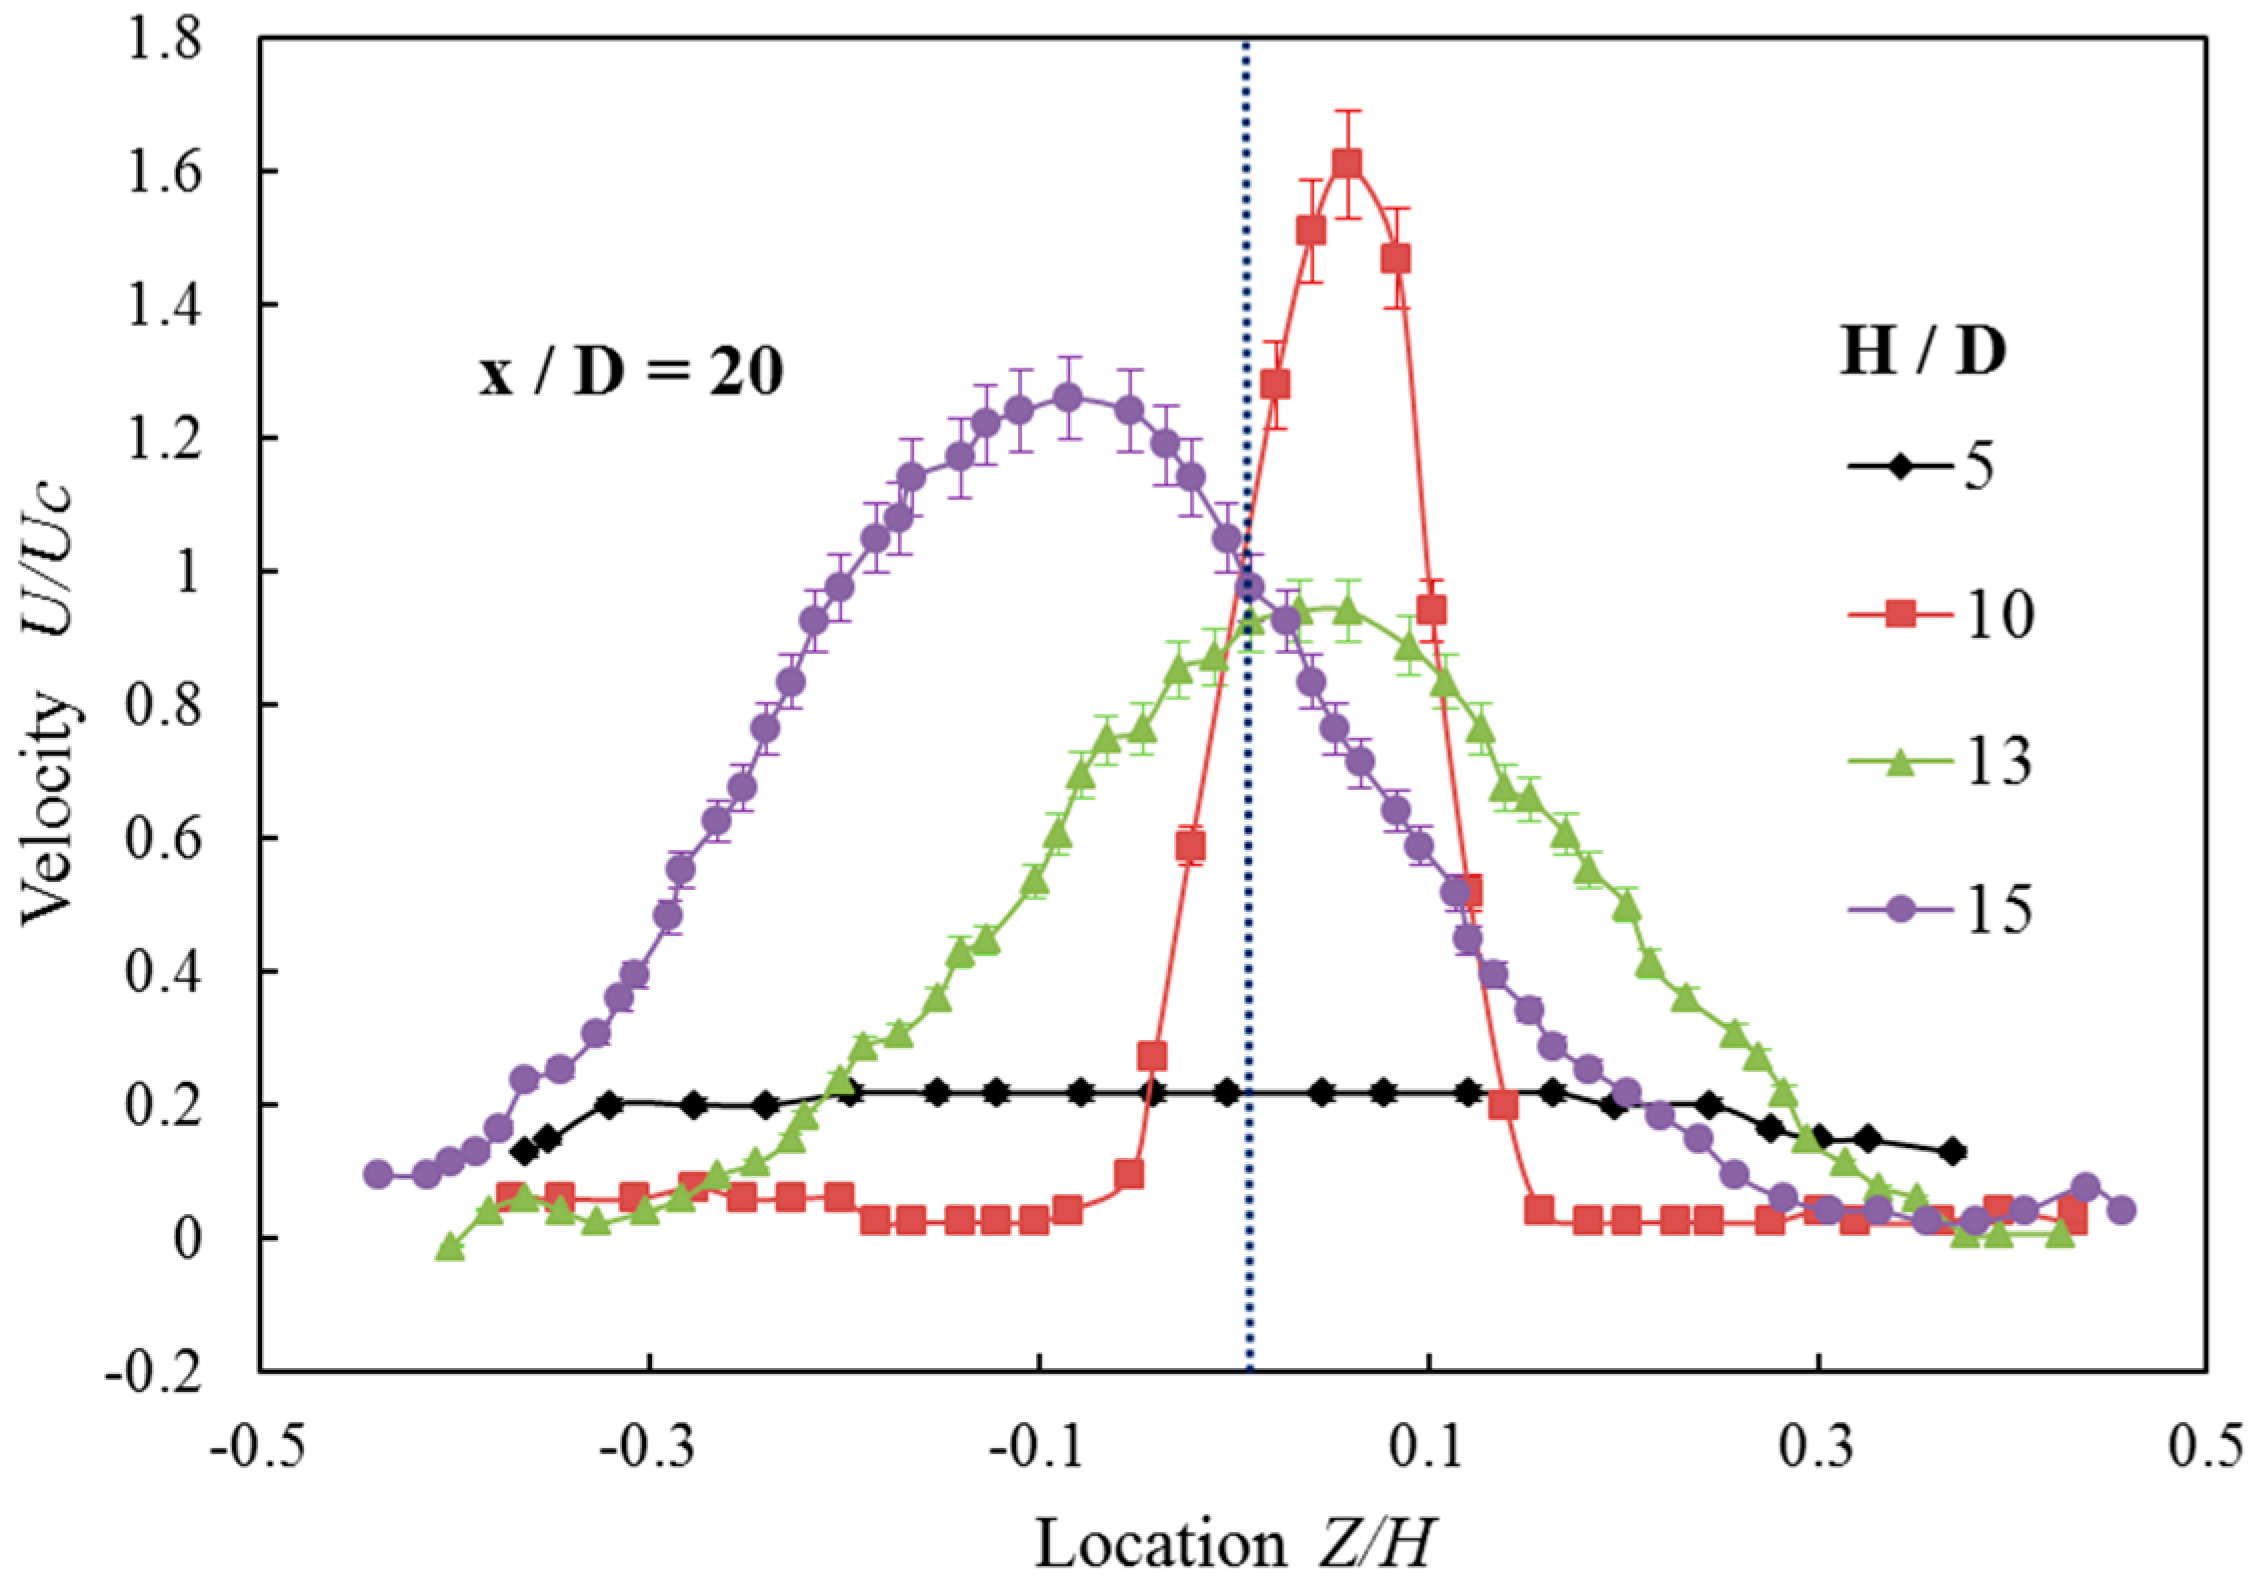
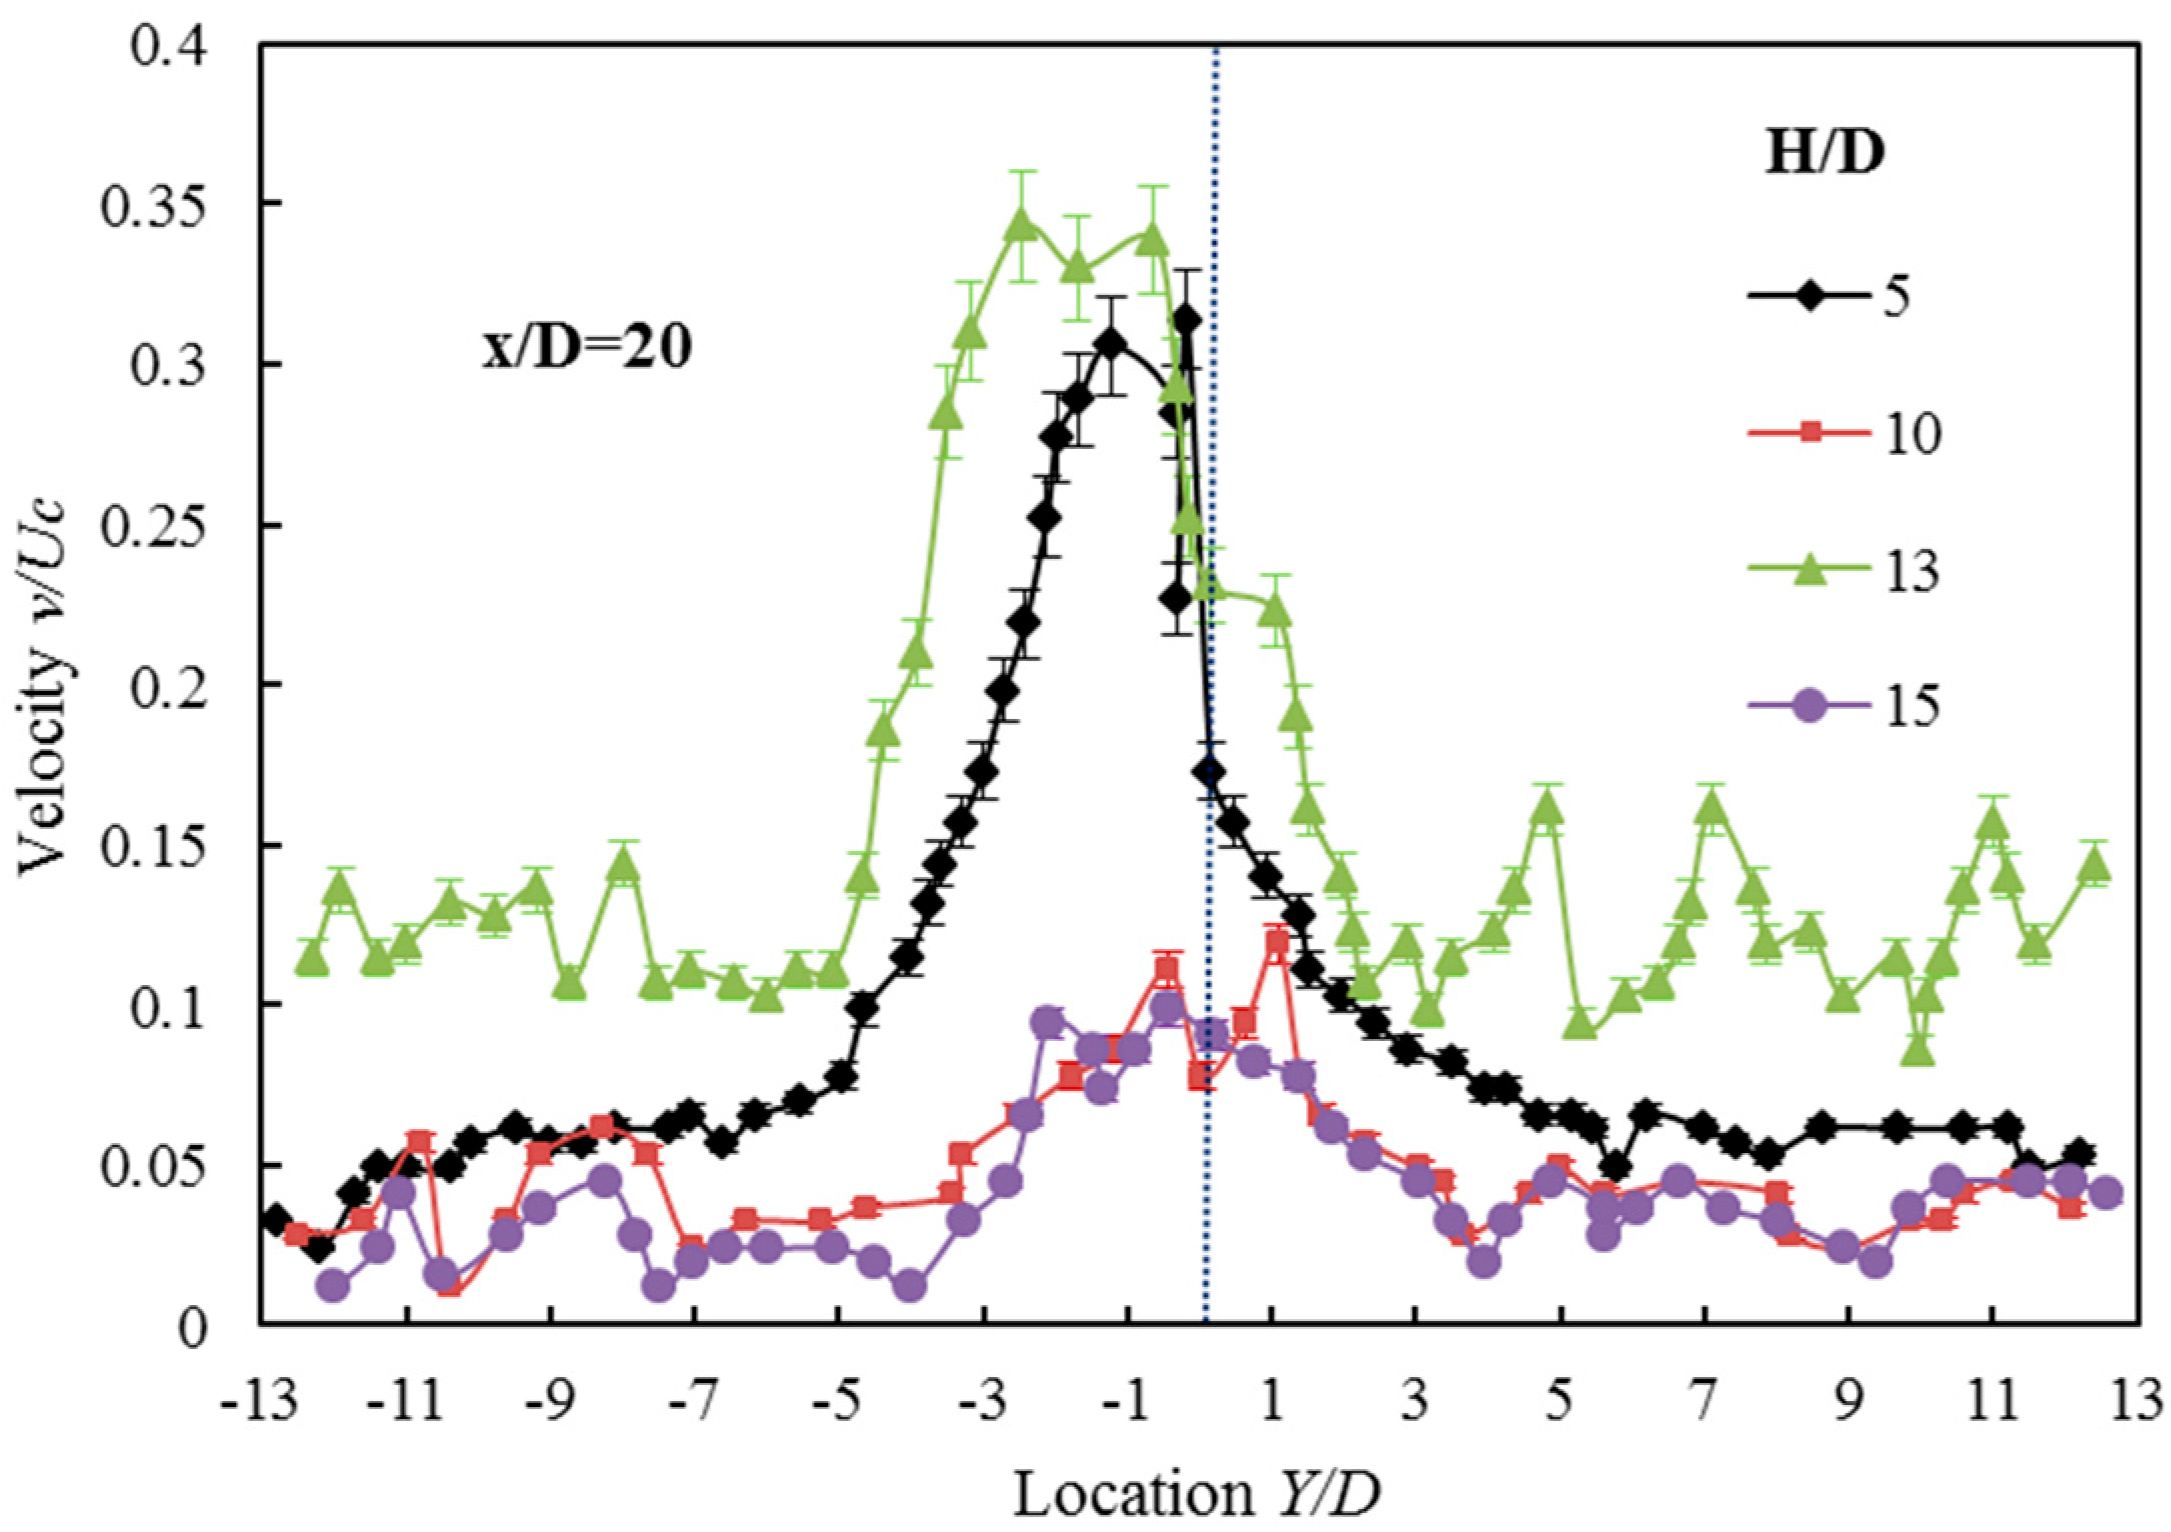
As is shown in Figure 7, the centerline velocity is greater than at other positions. With the location moving to both sides, the velocity decreases rapidly in all cases. Taking the features as a whole, the distribution of axial mean velocity of the X-Y plane is symmetrical about its own centerline. However, in each case, the plot shows various features according to different widths. The diffusion boundary of the submerged waterjet becomes narrower as the confined width increases. To be more specific, taking U/Uc = 0.6, for example, the dimensionless boundary lengths are 5, 4, 3.5, 2 when H/D = 5, 10, 13, 15 respectively. The double-walled confined condition is able to make the jet flow spread to both sides.
Another distinction shown from Figure 7 is that the maximum mean velocity of the centerline increases as the confined width H/D increases. When the confined width H/D = 5, the maximum velocity U/Uc is about 0.9 and when it is 15, the value is about 1.2. It is believed that this kind of phenomenon can be explained by the following reasons. On the one hand, the submerged waterjet flow is close to wall at the stream location. The wall is not completely smooth so as to hold back and disturb the flow field. With the confined width decreasing, the force of friction and disturbance become larger and energy dissipation increases. On the other hand, because of the existence of the double-wall, the development of the waterjet flow at the vertical direction is limited, which results in the flow spreading along the horizontal direction. The axial velocity component decreases and the radial velocity component increases.
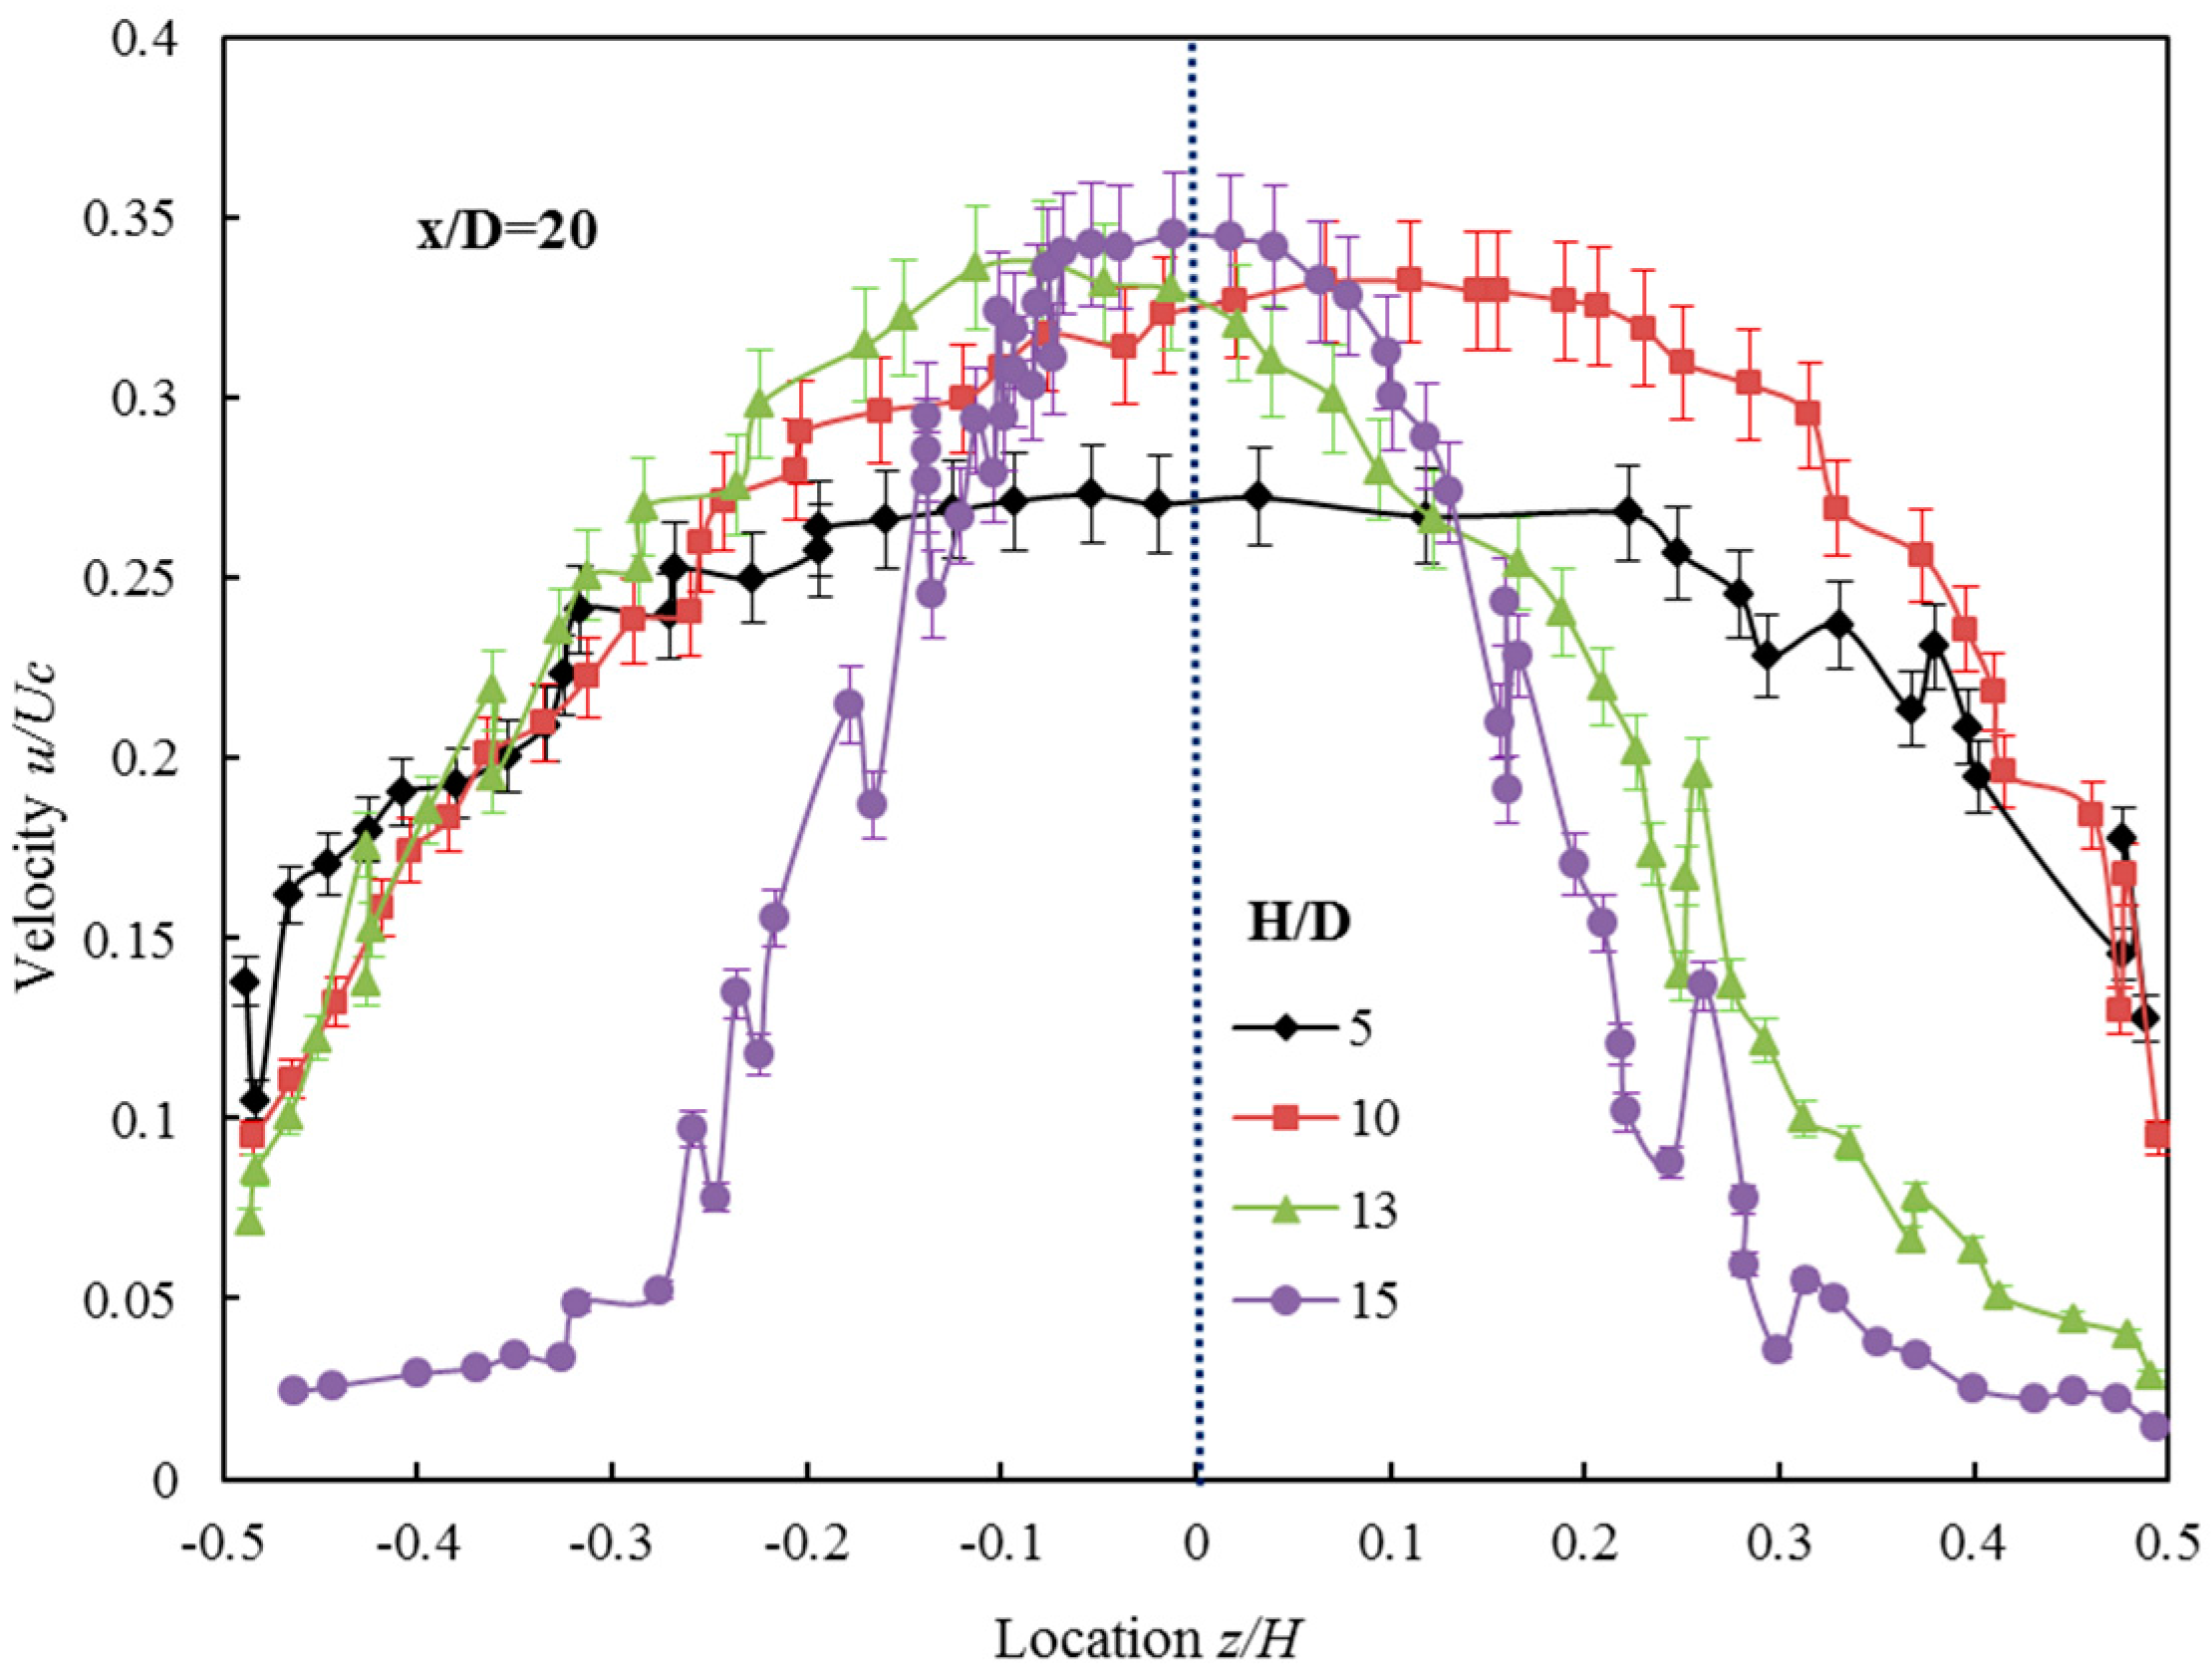
Figure 8 shows the mean velocity in the axial direction at the vertical plane X-Z. It can be seen that the axial mean velocity distribution of the vertical plane has similarities to the axial mean velocity distribution of the horizontal plane. In other words, from the central axis to both sides, the speed is decreased and it is symmetrically distributed with respect to the axis. However, the latter speed distribution is more irregular. When H/D = 5, the jet mean velocity distribution is uniform and has a trend of pulsating. When H/D = 15, the jet mean velocity shows a ridge distribution which is similar to that of the free jet. That is to say, the double-walled confined waterjet velocity distribution of the axial direction in the vertical plane is affected significantly by the confined width. As the confined width becomes smaller, the velocity distribution becomes more gentle. The presence of a limited condition forces the jet to develop horizontally. With the decrease of confined width, the impacting position of the wall on the jet will advance. That means that the confined width has a spatial advance effect on the transition process.
We can also observe some other rules from Figure 8. The velocity distributions under different operating conditions are not completely symmetrical to the axial centerline. For instance, when H/D = 10, the symmetry axis of axial velocity is Z/H = 0.8, and when H/D = 15, the symmetry axis is Z/H = −0.1. We believe that this is due to the following reasons. Firstly, the time of image acquisition is in the development period of the vortex, and the instantaneous flow velocity distribution is asymmetric. Secondly, the number of images acquired is too small to average the speed for a long enough time.
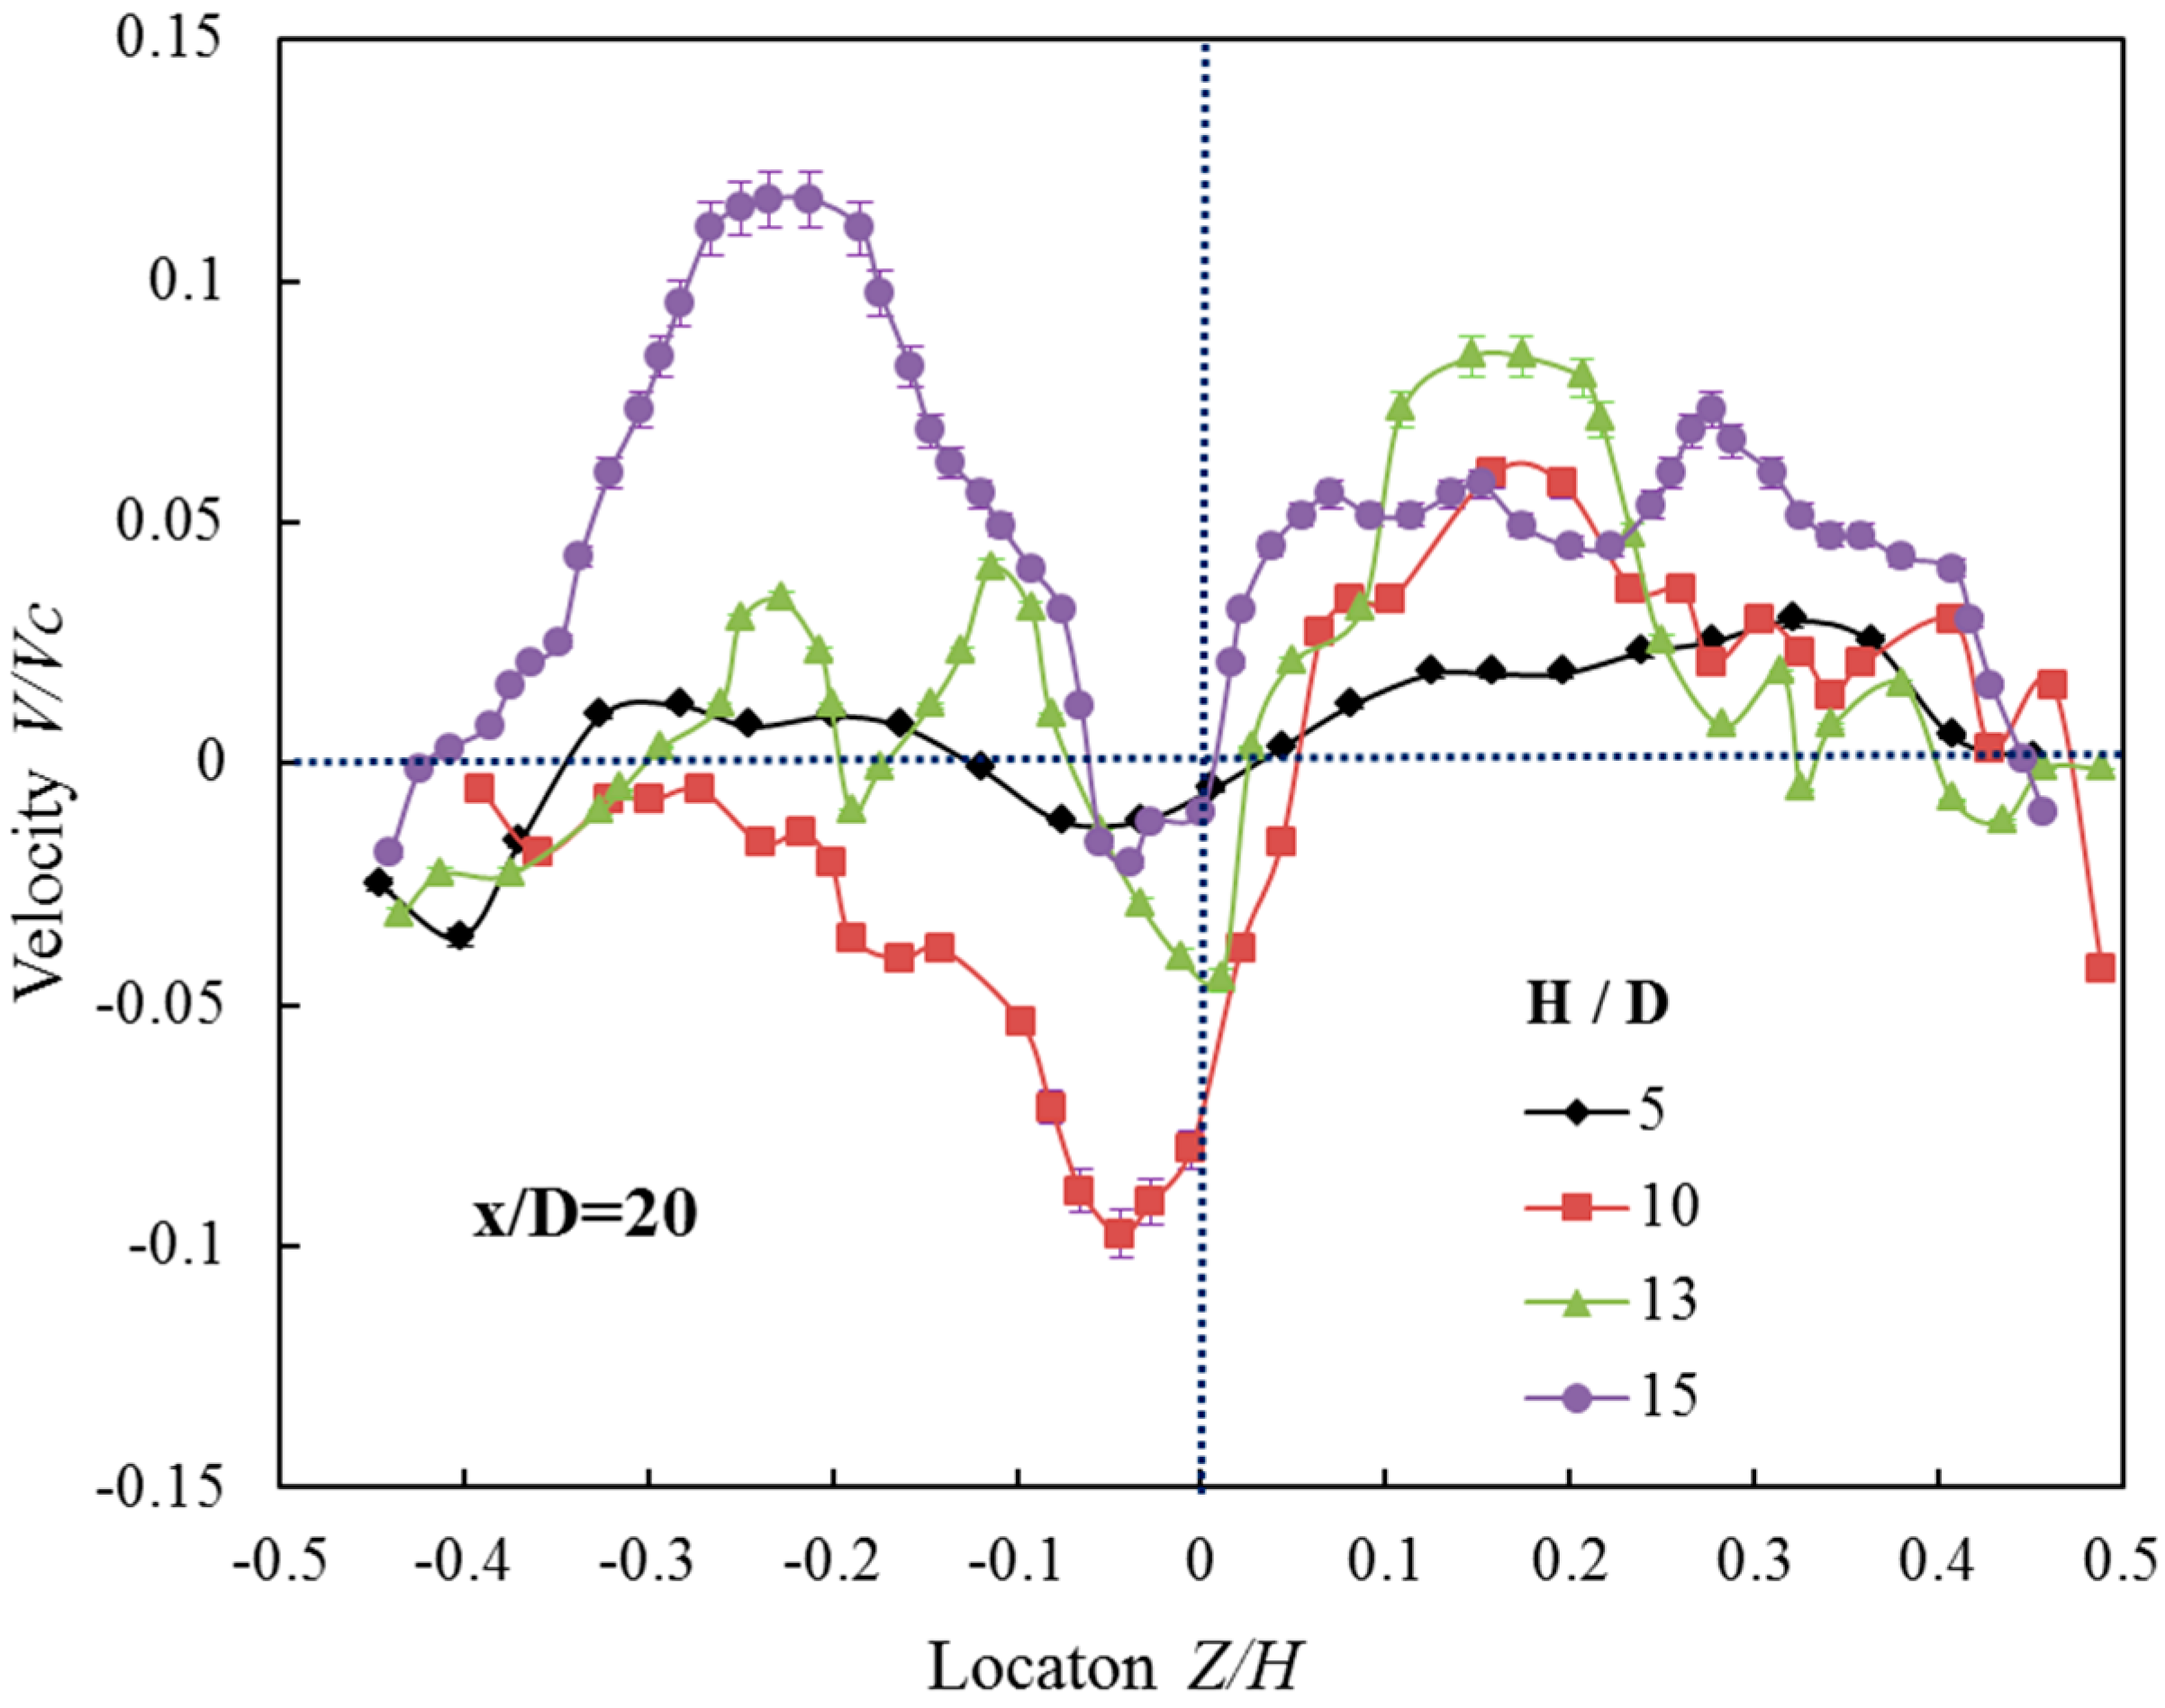
Figure 9 shows the mean velocity in the radial direction in the vertical plane X-Z. Although the speed distribution in Figure 8 is more chaotic, there are rules to follow. When H/D = 5, the radial mean velocity of the vertical plane distributes around V/Vc = 0 indicating that the velocity is affected significantly by the confined condition. However, other mean velocities are not affected too much. It should be noted that the dimensionless velocity V/Vc > 0 when the z/H < 0. As the positive speed is defined as the fluid flowing upwards and the negative speed as downwards, the fluid, of which z/H < 0, is flowing far away from the wall. Thus, the fluid forms a negative pressure region near the wall. According to the above rules, we have reasons to believe that negative pressure will lead to the trend of inward movement of the wall, rather than outward expansion. Simultaneously, we also conclude that the position at which the wall begins to affect the jet will advance as the width decreases.
3.4. The Turbulent Intensity of the Double-Walled Confined Waterjet
In this section, the turbulent intensity distributions are plotted and analyzed. Turbulent intensities are constructed as statistical measures of the local interactions due to unsteady behavior. Turbulent intensities can provide insight into the physics of turbulent flow from a Reynolds-averaged point-of-view.
The downstream development of the relative axial turbulence intensity u′/Uc extracted from the horizontal plane for the H/D = 5, 10, 13, 15 cases is shown in Figure 10. These profiles are plotted against the non-dimensional coordinate y/D in this figure. At x/D = 20, Figure 10 shows that the turbulence intensity for different H/D values is slightly affected by the vertical confinement. The turbulence intensity of the flow field at the centerline is the most intense. As the position gradually moves, the turbulence intensity decreases gradually.
However, the peak value of turbulence intensity changes with the change of H/D; the maximum reaches 0.6 when H/D = 5, and the maximum reaches 0.2 when H/D = 15. The turbulent kinetic energy boundary also decreases with increasing confinement width. It also shows that the finite space width affects the development of the turbulence intensity of the jet. The existence of the finite space makes the turbulence intensity develop in a transverse direction. As the width decreases, the trend becomes more pronounced.
Figure 11 shows the radial turbulence intensity of the horizontal plane. It can be seen from Figure 11 that the turbulence intensity distribution of the confined waterjet is basically the same as the axial velocity of the horizontal section, it is only different in quantity, and the finite space width also has a hysteresis effect on the jet.
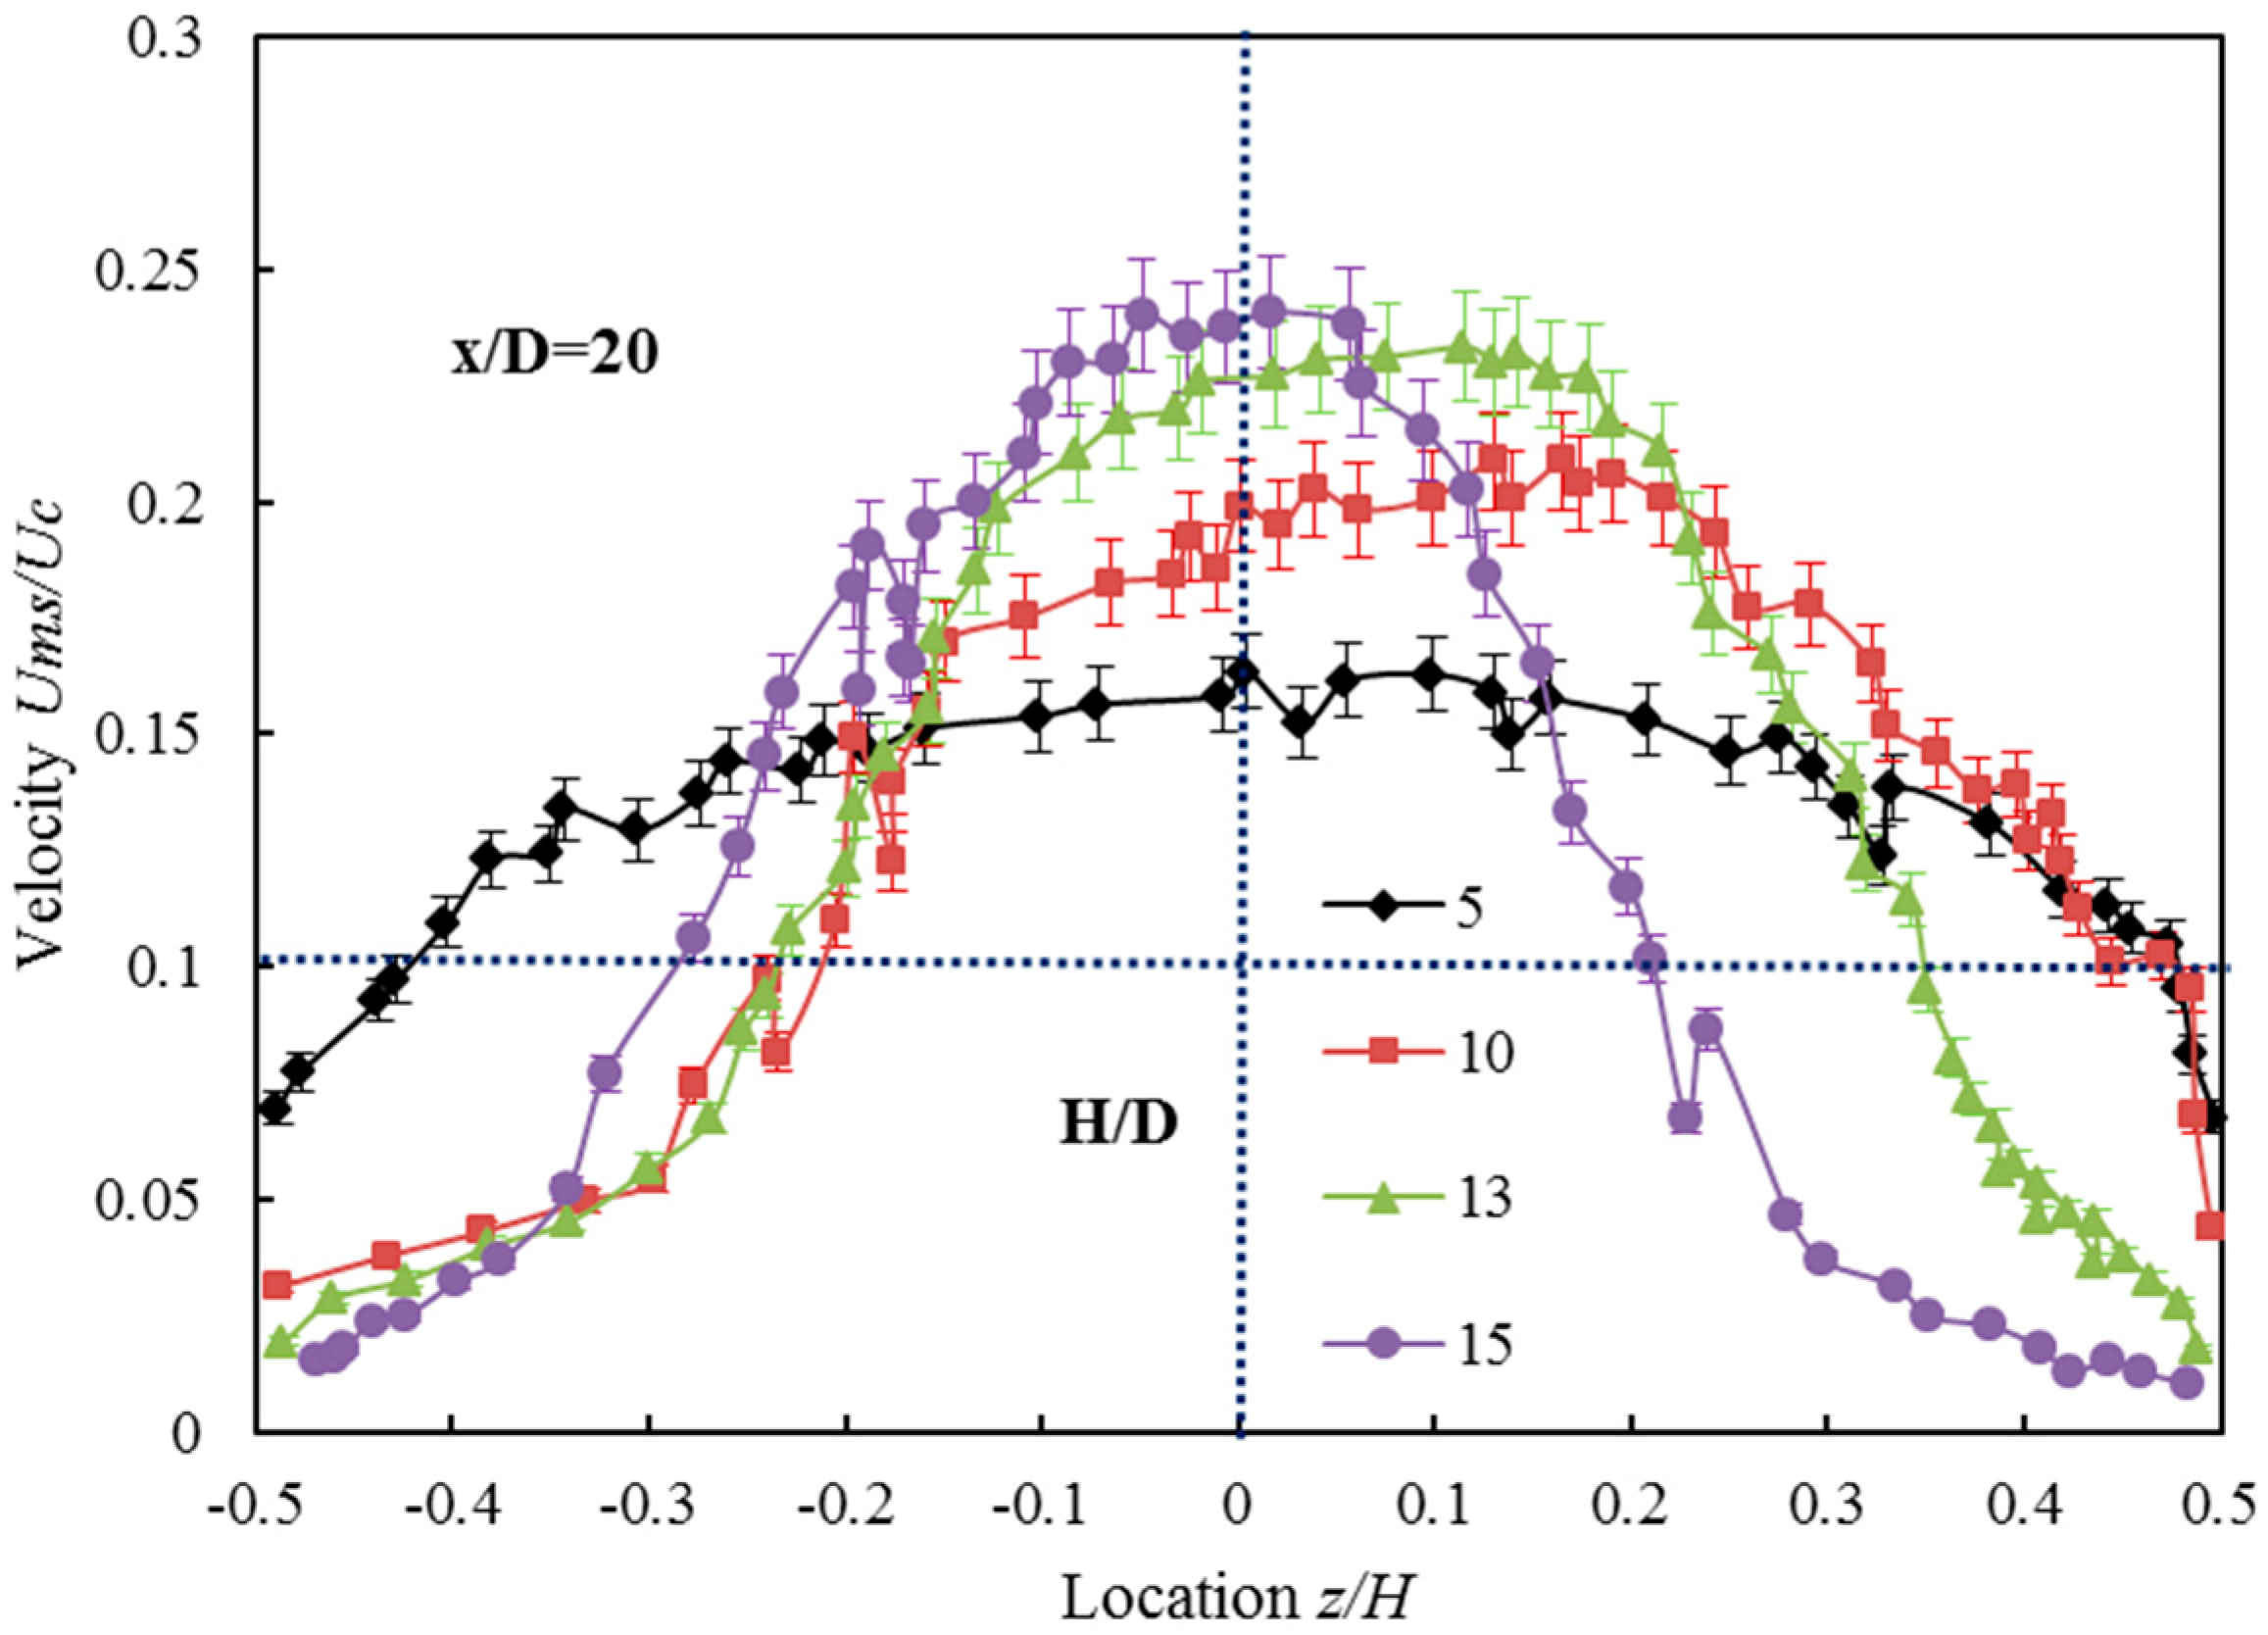
Figure 12 and Figure 13 are the axial and radial turbulence intensity of the submerged confined jet in the vertical plane at the position of x/D = 20. As can be seen in Figure 12, there is a significant relationship between the vertical turbulence intensity and the confined width. On the whole, the turbulence intensity follows a rule that is violent on the centerline and weak on both sides. However, the variation of turbulence intensity varies with different confined widths. For instance, the maximum value of turbulence intensity increases with increasing width. This is because the confined width brings a larger energy loss, resulting in a lower flow field velocity gradient. On the other hand, the intensity boundary decreases as the confined width increases. For example, if the dimensionless turbulence intensity Ums/Uc is equal to 0.1, the dimensionless lengths are 0.8, 0.7, 0.6 and 0.4 when the dimensionless confined width H/D = 5, 10, 13 and 15 respectively. This shows that with the decrease of the confined width, the turbulent area gradually expands, so the confined width has the effect of lateral expansion on the turbulence characteristic.
The radial turbulent intensity of the vertical section is basically the same as that of the axial intensities, but there are several differences. When H/D = 5, the turbulent intensity in the whole area is basically the same, indicating that the flow quality and energy exchange are distributed evenly in the vertical section. However, at H/D = 15, this blending has a distinct regionality, since the jet begins to be different in various directions after the outflow region is fully developed. In the smaller area of H/D, this non-heterosexuality has begun to affect the flow field, which shows that the confined width also has a delay effect in the longitudinal direction of the flow field.
4. Conclusions
- The vertical confinement has an obvious effect on the decay rate of the mean centerline velocity. When the confined width changes from 15 to 5, the speed is reduced by 20%. The slower decay rate can be explained by the conservation of mass which demands an increase in the jet velocity compared to the free jet because the cross-sectional area of the jet becomes constrained by the boundaries.
- The vertical confinement has a significant effect on the jet spread. With the decrease of the confined width, the jet has a tendency to spread horizontally. The confinement has a profound effect on the axial velocity profiles in the vertical plane. As the flow goes downstream, the jet spreads to the boundaries and the axial velocity above and below the jet centerline increases rapidly.
- The vertical confined region induces a space hysteresis effect which changes the location of the transition region moving downstream. With the enlarging of the confined width, the position moves back.
- The fluid could form a negative pressure region near the confined wall, and negative pressure will lead to the trend of inward movement of the wall, rather than outward expansion.
Acknowledgments
This work was supported by Research Program supported by the National Key Basic Research Program of China (No. 2014CB239203), the National Natural Science Foundation of China (No. 51474158), China.
Author Contributions
Xiaolong Ding and Bo Yuan conceived and designed the experiments; Xiaolong Ding and Deng Li performed the experiments; Xiaochuan Wang and Deng Li analyzed the data; Yong Kang supervised the projects and the students with contributions to guide the research program; Xiaolong Ding wrote the paper.
Conflicts of Interest
The authors declare no conflict of interest. The founding sponsors had no role in the design of the study; in the collection, analyses, or interpretation of data; in the writing of the manuscript, and in the decision to publish the results.
References
- Hong, Y.K.; Moon, K.H. Experimental research on a waterjet to simulate erosion by impact of a water drop. Wear 2016, 368–369, 116–123. [Google Scholar] [CrossRef]
- Caydas, U.; Hascahk, A. A study on surface roughness in abrasive waterjet machining process using artificial neural networks and regression analysis method. J. Mater. Process. Technol. 2008, 202, 574–582. [Google Scholar] [CrossRef]
- Zain, A.M.; Haron, H.; Sharif, S. Estimation of the minimum machining performance in the abrasive waterjet machining using integrated ANN-SA. Expert Syst. Appl. 2011, 38, 8316–8326. [Google Scholar] [CrossRef]
- Azhari, A.; Schindier, C.; Hilbert, K.; Godard, C.; Kerscher, E. Influence of waterjet peening and smoothing on the material surface and properties of stainless steel 304. Surf. Coat. Technol. 2014, 258, 1176–1182. [Google Scholar] [CrossRef]
- Liu, S.Y.; Liu, X.H.; Chen, J.F.; Lin, M.X. Rock breaking performance of a pick assisted by high-pressure water jet under different configuration models. Chin. J. Mech. Eng. 2015, 28, 607–617. [Google Scholar] [CrossRef]
- Glover, H.W.; Brass, T.; Bhagat, R.K.; Davidson, J.F.; Pratt, L.; Wilson, D.L. Cleaning of complex soil layers on vertical walls by fixed and moving impinging liquid jets. J. Food Eng. 2016, 178, 95–109. [Google Scholar] [CrossRef]
- Li, D.; Kang, Y.; Wang, X.C.; Ding, X.L.; Fang, Z.L. Effects of nozzle inner surface roughness on the cavitation erosion characteristics of high speed submerged jets. Exp. Therm. Fluid Sci. 2016, 74, 444–452. [Google Scholar] [CrossRef]
- Li, D.; Kang, Y.; Ding, X.L.; Wang, X.C.; Fang, Z.L. Effects of area discontinuity at nozzle inlet on the characteristics of self-resonating cavitating waterjet. Chin. J. Mech. Eng. 2016, 29, 813–824. [Google Scholar] [CrossRef]
- Guha, A.; Barron, R.M.; Balachander, R. An experimental and numerical study of water jet cleaning process. Mater. Process. Technol. 2011, 211, 610–617. [Google Scholar] [CrossRef]
- Hu, Y.; Kang, Y.; Wang, X.C.; Li, X.H.; Long, X.P.; Zhai, G.Y.; Huang, M. Mechanism and experimental investigation of ultrahigh pressure water jet on rubber cutting. Int. J. Precis. Manuf. 2014, 15, 1937–1978. [Google Scholar] [CrossRef]
- Lee, S.J.; Kim, H.L.; Lee, J.P.; Rajagopalan, S. Jet flow characteristics of sinusoidal wavy nozzles. J. Mech. Sci. Technol. 2012, 26, 4007–4016. [Google Scholar] [CrossRef]
- Li, D.; Kang, Y.; Ding, X.L.; Liu, W.C. Experimental study on the effects of feeding pipe diameter on the cavitation erosion performance of self-resonating cavitating waterjet. Exp. Therm. Fluid Sci. 2017, 82, 314–325. [Google Scholar] [CrossRef]
- Azimi, A.H.; Qian, Y.; Zhu, D.Z.; Rajaratnam, N. An experimental study of circular sand-water wall jets. Int. J. Multiph. Flow 2015, 74, 34–44. [Google Scholar] [CrossRef]
- Johnson, B.K.; Prud’homme, R.K. Chemical processing and micromixing in confined impinging jets. AiChE J. 2003, 49, 2264–2282. [Google Scholar] [CrossRef]
- Kaffel, A.; Moureh, J.; Harion, J.L.; Russeil, S. TR-PIV measurement and POD analysis of the plane wall jet subjected to lateral perturbation. Exp. Therm. Fluid Sci. 2016, 77, 71–90. [Google Scholar] [CrossRef]
- Donaldsion, C.D.; Snedeker, R.S. A study of free jet impingement. J. Fluid Mech. 1971, 45, 281–319. [Google Scholar] [CrossRef]
- Wang, X.N.; Zheng, X.J.; Wang, P. Direct numerical simulation of particle-laden plane turbulent wall jet and the influence of Stokes number. Int. J. Multiph. Flow 2017, 92, 82–92. [Google Scholar] [CrossRef]
- Rafferty, L.; Kaminski, D. Non-dimensionalization and mixing quantification of laminar twin semi-confined jets. Int. J. Heat Fluid Flow 2014, 48, 15–23. [Google Scholar] [CrossRef]
- Hadziabdic, M.; Hanjalic, K. Vortical structures and heat transfer in a round impinging jet. J. Fluid Mech. 2008, 596, 221–260. [Google Scholar] [CrossRef]
- Tani, I.; Komatsu, Y. Impingement of a round jet on a flat surface. In Applied Mechanics, Proceedings of the 11th International Congress of Applied Mechanics Munich; Springer: Heidelberg, Germany, 1964; pp. 672–676. [Google Scholar]
- Choo, K.; Kim, S.J. The influence of nozzle diameter on the circular hydraulic jump of liquid jet impingement. Exp. Therm. Fluid Sci. 2016, 72, 12–17. [Google Scholar] [CrossRef]
- Icardi, M.; Gavi, E.; Marchisio, D.; Barresi, A.A.; Olsen, M.G.; Fox, R.O.; Lakehal, D. Investigation of the flow field in a three dimensional confined impinging jets reactor by means of microPIV and DNS. Chem. Eng. J. 2011, 166, 294–305. [Google Scholar] [CrossRef]
- Rothenfluh, T.; Schuler, M.J.; von Rohr, P.R. Experimental heat transfer study on impinging, turbulent, near-critical water jets confined by an annular wall. J. Supercrit. Fluids 2013, 77, 79–90. [Google Scholar] [CrossRef]
- Fan, J.Y.; Zhang, Y.; Wang, D.Z. Experimental study on the vortex and entrainment characteristics for a round transverse jet in shallow water. J. Hydrodyn. 2009, 21, 386–393. [Google Scholar] [CrossRef]
- Adane, K.F.K.; Tachie, M.F. Experimental and numerical study of laminar round jet flows along a wall. J. Fluids Eng.-Trans. ASME 2010, 132. [Google Scholar] [CrossRef]
- Craft, T.J.; Launder, B.E. On the spreading mechanism of the three-dimensional turbulent wall jet. J. Fluid Mech. 2000, 435, 305–326. [Google Scholar] [CrossRef]
- Shinneeb, M. Confinement Effects in Shallow Water Jets. Ph.D. Thesis, University of Saskatchewan, Saskatoon, SK, Canada, 2006. [Google Scholar]
- Shinneeb, M.; Bugg, J.D.; Balachander, R. Coherent structures in shallow water jets. J. Fluids Eng. 2011, 133, 011203. [Google Scholar]
- Shinneeb, A.M.; Balachander, R.; Bugg, J.D. Confinement effects in shallow water jets. J. Hydraul. Eng. 2011, 137, 300–314. [Google Scholar] [CrossRef]
- Ghidelli, M.; Sebastiani, M.; Johanns, K.E.; Pharr, G.M. Effects of indenter angle on micro-scale fracture toughness measurement by pillar splitting. J. Am. Ceram. Soc. 2017, 100, 5713–5738. [Google Scholar] [CrossRef]
- Ghidelli, M.; Sebastiani, M.; Collet, C.; Guillemet, R. Determination of the elastic moduli and residual stresses of freestanding Au-TiW bilayer thin films by nanoindentation. Mater. Des. 2016, 106, 436–445. [Google Scholar] [CrossRef]
- Wang, J.S.; Wang, C. Heat transfer and flow characteristics of a rectangular channel with a small circular cylinder having slit-vent vortex generator. Int. J. Therm. Sci. 2016, 104, 158–171. [Google Scholar] [CrossRef]
- Vinze, R.; Chandel, S.; Limaye, M.D.; Prabhu, S.V. Heat transfer distribution and shadowgraph study for impinging underexpanded jets. Appl. Therm. Eng. 2017, 115, 41–52. [Google Scholar] [CrossRef]
- Fang, Z.L.; Kang, Y.; Yuan, B.; Yang, X.F.; Wang, X.C. Slotting radius prediction model of soft coal seams with high-pressure pulse water jet. Disaster Adv. 2013, 6, 431–437. [Google Scholar]
- Gent, M.; Menendez, M.; Torno, S.; Torano, J.; Schenk, A. Experimental evaluation of the physical properties required of abrasives for optimizing waterjet cutting of ductile materials. Wear 2012, 25, 284–285. [Google Scholar] [CrossRef]
- Huang, L.; Folkes, J.; Kinnell, P.; Shipway, P.H. Mechanisms of damage initiation in a titanium alloy subjected to water droplet impact during ultra-high pressure plain waterjet erosion. J. Mater. Process. Technol. 2012, 212, 1906–1915. [Google Scholar] [CrossRef]
- Wang, J.; Shanmugan, D.K. Cutting meat with bone using an ultrahigh pressure abrasive waterjet. Meat Sci. 2009, 81, 671–677. [Google Scholar] [CrossRef] [PubMed]
- Jegaraj, J.J.R.; Babu, N.R. A strategy for efficient and quality cutting of materials with abrasive waterjets considering the variation in orifice and focusing nozzle diameter. Int. J. Mach. Tools Manuf. 2005, 45, 12–13. [Google Scholar] [CrossRef]
- Bugg, J.D.; Rezkallah, K.S. An analysis of noise in PIV images. J. Vis. 1988, 1, 217–226. [Google Scholar] [CrossRef]
Figure 1.
Schematic diagram of the experimental setup.

Figure 2.
Profile and photo of nozzle.

Figure 3.
Illustration of plexiglass water tank and measuring region: (a) Structure of plexiglass water tank; (b) Vertical plane; (c) Horizontal plane.
Figure 3.
Illustration of plexiglass water tank and measuring region: (a) Structure of plexiglass water tank; (b) Vertical plane; (c) Horizontal plane.

Figure 4.
Velocity vector of the testing area.

Figure 5.
Cloud image of velocity: (a) Cloud image of average velocity; (b) Cloud image of fluctuation intensity.
Figure 5.
Cloud image of velocity: (a) Cloud image of average velocity; (b) Cloud image of fluctuation intensity.

Figure 6.
Distribution of centerline velocity in the axial direction.

Figure 7.
Axial mean velocity of the horizontal plane (X-Y).
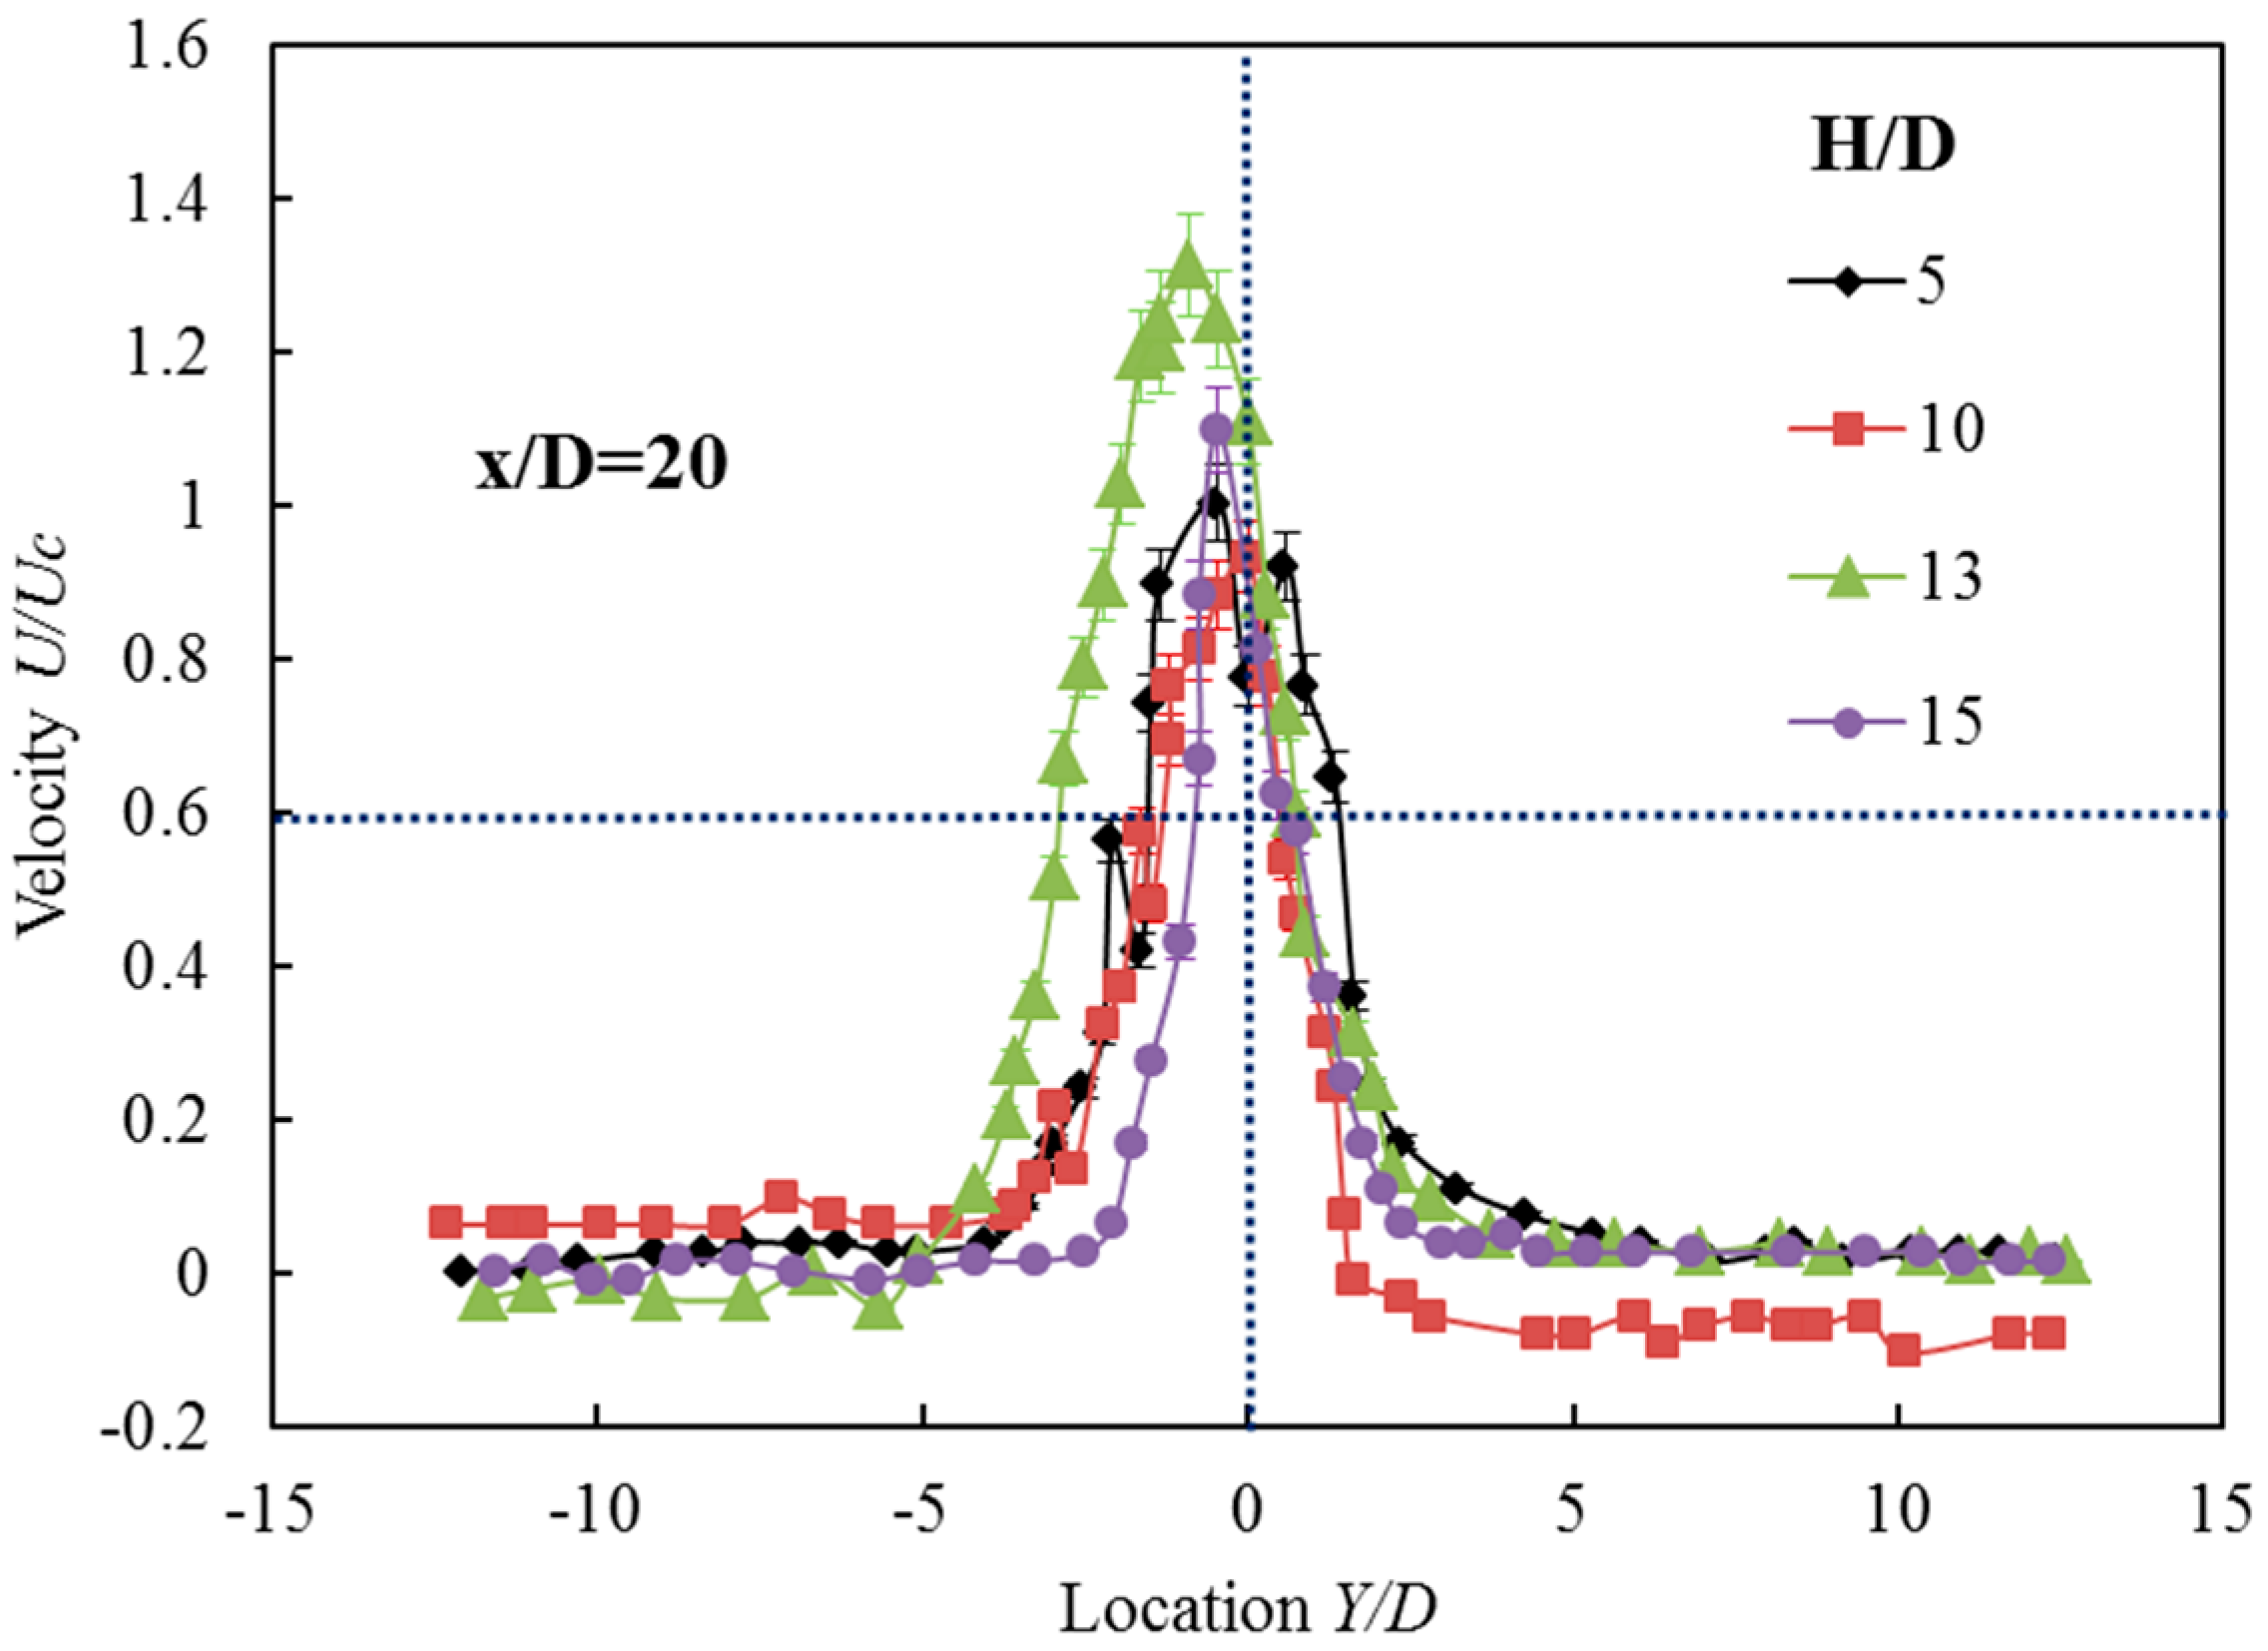
Figure 8.
Axial mean velocity of the vertical plane (X-Z).

Figure 9.
Radial mean velocity of the vertical plane (X-Z).

Figure 10.
Axial turbulent intensity of the horizontal plane (X-Y).
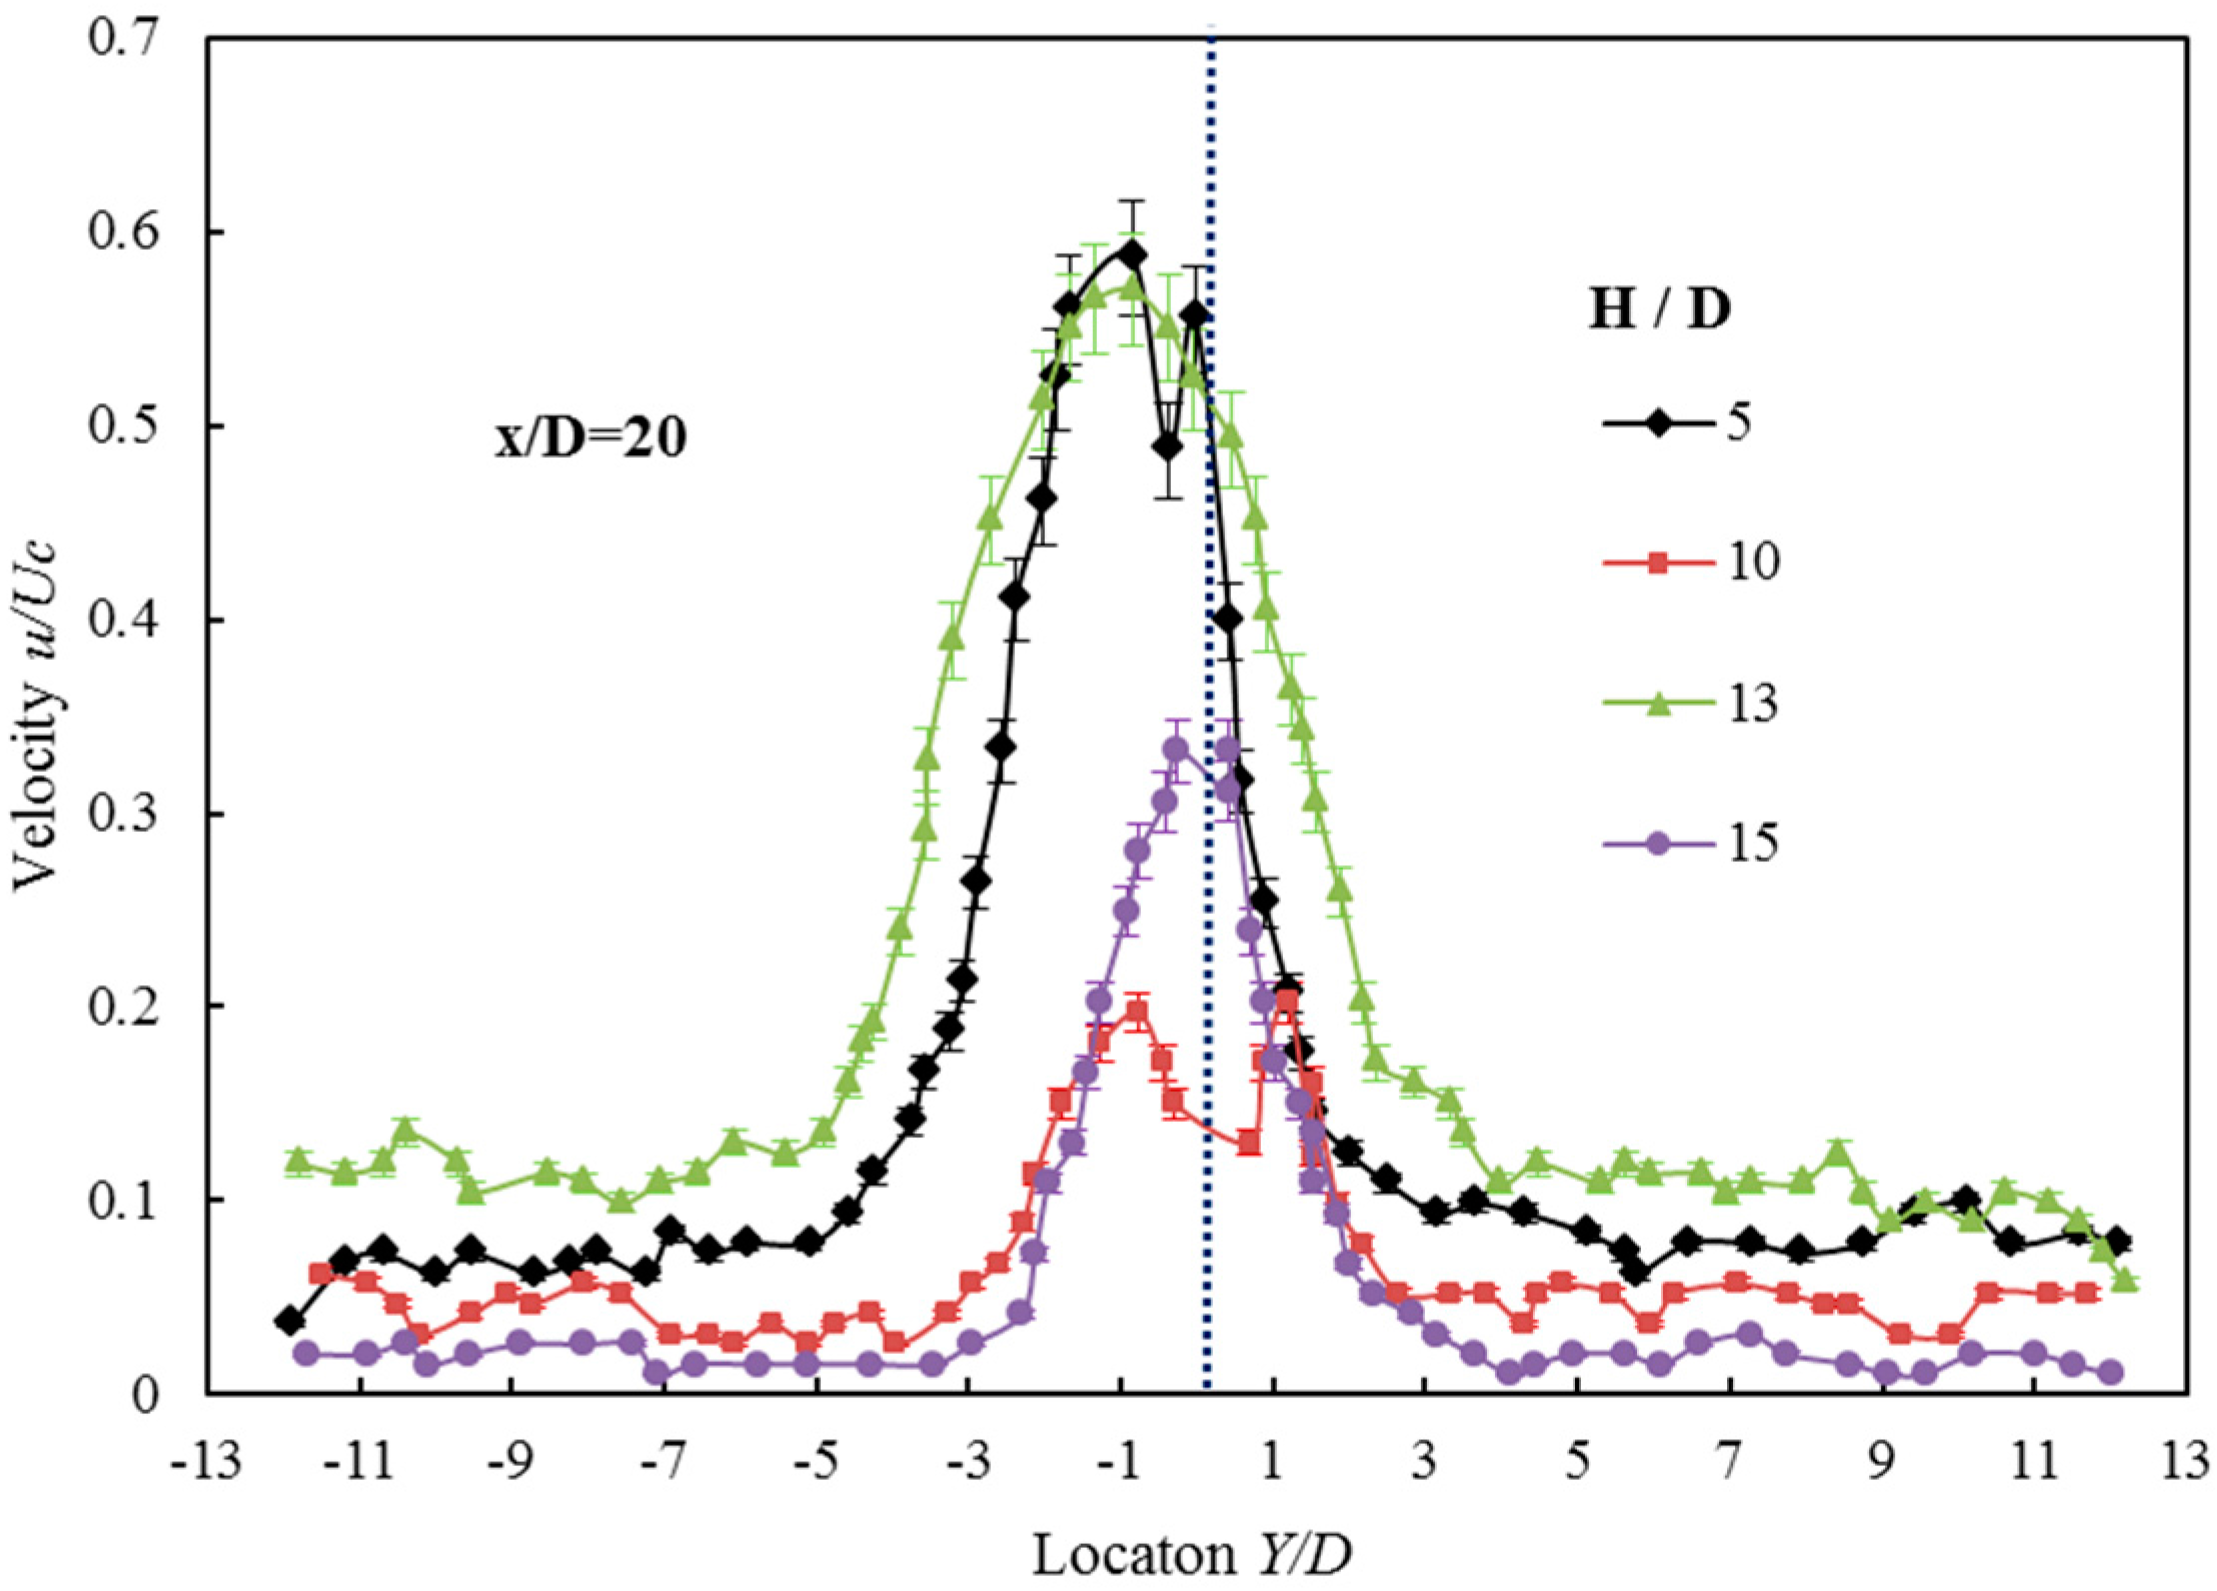
Figure 11.
Radial turbulent intensity of the horizontal plane (X-Y).

Figure 12.
Axial turbulent intensity of the vertical plane (X-Z).

Figure 13.
Radial turbulent intensity of the vertical plane (X-Z).


Table 1.
The detailed information of the pulsed laser.
| Item | Power | Impulse Frequency | Scanning Speed | Wavelength | Width |
|---|---|---|---|---|---|
| Value | 120 mJ/Pulse | 30 HZ | 3.75/s | 532 nm | 1 mm |
Table 2.
The detailed information of the charge-coupled device camera.
| Item | Resolution | Image Acquisition Frequency | Region of View |
|---|---|---|---|
| Value | 1600 × 1200 pixels | 32 fps | 600 × 600 mm |
Table 3.
The doubled-walled confined width.
| The Actual Width | 20 mm | 40 mm | 52 mm | 60 mm |
|---|---|---|---|---|
| The dimensionless width | 5 | 10 | 13 | 15 |
© 2017 by the authors. Licensee MDPI, Basel, Switzerland. This article is an open access article distributed under the terms and conditions of the Creative Commons Attribution (CC BY) license (http://creativecommons.org/licenses/by/4.0/).
Share and Cite
MDPI and ACS Style
Ding, X.; Kang, Y.; Li, D.; Yuan, B.; Wang, X. Experimental Investigation on the Influence of a Double-Walled Confined Width on the Velocity Field of a Submerged Waterjet. Appl. Sci. 2017, 7, 1281. https://doi.org/10.3390/app7121281
AMA Style
Ding X, Kang Y, Li D, Yuan B, Wang X. Experimental Investigation on the Influence of a Double-Walled Confined Width on the Velocity Field of a Submerged Waterjet. Applied Sciences. 2017; 7(12):1281. https://doi.org/10.3390/app7121281
Chicago/Turabian StyleDing, Xiaolong, Yong Kang, Deng Li, Bo Yuan, and Xiaochuan Wang. 2017. "Experimental Investigation on the Influence of a Double-Walled Confined Width on the Velocity Field of a Submerged Waterjet" Applied Sciences 7, no. 12: 1281. https://doi.org/10.3390/app7121281
Note that from the first issue of 2016, this journal uses article numbers instead of page numbers. See further details here.