Article

Experimental Study and Modelling of the Thermal Conductivity of Sandy Soils of Different Porosities and Water Contents

1
College of Water Resource Science and Engineering, Taiyuan University of Technology, Taiyuan 030024, China
2
School of Computing, Science & Engineering, University of Salford, Manchester M5 4WT, UK
3
Taiyuan Bilan Hydraulic Engineering Design Co. Ltd., Taiyuan 030024, China
*
Author to whom correspondence should be addressed.
Appl. Sci. 2017, 7(2), 119; https://doi.org/10.3390/app7020119
Submission received: 25 October 2016 / Revised: 13 January 2017 / Accepted: 17 January 2017 / Published: 25 January 2017
(This article belongs to the Section Energy Science and Technology)

Abstract

:
This paper at first reports an experimental work to test the thermal conductivity of formulated sandy soil specimens of different porosities and water contents. Both needle probe and hot-plate methods were conducted and compared. It has been confirmed that the needle probe method has a better accuracy for the measurement of unsaturated soil thermal conductivity, and that the pore size distribution plays an important role on unsaturated soil thermal conductivity. Secondly, it gives out an extensive review on the modelling work, and investigates two major types of empirical models in detail. Two generalized formulas have been suggested to mathematically characterise the two types of models and tested using the experimental data. Finally, in terms of the intrinsic relation to the pore size distribution and the similarity between the thermal conductivity and water retention characteristics of unsaturated soils, a soil water retention model has been suggested and tested to describe unsaturated soil thermal conductivity.

1. Introduction

Soil thermal conductivity has a wide interest in underground infrastructure engineering, such as sub-ground building [1], subsurface pipeline [2,3] and cable networks [4,5], underground transportation [6], and ground source heat pump systems [7,8,9]. Soil thermal conductivity depends on many factors, which may be primarily classified into three groups: the nature of soils, including the texture, mineral composition, shape and size of soil particles; the structural condition, including porosity and particle arrangement; and the physical condition, including water content, temperature, and pressure. In reality, all these influences work together making the evaluation of soil thermal conductivity a big challenge [10,11,12,13,14].
In order to understand the influences of structural and physical conditions, the study on the thermal conductivity of unsaturated sandy soils has raised particular interest [15,16,17,18,19]. Chen [18] reported an experimental work using four different quartz sands, which had the same over 99% quartz content, but different particle size distribution. Using the transient thermal probe method, the thermal conductivity was measured at four different porosities and five water contents from dry to fully saturated. Based on the experimental result, he proposed an empirical thermal conductivity model for sandy soil, which took a logarithmic form containing the porosity and saturation. Tarnawski et al. [16] conducted a similar test on three standard sands, called Ottawa C-109, Ottawa C-190, and Toyoura, respectively. The Ottawa sands have 99.8% quartz content and a density of 2.65, while the Toyoura sand, which is mainly composed of quartz and some siliceous rocks and black shale, has a density of 2.63. Using the thermal probe method, they measured the thermal conductivity at two porosities and six degrees of water saturation from dryness to full saturation. For modelling, they used the de Vries model [20] to fit the measurements. Both of the two reported works took a similar procedure in sample preparation, in which, at first, a certain amount of sands of a specific water content were filled in a container. Thereafter the sands in the container were compacted to a certain volume to achieve a specific porosity. The two separately conducted works had obtained quite similar measurement results for the thermal conductivity of sandy soils at different porosity and water content conditions. The two models adopted had produced a good fitting result for the experimental measurements.
The effect of the soil structural and physical conditions on soil thermal conductivity is a complicated problem because the two factors present a strongly coupled influence. It has been noticed before that there is an intrinsic link between thermal conductivity and the water retention characteristics of soils. The variation of thermal conductivity against the water saturation displays a resembling mirrored S-shape as the water retention curve of unsaturated soils [21] as illustrated in Figure 1. The resemblance is due to the variation of both thermal conductivity and matric suction of soils against the water content depending on the pore water distribution, which relates to the pore size distribution, and the configuration of the pore water interface, including the water film on pore wall surfaces and the air-water interface between soil particles. However, so far, most of the previous work evaluated the soil structural influence on thermal conductivity mainly based on porosity and particle size distribution. Seeing the fact that the pore water distribution of unsaturated soils depends on the soil pore size distribution, but the pore size distribution does not have a unique correlation to the soil porosity and particle size distribution, the effect of pore size distribution on the soil thermal conductivity at different water contents still needs more research for a deeper understanding.
This paper at first reports an experimental study on the specimens of formulated sands, which have similar quartz content, sand density, and particle size distribution as that of the samples used by Chen [18] and Tarnawski et al. [16]. However, in this work, the specimens were prepared using a different compaction method to intentionally make a big difference in pore size distribution while using the same porosities as those of the samples used in the two previously reported work. Thereafter, thermal conductivity of these prepared specimens was measured using both transient needle probe and steady state hot-plate methods in order to investigate how significant the effect of the expected moisture migration could be under unsaturated conditions. Secondly, following the experimental work, the two major types of thermal conductivity models in the literature were compared in two characterised general forms and used to model the experimental data. Finally, based on the recognition of the intrinsic relation to the pore size distribution for both thermal conductivity and water retention characteristic of unsaturated soils, this paper has proposed a unified model for the two characteristic properties.

2. Experimental Study
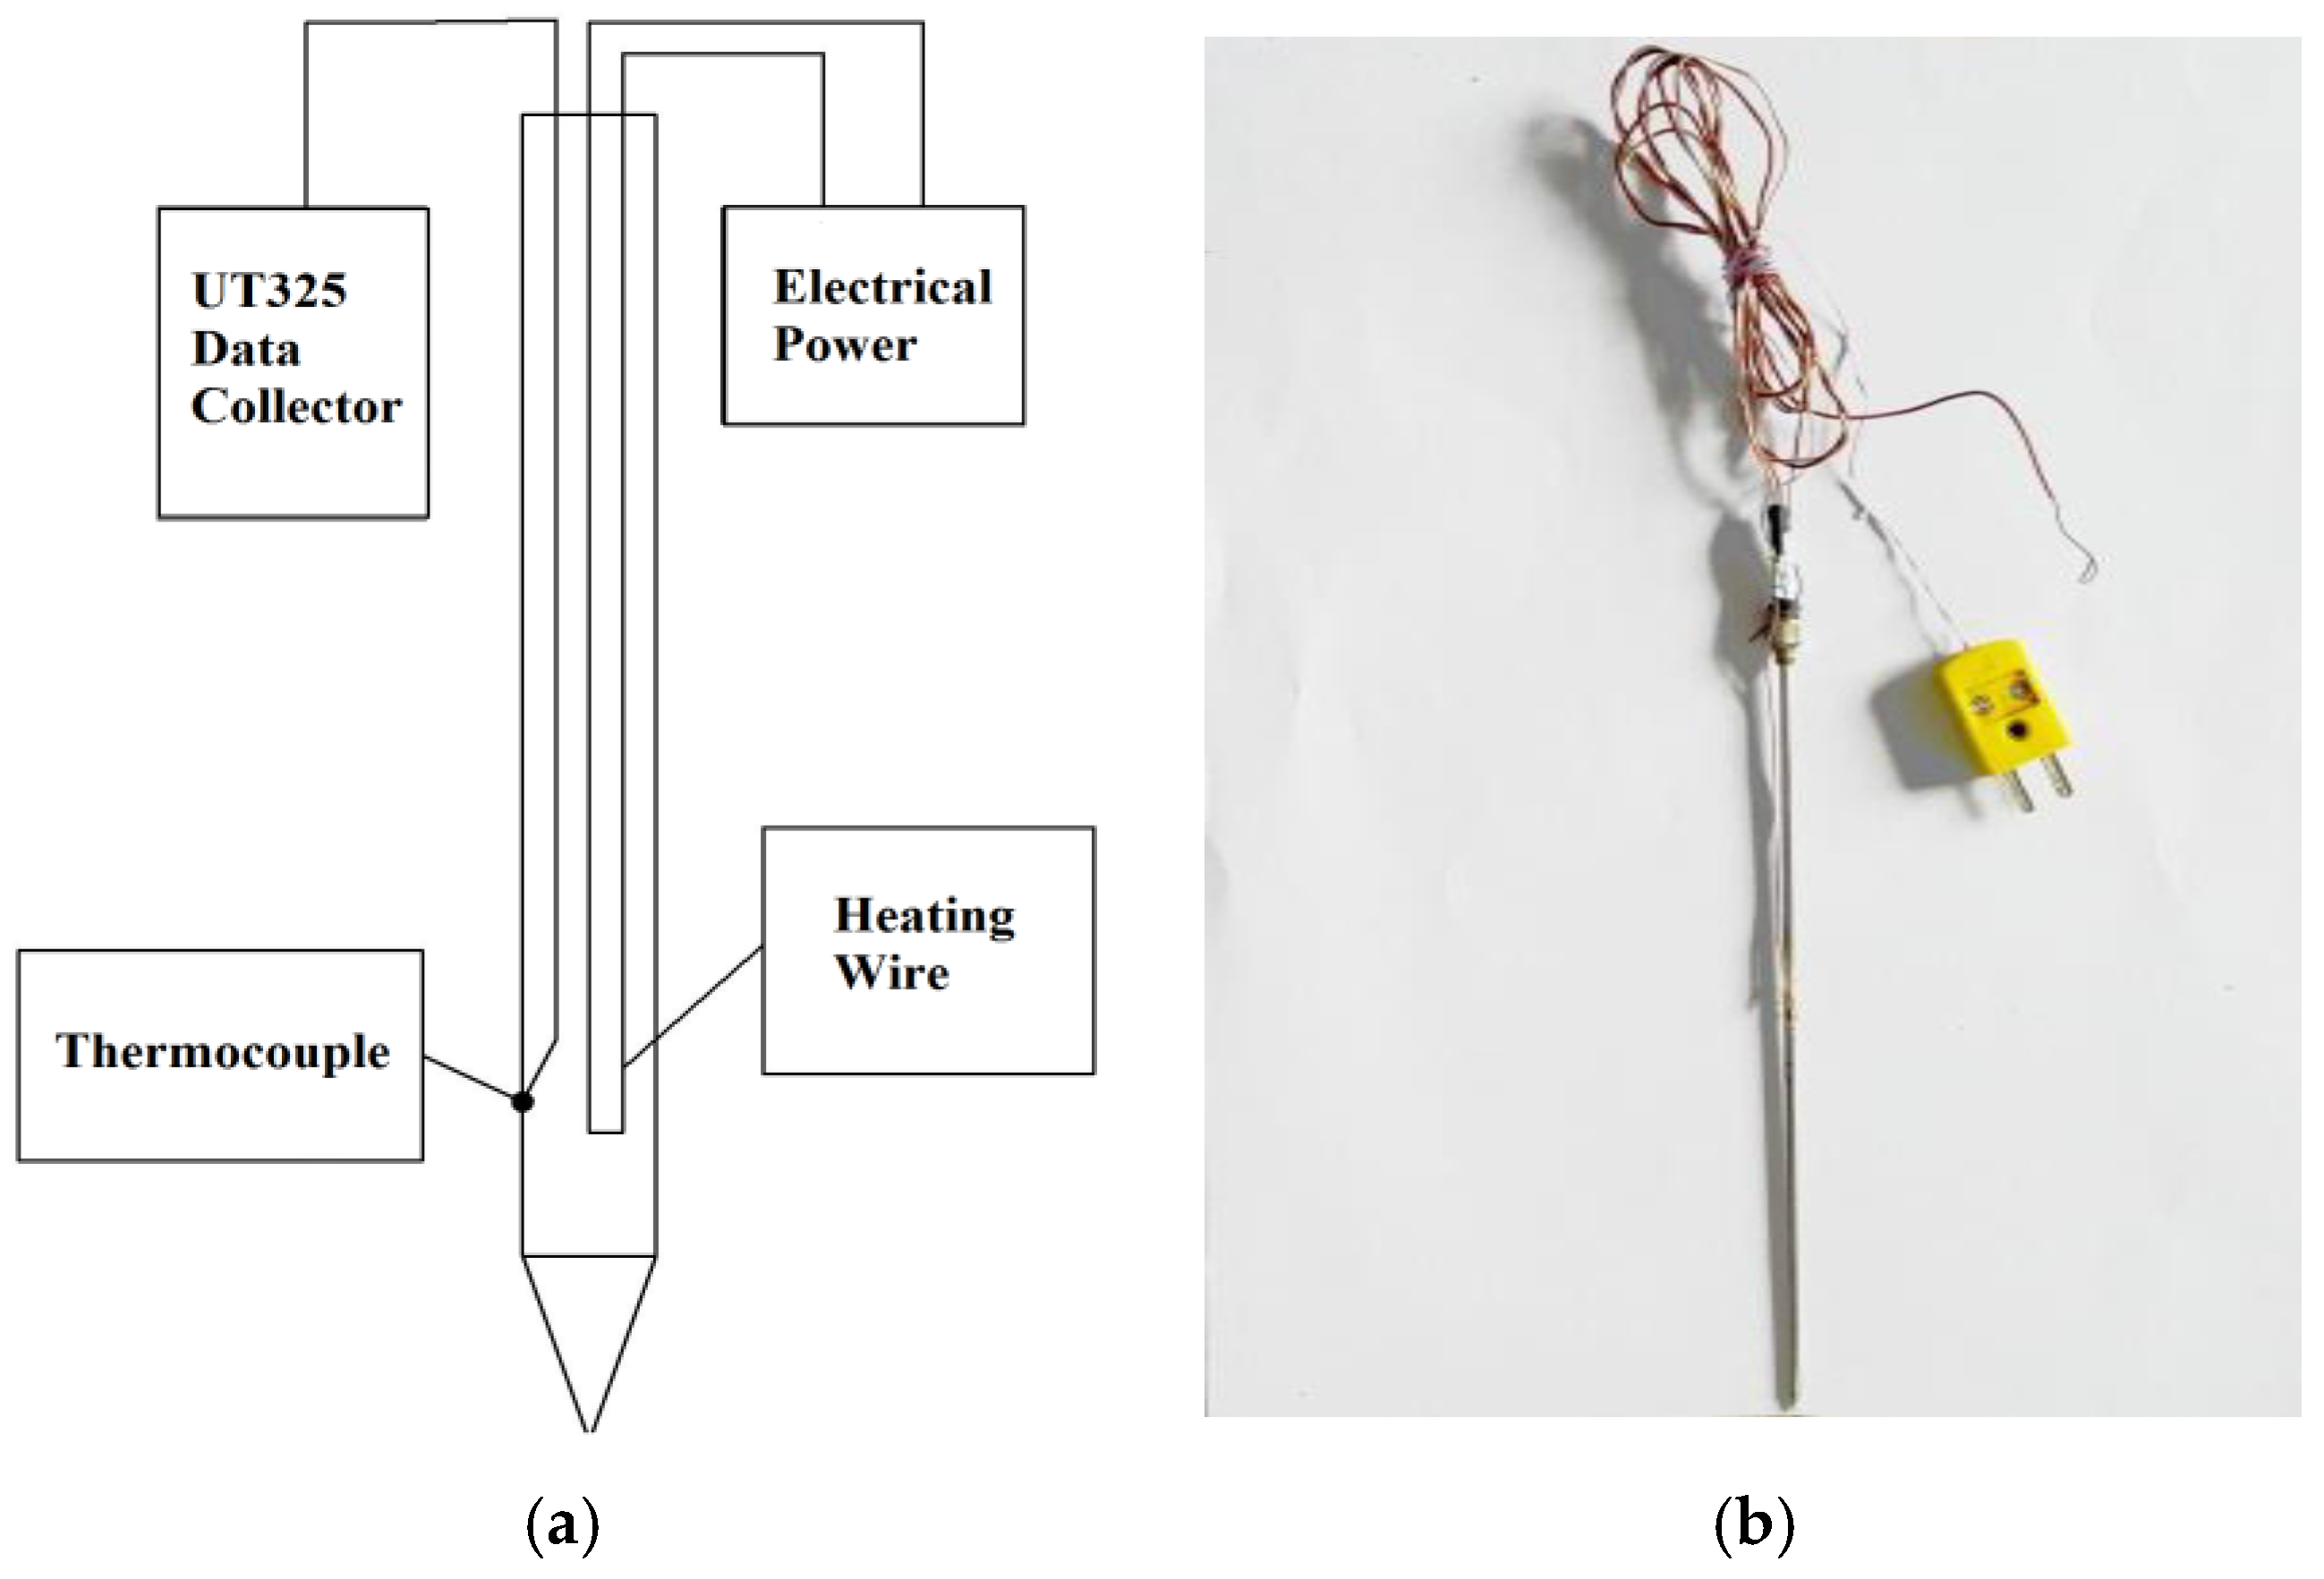
2.1. Methodology

There are two conventional methods to measure soil thermal conductivity [22,23], the steady state method and transient method. The steady state method is based on Fourier’s Law by applying a one-directional heat flow through a specimen. When a steady state is reached, there will be a constant temperature gradient inside the specimen along the direction of the heat flow, and the thermal conductivity can be calculated directly in terms of its definition in Fourier’s law. The steady state method is slow and time consuming. Its accuracy is particularly influenced by the potential heat loss of the experimental cell to the surrounding environment [23,24]. In addition, the temperature gradient in specimens may induce the migration of moisture and result in water redistribution in pores. Consequently, the steady heat-flow method, in a rigorous sense, should not be suitable for unsaturated soils [18]. The transient method, on the other hand, is based on the heat diffusion equation by applying a constant heat source into a specimen, such as a needle probe [23], and recording the local temperature change in the specimen over a period of time. The thermal conductivity can be calculated in terms of the power of the heat source, the temperature increase, and the heating time. The needle probe transient method is rapid and has a small influence on the original water distribution state in unsaturated soils [18].

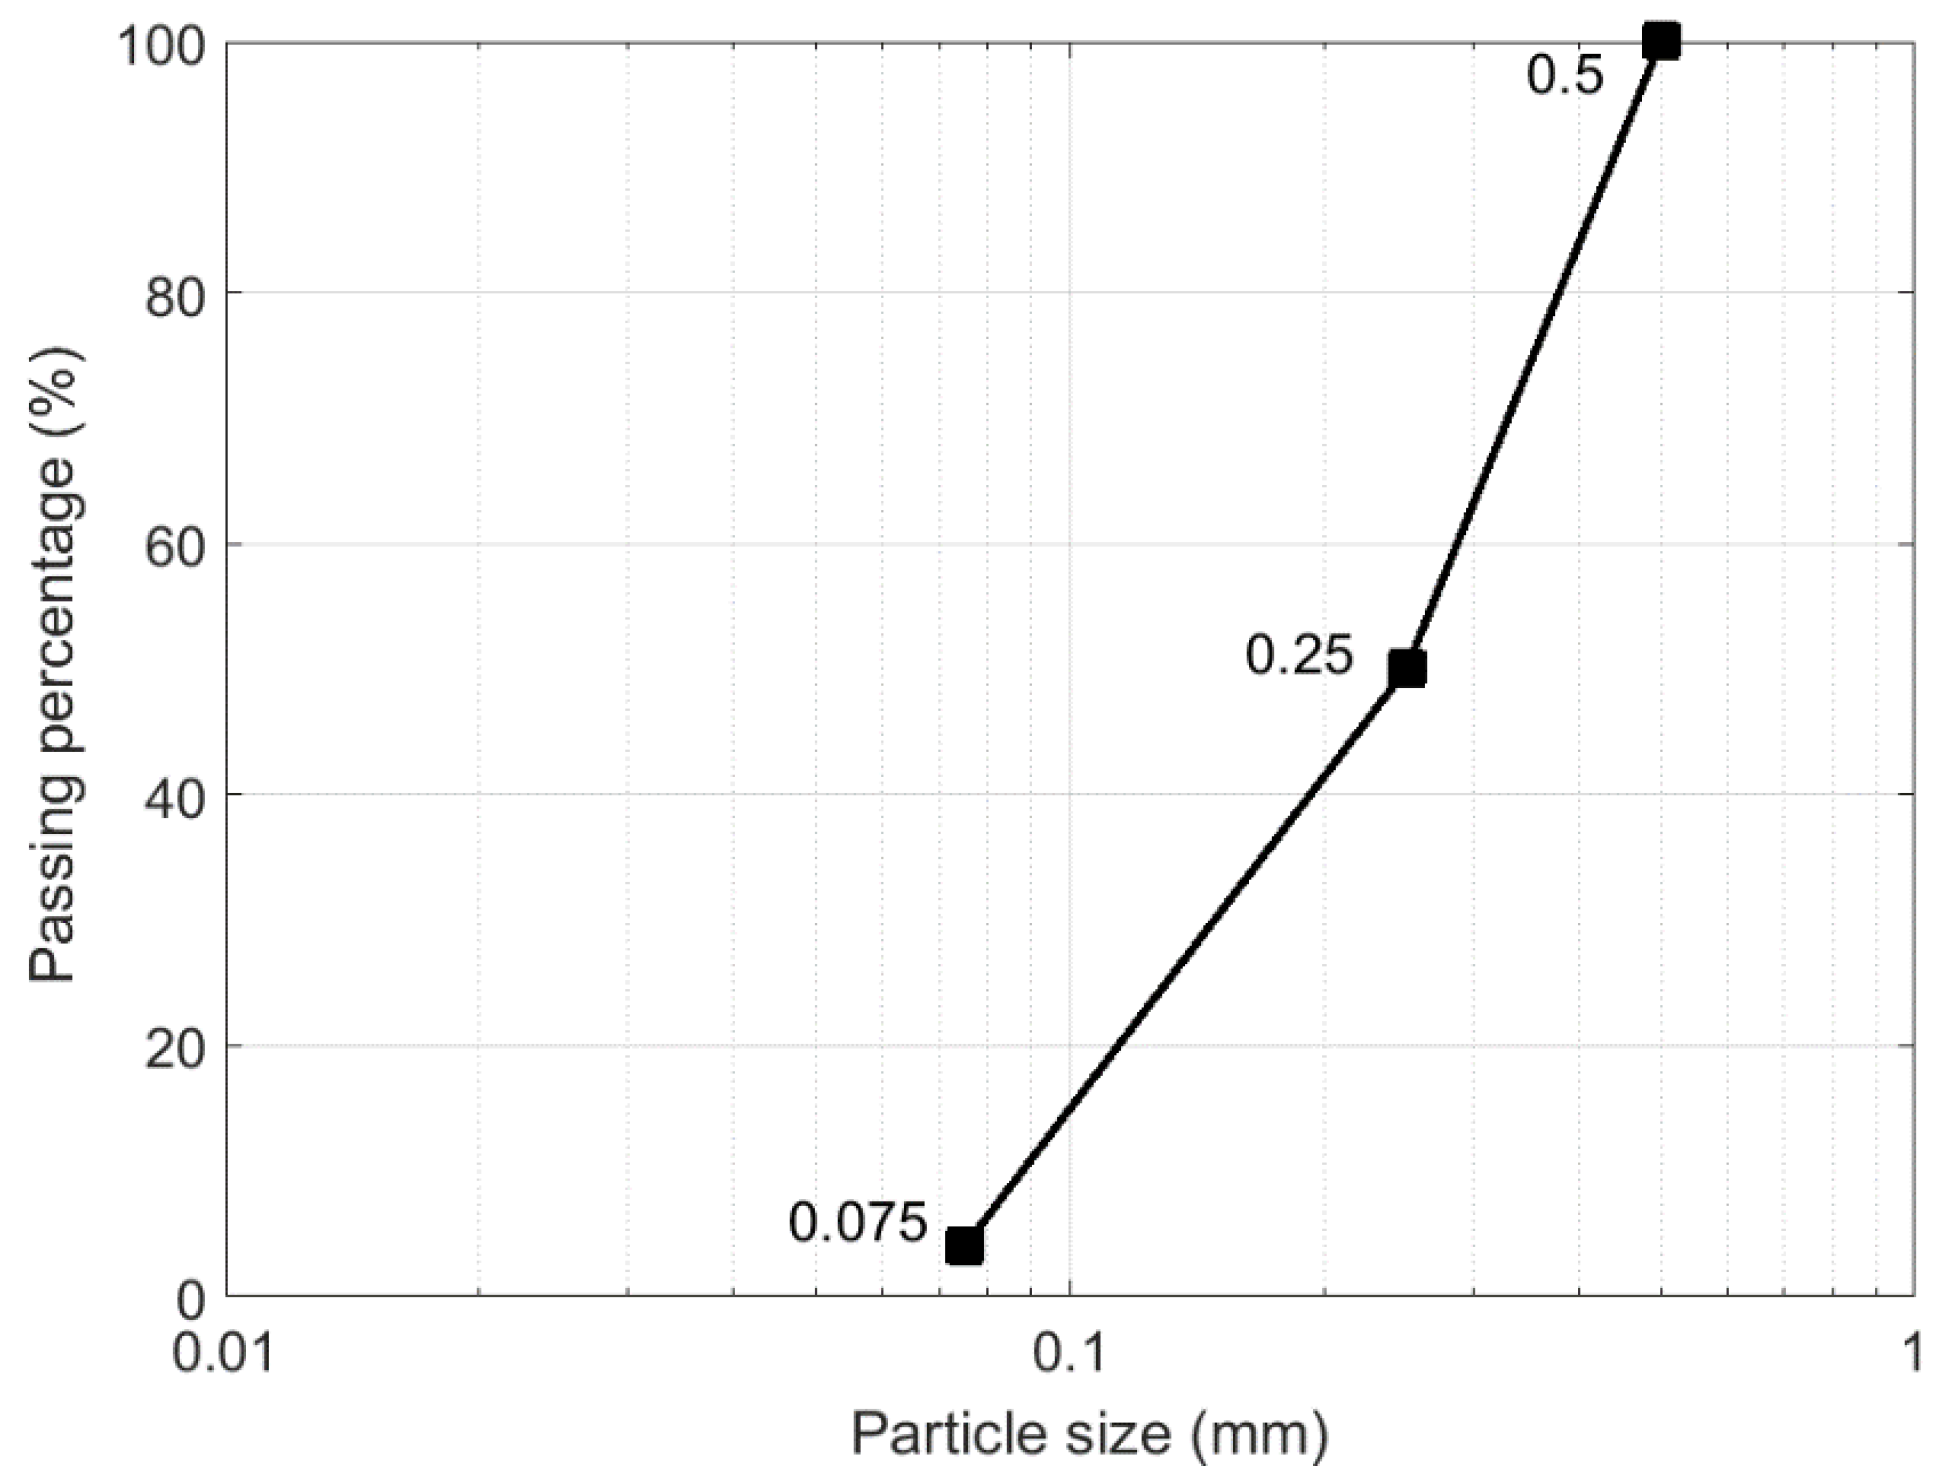
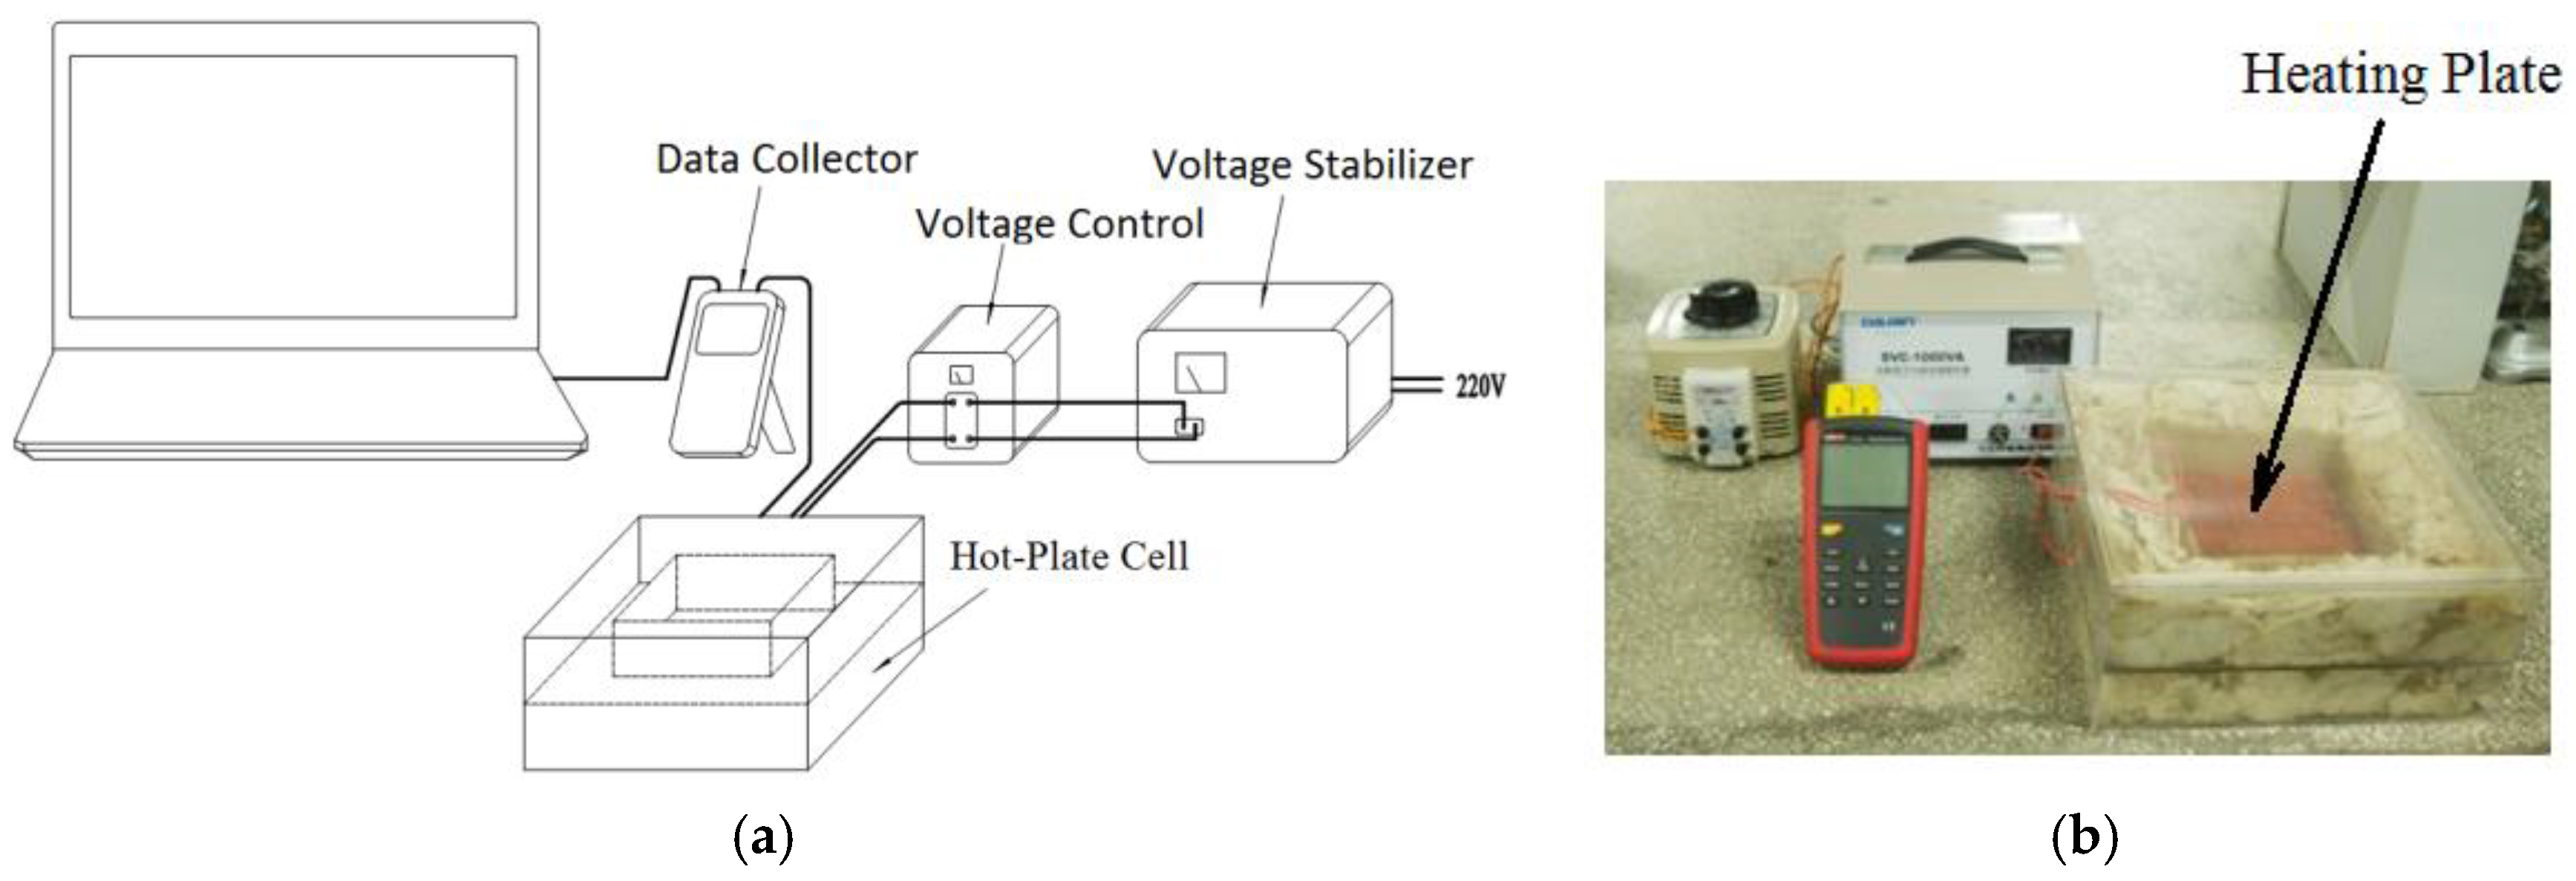
2.2. Materials and Setup

The soil specimens were prepared using the sands from a construction site in the Taiyuan city, Shanxi province in China. The sands had over 99% quartz content and a density of 2.66 g/cm3. The sands were at first heated for 24 h under 105 °C and then sieved in laboratory. Thereafter, the sands used for the test were formulated, using different particular particle sizes following the standard [25], to have a medium size. The particle size distribution of the formulated sands is showed in Figure 2, which is similar to that of the sample D in the work of Chen [18] and the Ottawa C-190 in the work of Tarnawski et al. [16]. Afterwards, the oven dry sand was spread out and had water added to reach four different water contents, 5%, 10%, 15%, and 20% in terms of the gravimetric weight of the dry sands. The sands and water were mixed extensively to maximize an even water distribution. Later, the sands of four different water contents were transferred respectively into four individual airtight containers where they stayed for 24 h without any disturbance to reach a stable water distribution situation. It was found, after the 24 h static stay, that the sand with 20% water content had a water film on the top surface. This was taken as a sign of a fully saturated state. Finally, each of the sands was evenly divided into seven parts (about 1 kg per part), which were thereafter put into stainless containers of the size of 150 mm (width) × 150 mm (depth) × 200 mm (height) one by one forming layers. After adding one layer, the sands in the container were impacted, using a 1 kg hammer falling from 0.05 m height above the top surface of the sands and the applied forces were 70, 210, 350, and 490 N, respectively, at four evenly distributed positions ensuring coverage of the total top surface of the sands in each container. Before adding a new layer, the compacted surface was ploughed to ensure a full integration between layers. A total of seven layers were added into one container. At the end, a specimen of water content and porosity was taken for each container, and the bulk dry density of the prepared specimens was measured. It was found that the bulk dry densities of all the specimens compacted under a certain force but having different water contents were very close. The relative variation against their average value is less than 3.6%. So, in this paper, it is assumed that the specimens of different water contents had the same porosity after been compacted using the same force. The porosity was calculated using the equation below:
n = 1 ρ d ρ s
where n is the porosity, ρd is the bulk dry density of formulated sand specimens, and ρs is the density of sand particles (ρs = 2.66 g/cm3).
The thermal conductivity was measured using both needle probe and hot-plate methods. In the test using the needle probe method (Figure 3), five measurements were taken at five different locations evenly distributing along the top surface of each specimen using five probes at the same time. The final result took the average of the five measurements. Before the test, the needle probe was calibrated in glycerol (C3H8O3) of 99% purity. The technical parameters of the needle probe are listed in Table 1. Table 2 shows the calibration result of the five needle probes used, with a maximum absolute error of 0.005 which is negligible compared to the measured value.
Figure 4 shows the hot-plate measuring system used in the test. The hot-plate cell is the core part, which consisted of a container, two heating plates, and thermal insulation wools. The container was made of acrylic boards and had dimensions (width by depth by height) of 270 mm × 270 mm × 120 mm, respectively. Claps and slots were fitted in it to secure the two heating plates to stay at the central position. The two heating plates were made of the copper constantan of a high electrical resistivity of 484 Ω. Each of them had the dimension (width by depth by thickness) of 150 mm × 150 mm × 20 mm, respectively. The soil specimen placed between the two plates had a thickness of 10 mm. A thermocouple with an accuracy of ±0.1 °C was attached on the cooling plate on the top of the measured soil specimens. At the start of each test, the two heating plates had a temperature difference less than 0.1 °C. Each test lasted for 44 min to ensure a steady state was reached, and data was recorded every minute.

2.3. Experimental Results

Figure 5 shows the plot of the results of the measured thermal conductivity of the specimens at different porosities and the water contents of 0%, 5%, 10%, and 15%, respectively. It shows that the measurements using the needle probe method and those using the hot-plate method are in a good agreement at low water contents. In the range of four water contents, the measurements of the probe method present a more stable and consistent trend in variation. It can be seen that two curves of the hot-plate measurements crossed at high water content and porosity. This result may be related to the moisture migration in the tests using the hot-plate method. The comparison demonstrates that the needle probe method is more suitable for unsaturated soils and can provide good accuracy. In conclusion, all the modelling, analyses, and discussion in the rest of the paper will use the data of the needle probe method. Compared with similar sands, the sample D of Chen [18] and the Ottawa C-190 of Tarnawski et al. [16], it can be noticed that the measurements in this study are very close to the two previous studies at the fully dry condition. For example, all the sands in the three studies have a similar thermal conductivity of about 0.3~0.4 Wm−1·K−1 at the porosity of about 0.4~0.5 at the dry condition. This demonstrates in another way that the three compared sands are quite close in composition and particle distribution. However, it is also noticed that at other unsaturated and fully saturated states, the thermal conductivity of the specimens in this study is much smaller than that of the two similar samples of Chen [18] and Tarnawski et al. [16]. For example, at porosity of 0.466, the fully saturated specimen of this work has a thermal conductivity of 1.6 Wm−1·K−1, however, the fully saturated thermal conductivity of the sample D of Chen [18] is about 2.46 Wm−1·K−1 at porosity of 0.43, while the fully saturated thermal conductivity of the Ottawa C-190 of Tarnawski et al. [16] is about 3.4 Wm−1·K−1 at porosity of 0.4. The big difference is attributed to the difference in pore size distribution of the used specimens because this study took a significantly different preparation procedure from that of the two previous studies.
Figure 5 also shows that at 0% water content the variation of porosity presents the smallest influence on the thermal conductivity. This can be explained in that the air content in soils has no significant effect on the thermal conductivity due to its own low thermal transfer capacity. It is noticed that water thermal conductivity is about 0.6 (W/(m·°C)) and air thermal conductivity one order of magnitude less and near 0.024 (W/(m·°C)) at 25 °C. Therefore, the higher the water content level, the more the conductive phase in the pore space and consequently the greater the thermal conductivity. For that of the 5% and 10% water contents, the thermal conductivity decreases relatively quickly with increasing porosity at the low porosity region. This may be related to the water condensation, the phase change from vapour to liquid, and the capillary effect in the small pores at low porosity. The condensed water bridges the void spaces between soil particles. With increasing porosity, the pore size will increase correspondingly, and, as a result, the capillary condensation effect will decrease. When many of the pores have reached a critical value in size, the capillary effect will become too small to be easily noticed. This observation is supported by the 15% water content result, which shows that the thermal conductivity decreases with the increase of porosity in an approximate straight line (needle probe method), when there is little variation in the capillary condensed water, and increase in the air content with the increasing porosity.
Figure 6 shows the variation of the thermal conductivity, measured using the needle probe method, against the water contents and degrees of water saturation at different porosities. It can be seen that initially with water increases from 0% to a relatively low content (10%), the thermal conductivity increases in an approximately linear trend. Thereafter the linear increasing trend starts to decrease until the content of 15%. The initial linear increase of thermal conductivity with the increase of water content from 0% to 10% can be explained by the fact that the initial water forms an evenly distributed water film coating on all pore surfaces of a constant surface area. The initial water content increase corresponds to the water film thickness increase which gives a linear relation to thermal conductivity. When the water reaches a certain level, more pore water occupies the pore volume space due to the capillary condensation. In this situation, the ratio of the water volume to the pore surface area decreases, and, as a result, the rate of the thermal conductivity increase drops off because the increased mass of water increases the local thermal capacity. Theoretically, the thermal conductivity will reach a constant value when soil becomes fully saturated. Figure 6 shows that the thermal conductivity is slightly higher at the water content of 20% than 15%. This can be explained that in the range of 15%~20%, free water starts to occupy the central region of the pore spaces up to full saturation, a situation in which the thermal conduction is further enhanced by a better connected pore water network.

3. Modelling

3.1. Previous Research

Mathematical characterisation and modelling of soil thermal conductivity under different structural and physical conditions have been a consistent interest in research. Dong et al. [26] reviewed all the major soil thermal conductivity models and compared their performance. These models were classified into three groups: mixing model, empirical model, and mathematical model. Mixing models take soils as a mixture of three elementary phase components, solid particles, water, and air. The effective bulk soil thermal conductivity depends on the individual thermal properties of these elementary components and their arrangement in soils, which takes two typical forms, in series and in parallel. The empirical models have little physical foundation, while the mathematical models compare the thermal conductivity to other physical properties, such as electrical conductivity [27]. In terms of the tests on varied soils, including sands, silts, and clay, it has been found that both the mixing and mathematical models demonstrated an underperformance in general, because it is difficult to adequately represent all the material characteristics related to the thermal conductivity of soils, such as the particle geometry, pore size distribution, and the configuration of the water bridges between particles or at the pore necks/throats. Recently, other new methods considering the involved underlying physics have also been investigated. Tarnawski and Leong [28] put forward an improvement for the geometrical mean model proposed by Woodside and Messmer [19] by introducing an inter-particle thermal contact resistance factor to reflect the interaction between the involved three phases (i.e., soil solids, water, and air). Ghanbarian and Daigle [29] presented a percolation-based effective-medium approximation (P-EMA) model, in terms of the properties of the elementary phases, a scaling exponent, and a percolation threshold. It has been concluded that the thermal conductivity under fully and partially saturated conditions conforms to non-universal behaviour. Likos [15] predicted and compared the thermal conductivity and water retention curve of unsaturated soils based on the water configuration retained in an idealized unit representative pore formed in a simple cubic pack of same sized spheres. Taking soils as a fractal structure to estimate the thermal conductivity has also been an effective approach [30]. Xiao et al. [31] made new progress in this direction.
So far, there has not been a comprehensive model able to effectively describe and generally define all the major underlying mechanisms involved in soil thermal conductivity. In practice, fitting empirical models to experimental data is still the most effective and popularly way employed for real world applications [32,33]. Farouki [34] has given a comprehensive review on soil thermal conductivity empirical models. Later, Misra et al. [35] and Tang et al. [14] updated the list covering other new developments. All of these models, however, were reported and tested on specific soils. Each of them had a limit of application. So far there has not been an accepted model generally applicable on a wide range of soil types, porosities, and water contents. The recent review by Dong et al. [26] has compared the empirical models proposed by Kersten [36], Johansen [37], Cote and Konrad [38], Lu et al. [39], and Chen [18]. It showed that although these models had demonstrated better performance than the mixing and mathematical models, they generally largely underestimated the thermal conductivity of sands. In the next section of this paper, two of the principal types of empirical models for sands are compared against the experimental data of this work. One type has a power function form and the other type an exponential function form. To investigate their range of application on different soils, the two types of model families are at first characterized into two general forms without specified constant values. The two characterized forms are then compared to model the experimental data of this paper. Finally, based on the recognition that an intrinsic relation between the water retention and thermal conductivity characteristics of unsaturated soils is established on the soil pore size distribution, this paper investigates the use of a water retention characteristic model to describe the thermal conductivity. The performance of this so-called unified model is tested on the experimental data and compared with the preceding two characterized empirical model forms.

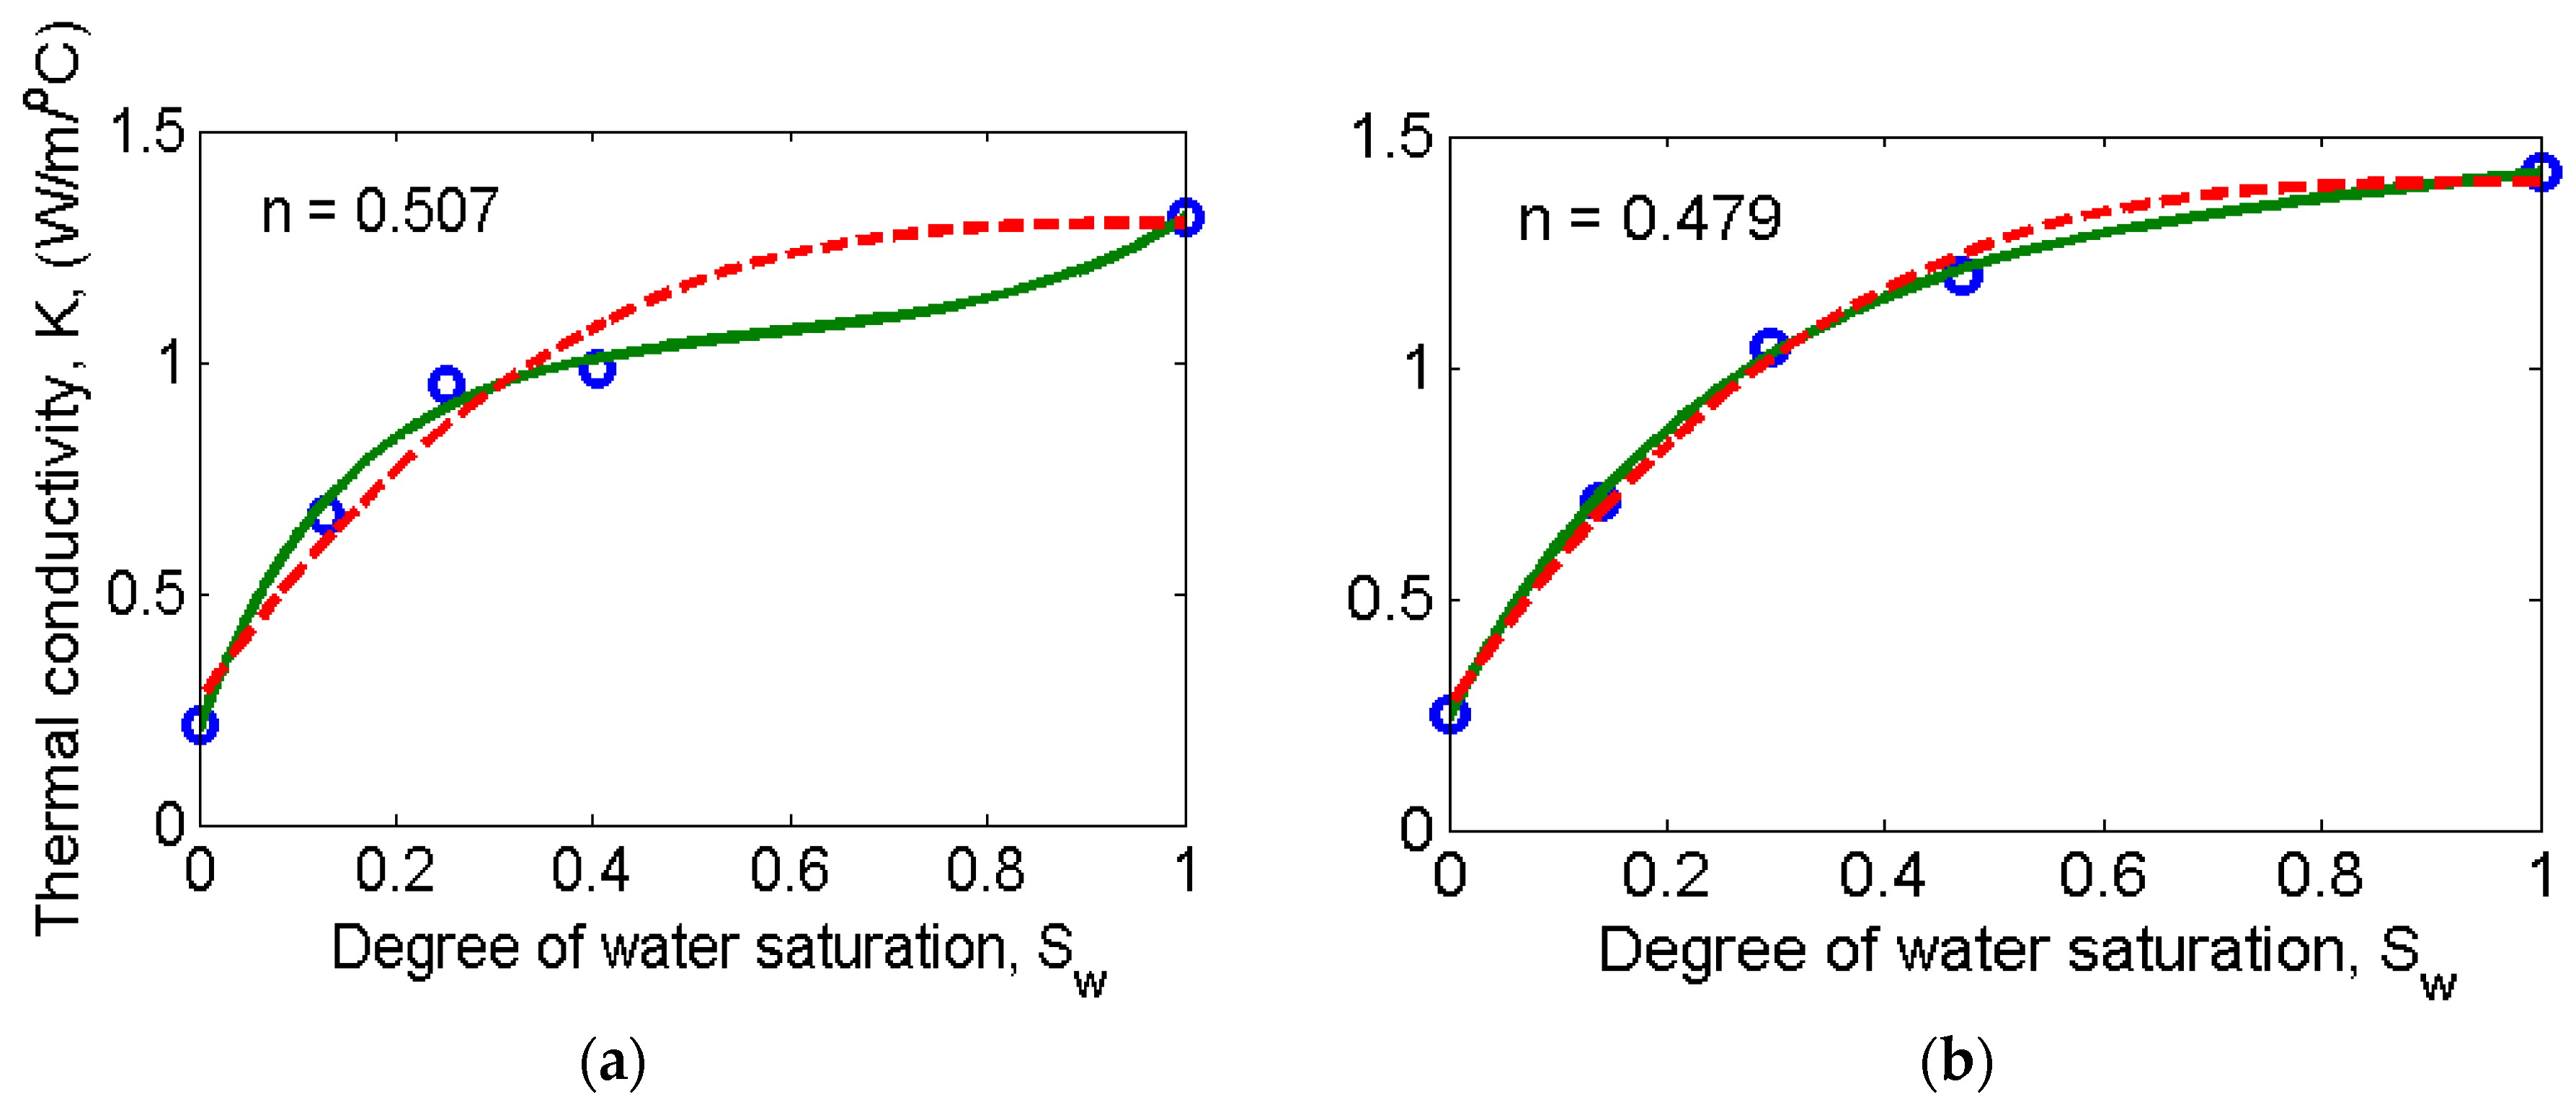
3.2. Comparison of Two Major Types of Empirical Model

Ould-Lahoucine et al. [40] used the following Equation (2) to model the thermal conductivity of bentonites,
K = K d r y { 1 + [ ( 9.75 n 0.706 ) S w ] 0.285 n + 0.731 }
where Kdry is the dry soil thermal conductivity, and n and Sw are the porosity and the degree of water saturation, respectively. Later, Chen [18] proposed a similar model in the form of Equation (3) for sandy soils.
K = K w n K s 1 n [ ( 1 b ) S w + b ] c n
where Ks is the solid thermal conductivity, and Kw is the water thermal conductivity. Mathematically, these two forms may be characterised into a general expression as Equation (4).
K = K 0 [ 1 + ( a S w ) b ]
K 0 = k 0 k 1 n
a = a 1 n + a 0
b = b 1 n + b 0
where K0 and a and b are three parameters related to porosity, n, and k0, k1, a0, a1, b0, and b1 are six constants, which can be regarded to depend all together upon the soil nature, elementary material properties, pore structure, and pore water configuration.
Donazzi et al. [41] proposed the following exponential formula for the thermal conductivity of different soils:
K = K w n K s 1 n exp [ 3.08 n ( 1 S w ) 2 ]
Later, Lu et al. [39] proposed a similar model, given by Equation (6) below, and tested it on a wide range of soils,
K = [ K w n K s 1 n ( b a n ) ] exp [ c ( 1 S w c 1.33 ) ] + ( b a n )
These two models may also be characterised into a general mathematical formula as:
K = K 0 exp [ a ( 1 S w ) b ] + c
K 0 = k n + c
a = a 1 n + a 0
b = b 1 n + b 0
c = c 1 n + c 0
where K0 and a, b, and c are four parameters related to porosity, n, and k, a1, a0, b1, b0, c1, and c0 are seven constants, which depend together on the soil nature, elementary material properties, pore structure, and pore water configuration.
Figure 7 compares the modelling results using the two characterized general forms to fit the measured thermal conductivity of the sands in this work at varied degrees of pore water saturation and porosities. The degrees of water saturation are calculated in terms of the results in Figure 6 and the intrinsic relationship:
S w = w ρ d r y n ρ w
where w is the water content, ρdry is the dry density of samples, and ρw is the water density. Figure 8 and Figure 9 show the fitting results using the parameter functions, Equation (4b–d) and Equation (7b–e), to describe the variation of parameters, K0, a, b, and c, against the porosity.
Figure 7 shows that both Equations (4) and (7) have produced comparable results of the modelling thermal conductivity against water saturation, for all the four porosity magnitudes, in terms of the agreement with the experimental measurements. Figure 8 shows that the predicted variation of the introduced parameters in Equation (4) against the porosity has presented good accuracy. However, for Equation (7), Figure 9 shows that the variation of the introduced parameters against the porosity does not display an accountable correlation, where the parameter formulas are unable to fit all of the four parameters at different porosity magnitudes. The comparison result suggests that the form of Equation (4) is more simple and flexible than Equation (7), and may work for a wider range of soils.

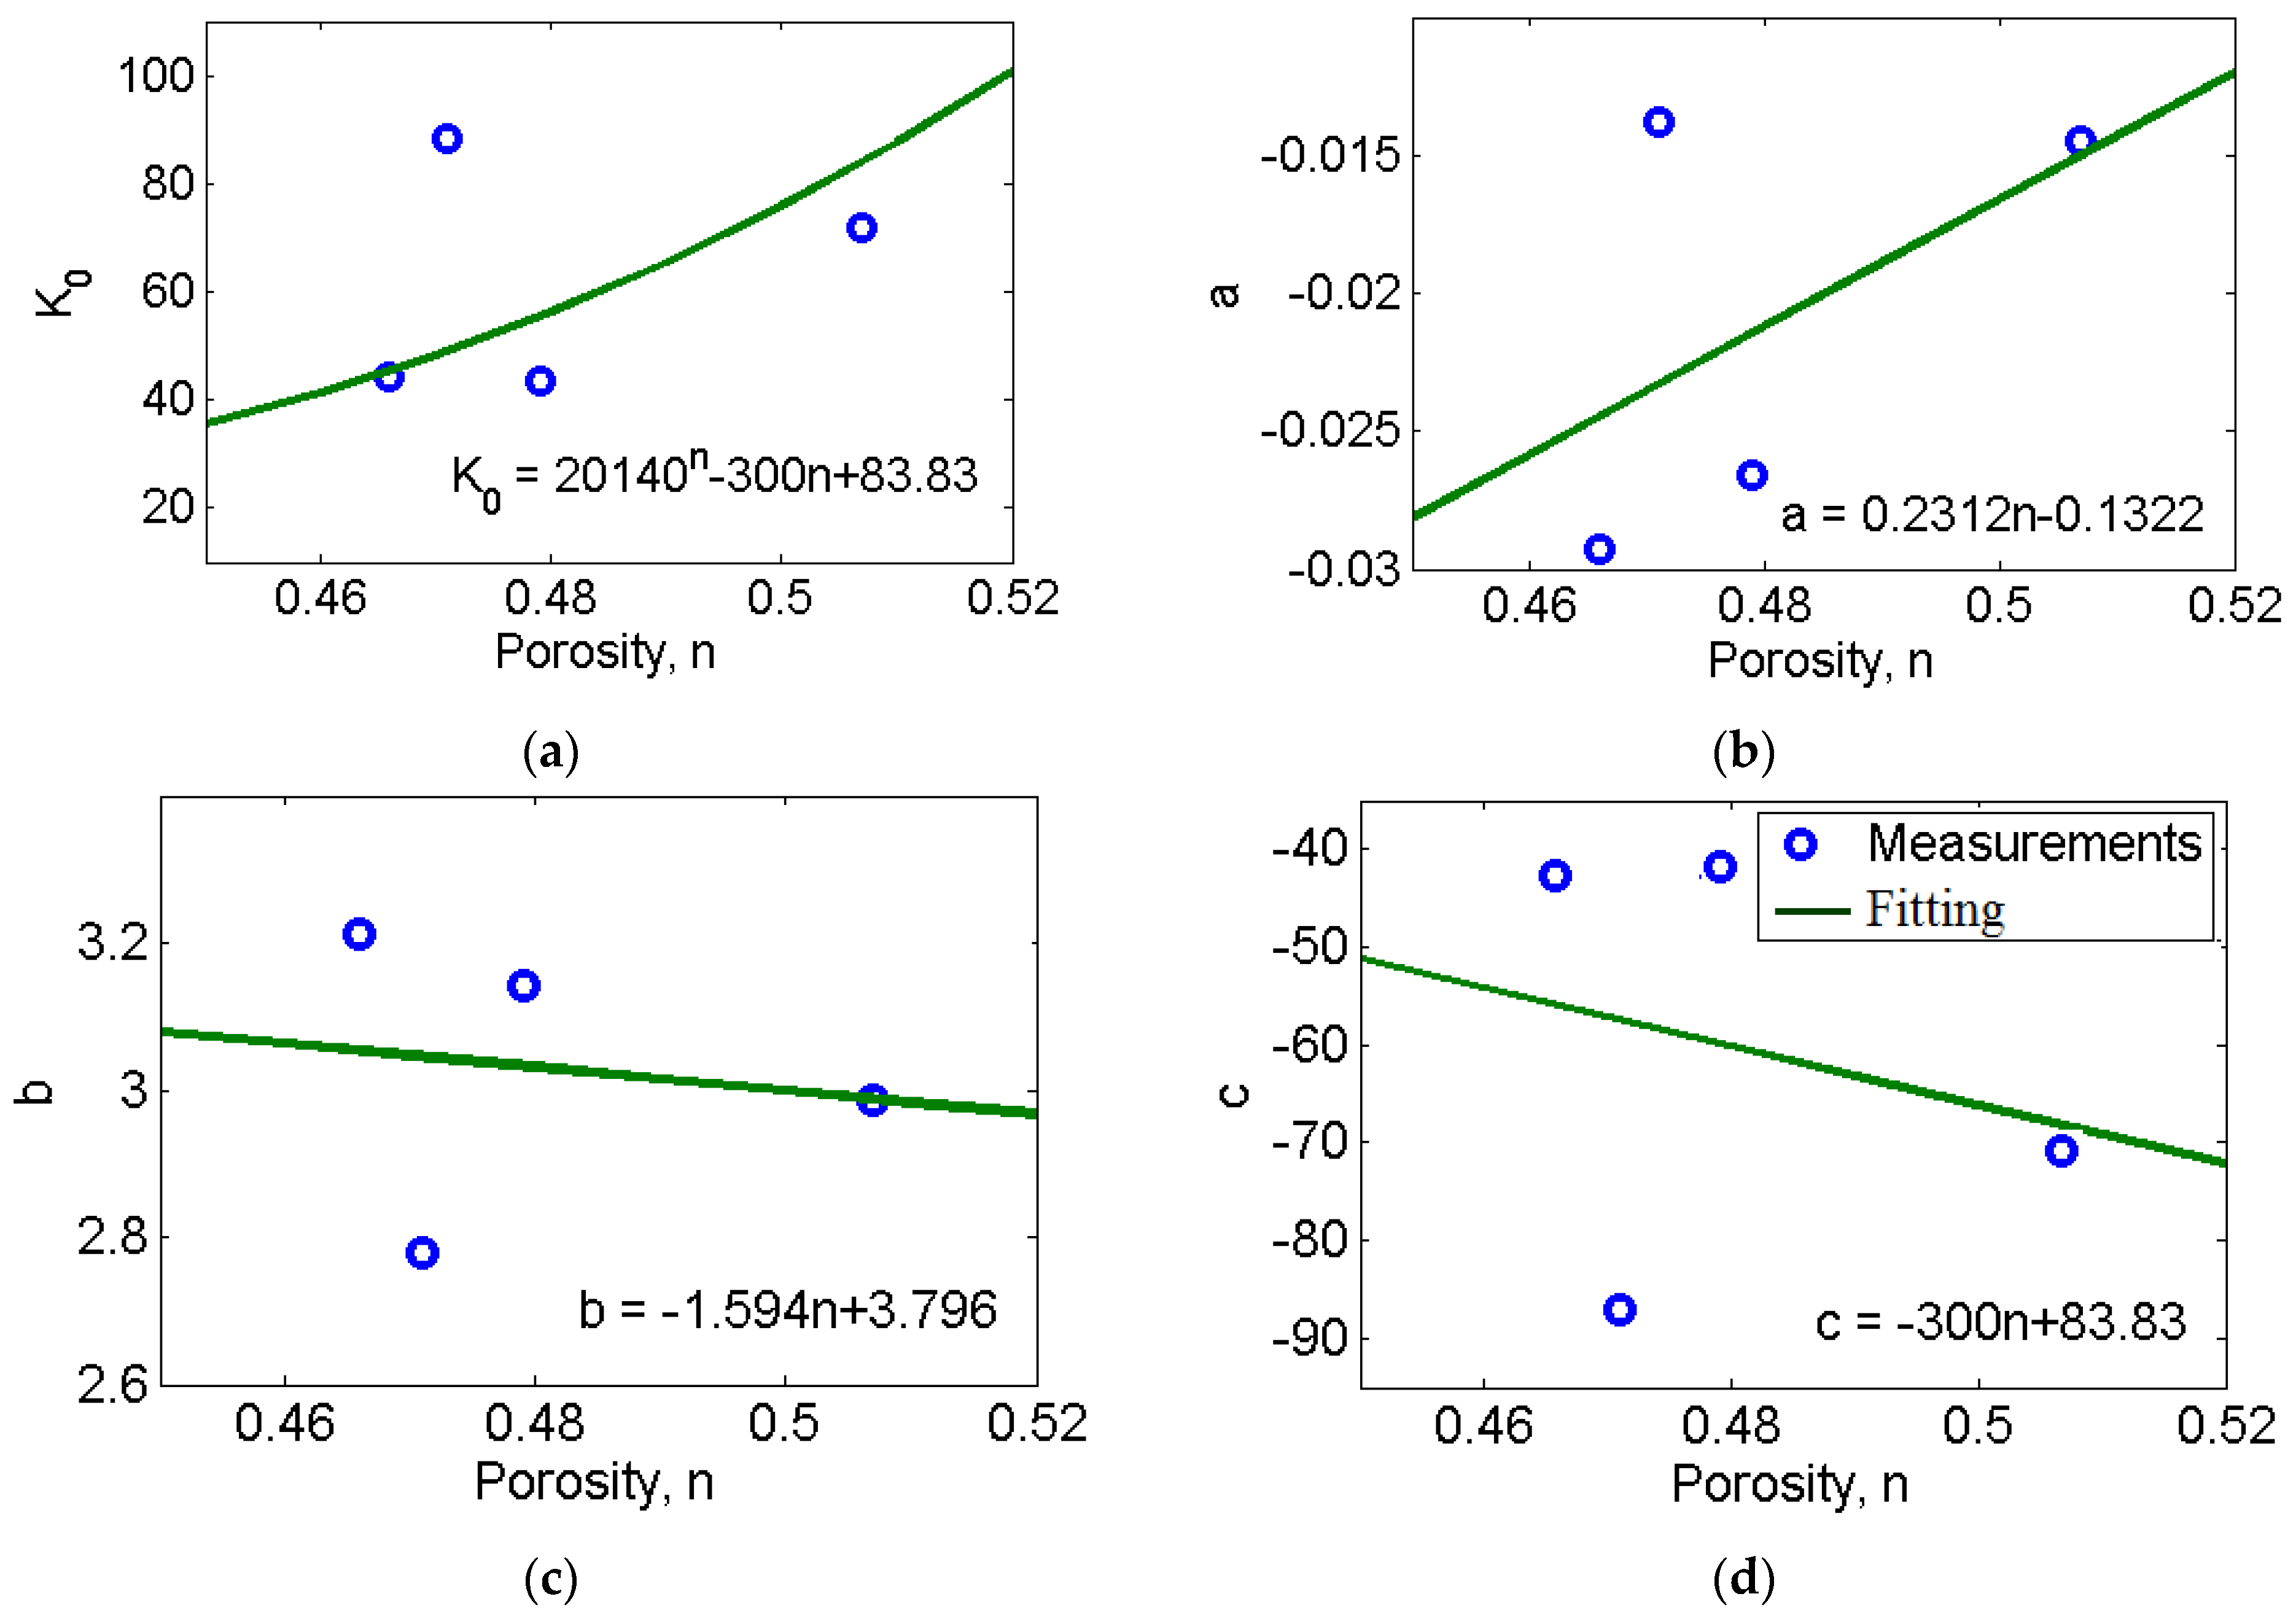
3.3. A Unified Thermal Conductivity and Water Retention Model

In order to investigate the intrinsic relationship between thermal conductivity and water retention characteristic—it is noted that both are linked to the pore water distribution and the pore size distribution in soils—this paper tries to use an analytical water retention model proposed by [42,43,44,45] to describe the thermal conductivity of soils at different water contents. The analytical water retention model takes account of the multiphase interaction in pores, and describes the respective behaviour of the coexisting water phase and vapor phase in a pore system in terms of the fundamental interfacial physics and the classical capillary theory.
In terms of surface phenomena, fluids retained in porous media could be regarded as being adsorbed on pore wall surfaces because chemical and physical interactions exit at their interfacial region due to the inter atomic and molecular attraction forces, known as the Van de Waals forces [42,44,45]. These forces will modify the chemical potential of the adsorbates (the fluids) at the interfacial region referring to their free bulk phase value. The chemical potential change is called Lennard–Jones (LJ) potential energy [46], which can be approximately defined as a function of the distance from adsorbed fluid molecule to the substrate surface (pore wall surfaces) and takes a pair-wise summation of all interaction forces between the fluid molecule and the solid atoms. Figure 10 illustrates that pore water resides on pore surface. The average LJ potential energy of the water film on the substrate surface can be expressed as a function of the fluid thickness above the substrate surface as [47]:
Δ u w = A m h 3 + A e h 2 + A s h
where Δuw is the LJ potential energy of the water film on substrate surface, and Am, Ae, and As are three constants related to the nature of the interfacial interaction.
On the other hand, the chemical potential change (the LJ potential energy) of the adsorbate fluids on a substrate surface can also be evaluated using the Kelvin equation. Finally, the intrinsic pressure of the adsorbed fluids on substrates can be expressed in terms of the following equation [43]:
p w = p Δ u w d + p v g = Δ u w V w m + p 0 exp ( Δ u w R T )
where pw is the average intrinsic pressure of the water on the surface, Δ u w is the average intrinsic molar potential change (the LJ potential energy) of the fluid of a thickness h, which is defined as Δ u w = 1 h 0 h Δ u w z ( z ) d z (or estimated by Equation (9)), where Δ u w z ( z ) is the water molar molecule potential change at position z above the substrate surface, and Vwm is the molar volume of the water phase. R is the gas constant; T is the temperature, p0 is a normal pressure. The pw consists of two components, p Δ u w d = Δ u w V w m is called the disjoining pressure [48], and p v g = p 0 exp ( Δ u w R T ) is called the gauge pressure which is equal to the pressure of the surrounding equilibrium vapour. Wang et al. [45] suggested the use of the gauge pressure to describe the state of the fluids residing in porous media at the pore scale. In unsaturated soils, it can be applied on the water and vapour phases coexisting in pore space, respectively, in terms of water content [44]:
p w = p 0 exp ( Δ u w R T ) = p 0 exp ( Δ u w f S w + Δ u w 0 R T ) = p 0 exp ( Δ u w 0 R T ) exp ( α S w )
p v = p 0 exp ( Δ u v R T ) = p 0 exp ( Δ u v f ( 1 S w ) + Δ u w 0 R T ) = p 0 exp ( Δ u w 0 R T ) exp ( β ( 1 S w ) )
where ∆uw and ∆uv are the average intrinsic molar potential change (the average LJ potential energy) of the water and vapour phases, respectively. Δ u w f and Δ u v f are the average LJ potential energy of the water and vapour phases at the two states when the soil is fully water saturated and when all the pore water has just been fully drained, respectively. They depend on the average pore size and the nature of the respective interfacial interaction of the pore water and vapour phases with the solid phase at the pore wall surface. α = Δ u w f R T and β = Δ u v f R T . Δ u w 0 is the initial chemical potential change of the first bulk water starting to fill the initially empty pore space under the effect of capillary condensation (i.e., the chemical potential change of the initial water molecular film on the totally empty pore surface just at the start filling pores (Wang 2010)). Sw is the degree of water saturation. Equation (11) defines the water and vapour states at the pore scale. Introducing in the volume average theorem to upscale the two state equations from pore scale to bulk material scale, the average pore pressure of the water and vapour phases in unsaturated soils can be described as:
p w = 1 V p o r e 0 V w p w d V w = 1 V p o r e 0 V p o r e S w p 0 exp ( Δ u w 0 R T ) exp ( α S w ) d ( V p o r e S w ) = 0 S w p 0 exp ( Δ u w 0 R T ) exp ( α S w ) d S w = λ 1 α [ exp ( α S w ) 1 ]
p v = 1 V p o r e 0 V v p v d V v = 1 V p o r e 0 V p o r e ( 1 S w ) p 0 exp ( Δ u w 0 R T ) exp ( β ( 1 S w ) ) d ( V p o r e ( 1 S w ) ) = 0 ( 1 S w ) p 0 exp ( Δ u w 0 R T ) exp ( β ( 1 S w ) ) d ( 1 S w ) = λ 1 β [ exp ( β ( 1 S w ) ) 1 ]
where p w and p v are the volume average pore pressure of the water and vapour phases in unsaturated soils, respectively. λ = p 0 exp ( Δ u w 0 R T ) is a redefined constant. The Equation (12) can be used to describe the water retention characteristic of unsaturated soils, the constitutive relation between the matrix suction, or capillary pressure and the water content. In conventional, matric suction is taken as the pressure different between the pore air (vapour) and pore water phases coexisting in soils, i.e.,
s = p c = ( p w p v ) = ( λ 1 α [ exp ( α S w ) 1 ] λ 1 β [ exp ( β ( 1 S w ) ) 1 ] ) = λ α λ β λ ( 1 α exp ( α S w ) 1 β exp ( β ( 1 S w ) ) )
where s is the matric suction, p c is called capillary pressure of bulk soils. At last, Equation (13) may be rewritten in a simplified form as:
p c = φ 0 + P 0 [ exp ( α S w ) exp ( β ( 1 S w ) ) ]
where ϕ0, P0, α, and β are four redefined parameters related to the pore structure and the nature of all the material phases involved.
Equation (12) describes the state of the coexisting water and vapour phases in unsaturated soils in terms of their interaction with the solid phase at the interface. The derived Equation (14) has been successfully used to describe the water retention characteristic of unsaturated soils and building materials [42,44,45]. It has been demonstrated that Equation (14) is able to represent the water distribution and the pore size distribution in porous media. Considering that the thermal conductivity of unsaturated soils is influenced by both the heat transfer at the interface between the soil particles and the fluids retained in pores, which relates to the water distribution in the pore system, and with the noticed resemblances between the variation of thermal conductivity against water content and water retention characteristic curves, this paper applies Equation (14) for thermal conductivity modelling. To avoid confusion, Equation (14) is rewritten in the following form given by Equation (15) as
K e f f = λ 0 + K 0 [ exp ( α S w ) exp ( β ( 1 S w ) ) ]
where Keff is called the effective thermal conductivity, λ0, K0, α, and β are four redefined parameters depending on the pore structure and the material nature of all phases.
Figure 11 compares the modelling results using Equations (4) and (15) for the reported experiment data of this paper, respectively. It can be seen that Equation (15) gives impressively close agreement to the experiment data in comparison to Equation (4) in all of the four cases of different porosities. Table 3 lists out the values of the four parameters defined in Equation (15). This suggests that Equation (15) can be used as a unified model for both the thermal conductivity and water retention characteristics of unsaturated soils. However, a deeper understanding the underlying mechanisms of the model working for the two constitutive soil properties and verification on a large experimental data of different soils still need to be studied, and represent continuing research.

4. Conclusions

From the reported experimental work, modelling, and discussion, the following conclusions can be drawn:
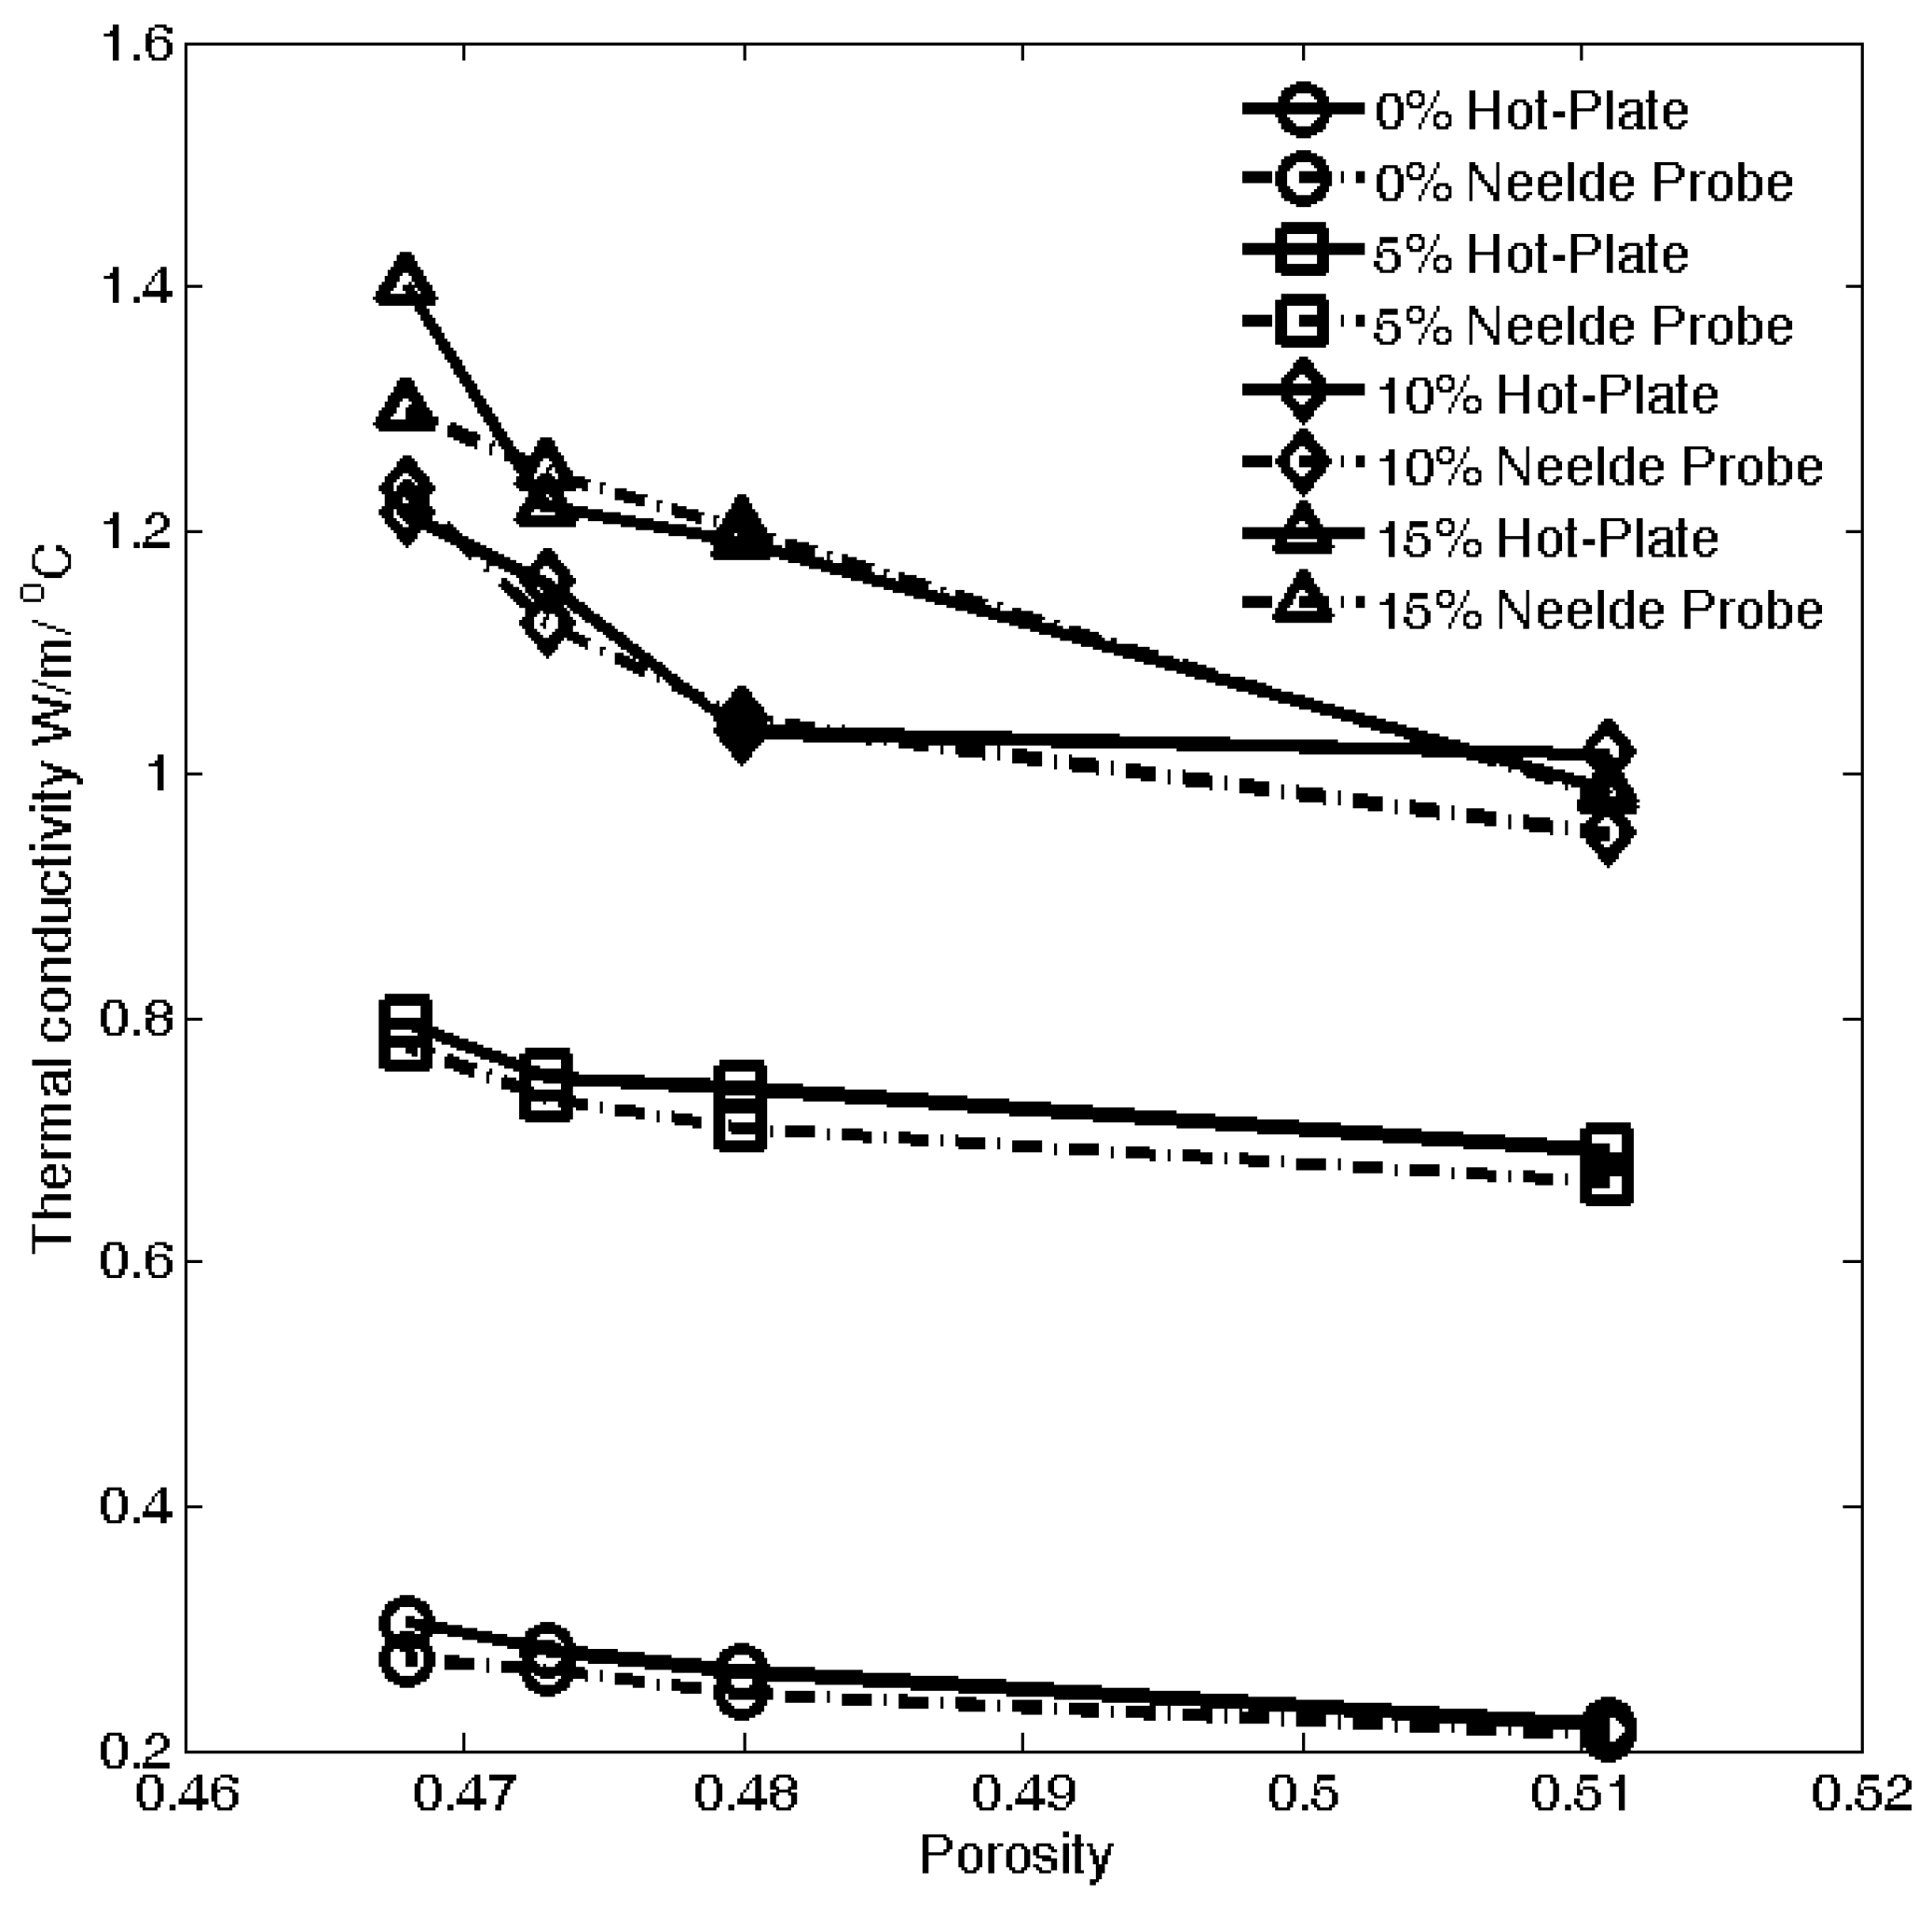
  • The needle probe method provides a convenient and accurate approach to measure unsaturated soil thermal conductivity.
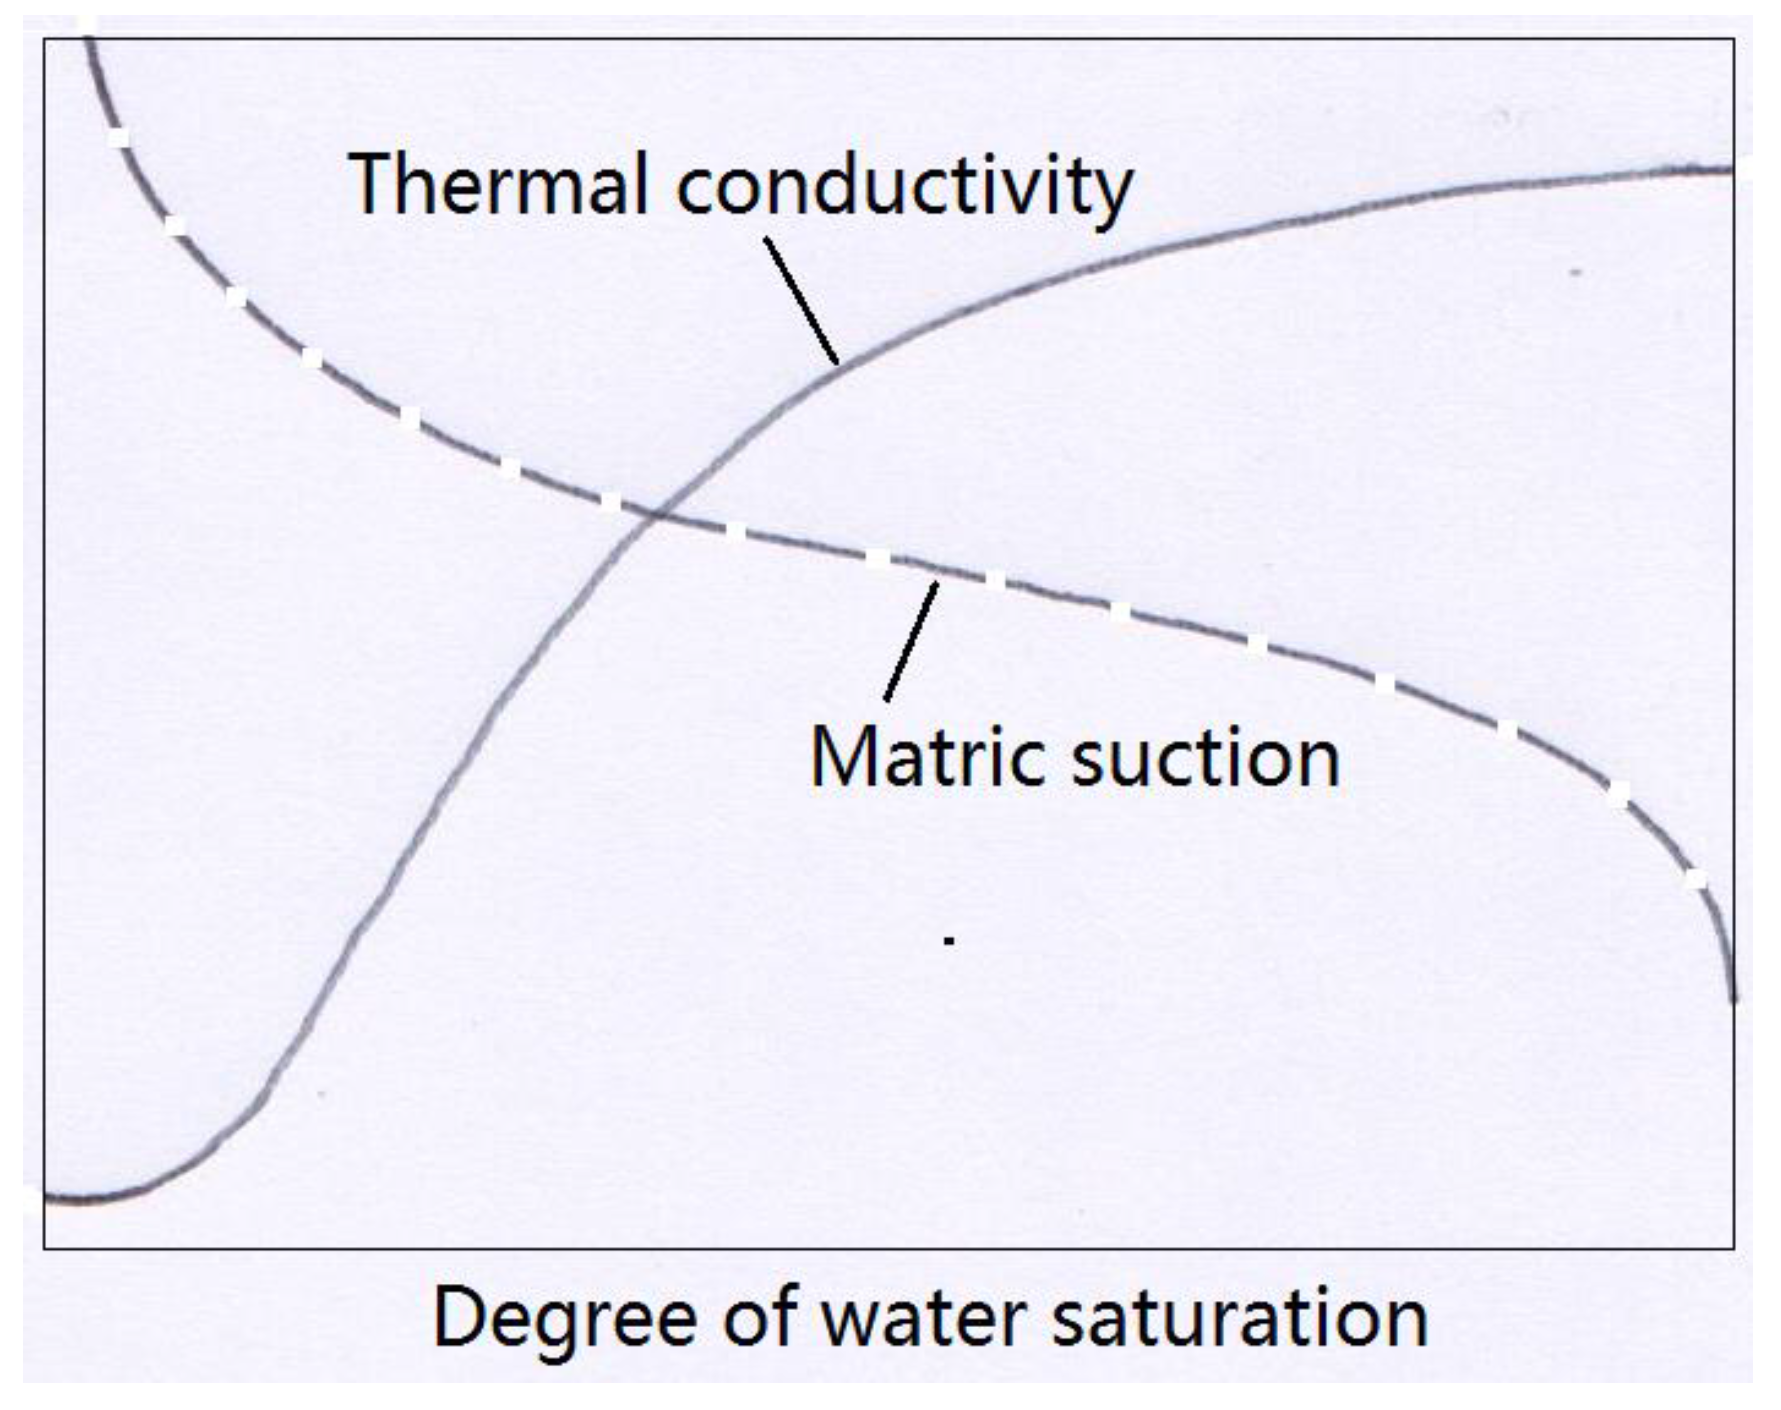
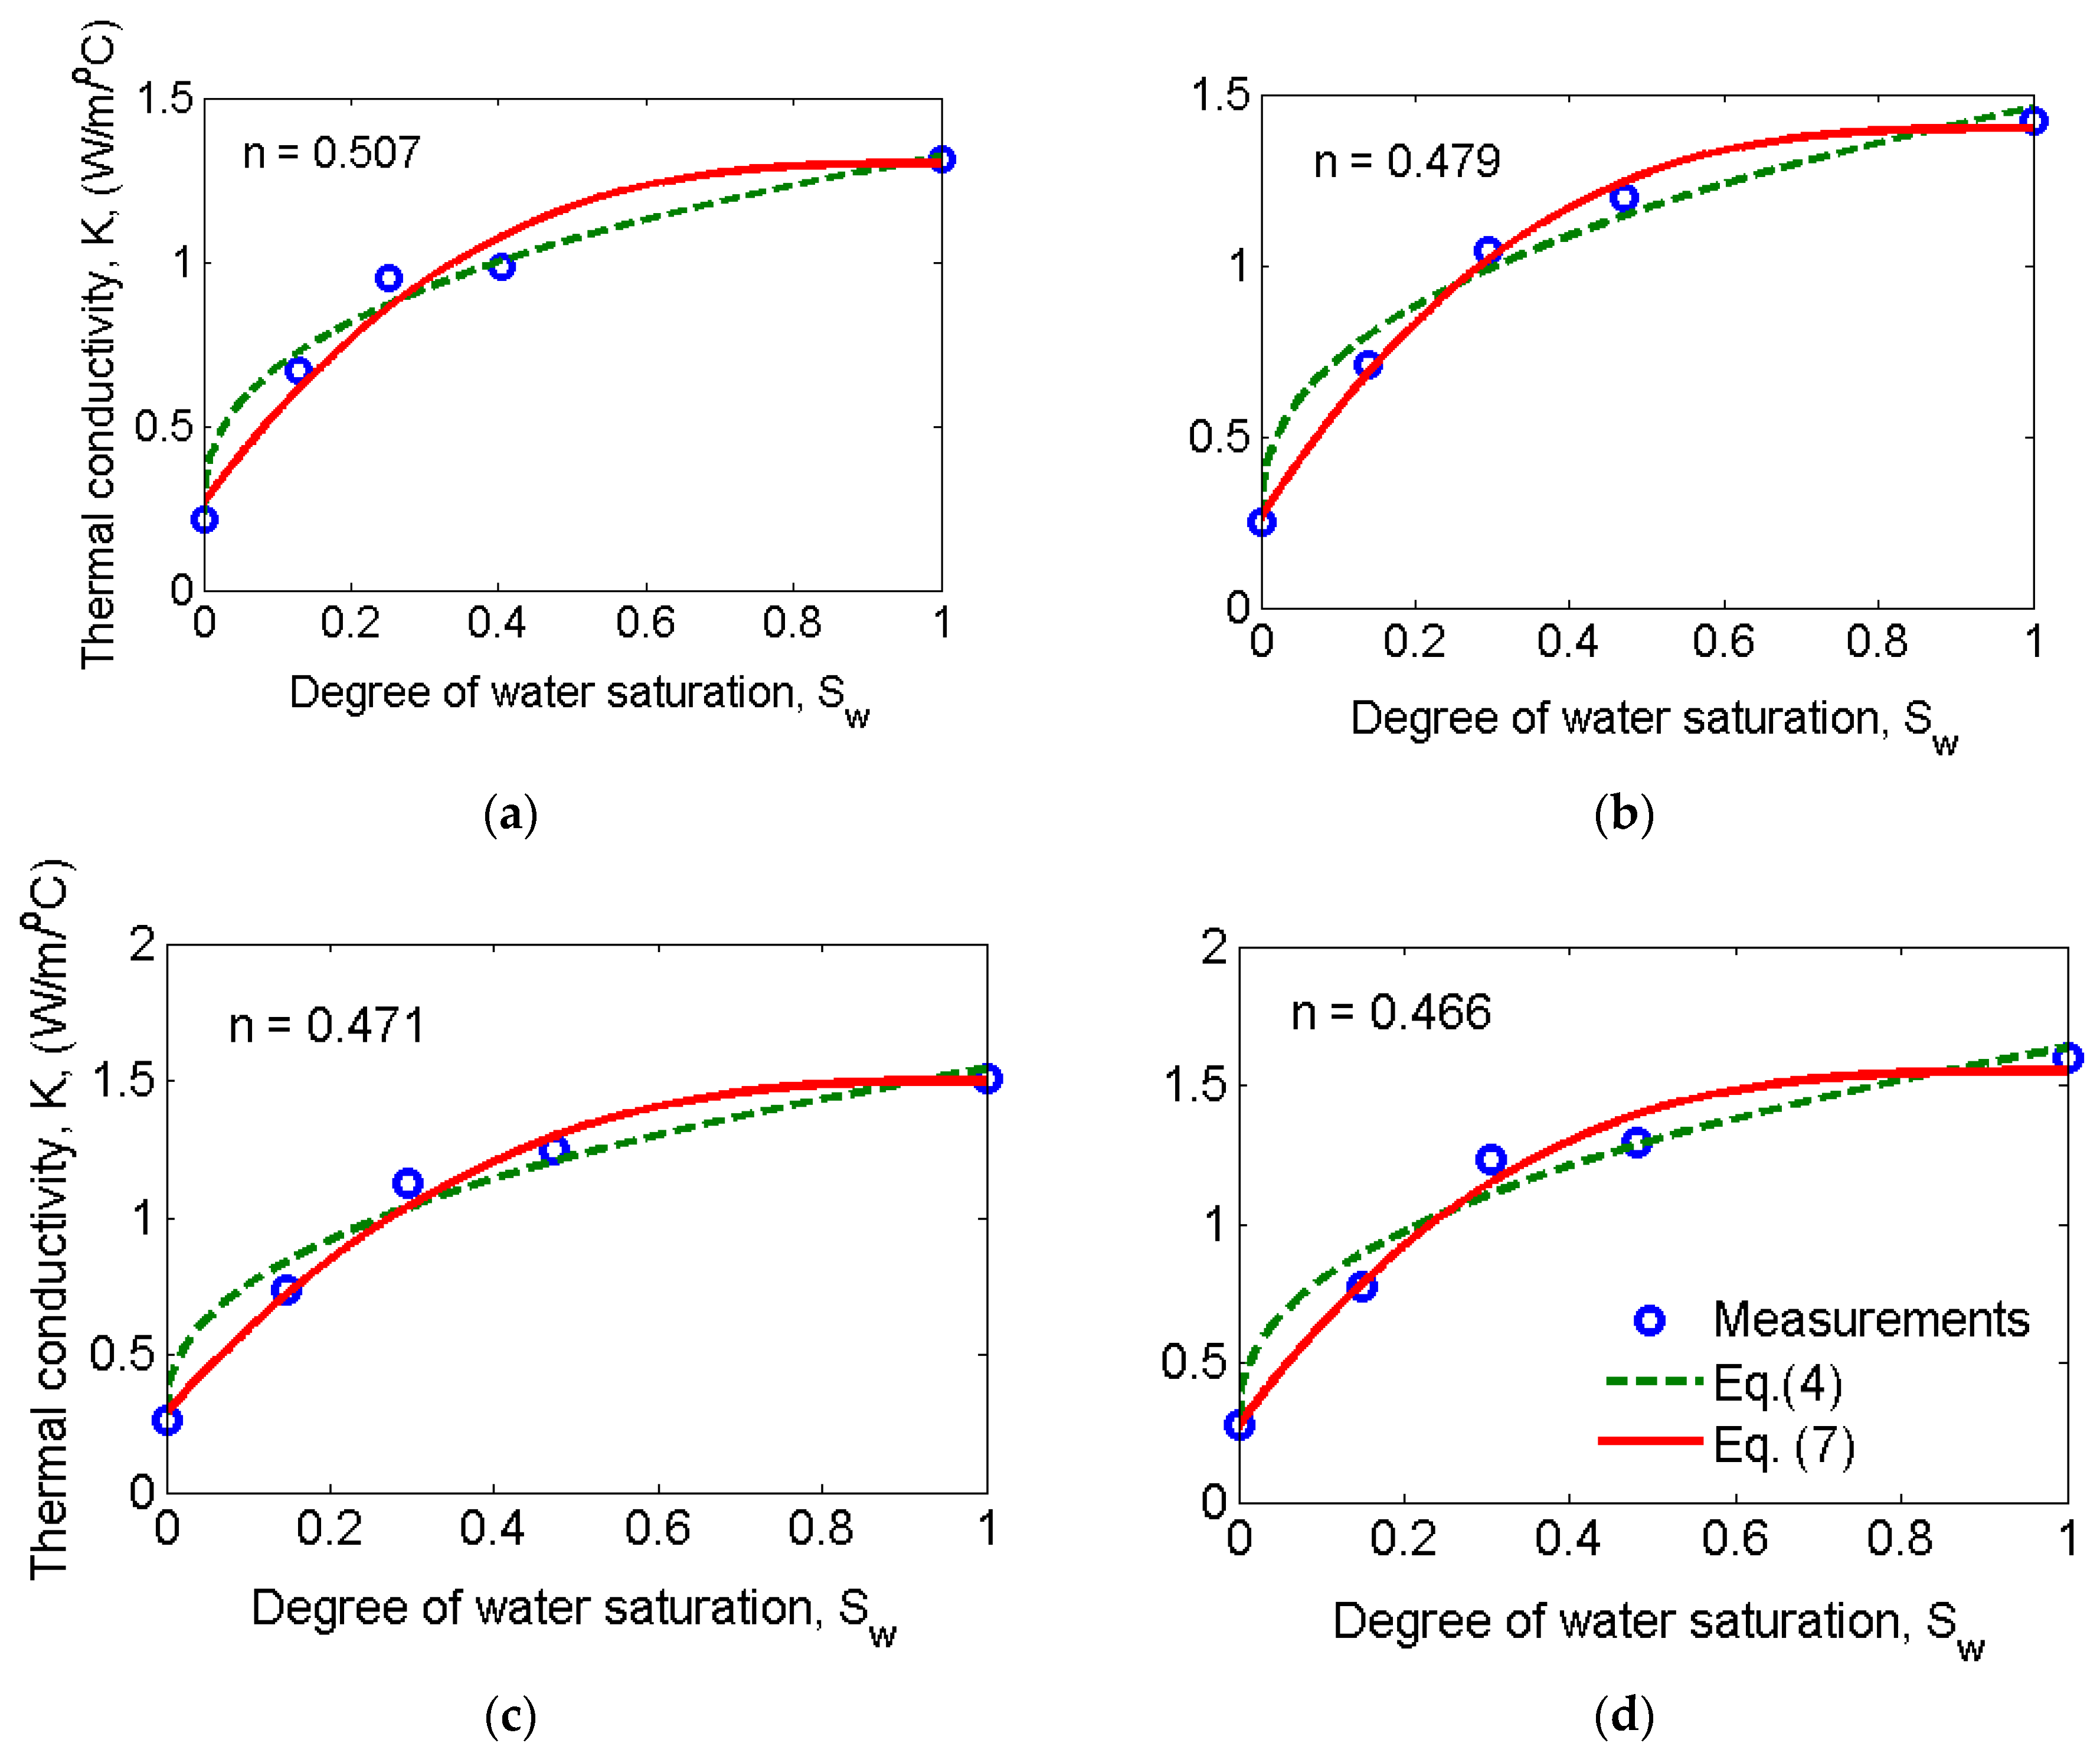
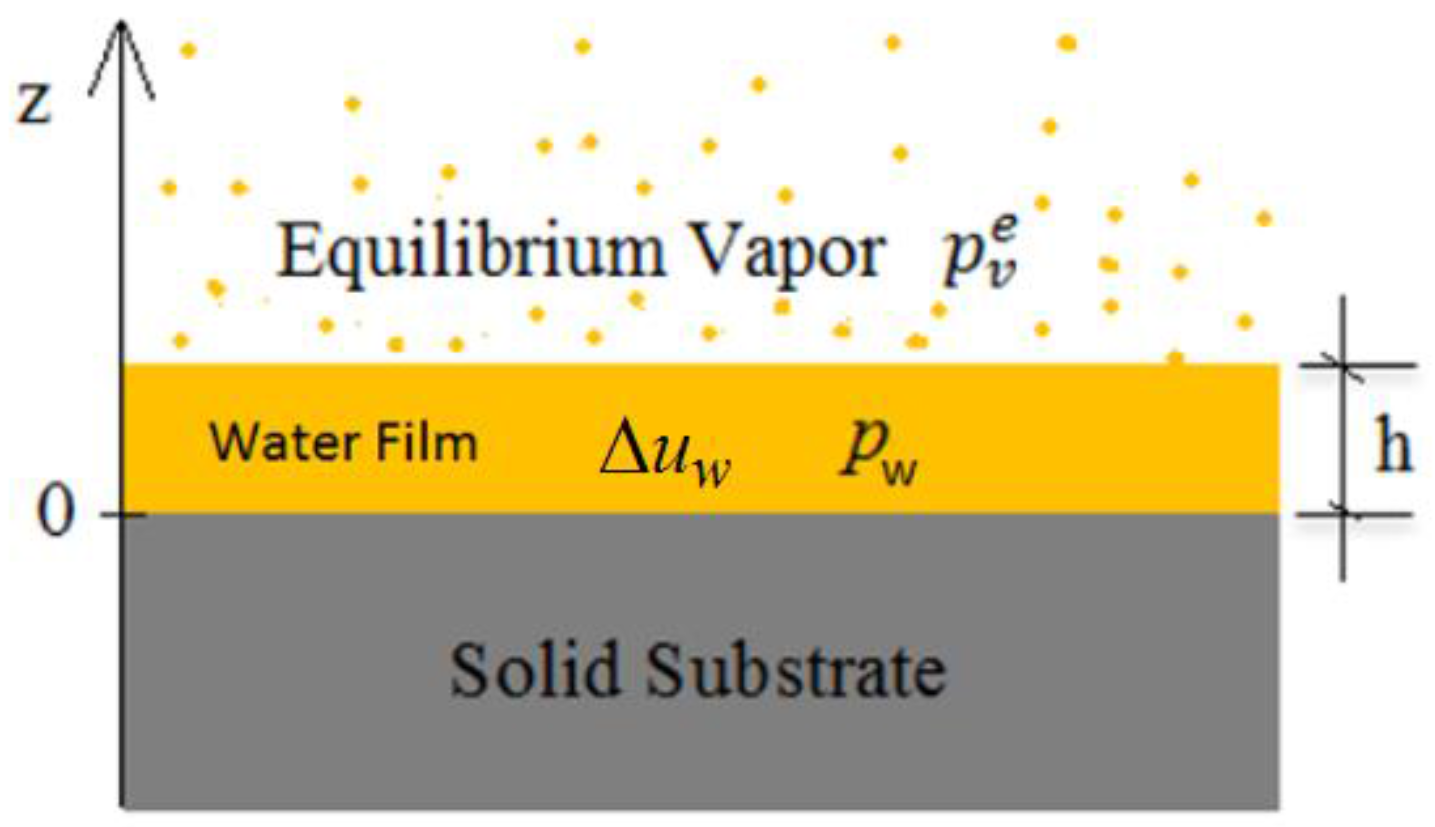
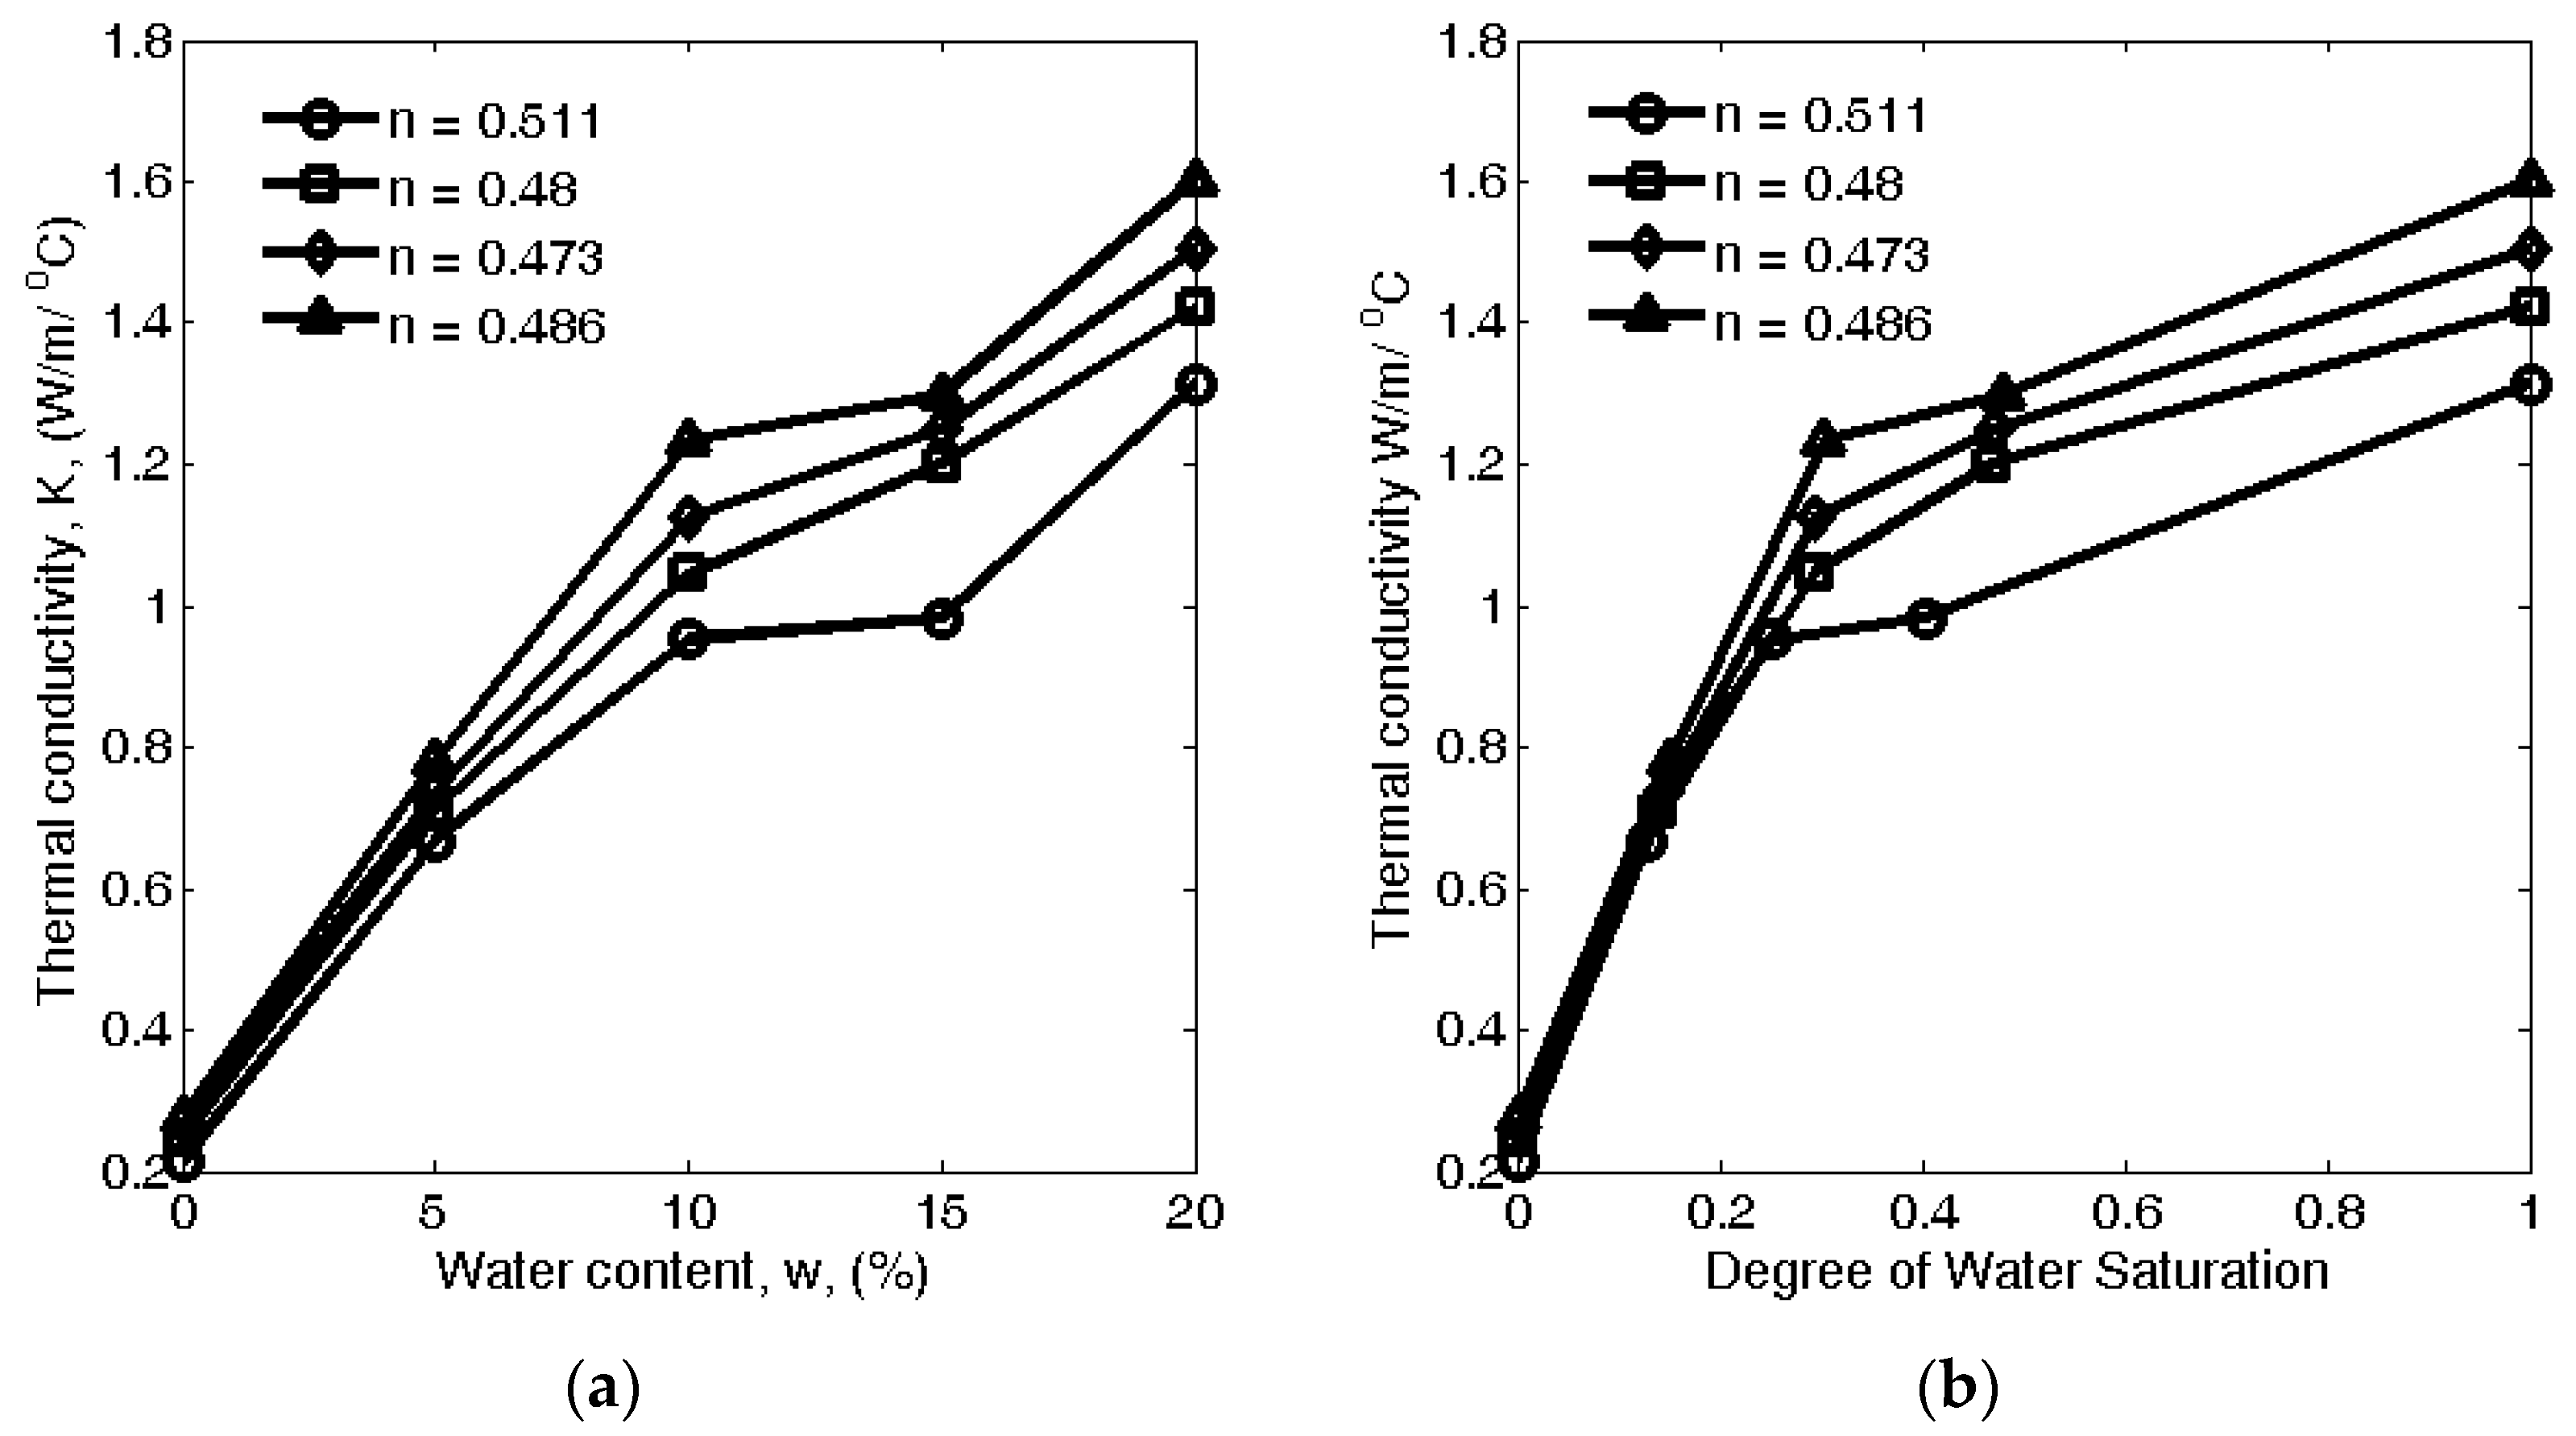
  • At a certain water content, the thermal conductivity of sandy soil decreases with increasing porosity due the increase in the air content. At a certain porosity, the thermal conductivity of sandy soil increases with the water content due to the decrease in the air content. Capillary condensation plays an important role on the thermal conductivity at low water content and low porosity with small pore sizes because the condensed water will affect the ratio of the water volume to total pore surface area.
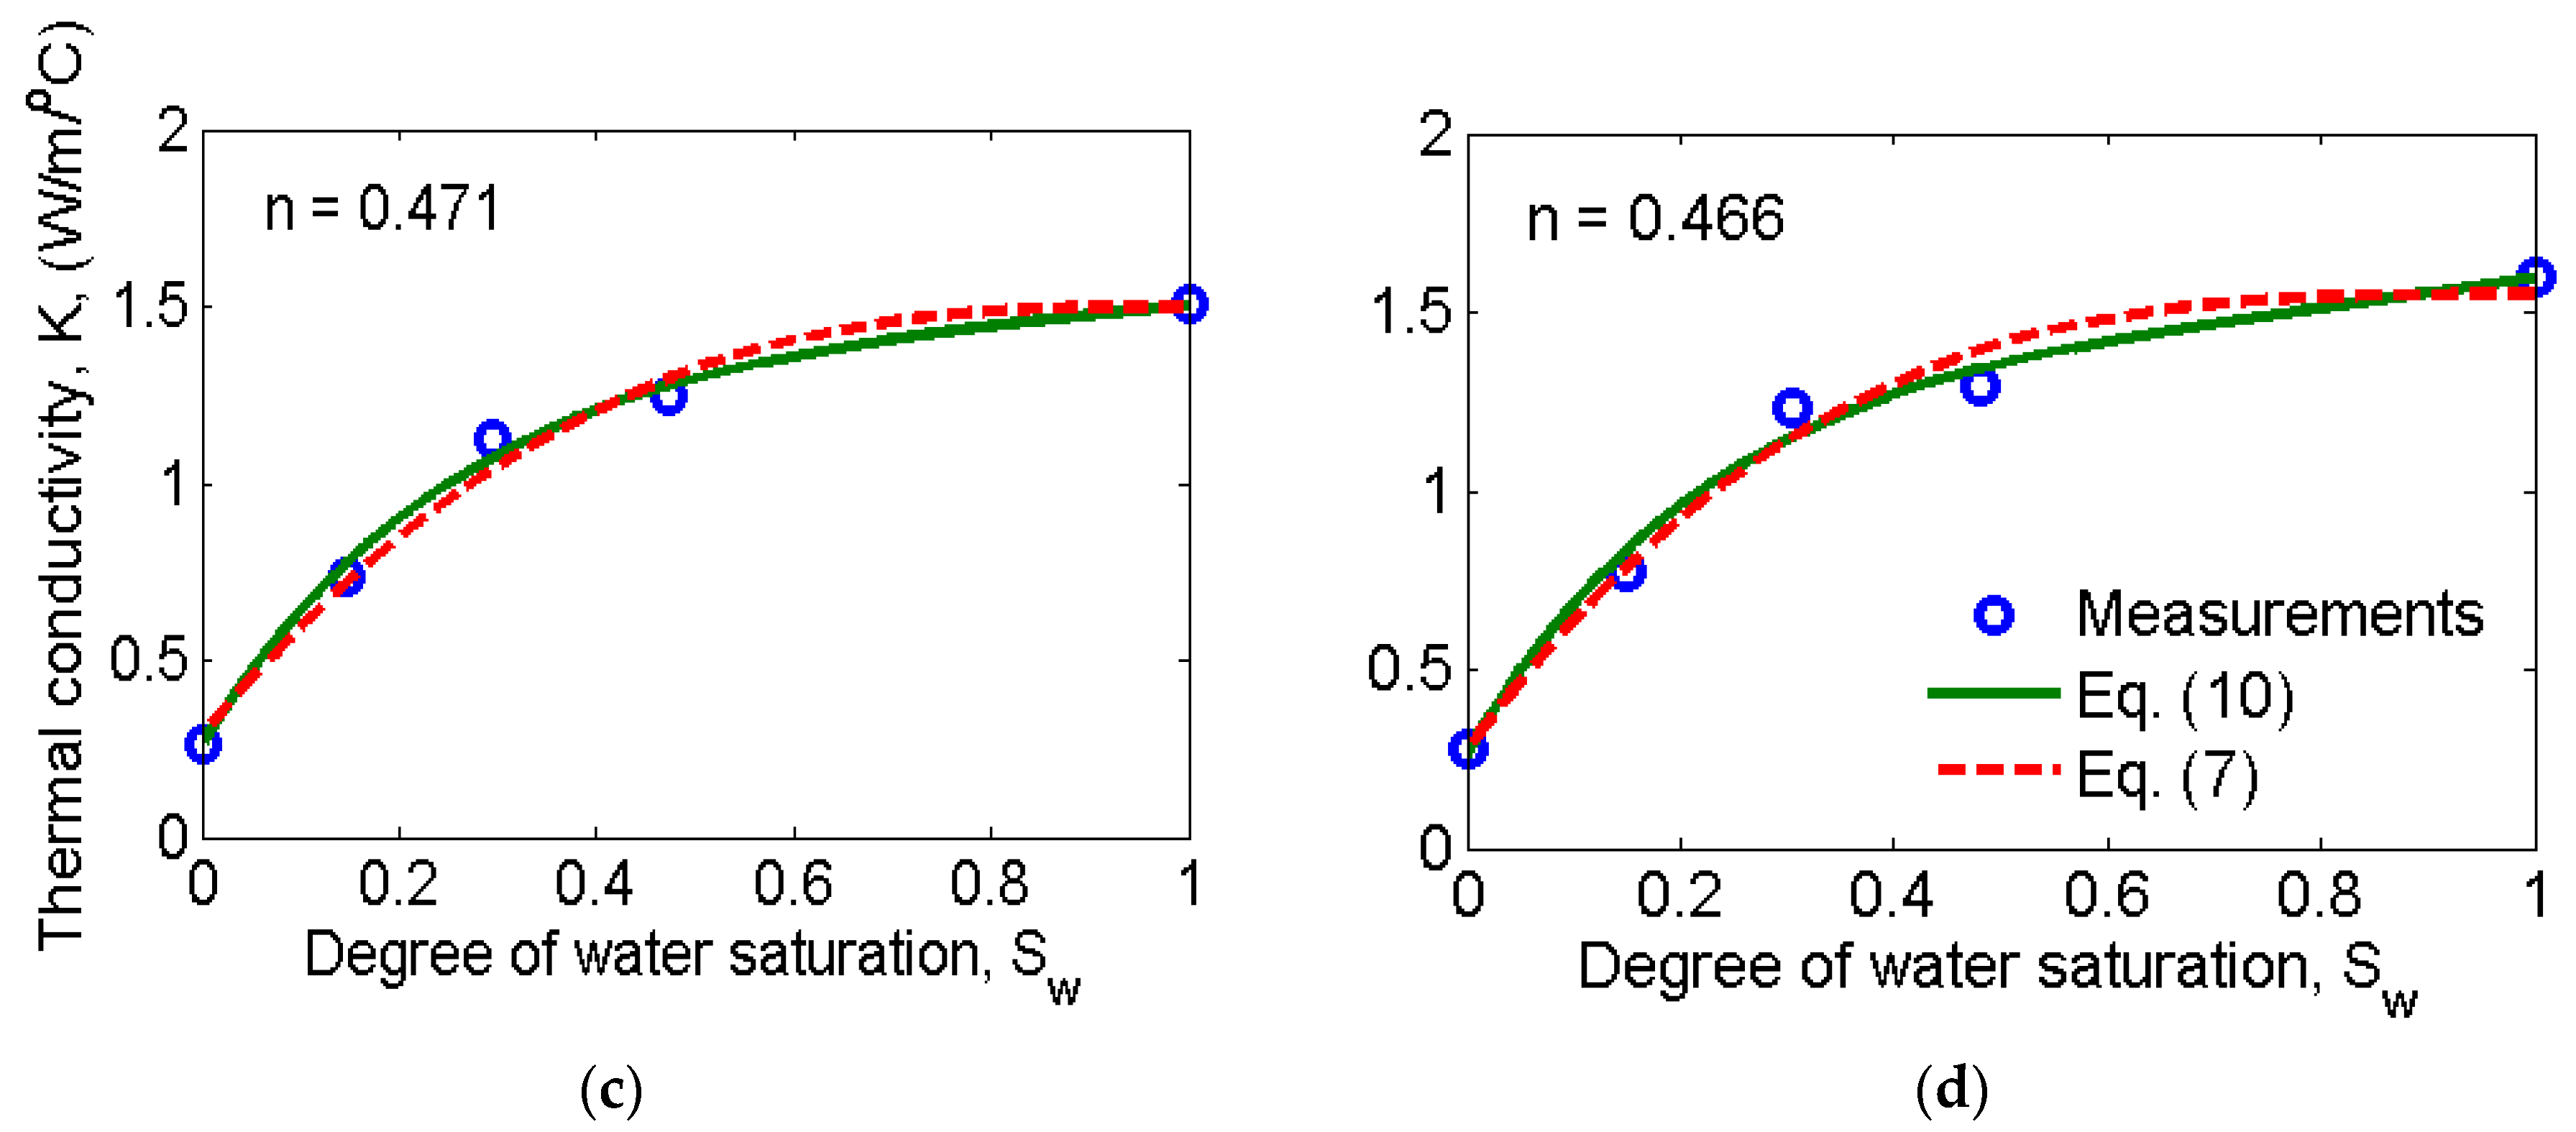
  • There are two major types of empirical model proposed, which can be generalised as representing an exponential function and power function, respectively. The characterised exponential function has showed a good result for the thermal conductivity of soils of a certain porosity at varied water contents. However, the power function has showed a better performance for the conditions of both varied water contents and porosities.
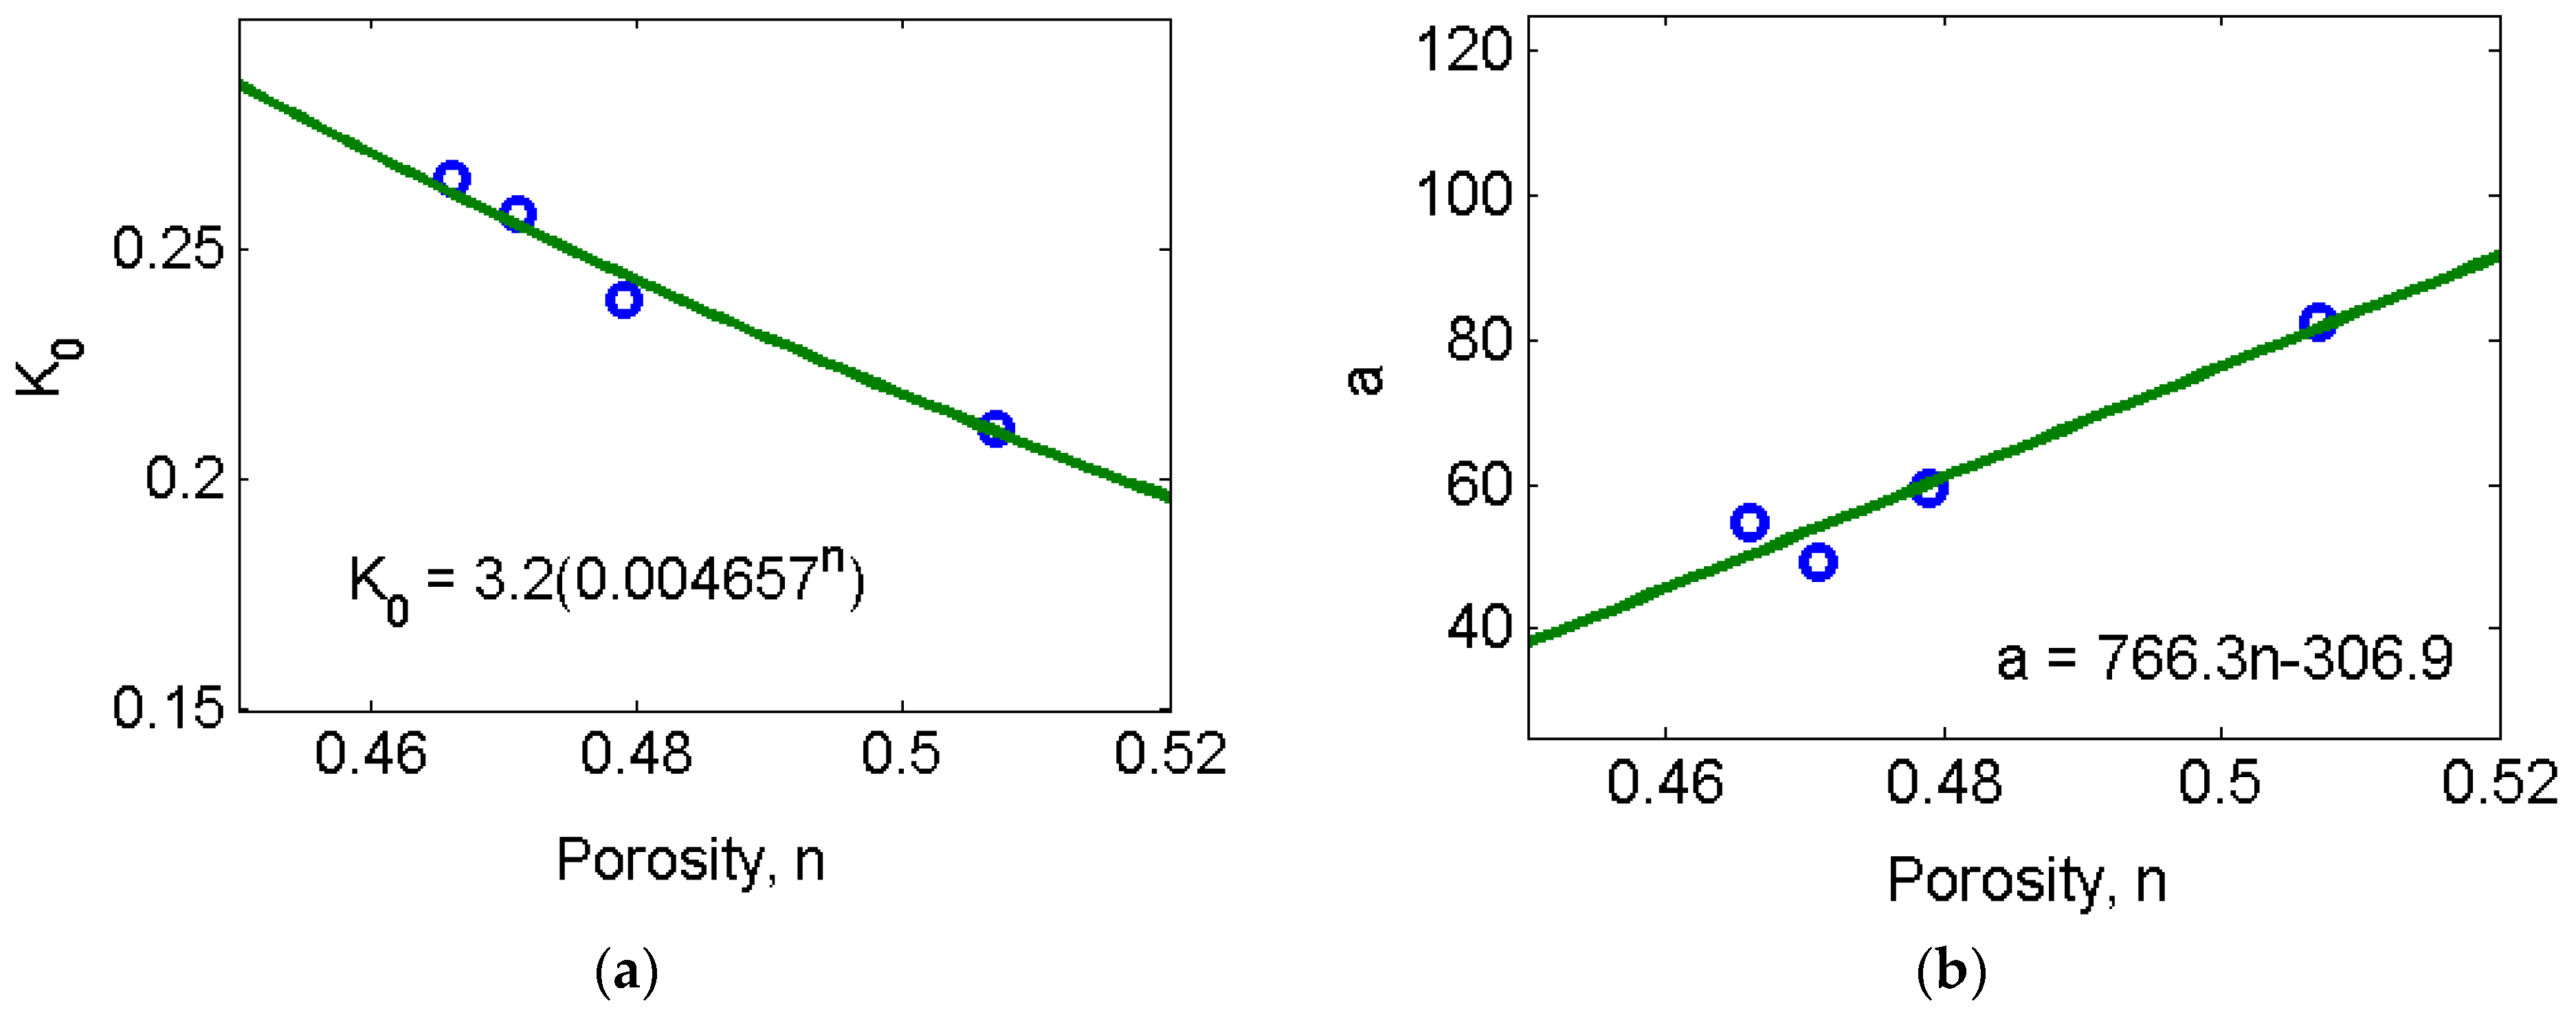
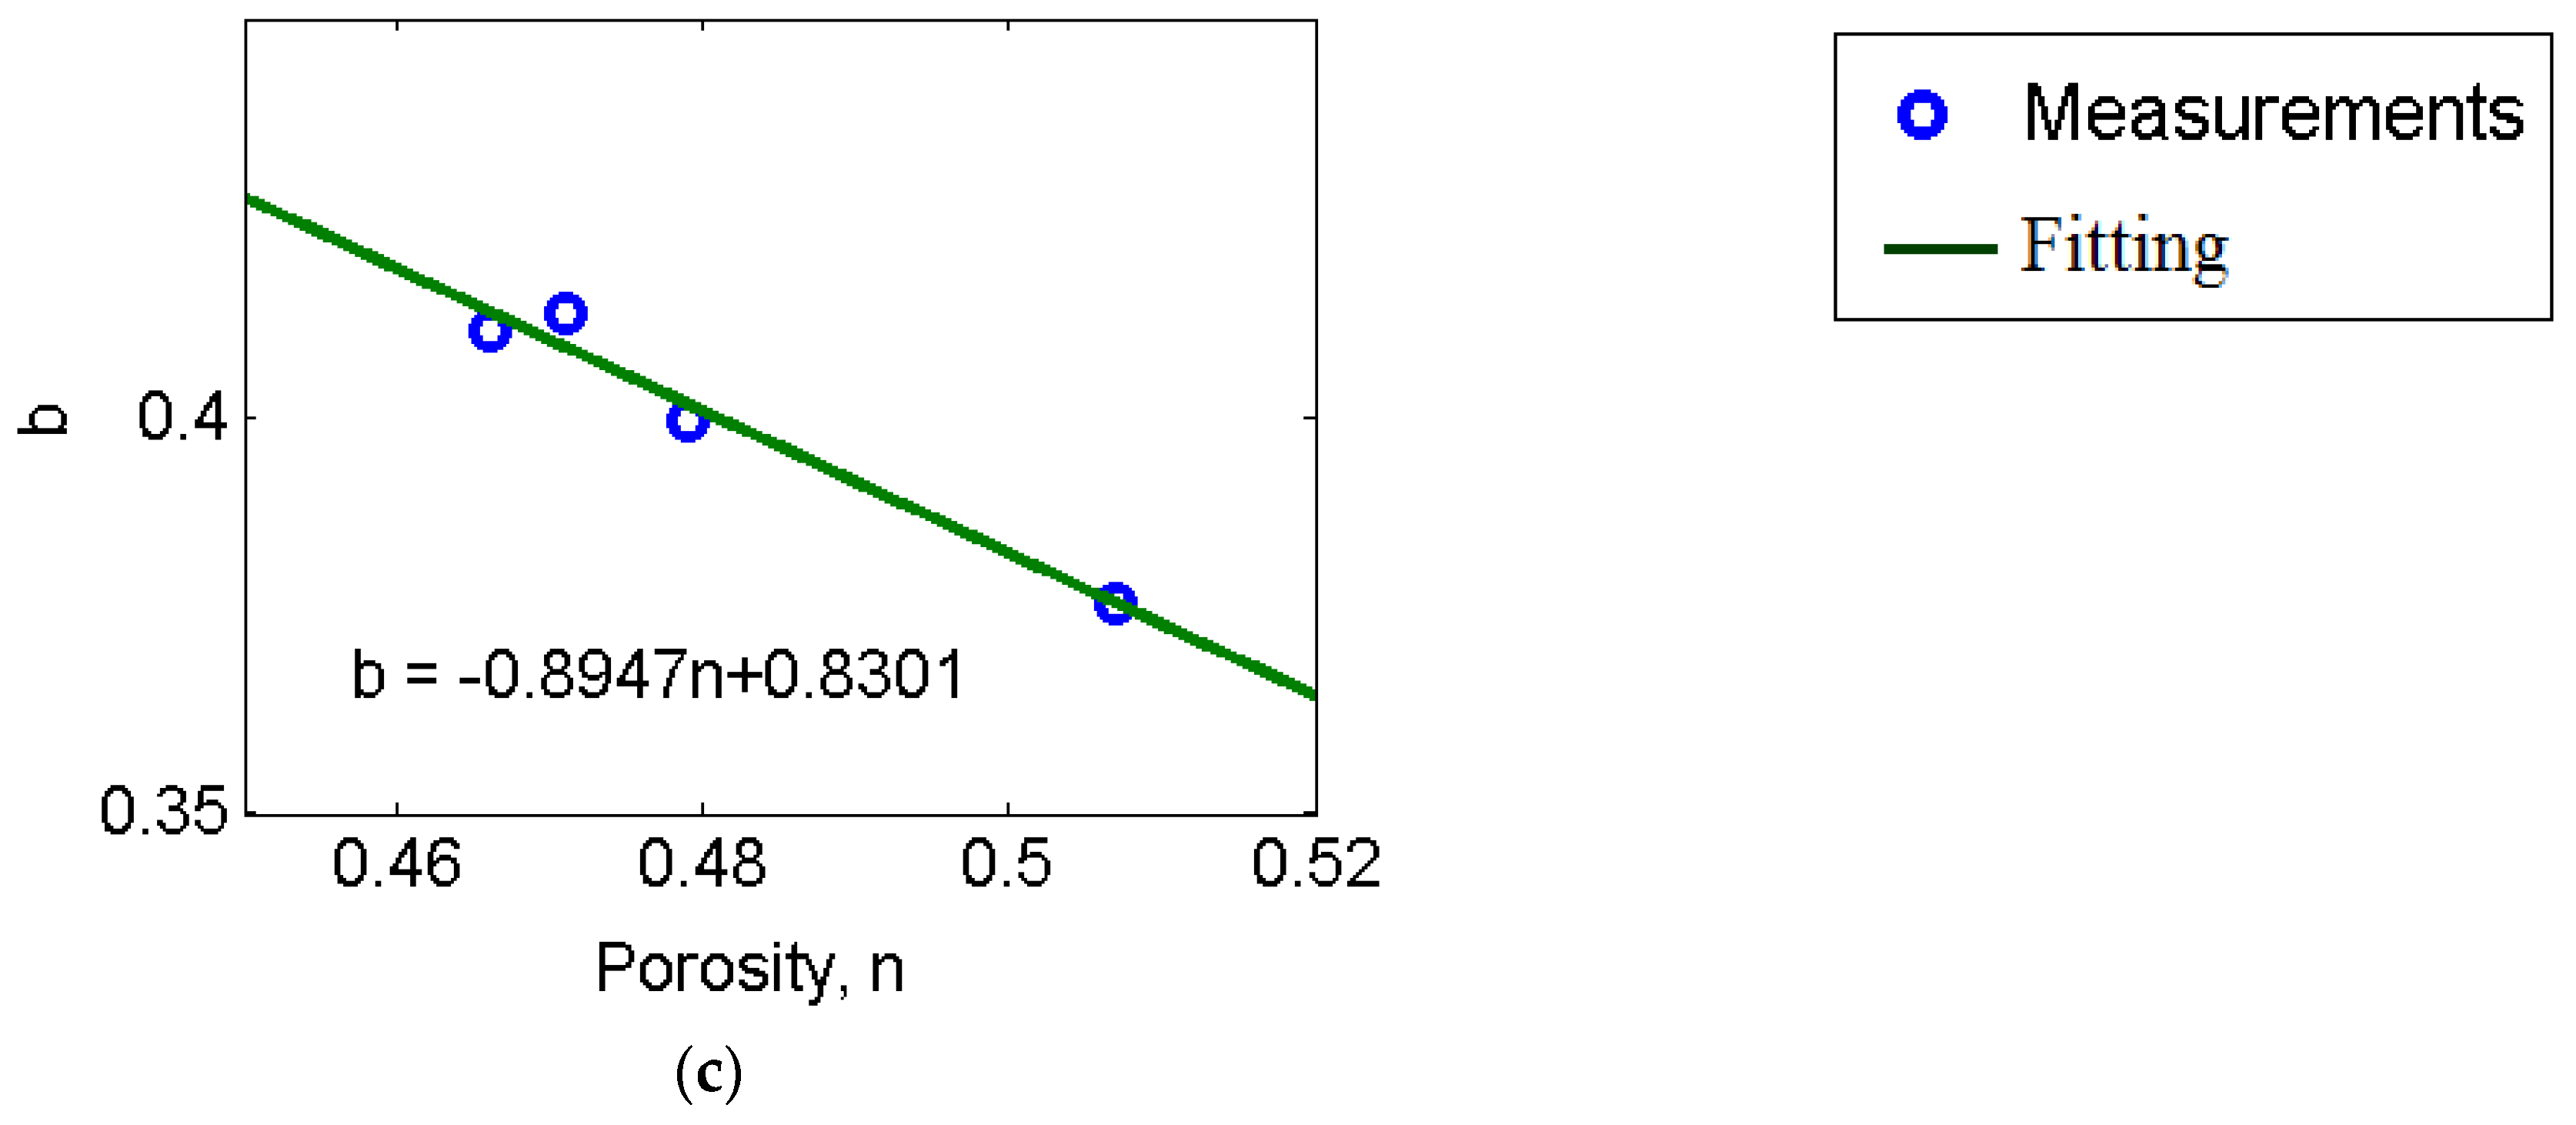
  • Intrinsically, the thermal conductivity at varied water content and porosity is related to the pore size distribution. Due to the intrinsic relation and the dependence on similar factors, both the thermal conductivity and water retention characteristics of unsaturated soils can be described using a unified model, which has demonstrated good accuracy.

Acknowledgments

The experimental work was funded by the National Natural Science Foundation of China (NSFC). Project No. 41372247.

Author Contributions

Hua Jin conceived and designed the experiments; Hua Jin, Qiang Zheng and Hu Liu performed the experiments; Yu Wang and Hua Jin analyzed the data; Yu Wang did the modelling, analysis and discussion; Yu Wang, Hua Jin and Edmund Chadwick wrote the paper.

Conflicts of Interest

The authors declare no conflict of interest.

References

  1. Yuan, Y.; Jib, H.; Duc, Y.; Cheng, B. Semi-analytical solution of roof-on-grade attached underground engineering envelope. Build. Environ. 2008, 43, 1138–1146. [Google Scholar] [CrossRef]
  2. Bai, Y.; Niedzwecki, J.M. Modeling deepwater seabed steady-state thermal fields around buried pipeline including trenching and backfill effects. Comput. Geotech. 2014, 61, 221–222. [Google Scholar] [CrossRef]
  3. Vipulanandan, C.; Kulkarni, S.P. Shear bonding and thermal properties of particle-filled polymer grout for pipe-in-pipe application. J. Mater. Civ. Eng. 2007, 19, 583–590. [Google Scholar] [CrossRef]
  4. Vollaro, R.; Fontana, L.; Vallati, A. Experimental study of thermal field deriving from an underground electrical power cable buried in non-homogeneous soils. Appl. Therm. Eng. 2014, 62, 390–397. [Google Scholar] [CrossRef]
  5. Al-Saud, M.S.; El-Kady, M.A.; Findlay, R.D. A new approach to underground cable performance assessment. Electr. Power Syst. Res. 2008, 78, 907–918. [Google Scholar] [CrossRef]
  6. Mimouni, T.; Dupray, F.; Laloui, L. Estimating the geothermal potential of heat-exchanger anchors on acut-and-cover tunnel. Geothermics 2014, 51, 380–387. [Google Scholar] [CrossRef]
  7. García-Gil, A.; Vázquez-Suñe, E.; Alcaraz, M.M.; Juan, A.S.; Sánchez-Navarro, J.A.; Montlleó, M.; Rodríguez, G.; Lao, J. GIS-supported mapping of low-temperature geothermal potential taking groundwater flow into account. Renew. Energy 2015, 77, 268–278. [Google Scholar] [CrossRef]
  8. Tye-Gingras, M.; Gosselin, L. Generic ground response functions for ground exchangers in the presence of groundwater flow. Renew. Energy 2014, 72, 354–366. [Google Scholar] [CrossRef]
  9. Mohamed, M.; El-Kezza, O.; Abdel-Aal, M.; Schellart, A.; Tait, S. Effects of coolant flow rate, groundwater table fluctuations and infiltration of rainwater on the efficiency of heat recovery from near surface soil layers. Geothermics 2015, 53, 171–182. [Google Scholar] [CrossRef]
  10. Nakhaei, M.; Šimůnek, J. Parameter estimation of soil hydraulic and thermal property functions for unsaturated porous media using the HYDRUS-2D code. J. Hydrol. Hydromech. 2014, 62, 7–15. [Google Scholar]
  11. Bozzoli, F.; Pagliarini, G.; Rainieri, S.; Schiavi, L. Estimation of soil and grout thermal properties through a TSPEP (two-step parameter estimation procedure) applied to TRT (thermal response test) data. Energy 2011, 36, 839–846. [Google Scholar] [CrossRef]
  12. Abuel-Naga, H.M.; Bergado, D.T.; Bouazza, A.; Pender, M.J. Thermal conductivity of soft Bangkok clay from laboratory and field measurements. Eng. Geol. 2009, 105, 211–219. [Google Scholar] [CrossRef]
  13. O’Donnell, J.A.; Romanovsky, V.E.; Harden, J.W.; McGuire, D.A. The Effect of Moisture Content on the Thermal Conductivity of Moss and Organic Soil Horizons from Black Spruce Ecosystems in Interior Alaska. Soil Sci. 2009, 174, 646–651. [Google Scholar] [CrossRef]
  14. Tang, A.; Cui, Y.; Le, T. A study on the thermal conductivity of compacted bentonites. Appl. Clay Sci. 2008, 41, 181–189. [Google Scholar] [CrossRef] [Green Version]
  15. Loikos, W.J. Pore-scale model for thermal conductivity of unsaturated sands. Geotech. Geol. Eng. 2015, 33, 179–192. [Google Scholar] [CrossRef]
  16. Tarnawski, V.R.; McCombie, M.L.; Momose, T.; Sakaguchi, I.; Leong, W.H. Thermal Conductivity of Standard Sands. Part III. Full Range of Saturation. Int. J. Thermophys. 2013, 34, 1130–1147. [Google Scholar] [CrossRef]
  17. Smits, K.M.; Sakaki, T.; Limsuwat, A.; Illangasekare, T.H. Thermal Conductivity of Sands under Varying Moisture and Porosity in Drainage–Wetting Cycles. Vadose Zone J. 2010, 9, 172–180. [Google Scholar] [CrossRef]
  18. Chen, S. Thermal conductivity of sands. Heat Mass Transf. 2008, 44, 1241–1246. [Google Scholar] [CrossRef]
  19. Woodside, W.; Messmer, J.H. Thermal Conductivity of Porous Media. I. Unconsolidated Sands. J. Appl. Phys. 1961, 32, 1688. [Google Scholar] [CrossRef]
  20. De Vries, D.A. Thermal properties of soils. In Physics of Plant Environment; van Wijk, W.R., Ed.; North Holland Publishing Company: Amsterdam, The Netherlands, 1963. [Google Scholar]
  21. Likos, W.J.; Olson, H.S.; Jaafar, R. Comparison of Laboratory Methods for Measuring Thermal Conductivity of Unsaturated Soils. In Proceedings of the GeoCongress, Oakland, CA, USA, 25–29 March 2012; pp. 4366–4376.
  22. Low, J.E.; Loveridge, F.A.; Powrie, W. Measuring soil thermal properties for use in energy foundation design. In Proceedings of the 18th International Conference on Soil Mechanics and Geotechnical Engineering, Paris, France, 2–6 September 2013; pp. 3375–3378.
  23. Low, J.E.; Loveridge, F.; Powrie, W. Thermal conductivity of soils by the needle probe method, for energy foundation applications. In Proceedings of the 32nd International Thermal Conductivity Conference and 20th International Thermal Expansion Symposium, Lafeyette, IN, USA, 27 April–1 May 2014; p. 11.
  24. Alrtimi, A.; Rouainia, M.; Manning, D.A.C. An improved steady-state apparatus for measuring thermal conductivity of soils. Int. J. Heat Mass Transf. 2014, 72, 630–636. [Google Scholar] [CrossRef]
  25. Standard for Hydrogeological Investigation of Water-Supply (GB 50027–2001); China Planning Press: Beijing, China, 2001.
  26. Dong, Y.; McCartney, J.S.; Lu, N. Critical Review of Thermal Conductivity Models for Unsaturated Soils. Geotech. Geol. Eng. 2015, 33, 207–221. [Google Scholar] [CrossRef]
  27. Jougnot, D.; Revil, A. Thermal conductivity of unsaturated clay-rocks. Hydrol. Earth Syst. Sci. 2010, 14, 91–98. [Google Scholar] [CrossRef]
  28. Tarnawski, V.R.; Leong, W.H. Advanced Geometric Mean Model for Predicting Thermal Conductivity of Unsaturated Soils. Int. J. Thermophys. 2016, 37, 18. [Google Scholar] [CrossRef]
  29. Ghanbarian, B.; Daigle, H. Thermal conductivity in porous media: Percolation-based effective-medium approximation. Water Resour. Res. 2016, 52, 295–314. [Google Scholar] [CrossRef]
  30. Lehmann, P.; Stähli, M.; Papritz, A.; Gygi, A.; Flühler, H. A Fractal Approach to Model Soil Structure and to Calculate Thermal Conductivity of Soils. Transp. Porous Media 2003, 52, 313–332. [Google Scholar] [CrossRef]
  31. Xiao, B.; Yang, Y.; Chen, L.X. Developing a novel form of thermal conductivity of nanofluids with Brownian motion effect by means of fractal geometry. Powder Technol. 2013, 239, 409–414. [Google Scholar] [CrossRef]
  32. Cai, G.; Zhang, T.; Puppala, A.J.; Liu, S. Thermal characterization and prediction model of typical soils in Nanjing area of China. Eng. Geol. 2015, 191, 23–30. [Google Scholar] [CrossRef]
  33. Nikiforova, T.; Savytskyi, M.; Limam, K.; Bosschaerts, W.; Belarbi, R. Methods and Results of Experimental Researches of Thermal Conductivity of Soils. Energy Procedia 2013, 42, 775–783. [Google Scholar] [CrossRef]
  34. Farouki, O.T. Thermal Properties of Soils; Trans Tech Publications: Rockport, MA, USA, 1986. [Google Scholar]
  35. Misra, A.; Becker, B.R.; Fricke, B.A. A Theoretical Model of the Thermal Conductivity of Idealized Soil. HVAC R Res. 1995, 1, 81–96. [Google Scholar] [CrossRef]
  36. Kersten, M.S. Laboratory Research for the Determination of the Thermal Properties of Soils; Technical Report 23; Research Laboratory Investigations, Engineering Experiment Station, University of Minnesota: Minneapolis, MN, USA, 1949. [Google Scholar]
  37. Johansen, O. Thermal Conductivity of Soils. N.H. CRREL Draft English Translation 637. Ph.D. Thesis, University of Trondheim, Trondheim, Norway, 1975. [Google Scholar]
  38. Cote, J.; Konrad, J.M. A generalized thermal conductivity model for soils and construction materials. Can. Geotech. J. 2005, 42, 443–458. [Google Scholar] [CrossRef]
  39. Lu, S.; Ren, T.; Gong, Y.; Horton, R. An improved model for predicting soil thermal conductivity from water content at room temperature. Soil Sci. Soc. Am. J. 2007, 71, 8–14. [Google Scholar] [CrossRef]
  40. Ould-Lahoucine, C.; Sakashita, H.; Kumada, T. Measurement of thermal conductivity of buffer materials and evaluation of existing correlations predicting it. Nucl. Eng. Des. 2002, 216, 1–11. [Google Scholar] [CrossRef]
  41. Donazzi, F.; Occhini, E.; Seppi, A. Soil Thermal and hydrological characteristics in designing underground. Proc. Inst. Electr. Eng. 1979, 126, 506–516. [Google Scholar] [CrossRef]
  42. Wang, Y.; Wu, G. Understanding and modelling of soil-water characteristic curves. Chin. J. Geotech. Eng. 2008, 30, 1282–1290. [Google Scholar]
  43. Wang, Y.; Grove, S.M.; Anderson, M.G. A physical-chemical model for the static water retention characteristic of unsaturated porous media. Adv. Water Resour. 2008, 31, 723–735. [Google Scholar] [CrossRef]
  44. Wang, Y. Phase deterministic modelling of water retention in unsaturated porous media and its potential in dynamic unsaturated flow application. J. Porous Media 2010, 13, 261–270. [Google Scholar] [CrossRef]
  45. Wang, Y.; Wang, X.Y.; Scholz, M.; Ross, D.K. A physico-chemical model for the water vapour sorption isotherm of hardened cementitious materials. Constr. Build. Mater. 2012, 35, 941–946. [Google Scholar] [CrossRef]
  46. McCash, E.M. Surface Chemistry; Oxford University Press: Oxford, UK, 2001. [Google Scholar]
  47. Tuller, M.; Or, D.; Dudley, L.M. Adsorption and capillary condensation in porous media: Liquid retention and interfacial configuration in angular pores. Water Resour. Res. 1999, 35, 1949–1964. [Google Scholar] [CrossRef]
  48. Derjaguin, B.; Obuchov, E. Acta Physicochimica U.R.S.S.; Academy of Sciences of the U.S.S.R.: Moskva, Russia, 1936. [Google Scholar]
Figure 1. A comparison between the thermal conductivity and the soil-water retention.
Applsci 07 00119 g001
Figure 2. The particle size distribution of the formulated sand samples.
Applsci 07 00119 g002
Figure 3. The needle probe used in the test, (a) illustration; (b) product.
Applsci 07 00119 g003
Figure 4. Hot-plate measuring system, (a) illustration; (b) products.
Applsci 07 00119 g004
Figure 5. The thermal conductivity vs. porosity at different water contents.
Applsci 07 00119 g005
Figure 6. The thermal Conductivity vs. water content (a) and water saturation (b) at different porosities.
Applsci 07 00119 g006
Figure 7. The Modelling Results using Equations (4a) and (7a), (a) porosity n = 0.507; (b) porosity n = 0.479; (c) porosity n = 0.471; (d) porosity n = 0.466.
Applsci 07 00119 g007
Figure 8. The Fitting Result of the Parametric Functions, (a) Equation (4b); (b) Equation (4c); (c) Equation (4d).
Applsci 07 00119 g008aApplsci 07 00119 g008b
Figure 9. The Fitting Result of the Parametric Functions, (a) Equation (7b); (b) Equation (7c); (c) Equation (7d); (d) Equation (7e).
Applsci 07 00119 g009
Figure 10. Water film adsorbed on a solid substrate.
Applsci 07 00119 g010
Figure 11. The Modelling Results using Equations (4) and (15), (a) porosity n = 0.507; (b) porosity n = 0.479; (c) porosity n = 0.471; (d) porosity n = 0.466.
Applsci 07 00119 g011aApplsci 07 00119 g011b
Table 1. The technical parameters of the needle probes used.
StructureHeating WireThermocoupleData Collector
Length (l): 167 mm
Diameter (d): 2 mm
l/d = 83.5
Electrical resistance
22.46 Ω/m
T-type
Accuracy: ±0.1 °C
UT325
Without the compensation at the cool end
Table 2. The comparison of the measurement of the thermal conductivity of glycerol.
The Order No. of the Needle ProbeThe Standard ValueMeasurementAbsolute Error *Relative Error **
20 °C40 °C
10.28720.28970.2920.0030.87%
20.2910.0020.55%
30.2900.0010.17%
40.284−0.005−1.76%
50.2910.0020.76%
* The measurement—the average of the two standard values at 20 and 40 °C; ** the absolute error/the average of the two standard values at 20 and 40 °C.
Table 3. The Fitting Parameter Results using Equation (15).
Porosity, nλ0K0αβ
0.5071.0550.0010645.4956.679
0.4791.3350.020281.6494.004
0.4711.4160.025981.4693.818
0.4661.4430.016972.3234.256

