1. Introduction
The construction industry in China has been growing at a high rate in recent years. From 2003 to 2014, construction revenue increased from 750 billion CNY (109 billion USD) to approximately 17,670 billion CNY (2568 billion USD), with an annual growth rate of 30.12%. Currently, the annual completed floor area of buildings in China exceeds 4.2 billion m
2. The construction industry has become the nation’s highest economic contributor among industrial sectors, and further investments could provide financial support for a large-scale shift of construction toward industrialization [
1]. However, the construction industry in China is encountering such challenges as rapid development, insufficient technologies, enormous depletion of resources, massive waste, compromised quality, safety risks, low productivity, and a shortage of skilled labour [
2]. These problems are restricting the sustainable development of the industry in China; therefore, innovative technologies and practices are needed to address these challenges. Industrialization of the construction process is a solution to mitigate these challenges. Construction industrialization is defined as factory-based prefabrication within a controlled environment, followed by assembly on site. Compared to conventional construction methods, industrialized construction entails such benefits as accelerated construction, improved quality, decreased material waste, and reduced hazards and worker injuries [
3]. It also contributes to sustainability by substantially reducing energy usage and thus reducing greenhouse gas emissions from the construction process.
The concept of construction industrialization emerged in China as early as 1955, and the application of construction industrialization in residential and non-residential buildings was emphasized in 1978 [
4]. In recent years, construction industrialization again has gained considerable attention and support from government at the national, provincial, and municipal levels in China; the government has successfully issued favourable policies to encourage construction industrialization. The use of industrialized construction methods is mandatory for affordable housing and public buildings in many jurisdictions, and it is expected that the total floor area built by means of industrialized construction in China will exceed 40 million m
2 by 2017 [
5]. Recently, the State Council of the People’s Republic of China announced that the incentive policies for construction industrialization will be enforced, and prefabricated construction is expected to account for 30% of total construction within approximately 10 years [
6].
Based on the growth of industrialized construction in China in recent years, one of the research aims is to analyze the overall demand, capacity, and trends related to construction industrialization; to achieve the research goal, survey is utilized to collect the required data and information in this research. Survey is a widely used method to collect information for social study. With predefined and structured questions, surveys are conducted to collect participants’ answers, which constitute the data to be analyzed [
7]. Pinsonneault and Kraemer (1993) have discussed the different purposes of survey research: exploration, description, or explanation. Exploratory surveys are used to gather information about a certain topic and determine the range of responses from the population [
7]. With a descriptive survey, the distribution of an opinion/situation/event within a population is studied. The key aspects of survey research include research design, sampling procedures, and data analysis. Kelley et al. (2003) introduced the survey methodology practically, including questionnaire layout, sampling, and data analysis [
8]. Based on the collected data through survey, the future trend is predicted using Holt and Delphi methods. Holt (1957) proposed a linear trend method to allow forecasting of data with a trend for time series [
9], and Hyndman and Athanasopoulos (2016) introduced the principles and practice thoroughly [
10]. Delphi method is a structured communication method, by which a panel of experts conducts interactive forecasting [
11]. Delphi method is developed based on the principle that forecasts (or decisions) from a structured group of individuals are more accurate than those from unstructured groups [
12], and has been widely used for forecasting in many areas. Bouzon et al. (2016) utilized fuzzy Delphi method and AHP to identify and analyze reverse logistics barriers [
13].
2. Research Objective and Methodology
This research aims to analyze the current status and to predict the trends for construction industrialization in China. The research objectives include: (1) to identify the construction industrialization status for major provinces and municipalities across China; (2) to investigate the capacity and production of construction industrialization for major provinces and municipalities across China; and (3) to foresee the future trends of construction industrialization. To achieve the proposed research objectives, questionnaire is utilized to collect the required data, which are described below.
In order to identify the status of construction industrialization in China, questionnaires are designed to collect the required information: (1) the gross floor area of buildings built using industrialized construction methods; (2) the building types and structure types of industrialized construction; and (3) the annual capacity and actual production of prefabrication production lines. The designed questionnaires were distributed to industry and the provincial or municipal government in 2015, via an online survey platform [
14]. There are a total of 113 effective responses, among which 19 responses are from representatives of provincial and municipal jurisdictions, including Anhui, Beijing, Fujian, Hebei, Henan, Hunan, Jilin, Ningxia, Qinghai, Sichuan, Shandong, Shanxi, Shanghai, Tianjin, Zhejiang, Chongqing, Hubei, Xinjiang, and Liaoning, and 94 responses are from such industry stakeholders as real estate developers and building component manufacturers. The collected information is utilized to analyze the status of construction industrialization in China; furthermore, Holt and Delphi methods are utilized to predict the construction industrialization trends for the next five years.
3. Construction Industrialization Profiles in China
3.1. Industrialized Construction Profiles by Province and Municipality
3.1.1. Gross Floor Area
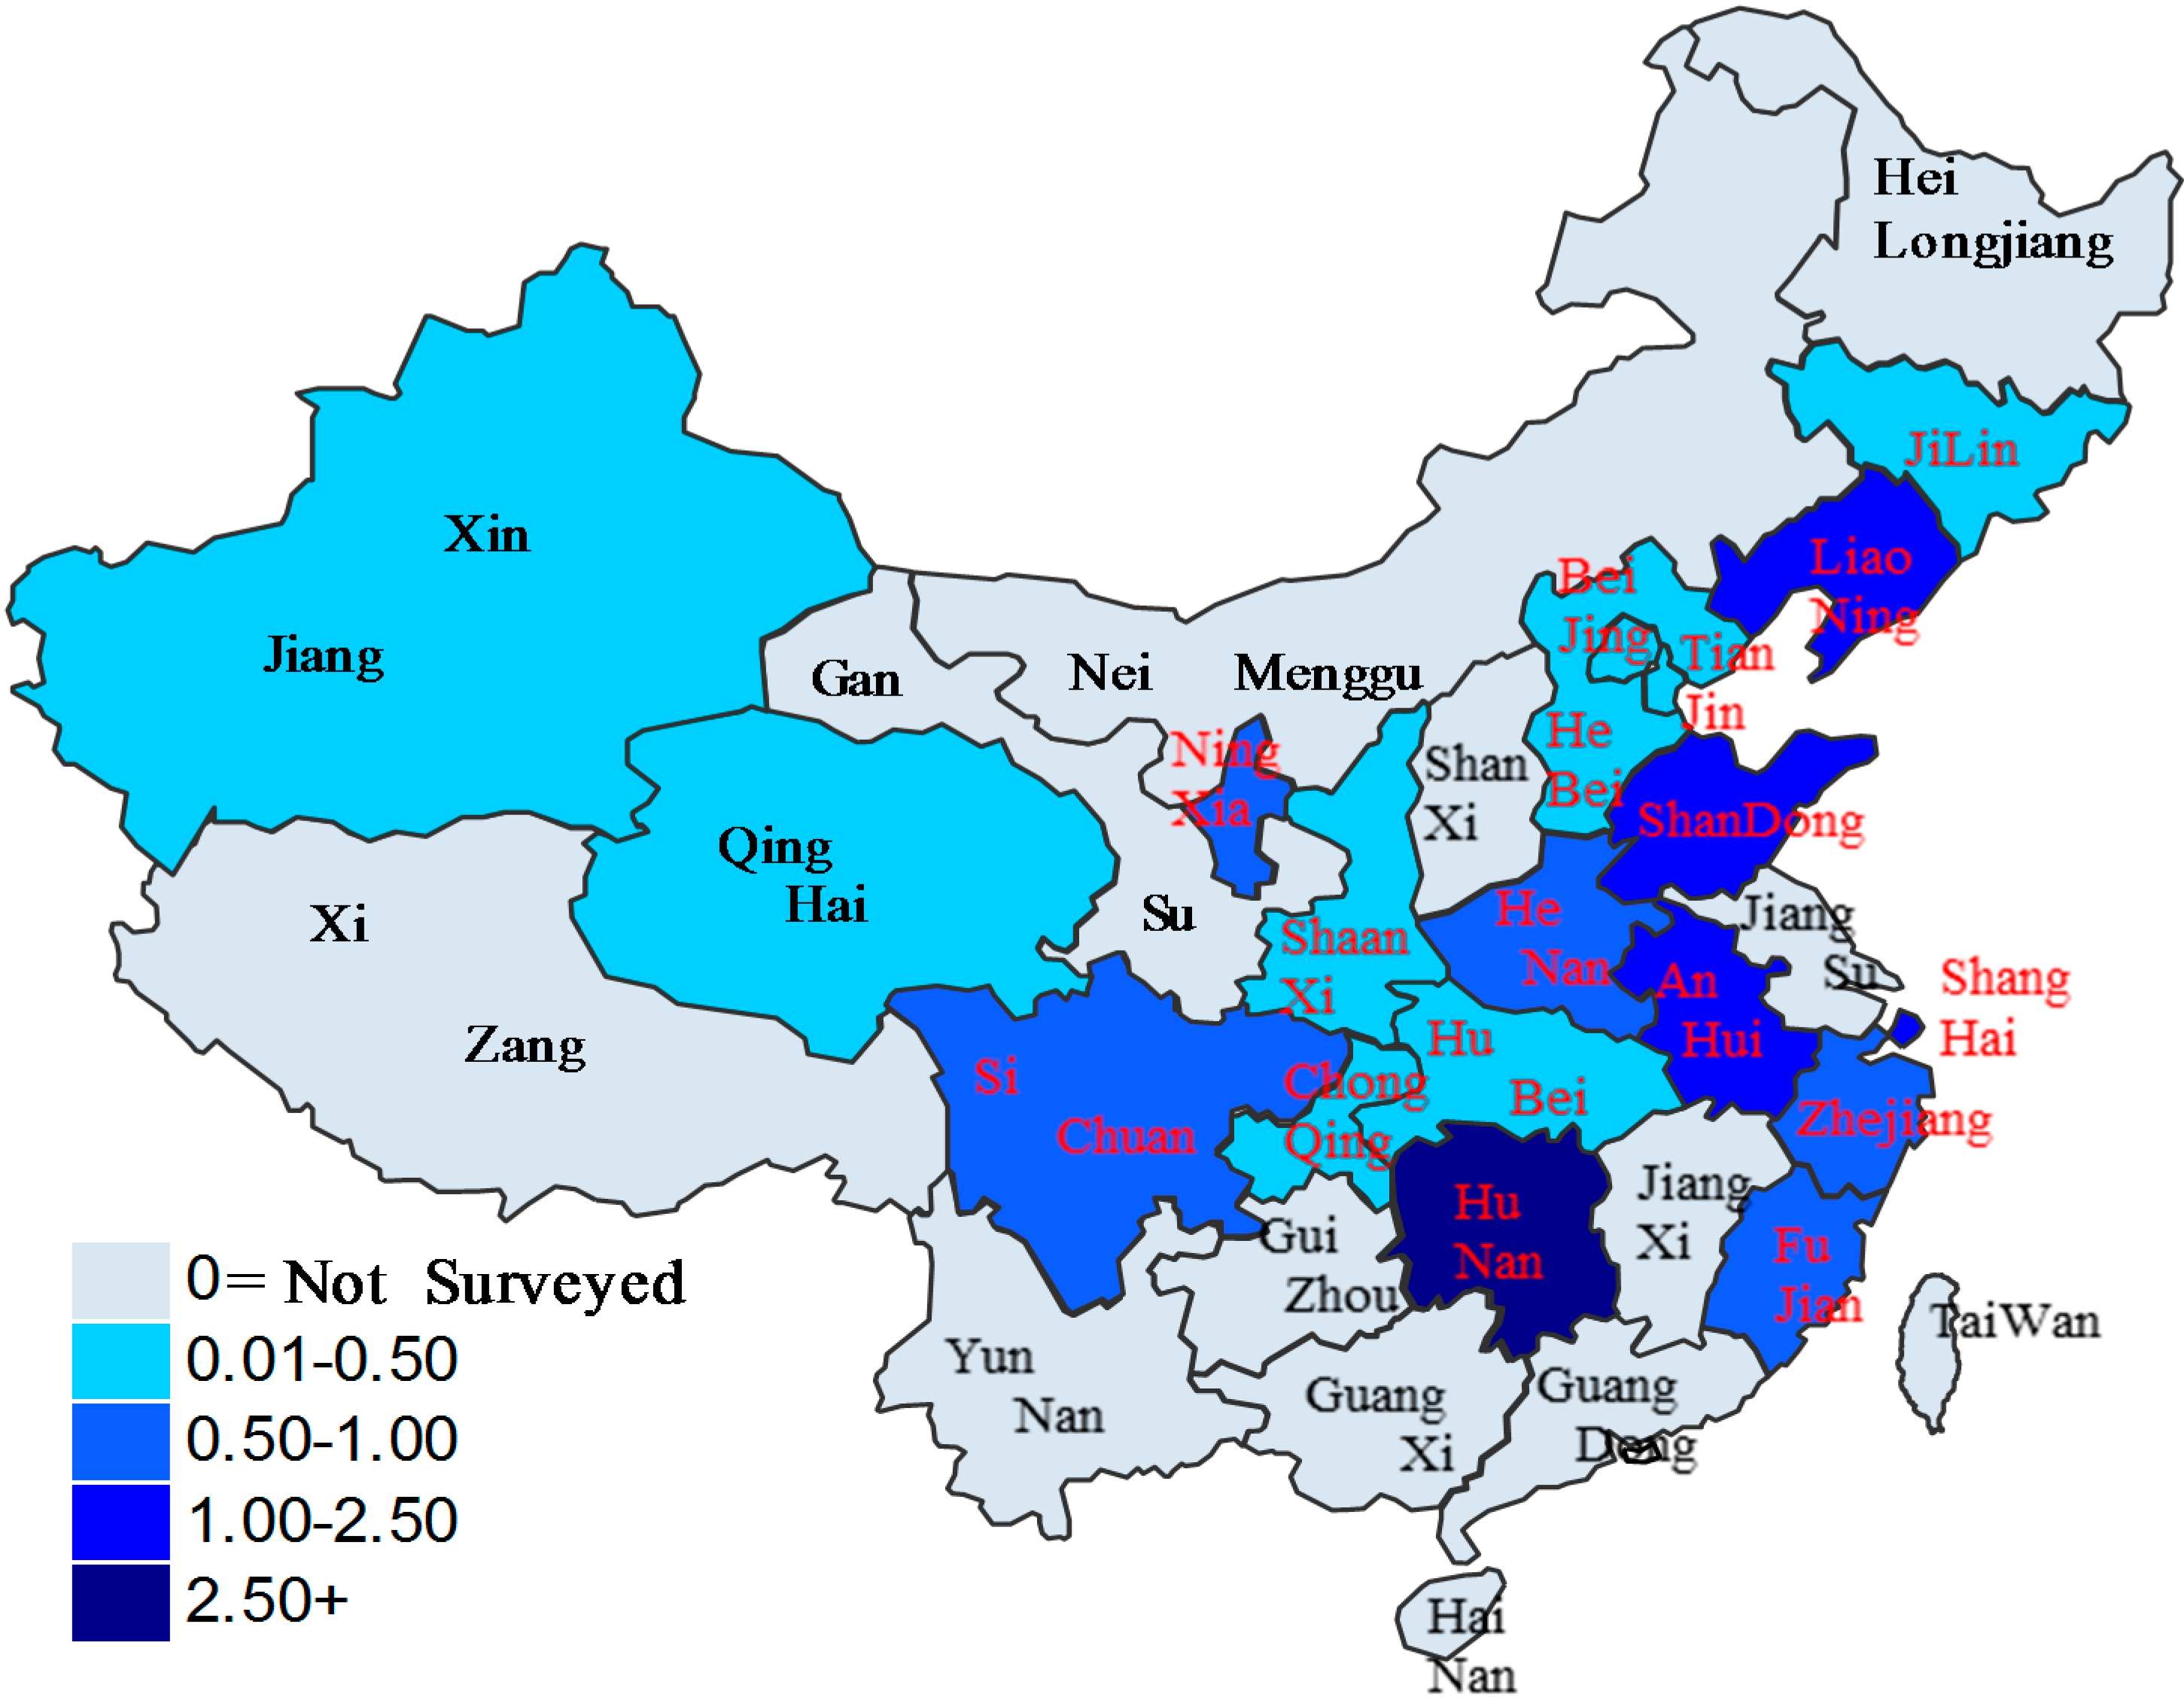
Construction industrialization is quantified as the total gross floor area of industrialized construction projects by province in this research. The total gross floor area of industrialized construction projects in 2014 within the 19 provinces and municipalities surveyed is found to be 16.76 million m
2. The regional distribution of construction industrialization is displayed in
Table 1: (1) among the 19 provinces and municipalities, Hunan is found to be the leading province, accounting for 3.75 million m
2 of gross floor area (22.4% of the total); (2) Liaoning Province is ranked second with a gross floor area of 2.24 million m
2 (13.4% of the total); and (3) Shanghai is ranked third with a gross floor area of 2.04 million m
2 (12.2% of the total). Among the remaining provinces and municipalities under study, Anhui Province and Shandong Province have also shown the momentum of construction industrialization, each with a gross floor area of more than 1 million m
2. The industrialized construction profile by province and municipality is illustrated using a map of China (
Figure 1). In
Figure 1, the colours ranging from dark blue to light blue show the decreasing floor area of industrialized construction, and the white area represents the non-surveyed regions. Overall, east China and central China have developed a large scale of construction industrialization, and Hunan Province, Liaoning Province, Shanghai Municipality, Anhui Province, and Shandong Province are the leaders in terms of construction industrialization in China.
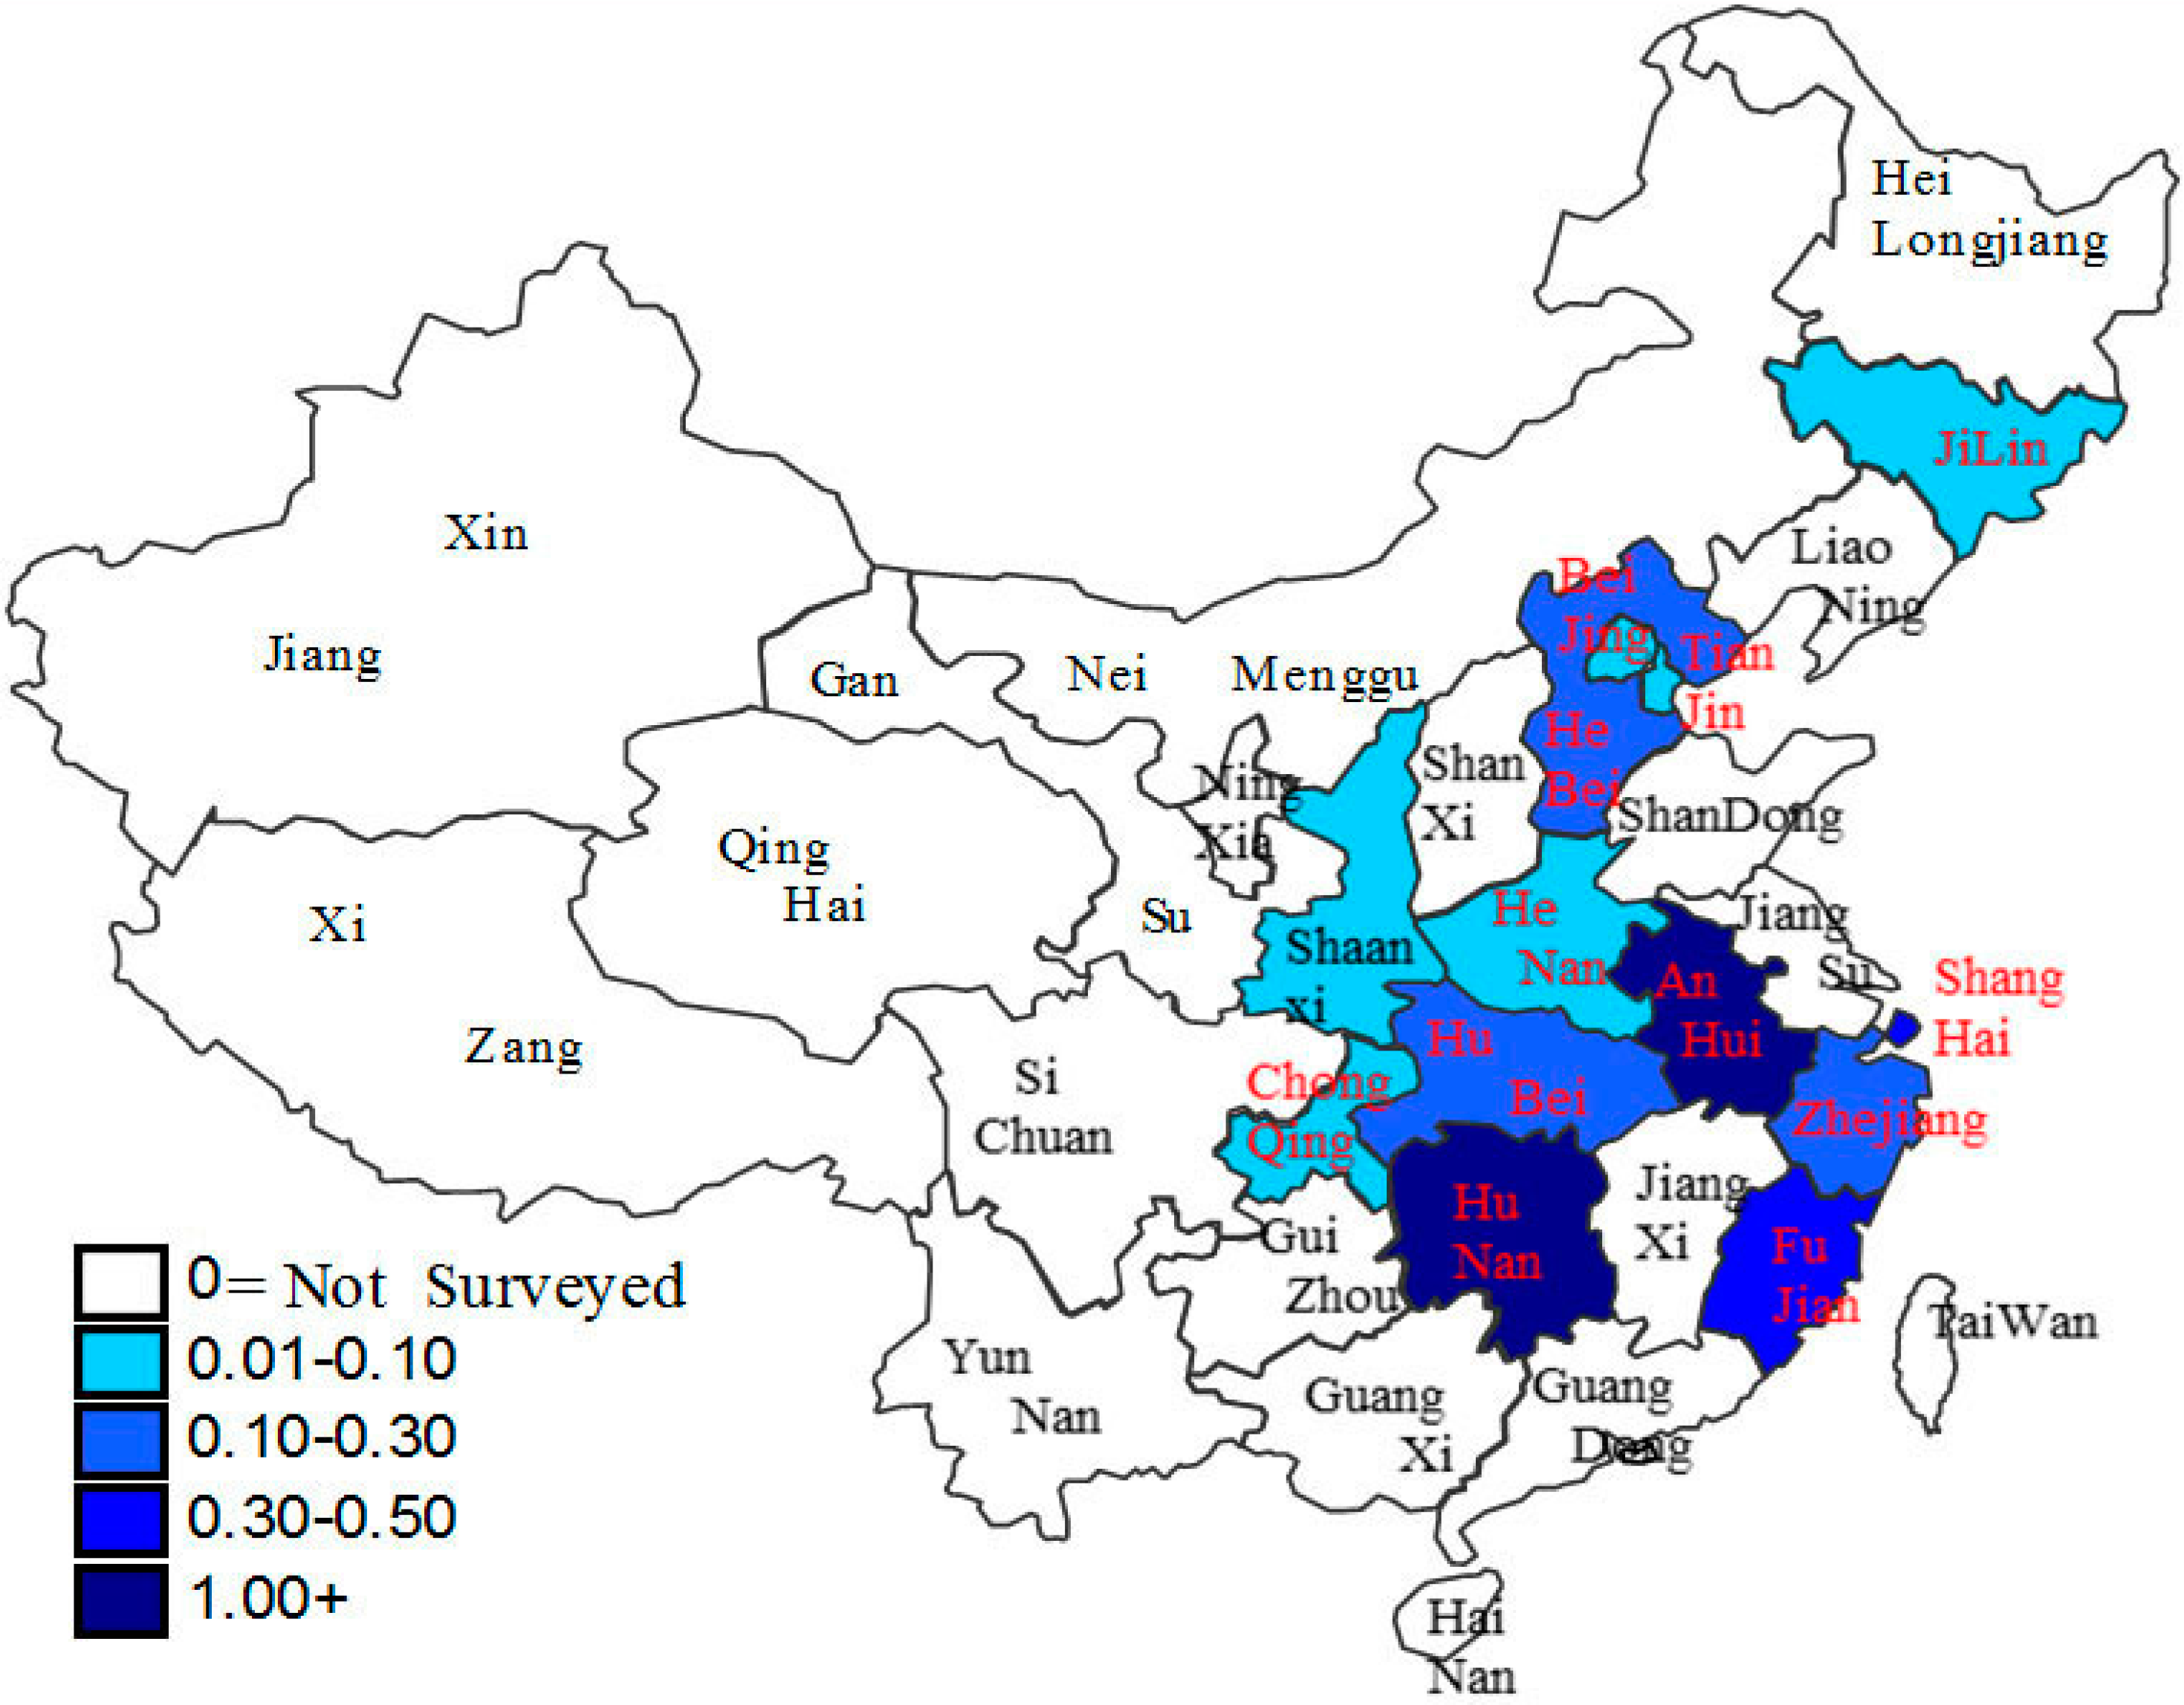
3.1.2. Net Floor Area
Among the 19 provinces and municipalities surveyed, 13 provinces and municipalities respond to the survey question pertaining to the prefabrication ratio (i.e., the percentage by area of the overall building that the prefabricated portions account for) for each project. Based on the gross floor area and the prefabrication ratios, the net floor area of prefabricated construction is displayed in
Table 2, from which it can be observed that Hunan Province is again ranked first in terms of net floor area, followed by Anhui Province, Fujian Province, Shanghai Municipality, and Zhejiang Province, sequentially. Industrialized construction by net floor area is demonstrated in the map shown in
Figure 2.
3.2. Industrialized Construction Profiles by Building Type and Structure Type
3.2.1. Building Type
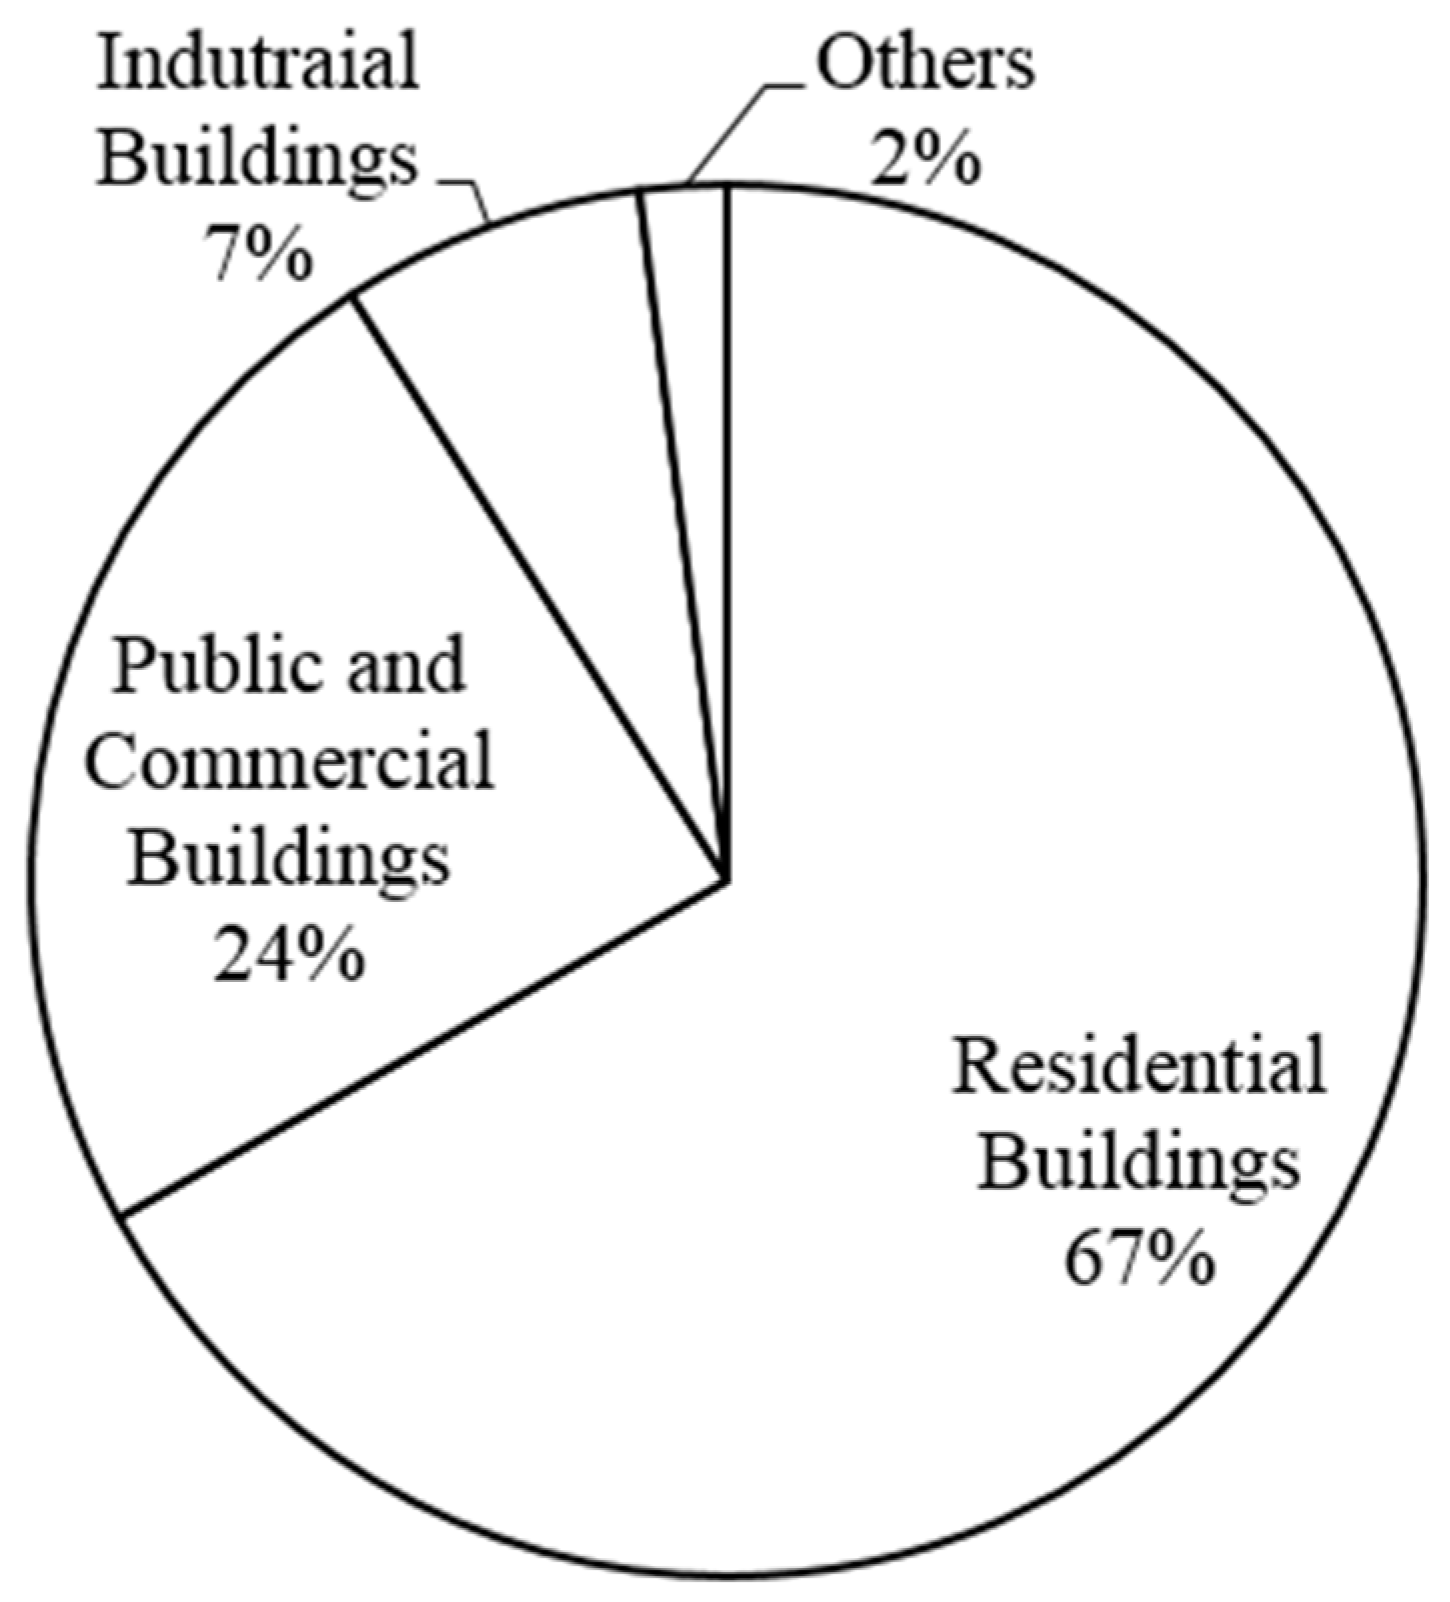
Industrialized construction is also analyzed by building type (i.e., residential buildings, public and commercial buildings, industrial buildings, and others.) in this research. The floor area distribution of different building types is illustarated in
Figure 3, from which it can be observed that affordable housing, public buildings, and residential buildings account for approximately 90% of total construction area, while publicly-funded buildings (i.e., affordable housing and public buildings) represent around half of the industrialized construction.
3.2.2. Structure Types
The survey results show that the projects constructed using industrialized construction methods mainly involve reinforced concrete and steel structures, while wood construction is rarely applied in industralized construction in China. The most frequently used structure is reinforced concrete, accounting for 77.1% of total gross floor area of prefabricated construction. Based on the fact that reinforced concrete is the predominant structure type for construction prefabrication in China, it is analyzed in terms of production capacity and actual production, as described in the following section.
3.3. Analysis of Reinforced Concrete Production Capacity and Actual Production
The production capacity of reinforced concrete is quantified as the volume of reinforced concrete for each province and municipality, based upon the number of prefabrication plants and the capacity of production plants in this survey.
Table 3 shows the production capacity of reinforced concrete for the 19 provinces and municipalities surveyed. In
Table 3, it can be observed that Hunan Province has the highest annual capacity (11.2 million m
3), accounting for 36.8% of the overall national reinforced concrete capacity, followed by Zhejiang Province (3.91 million m
3) and Shandong Province (2.88 million m
3).
Figure 4 demonstrates the production capacity of reinforced concrete by province and municipality in China. From the survey results, we are also informed that the reinforced concrete production is mainly carried out domestically in China (192 of a total of 203 production lines).
The actual production of reinforced concrete is obtained through the survey; the comparison between the production capacity and the actual production is listed in
Table 4. In
Table 4, it can be observed that: (1) the total actual production of reinforced concrete in 2014 only accounts for 8.55% the total production capacity; and (2) for each province/municipality, the ratio of the actual production and production capacity ranges between 2.31% (Tianjin) and 42.43% (Fujian). Overall, the production capacity of reinforced concrete greatly exceeds the actual production in 2014.
3.4. Prediction for the Next Five Years
Holt method involves a forecast equation and two smoothing equations (one for the level and one for the trend), which are displayed below [
9,
10].
Trend equation:
where
is the predicted value at time
t+
T;
is the observation value at time
t;
is an estimate of the level of the series at time
t;
T is the elapse time from time
t;
bt is an estimate of the trend (slope) of the series at time
t;
α is the smoothing parameter for the level, 0 ≤
α ≤ 1; and
β is the smoothing parameter for the trend, 0 ≤
β ≤ 1.
Based on the Holt theory and historical data, Eviews software is utilized to predict the industrialized construction floor area for each of the following years between 2016 and 2020. Considering that residential building and public and commercial building are the main building types for industrialized construction, three types of buildings—conventional residential buildings, advanced residential buildings, and office buildings—are predicted as the main building types in this research. The most recent twelve years of historical data (2004 to 2015) are archived from the National Bureau of Statistics of China [
15,
16], as listed in
Table 5.
In order to select appropriate values of α and β, multiple experiments are conducted to minimize the root mean squared error (RMSE). The prediction models and RMSE for conventional residential buildings, advanced residential buildings, and office buildings are presented below.
3.4.1. Conventional Residential Buildings
where
is the predicted value for 2016 onwards; 1066.51 is the estimated level of the series for the year 2015; 32.49 is the estimated trend (slope) of the series for the year 2015; and
T is the elapsed time from 2015. The smoothing parameter for level (
α), the smoothing parameter for trend (
β), and the RMSE are listed in
Table 6.
3.4.2. Advanced Residential Buildings
where
is the predicted value for the year 2016 onward; 47.40 is the estimated level of the series for the year 2015; 1.35 is the estimated trend (slope) of the series for the year 2015; and T is the elapsed time from 2015. The smoothing parameter for level (
α), the smoothing parameter for trend (
β), and the RMSE are listed in
Table 7.
3.4.3. Office Buildings
where
is the predicted value from 2016 on; 65.69 is the estimated level of the series for the year 2015; 3.27 is the estimated trend (slope) of the series for the year 2015; and T is the elapsed time from 2015. The smoothing parameter for level (
α), the smoothing parameter for trend (
β), and the RMSE are listed in
Table 8.
Based on the historical data and the prediction methods proposed above, the construction floor area is predicted for the years 2016 to 2020 (see
Table 5). In
Table 4, it can be observed that conventional residential buildings are the dominant building type for both the past years under study and future years being forecast, and that the construction floor area is predicted to reach 1228.97 million m
2 by 2020.
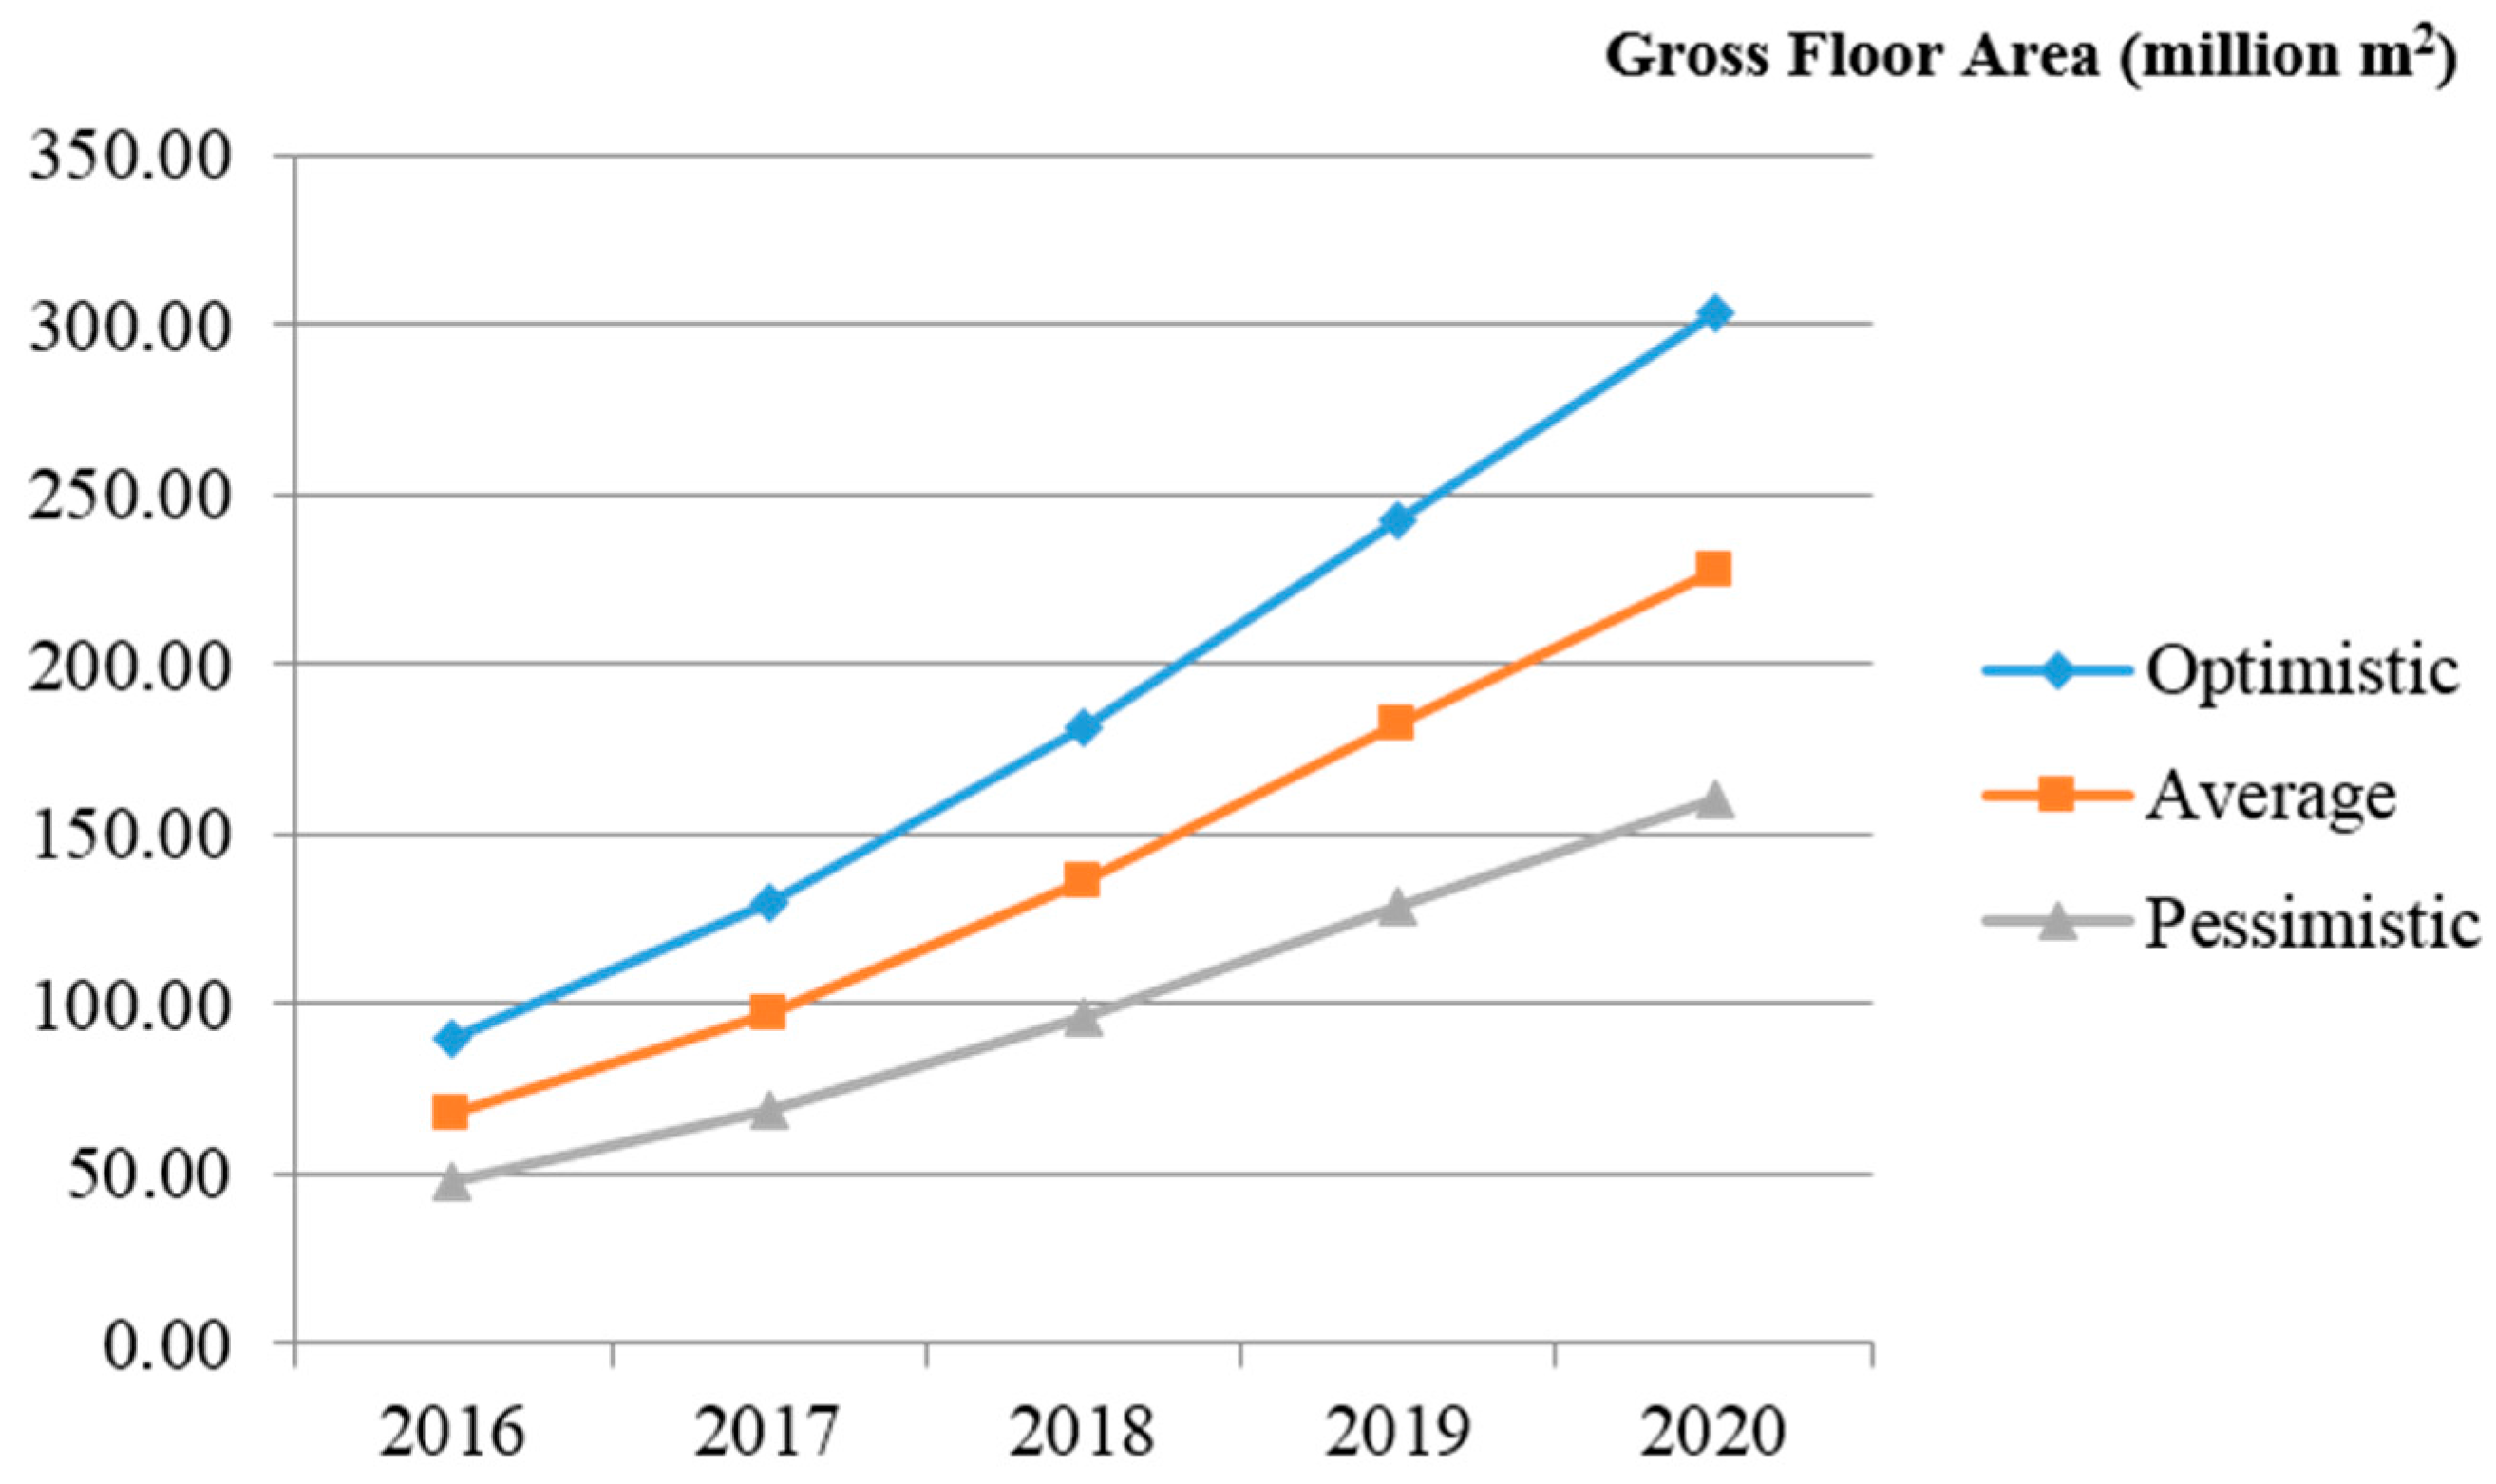
In order to analyze the construction industrialization trends in China, five influential experts in the field of construction industrialization are interviewed to predict the gross floor area of industrialized construction, in terms of construction industrialization ratio, for the next five years (2016 to 2020). The construction industrialization ratio indicates what percentage of gross floor areas will be built through construction industrialization. Three scenarios—“Optimistic”, “Average”, and “Pessimistic”—are adopted to predict the construction industrialization ratio for the main building types being analyzed—conventional residential buildings (i.e., high-rise buildings), advanced residential buildings (i.e., low-rise buildings such as single-family houses), and office buildings. The predicted construction industrialization ratios are listed in
Table 9, from which it can be observed that conventional residential buildings have a higher construction industrialization ratio than other building types. Combining the predicted gross floor areas in
Table 5 with the predicted construction industrialization ratios in
Table 9, the predicted construction industrialization floor areas of three scenarios for the main building types are listed in
Table 10 and
Figure 5, from which it can be observed that: (1) overall, an average of 100 million m
2 per year of gross floor area is predicted to be built through industrialized construction beginning in 2017, with a growing trend; (2) by 2020, an average of more than 200 million m
2 of gross floor area per year is forecast to be built through industrialized construction; and (3) conventional residential buildings will constitute the main building type of construction industrialization for the following years. The predicted results also coincide with related policy guidelines and predictions, which aim to achieve an overall construction industrialization ratio of 20% by 2020, and at least 30% by 2026 [
17,
18].
5. Conclusions
Construction industrialization is bringing in a new era of building construction in China. In order to investigate the advance of construction industrialization, a national survey was conducted in 2015 encompassing 19 key provinces and municipalities in China. Based on the data collected from the provincial and municipal governments and industry, it is found that the provinces and municipalities surveyed adopted industrialized construction on numerous projects in 2014, representing a total gross floor area of 16.76 million m2. Among the 19 provinces and municipalities studied, Hunan is the leading province, with a gross floor area of 3.75 million m2 (22.4% of the total), while Liaoning Province, Shanghai Municipality, Anhui Province, and Shandong Province also all adopted industrialized construction methods on a large scale, each with gross floor area exceeding 1 million m2. Industrialized construction is profiled with the use of a map, with different colours showing different levels of construction industrialization for 2014 in China. Furthermore, 13 surveyed provinces and municipalities respond to the survey question pertaining to prefabrication ratio (i.e., prefabricated portions as a percentage of overall area) for each project. Based on the gross floor area and the prefabrication ratios, the 13 responding provinces and municipalities are ranked in terms of net floor area of prefabricated construction, with Hunan Province again receiving the highest ranking, followed by Anhui Province, Fujian Province, Shanghai Municipality, and Zhejiang Province, sequentially. Industrialized construction is profiled with the use of a map, with different colours showing different levels of construction industrialization for 2014 in China.
In this research, construction industrialization is also analyzed by structure type and building type, and it is found that: (1) buildings constructed using industrialized construction methods mainly involve reinforced concrete (accounting for 77.1% of total gross floor area) and steel structures, while wood is rarely used in industralized construction in China; (2) affordable housing, public buildings, and residential buildings account for about 90% of total construction area, and publicly-funded buildings (i.e., affordable housing and public buildings) represent approximately half of industrialized construction; and (3) reinforced concrete is analyzed in terms of production capacity and actual production, and it is found that the production capacity tremendously exceeds the actual production in 2014. To predict the construction industrialization trends for the following five years (2016 to 2020), Holt linear forecasting model and Delphi method are utilized to predict the gross floor area of industrialized construction, based on the historical data. It is predicted that about 100 million m2 of gross floor area is predicted to be built annually through industrialized construction from 2017 on, with a growing trend; by 2020, an average of more than 200 million m2 of gross floor area is forecast to be built annually through industrialized construction.
Construction industrialization is an innovative transition in China, which will result in substantial benefits for both the industry and the public from a long-term perspective. However, the research results indicate that, at the onset of construction industrialization, the publicly-funded buildings are leading the process and fostering the market of construction industrialization. For sustained growth of construction industrialization, such means as policy, finance, and tax incentives need to be considered to promote the construction industrialization process. Furthermore, reinforced concrete and steel structures dominate the structural types of construction industrialization in China due to the high population density; the related technologies pertaining to building manufacturing and machinery need to be improved for both reinforced concrete and steel structures, which will enhance the affordability and secure the sustained construction industrialization. This research characterizes the progress of construction industrialization and future trends of construction industrialization in China; the research results provide information to shape future decision making by industry and government, and help to promote construction industrialization. This research also entails limitations due to the limited survey responses and interviewed experts; further surveys will be conducted in future research to validate the prediction results and track the continued progress of construction industrialization in China.
Acknowledgments
The authors are grateful for the support from the Natural Science Foundation of China Subject through the research project, “Research on collaborative innovation mechanism construction industrialization among stakeholders: Based on dynamic social network” (71401002), sponsorship from the National Key Research and Development Program of China through the project, “Comprehensive Supervision Platform and Demonstration of Industrialization Construction Evaluation” (2016YFC0701810), the Ministry of Science and Technology of the People’s Republic of China through the project, “Research on installation key technology and scale application demonstration” (2011BAJ10B06), and the Ministry of Science and Technology of the People’s Republic of China through the project, “Research on green building standards and different standards in different regions” (2012BAJ10B01).
Author Contributions
Yingbo Ji contributed to the questionnaire design and organized the national survey. Fadong Zhu was responsible for the prediction section and the figure drawings. Hongxian Li conceived the research framework and composed the paper manuscript. Mohamed Al-Hussein oversaw the research and reviewed the paper manuscript.
Conflicts of Interest
The authors declare no conflict of interest.
References
- Wang, N.; Ji, Y. Analysis on key factors to affect construction industrialization development in China. In Proceedings of the International Conference on Information Management, Innovation Management and Industrial Engineering, Information Management, Innovation Management and Industrial Engineering (ICIII), Kunming, China, 26–28 November 2010; pp. 64–67.
- Ji, Y. Construction Industrialization Development Research; China Architecture & Building Press: Beijing, China; Available online: http://www.bookask.com/book/129415.html (accessed on 01 April 2011).
- Li, H.X.; Esfahani, M.N.; Gül, M.; Yu, H.; Mah, D.; Al-Hussein, M. Carbon Footprint of Panelized Construction: An Empirical and Comparative Study. In Proceedings of the Construction Research Congress, Atlanta, GA, USA, 19–21 May 2014; pp. 21–23.
- Zhang, W. Historical Review and Status Estimation on the Development of Construction Industrialization in China. Constr. Archit. 1994, 3, 7–8. [Google Scholar]
- Ji, Y.; Li, X. Policy Suggestions on the Development of Construction Industrialization. Constr. Enterp. Manag. 2014, 5, 60–61. (In Chinese) [Google Scholar]
- State Council of the People’s Republic of China: Several Opinions for Further Strengthening the Management of the Urban Construction Planning. 2016. Available online: http://www.gov.cn/zhengce/2016-02/21/content_5044367.htm (accessed on 20 August 2016).
- Pinsonneault, A.; Kraemer, K.L. Survey Research Methodology in Management Information Systems: An Assessment. J. Manag. Inf. Syst. 1993, 10, 75–105. [Google Scholar] [CrossRef]
- Kelley, K.; Clark, B.; Brown, V.; Sitzia, J. Good Practice in the Conduct and Reporting of Survey Research. Int. J. Qual. Health Care 2003, 15, 261–266. [Google Scholar] [CrossRef] [PubMed]
- Holt, C.C. Forecasting Trends and Seasonals by Exponentially Weighted Averages; Carnegie Institute of Technology: Pittsburgh, PA, USA, 1957. [Google Scholar]
- Hyndman, R.J.; Athanasopoulos, G. Forecasting: Principles and Practice. 2016. Available online: https://www.otexts.org/book/fpp (accessed on 20 August 2016).
- Dalkey, N.; Helmer, O. An Experimental Application of the Delphi Method to the Use of Experts. Manag. Sci. 1963, 9, 458–467. [Google Scholar] [CrossRef]
- Green, K.C.; Armstrong, J.S.; Graefe, A. Methods to elicit forecasts from groups: Delphi and prediction markets compared. Foresight Int. J. Appl. Forecast. 2015, 8. Available online: http://repository.upenn.edu/marketing_papers/157/ (accessed on 20 May 2015). [Google Scholar]
- Bouzon, M.; Govindan, K.; Rodriguez, C.M.T.; Campos, L.M.S. Identification and Analysis of Reverse Logistics Barriers Using Fuzzy Delphi Method and AHP. Resour. Conserv. Recycl. 2016, 108, 182–197. [Google Scholar] [CrossRef]
- Wenjuanxing. 2015. Available online: http://www.sojump.com/?s=1 (accessed on 6 January 2015).
- National Bureau of Statistics of China. 2004. Available online: http://www.stats.gov.cn/english/Statisticaldata/AnnualData/ (accessed on 20 August 2016).
- National Bureau of Statistics of China. 2016. Available online: http://www.stats.gov.cn/tjsj/zxfb/201601/t20160119_1306094.html (accessed on 20 August 2016).
- China Concrete Precast Association (CCPA). Industrialized Construction Will Account for about 50% by 2025. 2015. Available online: http://www.ccpa.com.cn/ccpa/content/1100–8227941088246.html (accessed on 2 February 2017).
- State Council of the People’s Republic of China. Instructions on City Planning and Development Management. 2016. Available online: http://www.gov.cn/zhengce/2016-02/21/content_5044367.htm (accessed on 2 February 2017). [Google Scholar]
© 2017 by the authors. Licensee MDPI, Basel, Switzerland. This article is an open access article distributed under the terms and conditions of the Creative Commons Attribution (CC BY) license ( http://creativecommons.org/licenses/by/4.0/).


