Article

Design and Testing of a Novel Building Integrated Cross Axis Wind Turbine

1
Department of Mechanical Engineering, Faculty of Engineering, University of Malaya, Kuala Lumpur 50603, Malaysia
2
Department of Physics, Kebbi State University of Science and Technology, Aliero, Kebbi State 1144, Nigeria
3
Faculty of Engineering, Universiti Malaysia Sabah, Jalan UMS, Sabah 88400, Malaysia
*
Author to whom correspondence should be addressed.
Appl. Sci. 2017, 7(3), 251; https://doi.org/10.3390/app7030251
Submission received: 31 December 2016 / Revised: 6 February 2017 / Accepted: 27 February 2017 / Published: 8 March 2017
(This article belongs to the Section Energy Science and Technology)

Abstract

:
The prospect of harnessing wind energy in urban areas is not promising owing to low wind speeds and the turbulence caused by surrounding obstacles. However, these challenges can be overcome through an improved design of wind turbine that can operate efficiently in an urban environment. This paper presents a novel design of a building integrated cross axis wind turbine (CAWT) that can operate under dual wind direction, i.e., horizontal wind and vertical wind from the bottom of the turbine. The CAWT consists of six horizontal blades and three vertical blades for enhancing its self-starting behavior and overall performance. The study employed a mock-up building model with gable rooftop where both of the developed CAWT and the conventional straight-bladed vertical axis wind turbine (VAWT) are mounted and tested on the rooftop. The height of the CAWT and the VAWT above the rooftop was varied from 100 to 250 mm under the same experimental conditions. The results obtained from the experimental study showed that there is significant improvement in the coefficient of power (Cp) and self-starting behavior of the building integrated CAWT compared to the straight-bladed VAWT. At 100 mm height, the Cp,max value of the CAWT increased by 266%, i.e., from 0.0345 to 0.1263, at tip speed ratio (TSR) (λ) of 1.1 and at wind speed of 4.5 m/s. Similar improvements in performance are also observed for all condition of CAWT heights above the rooftop where the CAWT outperformed the straight-bladed VAWT by 196%, 136% and 71% at TSR of 1.16, 1.08, and 1.12 for Y = 150, 200, and 250 mm, respectively. Moreover, the CAWT performs better at 10° pitch angle of the horizontal blade compared to other pitch angles.

Graphical Abstract

1. Introduction

Mounting wind turbines in a built environment is estimated to have huge potential not only to satisfy the energy demands of the urban environment and provide decentralized generation but also to help tackle fuel poverty and to achieve the reduction in emissions [1]. Over the past decades, the significant progress made in the conversion of wind energy to electrical power is a result of considerable engineering research and development of wind machines with the emphasis on improved design, aerodynamics, structural and systems characteristics [2]. Research has shown that the mounting of wind turbines on urban buildings is affected by positioning (height above the roof ridge) and position relative to the prevailing wind direction [3]. The influence of the buildings on the wind turbines distinguished between the wind energy conversion in rural and urban areas [4]. However, Wind resource in the urban environment is complicated where the resource is proportionate to the surface topography, temperature influences and the dynamic nature of the urban environment [5]. Because of the high roughness length of the environment and the presence of obstacles characterized by different shapes and porousness along the flow stream path, the wind profile in urban areas is entirely not quite the same as the classical log-law based profile with the zero-speed elevation shifted up to a peculiar value (displacement, d) which is a function of the average height of the neighboring buildings (Figure 1) [6]. The wind speed increases logarithmically with height. The natural wind profile extrapolates to zero wind speed at zero displacement height (d) when above vegetation or buildings as shown in Equation (1).
u ¯ ( z ) =   U * k   ln ( z d z o )
where U* is the friction velocity, k is the von Karman’s constant, zo is the roughness length, d is the displacement height and u ¯ (z) is the average wind speed at height z above ground [3]. The wind profile in the internal boundary layer in an urban environment is shown in Figure 1. Other factors includes the orientation of the buildings to each other, the rooftop layout, street canyons, and trees [7].
Wind turbines on rooftops operate at about 20% higher wind speed than the undisturbed wind [4]. The slope of the roof has an effect on the wind speed over the buildings [8]. The significant improvement in the operating efficiencies of wind power systems makes them more economically competitive to other energy generation techniques [9]. At present, two main categories of wind turbines have been used for electricity generation based on the axis about which the wind turbines rotate; the horizontal axis wind turbines (HAWTs) and the vertical axis wind turbines (VAWTs) [10,11]. Both turbines have their merits and demerits. The HAWT can achieve higher energy efficiencies and is capable to self-start at low wind speed but it only operates under one wind direction and thus requires a yaw mechanism to direct the turbine into the wind. It also has a high cost of maintenance and repairs due to the tower structure and the placement of the transmission and electrical generation equipment at the hub [9]. Furthermore, it is dangerous to surrounding birds and has a high noise level so it is not suitable for the urban environment [12].
Owing to these disadvantages, the VAWT has attracted, much attention recently, in comparison to the HAWT. The VAWT is omni-directional and hence averts the need for a yawing mechanism. The transmission and electrical generation equipment can be located at the ground level, making the installation, operation and maintenance much easier and suitable for the urban environment [12]. Although Darrieus wind turbine was previously known for its difficulty in self-start [13,14,15], recent studies have shown that there are certain conditions that can make it otherwise. According to the recent literature on self-starting ability of the H-Darrieus wind turbine, Dominy et al. [16] and Hill et al. [17] demonstrated that it is possible to have a self-start three-bladed H-rotor VAWT using a fixed geometry and symmetrical airfoils. This study was confirmed by Bianchini et al. [18] and by using a numerical code they evaluated the transient behavior of H-Darrieus turbines under generic wind conditions in terms of velocity and direction. They also investigated the influence of the airfoil type and the blade shape on the startup capabilities of the rotor as a function of the initial position of the rotor and the oncoming wind velocity. Kirke [19] reported that the self-starting torque and low speed torque problem of VAWTs can be overcome either by passive variable pitch or by a combination of suitable blade airfoil sections. Dominy et al. [16] asserted that a lightly loaded, three-bladed rotor always has the potential to self-start under steady wind condition. Similar studies on the self-starting ability of VAWTs are reported in [20,21,22]. The VAWT operates with any horizontal wind direction (Figure 2). The VAWT is further sub-divided into two distinct types, i.e., the lift type (often refer to as Darrieus turbines) in Figure 2a which uses the lift force acting on the blades to rotate the rotor and generate power [11], and the drag type (Savonius rotor) in Figure 2b which consists of cup-shaped half, hollow cylinders fixed to a central rotating shaft, and the torque is generated due to the drag force acting on the half cylinders [23].
Wind turbine performance is commonly characterized by the relationship of the coefficient of power (Cp) and the tip speed ratio (TSR). The Cp of a wind turbine is defined as the ratio of the actual power extracted by the rotor to the theoretical power available. The Cp represents the efficiency of a wind turbine. It describes how much power can be extracted from the wind by a wind turbine. It varies from one wind turbine to another. According to the Betz limit, the theoretical Cp value of a wind turbine is 59.3%. The Cp, of the CAWT is calculated using Equation (2).
C p   =   P 0.5. ρ . A . U 3
where P is the power generated by the turbine (W); ρ is the density (1.23 kg/m3); A is the swept area of the rotor (m2); and U is the free stream wind speed (m/s).
The Cp varies with the TSR, (λ). The Cp values increases with increase in λ. The Cp reaches its maximum at a certain λ and then decreases with increase in λ. The TSR (λ) is the ratio of the mean blade tip speed to the wind velocity. The TSR is calculated using Equation (3).
TSR = λ = Ω U = ω r U
where r is the radius of the rotor (m); ω = 2πf is the angular velocity (rad/s); and f is the rotational frequency (Hz).

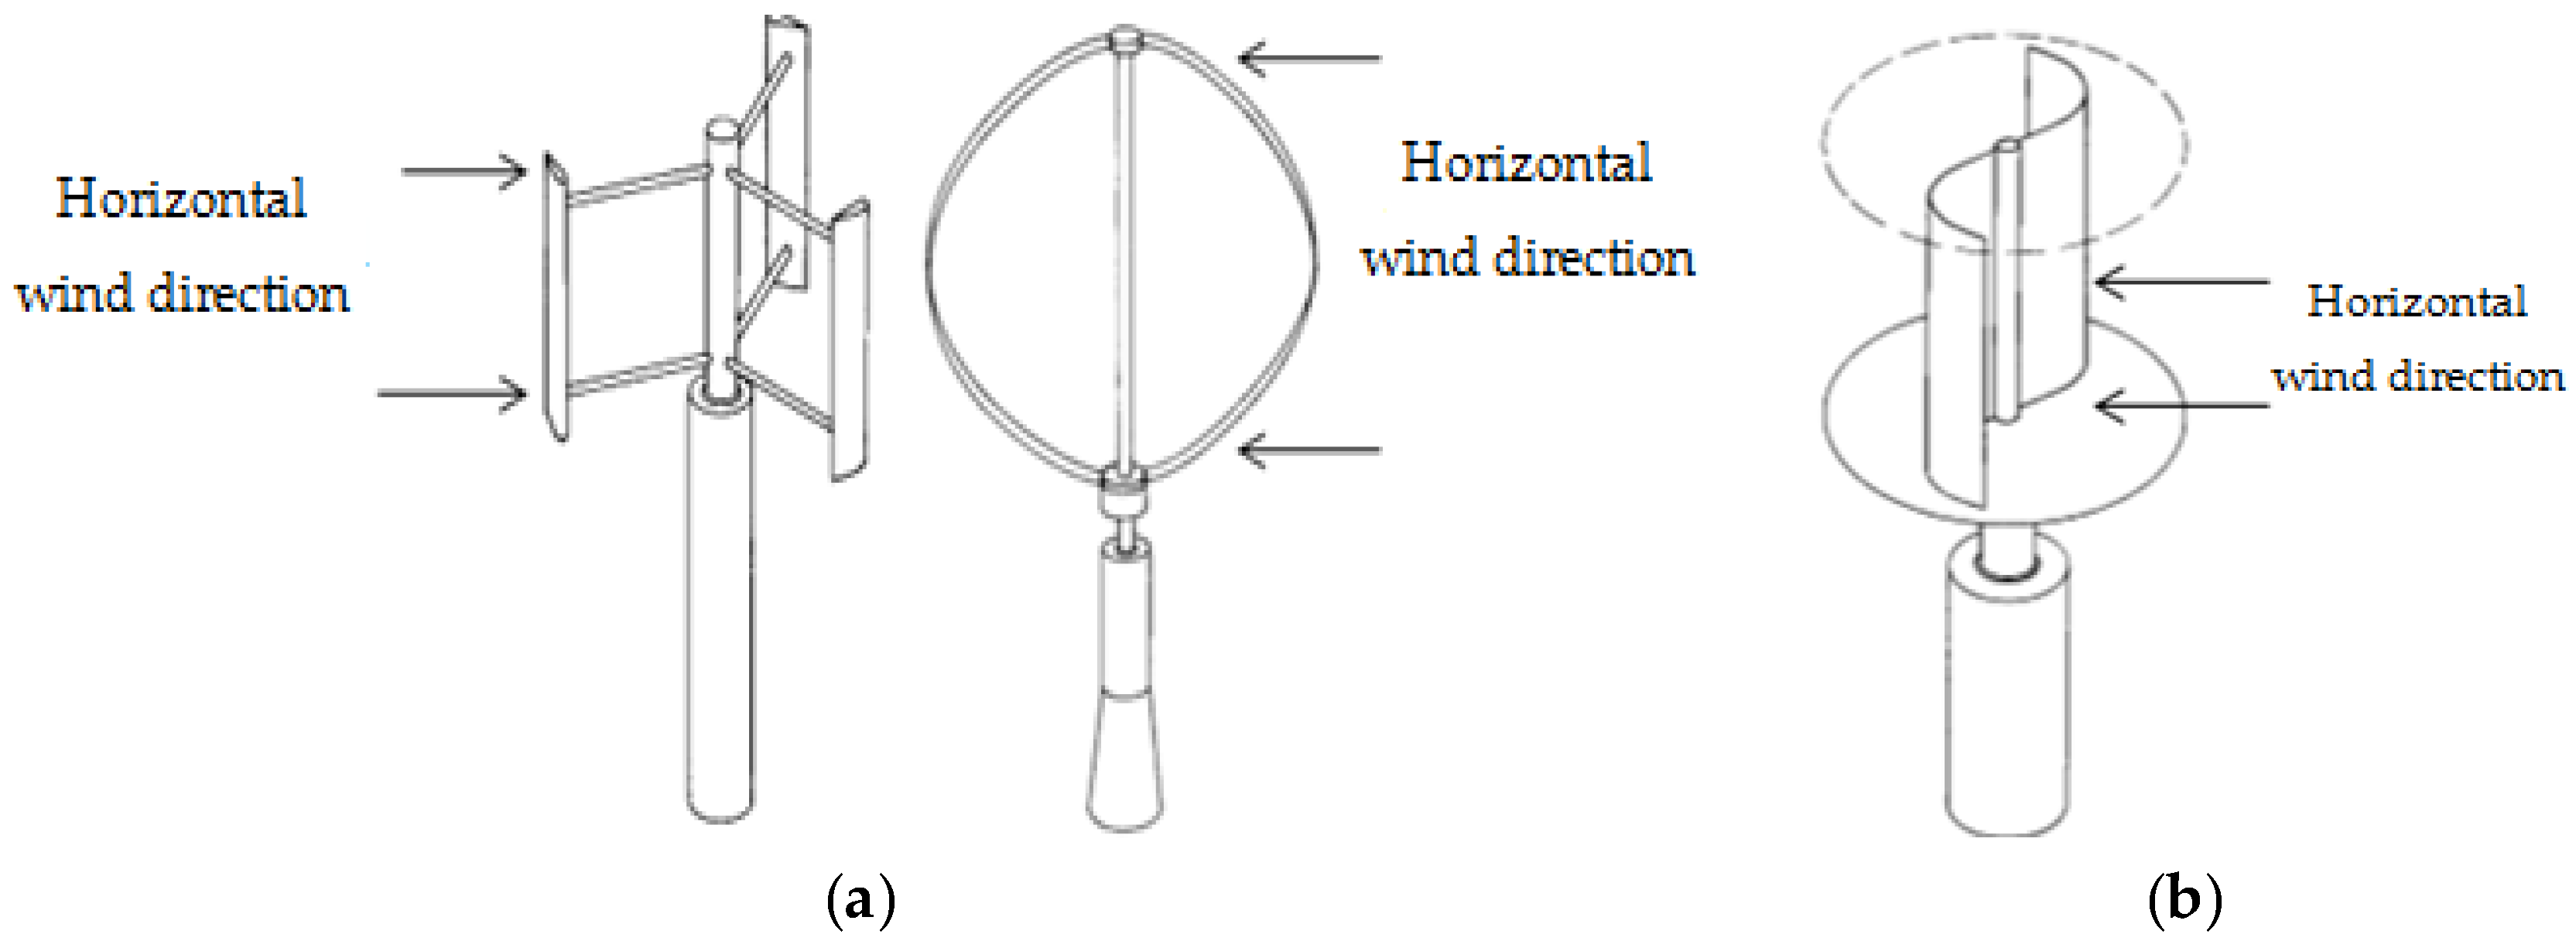
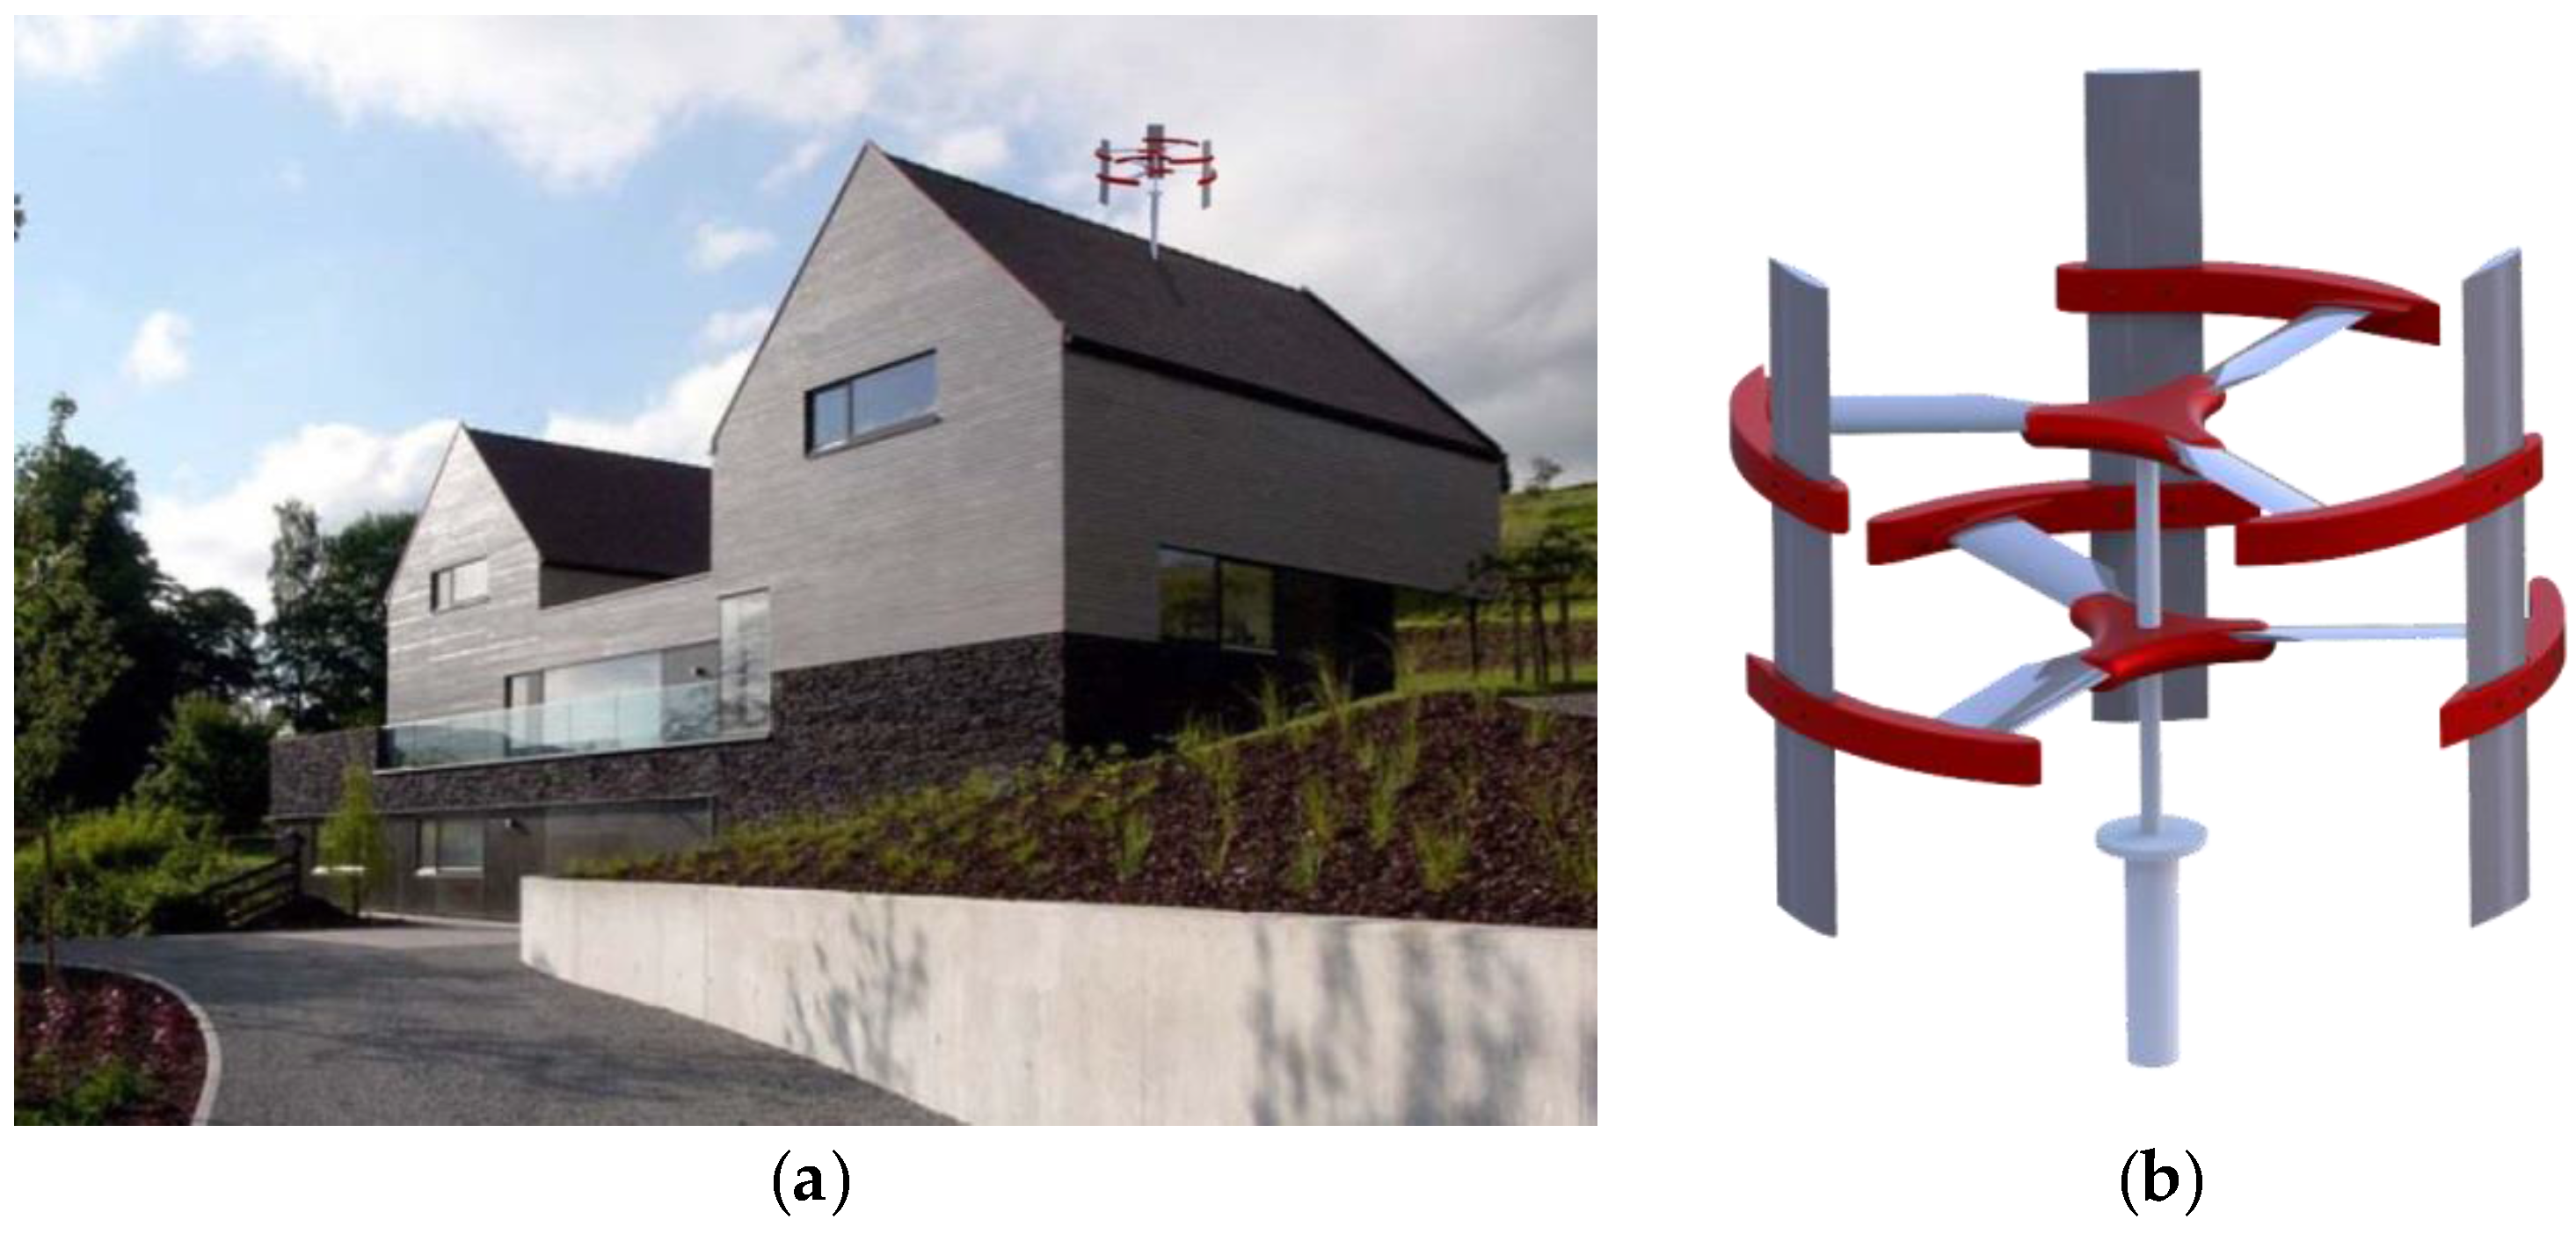
2. Building Integrated Wind Turbines

Integrating wind turbines onto buildings is considered a low-cost and effective way to harness renewable energy for buildings [25]. A building integrated wind turbine has the potential to reduce harmful carbon gas emissions from buildings, and it is suitable for on-site energy generation for urban environments. Despite their great potential, building integrated wind turbines have limited number of installations due to low wind speed, high level of turbulence and aerodynamic noise [26]. Dayan [27] suggested the mounting of wind turbines on top of high-rise buildings for a greater opportunity for wind energy generation in an urban area, and on buildings with special roof shapes [28]. The shape of buildings offers the possible benefits by augmentation of wind flow around buildings for wind energy generation as theoretically identified by Mertens [29]. Dutton et al. [30] suggested that the locations of the acceleration effects over different roof shapes should be investigated in order to take advantage of the increased wind speed which translates into more energy yield. Ledo et al. [26] studied the flow around pitched, pyramidal and flat roofs under three wind directions (0°, 45°, and 90°) for the purpose of mounting wind turbines. Gerald et al. [31] conducted a study on a Sistan type wind mill energy converter for building integration. The results of the research show that the improvement on the design could lead to an increase in theoretical efficiency of about 48% (conservative) or 61% (optimistic). The concept of utilizing the building shape for wind energy harvesting is also presented by Sharpe and Proven [32]. The study indicates that improved visual integration into new and existing buildings and augmentation airflow can be achieved by utilizing a lightweight cowling system.
The use of H-Darrieus wind turbine in buildings seems a favorable proposition because the H-Darrieus does not suffer from frequent changes in wind directions [33]. Wind turbine in urban buildings operates near, on, and in the wake of bluff bodies larger than the rotor scale and these flow conditions may result in skewed flow operation [34]. Many studies have been reported on H-Darrieus wind turbine in skewed flow. Bianchini et al. [35] developed an improved model for the performance prediction of H-Darrieus rotor under skewed flow. The model, which is based on momentum model, was properly modified to account for the variations induced by the new directions of the flow on the rotor. Results from the study indicate that a notable agreement has been constantly obtained between simulations and experiments. On the other hand, The variation in optimal performance of a H-Darrieus vertical axis wind turbine in skewed flow has been studied by Simao-Ferreira et al. [36] using an analytical approach. They predicted the variation in thrust, torque, tip speed ratio, and power generated using the momentum method. The results indicate that a high correlation between experimental and theoretical results can be achieved. Similar studies have been reported by Ferreira [34]. In this study, the incoming flow and the wake of the VAWT in skewed and non-skewed flow was measured; the results obtained indicate that in the non-skewed flow case, the flow in the rotor, around the downwind passage of the blade and in the wake, is mainly defined by the upwind passage of the blade. Mertens et al. [33] studied the behavior of a H-Darrieus VAWT in skewed flow condition and compared it with a model based on the blade element momentum theory. The results indicate that the H-Darrieus produces an increased power output in skewed flow. This is due to the increase in the effective surface area of the rotor. Ferreira [34] reported that in a non-skewed flow, the downwind half of the rotation of the VAWT blades operates in the wake of the upwind blade passage therefore resulting in lower energy content. On the other hand, in a skewed flow, the downwind passage of the wake is only partially in the wake of the upwind passage. In the upwind passage of the blade (where it is under higher loadings), the wake is generated by the shading of stronger vorticity than in the downwind passage. Since the VAWT operates in the wake of the upwind blade passage, the wake generated by the upwind blades might alter the flow that the downwind blade experiences therefore reducing the content of the power output to be extracted by the blades at the downwind side [20]. It was also observed by Chowdhury [37] that the wake of a tilted VAWT would proceed downstream in tilted manner, As a result, the wake of the tilted turbine would be shifted downward. The wake on the upwind side of the VAWT reduces the tangential thrust force experience by the blade on the downwind side of the VAWT.
In this study, a new type of wind turbine called the cross axis wind turbine (CAWT) was designed and integrated onto a building model with a gable roof shape. The main objective of this new concept of the wind turbine is to take advantage of the merits of both the HAWT and the VAWT while overcoming their respective demerits. The CAWT consists of both horizontal blade rotor and vertical blade rotor combined together as a compact design to be integrated on the rooftop of urban buildings in order to take advantage of the accelerating effect at the rooftop. The novel CAWT is discussed in detail in the following section.

3. Novel Design of a Cross Axis Wind Turbine (CAWT)

The challenges being faced in installing wind turbines onto urban buildings are due to the demerits of both the HAWT and the VAWT. However, these challenges can be overcome through the design of a novel building integrated CAWT that can function with dual wind directions (i.e., from the horizontal and vertical directions).

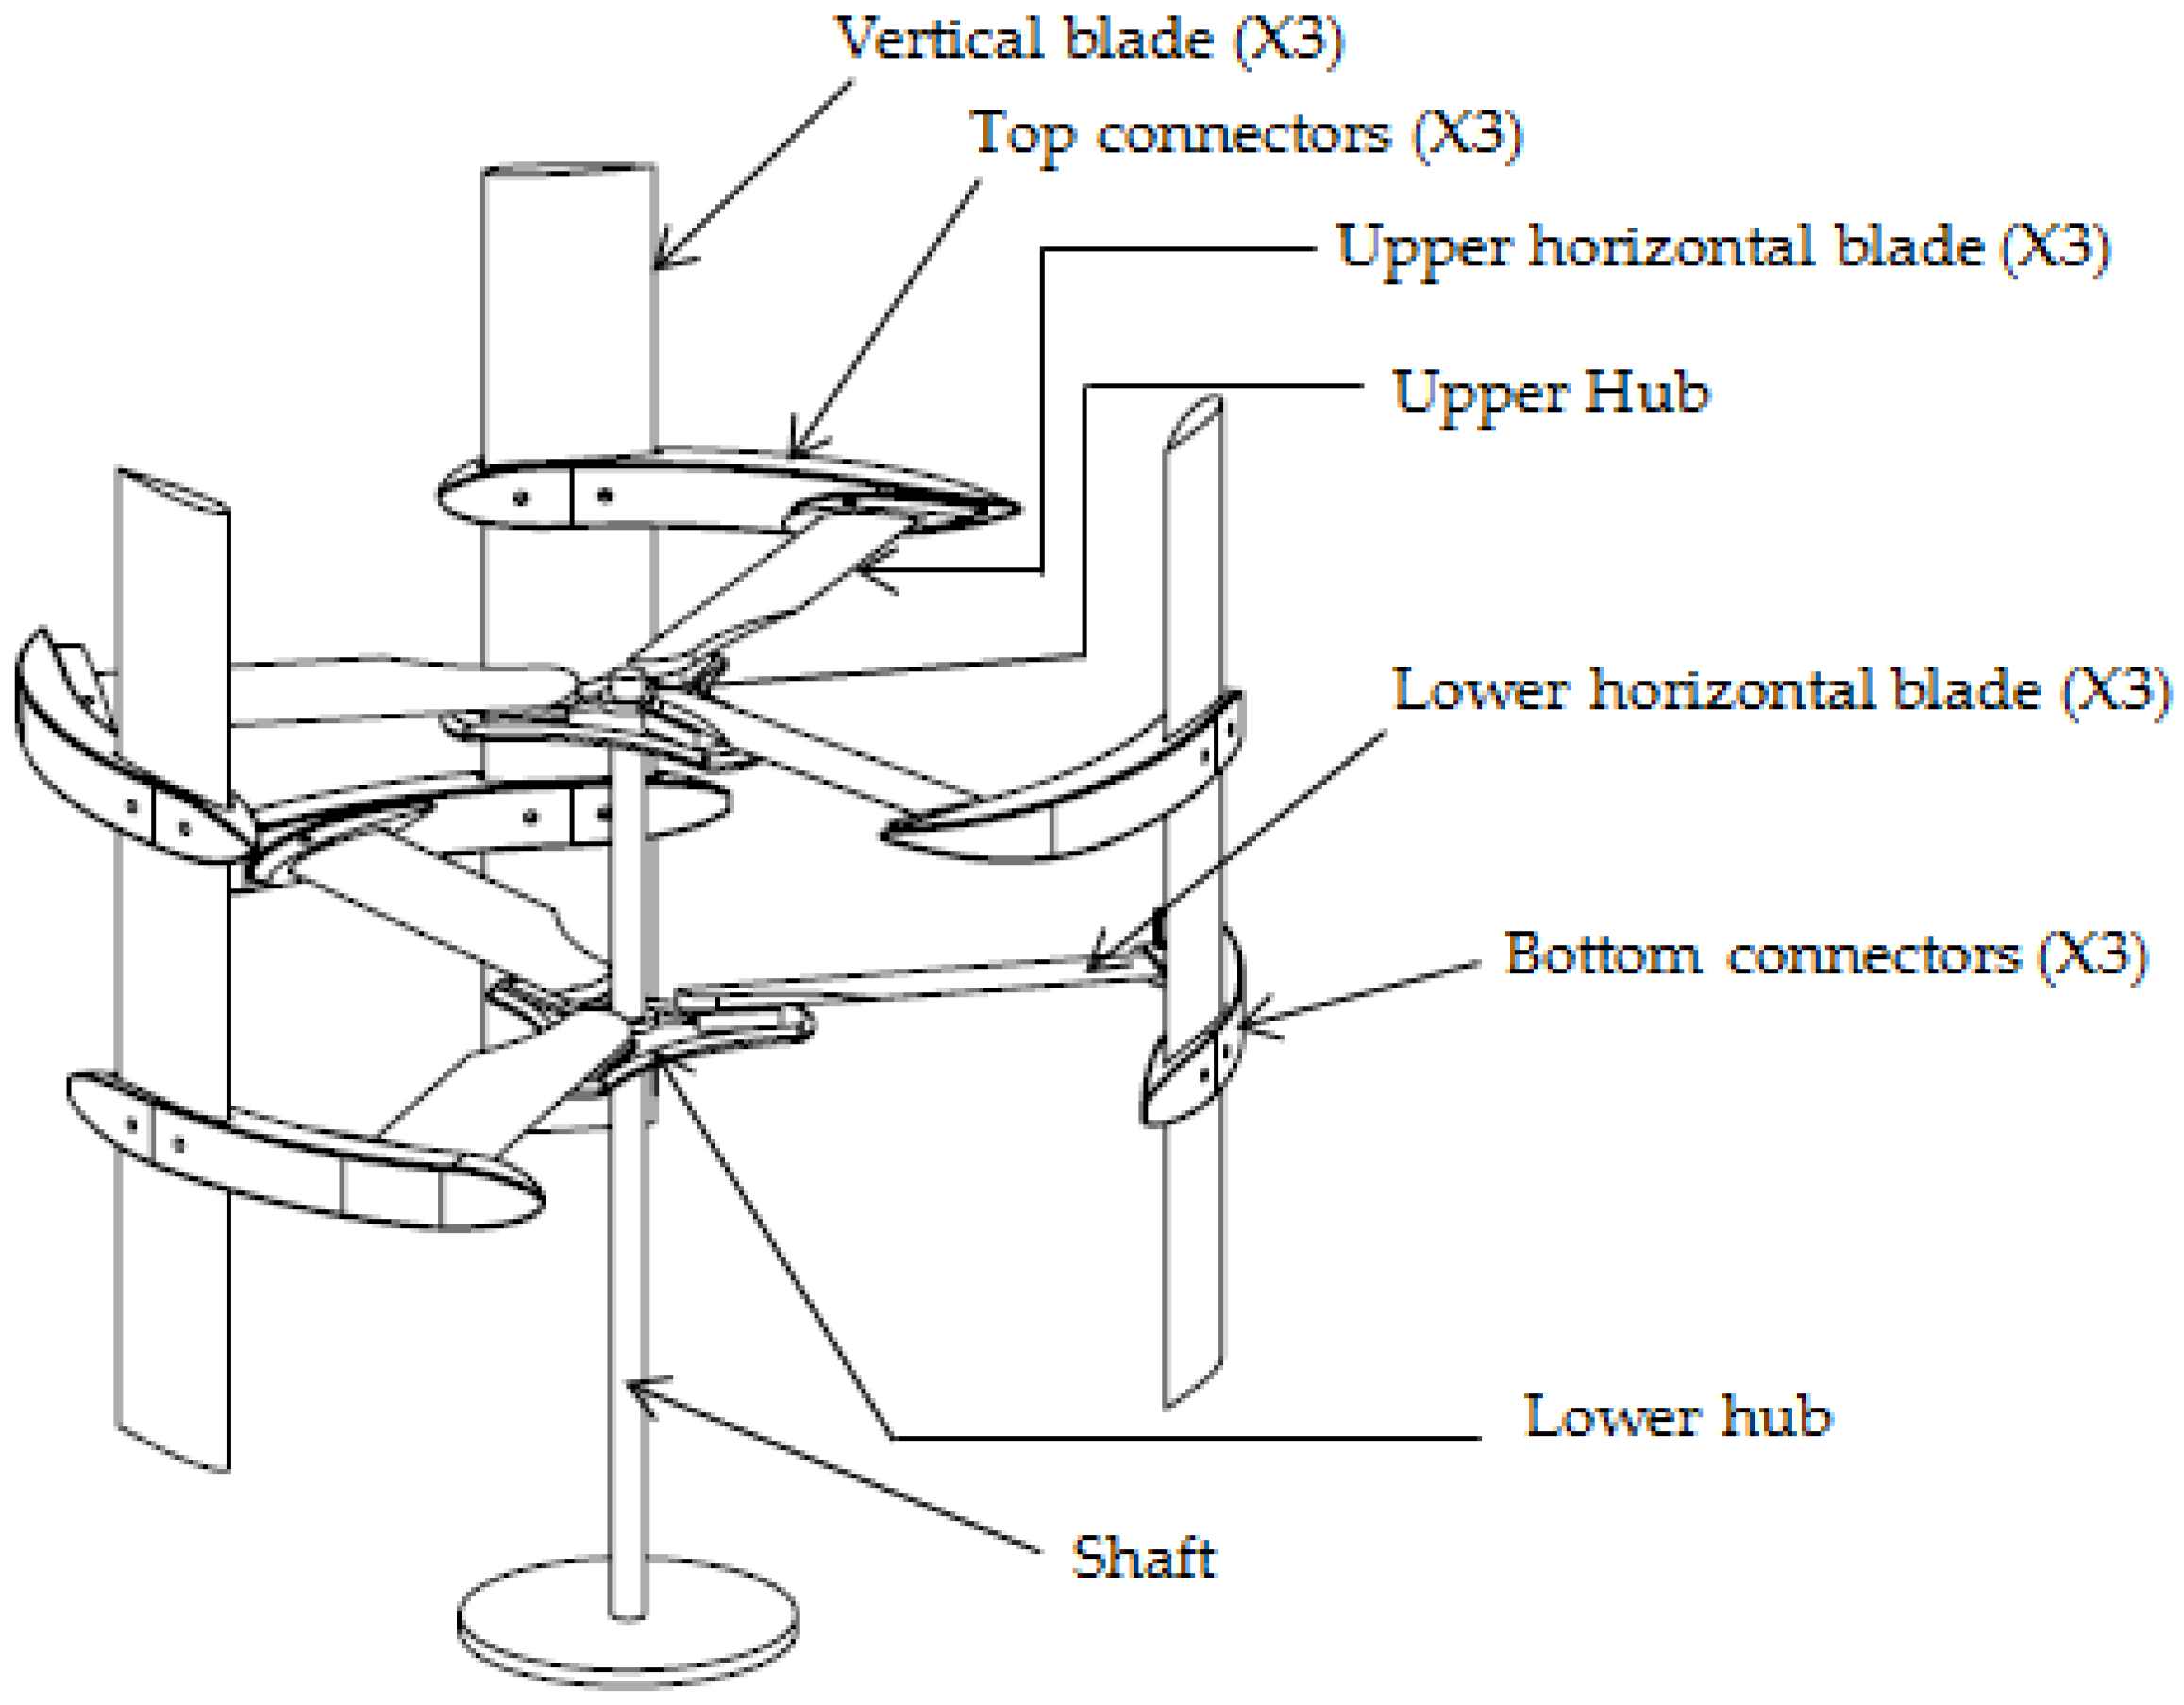
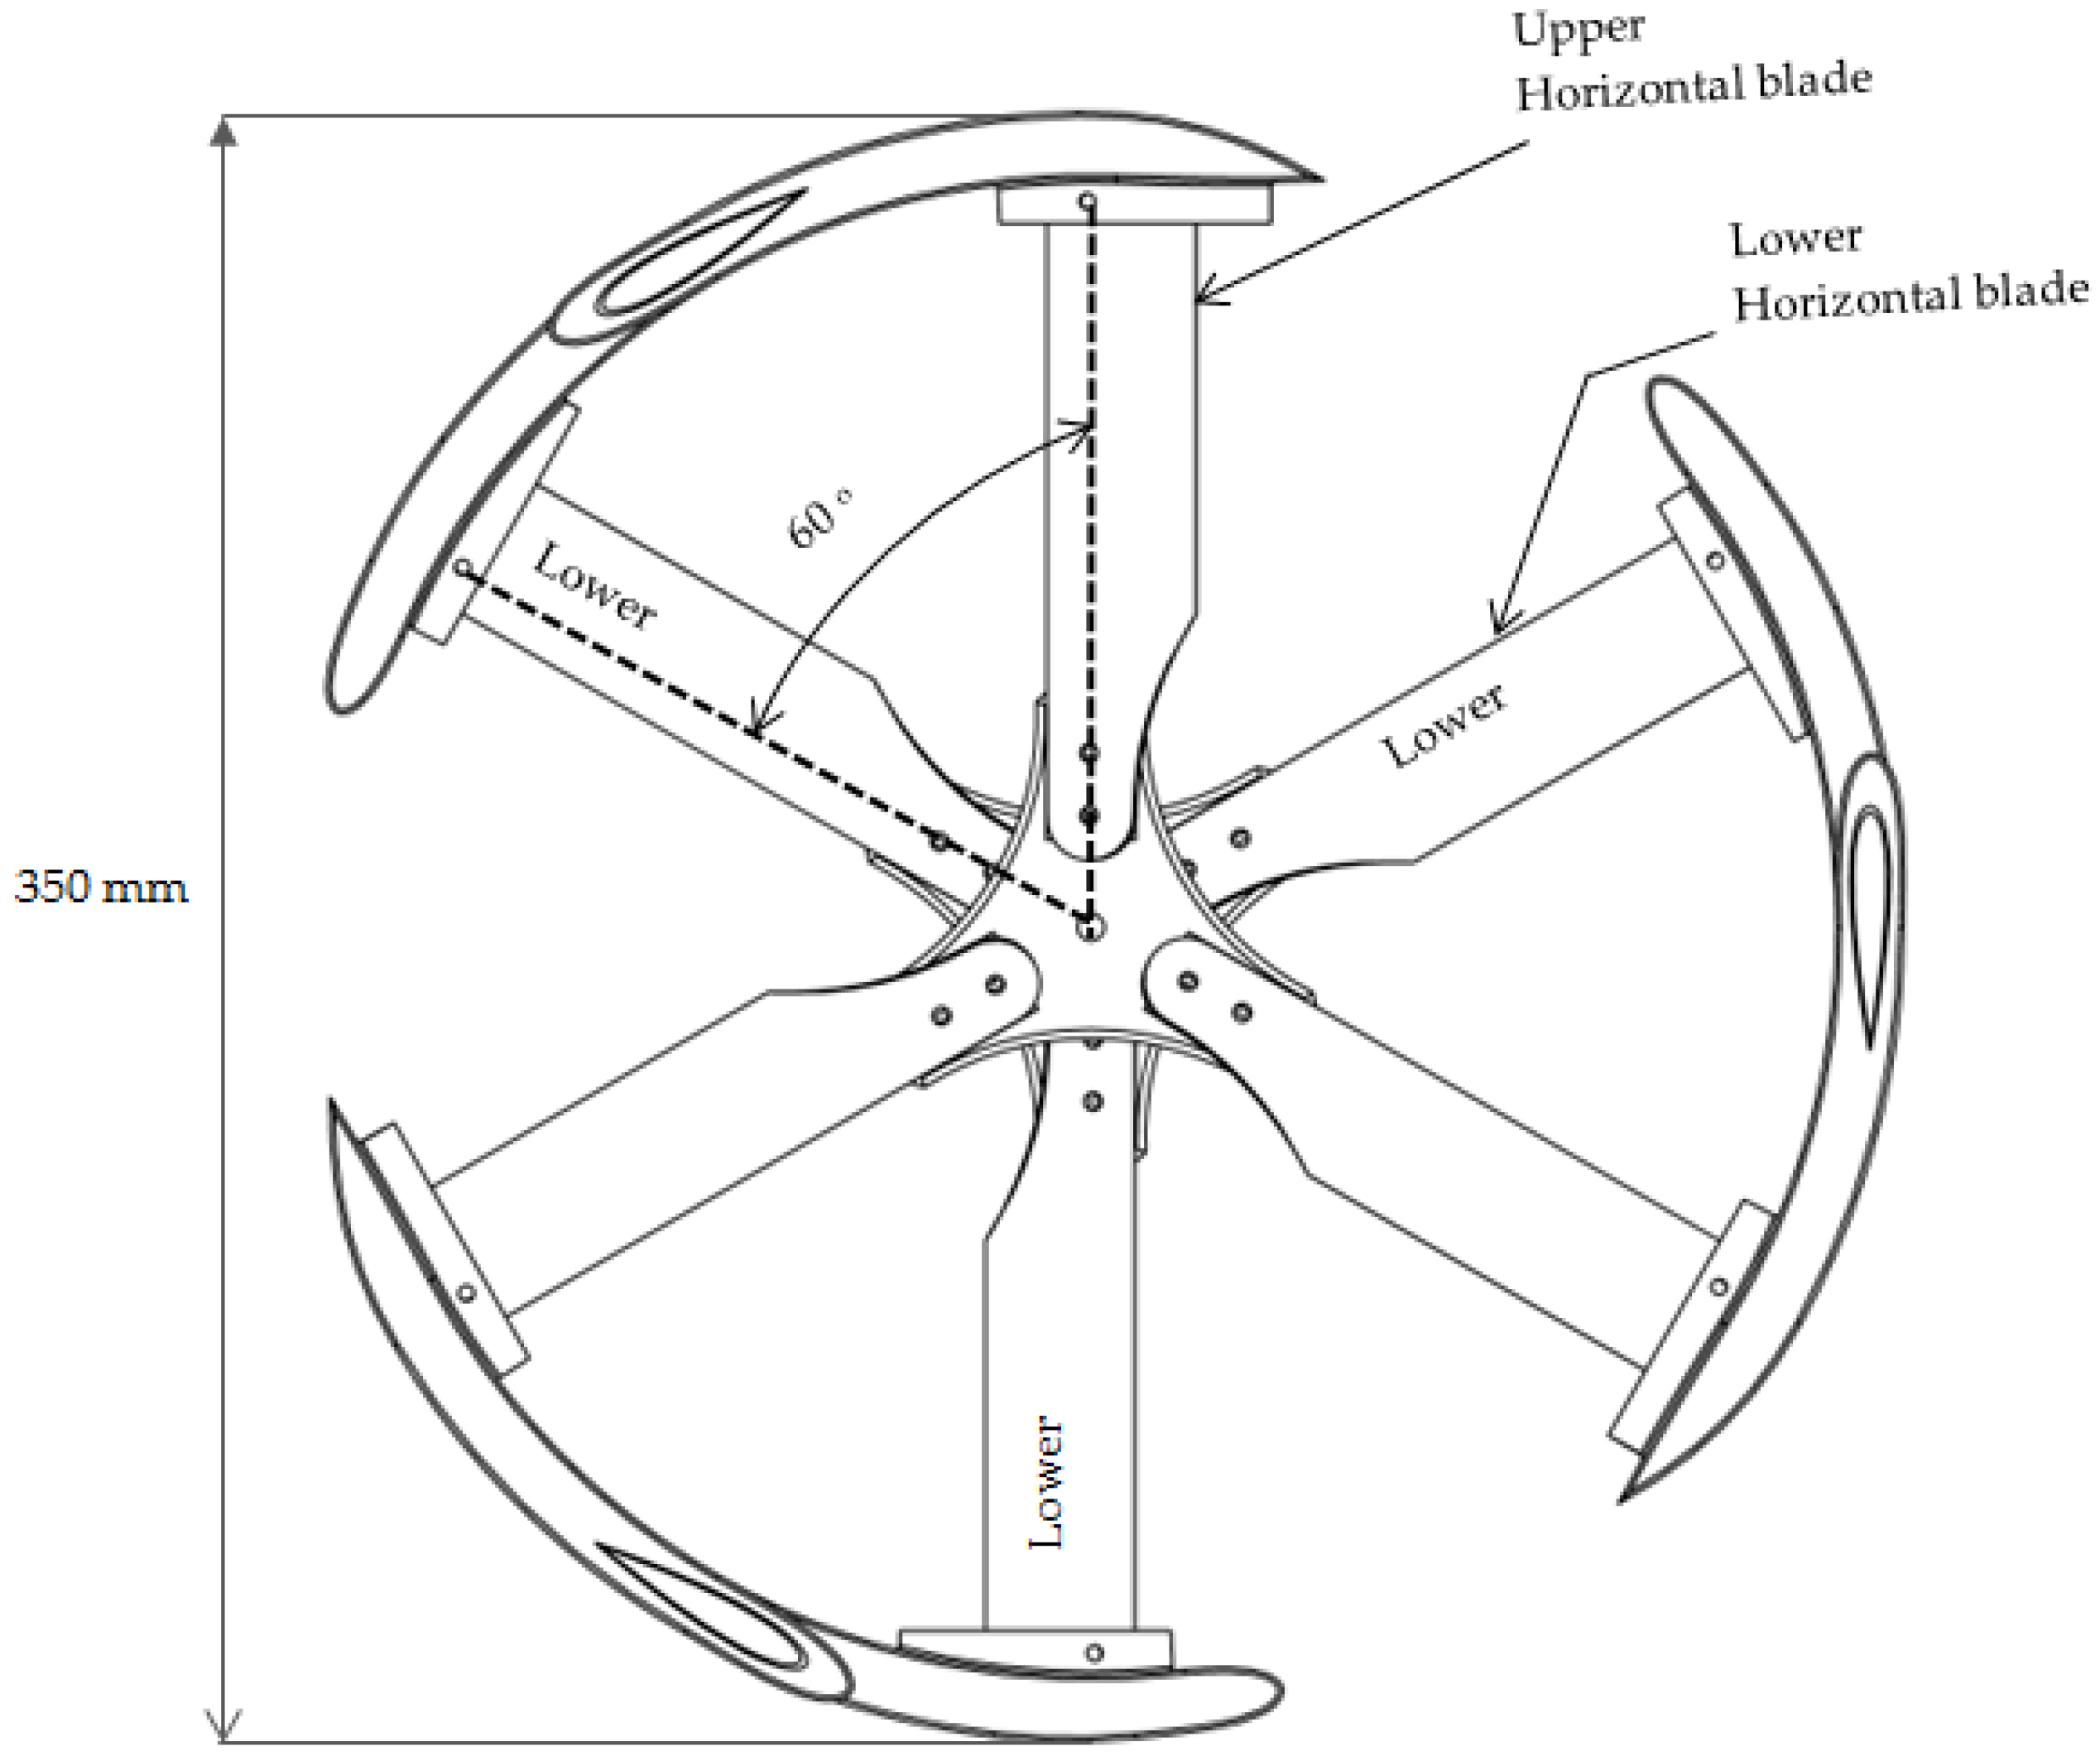
3.1. General Arrangement of the CAWT

Figure 3 shows the general arrangement of the CAWT. The CAWT consists of three main vertical blades and six horizontal blades. The vertical blades are connected to the horizontal blades via connectors and the horizontal blades are mechanically joined to the upper and lower hubs through the axle holes. Both hubs are attached to a center shaft with a relative distance of 100 mm. The horizontal blades are connected to the vertical blades via the top and bottom connectors. A total of six connectors were used in the design, three top connectors were used to connect the top horizontal blades to the upper part of the vertical blades through the axle hole of the connectors and the three bottom connectors were used to connect the lower horizontal blades to the lower parts of the vertical blade by screwing through the axle hole of the connectors.
To maximize the interaction of the vertical flow, the lower horizontal blades are offset by 60° from the upper horizontal blades. Offsetting the upper horizontal blades from the lower horizontal blades will enable the free flow of the vertical wind stream from the bottom of the turbine to the upper horizontal blades. The drive shaft of the CAWT can be fixed directly to the generator which converts the kinetic energy in the wind to mechanical energy at the shaft and then to electrical energy. The upper and lower horizontal blades can be pitched at different pitch angles (β = 0°, 5°, 10°, and 15°) to allow for better performance of the CAWT. The purpose of the pitch angle is to maintain a near uniform rotor speed under different wind conditions in order to maximize the power output from the turbine. For this study, the pitch angle of the horizontal blades is set at 10°. The choice of the pitch angle was arrived at after conducting an experimental study on four different pitch angles (β = 0°, 5°, 10°, and 15°) to ascertain the optimum pitch angle for the horizontal blade of the CAWT. The result showed that the 10° pitch angle is the optimum pitch angle for the horizontal blades. The whole system is attached to a small pole and can be mounted on a building of any roof shape.
For benchmarking, the performance of a conventional straight-bladed vertical axis wind turbine (VAWT) is tested under the same experimental conditions. The CAWT and VAWT used for this study are demonstrated in Figure 4. The lab scale VAWT model used for the comparison consists of a straight-bladed H-rotor, and it has a 50 mm chord length and 300 mm height. A flat plate metal was used as the connecting strut for the VAWT. The lab scale CAWT and VAWT model which are used in the experiment are depicted in Figure 4a,b. The material selection for the CAWT and VAWT is as shown in Table 1, while the parameter comparison between the two lab scale wind turbine models is presented Table 2.

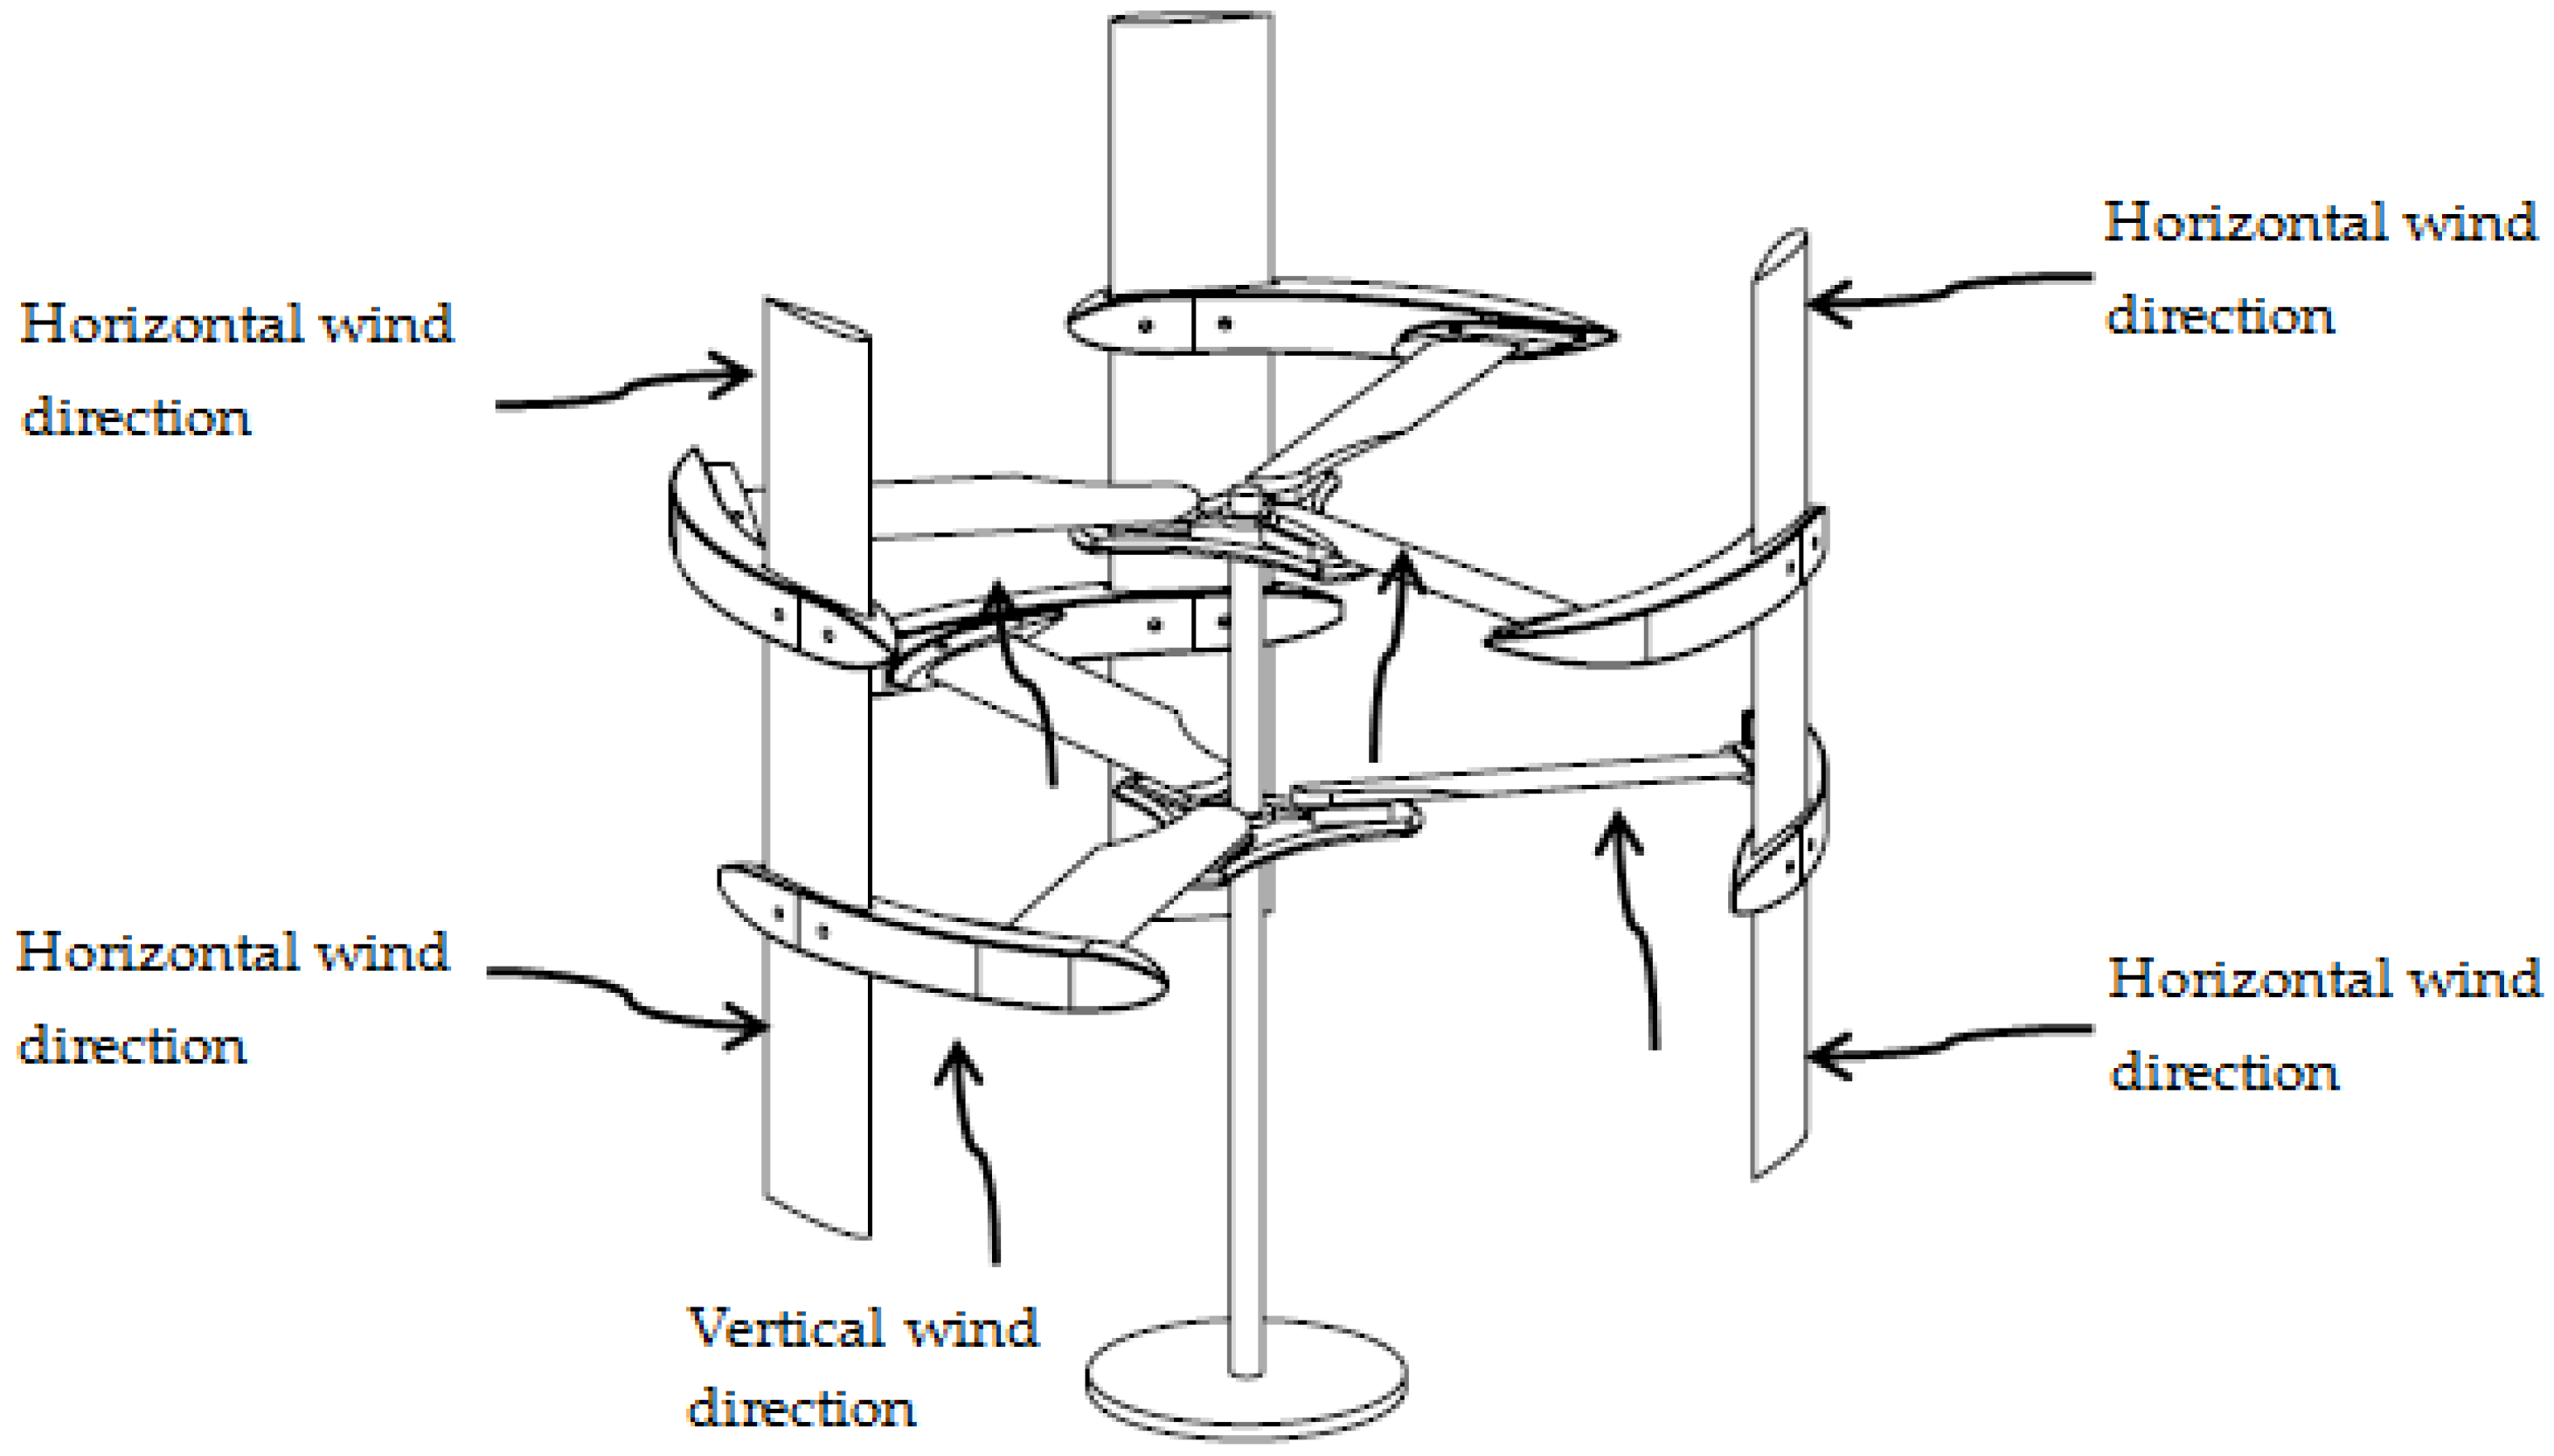
3.2. Working Principle of the CAWT

The CAWT is designed to operate either as a building integrated wind turbine or as a stand-alone wind turbine system. However, due to its compact design and its ability to operate under dual wind directions, the CAWT can be integrated onto urban buildings to take advantage of the accelerating effects on the building. Furthermore, it can easily fit onto any high-rise or low-rise building with different roof shapes such as vaulted roof, gable roof, doom roof, etc. When integrated on the rooftop of a building, the horizontal blades located at the bottom and top of the CAWT collects the upward wind streams that strike the wall and roof of the buildings. These wind streams interact with the horizontal blades and allow for self-starting as well as improved efficiency performance. The offset angle 60° (Figure 5) maximizes the interaction of the vertical flow since the vertical wind streams that escape from the bottom horizontal blades without interacting with the blades will be captured by the top horizontal blades. Moreover, offsetting the bottom horizontal blades by an angle of 60° from the top horizontal blades may provide large pocket area to allow for the deflected flow to interact with the top horizontal blades without impinging the bottom blades which allow for a good start-up, and improved efficiency. The wind turbine is designed to overcome the disadvantages of both the HAWT and the VAWT, as it is operational under both horizontal and vertical wind from the bottom of the turbine (Figure 6).
The CAWT is an omni-directional device and needs no yaw mechanism. Another unique feature of the CAWT is its ability to intercept the vertical wind stream from the bottom of the turbine through the horizontal blades as shown in Figure 6. This vertical wind stream can be due to the accelerating effect on the wind at the leading edge of the building [38] or guided by a guide vane to direct the vertical wind stream upward to the horizontal rotor when installed as a stand-alone wind turbine system.
The shape of the roof will act as an augmentation device by deflecting the wind that strikes the roof upward to the horizontal blades. The axis of orientation of the CAWT with its simplicity and improved aerodynamic rotation are the main advantages of the CAWT. An artist’s impression of the building integrated CAWT and the computer aided design (CAD) of the CAWT is shown in Figure 7a,b, respectively.

3.3. Selection of Airfoil

The choice of a suitable airfoil section can significantly improve both the peak performance and the starting characteristics of a wind turbine. Symmetrical NACA 0015 airfoil with a 15% thickness to chord ratio has been chosen for this study. It is an indisputable fact that a cambered airfoil is preferable for the VAWT, due to the curved nature of the airfoil as reported by [39,40,41]. However, VAWT researchers have used one of the original NACA four digit series airfoil sections, usually either a NACA 0012 or a NACA 0015 section. This is because their lift, drag, and pitching moment characteristics are presumably well documented thus making validation of theoretical predictions easier [19]. Bravo et al. [42] reported that a maximum Cp of 0.32 at TSR (λ) of 1.6 could be achieved with a symmetrical NACA 0015 airfoil. Hameed and Afaq [43] reported that the symmetrical airfoil is utilized for small scale VAWTs in order to have the same characteristics of lift and drag on the upper and lower surfaces. They asserted that the major advantage is that symmetrical airfoils provide lift from both sides of the airfoil and therefore it will provide lift during the complete 360° rotation of the turbine.
Although cambered airfoils are usually used in wind turbines because of their high L/D ratio (compared to symmetrical airfoils) at positive incidence (relative wind approaching the concave side of the airfoil), however they perform poorly at negative incidence (relative wind approaching the convex side of the airfoil. Because the angle of attack (α) on a VAWT blade reverses twice per revolution, it is impossible to avoid negative incidence. It has apparently been assumed by most researchers that any performance gain by a cambered airfoil when angle of attack (α) is positive would be more than offset by the reduction in performance when the angle of attack (α) reverses, and symmetrical airfoils have usually been used on VAWTs [19].

3.4. Supporting Struts

The supporting struts connect the central rotating column to the blades. They stabilize the blade during survival winds, transfer torque to the central column, reduce operating mean and fatigue stresses in the blades and strongly influence some natural frequencies of the rotor [10]. The main purpose for the supporting struts is to attach the blades to the main shaft and provide mechanical support to the blades. Usually, these struts have no aerodynamic characteristics. Struts that are commonly used are round pipes or flat metal plates [44]. It has been observed that the supporting struts generate parasitic drag which reduces the net power output [10,44]. However, using a streamline-shaped object (i.e., airfoils) as the supporting struts will significantly reduce the parasitic drag. A streamline shaped object maintains a smooth, laminar flow and the resistance can be substantially reduced [45]. Islam et al. [10] reported that the supporting struts with airfoil shape will improve the aerodynamic performance of the VAWT. Ramkissoon and Manohar [44] reportedly reduced the resistance of their supporting struts by 15% by modifying the original struts to a round pipe shape. For this study, the supporting strut is an airfoil, NACA 0015. Airfoil shapes have less resistance which makes them more favorable to replace the normal supporting struts for VAWT.

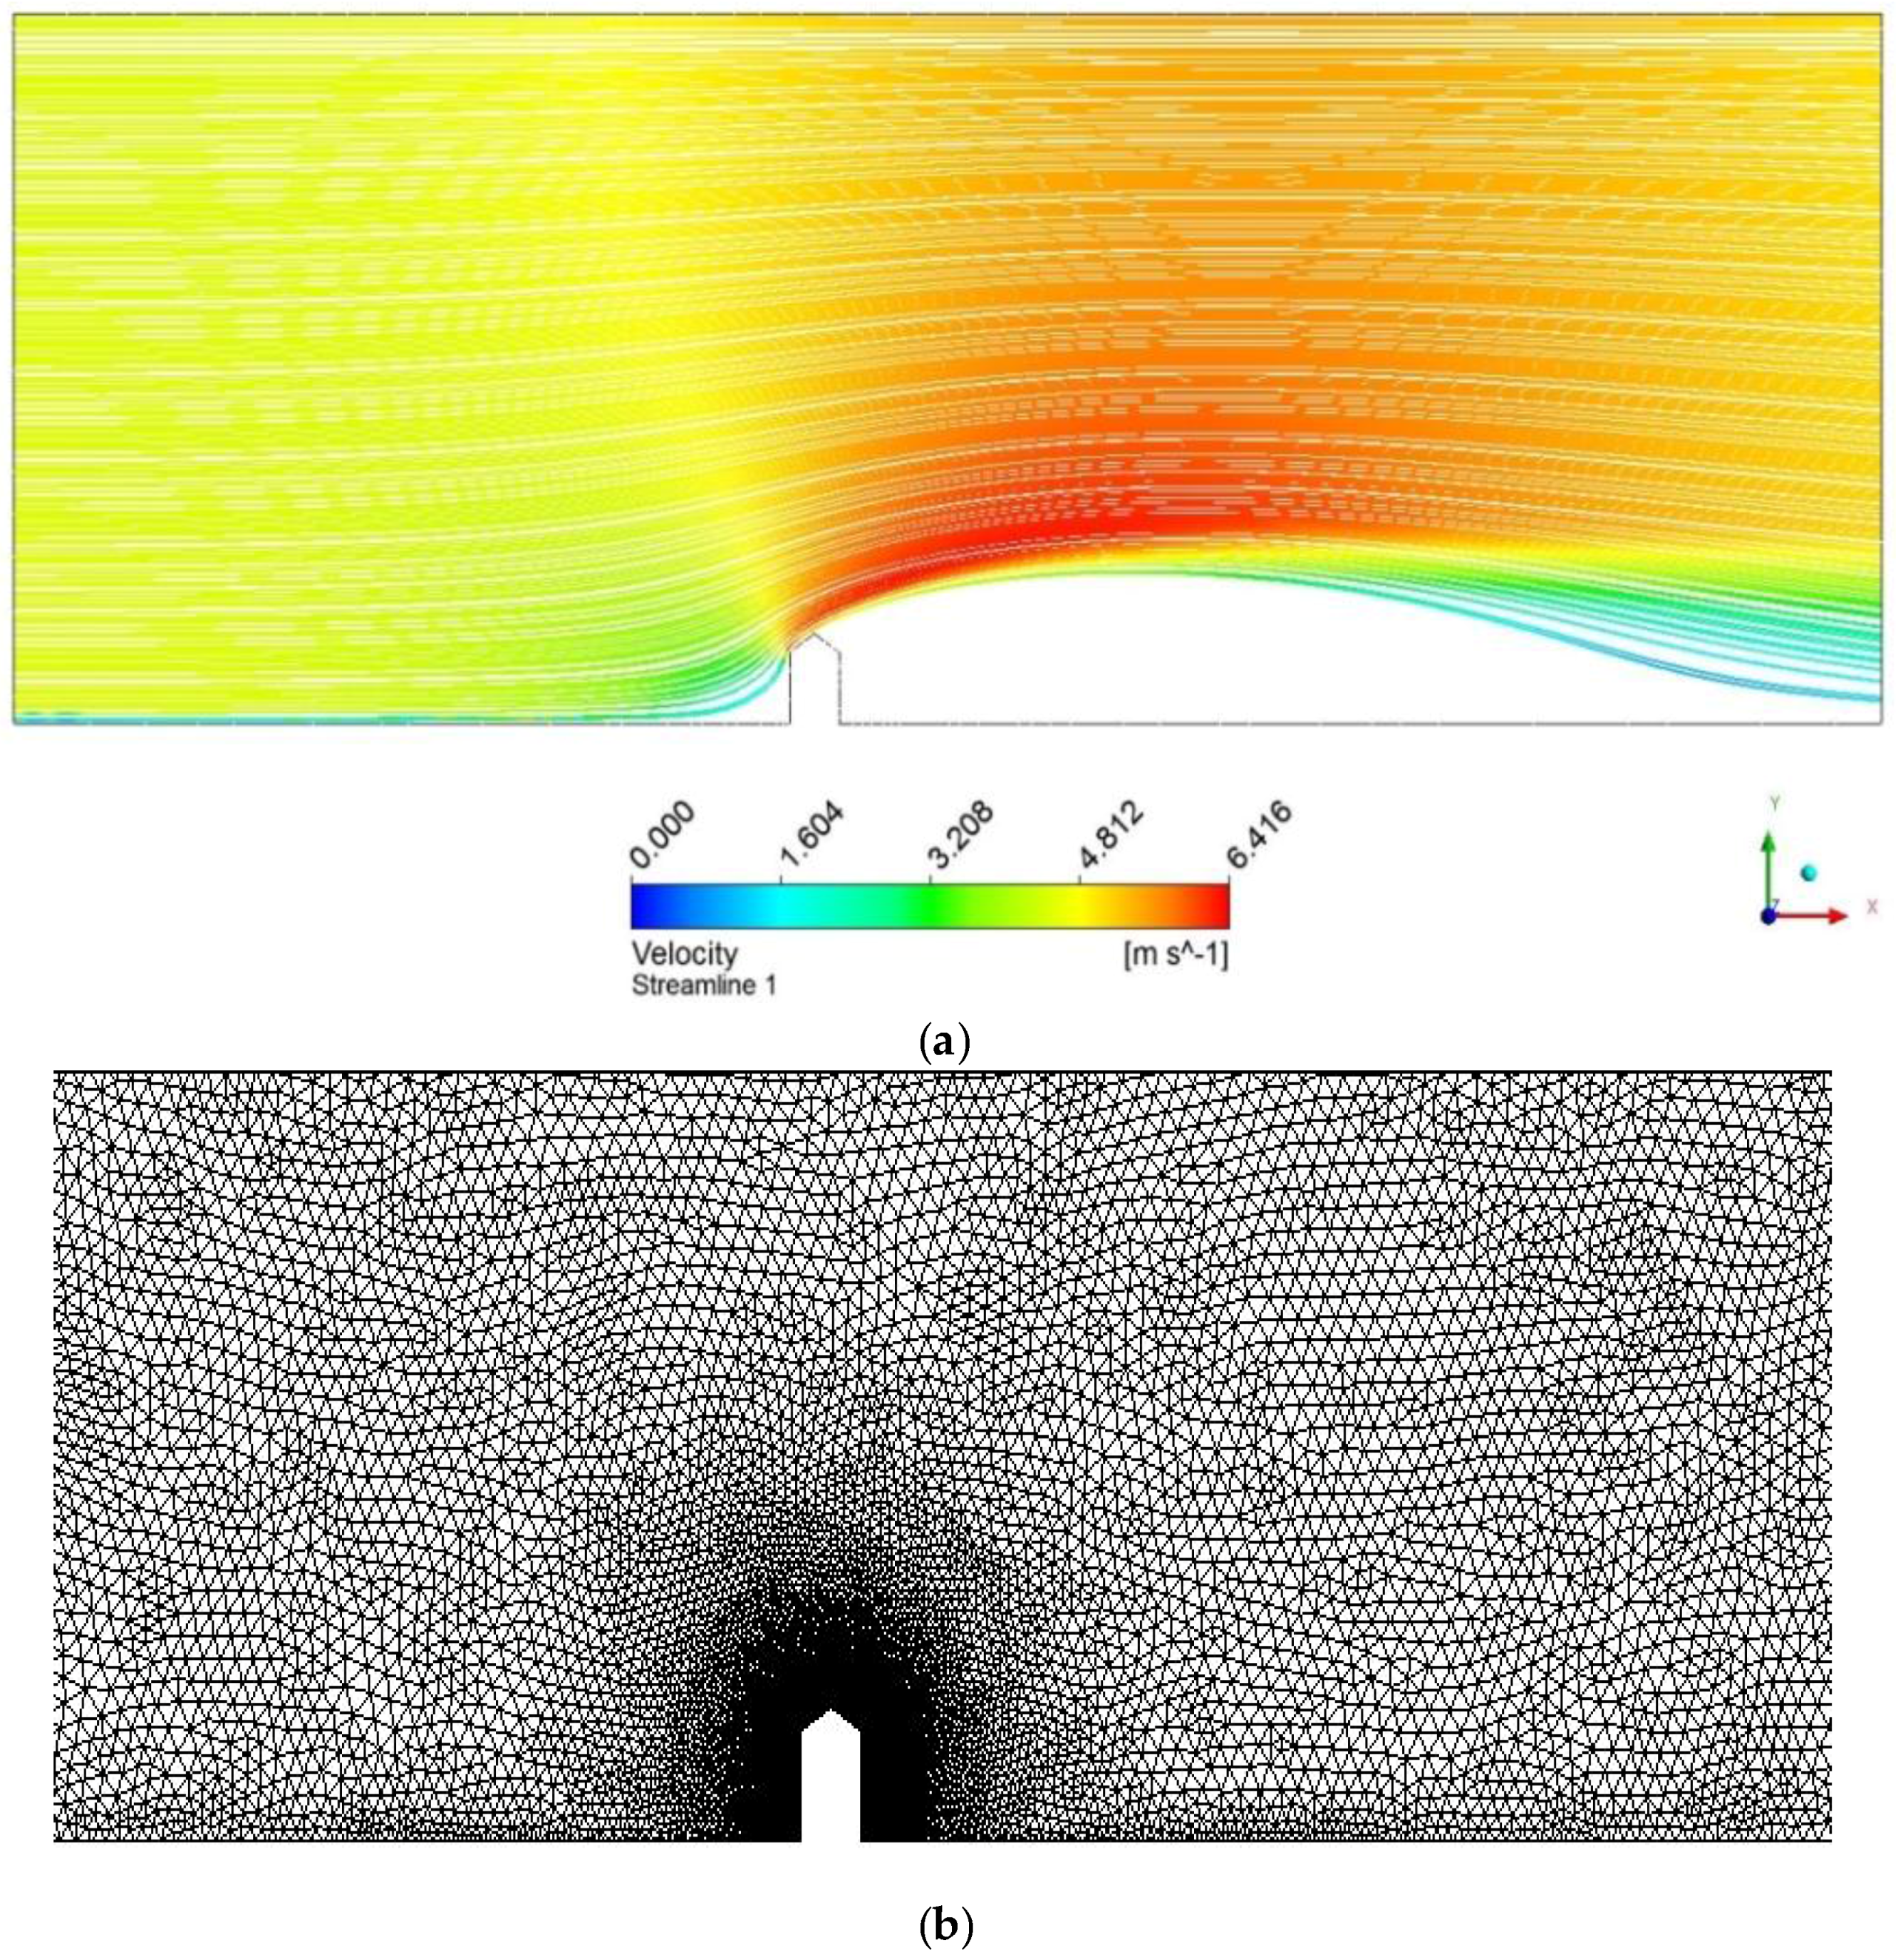
4. Computational Fluid Dynamic (CFD)

This section describes 2D computational fluid dynamics (CFD) calculation on the turbulence separation over the gable building model, carried out with the commercial code Fluent 16.1. The CFD gives an insight into the flow patterns that are difficult, and expensive to study using experimental methods. The choice of the method used is generally made based on the details of the flow to be obtained and the computing resources available [26]. The building model for the CFD calculation has a height of 1.36 m and a width of 0.74 m. The simulated streamlines are depicted in Figure 8. The flow-solver is based on the two-dimensional Reynolds-average Navier–Stokes equations (RANS), which formulate the principles of conservation of mass, momentum and energy in the form of partial differential equation. The shear stress transport (SST) k-ω turbulence model was used in the simulation because this model could produce more accurate and reliable results [46]. The SST k-ω model is also known to have reduced sensitivity to far field values of turbulence frequency, ω, and a more balanced performance for a wide range of flow types compared to other general purpose two equation model, as demonstrated by Menter et al. [47]. The discretization is carried out with the first-order upwind scheme and the velocity-pressure flow field is determined using the SIMPLE model [48]. This is due to the computational efficiency and robustness in iterating the coupled parameters.
A mesh independence study was carried out to determine the dependence of the flow field on the refinement of the mesh. Grid types on solution domain are performed near the building model with increasing intensity as shown in Figure 8b. The meshes are highly denser to capture the complex flow structure with lower expected error. To ensure attainment of grid-independent results, sensitivities of both grid numbers and grid distributions are tested and the mesh used is refined for the building model.
The building is modeled with the dimensions 1.45 m (L) × 0.74 m (W) × 1.36 m (H), which is the same size as the prototype, and the pitch angle of the gable roof was 35° (see Section 5.2). The domain size for the CFD simulation is (H) 10,000 and (L) 28,000 mm. In the simulation, only wind velocity was considered. In this analysis, the pressure profile and multi-directional wind were not considered. Furthermore, the roughness level of the roof surface was ignored. In the simulation, the inlet wind speed was set as 4.5 m/s, this is to perform the simulation under the same condition as the experiment where the wind speed used for the actual test is 4.5 m/s. The simulated streamlines are depicted in Figure 8a.
The boundary layer separates at the windward roof edge of the building and the flow forms a separation bubble on the roof (below the streamline above the roof). As a consequence, the velocity vector of the flow above the separation bubble makes an angle with the horizontal edge of the roof (Figure 8a). This angle is referred to as the skewed angle. The skewed angle is largest at the windward roof edge and decreases downwind [33]. From the simulation, the wind velocity along the centre line of the roof at Y = 100, 150, 200 and 250 mm was found to be 5.36, 5.8, 5.95 and 5.97 m/s respectively, it shows that the wind speed achieved high velocity at this points due to the accelerating effect on the building and comparing with the inlet wind speed, 4.5 m/s, the wind velocity at the above mention height of the CAWT increases by 19%, 29%, 32%, and 33% with a wind speed augmented factor f = 1.19, 1.28, 1.32, and 1.33, respectively.

5. Methods

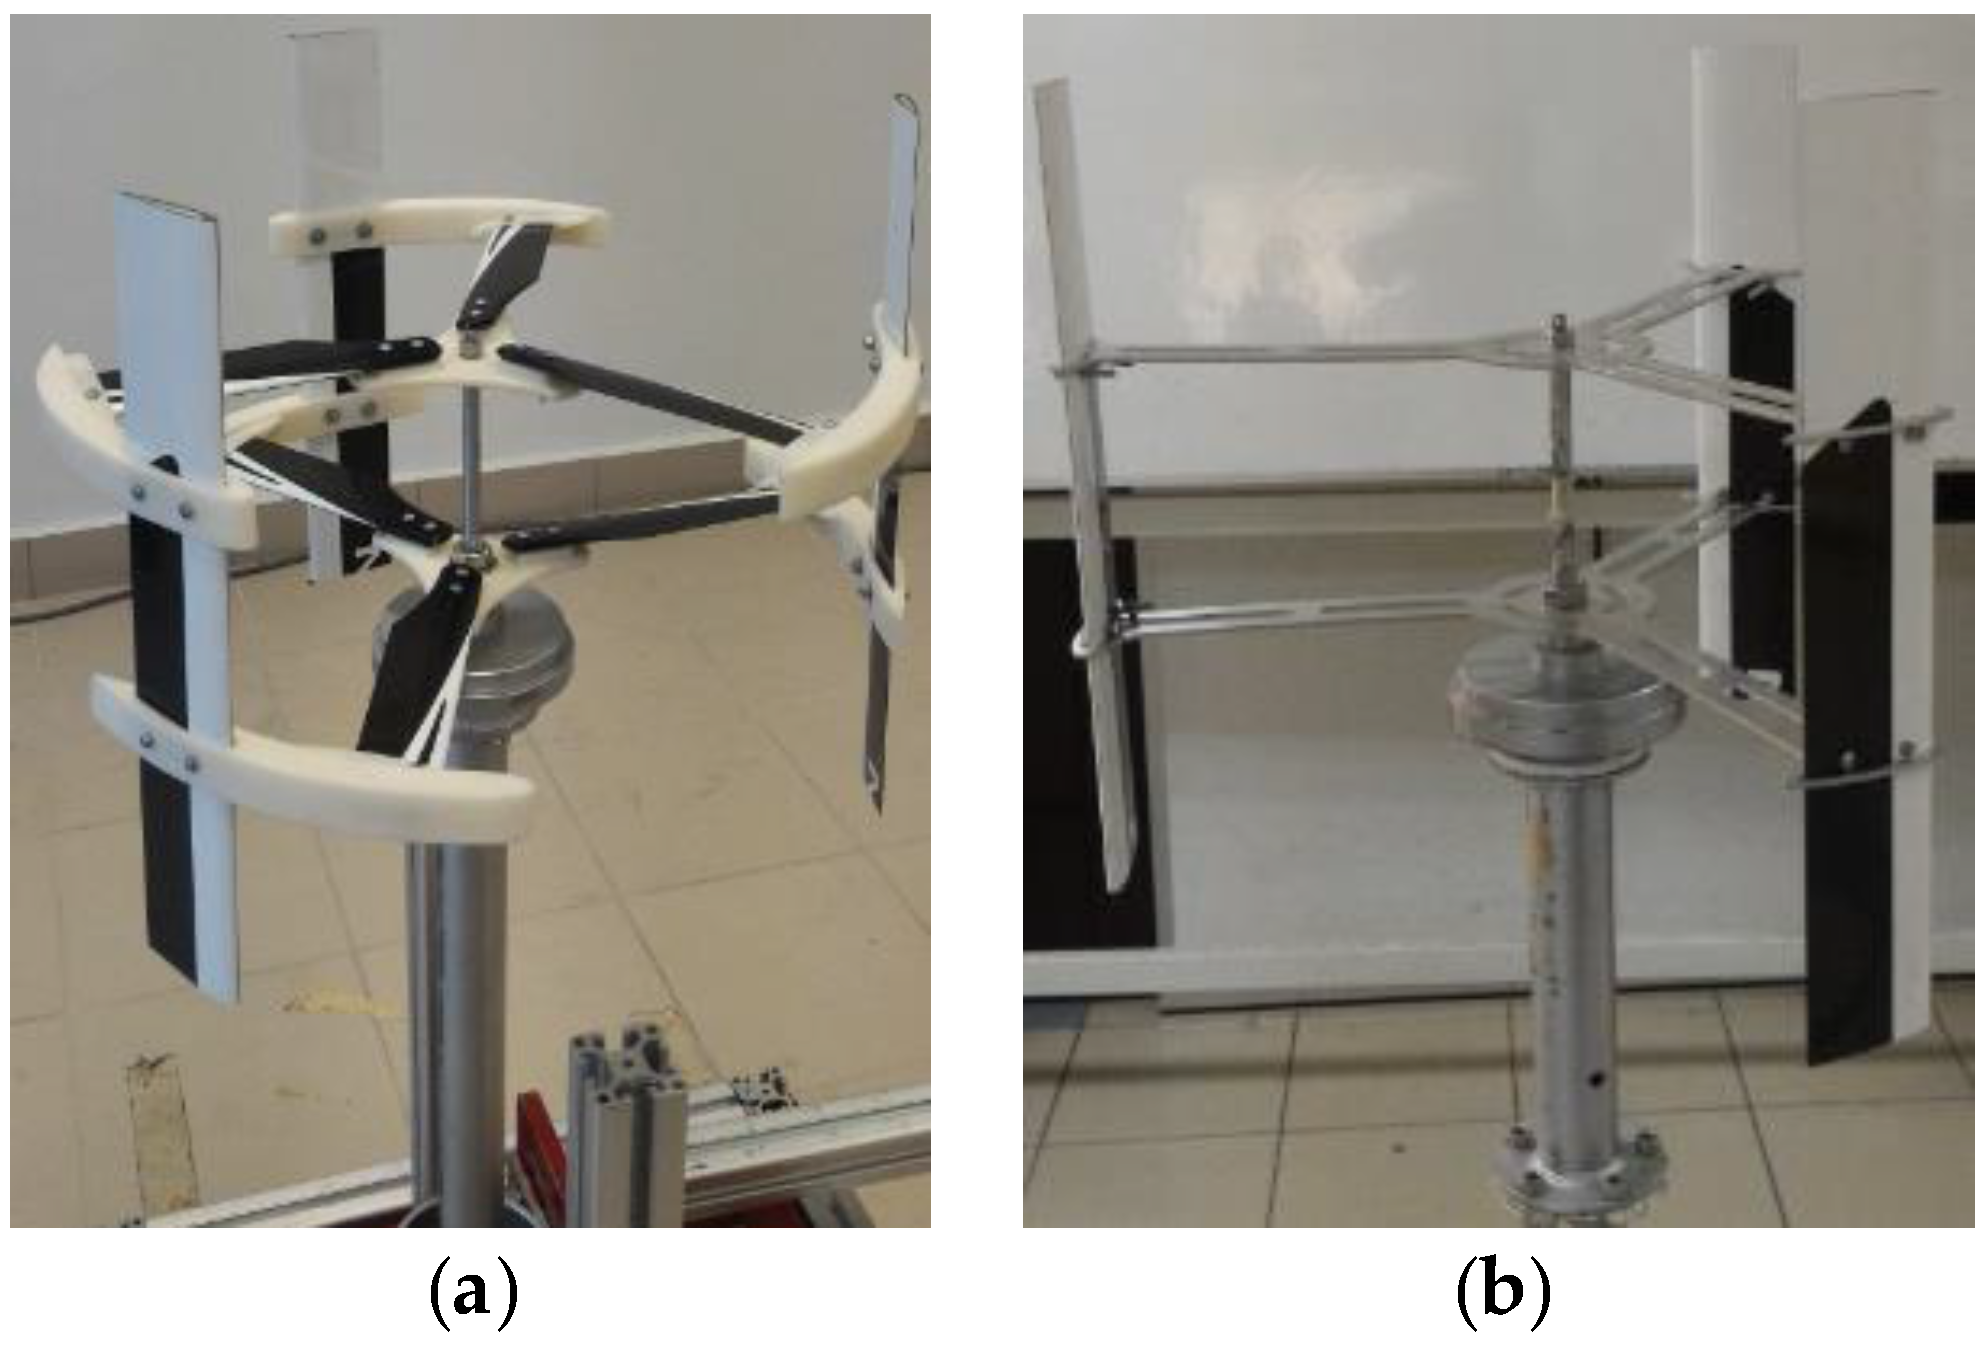
5.1. Prototype Fabrication

A prototype was built and integrated on a mock-up building model with a gable-shaped roof with dimensions (length, width, and height) of 1450 mm × 740 mm × 1364 mm. The feasibility of integrating the CAWT onto a building with gable-shaped rooftop is investigated through an experimental study using a mock-up rooftop. The performance of the CAWT was compared with the performance of a conventional straight-bladed VAWT having the same dimensions under the same experimental conditions.

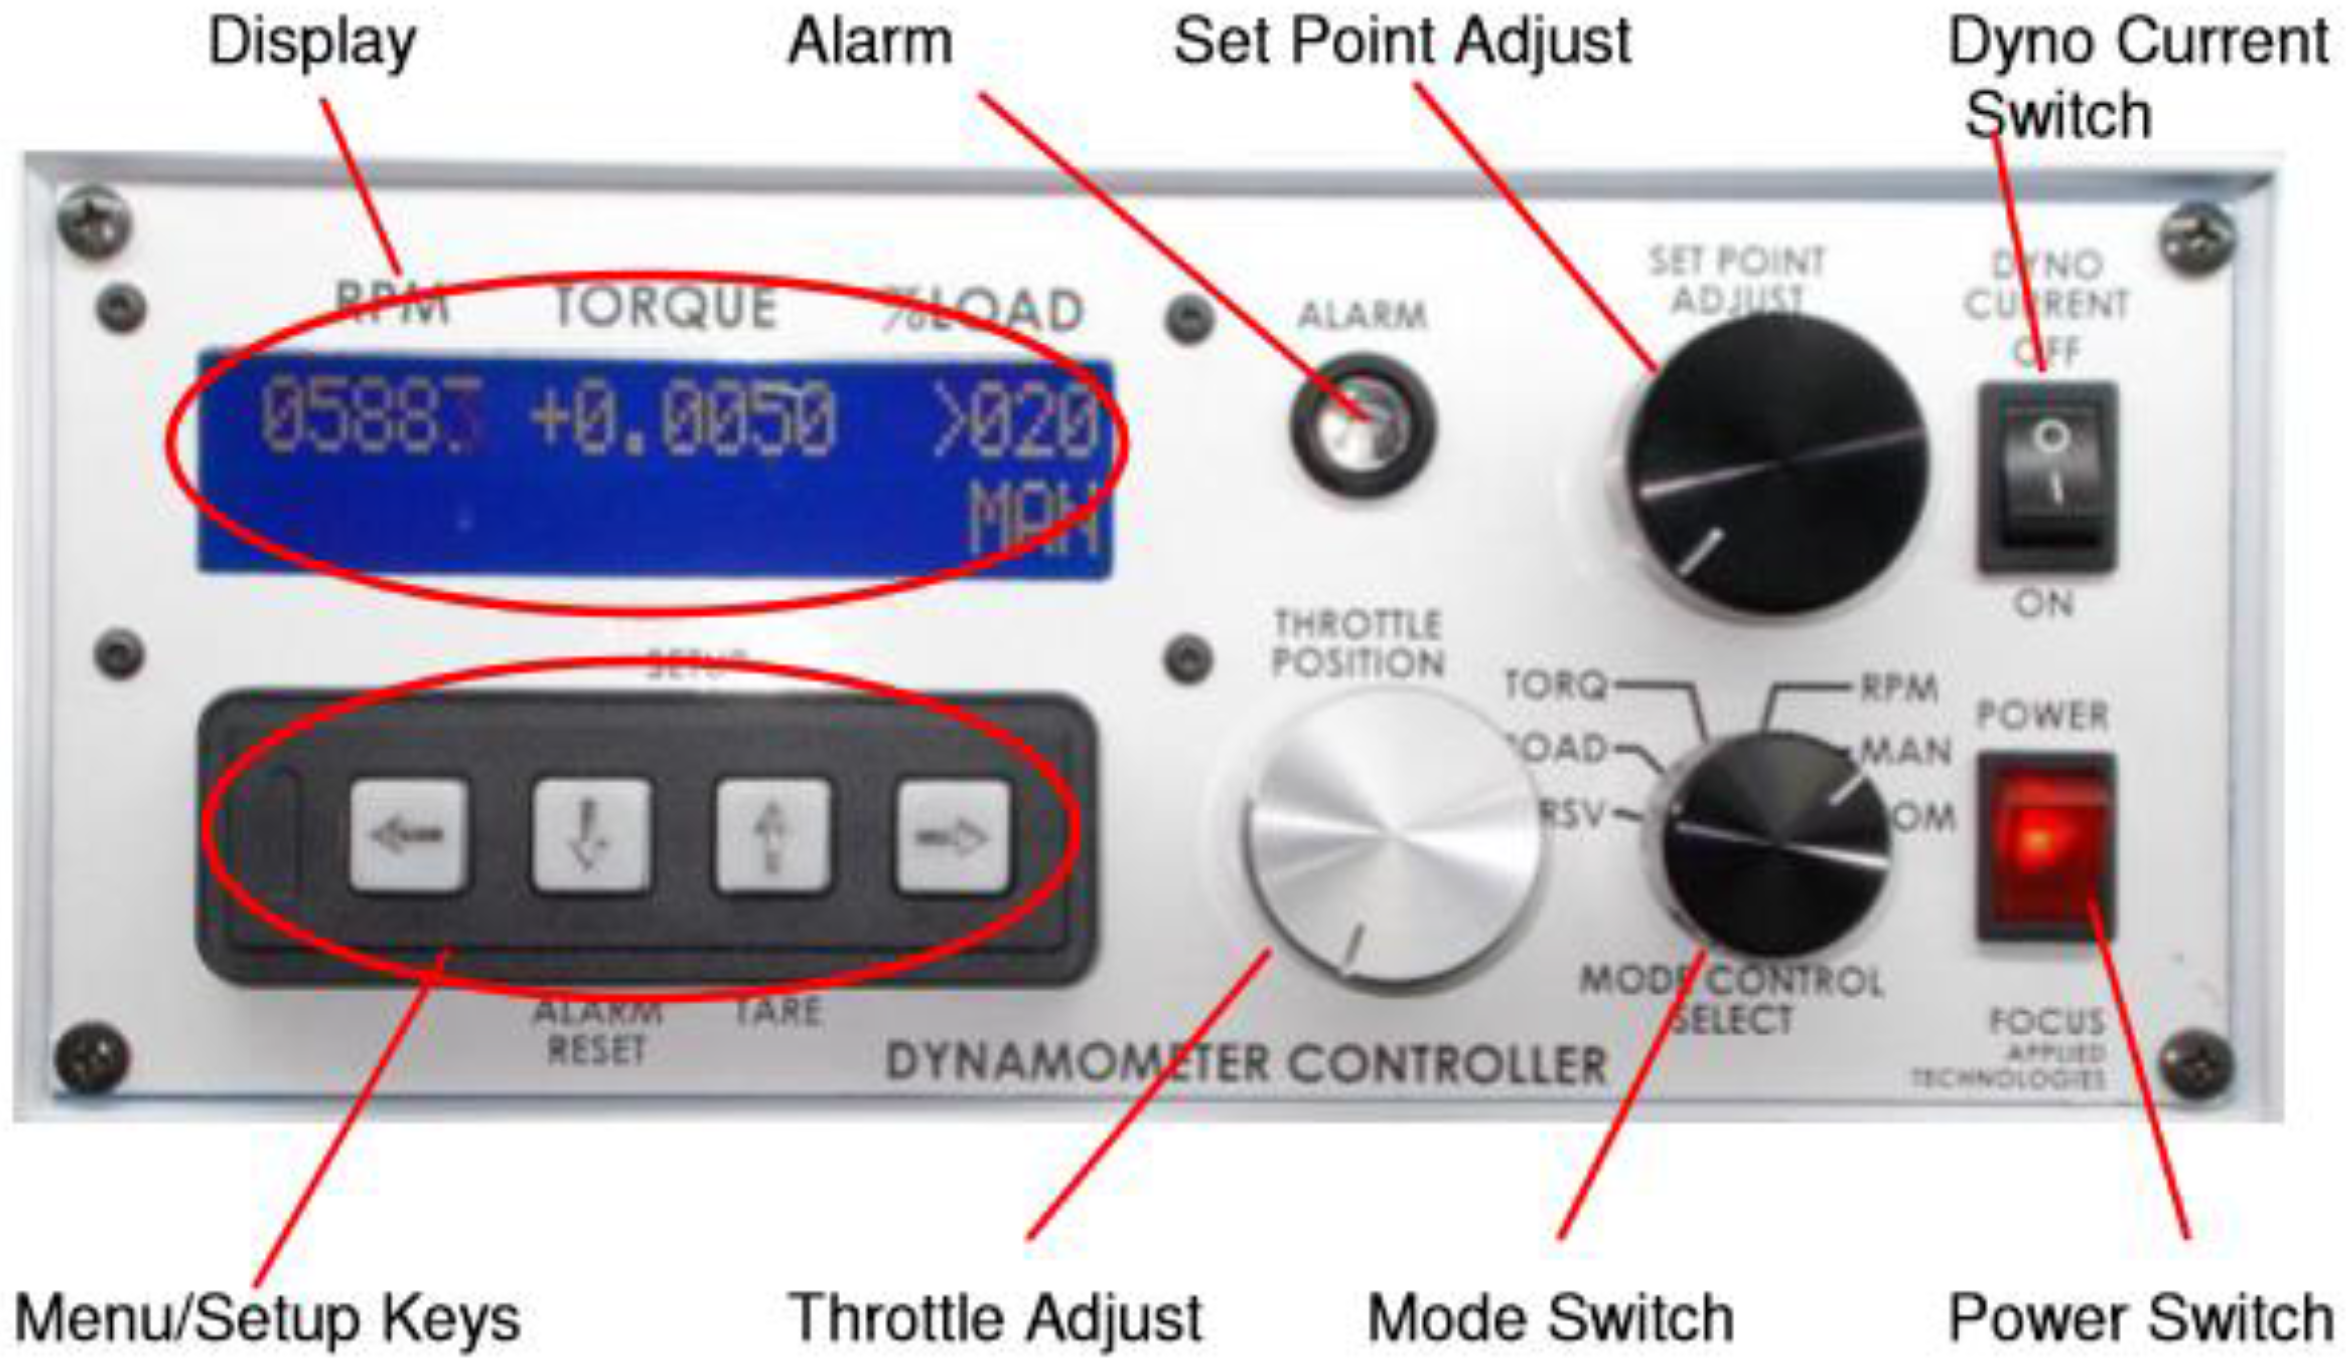
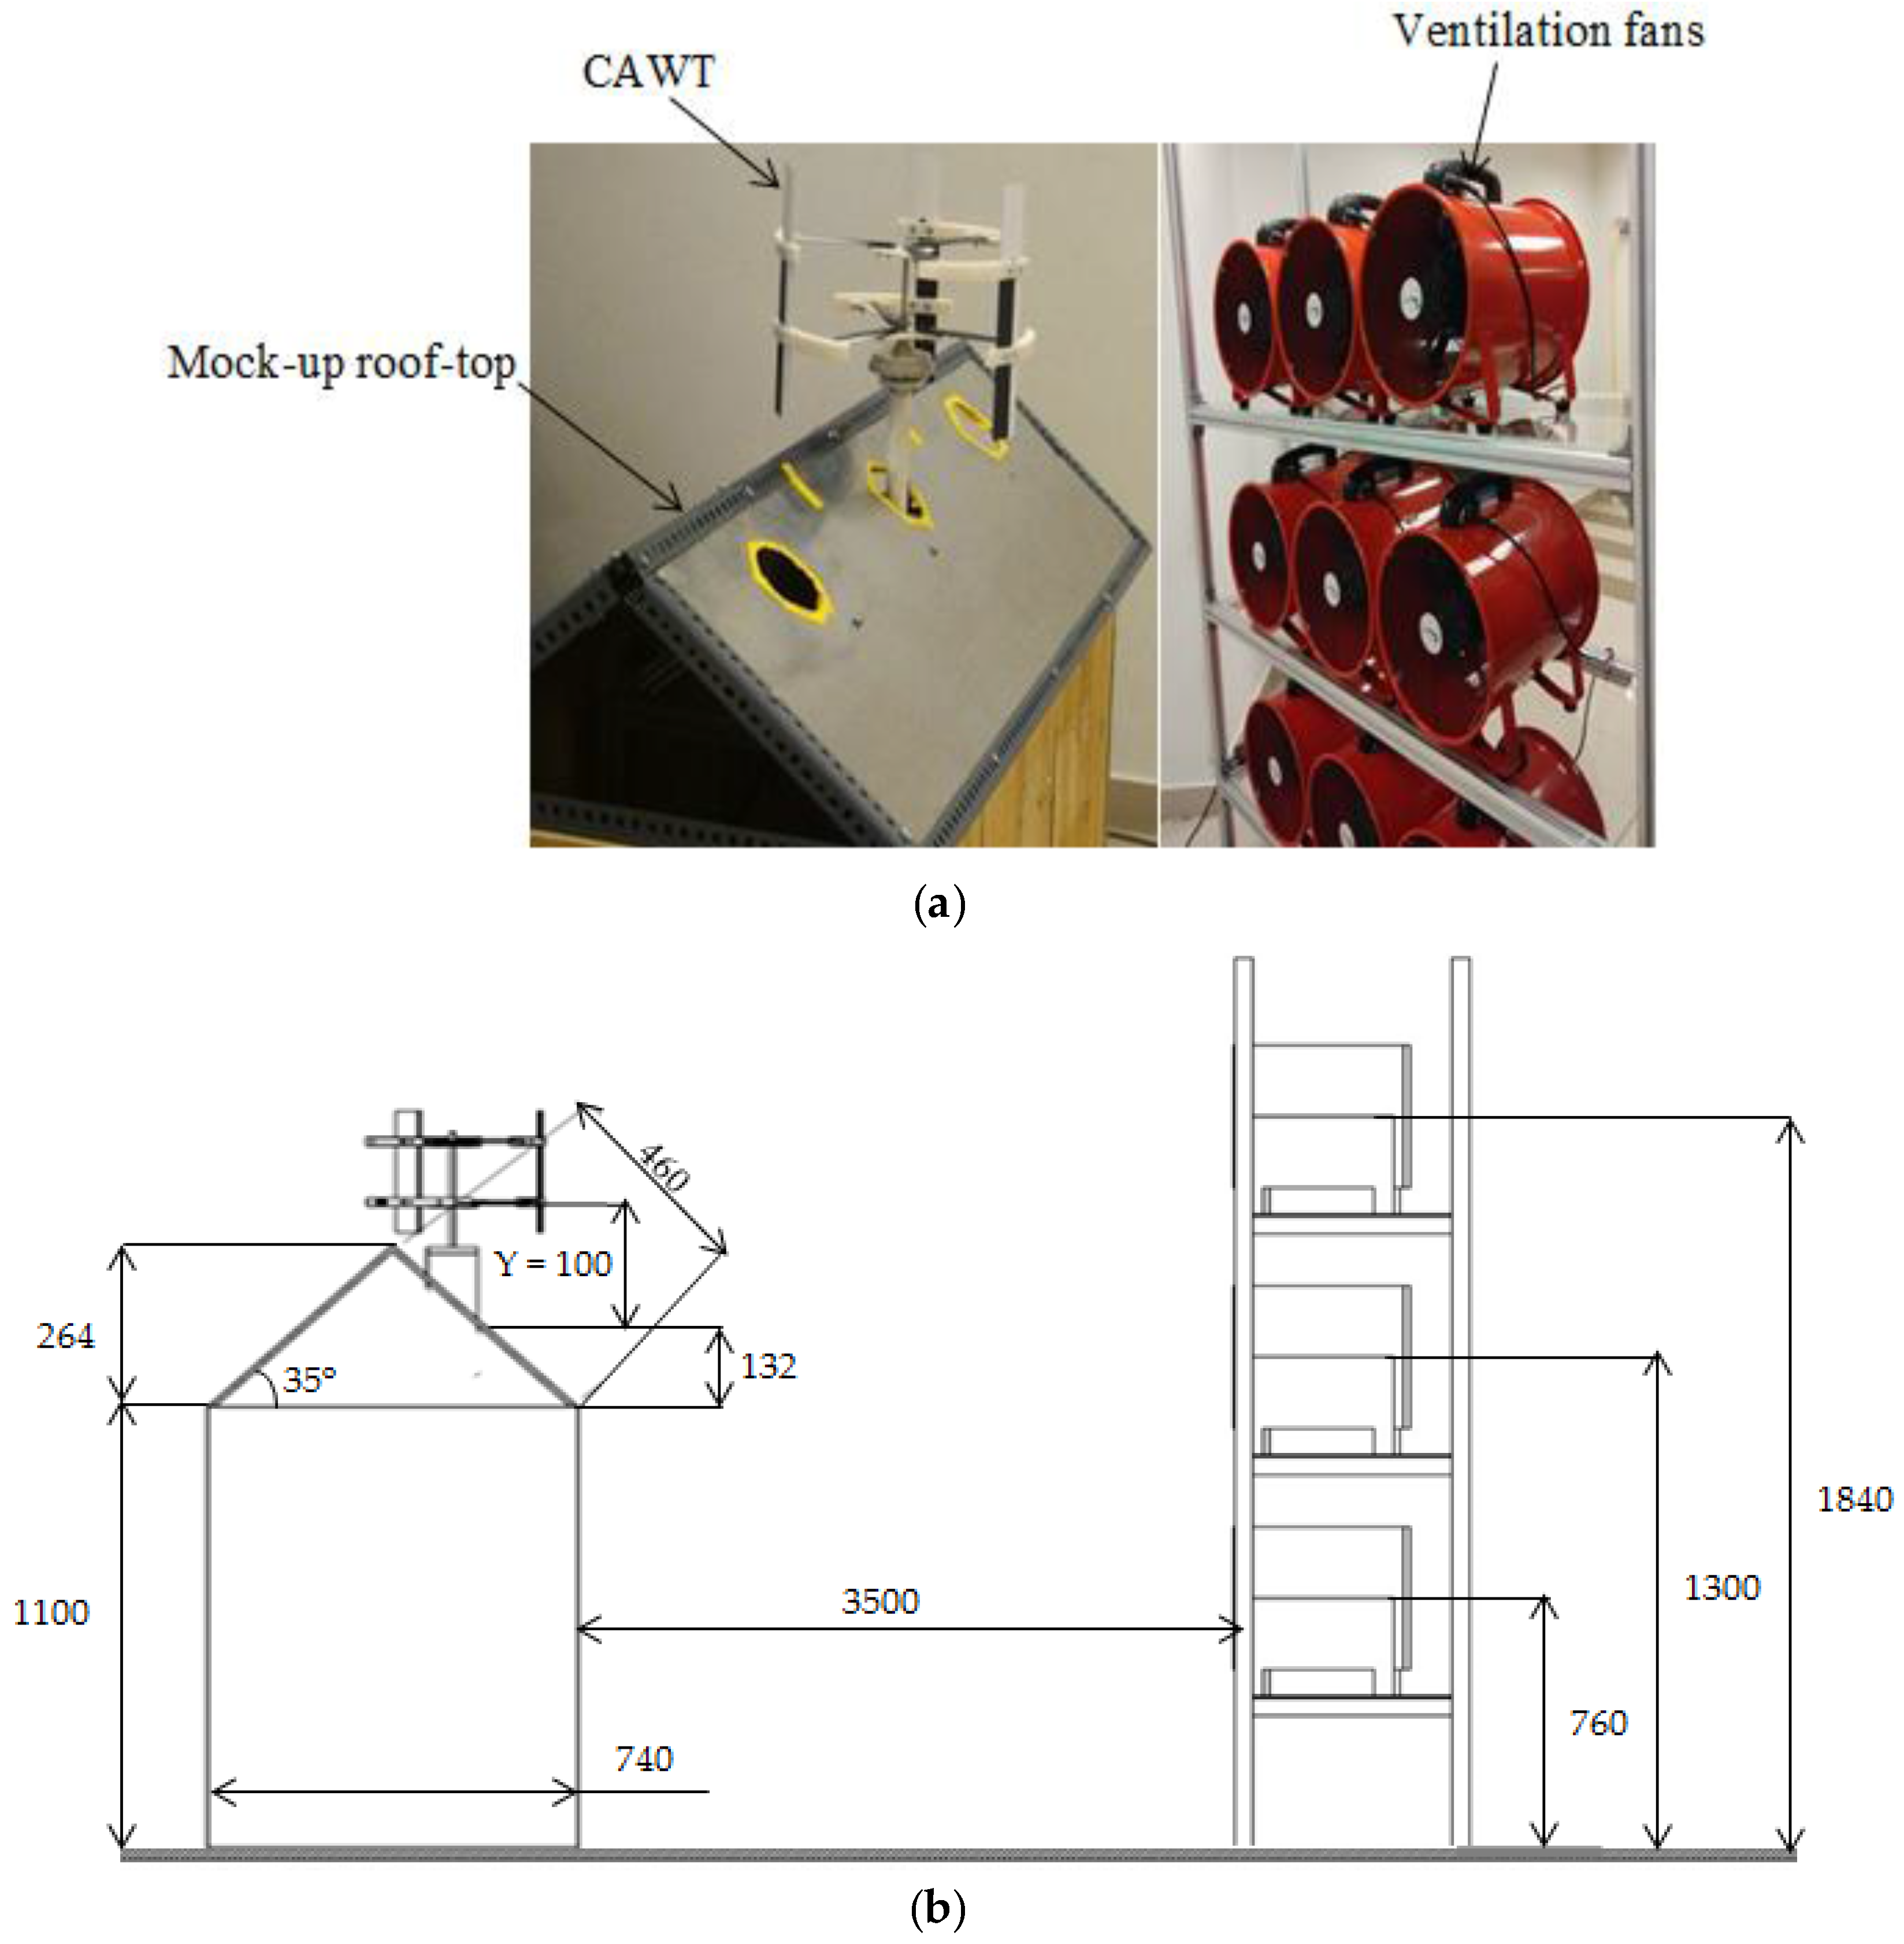
5.2. Experimental Set-Up

For testing and comparing the performance of the CAWT with the conventional straight-bladed VAWT, the following configurations were considered:
(a)
CAWT mounted on building mock-up rooftop;
(b)
Straight-bladed VAWT mounted on the same mock-up rooftop; and
(c)
Variation of height (CAWT and VAWT) above the rooftop.
The experimental set-up for this study is presented in Figure 9. Figure 9a shows the experimental set-up, and Figure 9b shows the detail dimensions of the building model and the ventilation fans, used for the study respectively. The set-up consists of a building model with gable rooftop with 35° roof angle. The CAWT and the straight-bladed VAWT were mounted at heights of Y = 100 to 250 mm at 50 mm intervals above the rooftop of the building model as shown in Figure 9b. The wind speed measurements were taken downstream of the ventilation fans placed at a distance of 3500 mm away from the building model. The ventilation fans were arranged in an array in a 3 × 3 configuration as shown in Figure 9a. An arrangement of 3 × 3 equally spaced grid points which covers a cross-section of 1.0 m by 1.0 m downstream of the fan array was used for the measurement of the wind speed which was set at 4.5 ± 0.2 m/s. The wind direction is set at 0° (i.e., perpendicular to the building model). Since the flow was not controlled, the blower was directed orthogonal to the test section area and the wind speed was measured at different lengths to conform spatial uniformity. The central axis of the turbine was taken as the center point, the wind speed measurements were taken at each measuring points by using a vane anemometer over a period of 5 min, repeatability and airflow uniformity were ensured by repeating the measurements for ten times at each point. To reduce the vortex flow created by the blower, the wind speed error was reduced from U = 5.0 m/s ± 0.8 (3.0 m) to 4.5 m/s ± 0.2 (3.5 m), therefore creating a more uniform flow.
The rotor of both the CAWT and the straight-bladed VAWT were in free-running conditions where only the inertial and bearing friction were applied. The measurement of the rotational speed (RPM) of both the turbines started immediately after switching on the ventilation fans until the stabilized RPM is achieved. The measurement was performed with a dynamometer controller system (Figure 10), which consists of a rectifier and resistive dump load. For current and voltage measurements, the alternating current (AC) voltage from the generator is rectified to direct current (DC). Frictional loss due to the generator is assumed to be negligible. The experiments were conducted for the above-mentioned configurations on the same building with the same roof shape under the same experimental conditions. The coefficient of power (Cp) is calculated using Equation (2), and by rearranging Equation (2), the power extracted by the turbine can be calculated.

6. Experimental Results and Discussion

An experiment was conducted with the CAWT and the straight-bladed VAWT integrated onto a low-rise building model with a gable rooftop. Two sets of experiments under the same conditions, i.e., one for the CAWT and another one for the VAWT, were conducted. The heights of the two turbines (CAWT and VAWT) above the rooftop were varied for four different heights (Figure 9b), i.e., from Y = 100 to 250 mm with increment of 50 mm for each case. The performance of the two turbines was evaluated based on the maximum Cp, TSR, (λ), and RPM.

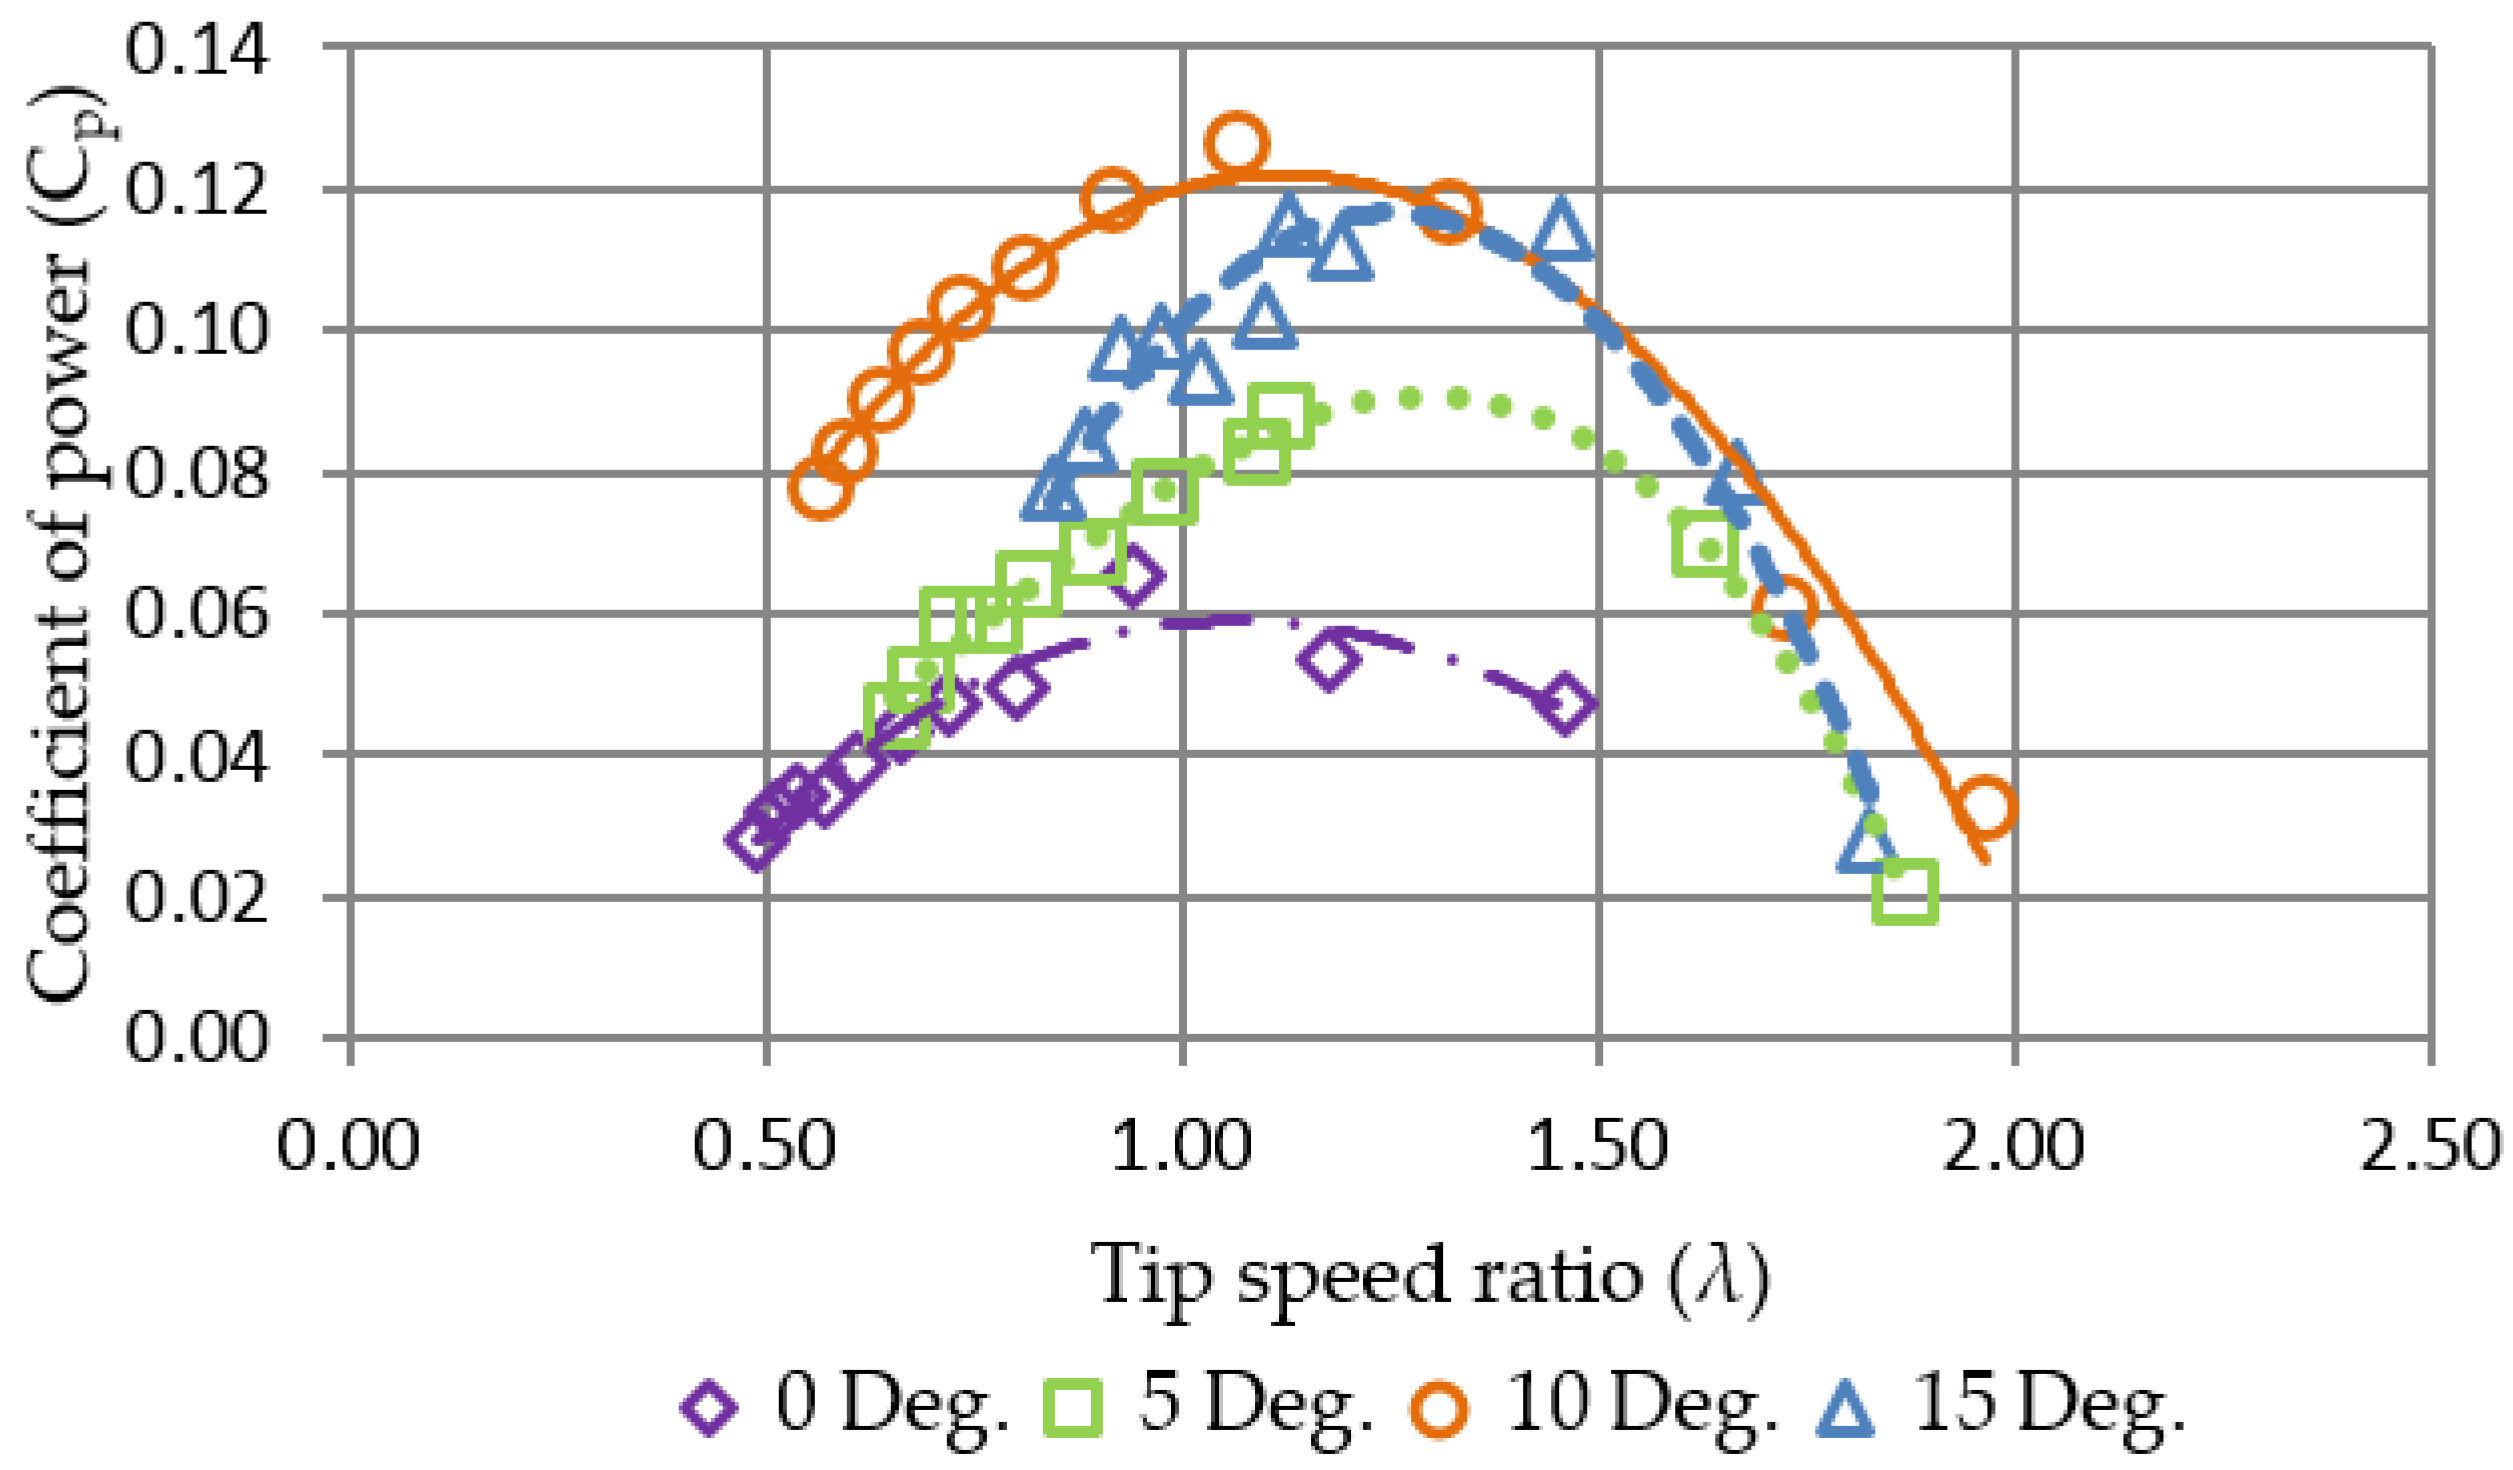
6.1. Pitch Angles of the Horizontal Blades

Figure 11 shows the coefficient of power against the tip speed ratio for various pitch angles of the horizontal blades of the CAWT. All the curves in Figure 11 show a similar trend where the Cp increases with increase in TSR; the Cp reaches its peak value at a certain TSR (between 0.89 and 1.16) and then decrease with increase in TSR. The results showed that the 10° pitch angle has the highest Cp values compared to the other ones. Therefore, for this study, 10° pitch angle is considered as the optimum pitch angle for the horizontal blades of the CAWT. At 10° pitch angle, the angle of attack is optimum, therefore, the flow along the blade is laminar which is the condition for the generation of lift force that maximizes the torque produced and improved the power output for the 10° pitch angle. When the pitch angle was increased above 10° (i.e., 15°), the Cp values decreases significantly (which results in lower Cp values for the CAWT). Again, the performance of the CAWT further decreases when the pitch angle is decreased below 10°. This shows that the pitch angle of the horizontal blades has significant effect on the performance of the CAWT.

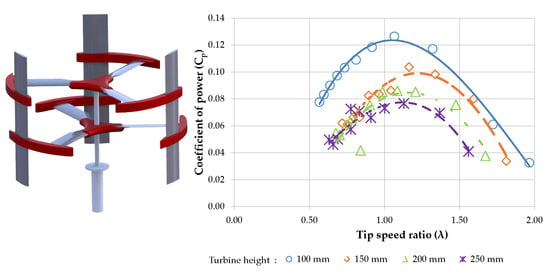
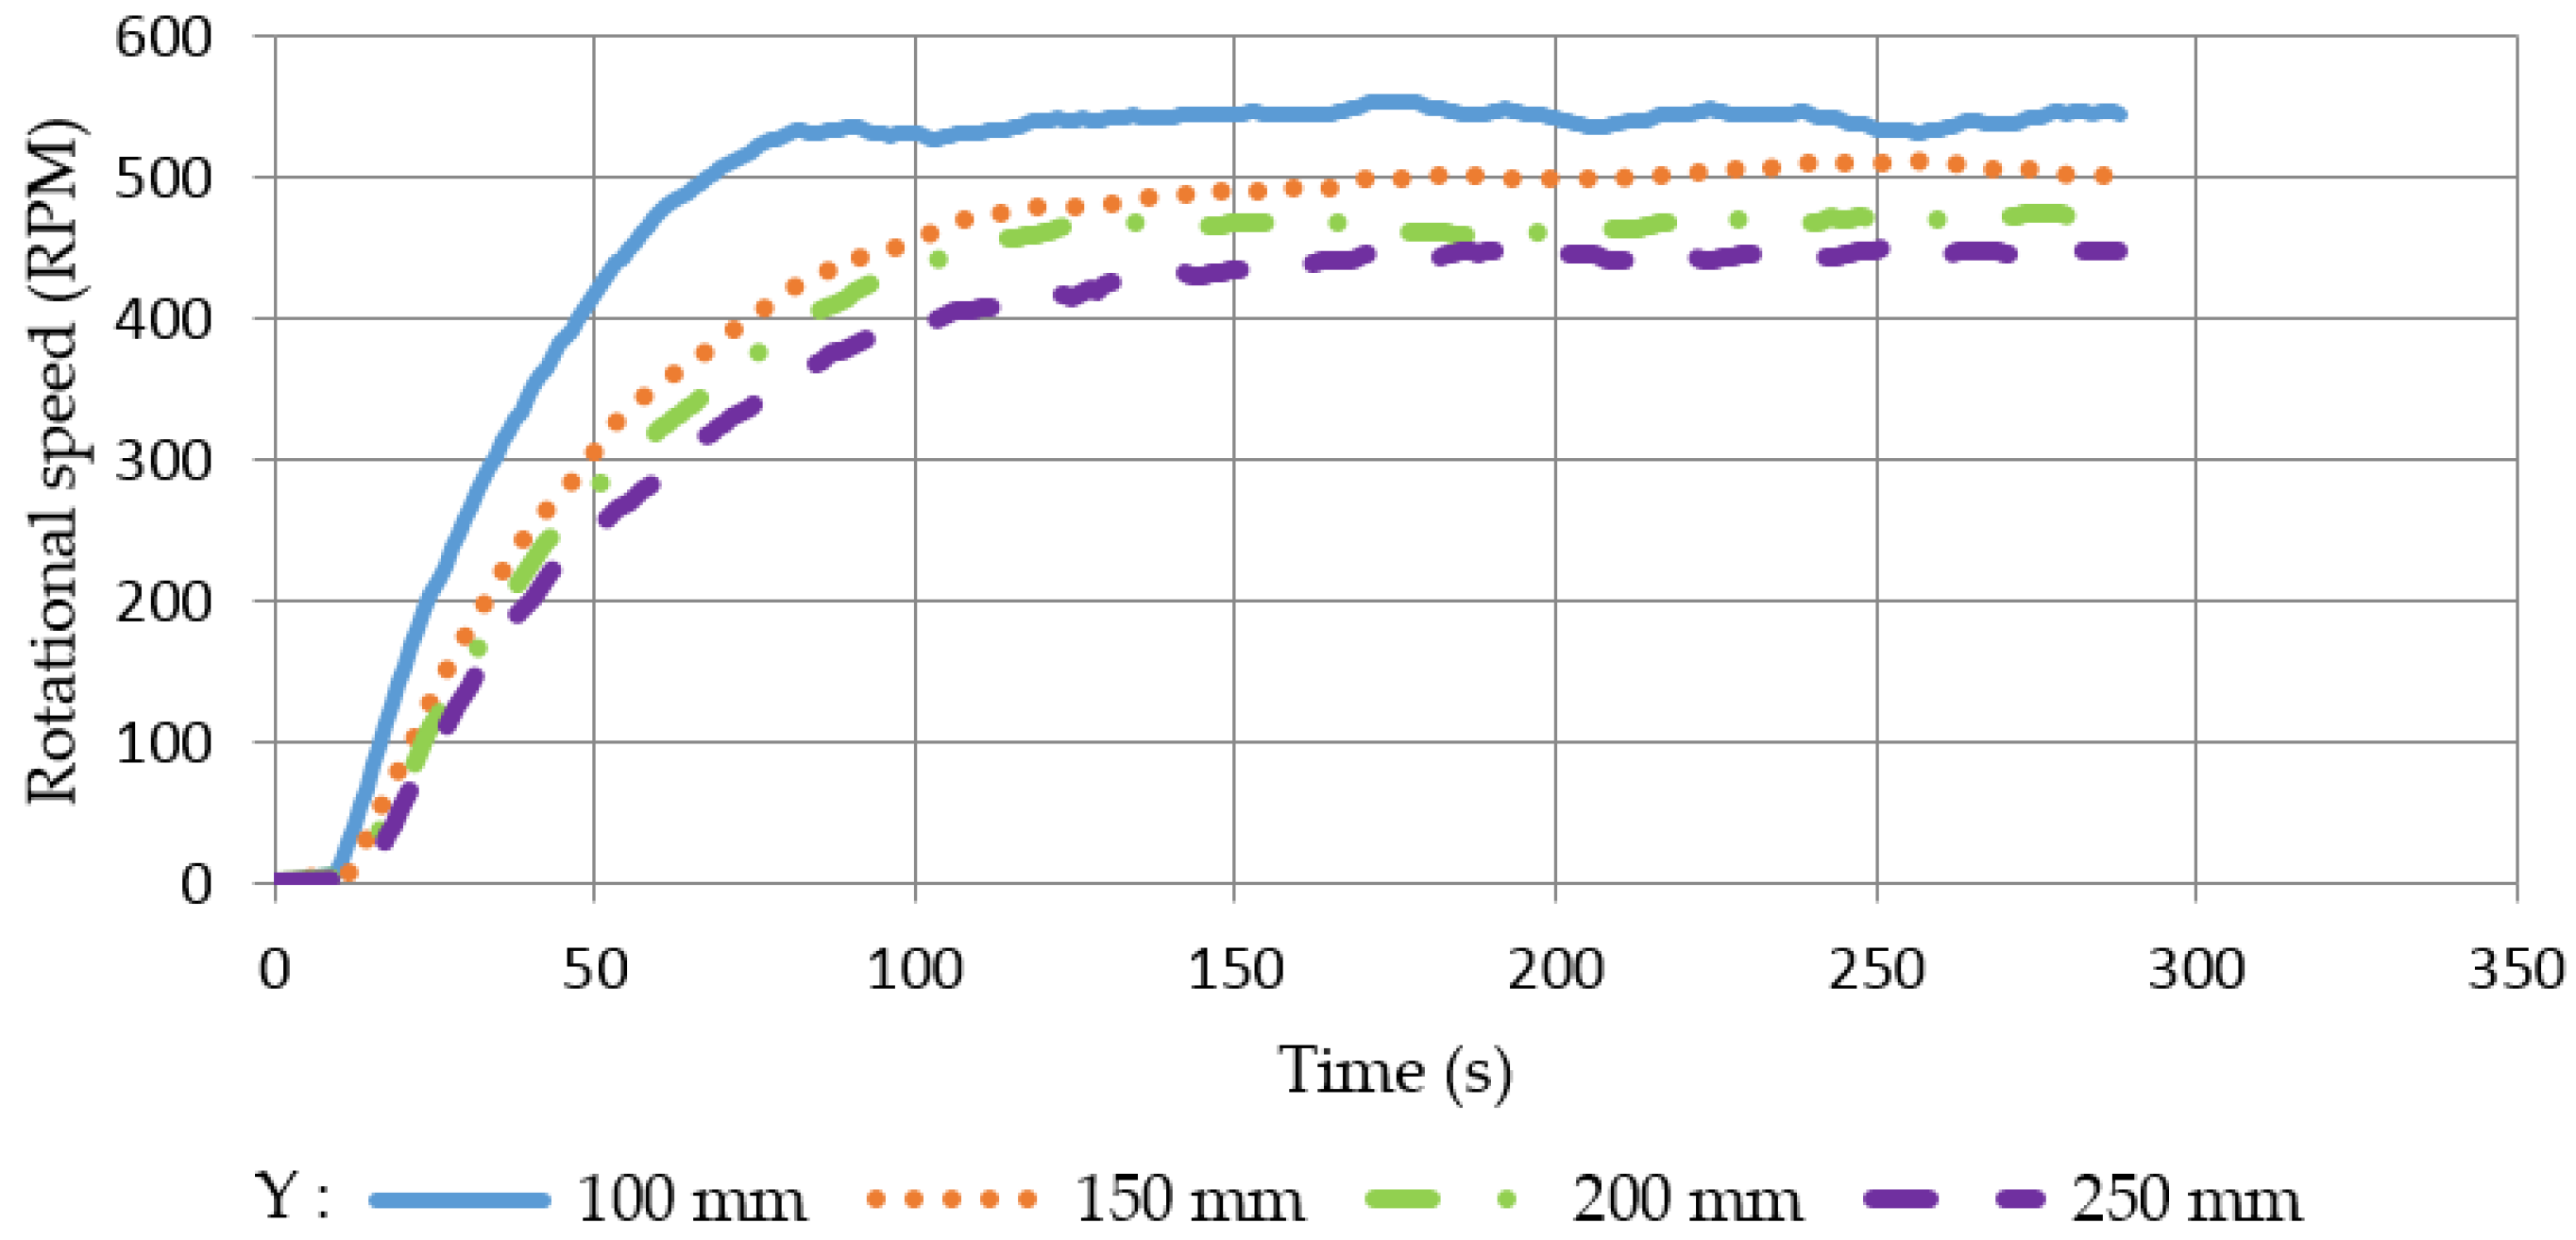
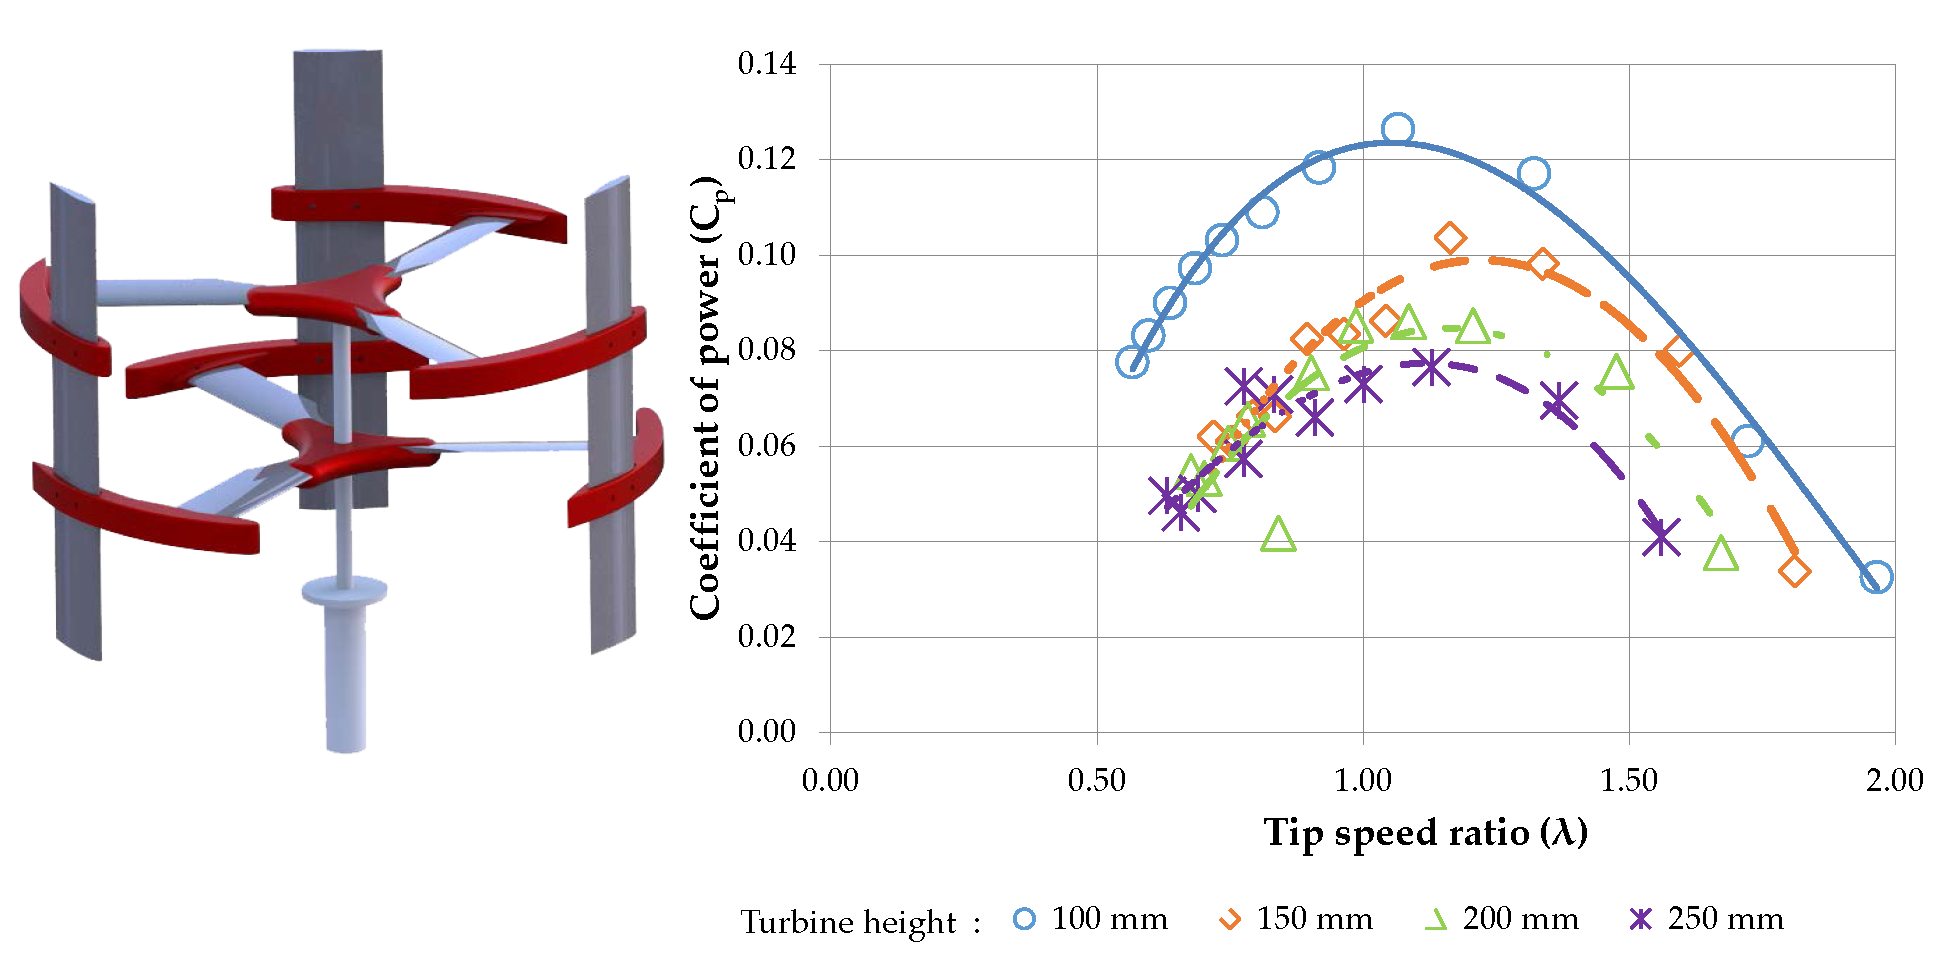
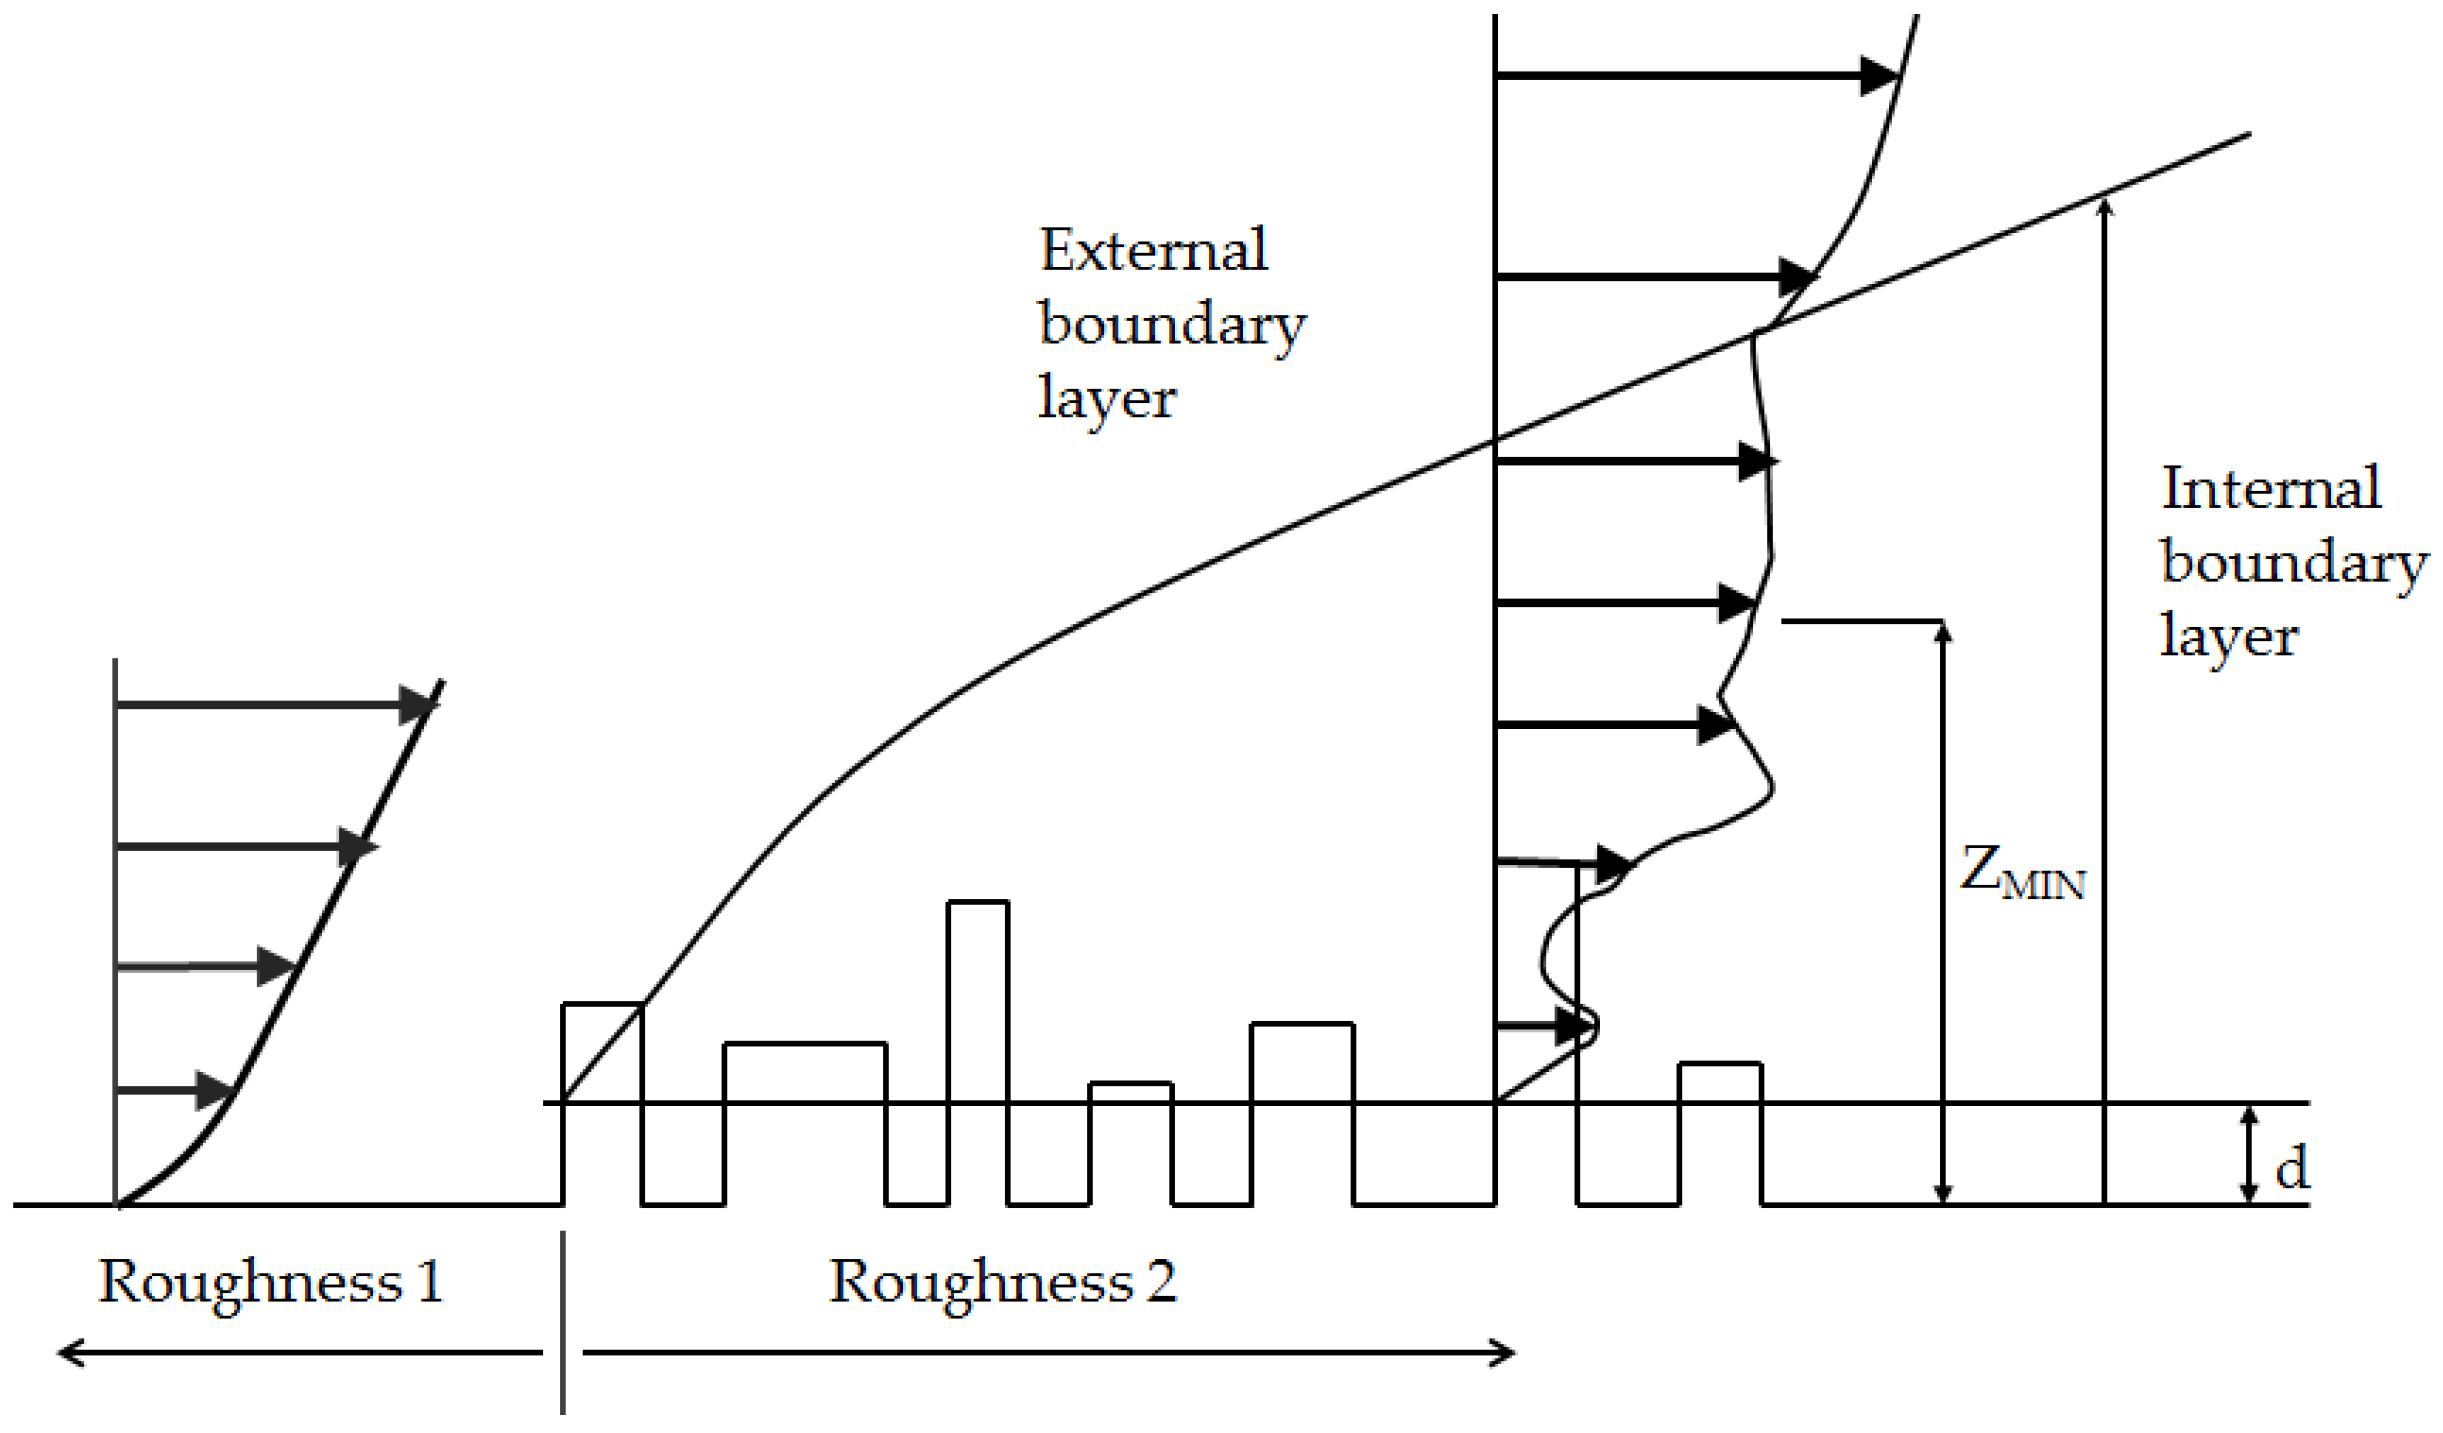
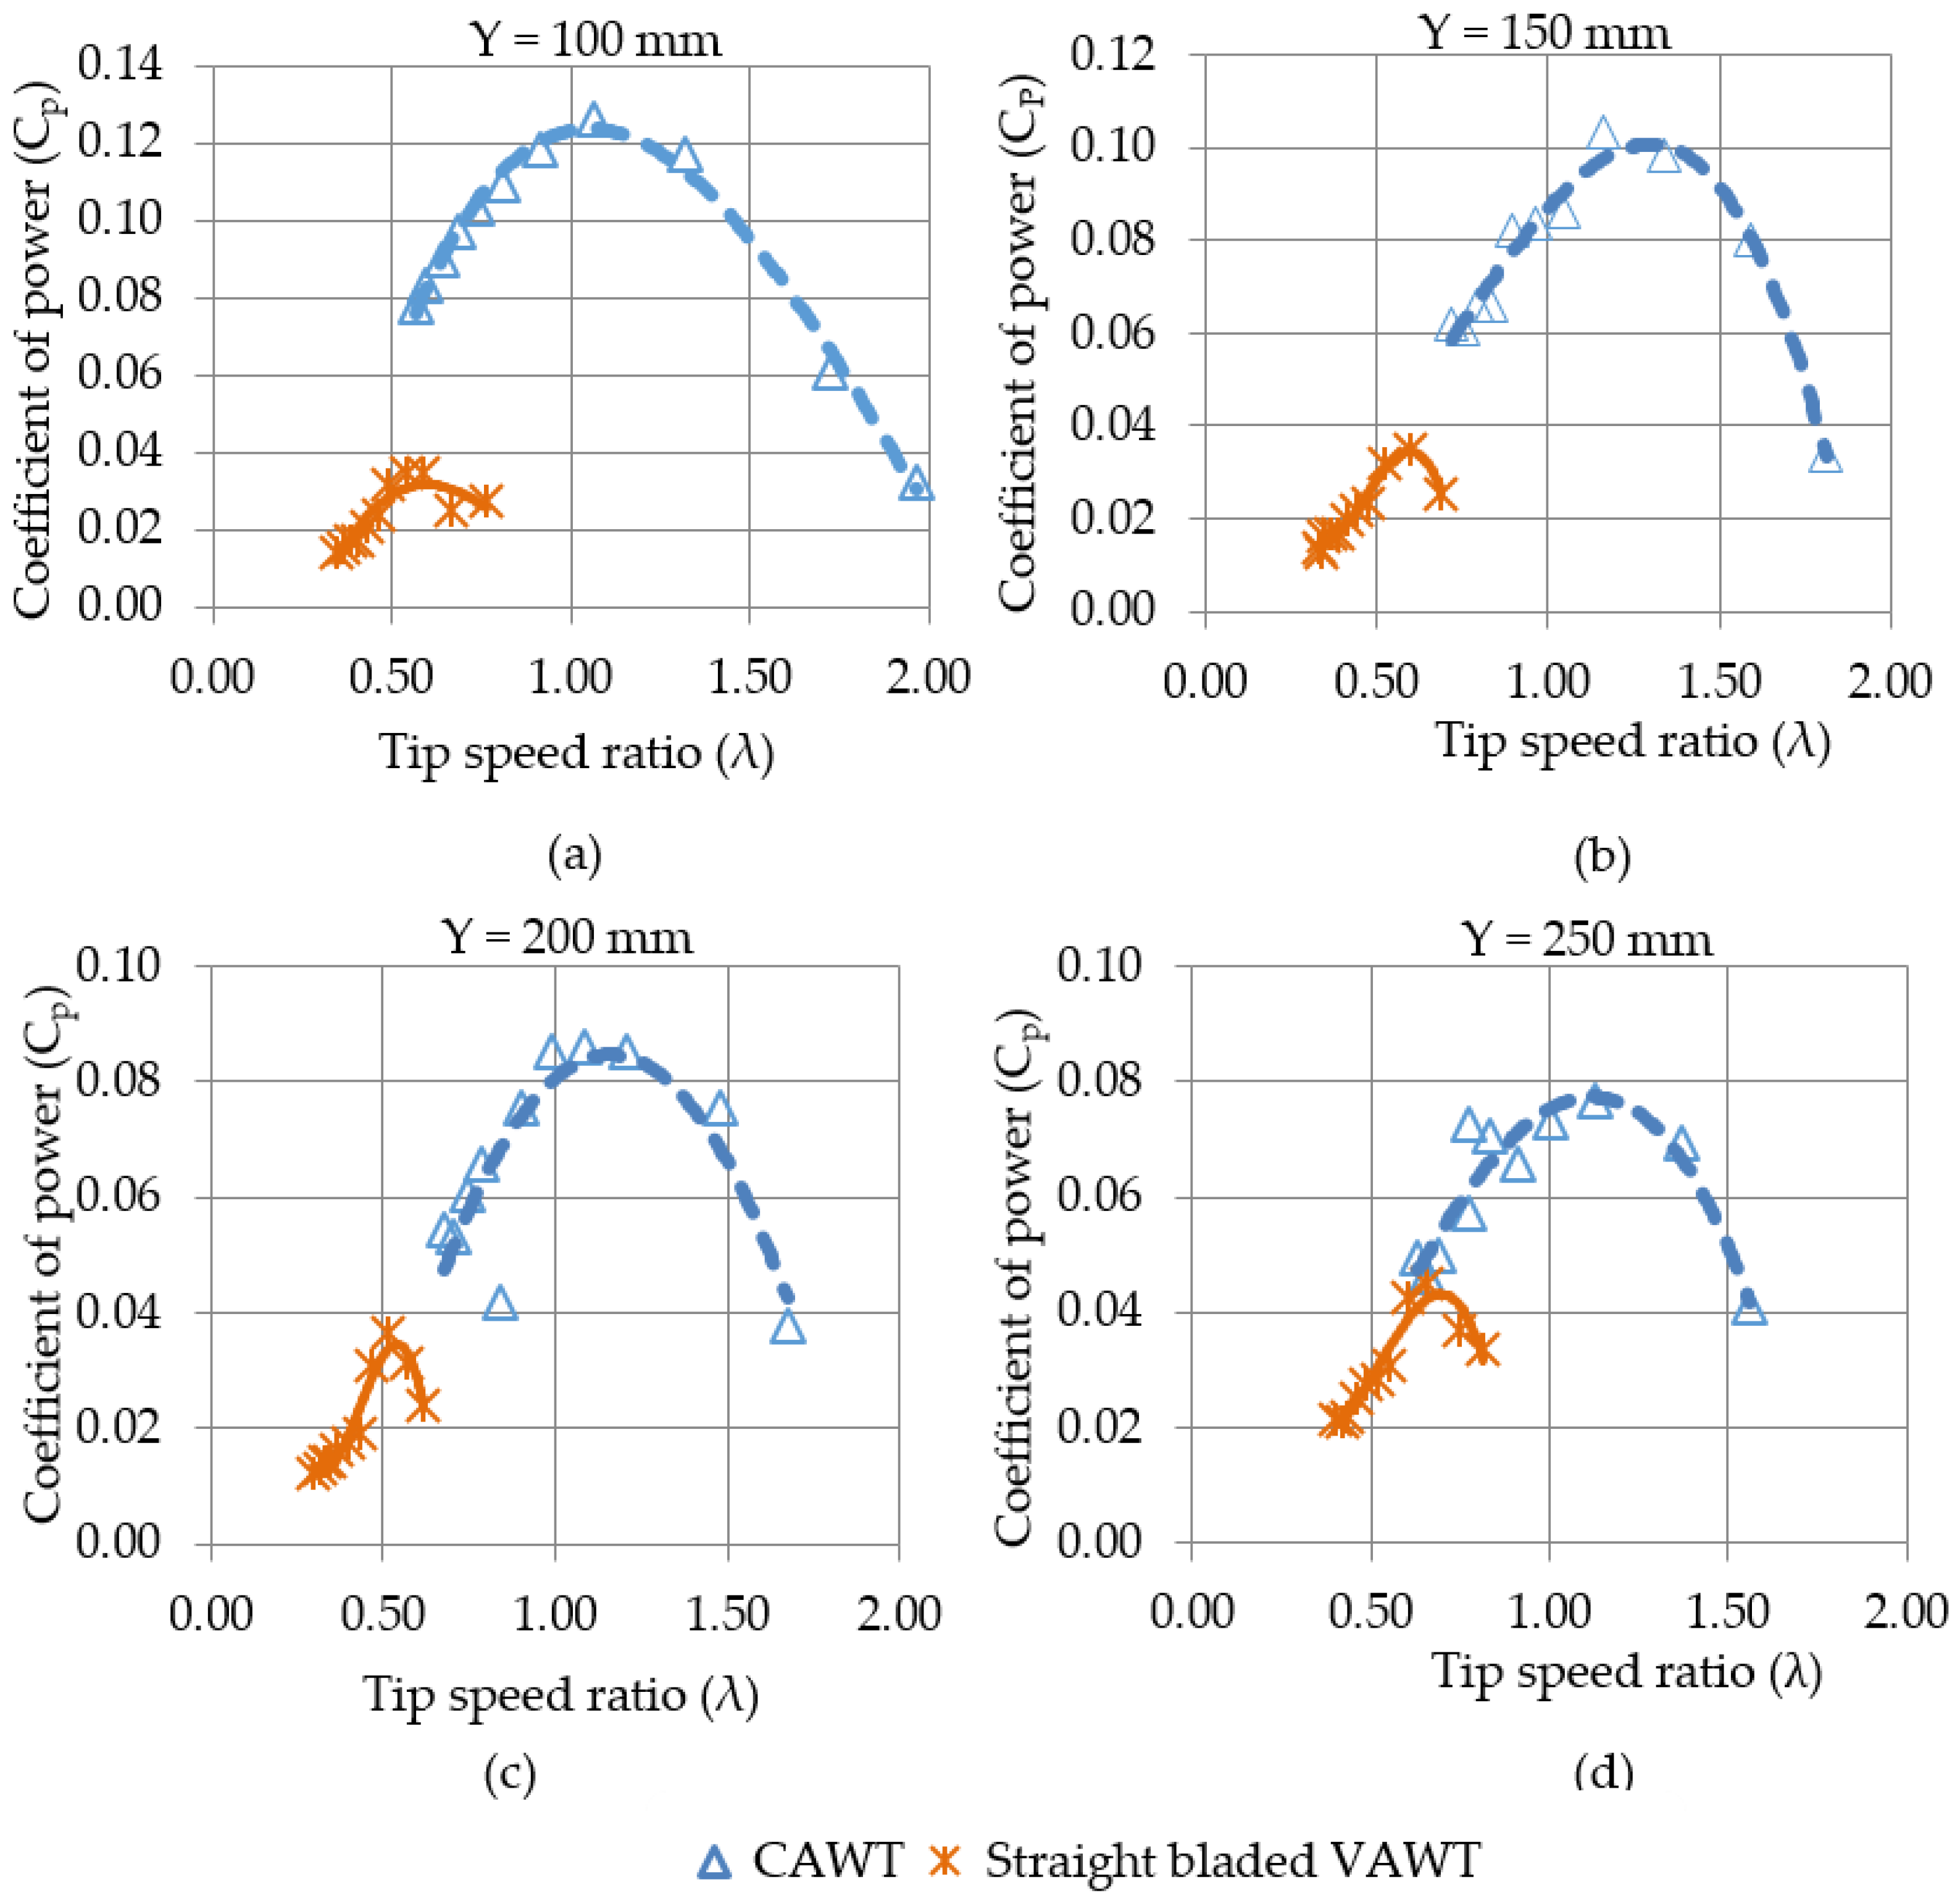
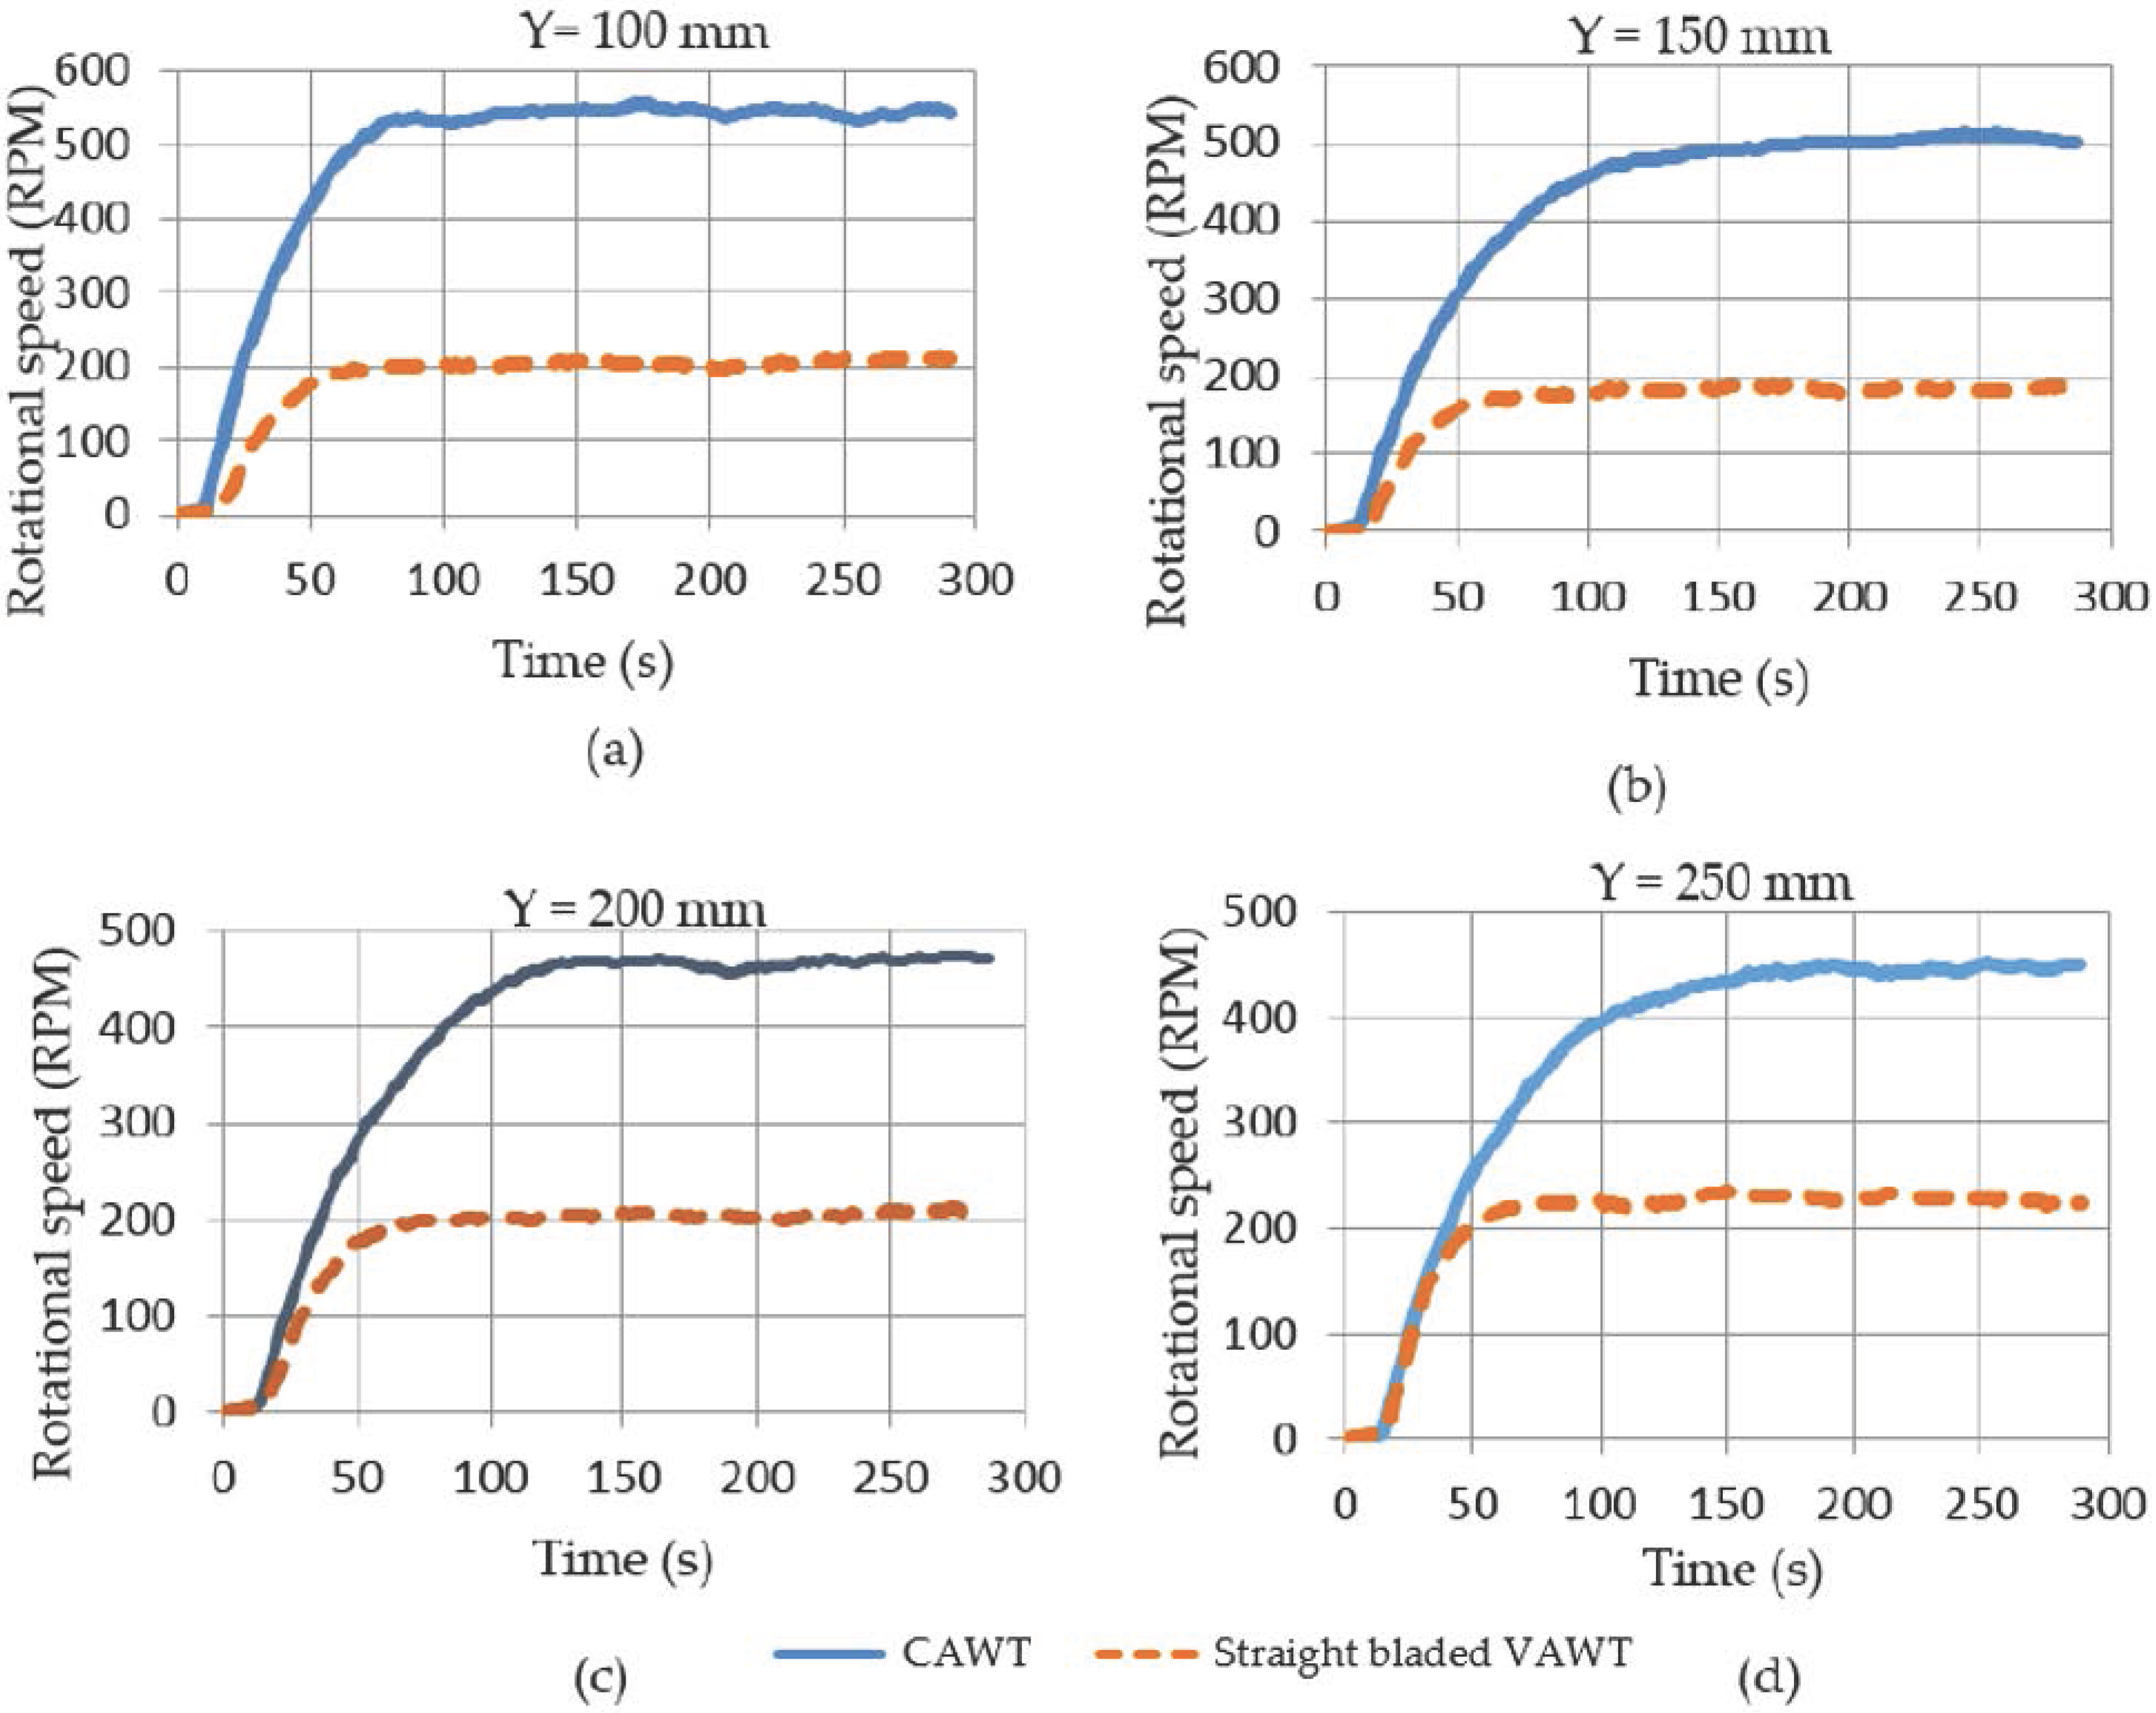
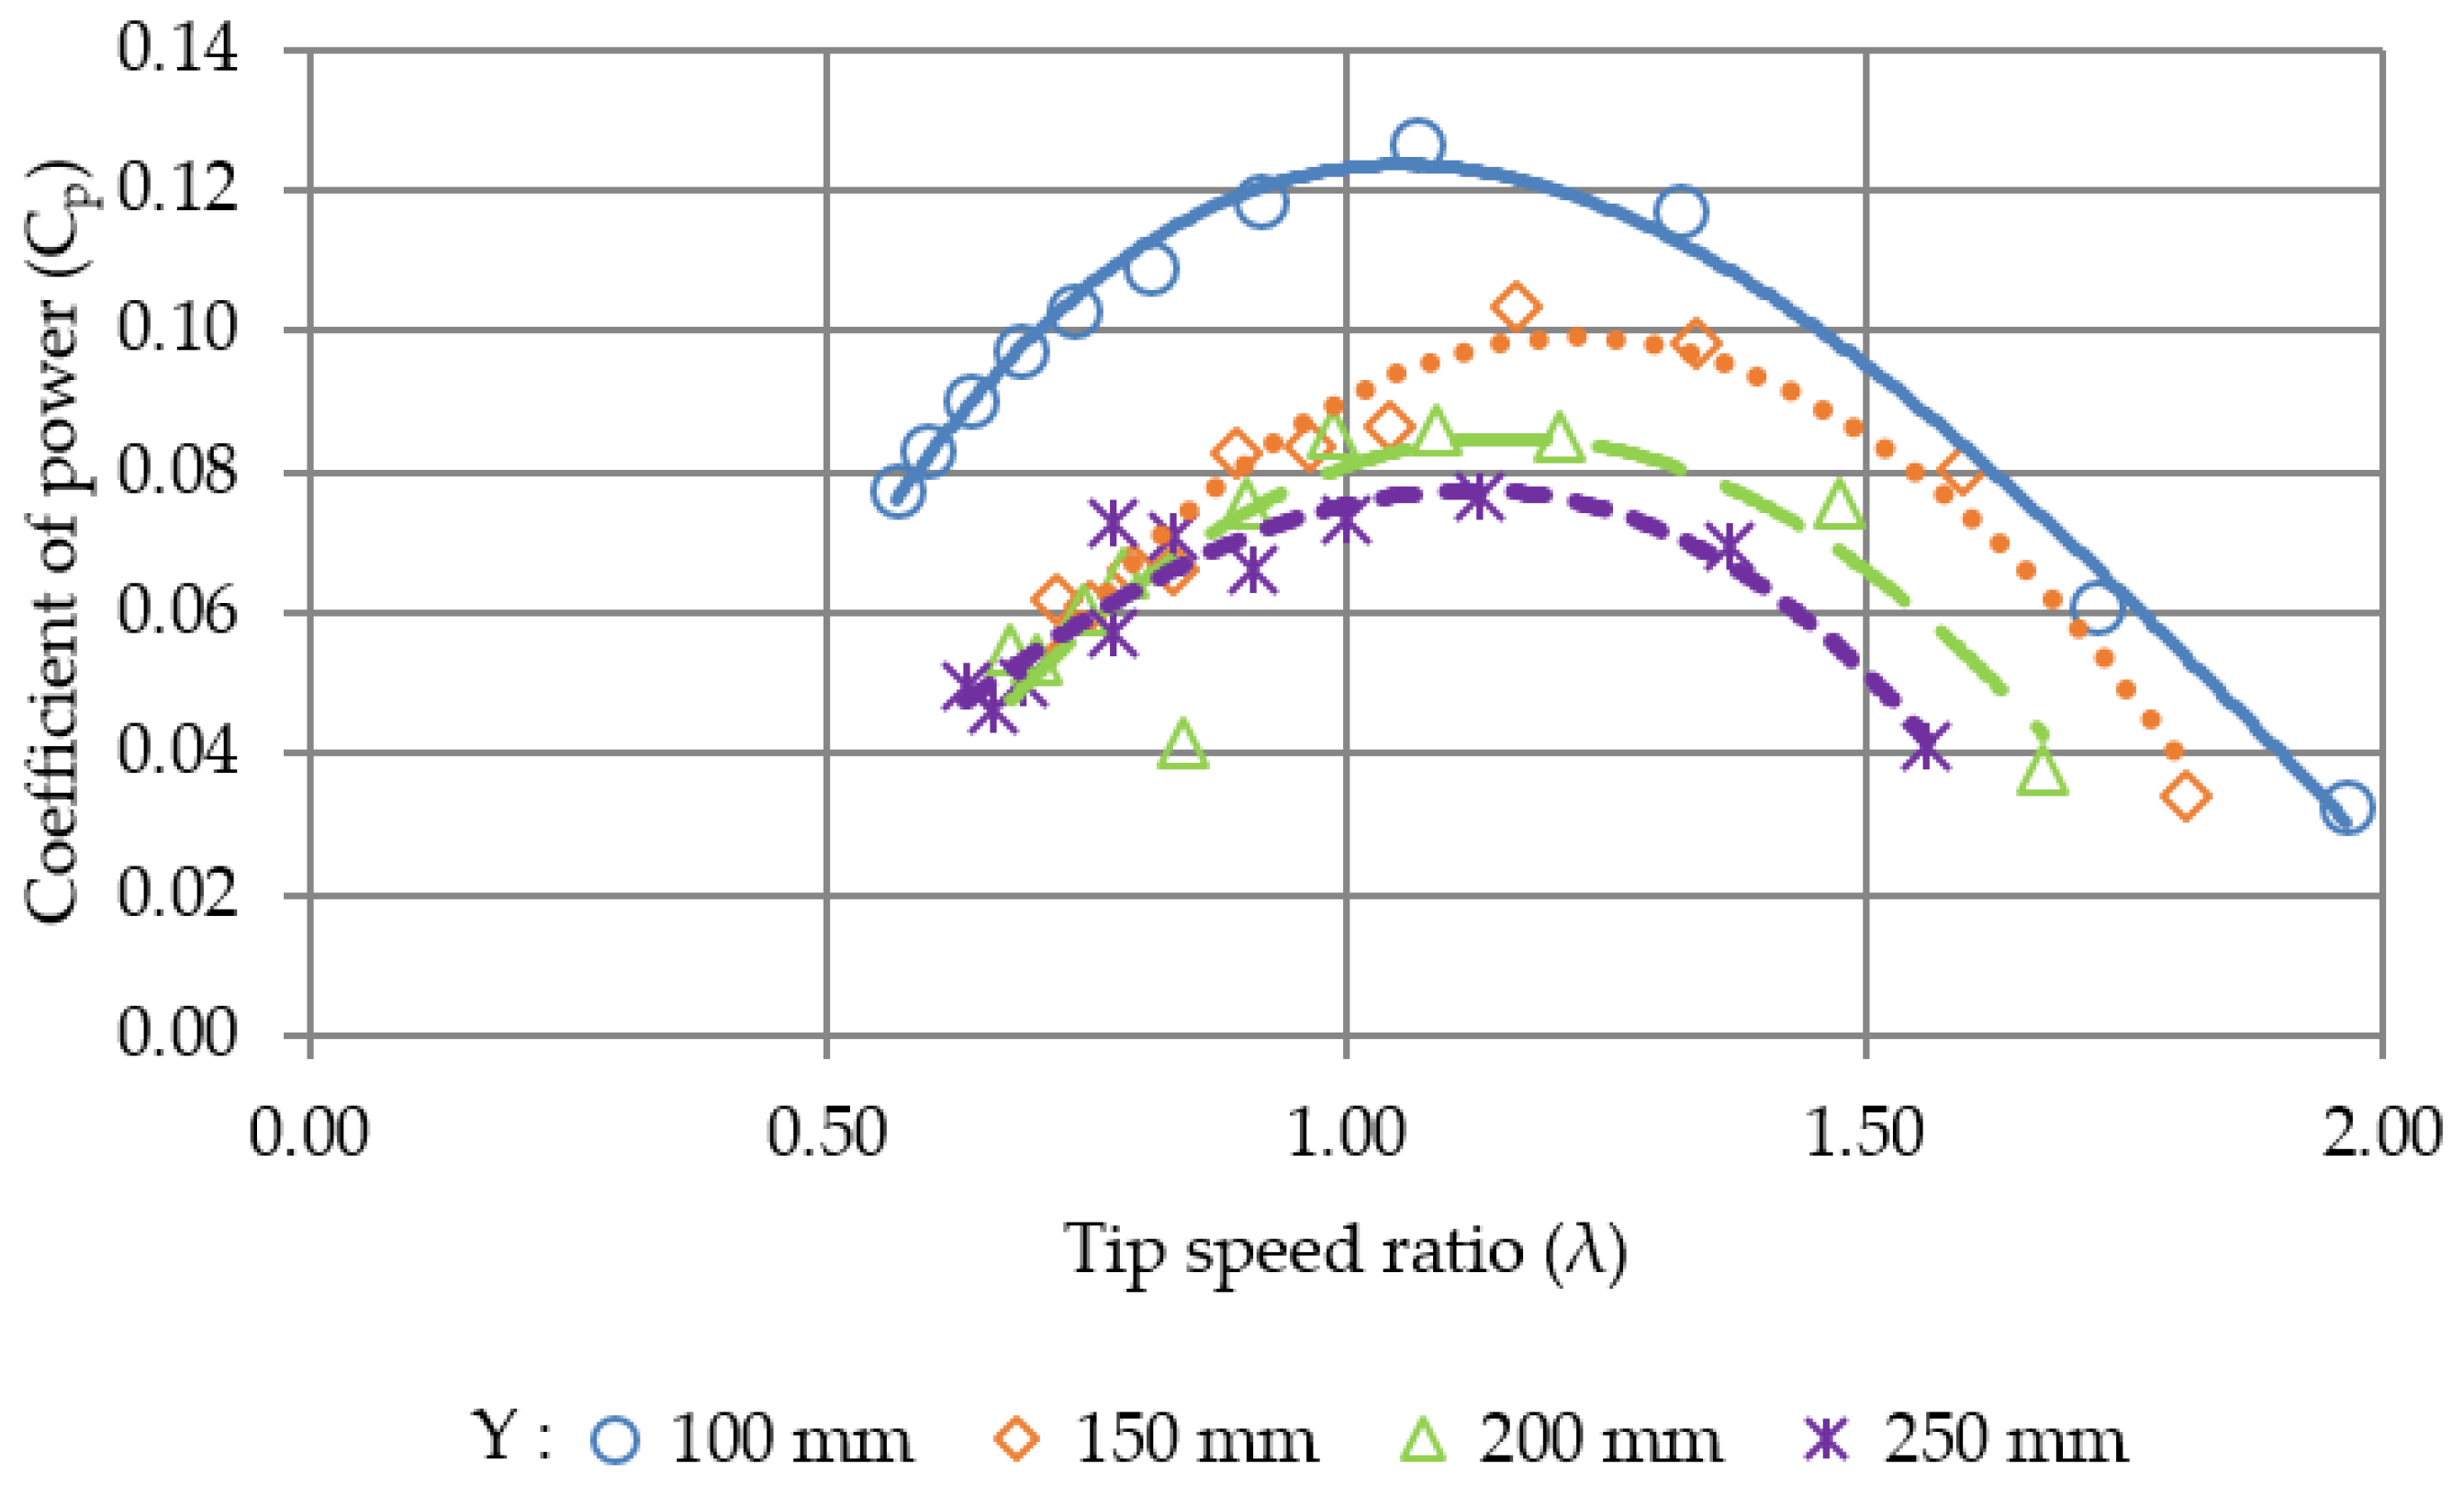
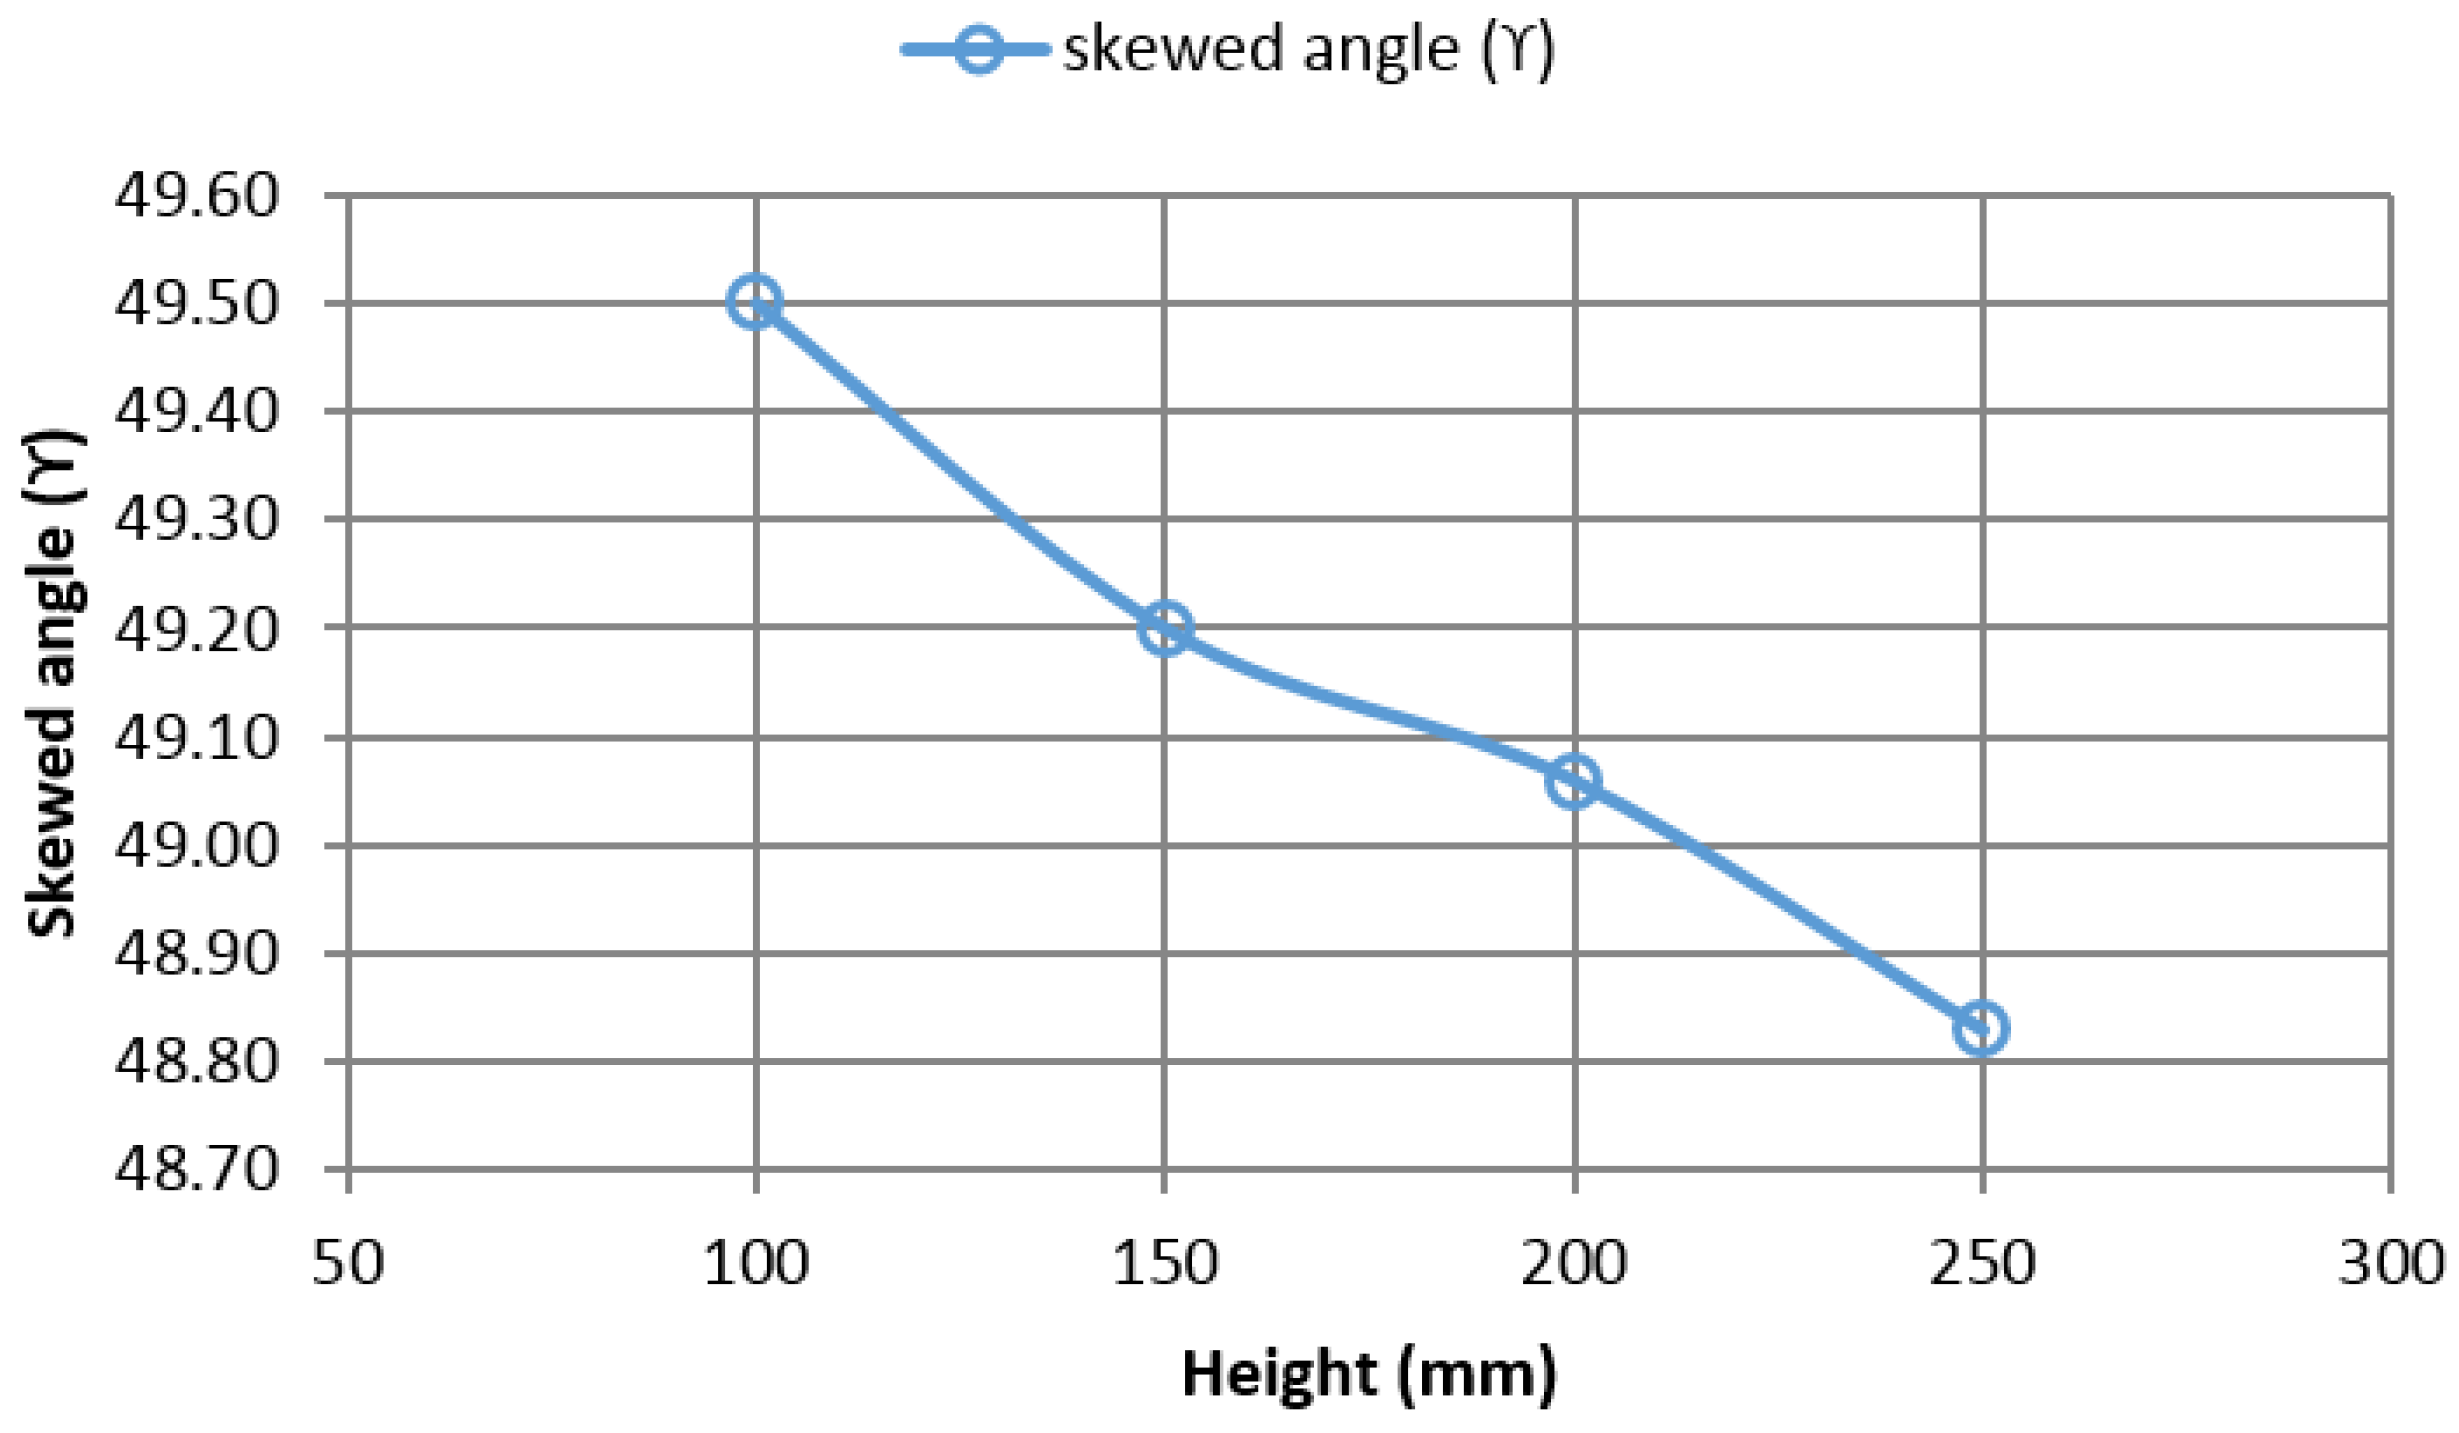
6.2. Variation of Height Above the Rooftop

The height of the building integrated CAWT and the conventional straight-bladed VAWT were varied from Y = 100 to 250 mm above the gable rooftop of the building. Figure 12a–d compares the Cp values between the building integrated CAWT and the conventional straight-bladed building integrated VAWT at turbine height Y = 100, 150, 200 and 250 mm. Results showing similar trend were obtained for Figure 12a–d. Figure 12a shows the coefficient of power against the tip speed ratio of the CAWT and the VAWT placed at 100 mm height above the rooftop of the building model. Based on the results obtained in Figure 12a, the CAWT can attain a maximum Cp of 0.1263 at a TSR (λ) of 1.1. The maximum Cp of the conventional straight-bladed VAWT integrated on the same rooftop of a building and subjected to similar experimental conditions is 0.0345 at a TSR (λ) of 0.59 (Figure 12a). The result shows that the Cp,max for the CAWT increased by 266% compared to the straight-bladed VAWT for Y = 100 mm as shown in Table 3. Figure 12b compares the Cp values between the CAWT and the straight-bladed VAWT placed at 150 mm height above the building model. The result showed that the maximum Cp recorded by the CAWT at Y = 150 mm is 0.1035 at a TSR (λ) of 1.16 higher than the Cp,max value recorded by the straight-bladed VAWT whose highest Cp value is 0.0350 at a TSR (λ) of 0.60. This shows that at 150 mm height above the gable rooftop, the CAWT outperformed the conventional straight-bladed VAWT by 196%. This increase in Cp values by the CAWT is attributed to the horizontal blades which serve as a horizontal axis wind turbine by interacting with the vertical airflow that is deflected from the building.
Figure 12c presents the Cp value of the building integrated CAWT and the straight-bladed VAWT for Y = 200 mm. It can be observed that the CAWT outperformed the conventional straight-bladed VAWT. The results showed that the Cp value attained by the CAWT is higher than that recorded by the VAWT. The maximum Cp value recorded by the building integrated CAWT and VAWT are 0.0859 at a TSR (λ) of 1.08 and 0.0364 at a TSR (λ) of 0.51. In comparison, the maximum Cp value for the building integrated CAWT is 136% higher compared to the maximum Cp value of the building integrated VAWT. The improved performance of the building integrated CAWT is attributed to the horizontal blade which utilized the vertical wind deflected by the building and the pitch angles of the horizontal blades which expose the horizontal blades to an optimum angle of attack to the vertical wind. Similarly, the result presented in Figure 12d for Y = 250 mm indicates that the Cp value of the building integrated CAWT increases by 71% compared to the conventional straight-bladed VAWT under the same experimental conditions. The maximum Cp value recorded by the building integrated CAWT and VAWT at Y = 250 mm are 0.0765 at a TSR (λ), of 1.12, and 0.0448 at a TSR, (λ) of 0.66. The result were summarised in Table 3, and the Cp values were calculated using Equation (2).
In general, the building integrated CAWT is shown to have better performance than the VAWT for all the configurations (100–250 mm). These significant improvements in the Cp values of the building integrated CAWT is attributed to the cross axis orientation of the CAWT which enables it to operate with dual wind directions. The roof shape acts as an augmentation device to further increase the wind speed due to the accelerating effects of the roof. The increased wind speed which is deflected from the roof of the building is utilized by the horizontal blades to increase the torque output of the CAWT by having a larger area for the oncoming wind to interact with the turbine. Furthermore, the horizontal blades of the CAWT create aerodynamic lift force that contributes in improving the self-starting characteristics of the CAWT. The presence of the horizontal blades as the supporting struts of the CAWT can lead to double advantage to minimize the parasitic drag contribution during the revolution and to produce some positive torque [49]. Furthermore, due to the performance improvement in the CAWT due to the skewed flow effect can also lead to a reduction of the minimum cut-in speed, thus extending the operating range of the rotor and increasing the energy harvesting for the low-wind conditions. The case is not the same for the VAWT since the arms (supporting struts) of the vertical blade is not an airfoil and thus does not utilize the deflected airflow from the accelerating effect of the roof. The low Cp output of the conventional straight-bladed VAWT is attributed to the radial arms (supporting struts) of the VAWT. The supporting struts of the VAWT inevitably affect the power output of the turbine by adding additional drag (parasitic drag) on the turbine, thereby affecting the overall performance of the VAWT [10,44,50]. The results are summarized in Table 3.
Figure 13a–d compares the rotational speed of the free running CAWT and the straight-bladed VAWT placed at 100 to 250 mm height above the gable rooftop of the building model.
The time recording is started immediately after switching on the ventilation fans. Figure 13a shows the rotational speed for CAWT and the one for VAWT at Y = 100 mm. The RPM for both turbines increases with time until it reaches maximum values of 554 and 179 RPM at t = 178 and t = 249 s, respectively. The rotational speed becomes constant (stabilize) after that. The maximum RPM recorded by the CAWT is 209% higher than the one for the VAWT under the same experimental conditions. Furthermore, the figure shows that the CAWT started to rotate earlier than the VAWT. At Y = 150 mm, the results shown in Figure 13b indicate that the rotational speed recorded by the building integrated CAWT is 171% higher than the one recorded by the building integrated VAWT (Table 3).
Similarly, Figure 13c,d presents the RPM of the building integrated CAWT and the VAWT for Y = 200 and 250 mm height above the rooftop of the building. It can be observed from the figure that the CAWT integrated onto the building with gable rooftop outperformed the VAWT. The result showed that the RPM increases by 123% and 93%, respectively, compared to the straight-bladed VAWT mounted at the same height and subjected to similar experimental conditions. The improved performance of the building integrated CAWT is attributed to the cross axis orientation of the CAWT where the horizontal blades, which is also the supporting struts of the CAWT, utilized the vertical airflow that is deflected from the building thereby improving the overall performance of the CAWT. In addition, the vertical wind guided by the gable roof shape has successfully reduced the self-starting time and increased the maximum rotational speed of the CAWT resulting in a better efficiency. For the case of the straight-bladed VAWT the connecting struts affect the performance by adding parasitic drag to the turbine.
Further study was conducted on the effect of the increase in turbine height on the performance of the building integrated CAWT. The height of the CAWT above the rooftop was varied as shown in Figure 14, and comparisons were made between the performances of the building integrated CAWT at various heights above the building model. Figure 14 presents the coefficient of power of the CAWT against tip speed ratio at various heights above the building rooftop. The figure shows that the low performance of the CAWT is observed as it is mounted at higher positions above the rooftop of the building. This implies that the closer the CAWT is mounted above the rooftop, and utilizing the vertical wind deflected by the rooftop, a better performance can be expected from the CAWT. Although the results showed a better performance closer to the roof, the air flow closer to the roof is turbulent and the machine experiences more turbulence and as a result more fatigue which may shorten the lifetime of the turbine. Research has shown that VAWT can operate efficiently in a turbulence environment [12,51,52]. Lubitz [53] reported that Turbulence in the approaching wind can have a significant influence on the wind turbine power output, this is mainly significant for the smaller wind turbines which in practice are often situated near buildings, trees and other Impediments. According to Cochran [54] the turbulence intensity has a significant influence on the performance of a wind turbine, due to the cubic variation of power with wind speed, more turbulent winds have greater power than less turbulent winds with the same mean wind speed. Evidence has shown that the turbulence level in the incoming flow affects the rate at which the velocity deficit reduces with downwind distance from the turbine (i.e., wake recovery rate), since the turbulence in the wake is an efficient mixer, it mixes the low velocity fluid in the wake with the high velocity fluid outside it. In this way momentum is transferred into the wake, the wake expands but the velocity deficit is reduced [55].
However, Y = 100 mm is the minimum distance in which the CAWT can be mounted above the rooftop, at Y < 100 mm, the distance will be too close that the vertical blade almost touch the surface of the rooftop. Moreover, the presence of the horizontal blades interacting with the deflected vertical wind enhances the self-starting capability of the CAWT and improves the overall performance of the CAWT. When the height of the CAWT above the rooftop of the building was increased from 100 to 150 mm and from 100 to 200 mm, the maximum Cp of the CAWT drops by 18% and 32%, respectively. The summary of the experimental results for the variation of height is presented in Table 4. Since there is non-uniform wind profile, the turbine at each position is expected to experience a different wind velocity and hence different amounts of available wind energy to be extracted.
Figure 15 shows the rotational speed of the building integrated CAWT at various heights above the rooftop. The overall results and observations showed that as the height of the CAWT above the rooftop is increased, the performance of the CAWT reduces. This is because the horizontal blades of the CAWT which utilizes the vertical airflow that is deflected from the building is been positioned further away from the deflected wind flow. Therefore, at higher position above the rooftop, very small vertical (deflected) wind is experienced by the horizontal blades. Hence, the reason for the poor performance of CAWT at higher positions above the rooftop. On the other hand, at lower positions, due to the speed up effect at the rooftop, more vertical (deflected) wind interacts with the horizontal blades therefore improving the performance of the CAWT. The presence of the horizontal blades of the CAWT is very important in case of the skewed flow, which could actually increase the lift production of the CAWT.
To verify the experimental result on the variation of height of CAWT above the rooftop (Figure 14 and Figure 15), a simple CFD simulation was carried out to calculate the skewed angle (Figure 16) of the wind at the rooftop shown in Section 4 (Figure 8a). For each height of the CAWT above the rooftop, i.e., Y = 100 mm, 150 mm, 200 mm, and 250 mm, the skewed angle is calculated. The result obtained for the calculated skewed angle agrees well with Martens et al. [33] where the skewed angle is largest close to the windward side of the roof edge. Figure 16 presents the results for the skewed angle for each of the turbine height above the rooftop. From the figure; it can be observed that the highest skewed angle is obtained at the 100 mm height of the CAWT. This confirms the results obtained in Figure 14 where the CAWT mounted at 100 mm height performs better than other heights. The figure shows that the skewed angle decreases with increase in height. Therefore, the performance of the CAWT increases with increase in skewed angle. Similarly, improvement in the performance of VAWT turbine due to skewed flow is reported in [6,33,56].
The higher skewed angle experience by the CAWT at 100 mm height also contributed to the improved performance of the CAWT at that position (Figure 14). At higher skewed angle the swept area of the turbine is increased due to the contribution of the downwind zone which counterparts the decrease of the projected frontal area with an overall increase of the available surface area to intercept the wind as reported by Bianchini et al. [35]. Furthermore, Skewed flow increases the performance of H-VAWT by modifying the region of interaction of the downwind blade passage with the upwind generated wake. Increasing the skewed angle will increase the area of the downwind blades passage which is operating outside the upwind generated wake thus experiencing an incoming flow with larger energy content [34]. While skewed angle is believed to improve the performance of wind turbine in urban buildings as reported by Mertens et al. [33], Bianchini et al. [35], and Ferreira et al. [57]. ZanForlin and Letizia [56] reported that for the case of cowling system the wind turbine in a skewed flow can lead to power loss of 11.6%. The skewed wind conditions in the cowling system generates excessive blockage thereby becoming an obstacle to the oncoming flow.

7. Conclusions

A highly efficient wind turbine with cross axis orientation for application in urban buildings has been designed and tested. The uniqueness of this design gives rise to its technical advantages over the conventional wind turbines and can minimize or completely eliminate the disadvantages of the conventional wind turbines. The idea of using horizontal blades as connecting struts for the CAWT is shown to have played a significant role in the improved rotational speed, power output and self-start behavior of the CAWT. The results obtained from the study showed that the coefficient of power (Cp) of the building integrated CAWT improved significantly compared to the building integrated straight-bladed VAWT. At Y = 100 mm, the Cp,max value of the CAWT increased by 266% at a TSR (λ) of 1.1 at a wind speed of 4.5 m/s compared to the straight-bladed VAWT under the same experimental conditions. Similar improvement in performance of CAWT is also observed for all conditions of height, i.e., Y = 150 mm, 200 mm, and 250 mm. The results obtained from the variation of height of CAWT above the rooftop showed that the closer the height of CAWT to the building rooftop, the better the performance of the CAWT. The result was verify from the CFD simulation which indicates that the 100 mm height has the highest skewed angle which helps to improves the performance of the building integrated CAWT. The building roof shape acts as an augmentation device by deflecting the free stream wind speed to the horizontal blades of the CAWT thereby enhancing it self-starting behavior and its overall performance. The 10° pitch angle for the horizontal blades is the optimum pitch angle for the CAWT. Increasing the pitch angle above this affects the performance of the CAWT by reducing the maximum Cp obtained. In addition, decreasing the pitch angle below 10° reduces the performance of the CAWT. Building integrated CAWT represents the future outlook of wind turbines in urban environments. However, there are some limitations from the study that require further investigations.
The study was limited to a specific model wind turbine (CAWT) of high solidity, low power coefficient, and low Reynolds number flow regime. Therefore, it is necessary to study this new type of wind turbine in a wind tunnel with higher Reynolds number flow regime, more over the blockage ratio of the CAWT in the wind tunnel should be estimated.
Although the results show a better performance closer to the rooftop, it should be known that closer to the rooftop, the air flow is turbulent and the machine experiences more turbulence and as a result more fatigue. It is therefore necessary to investigate the turbulence level closer to the rooftop where the CAWT was installed and its effect on the turbine cost and its lifetime. Studies on blade fatigue should also be one of the focus areas.
Since the experiment were performed on a semi-open wind tunnel where the flow is not controlled, turbulent flow is expected, and the turbulence in the experimental area cannot be controlled due to the limitations of instruments and costs. The turbulence could affect the wind turbine performance; therefore, it is necessary to study the CAWT in a proper wind tunnel with higher Reynolds number flow regime and higher accuracy instruments
The innovative design of the CAWT was intended to be very versatile and to excel in many different environments. It is an ideal solution for on-site building integrated wind turbines, especially in urban areas with relatively low to moderate wind speeds and a high level of turbulence. Future studies should include testing the CAWT for different roof shapes and performance prediction and/or CFD analysis of the flow field.

Acknowledgments

The authors would like to thank the University of Malaya for the research grant allocated under the University of Malaya Research Grant (RP015C-13AET). Special appreciation is also credited to the Malaysia Ministry of Higher Education (MOHE) for the research grant (Prototype Research Grant Scheme, PRGS–PR005-2016). The authors would also like to thank the Centre for Research Grant Management Unit, University of Malaya for the Postgraduate Research Grant (PG098-2014A).

Author Contributions

Wen Tong Chong, conceived the idea, the design and filed a patent on the novel CAWT (Patent Application No.: PI 2015702341). Mohammed Gwani, and Wan Khairul Muzammil developed the prototype of the novel CAWT, performed the experiments, and analyzed the data. Chin Joo Tan, Sin Chew Poh and Kok Hoe Wong contributed materials and provided useful information and suggestions for the article. All authors contributed to writing the paper.

Conflicts of Interest

The authors declare no conflict of interest.

References

  1. Bahaj, A.S.; Myers, L.; James, P.A.B. Urban energy generation: Influence of micro-wind turbine output on electricity consumption in building. Energy Build. 2007, 39, 154–165. [Google Scholar] [CrossRef]
  2. Beri, H.; Yao, Y. Double Multiple Stream Tube Model and Numerical Analysis of Vertical Axis Wind Turbine. Energy Power Eng. 2011, 3, 262–270. [Google Scholar] [CrossRef]
  3. Walker, S.L. Building mounted wind turbines and their suitability for the urban scale—A review of methods of estimating urban wind resource. Energy Build. 2011, 43, 1852–1862. [Google Scholar] [CrossRef]
  4. Mertens, S. Wind energy in urban areas: Concentration effects for wind turbine close to buildings. Refocus 2002, 3, 22–24. [Google Scholar] [CrossRef]
  5. Sunderland, K.; Conlon, M. Estimating the Yield of Micro Wind Turbines in an Urban Environment: A Methodology. In Proceedings of the 2010 45th International Universities Power Engineering Conference (UPEC), Dublin Institute of Technology ARROW@DIT, Cardiff, UK, 31 August–3 September 2010.
  6. Balduzzi, F.; Bianchini, A.; Carnevale, E.A.; Ferrari, L.; Magnani, S. Feasibility analysis of a Darrieus vertical-axis wind turbine installation in the rooftop of a building. Appl. Energy 2012, 97, 921–929. [Google Scholar] [CrossRef]
  7. Beller, C. Energy Output Estimation for a Small Wind Turbine Positioned on a Rooftop in the Urban Environment with and without a Duct; Risø National Laborator for Sustainable Energy: Roskilde, Demark, 2011. [Google Scholar]
  8. Padmanabhan, K.K. Study on increasing wind power in buildings using TRIZ Tool in urban areas. Energy Build. 2013, 61, 344–348. [Google Scholar] [CrossRef]
  9. Pope, K.; Dincer, I.; Naterer, G.F. Energy and exergy efficiency comparison of horizontal and vertical axis wind turbines. Renew. Energy 2010, 35, 2102–2113. [Google Scholar] [CrossRef]
  10. Islam, M.; Fartaj, A.; Carriveau, R. Analysis of the Design Parameters related to a Fixed-pitch Straight-Bladed Vertical Axis Wind Turbine. Wind Eng. 2008, 32, 491–507. [Google Scholar] [CrossRef]
  11. Wang, Y.; Sun, X.; Dong, X.; Zhu, B.; Huang, D.; Zheng, Z. Numerical investigation on aerodynamic performance of a novel vertical axis wind turbine with adaptive blades. Energy Convers. Manag. 2016, 108, 275–286. [Google Scholar] [CrossRef]
  12. Eriksson, S.; Benhoff, H.; Leijon, M. Evaluation of different turbine concept for wind power. Renew. Energy 2008, 12, 1219–1234. [Google Scholar] [CrossRef]
  13. Ackermann, T.; Soder, L. Wind energy technology and current status: A review. Renew. Sustain. Energy Rev. 2000, 4, 315–374. [Google Scholar] [CrossRef]
  14. Hyun, B.S.; Choi, D.H.; Han, J.S.; Jin, J.Y.; Roo, C.H. Performance analysis and design of vertical axis tidal stream turbine. J. Shipp. Ocean Eng. 2012, 2, 191–200. [Google Scholar]
  15. Johnson, G.L.; Manhattan, K.S. Wind Energy Systems. Available online: http://eece.ksu.edu/~gjohnson/Windbook.pdf (accessed on 27 September 2016).
  16. Dominy, R.; Lunt, P.; Bickerdyke, A.; Dominy, J. Self-starting capability of a Darrieus turbine. Proc. Inst. Mech. Eng. A J. Power Energy 2007, 221, 111–120. [Google Scholar] [CrossRef] [Green Version]
  17. Hill, N.; Dominy, R.; Ingram, G.; Dominy, J. Darrieus turbines: The physics of self-starting. Proc. Inst. Mech. Eng. A J. Power Energy 2009, 223, 21–29. [Google Scholar] [CrossRef]
  18. Bianchini, A.; Ferrari, L.; Magnani, S. Start-up Behavior of a Three-Bladed H-Darrieus VAWT: Experimental and Numerical Analysis. In Proceedings of the ASME Turbo Expo 2011 GT2011, Vancouver, BC, Canada, 6–10 June 2011.
  19. Kirke, B.K. Evaluation of Self-Starting Vertical Axis Wind Turbines for Stand-Alone Applications. Ph.D. Thesis, Griffith Univerisity Gold Coast Campus, School of Engineering, Brisbane, Australia, 1998. [Google Scholar]
  20. Worasinchai, S.; Ingram, G.L.; Dominy, R.G. The physics of H-Darrieus turbine starting behavior. J. Eng. Gas Turbines Power 2015, 138, 1–27. [Google Scholar] [CrossRef]
  21. Batista, N.C.; Melício, R.; Mendes, V.M.F.; Calderón, M.; Ramiro, A. On a self-start Darrieus wind turbine: Blade design and field tests. J. Renew. Sustain. Energy Rev. 2015, 52, 508–522. [Google Scholar] [CrossRef]
  22. Barker, J.R. Features to aid or enable self-starting of fixed pitch low solidity vertical axis wind turbines. Wind Eng. Ind. Aerodyn. 1983, 15, 369–380. [Google Scholar] [CrossRef]
  23. Bhutta, M.M.A.; Hayat, N.; Farooq, A.U.; Ali, Z.; Jamil, S.R.; Hussain, Z. Vertical axis wind turbine—A review of various configurations and design techniques. Renew. Sustain. Energy Rev. 2012, 16, 1926–1939. [Google Scholar] [CrossRef]
  24. Hau, E. Wind Turbines: Fundamentals, Technologies, Applications, Economics, 2nd ed.; Springer: Berlin, Germany, 2006. [Google Scholar]
  25. Stankovic, S.; Campbell, N.; Harries, A. Urban Wind Energy; Earthscan: London, UK, 2009. [Google Scholar]
  26. Ledo, L.; Kosasih, P.B.; Cooper, P. Roof mounting site analysis for micro-wind turbines. Renew. Energy 2011, 36, 1379–1391. [Google Scholar] [CrossRef]
  27. Dayan, E. Wind energy in building: Power generation in the urban environment—Where it is need most. Refocus 2006, 7, 33–38. [Google Scholar] [CrossRef]
  28. Cochran, B.C.; Damiani, R.R. Integrating Wind Energy into the Design of Tall Buildings—A Case Study of the Houston Discovery Tower. In Proceedings of the Wind Power 2008, Huston, TX, USA, 2–4 June 2008; pp. 1–11.
  29. Mertens, S. Energy yield of roof mounted wind turbine. Wind Eng. 2003, 27, 508. [Google Scholar] [CrossRef]
  30. Dutton, A.G.; Halliday, J.A.; Halliday, M.J. The Feasibility of Building Mounted/Integrated Wind Turbines (BUWTs): Achieving Their Potential for Carbon Emission Reductions; Final Report for Energy research Unit, Rutherford Appleton Laboratory, Science and Technology Facilities Council: Oxfordshire, UK, 4 May 2005; pp. 1–109.
  31. Muller, G.; Jentsch, M.; Stoddart, E. Vertical axis resistance type wind turbines for use in buildings. Renew. Energy 2009, 34, 1407–1412. [Google Scholar] [CrossRef]
  32. Sharpe, T.; Proven, G. Crossflex: Concept and early development of a true building integrated wind turbine. Energy Build. 2010, 42, 2365–2375. [Google Scholar] [CrossRef]
  33. Mertens, S.; Kuik, G.V.; van Bussel, G. Performance of an H-Darrieus in the skewed flow on a roof. J. Sol. Energy Eng. 2003, 125, 433–440. [Google Scholar] [CrossRef]
  34. Ferreira, C. Wind tunnel hotwire measurements, flow visualization and thrust measurement of a VAWT in skew. In Proceedings of the 44th AIAA Aerospace Sciences Meeting and Exhibit, Reno, Nevada, 9–12 January 2006.
  35. Bianchini, A.; Ferrara, G.; Ferrari, L.; Magnani, S. An Improved Model for the Performance Estimation of an H-Darrieus Wind Turbine in Skewed Flow. Wind Eng. 2012, 36, 667–686. [Google Scholar] [CrossRef]
  36. Simao Ferreira, C.J.; van Bussel, G.; van Kuik, G. An analytical methods to predict the variation in performance of a H-Darrieus in skewed flow and its experimental validation. In Proceedings of the European Wind Energy Conference, Athens, Greece, 27 February–2 March 2006.
  37. Chowdhury, A.M.; Akimoto, H.; Hara, Y. Comparative CFD analysis of Vertical Axis Wind Turbine in upright and tilted configureation. Renw. Energy 2016, 85, 327–337. [Google Scholar] [CrossRef]
  38. Dannecker, R.K.W.; Grant, A.D. Investigations of a Building Integrated Ducted Wind Turbine Module. Wind Energy 2002, 5, 53–71. [Google Scholar] [CrossRef]
  39. Rainbird, J.M.; Bianchini, A.; Balduzzi, F.; Peiró, J.; Graham, J.M.R.; Ferrara, G.; Ferraric, L. On the influence of virtual camber effect on airfoil polars for use in simulations of Darrieus wind turbines. Energy Convers. Manag. 2015, 106, 373–384. [Google Scholar] [CrossRef]
  40. Sayed, M.A.; Kandil, H.A.; Shaltot, A. Aerodynamic analysis of different wind-turbine-blade profiles using finite-volume method. Energy Convers. Manag. 2012, 2, 541–550. [Google Scholar] [CrossRef]
  41. Beri, H.; Yao, Y. Effect of camber on self starting of vertical axis wind turbine. Environ. Sci. Technol. 2011, 4, 302–312. [Google Scholar] [CrossRef]
  42. Bravo, R.; Tullis, S.; Ziada, S. Performance testing of a small scale vertical-axis wind turbine. In Proceedings of the 21st Canadian Congress of Applied Mechanics, Toronto, Canada, 3–7 June 2007; pp. 1–2.
  43. Hameed, M.S.; Afaq, S.K. Design and analysis of a straight-bladed vertical axis wind turbine blade using analytical and numerical techniques. Ocean Eng. 2013, 57, 248–255. [Google Scholar] [CrossRef]
  44. Ramkissoon, R.; Manohar, K. Increasing the Power Output of the Darrieus Vertical Axis Wind Turbine. Br. J. Appl. Sci. Technol. 2013, 3, 77–79. [Google Scholar] [CrossRef]
  45. Streamlining and Aerodynamics. Available online: http://www.aerospaceweb.org/question/aerodynamics/q0094b.shtml (accessed on 27 September 2016).
  46. ANSYS Fluent User’s Guide Released 14.0 ANSYS Inc. Available online: http://www.ansys.com (accessed on 27 September 2016).
  47. Menter, F.R.; Kuntz, M.; Langtry, R. Ten years of industrial experience with the SST turbulence model. In Proceedings of the Fourth International Conference on Turbulence, Heat and Mass Transfer, Redding, CT, USA, 12–17 October 2003; pp. 625–632.
  48. Fluent. Fluent, 5 User’s Guide 2; Fluent Inc.: Lebanon, PA, USA, 1998; pp. 8–9. [Google Scholar]
  49. Ferrari, L.; Bianchini, A. Critical aspects in the design of a small-size Darrieus wind turbine. In Proceedings of the World Renewable Energy Congress (WREC) XI, Abu Dhabi, UAE, 20–30 September 2010.
  50. Li, Y.; Calisal, S.M. Three-dimensional effects and arm effects on modeling a vertical axis tidal current turbine. Renew. Energy 2010, 35, 2325–2334. [Google Scholar] [CrossRef]
  51. Van Bussel, G.J.W.; Mertens, S.; Polinder, H.; Sidler, H.F.A. TURBY®concept and realisation of a small VAWT for the built environment. In Proceedings of the EAWE/EWEA Special Topic Conference: The Science of making Torque from Wind, Delft, The Netherlands, 19–21 April 2004.
  52. Armstrong, S.; Fiedler, A.; Tullis, S. Flow separation on a high Reynolds number, high solidity vertical axis wind turbine with straight and canted blades and canted blades with fences. Renew. Energy 2012, 41, 13–22. [Google Scholar] [CrossRef]
  53. Lubitz, W.D. Impact of ambient turbulence on performance of a small wind turbine. Renew. Energy 2014, 61, 69–73. [Google Scholar] [CrossRef]
  54. Cochran, B. The Influence of Atmospheric Turbulence on the Kinetic Energy Available during Small Wind Turbine Power Performance Testing; CEDER-CIEMAT: Soria, Spain, 2002. [Google Scholar]
  55. Sanderse, B. Aerodynamics of Wind Turbine Wakes: Literature Review; ECN-e-09-016; Energy Research Center of Netherland (ECN): Petten, The Netherland, 2009. [Google Scholar]
  56. Zanforlin, S.; Letizia, S. Improving the performance of wind turbines in urban environment by integrating the action of a diffuser with the aerodynamics of the rooftops. In Proceedings of the ATI 2015—70th Conference of the ATI Engineering Association, Roma, Italy, 9–11 September 2015; pp. 774–781.
  57. Ferreira, C.; Dixon, K.; Hofemann, C.; Kuik, G.V.; Gerard, V.B. The VAWT in Skew: Stereo-PIV and Vortex Modeling. In Proceedings of the 47th AIAA Aerospace Sciences Meeting Including the New Horizons Forum and Aerospace Exposition 2009, Orlando, FL, USA, 5–8 January 2009.
Figure 1. Wind profile in the internal boundary layer in a built environment [6].
Applsci 07 00251 g001
Figure 2. Two distinct types of VAWT operating under any horizontal wind direction [24]. (a) Darrieus rotors; (b) Savonius rotor.
Applsci 07 00251 g002
Figure 3. General arrangement of the CAWT.
Applsci 07 00251 g003
Figure 4. Lab scale model of: (a) CAWT; and (b) VAWT.
Applsci 07 00251 g004
Figure 5. Top view of the CAWT showing the 60° offset angle of the upper and lower horizontal blades.
Applsci 07 00251 g005
Figure 6. CAWT operating under horizontal and vertical wind directions.
Applsci 07 00251 g006
Figure 7. (a) Artist’s impression of a building integrated CAWT; and (b) CAD design of the CAWT.
Applsci 07 00251 g007
Figure 8. (a) Velocity streamline for gable rooftop; and (b) 2 D mesh for the building model.
Applsci 07 00251 g008
Figure 9. (a) Experimental set-up of the CAWT; and (b) detailed dimensions of a building integrated with a CAWT and dimensions of the ventilation fans (all dimensions in mm).
Applsci 07 00251 g009
Figure 10. Dynamometer Controller.
Applsci 07 00251 g010
Figure 11. Coefficient of power against tip speed ratio for different pitch angle.
Applsci 07 00251 g011
Figure 12. Coefficient of power against tip speed ratio for CAWT and straight-bladed VAWT for height above the rooftop: (a) Y = 100 mm; (b) Y = 150 mm; (c) Y = 200 mm; and (d) Y = 250 mm.
Applsci 07 00251 g012
Figure 13. Rotational speed against time for building integrated CAWT and VAWT for height: (a) Y = 100 mm; (b) Y = 150 mm; (c) Y = 200 mm; and (d) Y = 250 mm.
Applsci 07 00251 g013
Figure 14. Coefficient of power of CAWT at various heights above the rooftop.
Applsci 07 00251 g014
Figure 15. Rotational speed against time for CAWT at various heights above the rooftop.
Applsci 07 00251 g015
Figure 16. Skewed angle for CAWT for Y = 100 mm, 150 mm, 200 mm, and 250 mm.
Applsci 07 00251 g016
Table 1. Materials selection for the CAWT and VAWT.
ComponentCAWTVAWT
Vertical bladeCarbon fiberCarbon fiber
Horizontal bladeCarbon fiberN/A
Connectors3D printing—Acrylonitrile Butadiene Styrene (ABS)N/A
Generator10 W10 W
ShaftMild steelMild steel
Hubs3D printing (ABS)N/A
Supporting strutAirfoil (Horizontal blades)Flat plate
Table 2. Summary of design parameters of the lab scale CAWT and straight-bladed VAWT.
ParametersCAWTVAWT
Diameter of rotor, d (mm)350350
Height of vertical blade, h (mm)300300
Chord length of vertical blade, c (mm)5050
Length of horizontal blade, l (mm) of CAWT150N/A
Connecting strut of VAWT (mm)N/A150 (flat plate: W = 25 mm, thickness = 2.03 mm)
Chord length of horizontal blade, c (mm)34N/A
Profile of aerofoilNational Advisory Committee for Aeronautics (NACA) 0015NACA 0015
Profile of the horizontal bladesNACA 0015N/A
Pitch angle of the horizontal blade,   β h 10°N/A
Pitch angle of the vertical blade, β v
Table 3. Summary of the experimental results for the CAWT and the VAWT.
Height (mm)ParameterCAWTStraight-Bladed VAWTPercentage of Improvement (%)
Y = 100RPM554179209
Cp,max0.12630.0345266
TSR for Cp,max1.10.5986
Y = 150RPM512189171
Cp,max0.10350.0350196
TSR for Cp,max1.160.6093
Y = 200RPM474212123
Cp,max0.08590.0364136
TSR for Cp,max1.080.51112
Y = 250RPM44923393
Cp,max0.07650.044871
TSR for Cp,max1.120.6670
Table 4. Summary of experimental results on variation of height.
ParameterHeight (mm)
100150200250
RPM554512474449
CP,max0.12630.10350.08590.0765
TSR for Cp,max1.11.161.081.12

