Article

In Situ Measurement of Alkali Metals in an MSW Incinerator Using a Spontaneous Emission Spectrum

1
School of Electrical and Power Engineering, China University of Mining and Technology, No. 1, Daxue Road, Xuzhou 221116, Jiangsu, China
2
State Key Laboratory of Coal Combustion, Huazhong University of Science and Technology, No. 1037, Luoyu Road, Wuhan 430074, Hubei, China
3
National Engineering Research Center of Clean Coal Combustion, Xi’an Thermal Power Research Institute Co., Ltd, No. 136, Xingqing Road, Xi’an 710032, Shanxi, China
*
Authors to whom correspondence should be addressed.
Appl. Sci. 2017, 7(3), 263; https://doi.org/10.3390/app7030263
Submission received: 24 December 2016 / Revised: 28 February 2017 / Accepted: 6 March 2017 / Published: 9 March 2017
(This article belongs to the Special Issue Optics and Spectroscopy for Fluid Characterization)

Abstract

:
This paper presents experimental investigations of the in situ diagnosis of the alkali metals in the municipal solid waste (MSW) flame of an industrial grade incinerator using flame emission spectroscopy. The spectral radiation intensities of the MSW flame were obtained using a spectrometer. A linear polynomial fitting method is proposed to uncouple the continuous spectrum and the characteristic line. Based on spectra processing and a non-gray emissivity model, the flame temperature, emissivity, and intensities of the emission of alkali metals were calculated by means of measuring the spectral radiation intensities of the MSW flame. Experimental results indicate that the MSW flame contains alkali metals, including Na, K, and even Rb, and it demonstrates non-gray characteristics in a wavelength range from 500 nm to 900 nm. Peak intensities of the emission of the alkali metals were found to increase when the primary air was high, and the measured temperature varied in the same way as the primary air. The temperature and peak intensities of the lines of emission of the alkali metals may be used to adjust the primary airflow and to manage the feeding of the MSW to control the alkali metals in the MSW flame. It was found that the peak intensity of the K emission line had a linear relationship with the peak intensity of the Na emission line; this correlation may be attributed to their similar physicochemical characteristics in the MSW. The variation trend of the emissivity of the MSW flame and the oxygen content in the flue gas were almost opposite because the increased oxygen content suppressed soot formation and decreased soot emissivity. These results prove that the flame emission spectroscopy technique is feasible for monitoring combustion in the MSW incinerator in situ.

1. Introduction

The rapid development of modern society has resulted in the production of an increasing volume of MSW. The disposal, treatment and management of MSW are common problems in the world. Incineration has been widely used for the disposal of MSW in order to conserve fuel and protect the environment by lessening the amount of MSW in landfills [1,2]. However, emissions of trace organic compounds—particularly polychlorinated dioxins and furans, and heavy metals such as mercury, lead and cadmium—are major environmental hazards caused by MSW incineration. Alkali and alkaline earth metals are typically found in high concentrations in MSW. These alkali metal compounds often contribute to the fouling and corrosion of the heating surfaces of fluidized bed and grate incinerators. To understand the transfer of heavy metals and alkali and alkaline earth metals, and to control the emission of these metals in MSW incineration, certain methods for measuring the metal species in flue gasses have been applied—including absorption, emission, plasma spectroscopy, and ionization/mass spectrometric methods [3,4]. In addition, other analysis techniques, such as X-ray fluorescence (XRF), energy dispersive X-ray spectroscopy (EDX), scanning electron microscope combined energy dispersive spectrometer (SEM-EDS) and X-ray diffraction (XRD), have been used to provide supporting/complementary data about the metal species in fuel and ash [5]. However, few in situ measuring systems focus on combustion or flame inside the incinerator. Only two of the studies we reviewed [6,7] used infrared thermographic cameras to replace thermocouples and to obtain a temperature map inside the combustion chambers of incineration plants. These studies demonstrated that in situ monitoring combustion can be helpful, particularly for control and optimization purposes. Some research has reviewed diagnostic techniques for monitoring and controlling flames [8,9]. Optical methods based on laser diagnostic techniques have been applied for measuring velocity, temperature, species, and particulate in flames. However, using these latter methods presents some challenges in practical industrial furnaces and incinerators, because of the limited optical access, the laser attenuation by the particulate medium and other factors. Flame emission spectroscopy (FES) is another alternative non-intrusive approach for diagnosing flames. The spontaneous emission spectra of flames contain continuous spectra from the blackbody radiation of solid particles (e.g., soot, char, or ash particles); from the band spectra produced by the radiation of gas molecules (e.g., CO2 or H2O); from the chemiluminescence of excited radicals (e.g., OH, CH, or C2); and from the line spectra of free atoms (e.g., alkalis or alkaline earth metals) [10]. Based on the measurement and analysis of the spontaneous emission spectra of flames, FES has been proposed to determine equivalence ratios [9], to monitor flame stoichiometry [9,11] and to calculate flame temperatures in a natural gas-fired furnace [12], a pulverized coal-fired furnace [13,14], a gasification facility [15], an aluminum flame [16], and even an MSW incinerator [17]. For the flame of the MSW incinerator, strong characteristic emission lines of Na and K are observed in the visible spectra in the experiments, and more studies are needed to know if this type spectrum could be used for measurement temperature, while related works are relatively few in number.
In this paper, experimental investigations involving in situ measuring and analyzing spontaneous emission spectra of MSW flames in a grate incinerator using FES are presented. First, the experimental setup, including the grate incinerator and a spectrometer system, will be introduced, and then the measurement principle will be described. Then, the results of temperature, emissivity and intensities of the emissions lines of the alkali metals derived from MSW flame spectra in the incinerator will be given. The effects of operating parameters of the incinerator, such as the primary air on the measurement results, will be analyzed. Finally, some concluding remarks will be made.

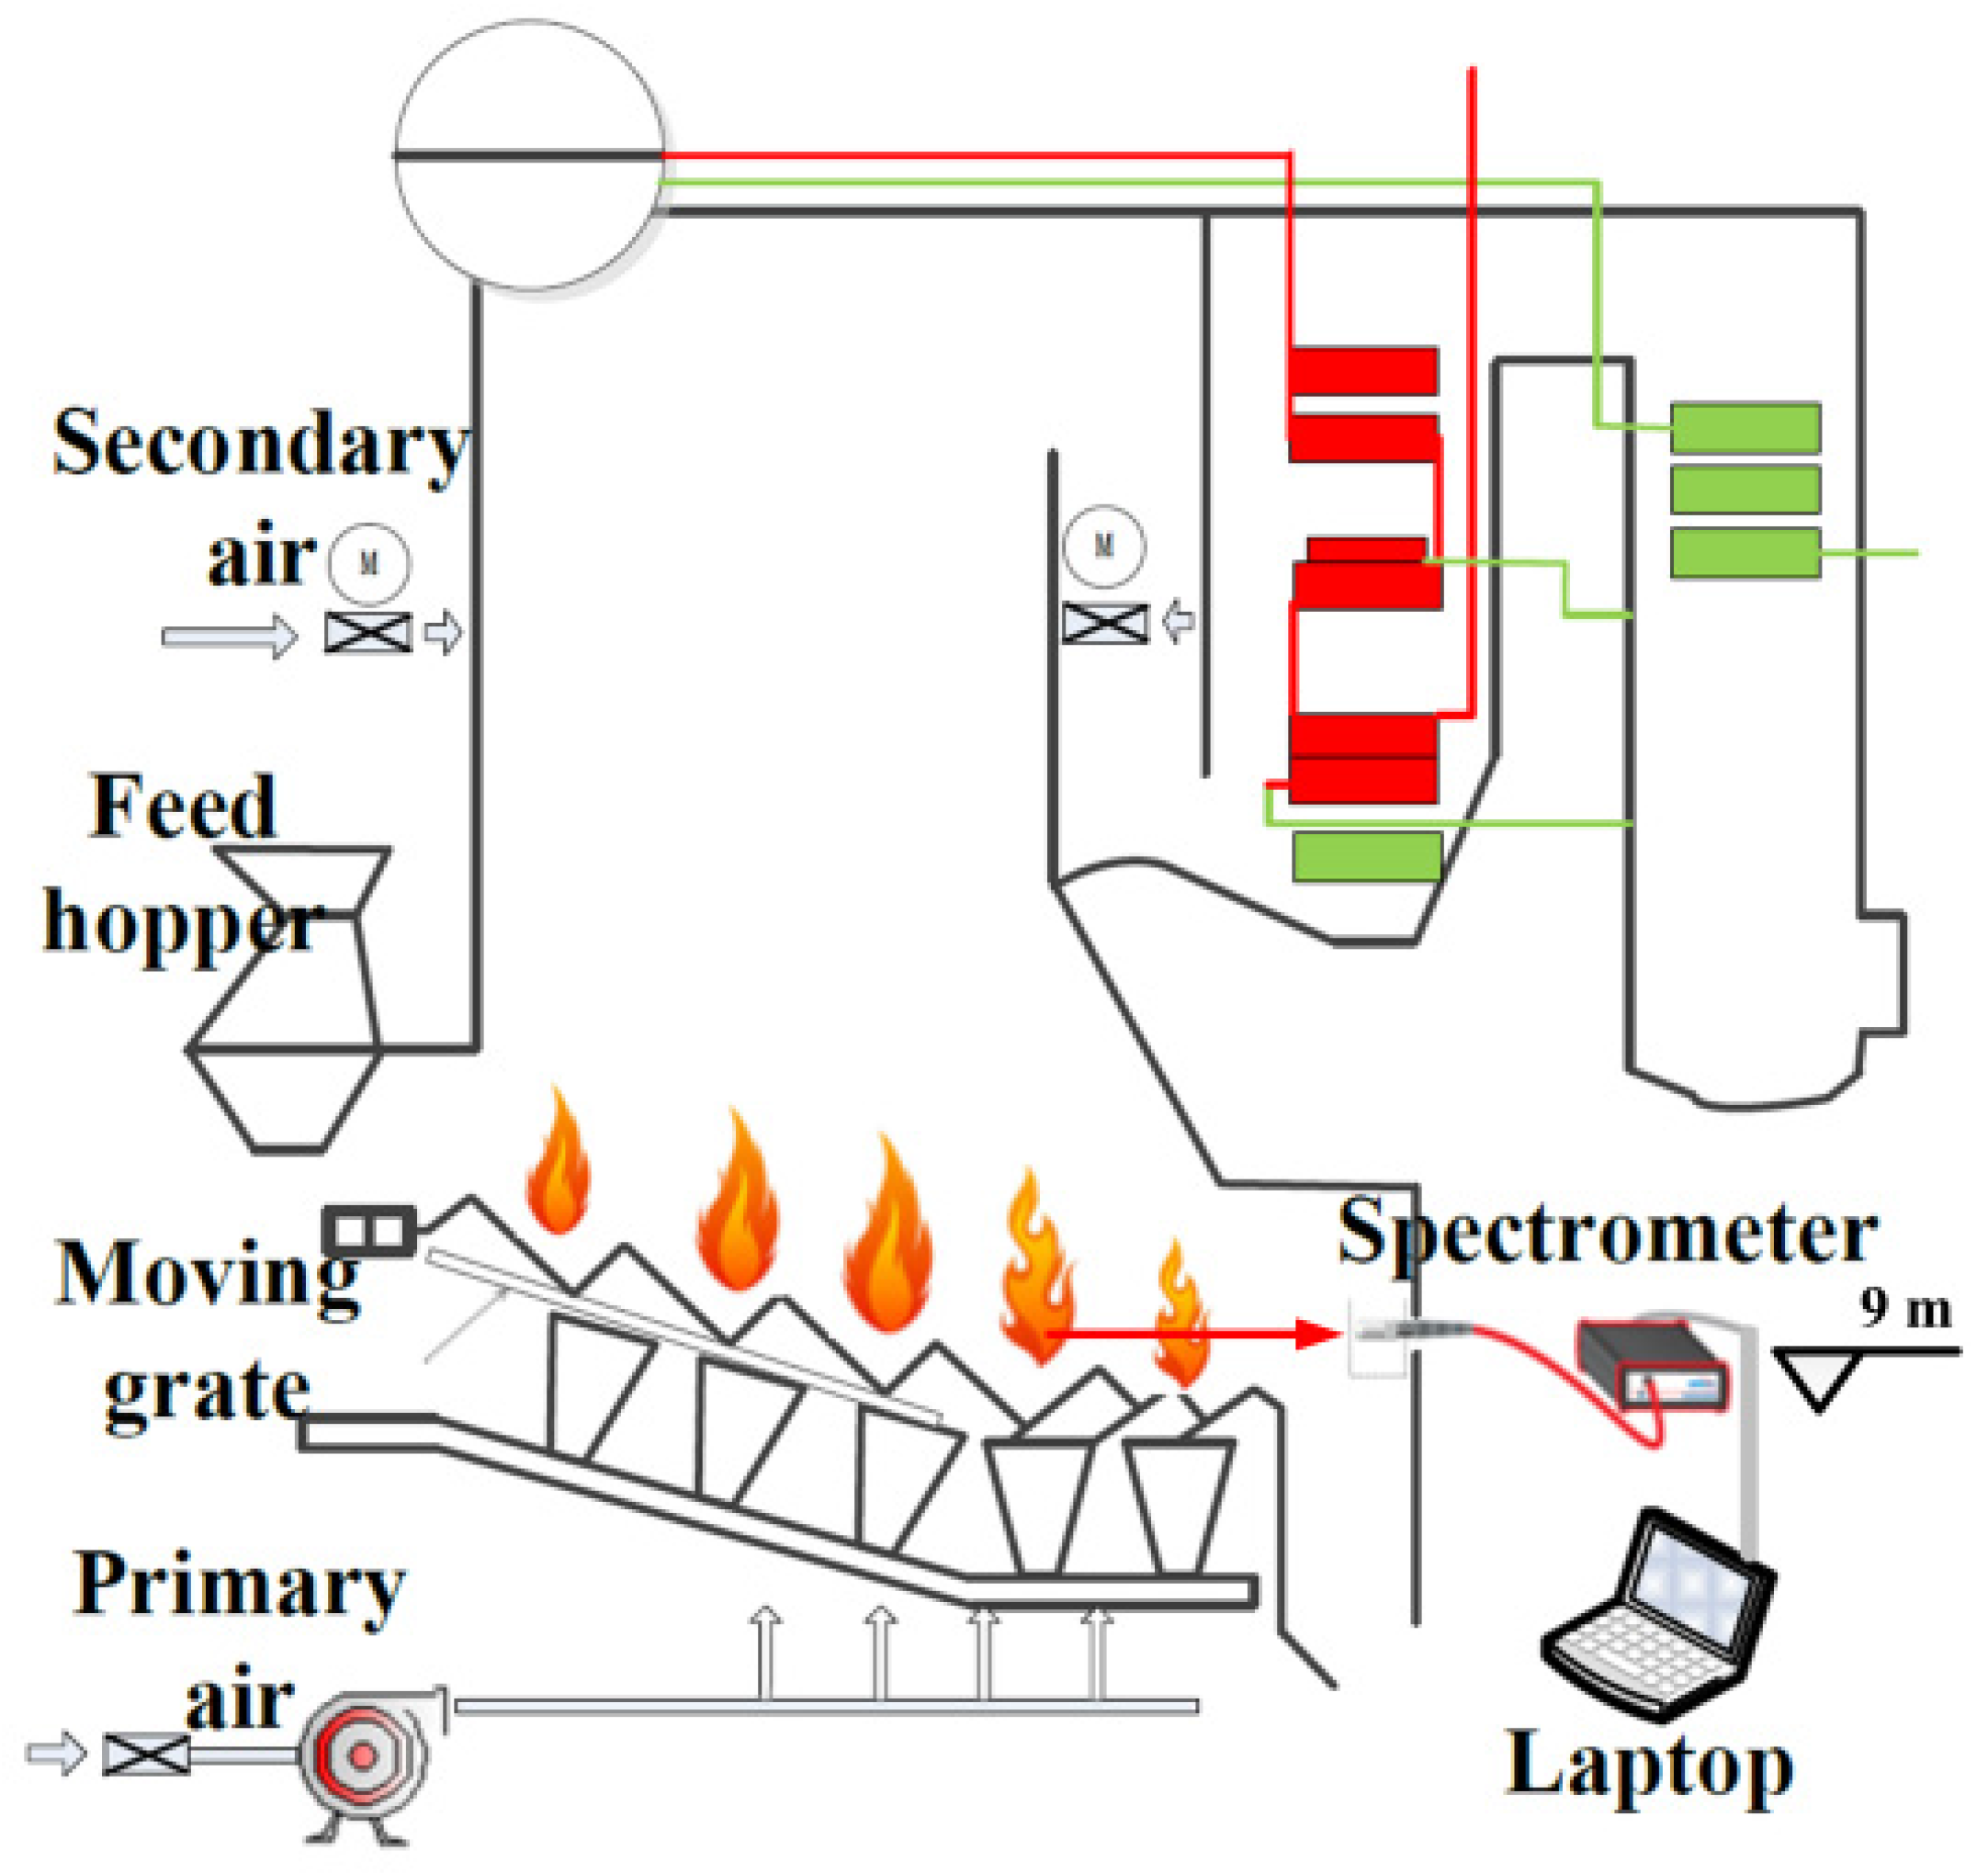
2. Experimental Setup

Due to the high moisture and low heat value characteristics of Chinese MSW, the preferred furnace type for MSW incineration is a mechanical grate incinerator; the reciprocating grate incinerator is a particularly common choice, because it can decrease the pollutant emissions by means of a forward and backward pushing two-stage grate. Therefore, our experiment was conducted in a two-stage reciprocating grate incinerator of the GCL Renewable Energy Power Generation Co., Ltd., which is located in Xuzhou, China. The incinerator can dispose of MSW at a rate of 400 tons per day. The rated evaporative capacity of the incinerator is 35 ton/h. The MSW studied was a mixture of household trash (70%), street waste (20%), and office waste (10%). During the experiment, the MSW was sampled and analyzed three times. Table 1 lists the proximate and ultimate analysis of the MSW used in the experiment. The composition of the incinerated MSW incineration changed only slightly.
As shown in Figure 1, the L-shaped furnace was adapted by the two-stage reciprocating grate waste incinerator to prolong the time that the flue gas would reside in the furnace and to prevent a flue gas blockade. The total length and width of the grate were 9.7 m and 7.07 m, respectively. The furnace outlet was located above the grate center, and the waste underwent drying, pyrolysis, and combustion progressively along the grate after entering the incinerator. To achieve the staged combustion process, the total air supply was divided into primary and secondary air. The primary air used for assisting combustion was heated to 230 °C in two stages of preheating by steam and flue gas, respectively. The residence time of the flue gas in the furnace was > 2 s at a temperatures > 850 °C after the secondary air supply was provided.
As shown in Figure 1, a spectrometer system, consisting of a portable spectrometer (AvaSpec-USB2048, Avantes, Apeldoorn, The Netherlands) with 2048 pixels, a fiber with a collimating lens, and a laptop was placed at the rear section of the combustion chamber. The measurement wavelength range of the spectrometer was 200 nm to 1100 nm, and the spectral resolution was 0.8 nm. In the process of spectral analysis, a smoothing function was introduced to decrease noise, each pixel will be averaged with three left and three right neighboring pixels, in this case, and the resolution of spectrum data is about 1.71 nm. The spectra of the MSW flames were collected by the fiber and then converted into digital signals by the spectrometer; finally, they were sent to the laptop via a USB cable. Dedicated application software developed by the authors of this study was used to obtain and process the MSW flame emission spectra in situ.

3. Measurement Principle

The spectra of the spontaneous emissions of flames with a certain wavelength range can be obtained by an emission spectrometer. Generally, the raw output of the spectrometer will be in photon counts S ( λ ) of the radiation as a function of the wavelength λ ; these counts represent the relative spectral profile of the flame. To quantitatively analyze the spectra of the flame’s spontaneous emission, it is necessary to calibrate the profile of the spectral radiation intensities I ( λ ) along the wavelength. As described in [14,15,17], a blackbody furnace was used to obtain the calibration coefficients k ( λ ) = I b ( λ ) / S b ( λ ) . Figure 2 shows the profiles of k ( λ ) within the wavelength range from 500 nm to 900 nm at four temperatures: 1273, 1373, 1473, and 1573 K. It can be seen that profiles of the calibration coefficients at different blackbody temperatures were consistent with each other; thus, it can be concluded that the calibration coefficients remained independent of temperature. The flame’s spectral radiation intensities can be obtained by I ( λ ) = S ( λ ) k ( λ ) .
Three cases of relative spectral profiles and their corresponding spectral radiation intensities of the MSW flame are shown in Figure 3. As shown in Figure 3b, the flame’s spectral radiation intensities I e were equal to the sum of the continuous spectral radiation intensities I c produced by particulates in the flame plus the discontinuous spectral intensities I d , such as the intensities of the emission lines of the alkali metals:
I e = I c + I d
where every term is wavelength dependent.
Some algorithms have been proposed to automatically separate the continuous and discontinuous spectral information from the measured flame emission spectra [18]. In this paper, continuous spectral radiation intensities in a wavelength range from 500 nm to 900 nm were extracted from the measured spectral radiation intensities of the MSW flame, and they were then fitted by a fourth-order polynomial. Figure 4 shows a comparison of the original continuous spectral radiation intensities (dotted line) extracted from Figure 3b and the corresponding fitting curves (solid line). In order to evaluate the fitting performance, the goodness-of-fit coefficient (GFC) [18] quality metrics between the fitting I c and the original I c spectral radiation intensities in the absence of discontinuous emission lines were calculated as:
G F C = | j I c ( λ j ) I c ( λ j ) | j [ [ I c ( λ j ) ] 2 ] 1 / 2 j [ [ I c ( λ j ) ] 2 ] 1 / 2
Generally, an accurate fitting yields a GFC higher than 0.99. The results of the GFC for the three cases in Figure 4 were 0.9933, 0.9973, and 0.9988, respectively.
The continuous spectral radiation intensities from the MSW flame may be described by the approximate form of Planck’s radiation law for a heat radiation source at temperature T :
I c ( λ i , T ) = ε ( λ i ) C 1 λ i 5 exp ( C 2 / ( λ i T ) ) / π
where I c ( λ i , T ) is the radiation intensity at wavelength λ i   ( i = 1 , 2 , , m ) . For the type of spectrometer used in this article, m = 703 , T is the flame temperature, ε ( λ i ) is the emissivity at wavelength λ i , and C1 and C2 are the first and second Plank’s constants. For the MSW incineration, the pyrolysis of the MSW generated volatile matter, which was burned in the incinerator, producing more soot particles in the MSW flame. The soot emissivity is spectrally dependent; Hottel and Broughton [19,20] developed an empirical emissivity model for soot particles that has been widely used:
ε ( K L , λ i ) = 1 e K L / λ i α
where ε ( K L , λ i ) is the spectral emissivity, K L is the optical thickness of the flame, and α is an empirical parameter depending upon the given wavelength, given by Hottel and Broughton as 1.39 in the visible spectral region. When substituted into Equation (3), this model allows one to calculate the temperature T and K L [19,20,21] numerically by using the least squares method. The calculated value of K L , which is independent of wavelength, can then be used with Equation (4) to determine the spectrally-dependent ε ( λ i ) .
After T and ε ( λ i ) were obtained, the continuous spectral radiation intensities I c were calculated using Equation (3). Then, the intensities of the emission lines of the alkali metals were calculated by I d = I e I c , which was used to analyze the variation of the peak intensities of the alkali metals’ lines in the MSW flame.

4. Results and Analysis

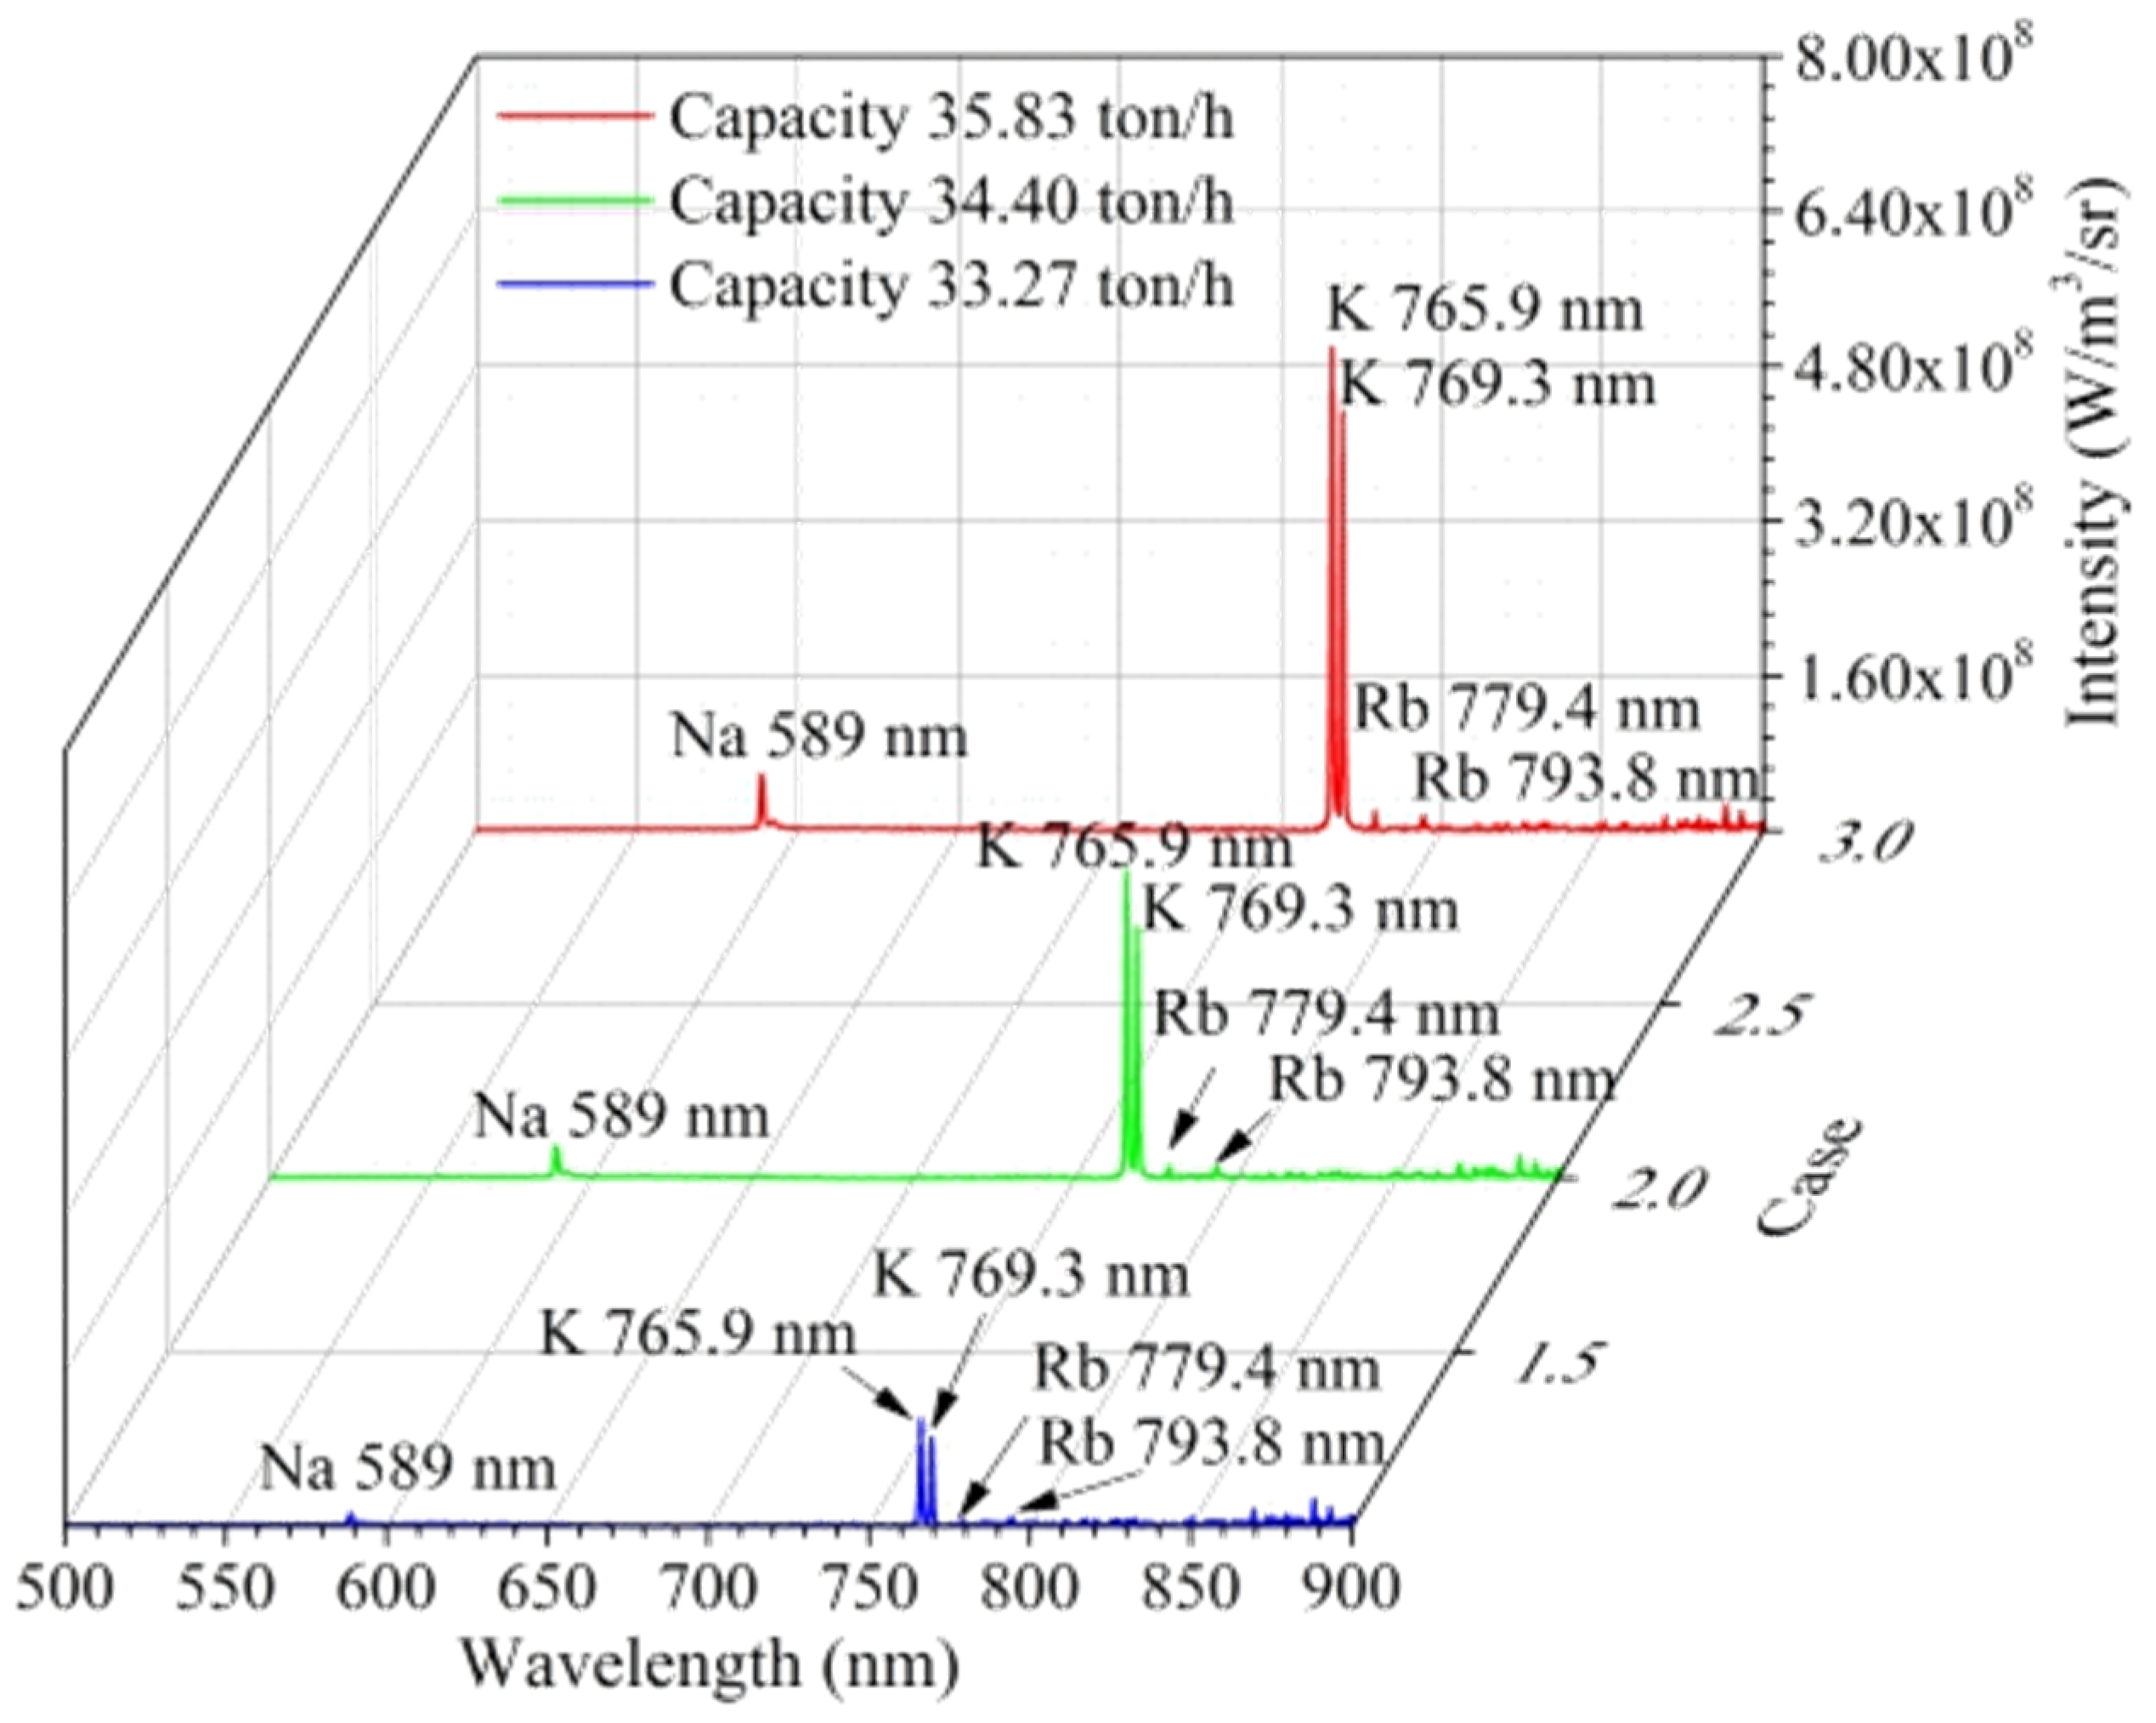
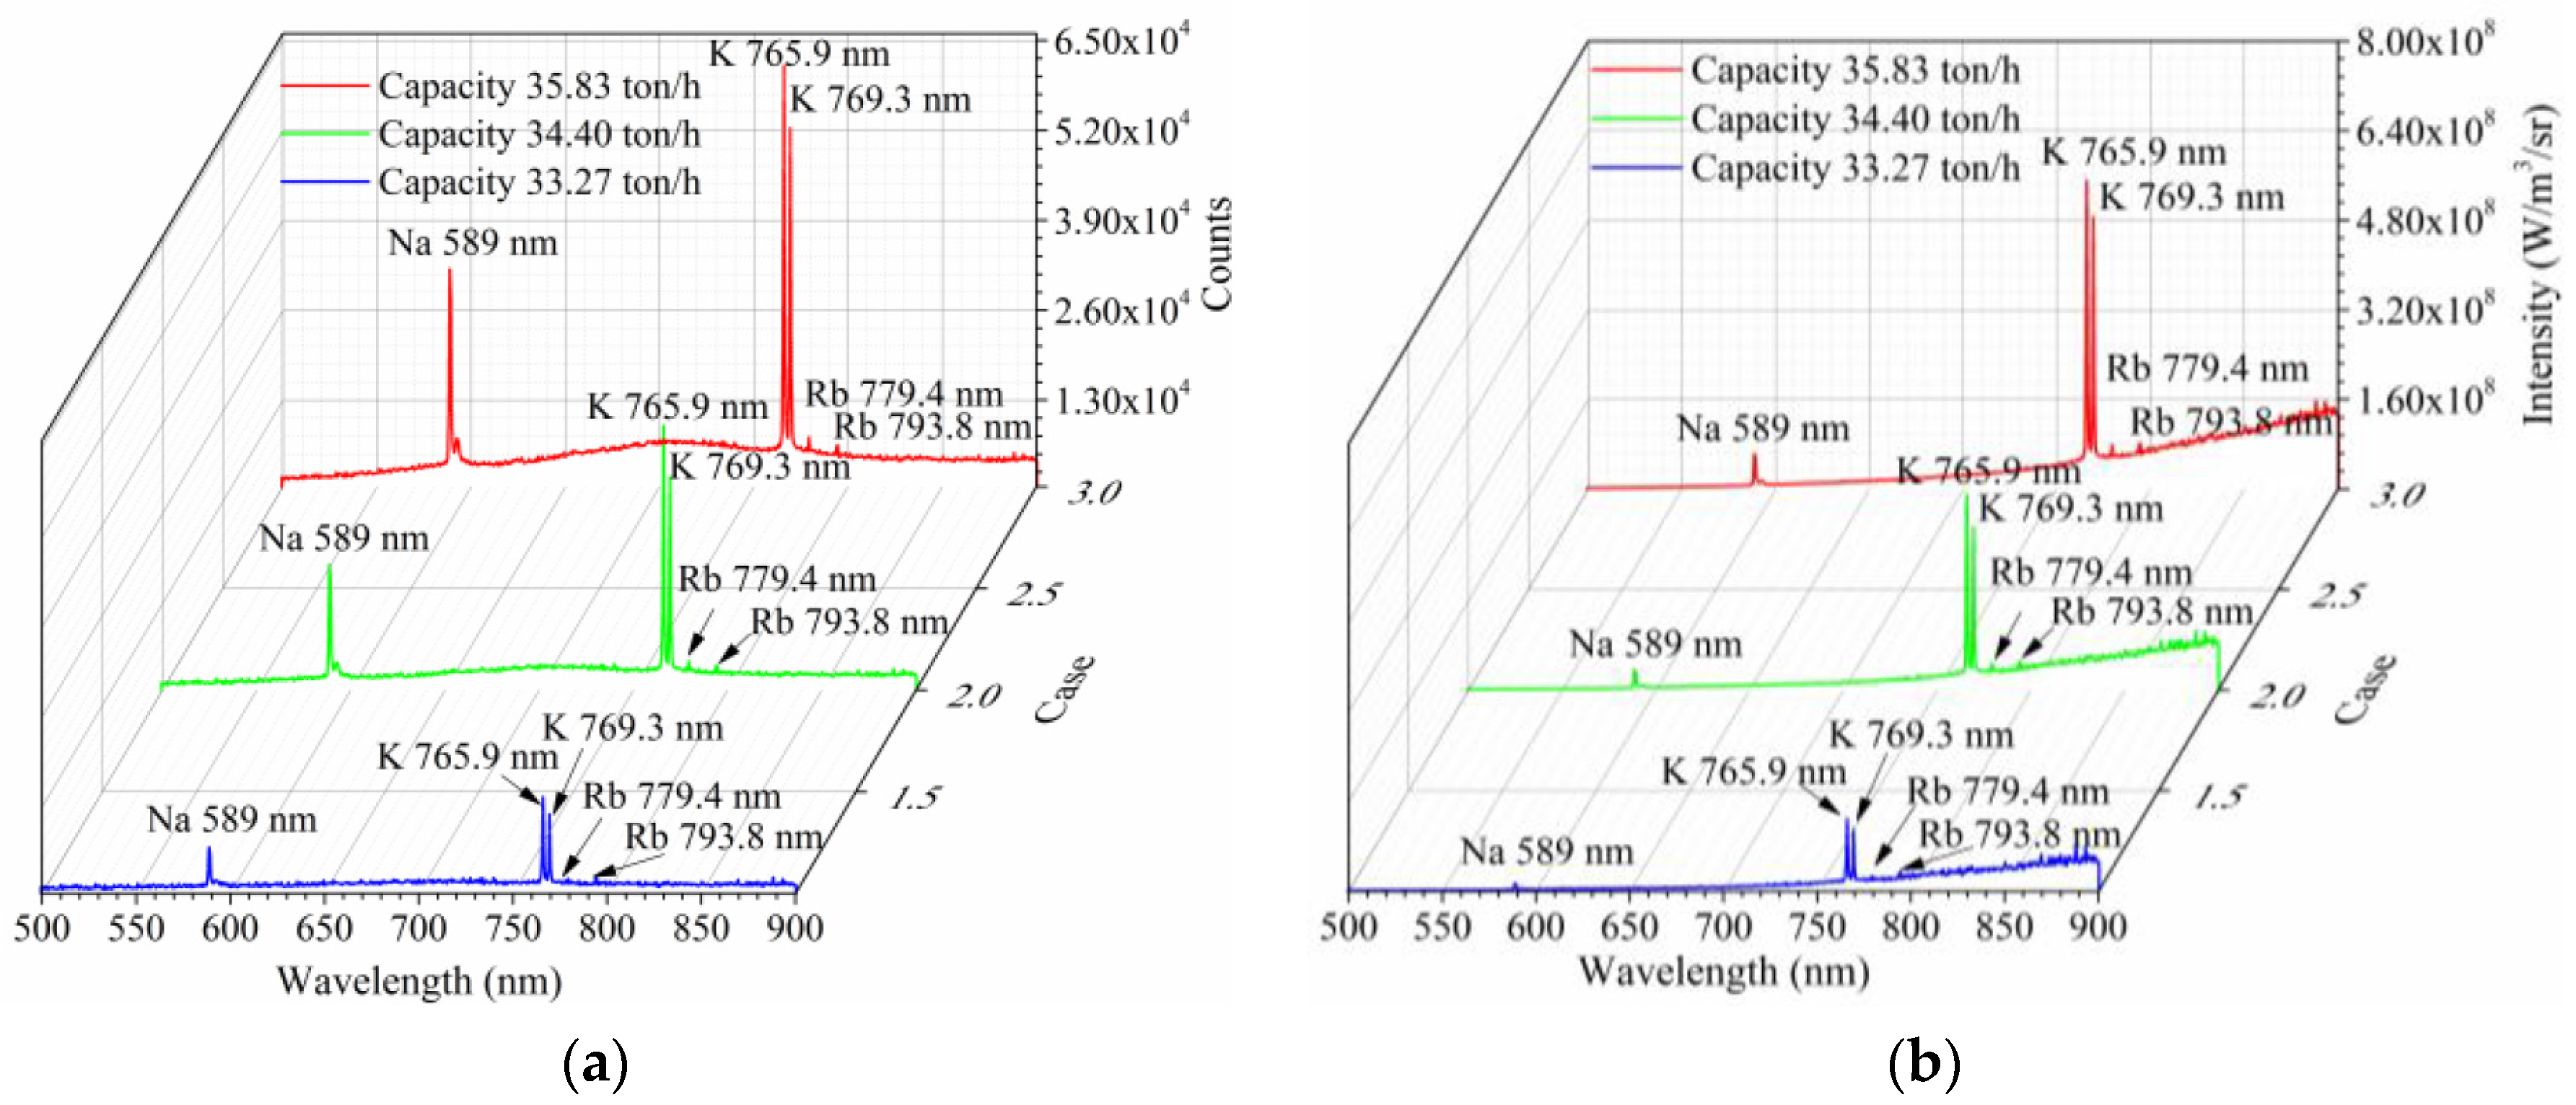
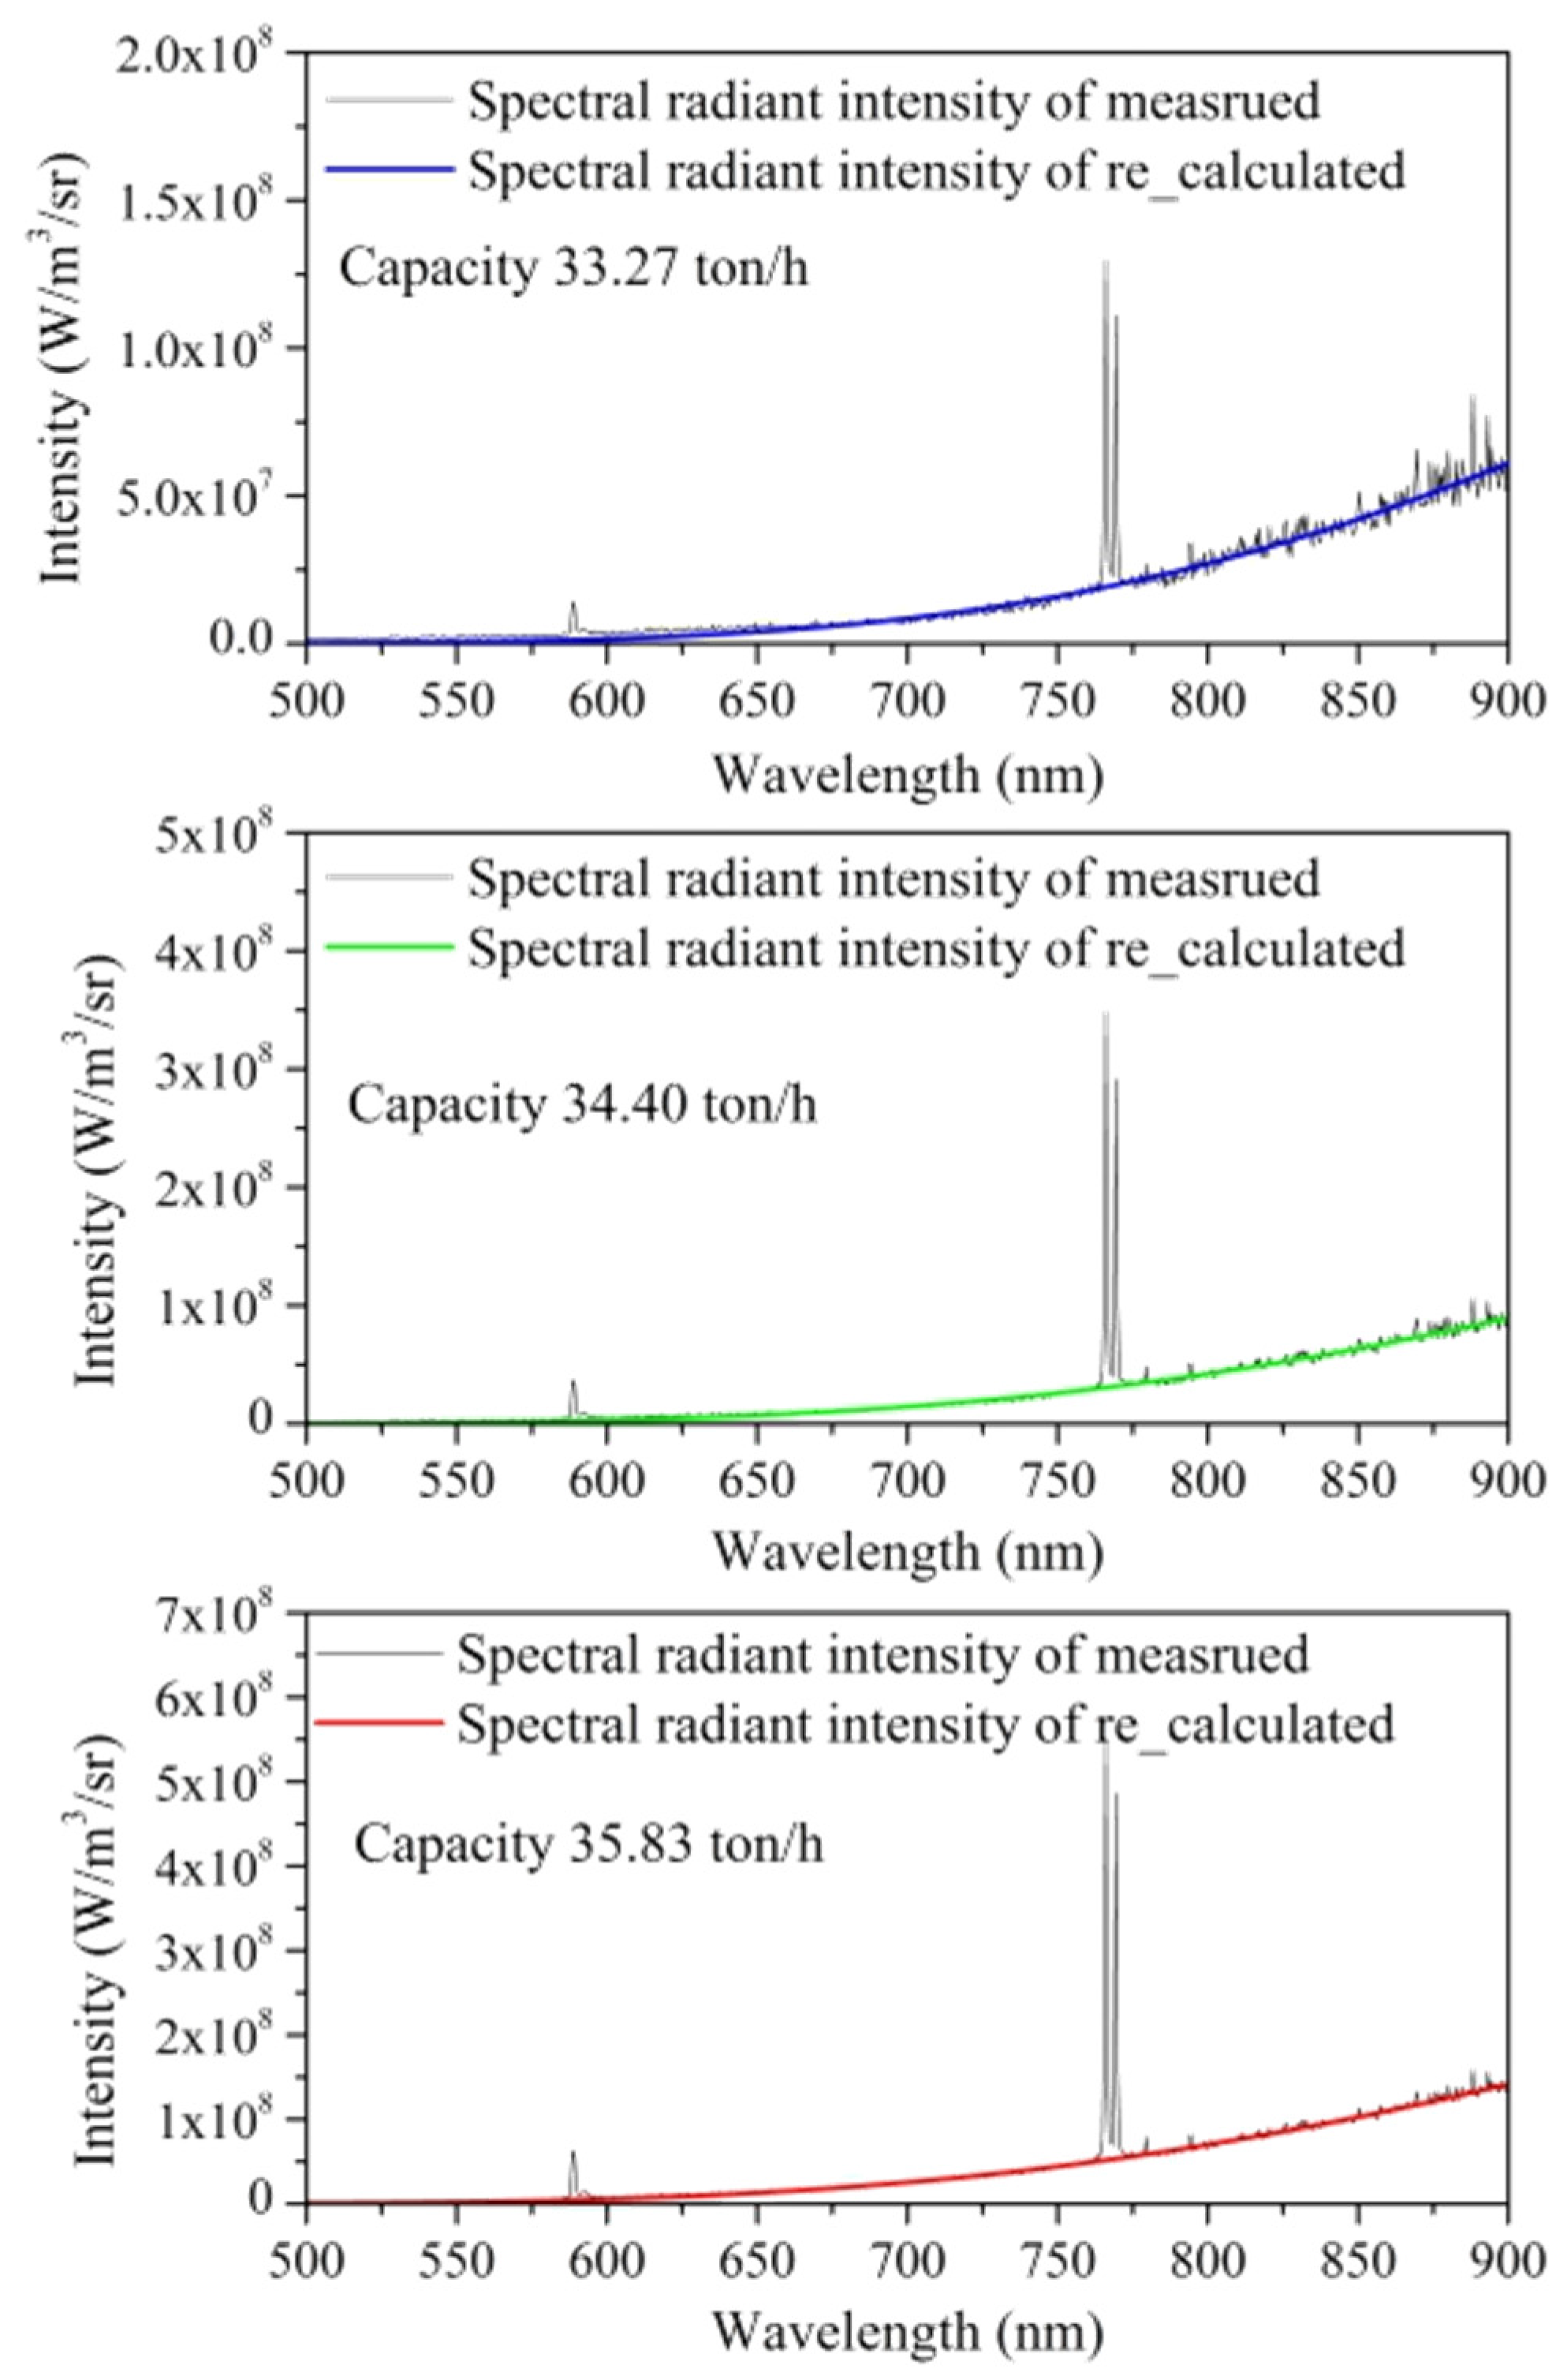
4.1. MSW Flame Spectra

Figure 3 shows three examples of the spontaneous emission spectra of the MSW flame in the incinerator from 500 nm to 900 nm. As shown in Figure 3a, some emission peaks or lines at wavelengths of 589, 765.9, 769.3, 779.4, and 793.8 nm were observed. According to the National Institute of Standards and Technology (NIST)’s Atomic Spectra Database, these emission peaks represent the atomic emission lines of Na (588.995 nm, 589.592 nm), K (766.490 nm, 769.896 nm), and Rb (780.027 nm, 794.760 nm), respectively. Since the spectral resolution of this spectrometer was low, only 0.8 nm, the two emission lines of Na at approximately 589 nm were not distinguished. Generally, vegetable and garden wastes form a significant part of household trash, so the composition of the MSW contains Na and K. However, the presence of Rb in the MSW is seldom reported in the literature. It may come from small electronic components in the MSW. As the absolute spectral intensity distribution of the MSW flames depicted in Figure 3b shows, it can be seen that the peak intensities of the Rb emission lines are too weak to be identified. Continuous emission is mainly due to thermal radiation from soot particles in the MSW flame.

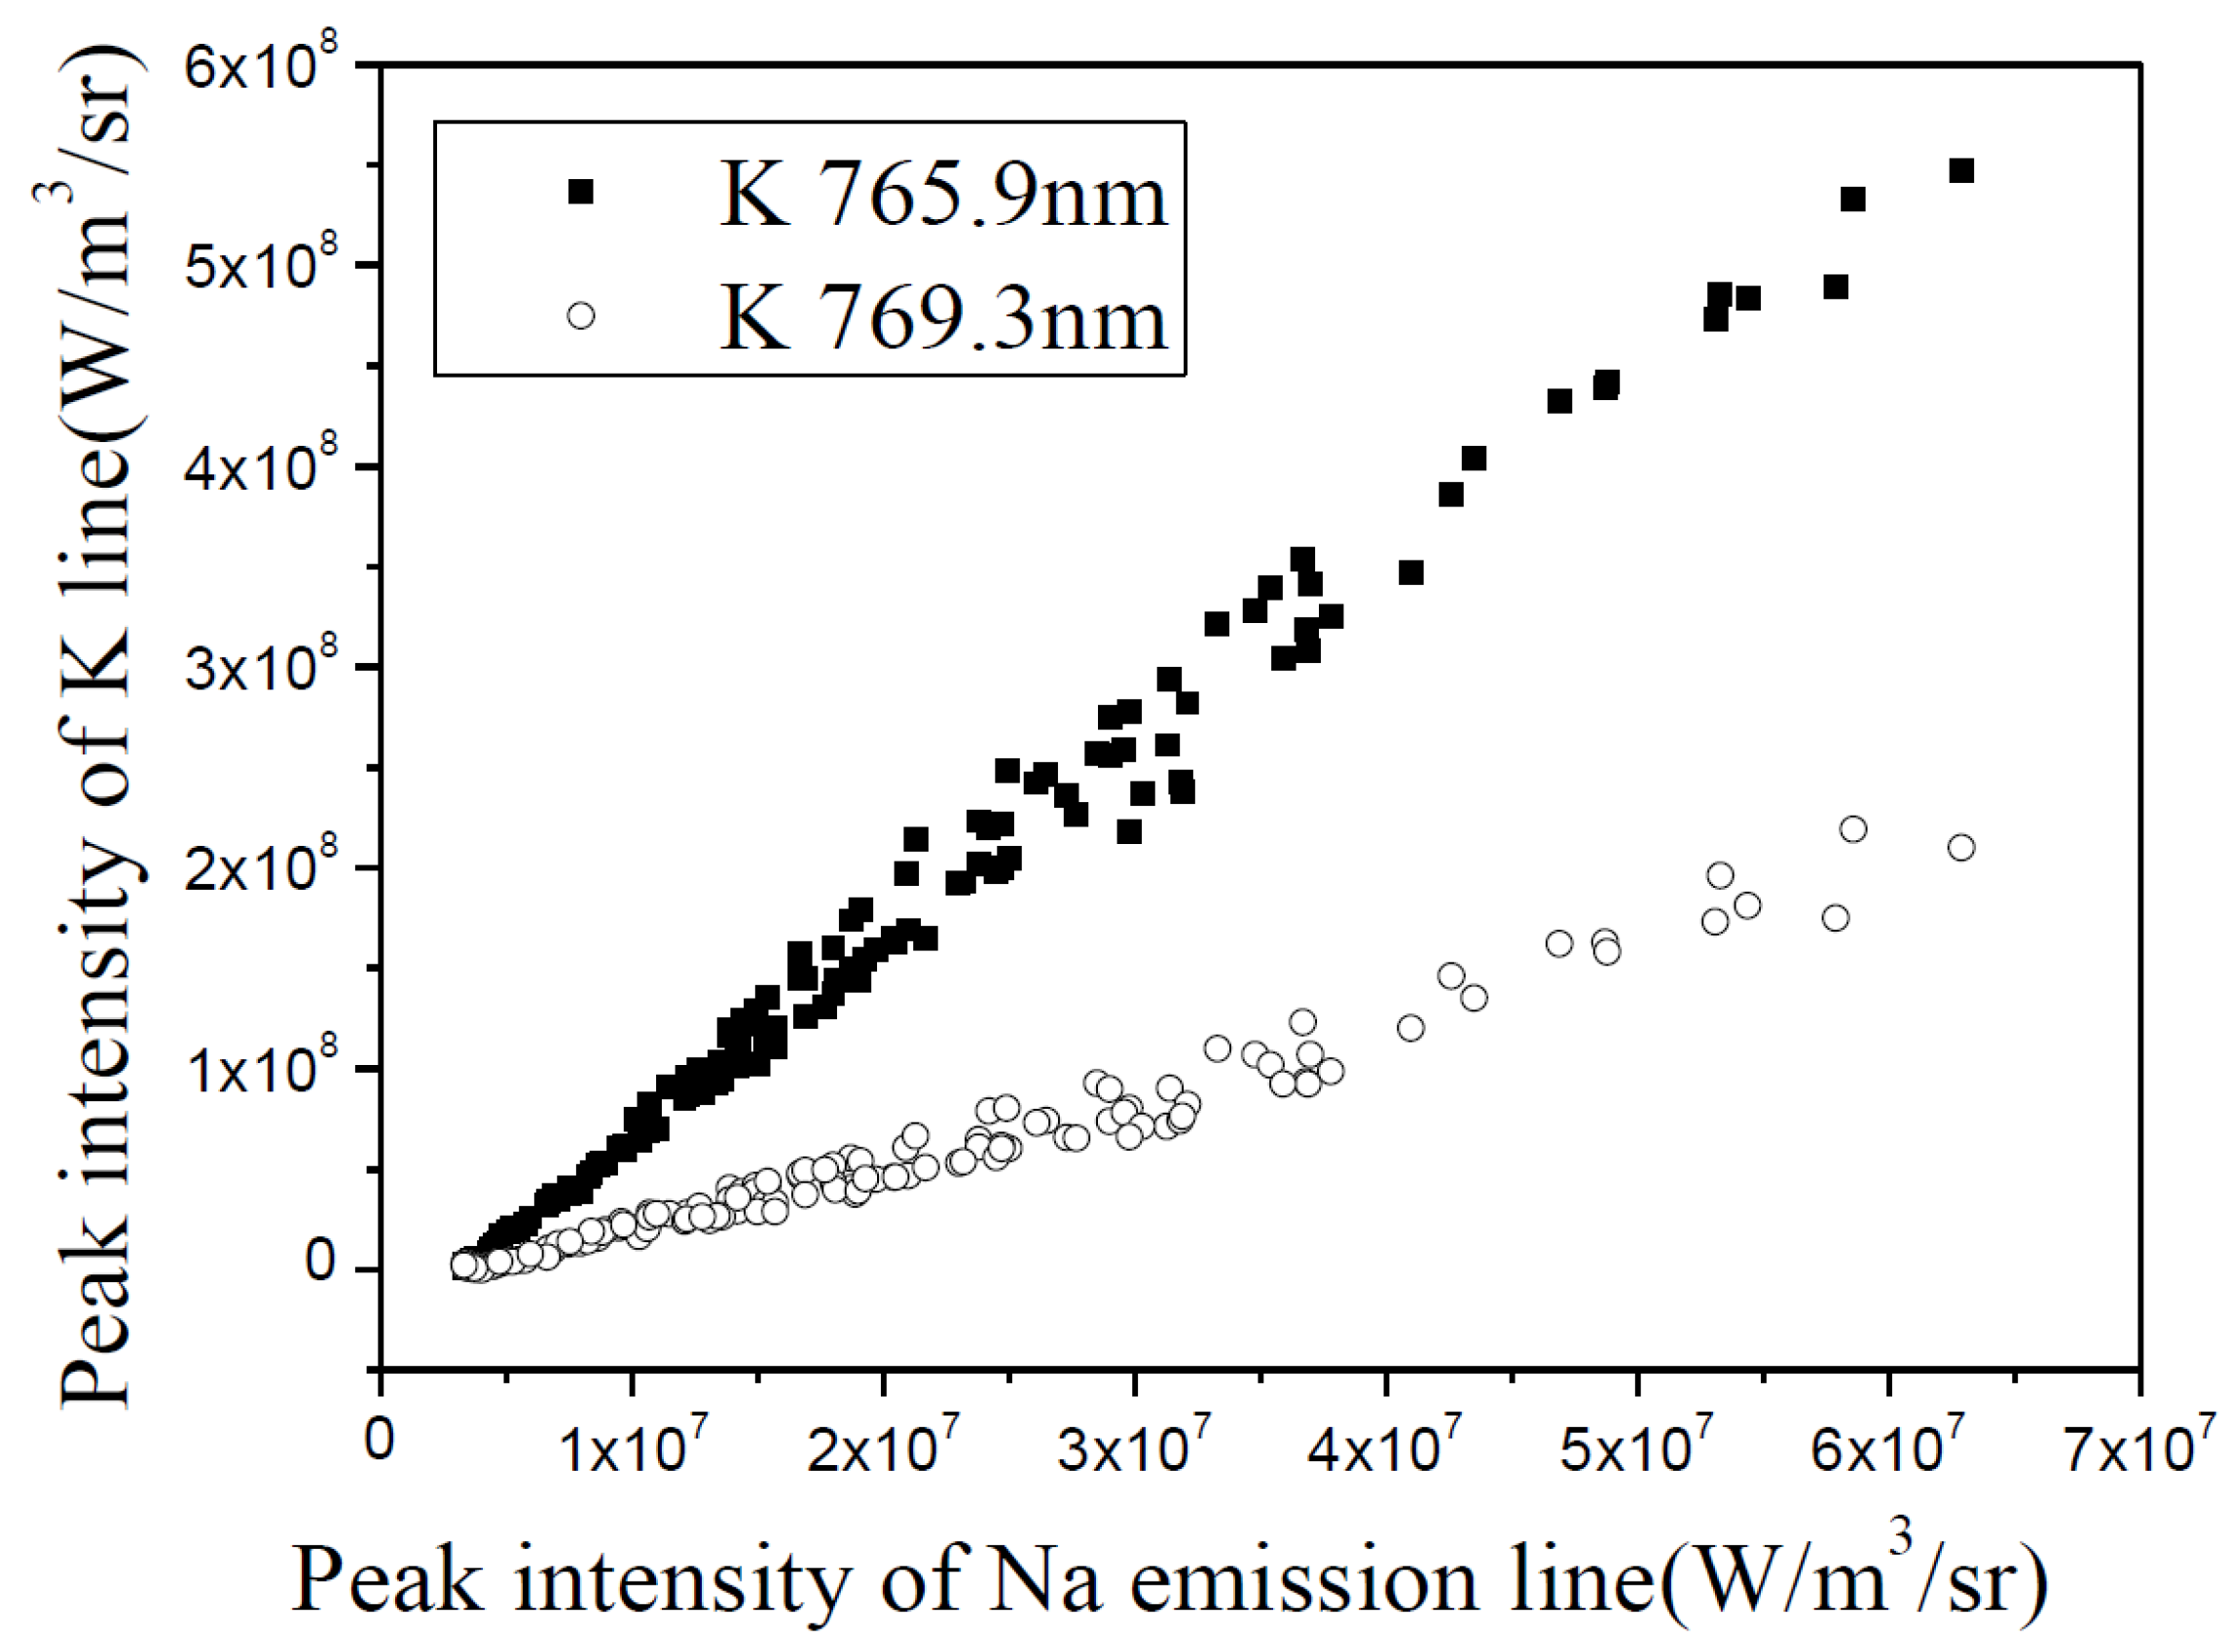
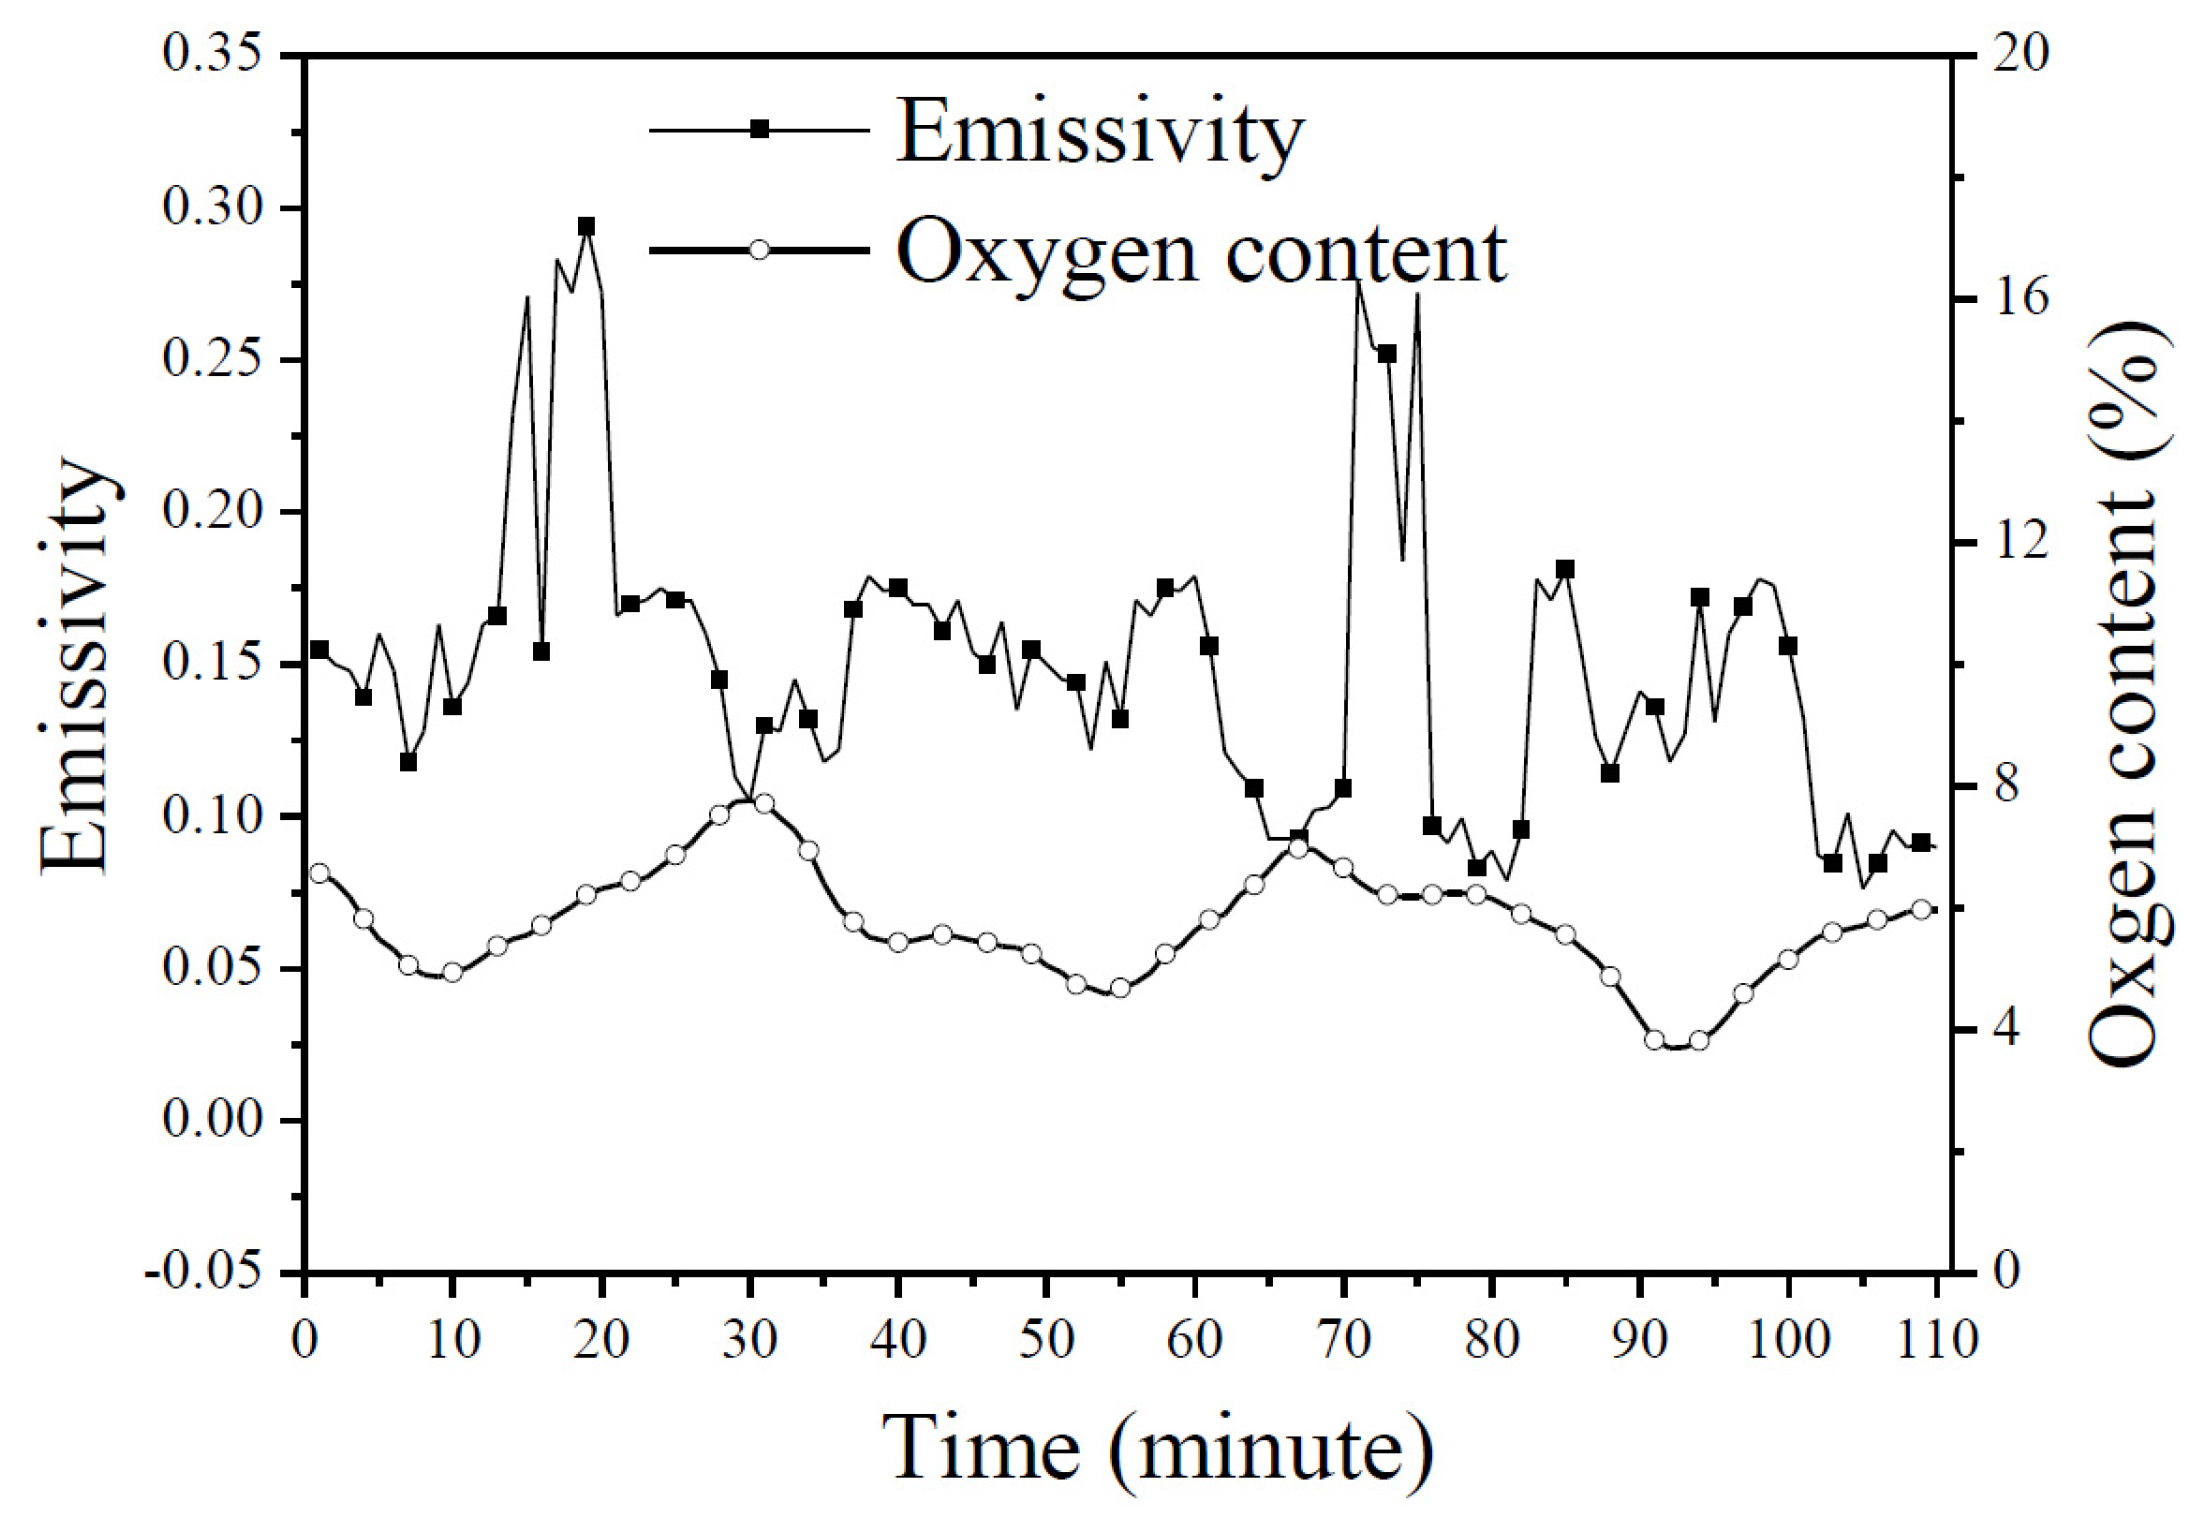
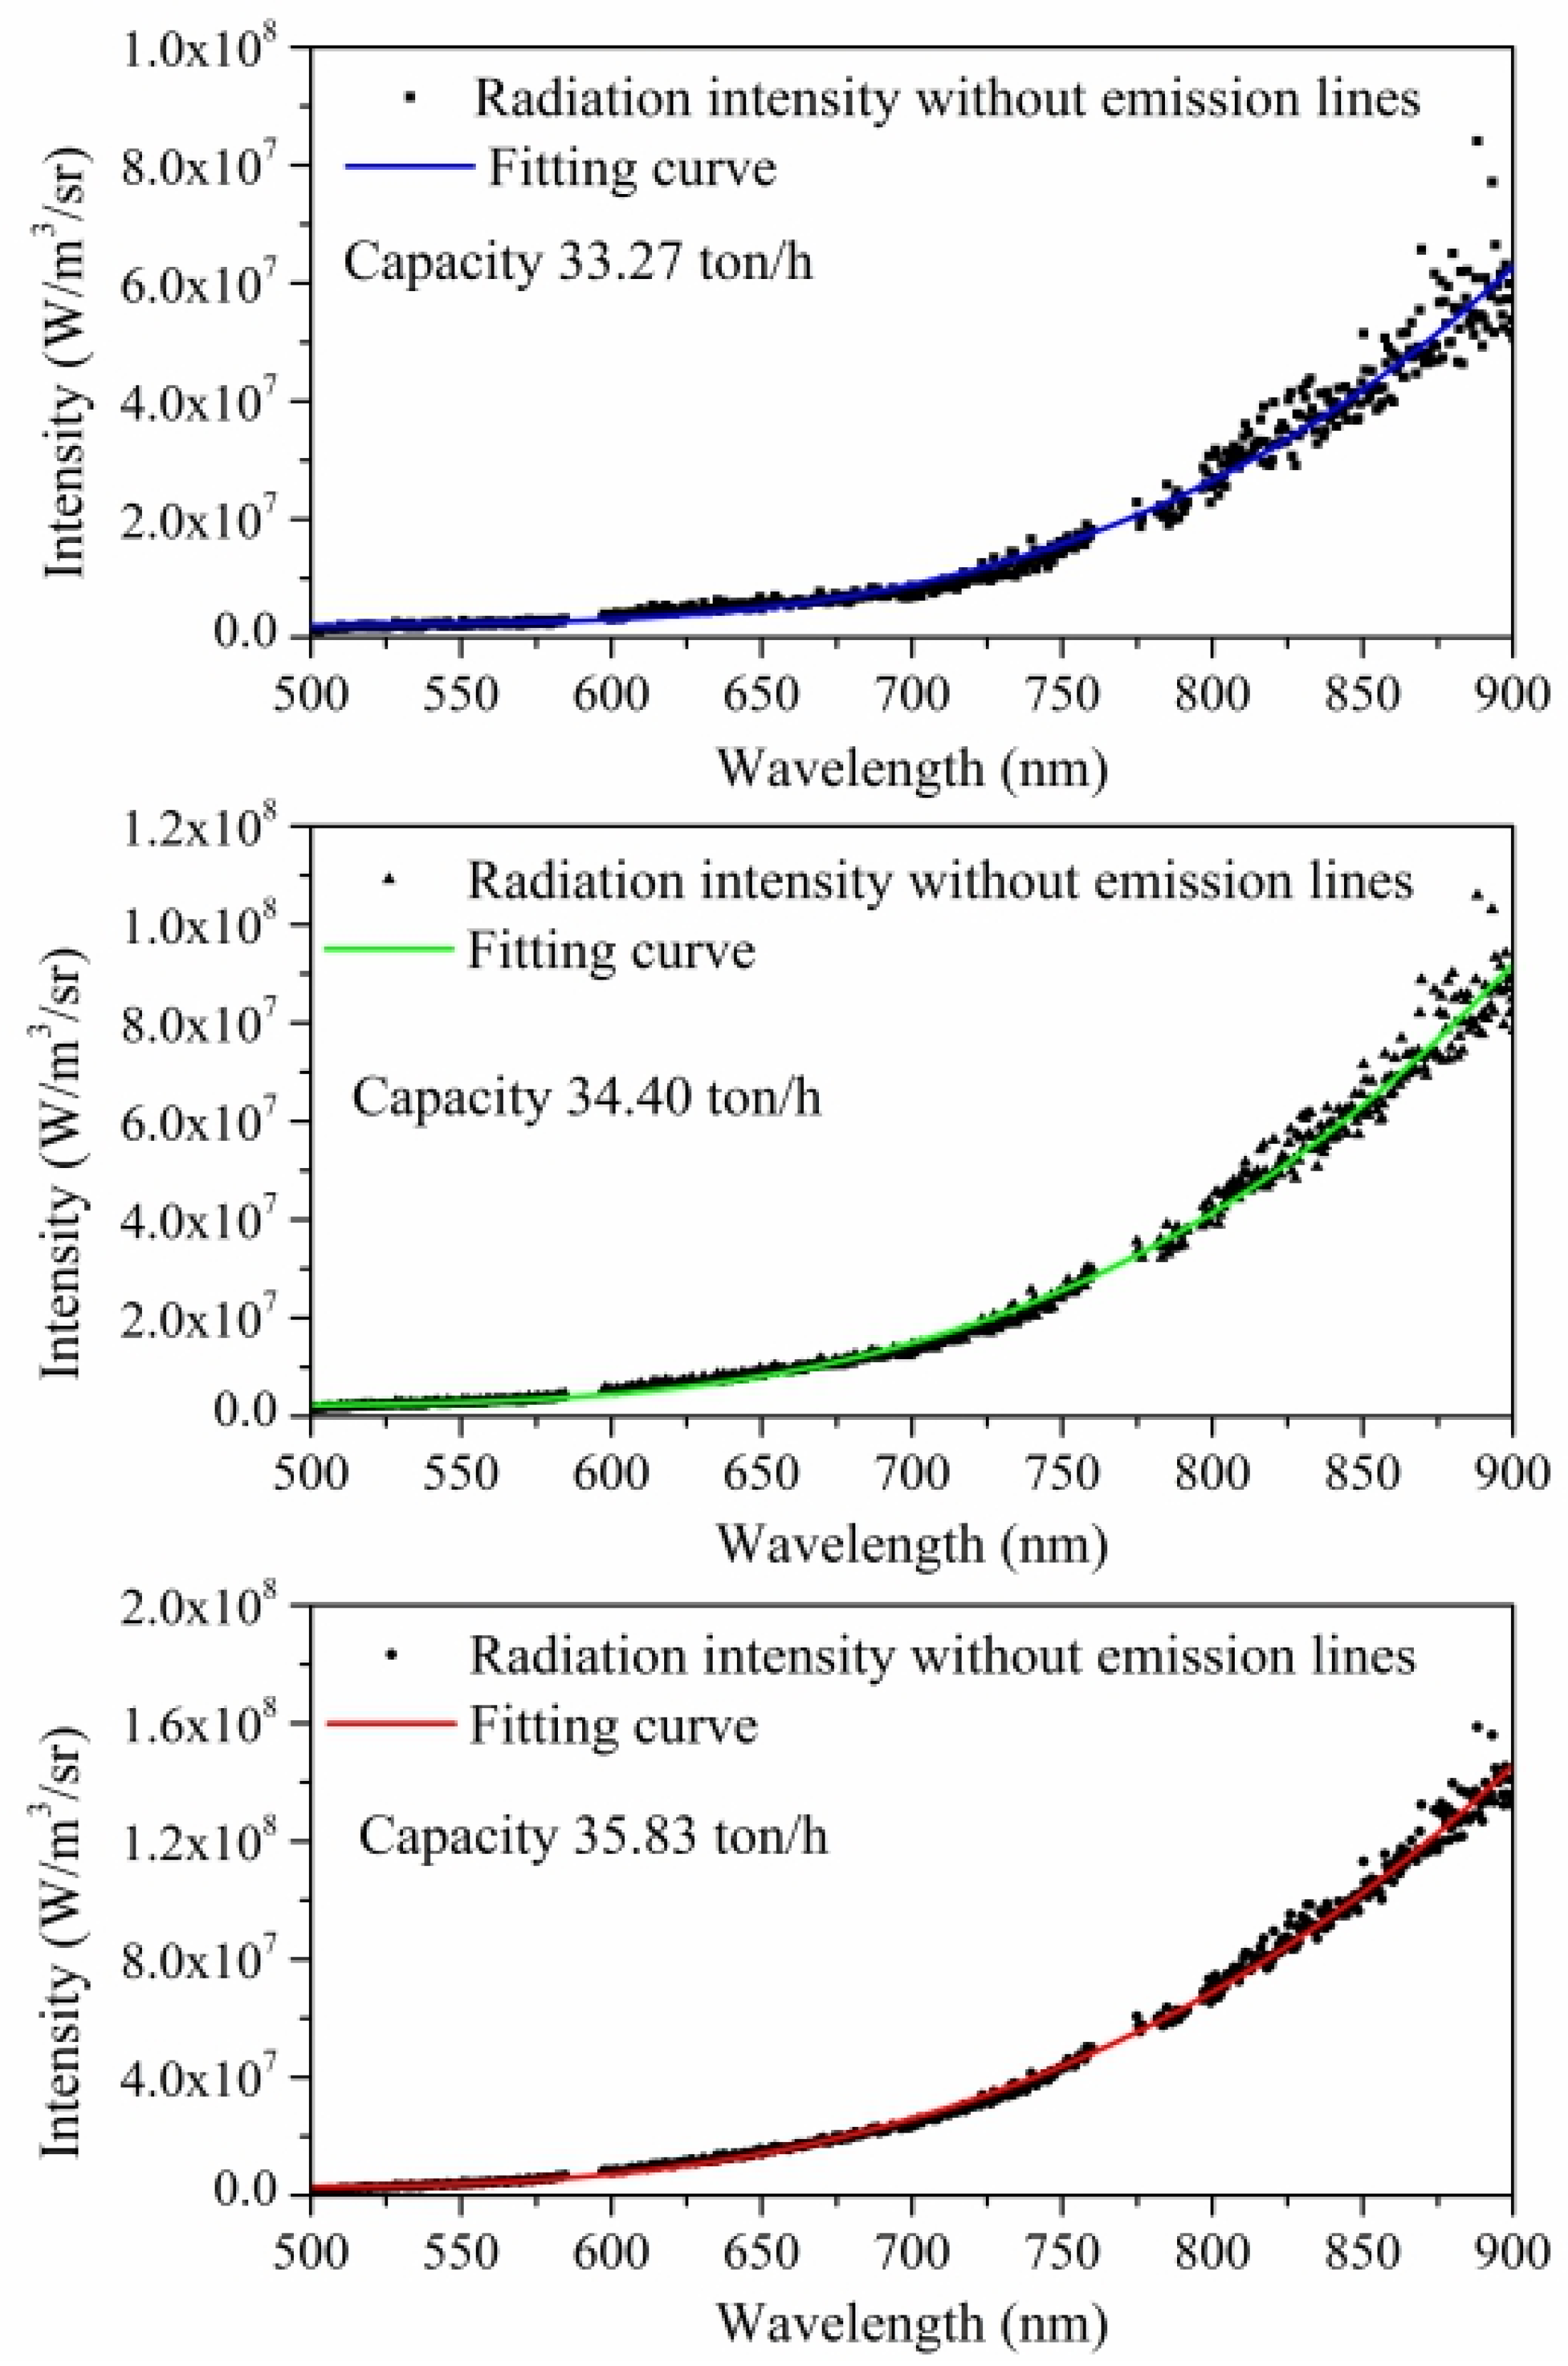
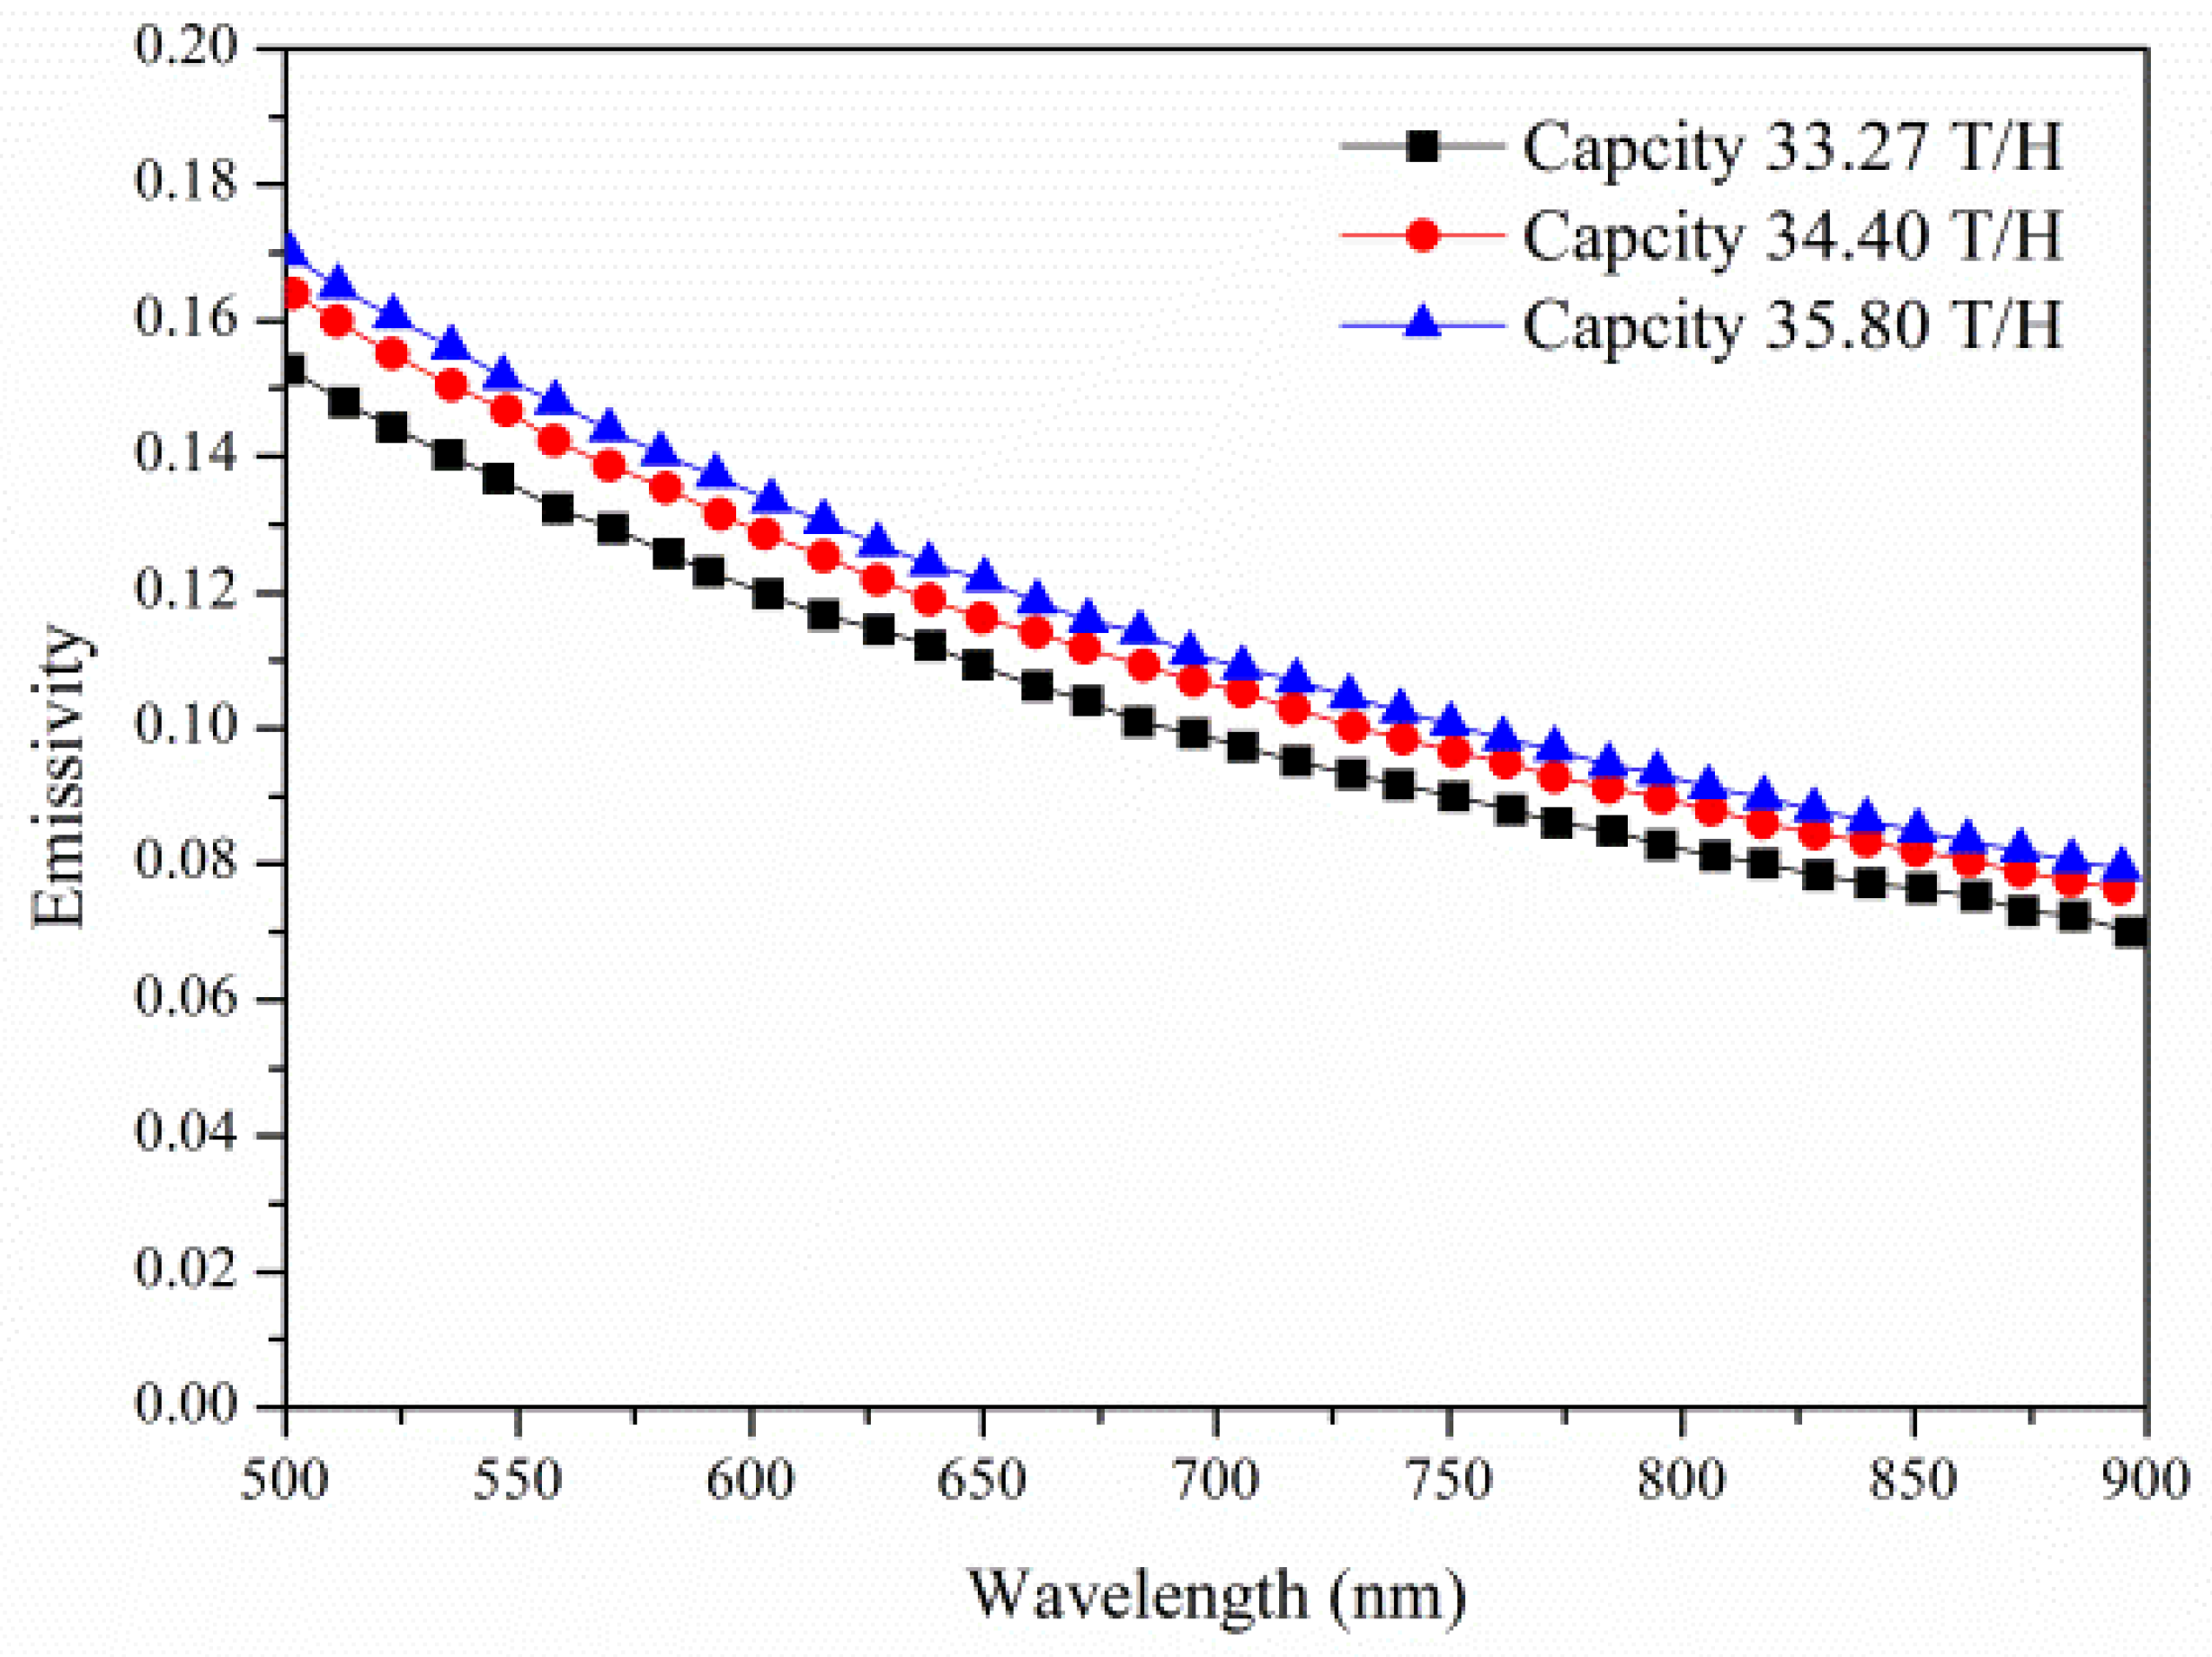
4.2. Temperature, Emissivity, and Alkaline Metal Emission Lines from MSW Flame Spectra

According to measurement principles, the temperature and emissivity can be derived from continuous spectral radiation intensities based on Hotel and Broughton’s emissivity model. The emissivity distributions of the three MSW flame spectra represented in Figure 3b are given in Figure 5. These figures demonstrate that the MSW flame shows non-gray characteristics in a wavelength range of 500 nm to 900 nm, caused by an increased amount of soot particles in the flame. The corresponding temperatures of the three cases are 1282 K, 1335 K, and 1379 K, respectively.
To validate the accuracy of the results, the spectral radiation intensities were re-calculated by substituting the values of the temperature and emissivity into Equation (3). Comparing the re-calculated and measured spectral radiation intensities, as shown in Figure 6, it was found that they matched well in the continuous wavelength range.
As mentioned in Section 3, the intensities of the emission lines of the alkali metals were obtained by deducting the continuous spectral radiation intensities from the measured spectral radiation intensities. Figure 7 lists the intensities of the alkali metal emission lines of the three MSW flame spectra depicted in Figure 3b. The intensities of the alkali metal emission lines were taken to compare with those of the background radiation, and the results show that the relationship between them is nearly five times, so uncoupling the continuous spectrum and the characteristic lines is necessary for the temperature measurement of K and Na.
The strength of the alkali metals’ emission lines is a complex function of the concentration of the alkali metals, and it also depends on the self-absorption of the radiation. For small-scale flames enriched by alkali metals, the concentration distributions of the alkali metals are generally assumed to be uniform. Some methods similar to those described in the literature [22] may be used to correct the effect of self-absorption. However, for an industrial MSW incinerator, which has a large furnace cavity, these concentration distributions of the alkali metals in the furnace are inappropriately assumed to be uniform. In such cases, it is difficult to correct for the effect of self-absorption using methods such as those described in the literature [23]. It is best to reconstruct the 2D and/or 3D distribution of local quantities inside the isothermal and homogeneous combustion chambers, as is often done for a large-scale, coal-fired boiler furnace by means of a visible flame image processing system with many detectors [24]. In this article, by means of a single spectrometer detector, line-of-sight values were determined for the measurement of the flame temperature, the radiation intensity of the alkali metals, and the flame emissivity. In this article, the peak intensities of the alkali metals’ emission lines are used for in situ monitoring of the alkali metal content in the MSW flame.

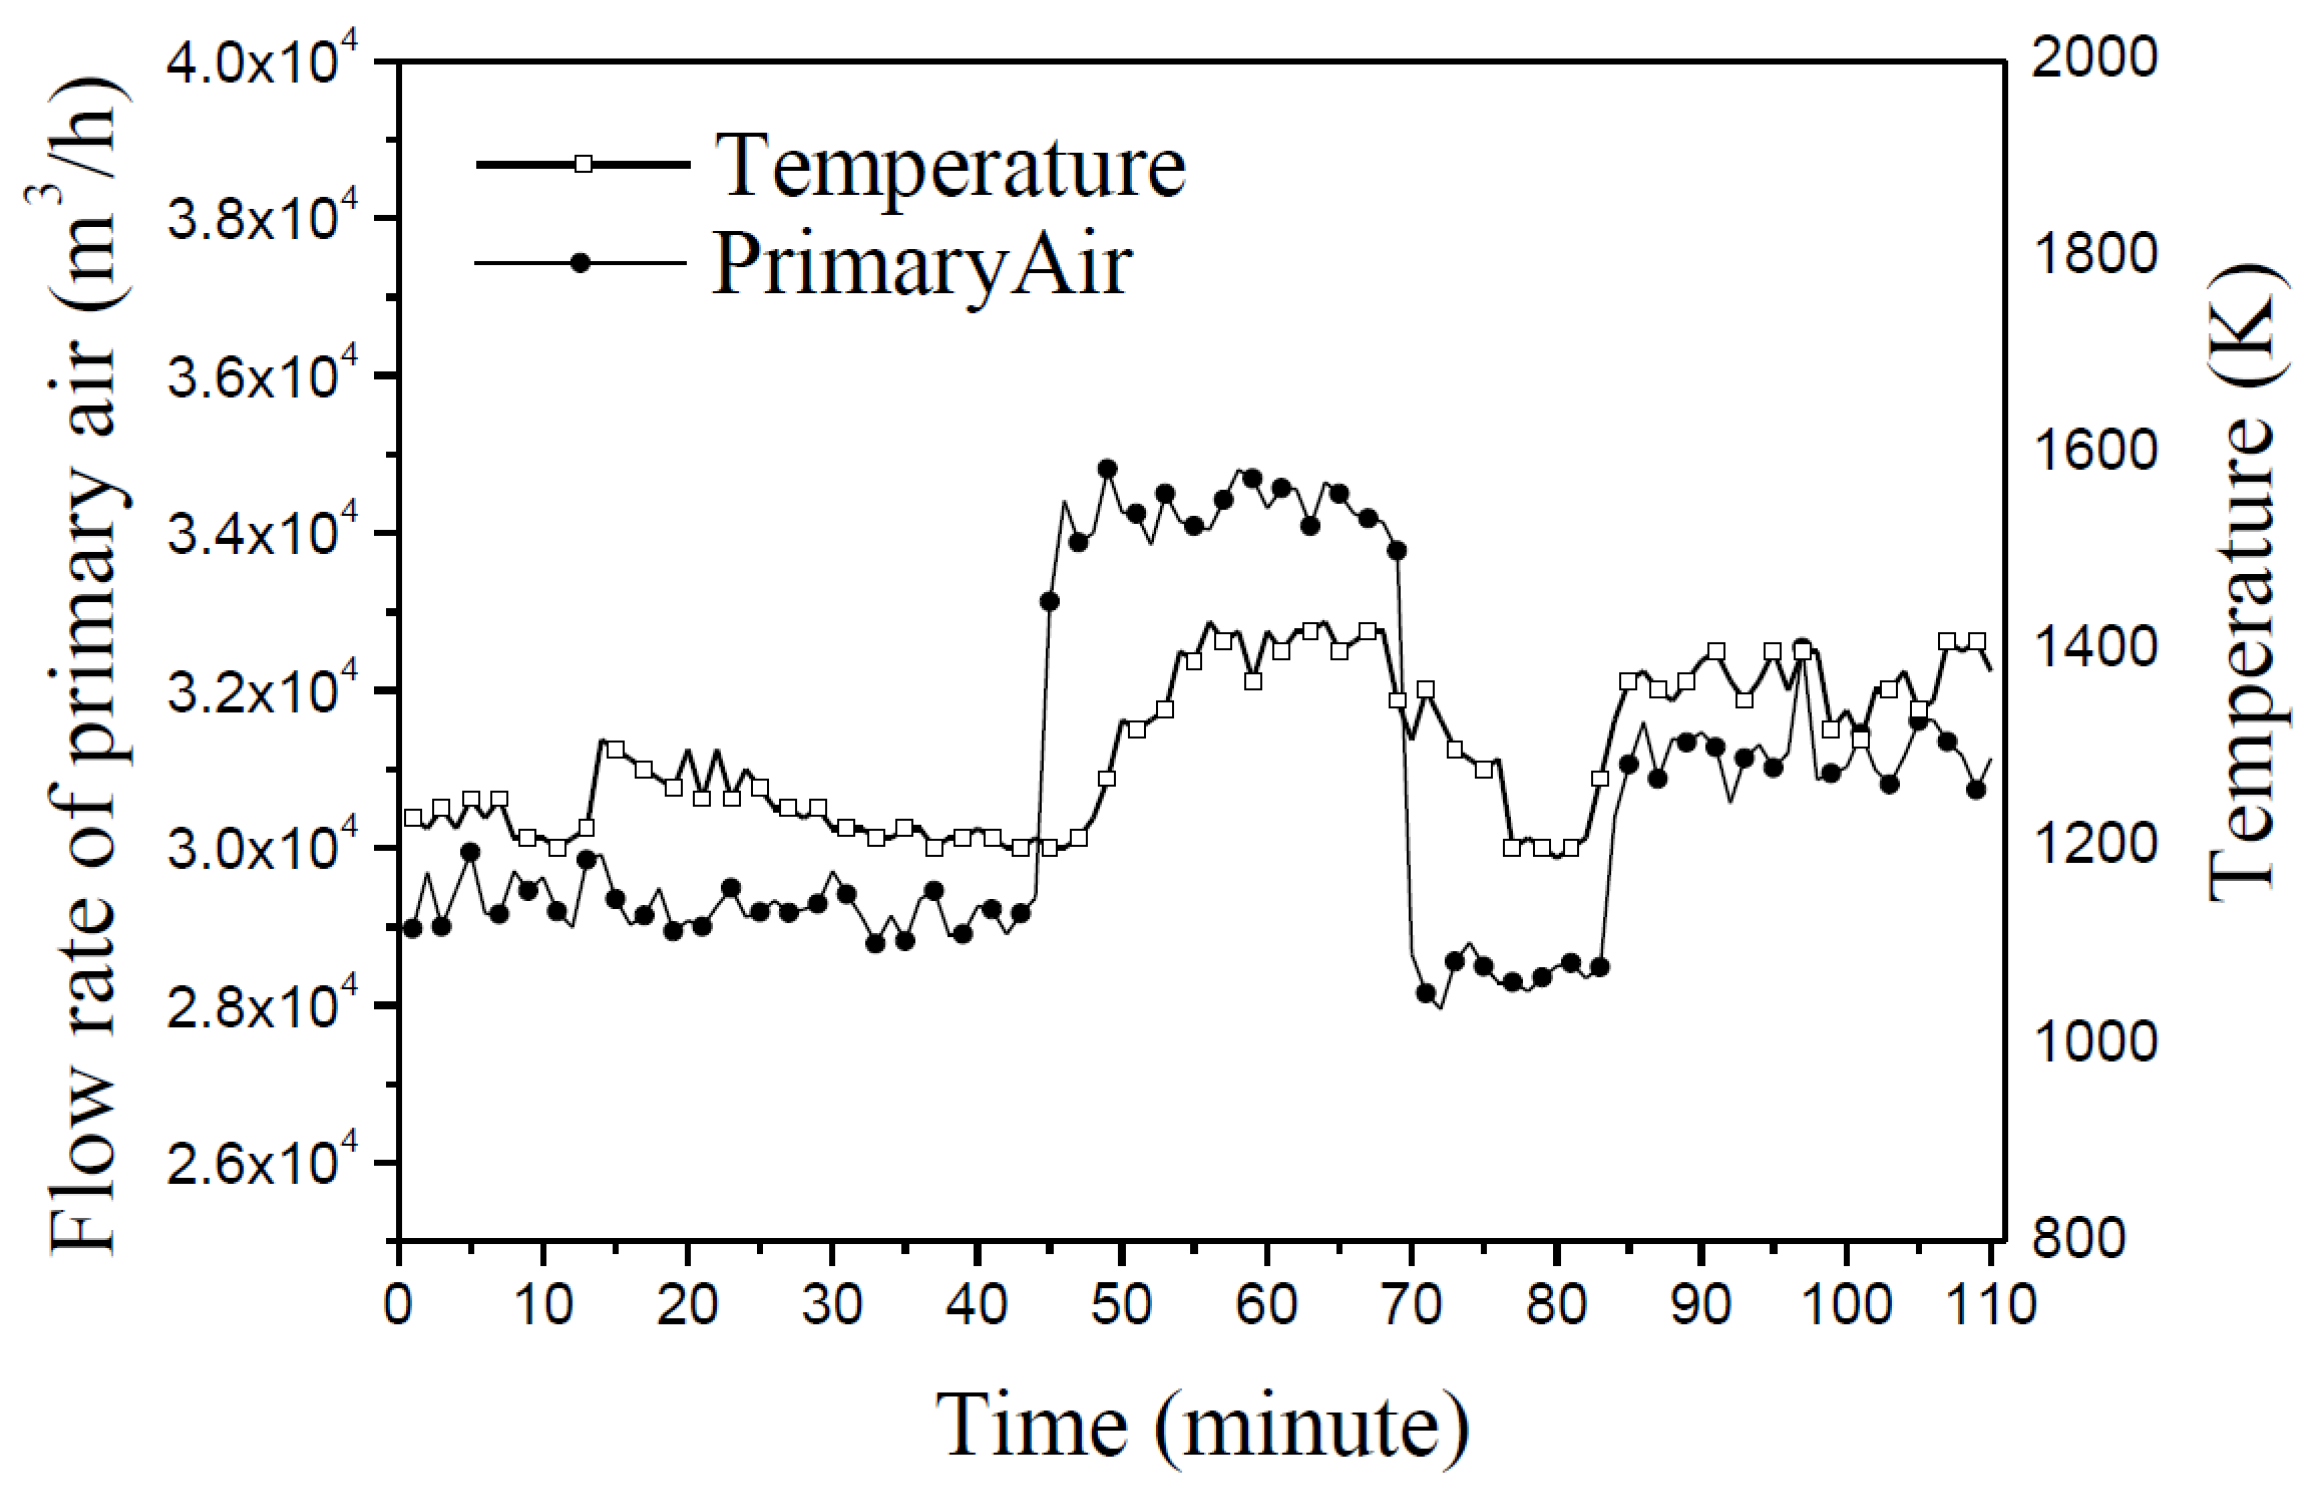
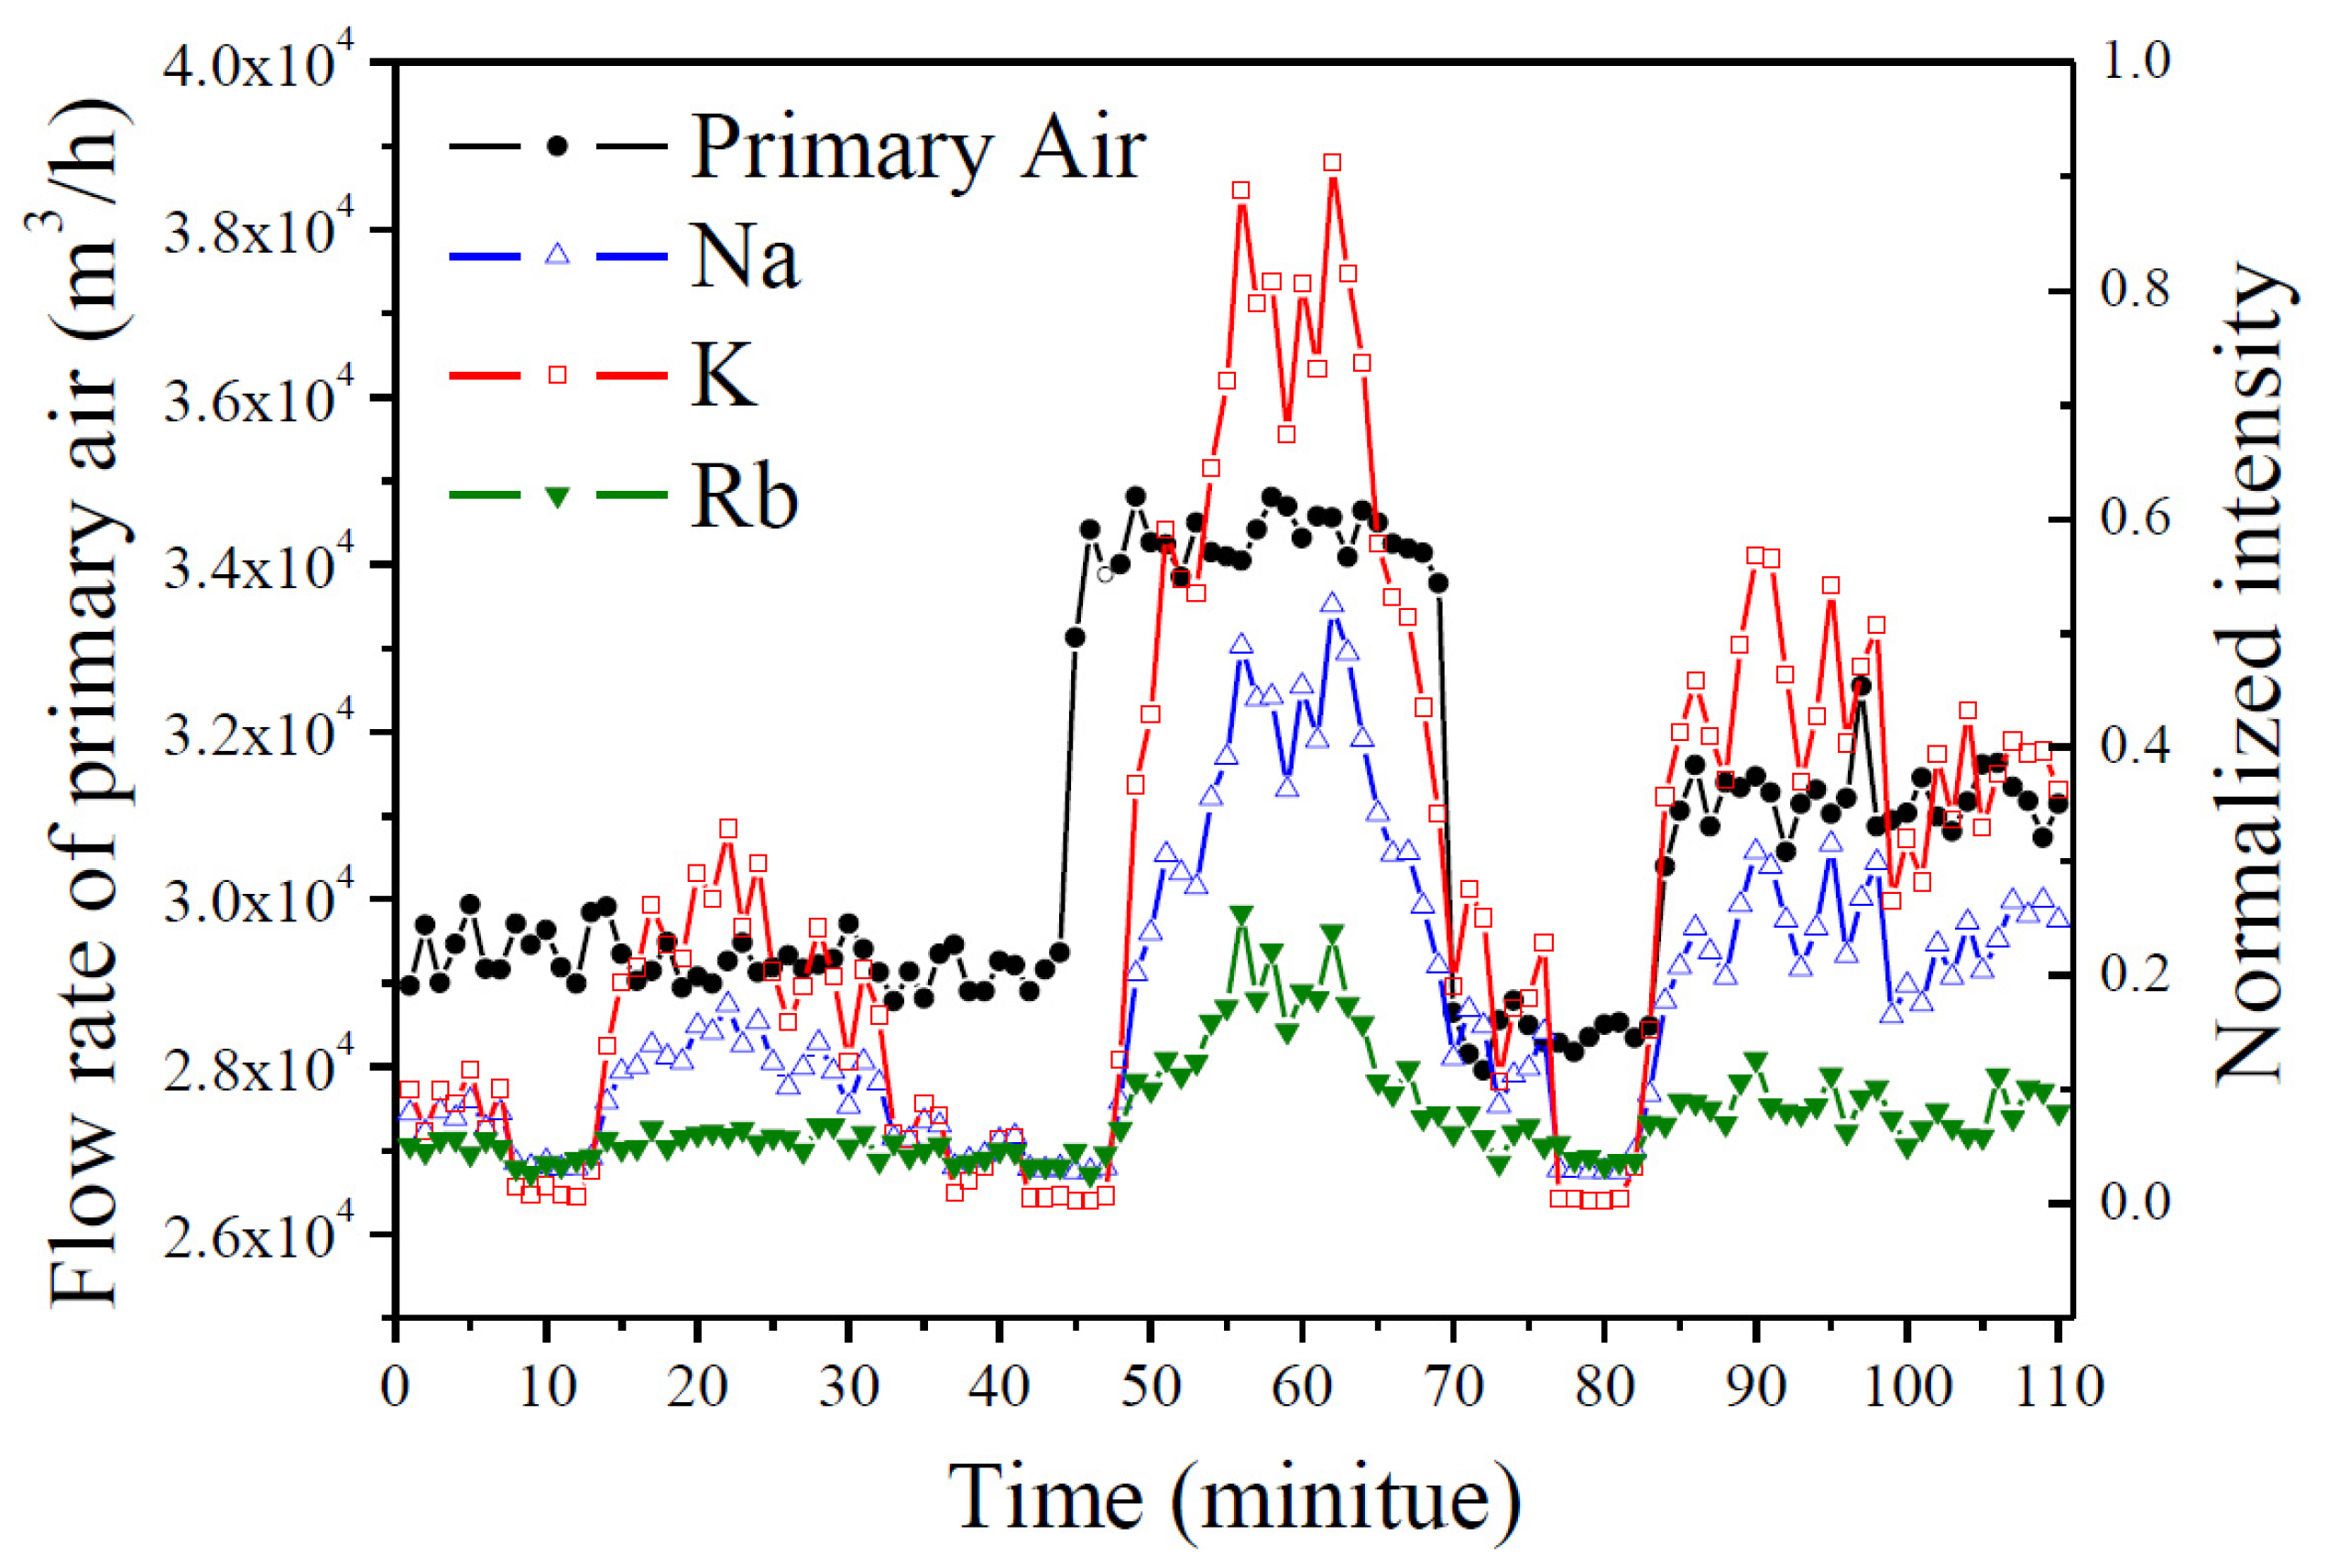
4.3. Comparison of Measured Results and Operating Parameters of the Incinerator

Generally, in order to decrease the pollutant emissions, the incinerator is operated with an excess air coefficient of between 1.4 and 1.6, and at a temperature higher than 850 °C. The adjustment of the primary air is crucial for controlling the excess air and the temperature in MSW incineration. A test for changing the flow rate of the primary air flow from 28,000 to 35,000 m3/h has been conducted. The measured temperature, emissivity, and peak intensities of the alkali metals’ emission lines were compared with the recorded primary air, actual evaporative capacity, and oxygen content of the incinerator, respectively. Figure 8 displays the normalized peak intensities of Na (589 nm), K (765.9 nm), and Rb (779.4 nm) emission lines, and demonstrates that the flow rates of primary air varied with time. From Figure 8, it can be seen that when the primary air was high, the peak intensities of the alkali metal emissions increased. The increased primary air enhanced the particulate entrainment in the MSW flame, so more alkali metal entered the gaseous medium of the flame instead of staying in the ash. Therefore, the concentrations of alkali metals in the flame increased, which caused the peak intensities of the alkali metals’ emission lines to increase. Changes in the peak intensities of the alkali metals’ emission lines may be related to changes in the characteristics of the MSW. However, in this experiment, the composition of the MSW used changed only slightly.
Additionally, the adjustment of the primary air affected the temperature of the MSW flame. Figure 9 displays temperatures derived from the MSW flame spectra and the primary air and shows that they varied with time. The temperature had a similar variation trend as the primary air. The increase in surface temperature on the particles leads to higher K and Na emissions; those results are similar to the release of alkali metal during biomass and coal combustion. The literature [24] shows that the release of K and Na from well-characterized biofuels was quantified as a function of temperature in a lab-scale fixed-bed reactor. Wang et al. [25] investigated the release and transformation fundamentals of sodium during pyrolysis of two Zhundong bituminous coals, with experimental results showing that the release of sodium increases with temperature, indicating that temperature has a profound effect on the volatilization of sodium. The range of temperatures was between 1200 and 1400 K. In this temperature range, the emission of pollutants, such as dioxin, can be controlled.
Another interesting phenomenon was that the peak intensity of the K emission line had a linear relationship with the peak intensity of the Na emission line, as shown in Figure 10. This correlation may be attributed to the wide availability of these two metals in the waste, and also to their similar physicochemical characteristics. Na and K are both important elements in biomass, and because biomass (vegetable, plant, and garden wastes) forms a significant part of household waste, it stabilizes the ratio of Na and K in the MSW.
Figure 11 displays the emissivity derived from the MSW flame spectra and oxygen content in the flue gas varying with time. It is interesting that the two parameters behaved in an approximately contrary manner, which may be explained by the soot in the flame. The increased oxygen content may have suppressed soot formation. Thus, emissivity from the soot particles generated in the MSW in the furnace may increase as the flame decreases.

5. Conclusions

In this paper, a flame emission spectroscopy technique was used to diagnose, in situ, the spontaneous emission spectra of MSW flames in an industrial-grade incinerator. For MSW flames, strong characteristic emission lines of Na and K are observed in the visible spectra, and a linear polynomial fitting method is proposed to uncouple them. Based on spectra processing and a non-gray emissivity model, the temperature, emissivity, and intensities of the emission lines of alkali metals were calculated from the spectral radiation intensities of the MSW flame. Experimental results indicate that the MSW flame contained alkali metals, including Na, K, and even Rb, and that the flame demonstrated non-gray characteristics in a wavelength range from 500 nm to 900 nm. The variation of the measured temperature, emissivity, and peak intensities of the alkali metals’ emission lines may reflect the variation of actual oxygen content and primary air. The preliminary results prove that the flame emission spectroscopy technique is feasible for in situ monitoring of the combustion in a MSW incinerator. In later studies, calibration methods similar to the literature [22] will be conducted, making use of multi-parameter coupling technology to correlate the concentration of alkali metals, the flame temperature, and the radiation of alkali metals. Then the radiation function of alkali metal concentration will be obtained.

Acknowledgments

The present study has been supported by the Fundamental Research Funds for the Central Universities, CUMT: 2015QNA14, the National Natural Science Foundation of China (No. 51676077, No. 51676078).

Author Contributions

Weijie Yan and Chun Lou conceived and designed the experiments; Weijie Yan, Chun Lou, Peitao Zhao, and Xiangyu Zhang performed the experiments; Weijie Yan, Chun Lou, and Qiang Cheng analyzed the data; Weijie Yan and Chun Lou wrote the paper.

Conflicts of Interest

The founding sponsors had no role in the design of the study, in the collection, analyses, or interpretation of data, in the writing of the manuscript, and in the decision to publish the results.

References

  1. Ruth, L.A. Energy from municipal solid waste: A comparison with coal combustion technology. Prog. Energy Combust. Sci. 1998, 24, 545–564. [Google Scholar] [CrossRef]
  2. Zhao, X.G.; Jiang, G.W.; Li, A.; Li, Y. Technology, cost, a performance of waste-to-energy incineration industry in China. Renew. Sustain. Energy Rev. 2016, 55, 115–130. [Google Scholar]
  3. Poole, D.; Sharifi, V.; Swithenbank, J.; Argent, B.; Ardelt, D. On-line detection of metal pollutant spikes in MSW incinerator flue gases prior to clean-up. Waste Manag. 2007, 27, 519–532. [Google Scholar] [CrossRef] [PubMed]
  4. Monkhouse, P. On-line spectroscopic and spectrometric methods for the determination of metal species in industrial processes. Prog. Energy Combust. Sci. 2011, 37, 125–171. [Google Scholar] [CrossRef]
  5. Vassilev, S.V.; Vassileva, C.G. Methods for characterization of composition of fly ashes from coal-fired power stations: A critical overview. Energy Fuels 2005, 19, 1084–1098. [Google Scholar] [CrossRef]
  6. Schuler, F.; Rampp, F.; Martin, J.; Wolfrum, J. TACCOS—A thermography-assisted combustion control system for waste incinerators. Combust. Flame 1994, 99, 431–439. [Google Scholar] [CrossRef]
  7. Manca, D.; Rovaglio, M. Infrared thermographic image processing for the operation and control of heterogeneous combustion chambers. Combust. Flame 2002, 130, 277–297. [Google Scholar] [CrossRef]
  8. Kohse-Höinghaus, K.; Barlow, R.S.; Aldén, M.; Wolfrum, J. Combustion at the focus: Laser diagnostics and control. Proc. Combust. Inst. 2005, 30, 89–123. [Google Scholar] [CrossRef]
  9. Ballester, J.; García-Armingol, T. Diagnostic techniques for the monitoring and control of practical flames. Prog. Energy Combust. Sci. 2010, 36, 375–411. [Google Scholar] [CrossRef]
  10. Broida, H.P. The spectroscopy of flames. Combust. Flame 1957, 1, 487–488. [Google Scholar] [CrossRef]
  11. Romero, C.; Li, X.; Keyvan, S.; Rossow, R. Spectrometer-based combustion monitoring for flame stoichiometry and temperature control. Appl. Therm. Eng. 2005, 25, 659–676. [Google Scholar] [CrossRef]
  12. Keyvan, S.; Rossow, R.; Romero, C. Blackbody-based calibration for temperature calculations in the visible and near-IR spectral ranges using a spectrometer. Fuel 2006, 85, 796–802. [Google Scholar] [CrossRef]
  13. Cai, X.S.; Cheng, Z.H.; Wang, S.M. Flame measurement and combustion diagnoses with spectrum analysis. AIP Conf. Proc. 2007, 914, 60. [Google Scholar]
  14. Sun, Y.P.; Lou, C.; Zhou, H.C. A simple judgment method of gray property of flames based on spectral analysis and the two-color method for measurements of temperatures and emissivity. Proc. Combust. Inst. 2011, 33, 735–741. [Google Scholar] [CrossRef]
  15. Parameswaran, T.; Hughes, R.; Gogolek, P.; Hughes, P. Gasification temperature measurement with flame emission spectroscopy. Fuel 2014, 134, 579–587. [Google Scholar] [CrossRef]
  16. Christian, G.P.; Alexander, C.W.; David, M.S.; Donaldson, A.B.; Jonathan, L.H. Aluminum Flame Temperature Measurements in Solid Propellant Combustion. Appl. Spectrosc. 2014, 68, 362–366. [Google Scholar]
  17. Yan, W.J.; Zhou, H.C.; Jiang, Z.W.; Lou, C.; Zhang, X.K.; Chen, D.L. Experiments on measurement of temperature and emissivity of municipal solid waste (MSW) combustion by spectral analysis and image processing in visible spectrum. Energy Fuels 2013, 27, 6754–6762. [Google Scholar] [CrossRef]
  18. Arias, L.; Sbarbaro, D.; Torres, S. Removing baseline flame’s spectrum by using advanced recovering spectrum techniques. Appl. Opt. 2012, 51, 6111–6116. [Google Scholar] [CrossRef] [PubMed]
  19. Draper, T.S.; Zeltner, D.; Tree, D.R.; Xue, Y.; Tsiava, R. Two-dimensional flame temperature and emissivity measurements of pulverized oxy-coal flames. Appl. Energy 2012, 95, 38–44. [Google Scholar] [CrossRef]
  20. Lu, G.; Yan, Y.; Riley, G.; Bheemul, H.C. Concurrent measurement of temperature and soot concentration of pulverized coal flames. IEEE Trans. Instrum. Meas. 2002, 51, 990–995. [Google Scholar]
  21. Zhao, H.; Ladommatos, N. Optical diagnostics for soot and temperature measurement in diesel engines. Prog. Energy Combust. Sci. 1998, 24, 221–255. [Google Scholar] [CrossRef]
  22. He, Y.; Zhu, J.J.; Li, B.; Wang, Z.H.; Li, Z.S.; Aldén, M.; Cen, K.F. In-situ measurement of sodium and potassium release during oxy-fuel combustion of lignite using laser-induced breakdown spectroscopy: Effects of O2 and CO2 concentration. Energy Fuels 2013, 27, 1123–1130. [Google Scholar] [CrossRef]
  23. Wang, H.J.; Huang, Z.F.; Wang, D.D.; Luo, Z.X.; Sun, Y.P.; Fang, Q.Y.; Lou, C.; Zhou, H.C. Measurements on flame temperature and its 3D distribution in a 660 MW archfired coal combustion furnace by visible image processing and verification by using an infrared pyrometer. Meas. Sci. Technol. 2009, 20, 114006. [Google Scholar]
  24. Frandsen, F.J.; Lith, S.C.; Korbee, R.; Yrjas, P.; Backman, R.; Obernberger, I.; Brunner, T.; Jöller, M. Quantification of the release of inorganic elements from biofuels. Fuel Process. Technol. 2007, 88, 1118–1128. [Google Scholar] [CrossRef]
  25. Wang, C.A.; Jin, X.; Wang, Y.K.; Yan, Y.; Cui, J.; Liu, Y.H.; Che, D.F. Release and transformation of sodium during pyrolysis of Zhundong Coals. Energy Fuels 2015, 29, 78–85. [Google Scholar] [CrossRef]
Figure 1. Schematic diagram of the experimental setup.
Applsci 07 00263 g001
Figure 2. Calibration coefficients for the spectrometer at different blackbody temperatures.
Applsci 07 00263 g002
Figure 3. Three typical of MSW flame spectra. (a) Relative spectral profiles S ( λ ) ; and (b) corresponding spectral radiation intensities I ( λ ) .
Applsci 07 00263 g003
Figure 4. Comparison of the original continuous spectral radiation intensities (dotted line) separated from Figure 3b and the corresponding fitting curves (solid line).
Applsci 07 00263 g004
Figure 5. Emissivity distributions calculated from spectral radiation intensities in Figure 3b.
Applsci 07 00263 g005
Figure 6. Comparison of the re-calculated and measured spectral radiation intensities.
Applsci 07 00263 g006
Figure 7. Intensities of alkali metals’ emission lines calculated from spectral radiation intensities in Figure 3b.
Applsci 07 00263 g007
Figure 8. Peak intensities of the alkali metals’ emission lines and primary air varying with time.
Applsci 07 00263 g008
Figure 9. Temperatures of the MSW flame and primary air varying with time.
Applsci 07 00263 g009
Figure 10. Relationship between peak intensities of K and Na emission lines.
Applsci 07 00263 g010
Figure 11. Emissivity and oxygen content varying with time.
Applsci 07 00263 g011
Table 1. Proximate and ultimate analysis of the MSW (air dried basis, %).
No.MoistureAshVolatileFixed CarbonTotal SulfurHydrogenCalorific Value
13.6255.6229.6411.120.322.506.40 MJ/kg
23.5954.6329.7212.060.412.606.63 MJ/kg
33.6855.4628.8212.040.382.466.66 MJ/kg

