Article

Aqueous-Organic Phase Transfer of Gold and Silver Nanoparticles Using Thiol-Modified Oleic Acid

by
Alejandra López-Millán
1,
Paul Zavala-Rivera
2,
Reynaldo Esquivel
1,
Roberto Carrillo
1,
Enrique Alvarez-Ramos
1,
Ramón Moreno-Corral
3,
Roberto Guzmán-Zamudio
4 and
Armando Lucero-Acuña
2,*
1
Nanotechnology Graduate Program, Department of Physics, University of Sonora, Hermosillo 83000, Sonora, Mexico
2
Department of Chemical and Metallurgical Engineering, University of Sonora, Hermosillo 83000, Sonora, Mexico
3
Department of Polymers and Materials Research, University of Sonora, Hermosillo 83000, Sonora, Mexico
4
Department of Chemical and Environmental Engineering, University of Arizona, Tucson, AZ 85721, USA
*
Author to whom correspondence should be addressed.
Appl. Sci. 2017, 7(3), 273; https://doi.org/10.3390/app7030273
Submission received: 10 February 2017 / Accepted: 6 March 2017 / Published: 9 March 2017
(This article belongs to the Section Nanotechnology and Applied Nanosciences)

Abstract

:
The handling of metallic nanoparticles often requires their dispersion into several polar and nonpolar solvents. Solid-phase stages or polymer-based ligands are commonly required to complete the transfer. The construction of a thiol ligand based in oleic acid, and its ability to efficiently assist in gold and silver nanoparticle aqueous–organic phase transfer is reported. After the transfer, the particles are completely dispersed in an organic solvent, preserving their diameter and morphology, as confirmed by ultraviolet–visible spectroscopy and scanning transmission electron micrographs.

Graphical Abstract

1. Introduction

Metallic nanoparticles are of great interest due to their physical and chemical properties, which makes them suitable for a broad range of applications. In this regard, gold nanoparticles are the most stable metallic particles, and they offer several features including size-related electronic, magnetic, and optical properties; biocompatibility; non-cytotoxic properties; multiple assembly types; and surface functionalization with a broad range of applications [1,2]. Parallel silver nanoparticles present optical, electronic, and antibacterial properties that depend on their dimensions as well as their structure, form, size distribution, and chemical–physical environment. As such, they are suitable for an extensive range of applications [3,4].
Polar and non-polar environments could be used to synthesize metallic nanoparticles of different shapes and sizes. Each environment presents its unique advantages and disadvantages [5,6,7]. Nevertheless, in general, the synthesis of metallic nanoparticles in organic solvents is very sensitive and thus requires considerable effort to develop convenient size- and shape-controllable processes, while the synthesis of those in aqueous solutions has many well-defined preparation procedures [8]. In many cases, the transfer of gold nanoparticles between polar and non-polar environments is necessary to increase the applications of the particles, as well as to obtain advantages of the manufacturing process. The phase transfer of gold nanoparticles from polar to non-polar solvents has been studied using ionic liquids [8], phenolic hydroxyl groups [9], thiol ligands [10,11], etc. There are various reports that present many particular methodologies that have been established for the metallic nanoparticles phase transfer from an aqueous phase to an organic medium or vice versa [12]. There are also reports presenting the ligands commonly used for surface modification in the phase transfer of metallic nanoparticles [13]. Oleic acid (OA) has been used as a ligand for phase transfer of iron oxide nanoparticles [14] and silver nanoparticles [15]. It has also has been used to synthesize gold nanoparticles coated with oleic acid and oleylamine [16]. In that case, the synthesis is carried in organic solvents, followed by precipitations and redispersions to obtain nanoparticles of 6.7 nm.
This work aims to study the synthesis of a thiol ligand prepared through modification of oleic acid with 2-aminoethanethiol, and the metallic nanoparticle aqueous-organic phase transfer using this ligand, with a particular focus on gold and silver nanoparticles. However, the proposed strategies could be of general nature and work similarly to other metallic nanoparticles. This phase transfer method could be applied to a wide range of established nanoparticle aqueous synthesis.

2. Materials and Methods

2.1. Materials

Sodium citrate (Na3-citrate), tetrachloroauric III acid (HAuCl4), silver nitrate (AgNO3), ascorbic acid, and hydroxylamine hydrochloride were purchased from Sigma-Aldrich (St. Louis, MO, USA). OA was acquired from Fermont (Monterrey, NL, Mexico). N,N′-dicyclohexylcarbodiimide (DCC) was bought from Alsa Aesar (Ward Hill, MA, USA). DCM was purchased from Fisher Scientific Inc. (Fair Lawn, NJ, USA). 2-Aminoethanethiol was purchased from TCI (Portland, OR, USA). Other reagents were analytical grade.

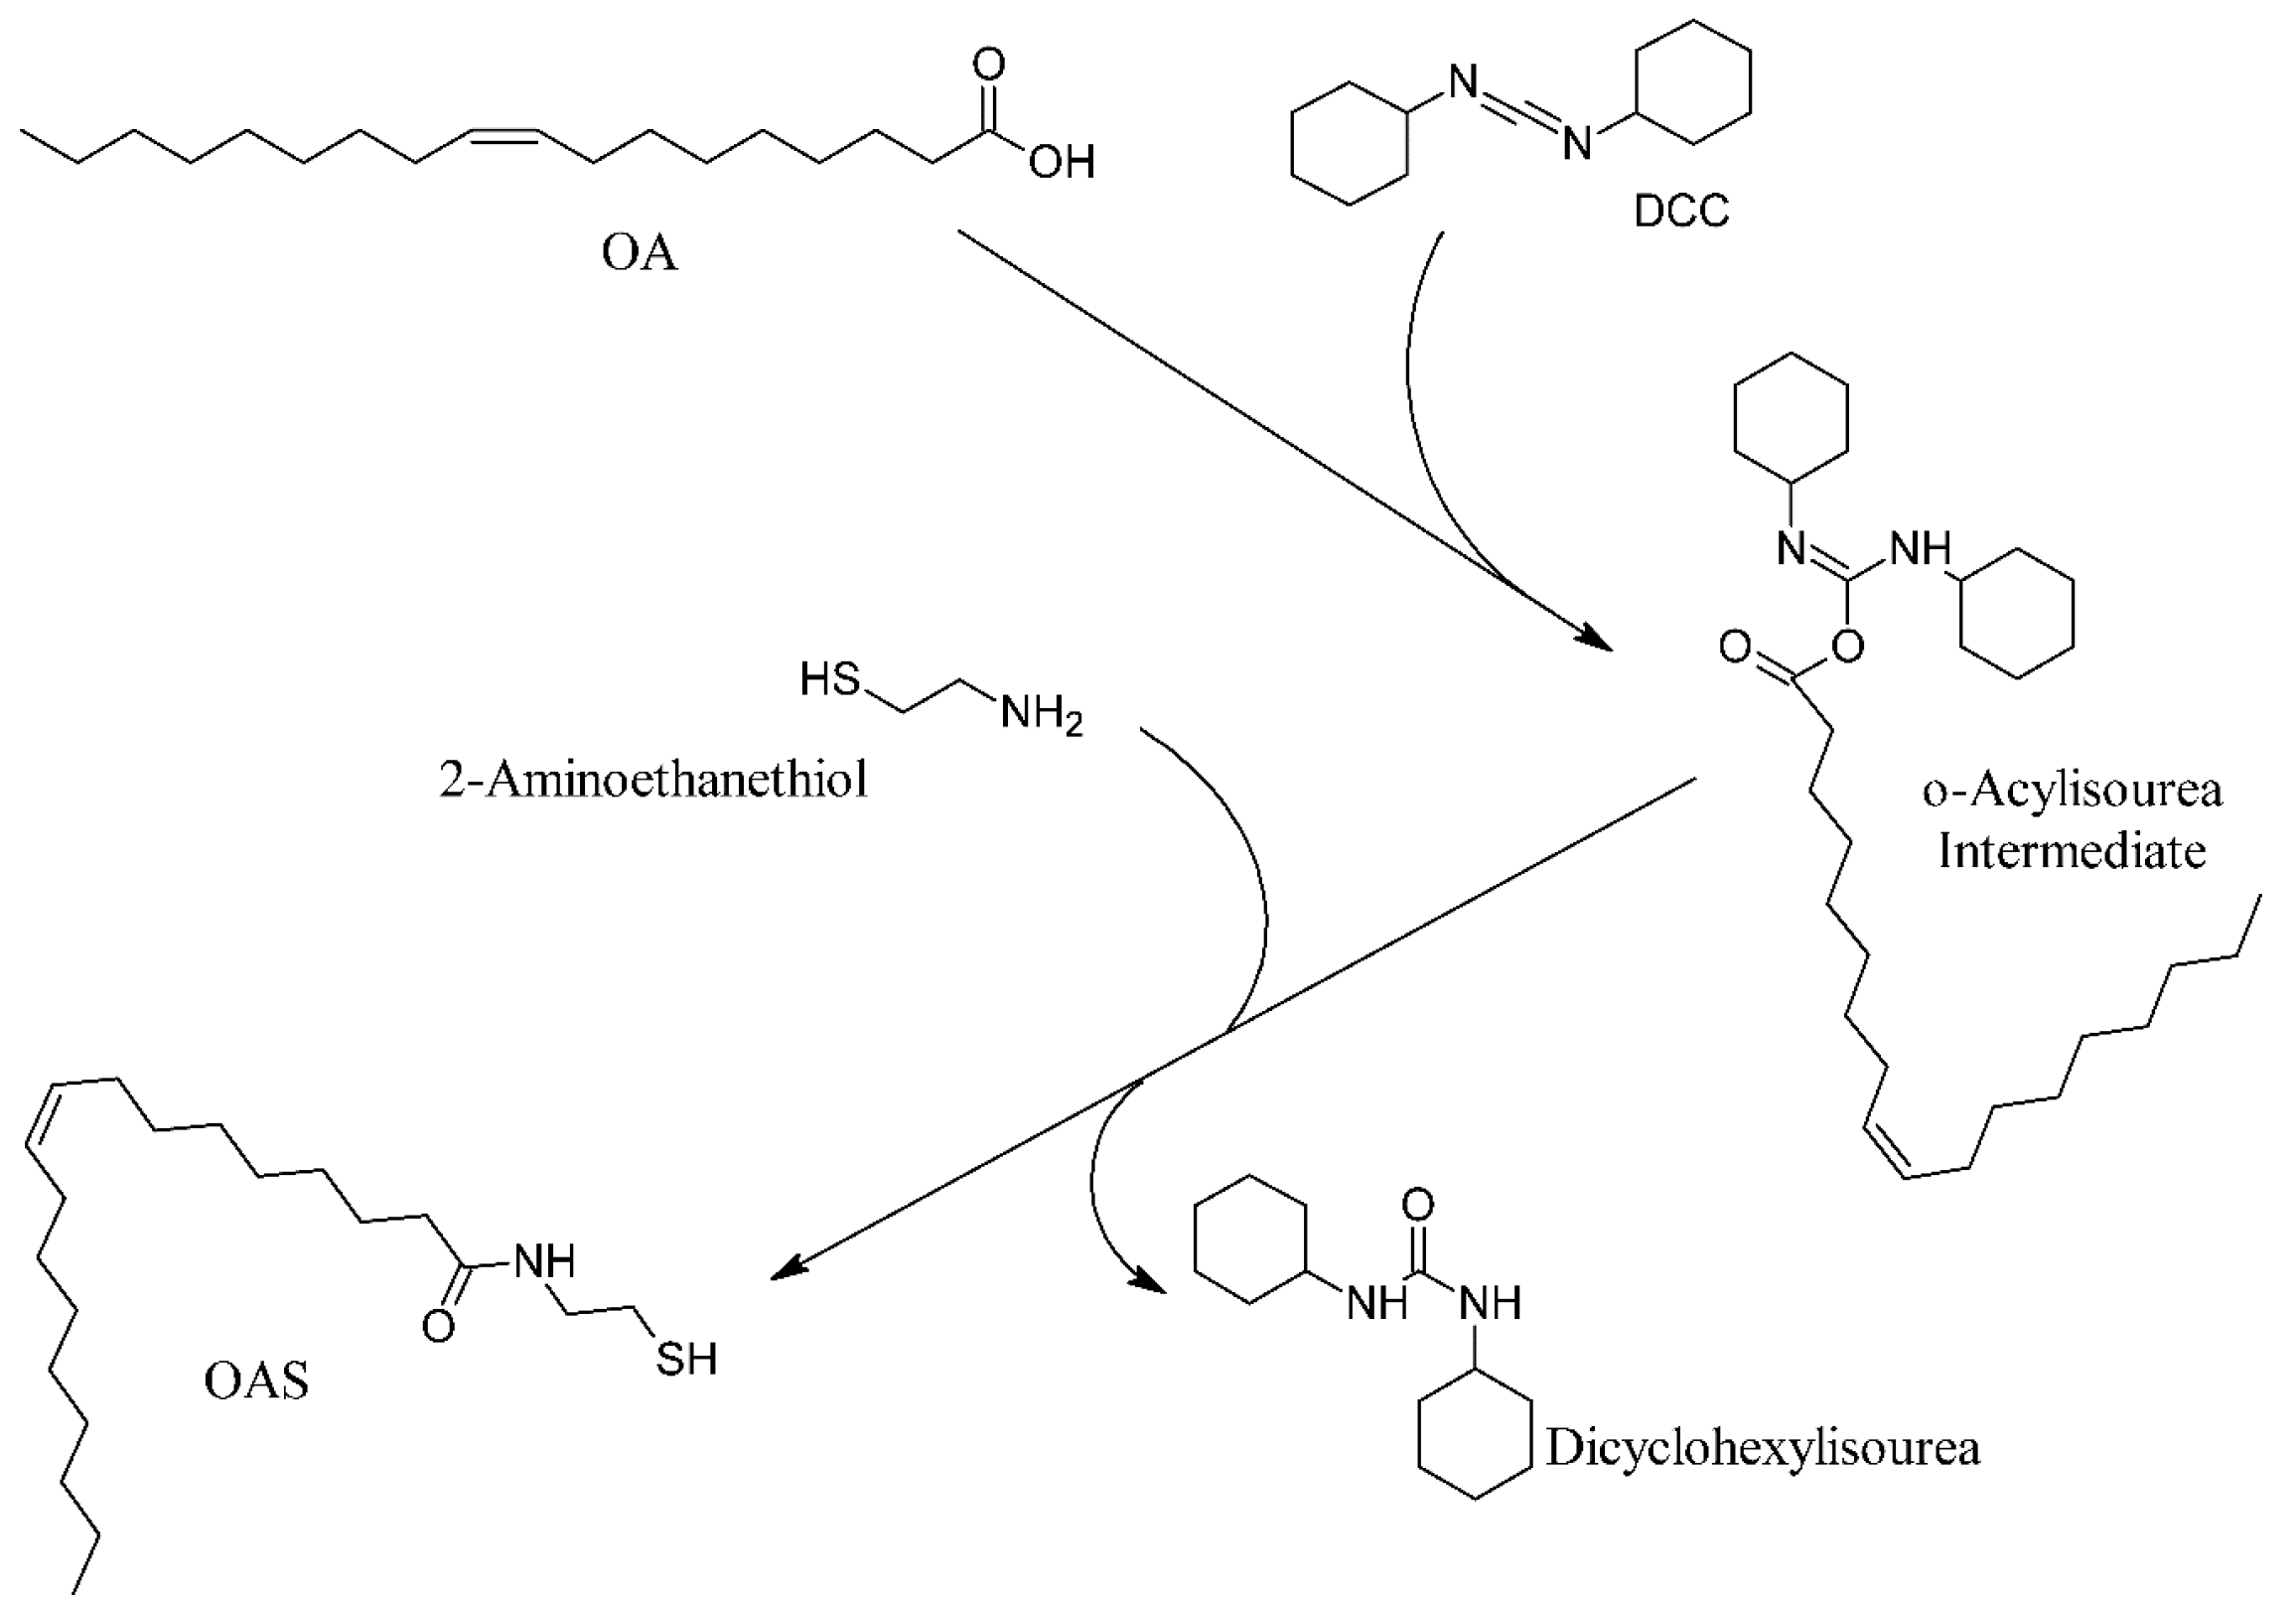
2.2. Preparation of OAS

OA modification with 2-aminoethanethiol was performed following a common coupling reaction reported in literature [17] and presented in Figure 1. Briefly, 3.54 mmol of OA and 3.54 mmol of DCC were dissolved in methanol (other solvents like dimethyl sulfoxide could also be used). Next, 2-aminoethanethiol (3.54 mmol) was added to the methanol solution and gently stirred for two hours at room temperature. Precipitated dicyclohexylurea was removed by a centrifugation cycle at 2348× g for 20 min in the equipment Sigma 3-30 KS Ultracentrifuge (Osterode, Germany). The supernatant was stored at 4 °C for 12 h to secure the termination of the coupling reaction. Then, a centrifugation cycle at the same conditions described above was performed to remove potential precipitates (dicyclohexylurea). In order to perform further characterizations, part of the solvent was evaporated and the compound was isolated as a pale-yellow oil.

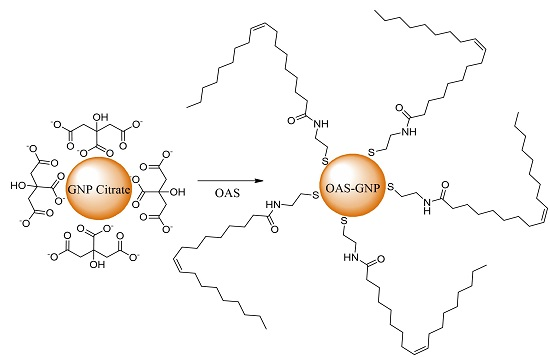
2.3. Preparation of GNP and SNP

Solutions of GNP were prepared in accordance with the Frens method [18]. Briefly, HAuCl4 0.01% by weight (Solution I) and Na3-citrate 1% by weight (Solution II) were prepared. Ten milliliters of Solution I were heated to the boiling point, after which 0.2 mL of Solution II were added. After about 25 s, the solution turned faintly blue. Approximately 70 s after, the blue color suddenly changed into a brilliant red, indicating the formation of spherical particles [18]. Reduction of gold chloride was left to complete for 10 min at the boiling point.
Solutions of SNP were prepared at 60 °C by adding 100 mmol of sodium borohydride into a well-stirred solution (90 mL) containing 0.2 mmol of silver nitrate and 0.5 mmol of sodium citrate. The silver solution was allowed to react at 60 °C while being stirred for a minimum of 2 h observing a yellow color. This was to enable the completion of the formation of nanoparticles. Then, silver particle growth was carried out by adding 200 mmol of hydroxylamine hydrochloride to the silver solution followed by the addition of 0.7 mL of 0.1 M AgNO3, all while stirring. The growing silver nanoparticles changed the color of the solution into a darker yellow or orange depending on the amount of additional AgNO3 [19].

2.4. Aqueous-Organic Phase Transfer of GNP and SNP

The GNP and SNP aqueous-organic phase transfer were carried out using the OAS molecule. Briefly, 2 mL of the as-synthesized GNP or SNP in aqueous solution were mixed with one volume of methanol solution containing the OAS (0.354 mmol). The mixture was vigorously stirred until there was the formation of an emulsion and left to react for 1 h at room temperature. Then, 2 mL of DCM and 1 mL of methanol were added sequentially, and the solution was vigorously stirred until GNP or SNP began the transference into the organic phase, as seen with the naked eye. After complete transference of GNP or SNP to the organic phase, both were separated from the aqueous phase by decantation.

2.5. Characterization

The structures of the OA and the derivatives were confirmed by FT-IR spectrometer spectrum (Perkin Elmer, Llantrisant, UK). For FT-IR measurements, the sample was placed directly onto ATR crystal, and the spectrum was collected in a range between 4000 and 500 cm−1 with a resolution of 4 cm−1 (16 scans per sample). NMR studies of OAS were obtained with the Bruker Avance 400 spectrometer. 1H and 13C NMR conditions were 400 and 100 MHz, respectively. Other parameters were 25 °C, ppm, CDCl3, Me4Si. Assignment of all representative signals was carried by using Mestrenova software (Version 6.0, Mestrelab Research, Santiago de Compostela, Spain). The morphologies of GNP and SNP were observed by scanning transmission electron microscopy (STEM) through a field emission scanning electron microscope (JEOL JSM-7800F, Pleasanton, CA, USA). Samples of nanoparticles were prepared through their immobilization onto carbon-coated 400-mesh copper grids (Ted Pella Inc., Redding, CA, USA). Nanoparticle size distributions were measured using the measurement tools of software ImageJ (1.51 J version) by analyzing at least 200 particles. UV–vis absorption spectra for nanoparticle samples in both phases were collected with a UV-6300PC spectrophotometer (VWR, Radnor, PA, USA).

3. Results

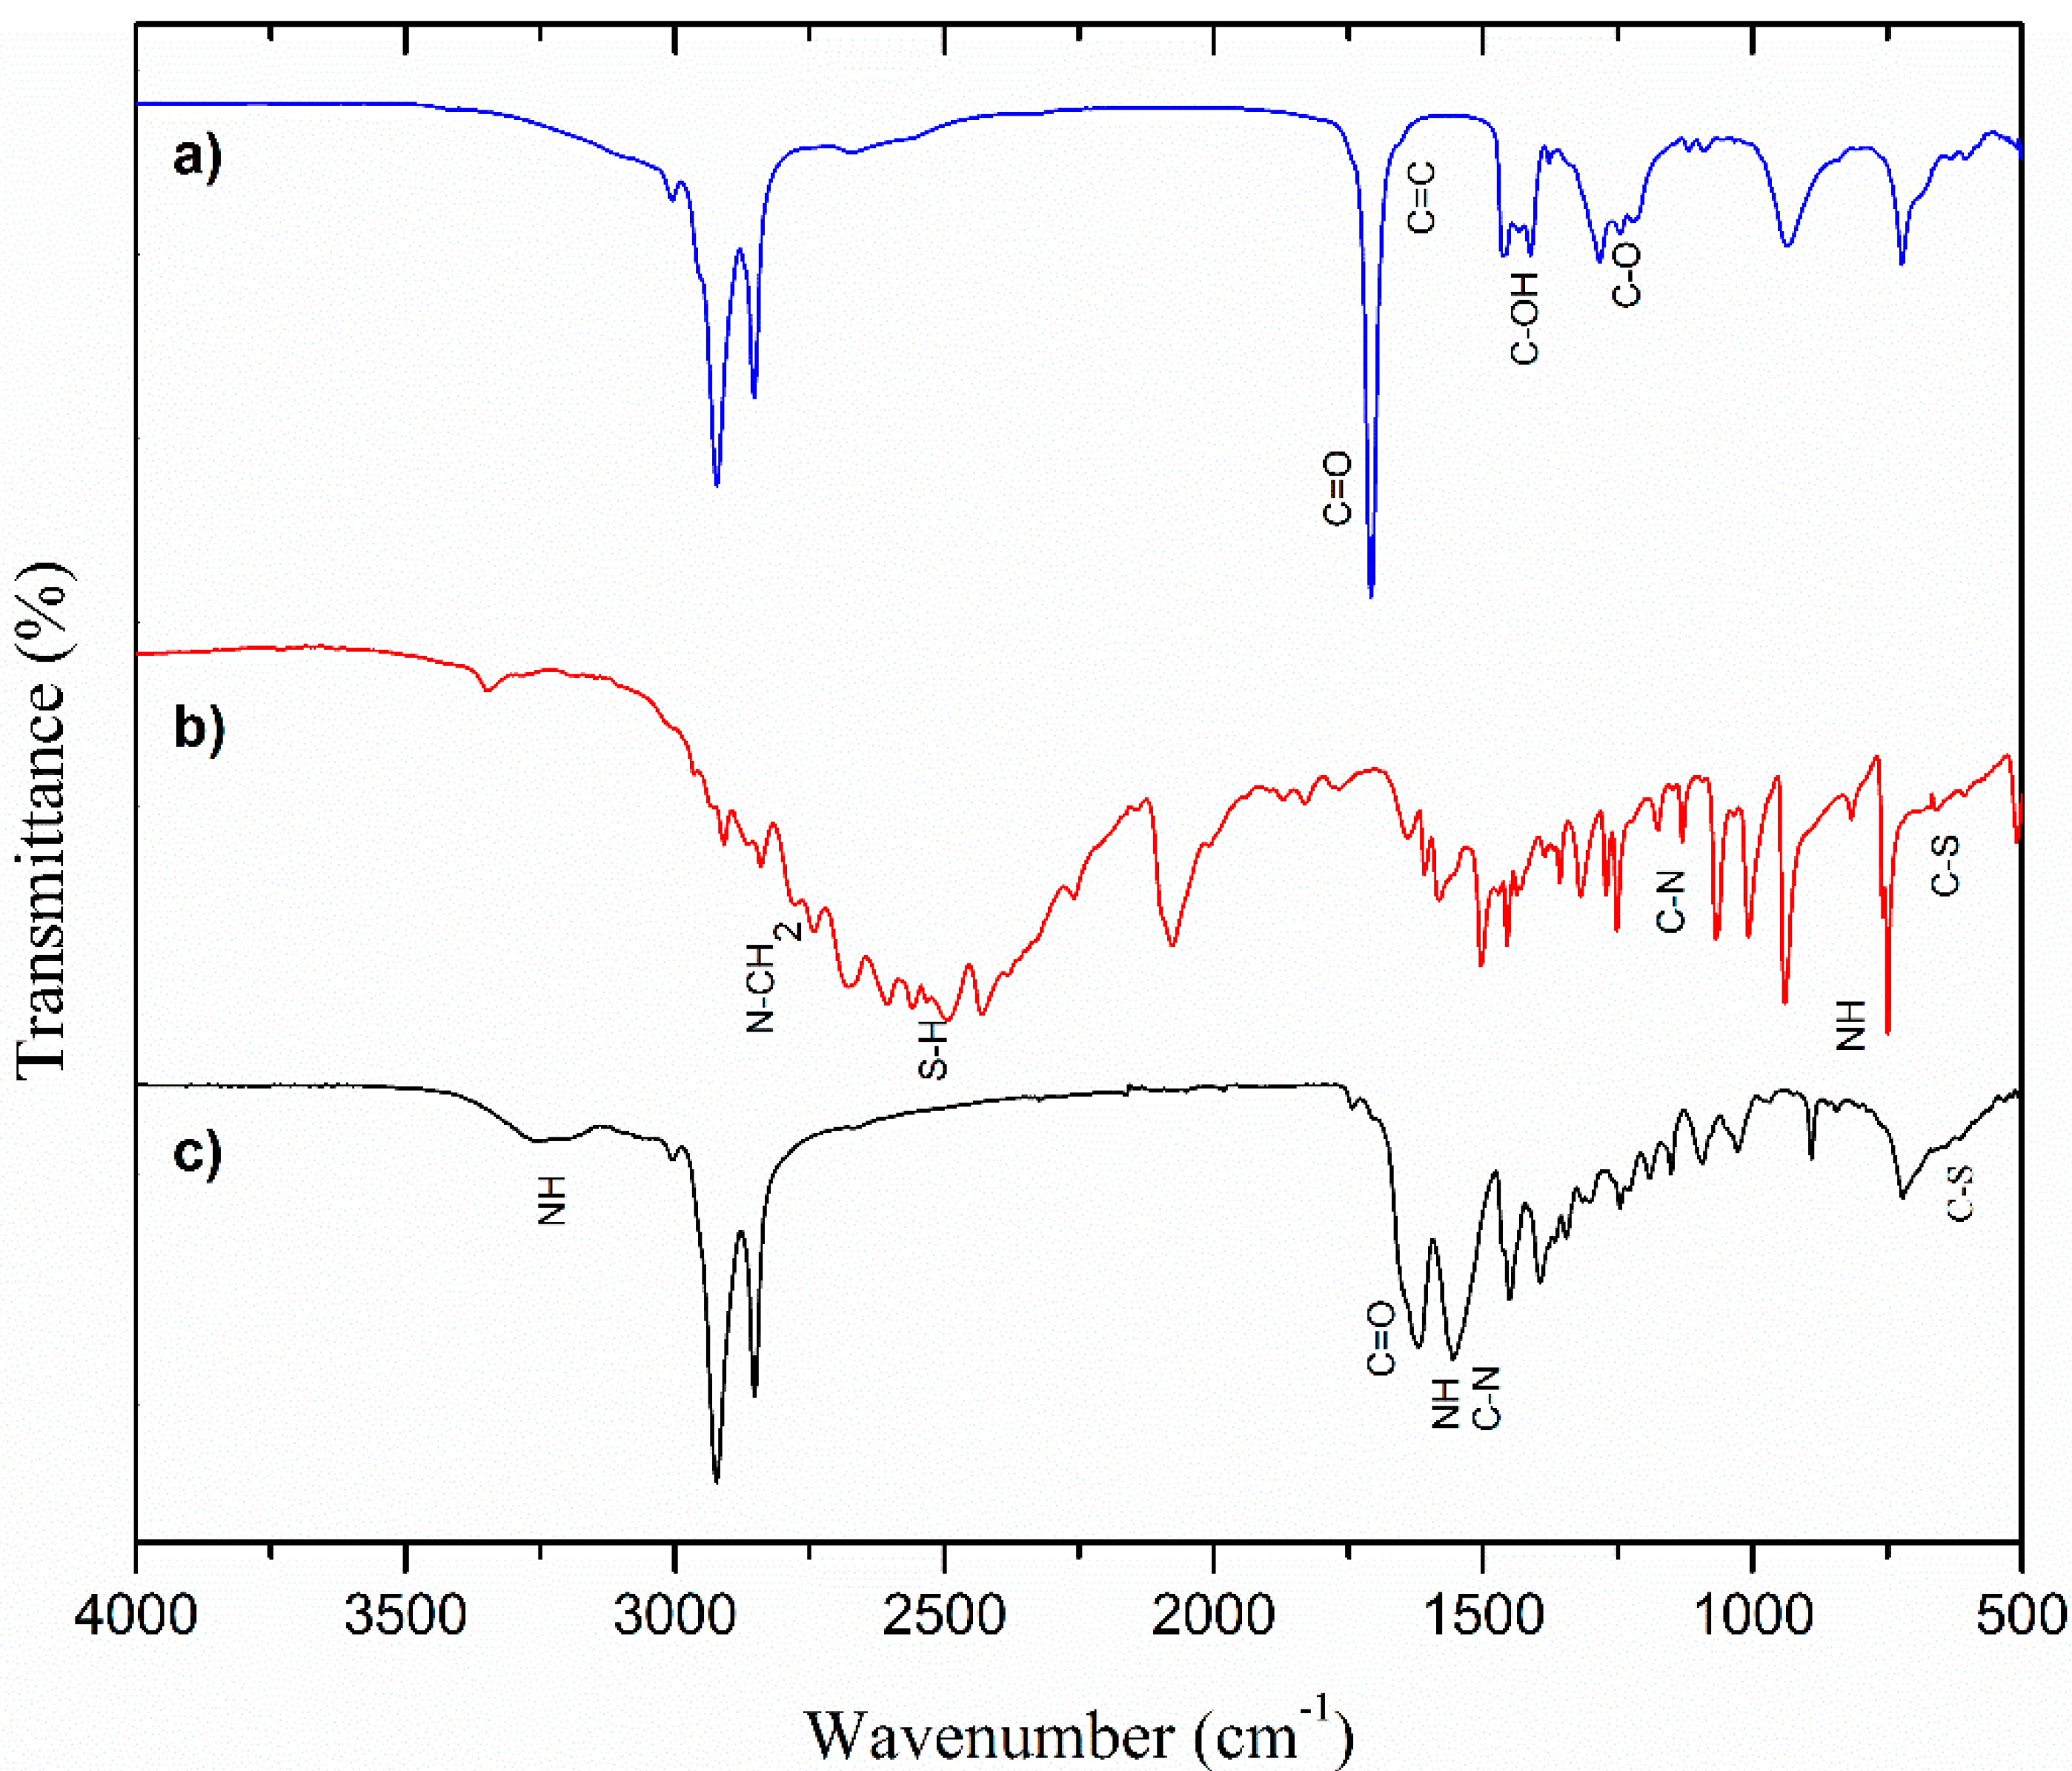
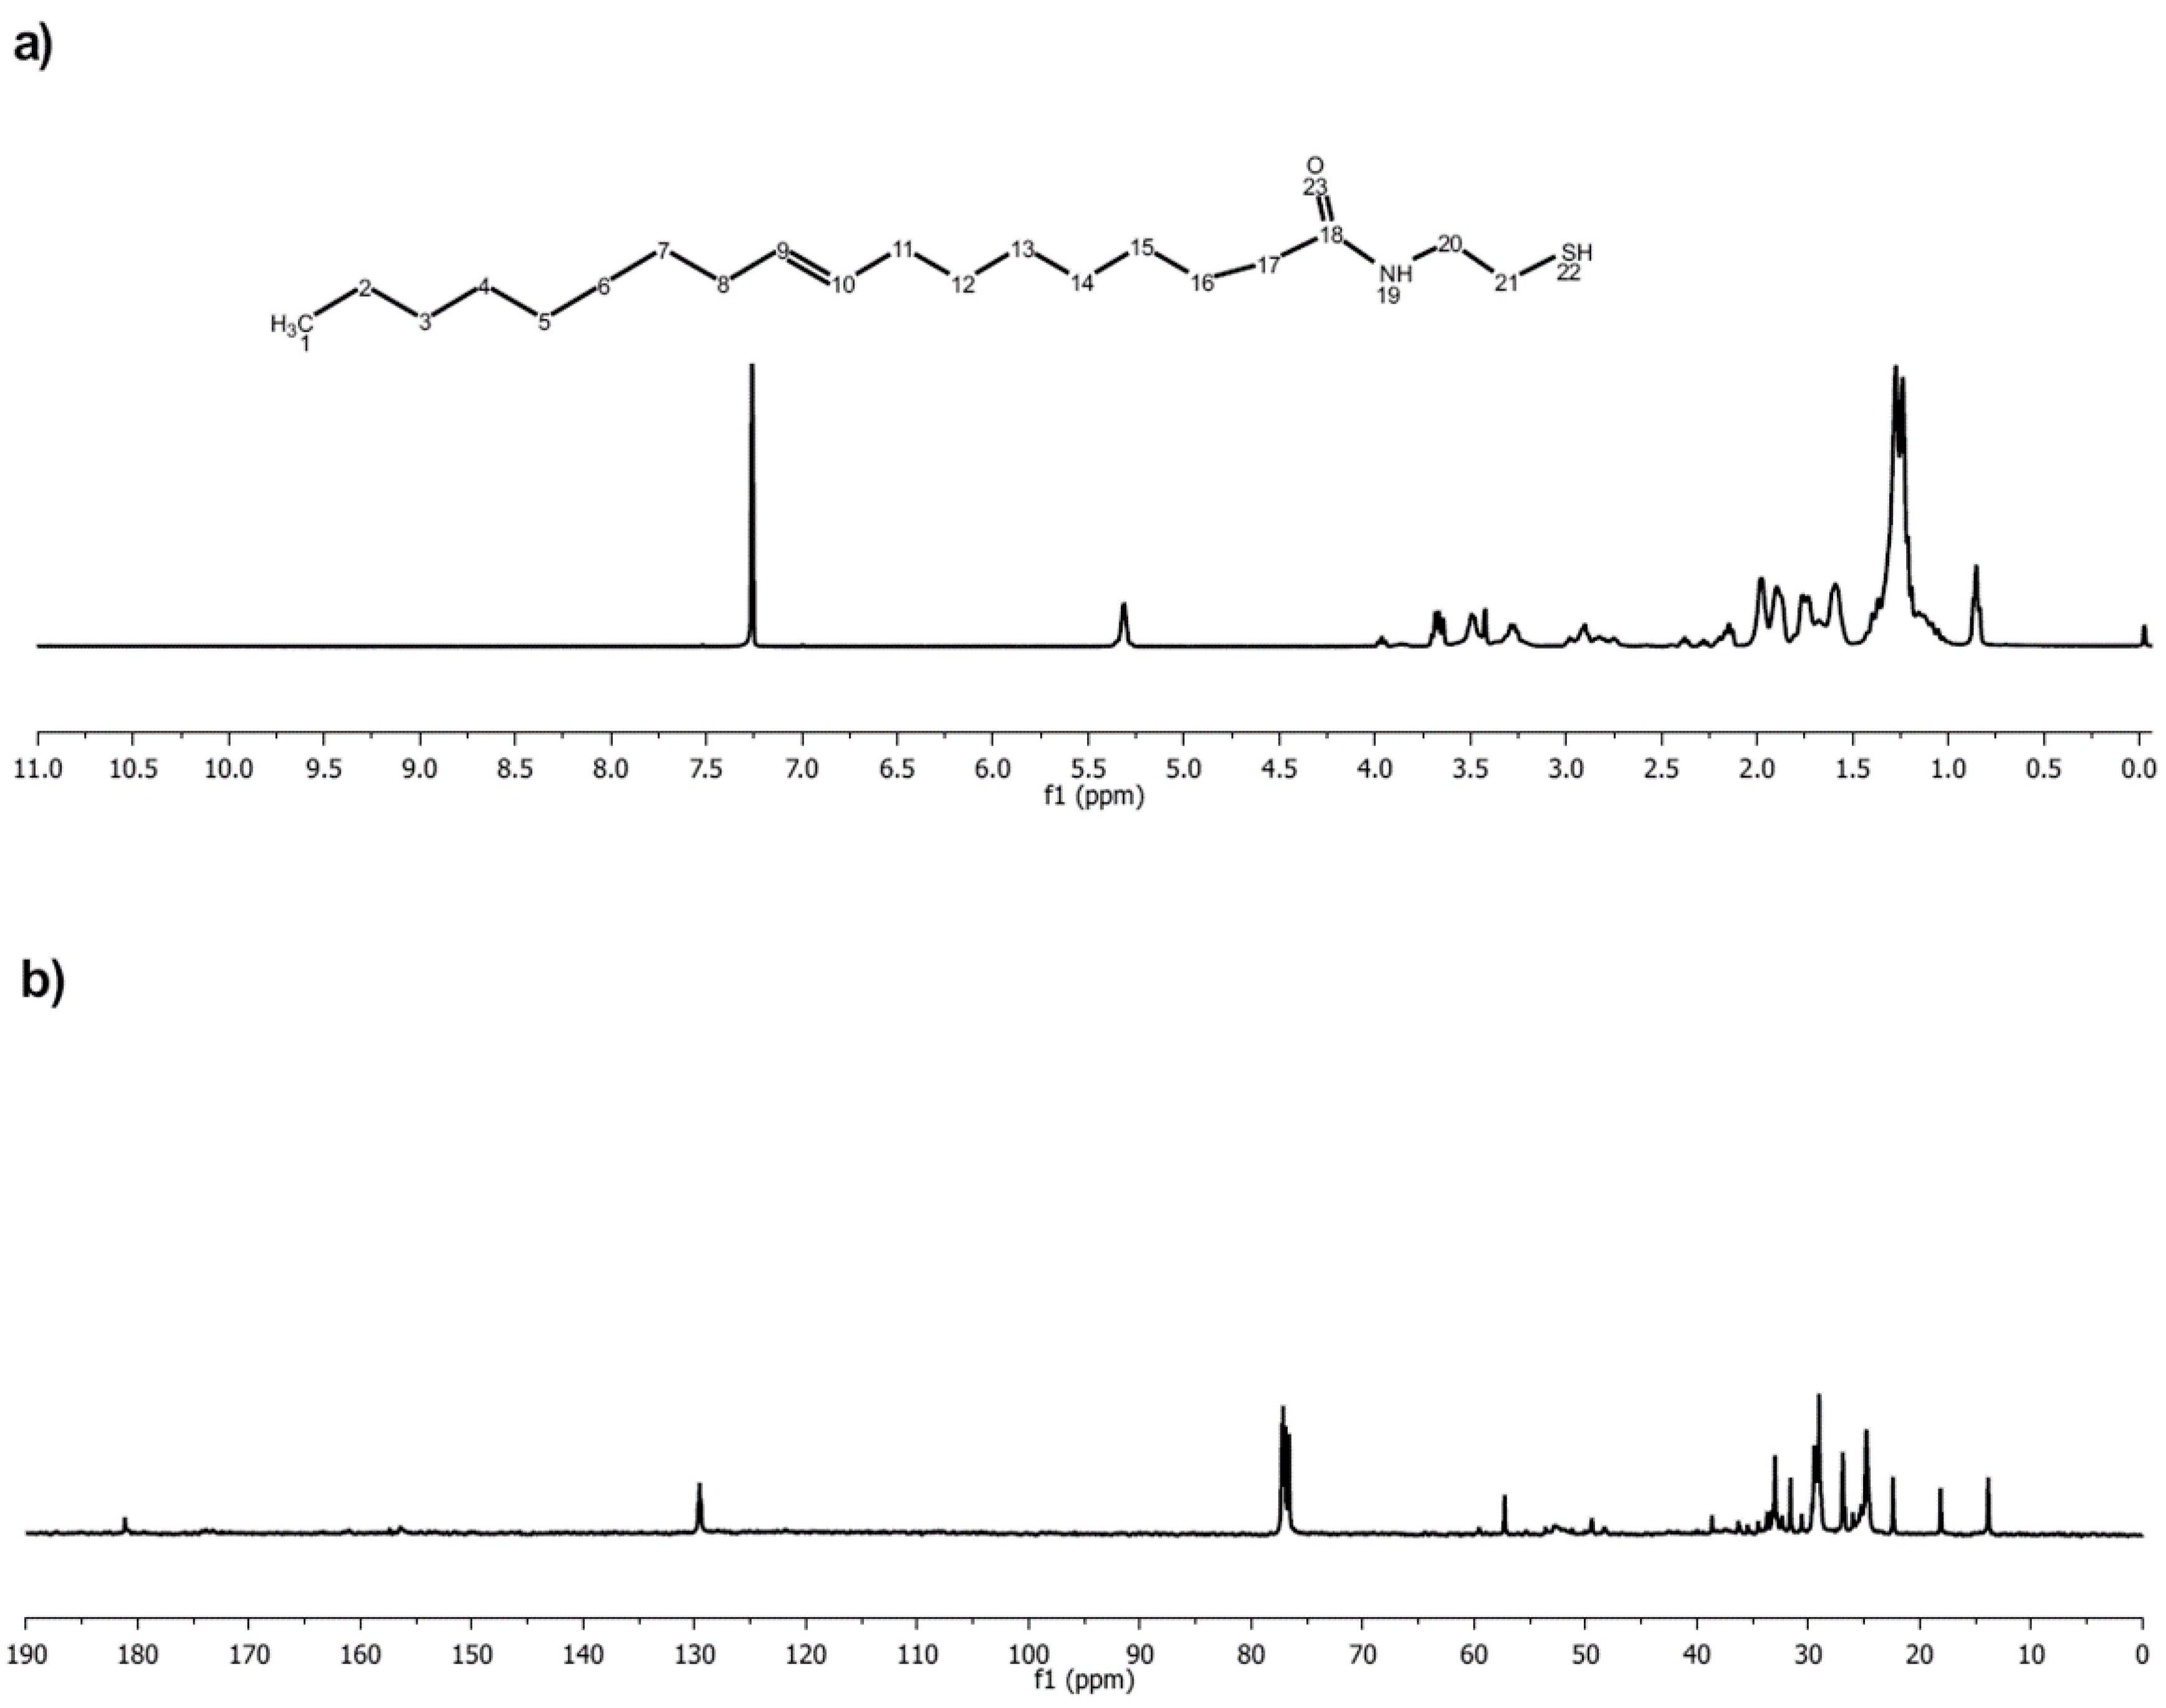
3.1. Preparation of Thiol Terminated Oleic Acid (OAS)

Infrared spectra were recorded for OA and thiol-terminated oleic acid (OAS). Figure 2 show the infrared transmission spectrum of (a) OA; (b) 2-aminoethanethiol; and (c) OAS. The IR spectra of OA and OAS indicate that the 2-aminoethanethiol is indeed part of the composite. In the infrared transmission spectrum of pure oleic acid, the infrared band at 1707 cm−1 is related to C=O stretching mode. Generally, COOH groups involve hydrogen bonding at higher concentrations to form the dimeric COOH species. Upon hydrogen bonding, the band location for the C=O stretching mode involving the monomeric COOH species shifts to a lower wavenumber due to the perturbation of the vibrational mode. The weak shoulder at 1656 and 1245 cm−1 can be attributed to the C=C stretching mode for oleic acid and C–O stretching, respectively. Finally, the infrared band at 1434 cm−1 is related to C–OH in-plane bending [20,21]. For the infrared analysis of 2-amoniethanethiol, the infrared band at 2780 cm−1 is related to N–CH2 stretching. IR bands at 1131, 1150, and 1175 cm−1 are ascribed to aliphatic C–N stretching, the IR bands at 750 and 758 cm−1 are attributed to NH wagging and twisting, and the 660 IR band is associated with C–S stretching. Finally, the IR band at 2494 is attributed to S–H stretching [20]. In the infrared transmission spectrum of OAS, the infrared band at 3260 cm−1 is attributed to secondary amide N–H stretching. The 1650 cm−1 band is attributed to secondary amide C=O stretching, and 1556 cm−1 can be attributed to secondary amide N–H bending and C–N stretching. Finally, the infrared band at 642 cm−1 is related to C–S stretching. As is presented, OA modification to obtain OAS was carried out successfully due to the disappearance of the 2780 cm−1 band related to N–CH2 stretching and the consequent appearance of one band at 1556 cm−1, which can be attributed to secondary amide N–H bending and C–N stretching.
The resulting signals for NMR 1H and NMR 13C for OAS are presented in Figure 3. Move it down. Signals for 1H NMR –CH2SH and –N–CH2 were found at δH = 2.90 (2H, s, H-21) and 3.41–3.66 (2H, d, H-20). While signals for equivalent methylene protons CH=CH– were found at δH = 5.31 (1H, s, H-9 and H-10), signals for alkylic protons of oleic acid chain are at δH = 0.99–1.5 (22H, m, H2-7, H12-15) and δH = 1.5–1.75 (6H, m, H-15 and H-16). Finally, protons –CH2– were found at δH = 1.75–2.0 (6H, m, H-8, H-11 and H-17). Mercapto proton signal was found overlapped δH = 1.21 (1H, s, H-22), terminal –CH3 was found at δH = 0.85 (2H, s, H-1) (Figure 3a). The corresponding signals for 13C NMR, shown in Figure 3b, are CH2–SH (26.92, C-21), NH–CH2– (57.28, C20), –CH2C=O (38.65, C17), NHC=O (180.26, C18), –CH2– (22.40, C2), –CH2–(24.79, C16), –CH2– (28.86, C6 and C13), –CH2– (29.03, C15), –CH2– (29.24, C5 and C14), –CH2– (29.35, C4), –CH2– (29.48, C7 and C12), –CH2– (31.61, C8 and C11), –CH2– (33.0, C3), –CH=CH– (129.67, C9 and C10). The NMR show a unique signal pattern, corresponding to a chemically pure compound.

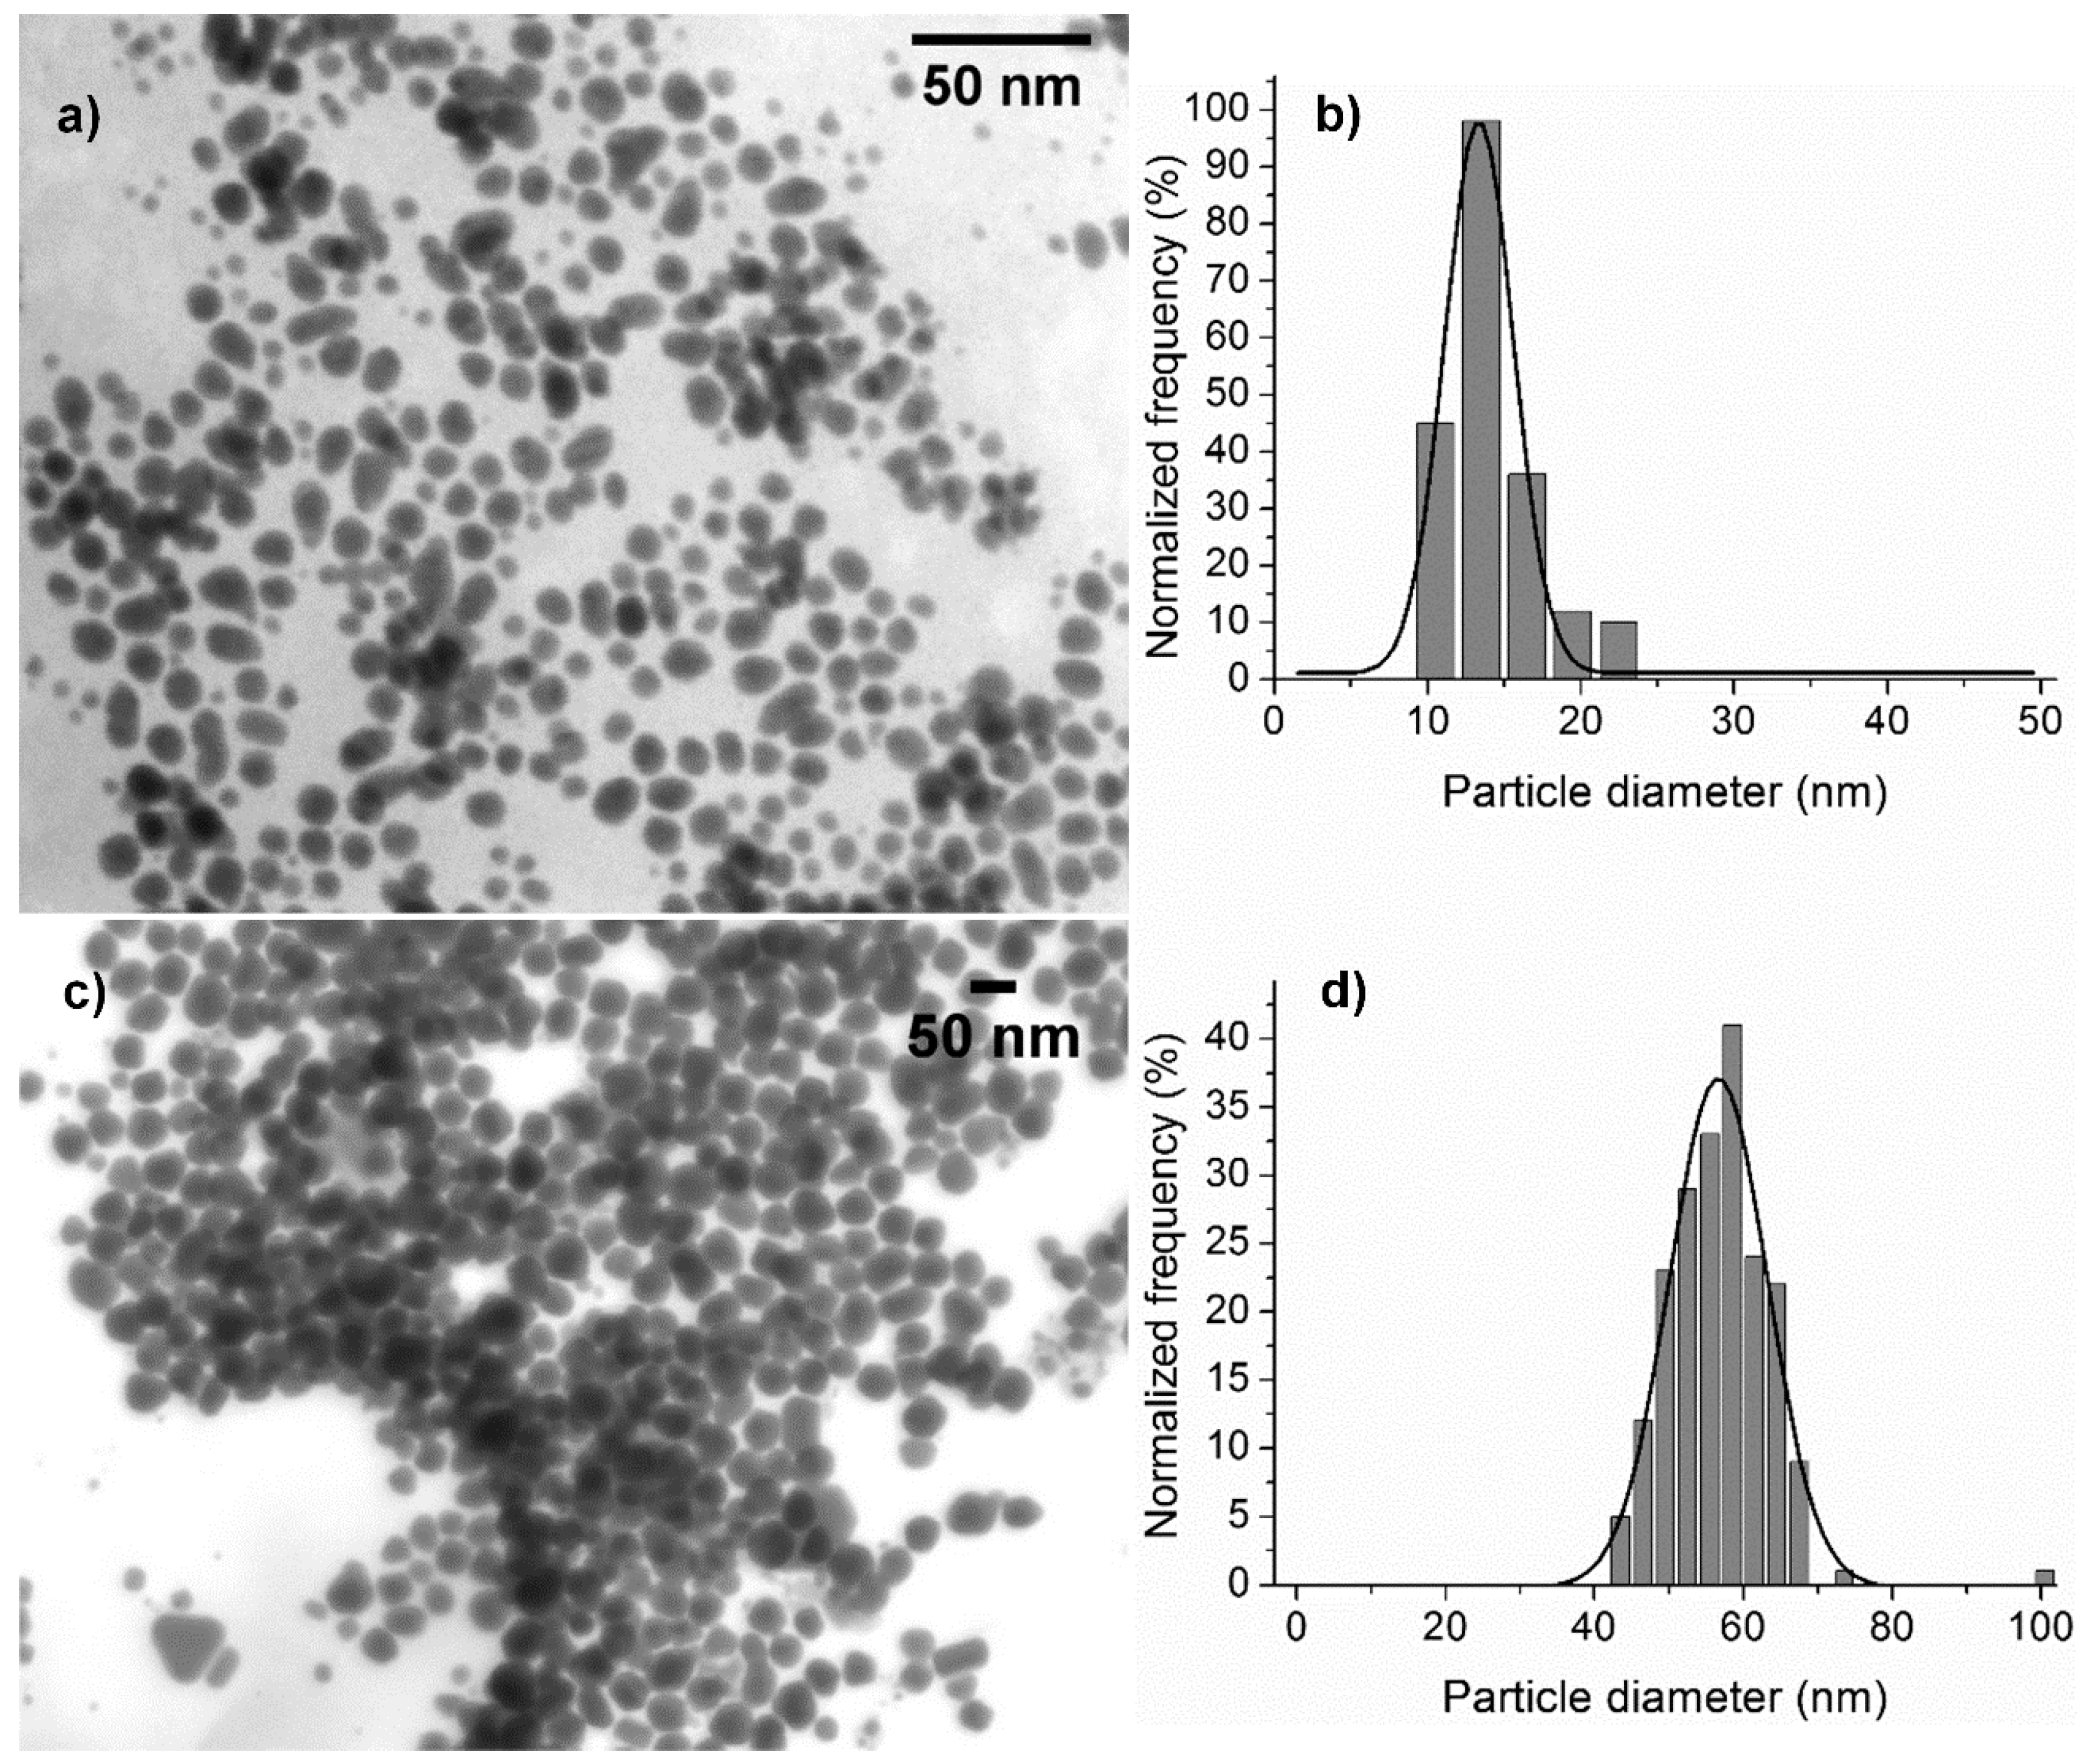
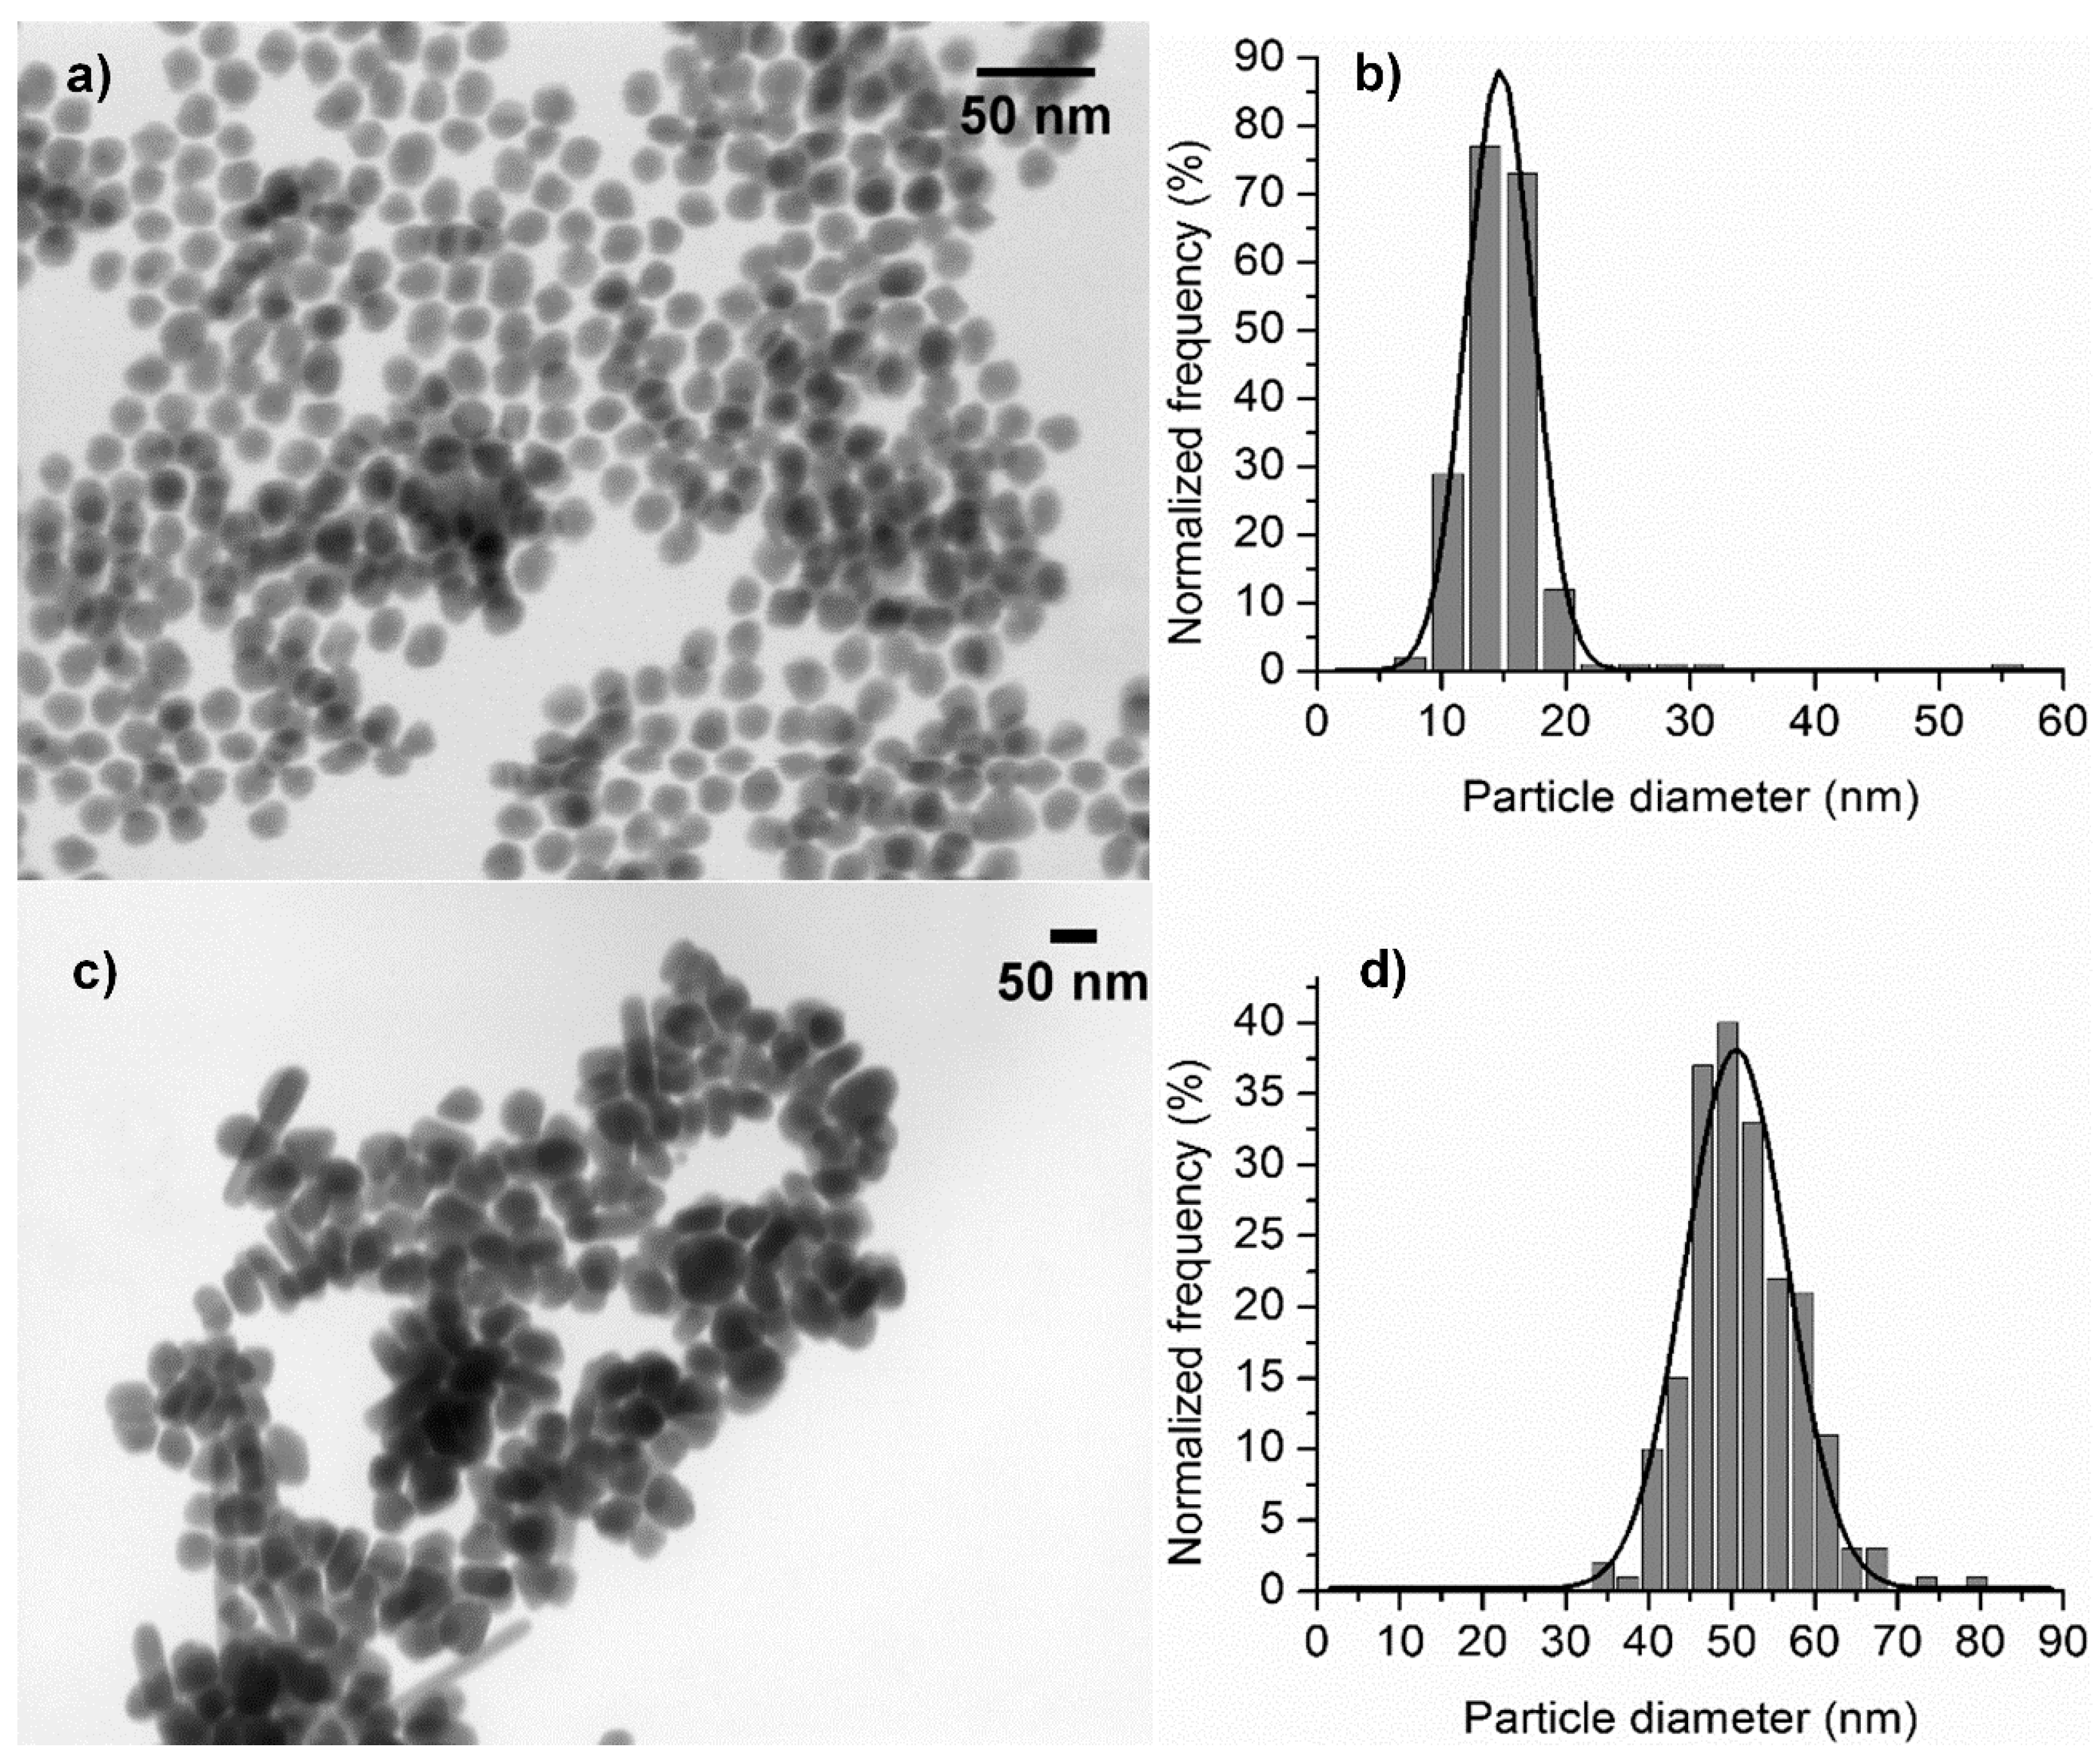
3.2. Synthesis of Gold and Silver Nanoparticles

Gold nanoparticles (GNP) resulted in spherical morphology, evaluated by scanning transmission electron microscopy (STEM) (Figure 4a). GNP presented good dispersion in an aqueous solution and displayed a small particle size of 13 ± 2 nm when assessed by the particle size distribution histogram presented in Figure 4b. The solid line in that figure is a Gaussian fit to the data. The reaction temperature from 100 °C left a smaller particle size distribution and uniform morphologies [1]. Zhao and Friedrich reported that uniform spherical gold nanoparticles of around 10, 25, and 50 nm were produced through the same method [1].
Silver nanoparticles (SNP) presented mostly spherical morphology, but with the presence of few rods, as could be seen in the STEM micrograph shown in Figure 4c. SNP presented good dispersion in aqueous solution and small particle sizes of 57 ± 7 nm when evaluated by the particle size distribution histogram shown in Figure 4d. The solid line in the figure is a Gaussian fit to the data. Similar nanoparticle sizes were reported by Prevo et al. [19], who used the same method. These silver particles can be used as a nucleation center for additional growth by adding more silver nitrate and hydroxylamine hydrochloride. A direct increase in the absorbance at the 400 nm peak, related with the surface plasmon resonance of silver nanoparticles, by increasing the silver nitrate concentration, is reported in the literature [19].

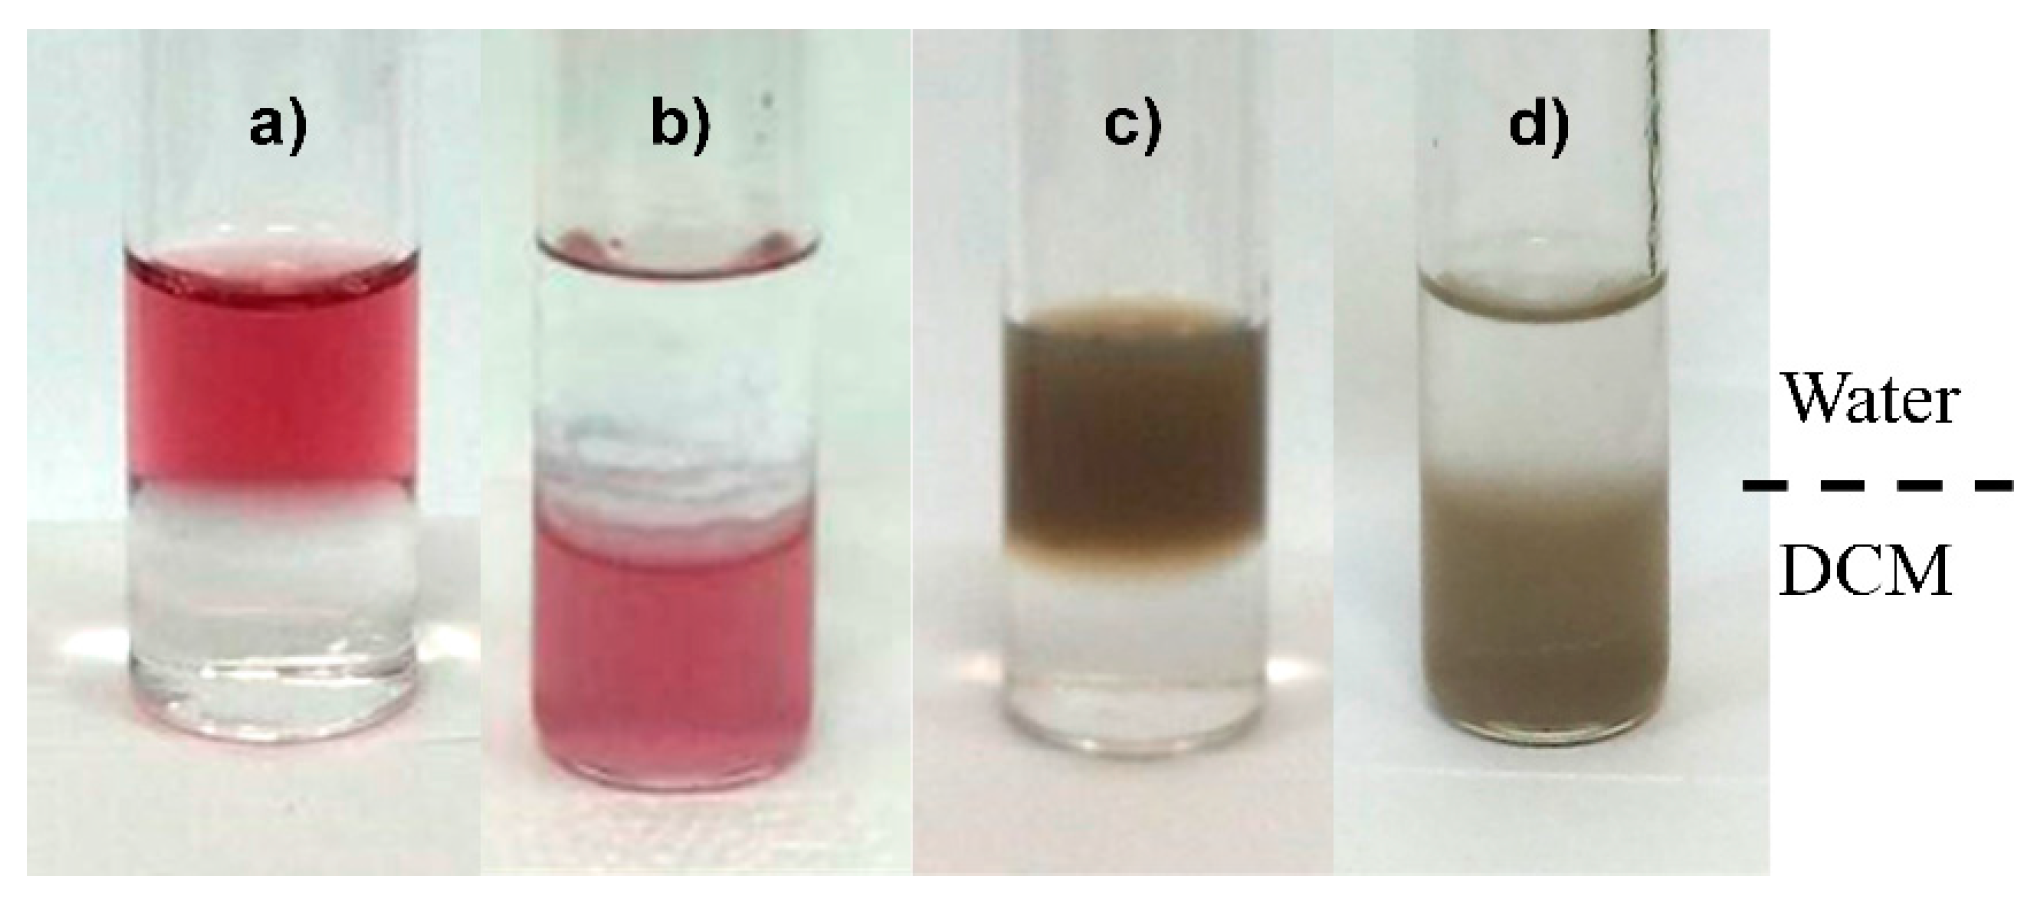
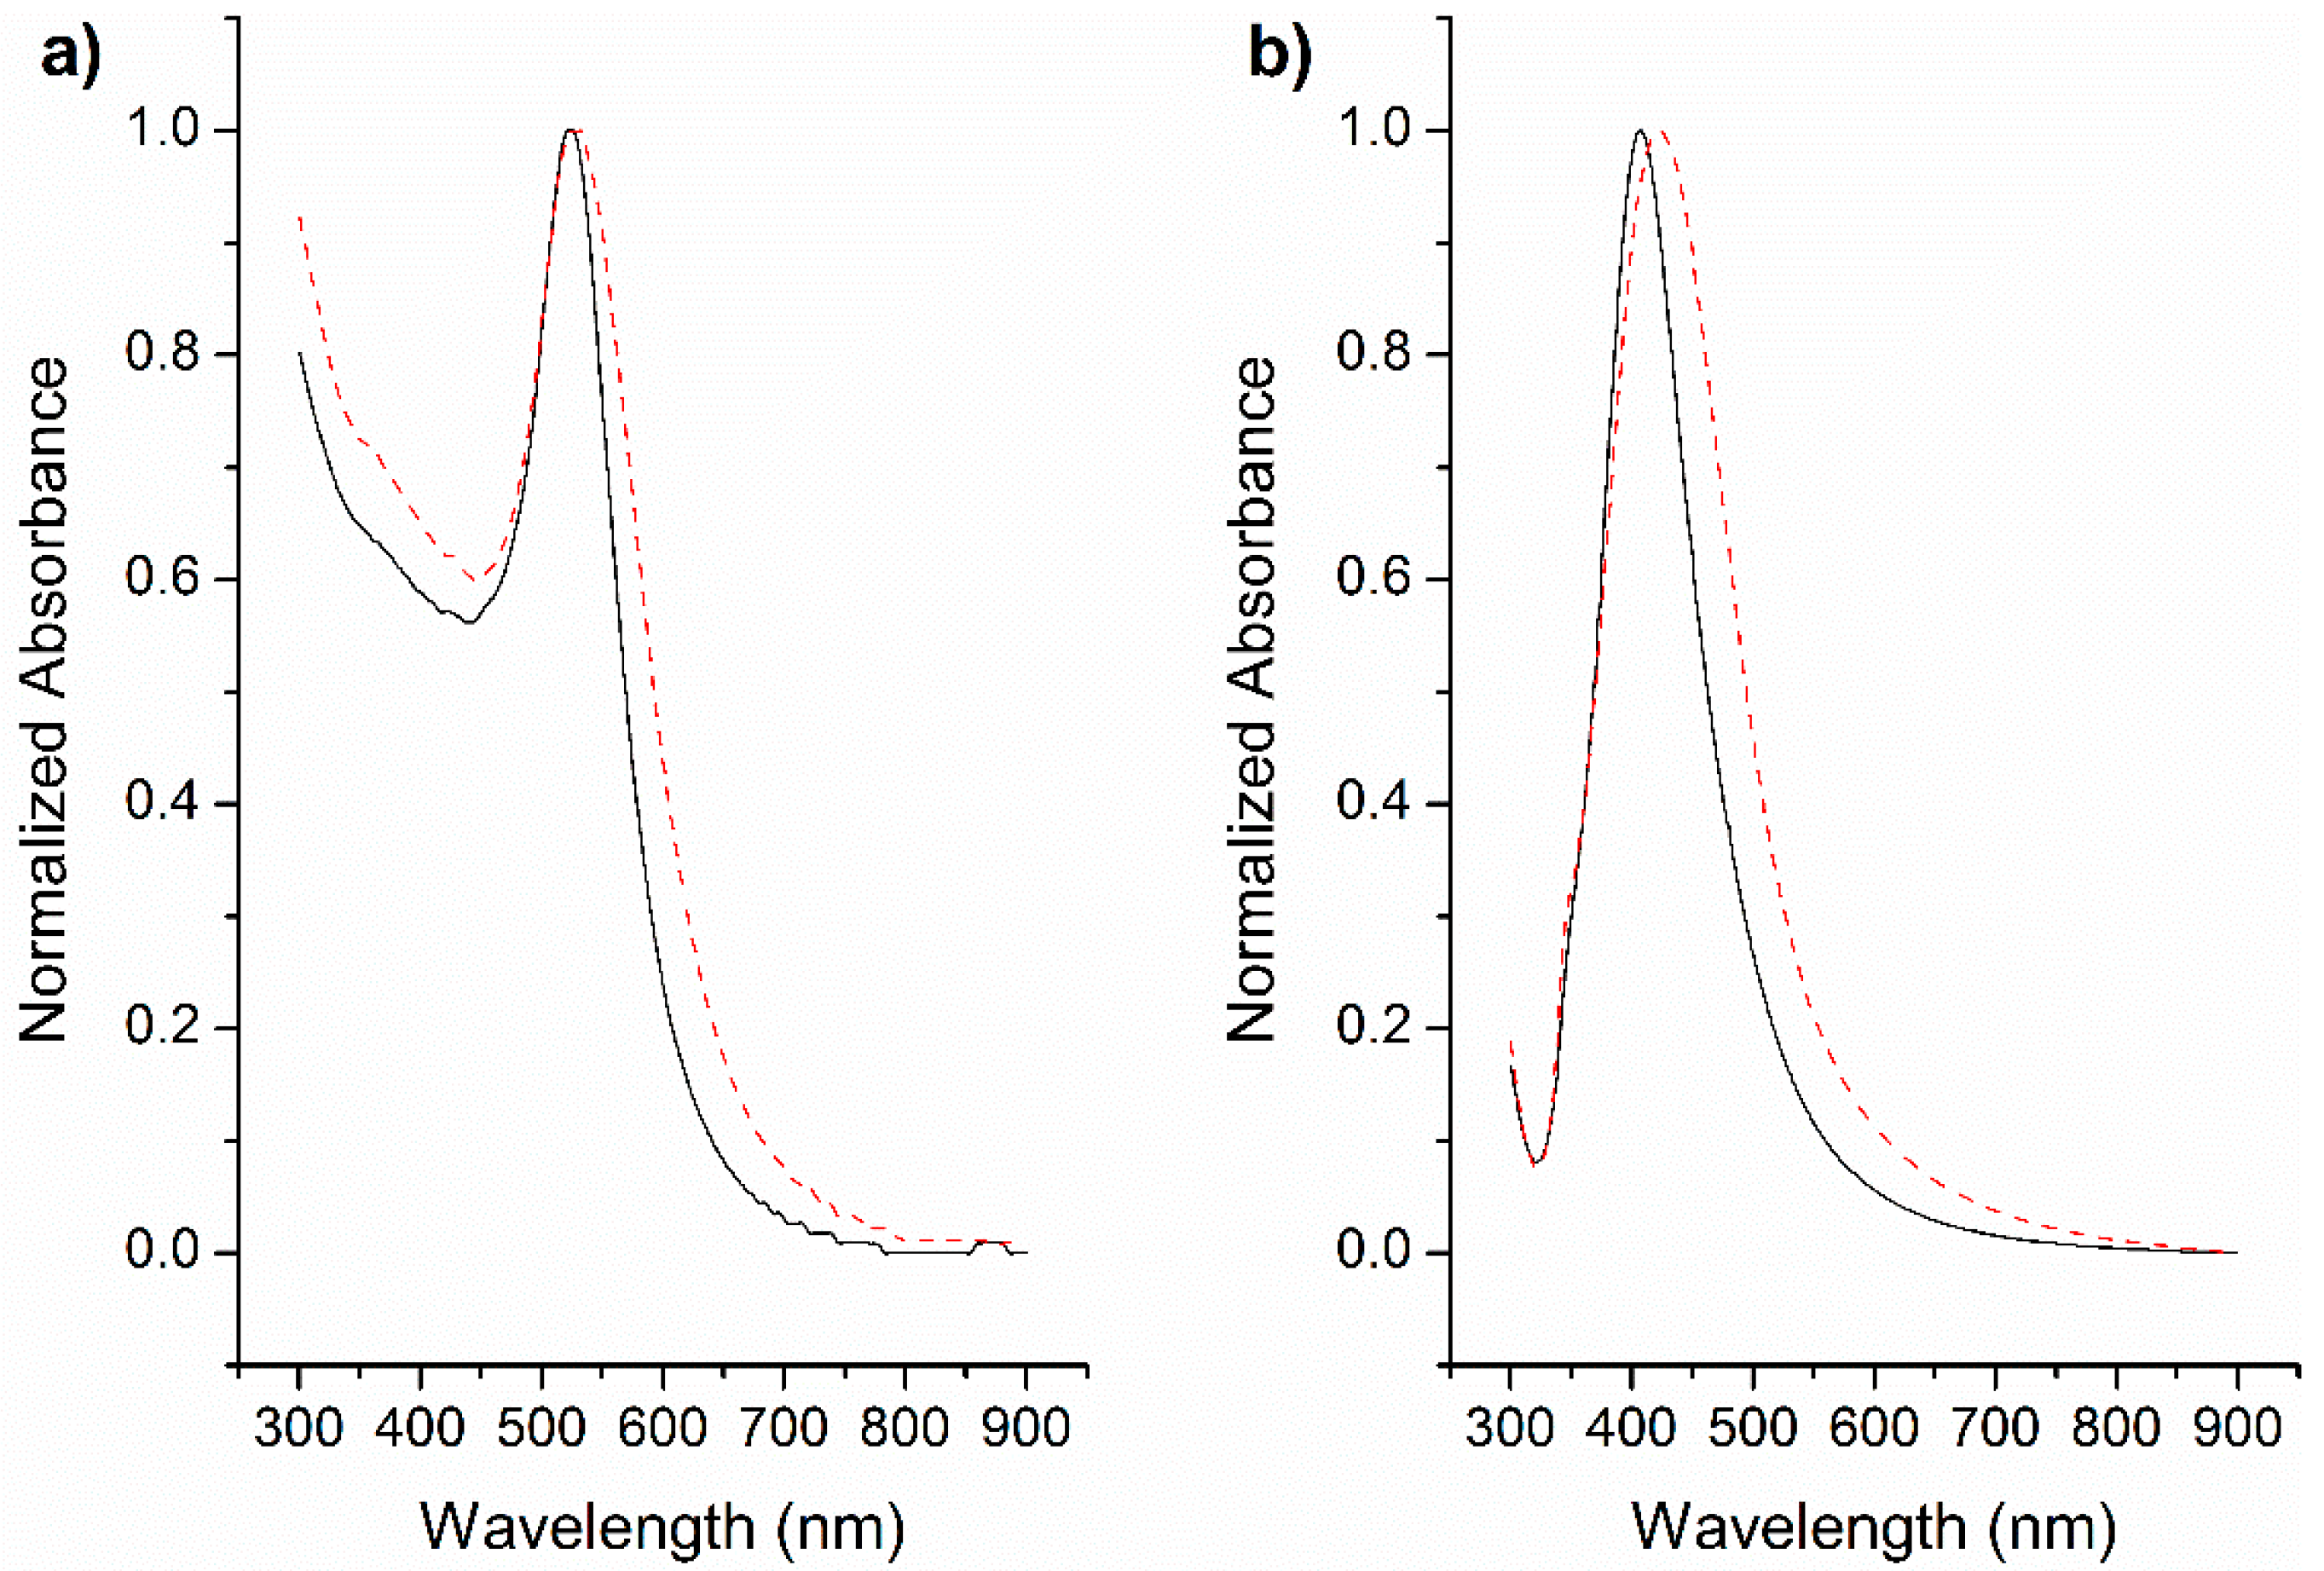
3.3. Aqueous-Organic Phase Transfer of GNP and SNP

Aqueous solutions of GNP and SNP were transferred to the solvent dichloromethane (DCM) by using OAS ligand. Solutions containing the nanoparticles were mixed with OAS, forming an emulsion. The emulsion was then broken by the sequential addition of DCM and methanol to allow for phase transfer. After a few minutes, the particles were effectively transferred from water to DCM, as can be seen in Figure 5. The metallic particle phase transfer was carried out by ligand exchange, where the thiol from OAS is bound to the particle surface. Thiol groups have shown the highest affinity to noble metal surfaces, particularly to gold. This coupling has been called chemisorption and has been noted as a covalent bond, while the exact processes and the microscopic nature are still subject to research and discussion [13,22].
Figure 6 shows the absorption spectrum of GNP and SNP in aqueous solution and in DCM. Ultraviolet–visible (UV–vis) adsorption spectra documented that the maximum absorption peak of GNP was around 525 nm and around 407 nm for SNP in aqueous solutions. The optical properties such as absorption maxima and absorption intensity are particle-size-dependent [23]. An intense absorption peak at 525 nm is generally attributed to the surface plasmon excitation of small spherical gold particles, which, according to Mie theory for metal nanoparticles, represents a spherical shape and small particle diameter size [24]. The absorption spectrum of GNP and SNP in organic solvents are also shown in Figure 6. After phase transfer, the vanishing of the plasmon signal for GNP and SNP indicates a great transference, around 100%, to the organic phase (results not shown). Methanol is an intermediary solvent to obtain the phase transfer of nanoparticles. According to Alkilany et al. [25], methanol can induce a full phase transfer, as well as help in the concentration of nanoparticles in the DCM solvent. The UV–vis absorption spectra show that the optical properties of nanoparticles are maintained through the transfer process from water to DCM. The surface plasmon resonance red shift observed in both normalized UV–vis spectra, for gold and silver nanoparticles (Figure 6), could be due to the modification in refractive index of the media.
The GNP and SNP aqueous-organic phase transfer was performed using the OAS molecule. The morphology of GNP and SNP, analyzed by scanning transmission electron microscopy (STEM), was maintained spherical, as is shown in Figure 7a,c, respectively. The histogram of the particle diameters are plotted in Figure 7b,d, for GNP and SNP, respectively. The solid lines on those figures are a Gaussian fit to the data, leading to the diameter sizes of 15 ± 3 nm and 50 ± 6 nm for GNP and SNP, respectively, indicating that the particle size is maintained in the phase transfer process. Besides, nanoparticles presented good stability in the organic solvent for several days without precipitation occurring. The metallic nanoparticles dispersed in the non-polar solvent could be transferred again into a polar solvent by using α-cyclodextrin in the polar phase and stirring, according to literature protocols [11,26].

4. Conclusions

The capacity of a newly synthesized ligand based on oleic acid to assist the aqueous–organic phase transfer of gold and silver nanoparticles was demonstrated. The diameter and morphology of the nanoparticles are conserved when using this phase-transfer ligand, as verified by UV–vis spectroscopy, and STEM measurements. The high transfer yields and the straightforward synthesis of this ligand help to achieve several self-assembly processes by modifying oleic acid with different functional groups.

Acknowledgments

Financial assistance from the National Council of Science and Technology of Mexico (CONACYT) is genuinely acknowledged with projects I0007-2013-02 No. 206489 and INFR-2014-01 No. 226208. Financial assistance from the Secretariat of Public Education of Mexico (SEP) with the project UNISON-PTC-222 DSA/103.5/15/7356 is also acknowledged. Reynaldo Esquivel thanks CONACYT for project PDCPN201401-247326. Alejandra López-Millán thanks CONACYT for the Ph.D. scholarship.

Author Contributions

Alejandra López-Millán performed all experiments. Paul Zavala-Rivera, Reynaldo Esquivel, Roberto Carrillo, Enrique Alvarez-Ramos, Ramón Moreno-Corral, and Roberto Guzmán-Zamudio contributed with reagents/materials/analysis tools and discussion for all experiments. Armando Lucero-Acuña conceived and designed the experiments and contributed in the manuscript writing.

Conflicts of Interest

The authors declare no conflict of interest.

References

  1. Jingyue, Z.; Bernd, F. Synthesis of Gold Nanoparticles Via Chemical Reduction Methods. In Proceedings of the Nanocon, Brno, Czech Republic, 14–16 October, 2015; pp. 597–604.
  2. Daniel, M.-C.; Astruc, D. Gold nanoparticles: Assembly, supramolecular chemistry, quantum-size-related properties, and applications toward biology, catalysis, and nanotechnology. Chem. Rev. 2004, 104, 293–346. [Google Scholar] [CrossRef] [PubMed]
  3. Abou El-Nour, K.M.M.; Eftaiha, A.; Al-Warthan, A.; Ammar, R.A.A. Synthesis and applications of silver nanoparticles. Arab. J. Chem. 2010, 3, 135–140. [Google Scholar] [CrossRef]
  4. Wei, L.; Lu, J.; Xu, H.; Patel, A.; Chen, Z.S.; Chen, G. Silver nanoparticles: Synthesis, properties, and therapeutic applications. Drug Discov. Today 2015, 20, 595–601. [Google Scholar] [CrossRef] [PubMed]
  5. Sastry, M.; Ahmad, A.; Khan, M.I.; Kumar, R. Biosynthesis of metal nanoparticles using fungi and actinomycete. Curr. Sci. 2003, 85, 162–170. [Google Scholar]
  6. Zhang, Q.; Lee, J.Y.; Yang, J.; Boothroyd, C.; Zhang, J. Size and composition tunable Ag–Au alloy nanoparticles by replacement reactions. Nanotechnology 2007, 18, 245605. [Google Scholar] [CrossRef]
  7. Yang, J.; Liu, H. Introduction. In Metal-Based Composite Nanomaterials; Springer International Publishing: Cham, Switzerland, 2015; pp. 1–9. [Google Scholar]
  8. Wei, G.; Yang, Z.; Lee, C.; Yang, H.; Wang, C.R.C. Aqueous-Organic Phase Transfer of Gold Nanoparticles and Gold Nanorods Using an Ionic Liquid. J. Am. Chem. Soc. 2004, 126, 5036–5037. [Google Scholar] [CrossRef] [PubMed]
  9. Misra, T.K.; Chen, T.-S.; Liu, C.-Y. Phase transfer of gold nanoparticles from aqueous to organic solution containing resorcinarene. J. Colloid Interface Sci. 2006, 297, 584–588. [Google Scholar] [CrossRef] [PubMed]
  10. Lista, M.; Liu, D.Z.; Mulvaney, P. Phase Transfer of Noble Metal Nanoparticles to Organic Solvents. Langmuir 2014, 30, 1932–1938. [Google Scholar] [CrossRef] [PubMed]
  11. Lala, N.; Lalbegi, S.P.; Adyanthaya, S.D.; Sastry, M. Phase transfer of aqueous gold colloidal particles capped with inclusion complexes of cyclodextrin and alkanethiol molecules into chloroform. Langmuir 2002, 17, 3766–3768. [Google Scholar] [CrossRef]
  12. Yang, J.; Yang, J.; Ying, J.Y.; Lee, J.Y. Phase transfer and its applications in nanotechnology. Chem. Soc. Rev. 2011, 40, 1672–1696. [Google Scholar] [CrossRef] [PubMed]
  13. Sperling, R.A.; Parak, W.J. Surface modification, functionalization and bioconjugation of colloidal inorganic nanoparticles. Phil. Trans. R. Soc. A 2010, 368, 1333–1383. [Google Scholar] [CrossRef] [PubMed]
  14. Anwar, M.; Asfer, M.; Akhter, S.; Mohapatra, S.; Warsi, M.H.; Jain, N.; Mallick, N.; Jain, G.K.; Ali, A.; Panigrahi, P.K.; et al. Aqueous phase transfer of oleic acid coated iron oxide nanoparticles: Influence of solvents and surfactants on stability and pharmaceutical applications of ferrofluid. Magnetohydrodynamics 2013, 49, 339–343. [Google Scholar]
  15. Bala, T.; Swami, A.; Prasad, B.L.V; Sastry, M. Phase transfer of oleic acid capped NicoreAgshell nanoparticles assisted by the flexibility of oleic acid on the surface of silver. J. Colloid Interface Sci. 2005, 283, 422–431. [Google Scholar] [CrossRef] [PubMed]
  16. De La Presa, P.; Multigner, M.; De La Venta, J.; García, M.A.; Ruiz-González, M.L. Structural and magnetic characterization of oleic acid and oleylamine-capped gold nanoparticles. J. Appl. Phys. 2006, 100, 123915. [Google Scholar] [CrossRef]
  17. Hermanson, G.T. Bioconjugate Techniques; Elsevier: Amsterdam, The Netherlands, 2013. [Google Scholar]
  18. Frens, G. Controlled Nucleation for the Regulation of the Particle Size in Monodisperse Gold Suspensions. Nat. Phys. Sci. 1973, 241, 20–22. [Google Scholar] [CrossRef]
  19. Prevo, B.G.; Esakoff, S.A.; Mikhailovsky, A.; Zasadzinski, J.A. Scalable routes to gold nanoshells with tunable sizes and response to near-infrared pulsed-laser irradiation. Small 2008, 4, 1183–1195. [Google Scholar] [CrossRef] [PubMed]
  20. Stuart, B.H. Infrared Spectroscopy: Fundamentals and Applications; Wiley: Toronto, ON, Canada, 2004; Volume 8. [Google Scholar]
  21. Lee, D.H.; Condrate, R. A FTIR spectral characterization of thin film coatings of oleic acid on glasses: I. Coatings on glasses from ethyl alcohol. J. Mater. Sci. 1999, 34, 139–146. [Google Scholar] [CrossRef]
  22. Love, J.C.; Estroff, L.A; Kriebel, J.K.; Nuzzo, R.G.; Whitesides, G.M. Self-assembled monolayers of thiolates on metals as a form of nanotechnology. Chem. Rev. 2005, 105, 1103–1170. [Google Scholar] [CrossRef] [PubMed]
  23. Huang, X.; El-Sayed, M.A. Gold nanoparticles: Optical properties and implementations in cancer diagnosis and photothermal therapy. J. Adv. Res. 2010, 1, 13–28. [Google Scholar] [CrossRef]
  24. Jain, P.K.; ElSayed, I.H.; El-Sayed, M.A. Au nanoparticles target cancer. Nano Today 2007, 2, 18–29. [Google Scholar] [CrossRef]
  25. Alkilany, A.M.; Yaseen, A.I. B.; Park, J.; Eller, J.R.; Murphy, C.J. Facile phase transfer of gold nanoparticles from aqueous solution to organic solvents with thiolated poly(ethylene glycol). RSC Adv. 2014, 4, 52676–52679. [Google Scholar] [CrossRef]
  26. Wang, Y.; Wong, J.F.; Teng, X.; Lin, X.Z.; Yang, H. “Pulling” Nanoparticles into Water: Phase Transfer of Oleic Acid Stabilized Monodisperse Nanoparticles into Aqueous Solutions of α-Cyclodextrin. Nano Lett. 2003, 3, 1555–1559. [Google Scholar] [CrossRef]
Figure 1. Schematic representation of OA modification to obtain the thiol-termination ligand (OAS).
Applsci 07 00273 g001
Figure 2. FT-IR spectra of (a) OA; (b) 2-aminoethanethiol; and (c) OAS.
Applsci 07 00273 g002
Figure 3. (a) 1H NMR spectrum of OAS in CDCl3; (b) 13C NMR spectrum of OAS in CDCl3.
Applsci 07 00273 g003
Figure 4. Scanning transmission electron micrographs of nanoparticles in water. (a) GNP; (b) Particle size distribution histogram of the GNP imaged in the STEM picture (Figure 4a); (c) SNP; (d) Particle size distribution histogram of the SNP imaged in the STEM picture (Figure 4c). The solid lines in Figure 4b,d are a Gaussian fit to the data.
Applsci 07 00273 g004
Figure 5. (a) GNP before phase transfer and (b) after phase transfer; (c) SNP before phase transfer and (d) after phase transfer.
Applsci 07 00273 g005
Figure 6. (a) GNP; (b) SNP. Normalized UV–vis spectra of metallic nanoparticles in aqueous solution (black line), and in the solvent DCM (red dashed line).
Applsci 07 00273 g006
Figure 7. Scanning transmission electron micrographs of nanoparticles in organic solvent. (a) GNP; (b) Particle size distribution histogram of the GNP imaged in the STEM picture (Figure 7a); (c) SNP; (d) Particle size distribution histogram of the SNP imaged in the STEM picture (Figure 7c). The solid lines in Figure 7b,d are a Gaussian fit to the data.
Applsci 07 00273 g007

