1. Introduction
Additive manufacturing (AM) is a new technology, with which a structure can be created by depositing successive layers. This approach has been considered to be an alternative, economic process for producing metallic components due to its potential benefits of saving lead time and costs [
1]. Owing to its intrinsic characteristics, each AM process is naturally suitable for certain applications [
2,
3,
4,
5,
6,
7]. Compared with powder-based AM techniques, which usually employ laser beams and electron beams as heat sources, wire + arc additive manufacturing (WAAM) has shown its advantages in manufacturing large-scale components thanks to its high deposition rate, high material utilization rate, low production and equipment cost, and high equipment flexibility and scalability [
4,
7,
8]. High strength aluminum alloys have been widely used in aeronautics and aerospace applications for their excellent mechanical properties [
9]. In recent years, manufacturing aluminum alloy components with the WAAM process is gaining more and more interest from the aerospace industry due to its advantages as described above. Among all the different aluminum alloys, Al-6.3%Cu alloy is particularly favored because of its wide aerospace applications such as cryogenic tanks, fuselage or shells for space vehicles [
10].
So far, only a few research papers have addressed the topic of WAAM Al-6.3%Cu alloy. Bai et al. [
11] reported their work on the mechanical properties of the additively manufactured Al-6.3%Cu alloy with Al2319 wire (nominally Al, 6.3 wt % Cu) and variable polarity gas tungsten arc welding (VP-GTAW) process, and discussed the microstructure evolution of this alloy during the deposition [
12]. WAAM Al-6.3%Cu alloy was also studied with the cold metal transfer (CMT) process [
13], with a focus of the effect of inter-layer cold working and post-deposition heat treatment on the material strengthening of this alloy [
8] and their effect on porosity control [
14]. Cong et al. [
15] found that by using pulse-advanced cold metal transfer (CMT-P-ADV), pore-free deposition with refined equiaxed grains of the WAAM Al-6.3%Cu alloy can be produced.
However, all of the abovementioned research projects are based on the thin wall structure. The porosity and microstructure characterization of block structure is not studied. In this paper, thin walls and blocks of WAAM Al-6.3%Cu alloy samples were built with CMT in its pulsed (CMT-P) and advanced (CMT-ADV) variants, respectively. The porosity, microstructure, and micro hardness characteristics for these deposits were investigated in detail.
2. Materials and Methods
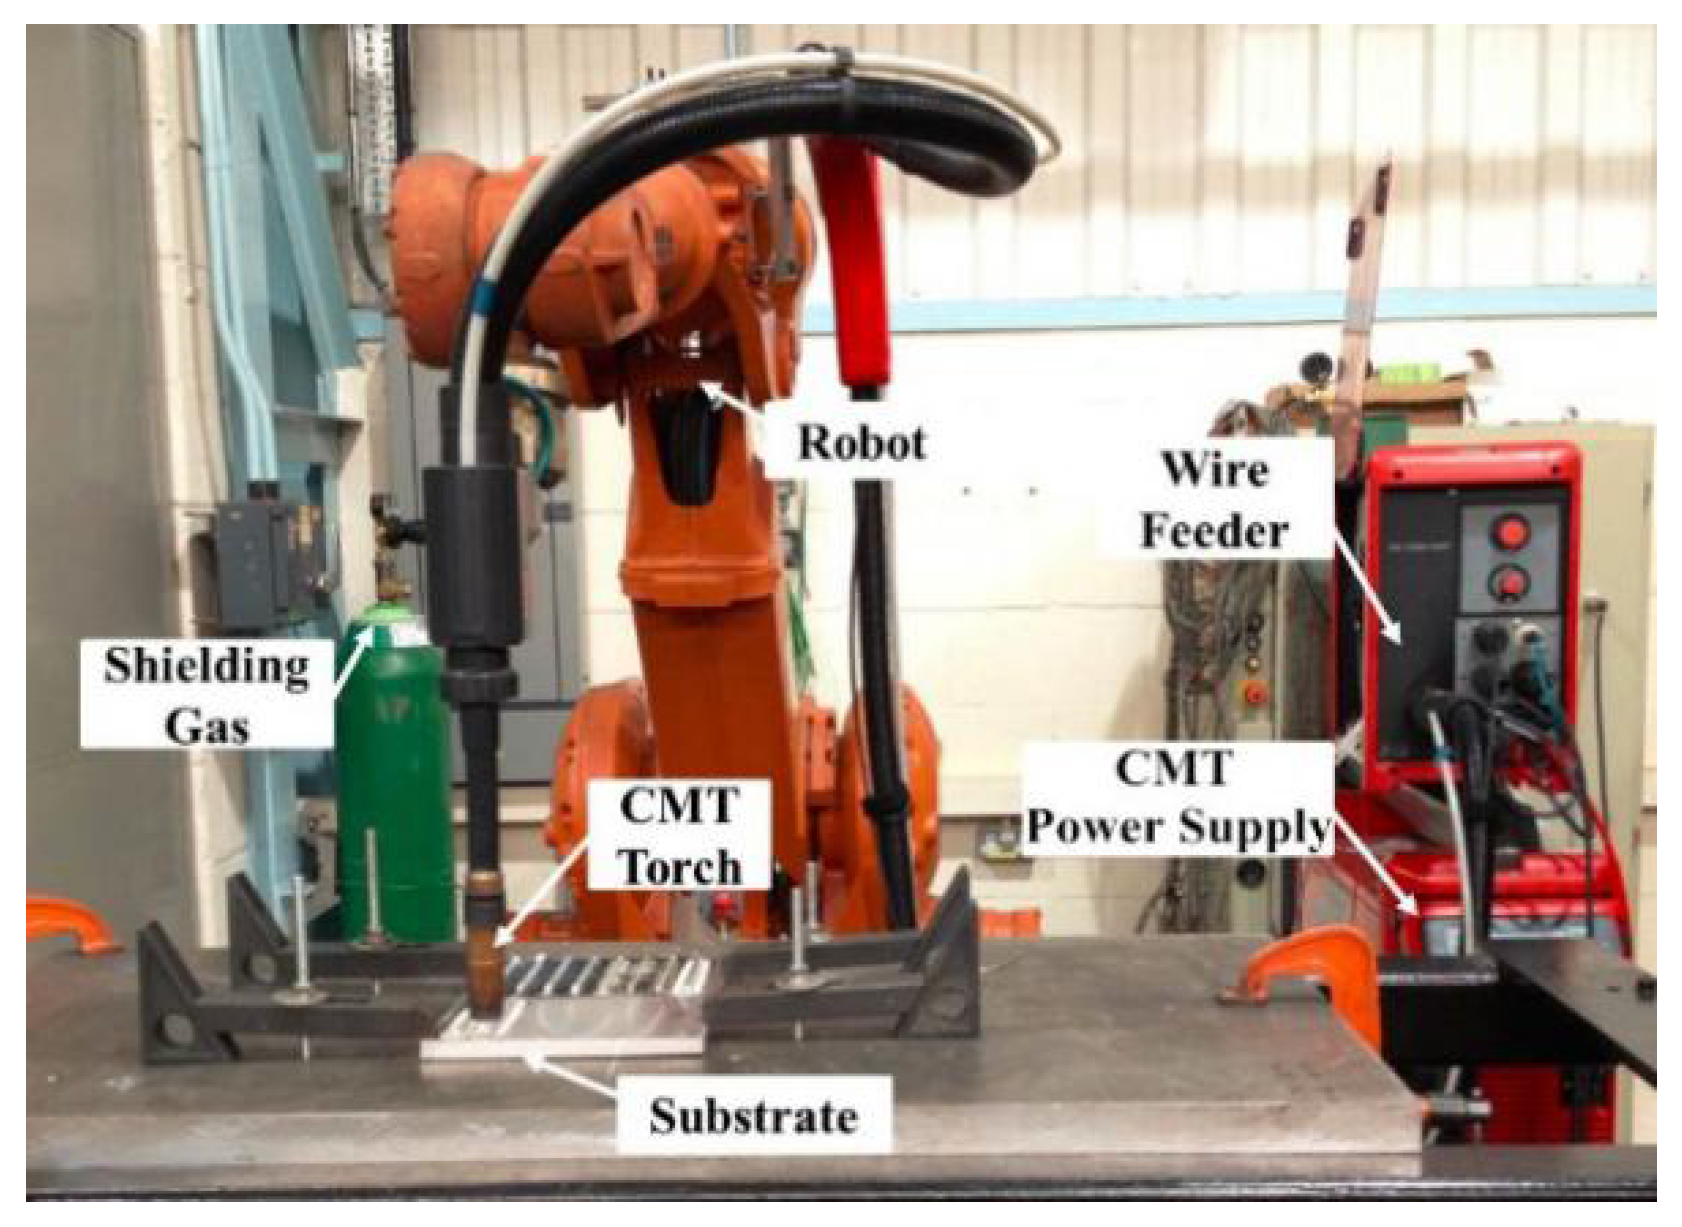
Experiments were carried out with a cold metal transfer wire + arc additive manufacturing (CMT-WAAM) system, which mainly consists of a Fronius CMT 4000R power supply (Fronius, Pettenbach, Austria) with a wire feeder and a CMT torch (Fronius, Pettenbach, Austria), an ABB robot IRB2400 (ABB, Zurich, Switzerland), a shielding gas system (Fronius, Pettenbach, Austria) and a working table, as shown in
Figure 1. CMT process is a modified gas metal arc welding (GMAW) variant based on a controlled dip transfer mode mechanism. It has four different variants, which are standard CMT, CMT-P, CMT-ADV and CMT-P-ADV. As presented in the study of the effects of these different CMT variants on the porosity in the WAAM aluminum thin wall structure [
15], adding a pulsing cycle to the standard CMT helps the control of porosity. Compared with the CMT-P process, the CMT-ADV process controls porosity even more efficiently due to its lower heat input, cleaning effect on the tip of the wire during the negative cycle and the smaller microstructure [
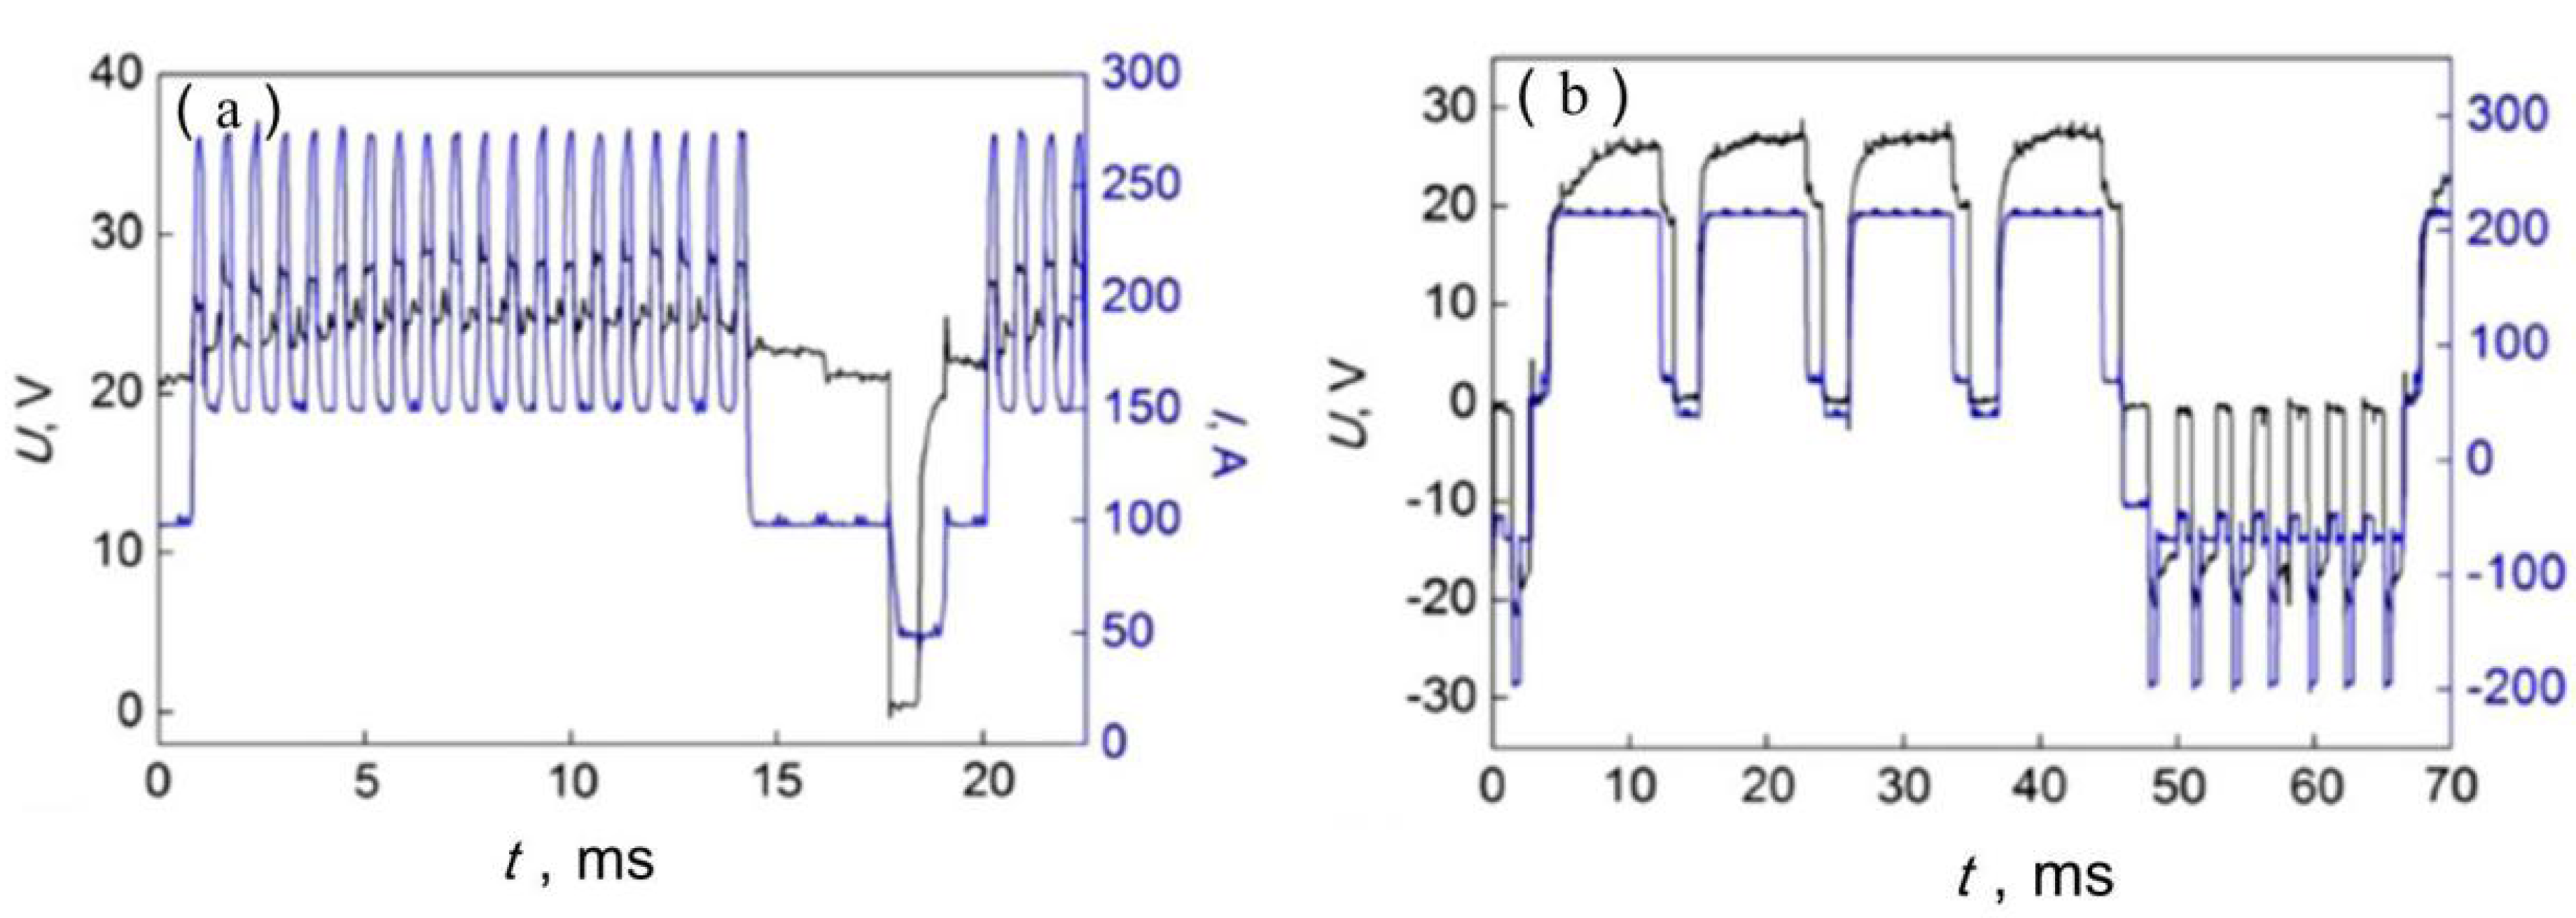
15]. In this study CMT-P and CMT-ADV were employed to build the samples. Although using the CMT-P-ADV process can provide the most effective porosity control, it is not suitable for building block structures due to its very low heat input, which results in a lack of fusion defects when one pass of bead is deposited next to other beads. The actual arc current and voltage waveforms of these two modes are presented in
Figure 2.
ER2319 wire (1.2 mm in diameter) (VBC, Leicestershire, UK) and 2219-T87 plate (200 mm × 200 mm × 19 mm in dimension) (CHALCO, Chongqing, China) were chosen as the material and substrate, respectively. The nominal compositions of the material and substrate are listed in
Table 1. All substrates were cleaned shortly before being used, by washing in alkaline solution, drying, then linishing and degreasing with acetone afterwards.
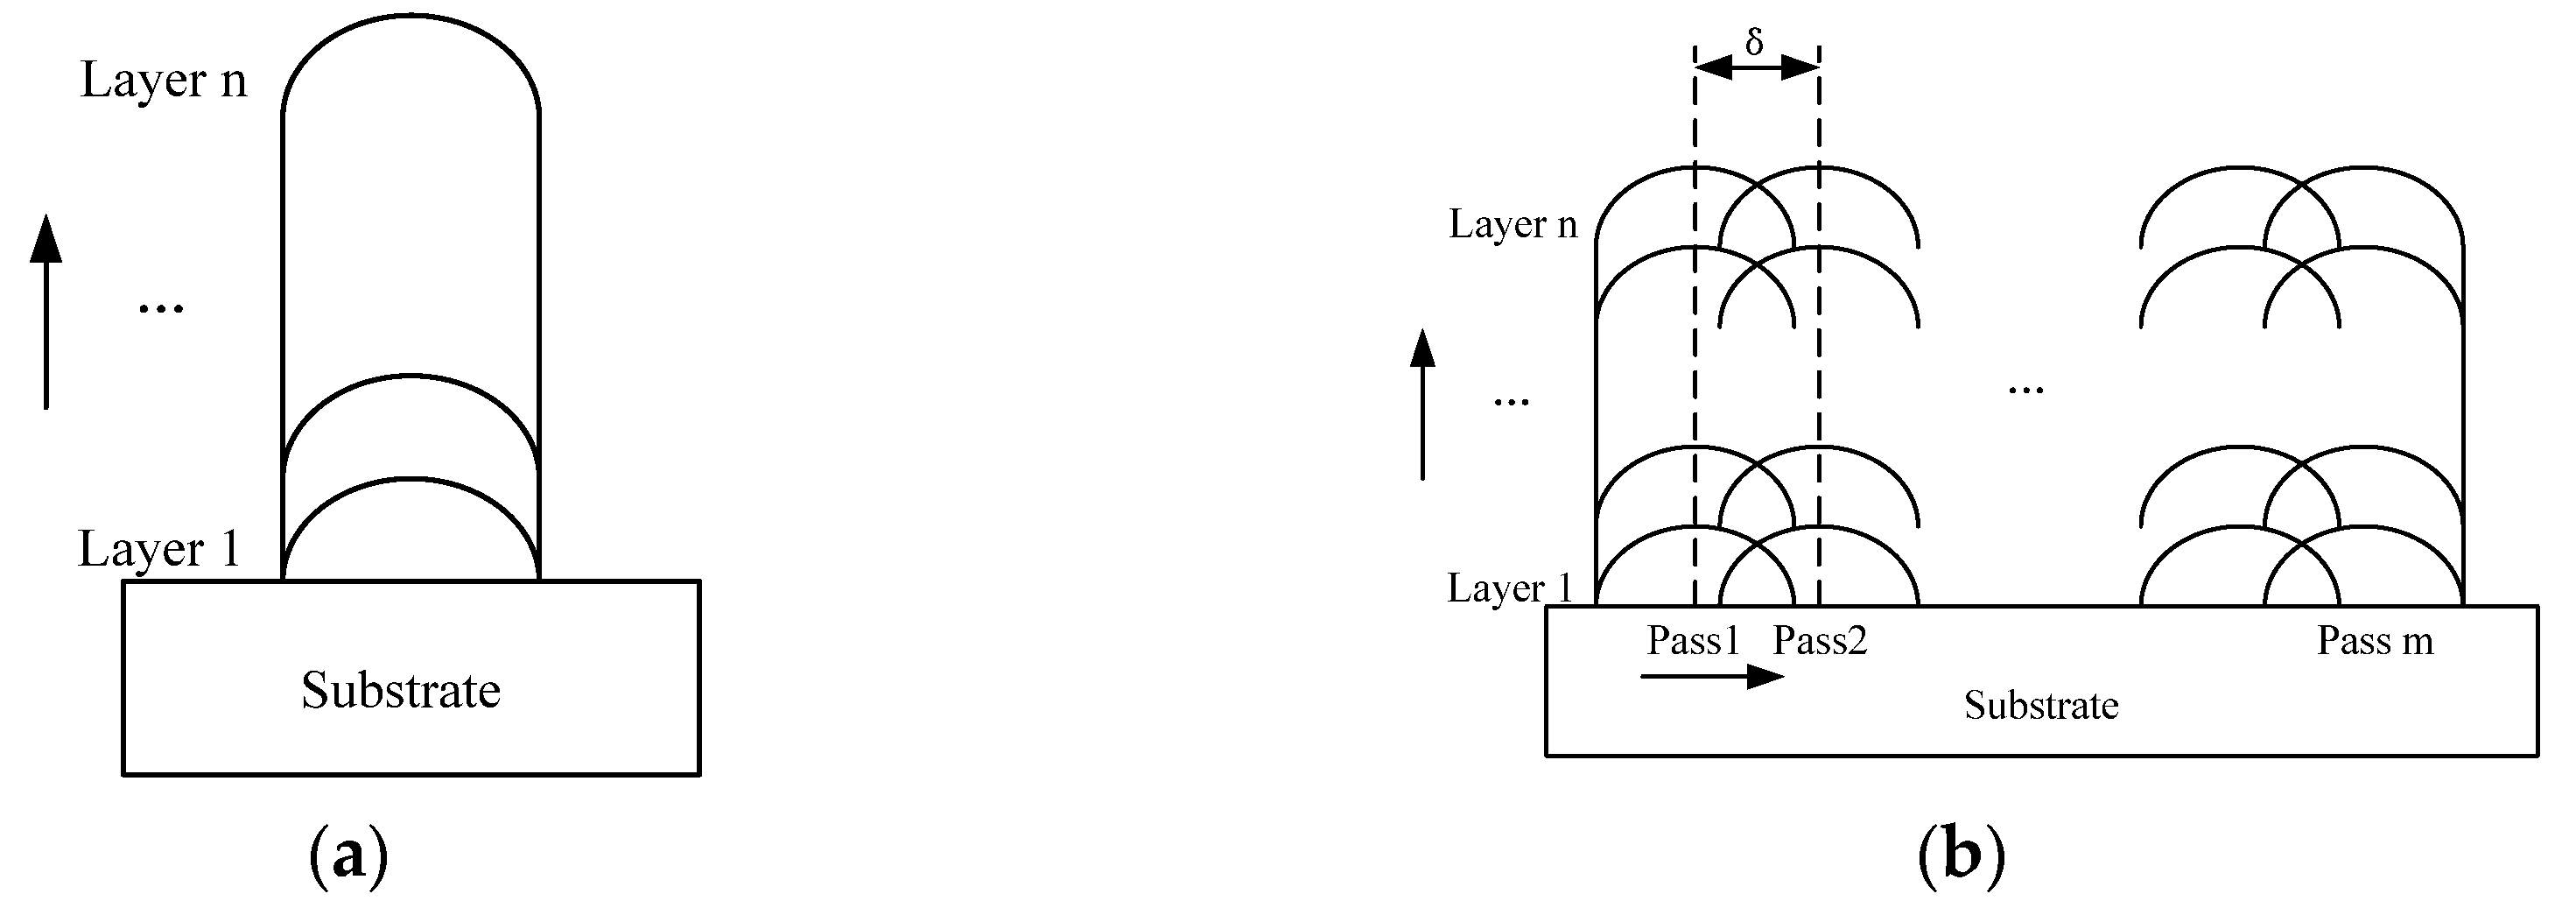
The depositing paths of thin wall samples and block samples are shown in
Figure 3. Thin wall samples were deposited layer-by-layer in the vertical direction with only one pass of bead in each layer. On the other hand, the block samples were produced by first laying a number of parallel passes one by one next to each other and then repeating the deposition of the same number of passes on top of the previous layer. In this study, thin wall structures and block structures were built with CMT-P and CMT-ADV, and all the experiments were carried out in an open atmosphere with torch shielding only. Pure argon (99.99%) was used as the shielding gas with a constant flow rate of 25 L/min, and the contact tip to work distance was kept to 15 mm for all the trials. A constant waiting time of 60 s was applied between each layer/pass for cooling the samples below 50 °C before the deposition of the subsequent layer/pass. This was monitored by using a portable thermal couple measuring at the middle section of the top surface of the newly deposited layer/pass. The detailed parameters of the depositing process and the dimensions of the components are listed in
Table 2. The heat input (HI) was calculated using the equation
where
(A) and
(V) are arc current and voltage for each sample, and the arc thermal efficiency (
) of CMT is set to 0.9 [
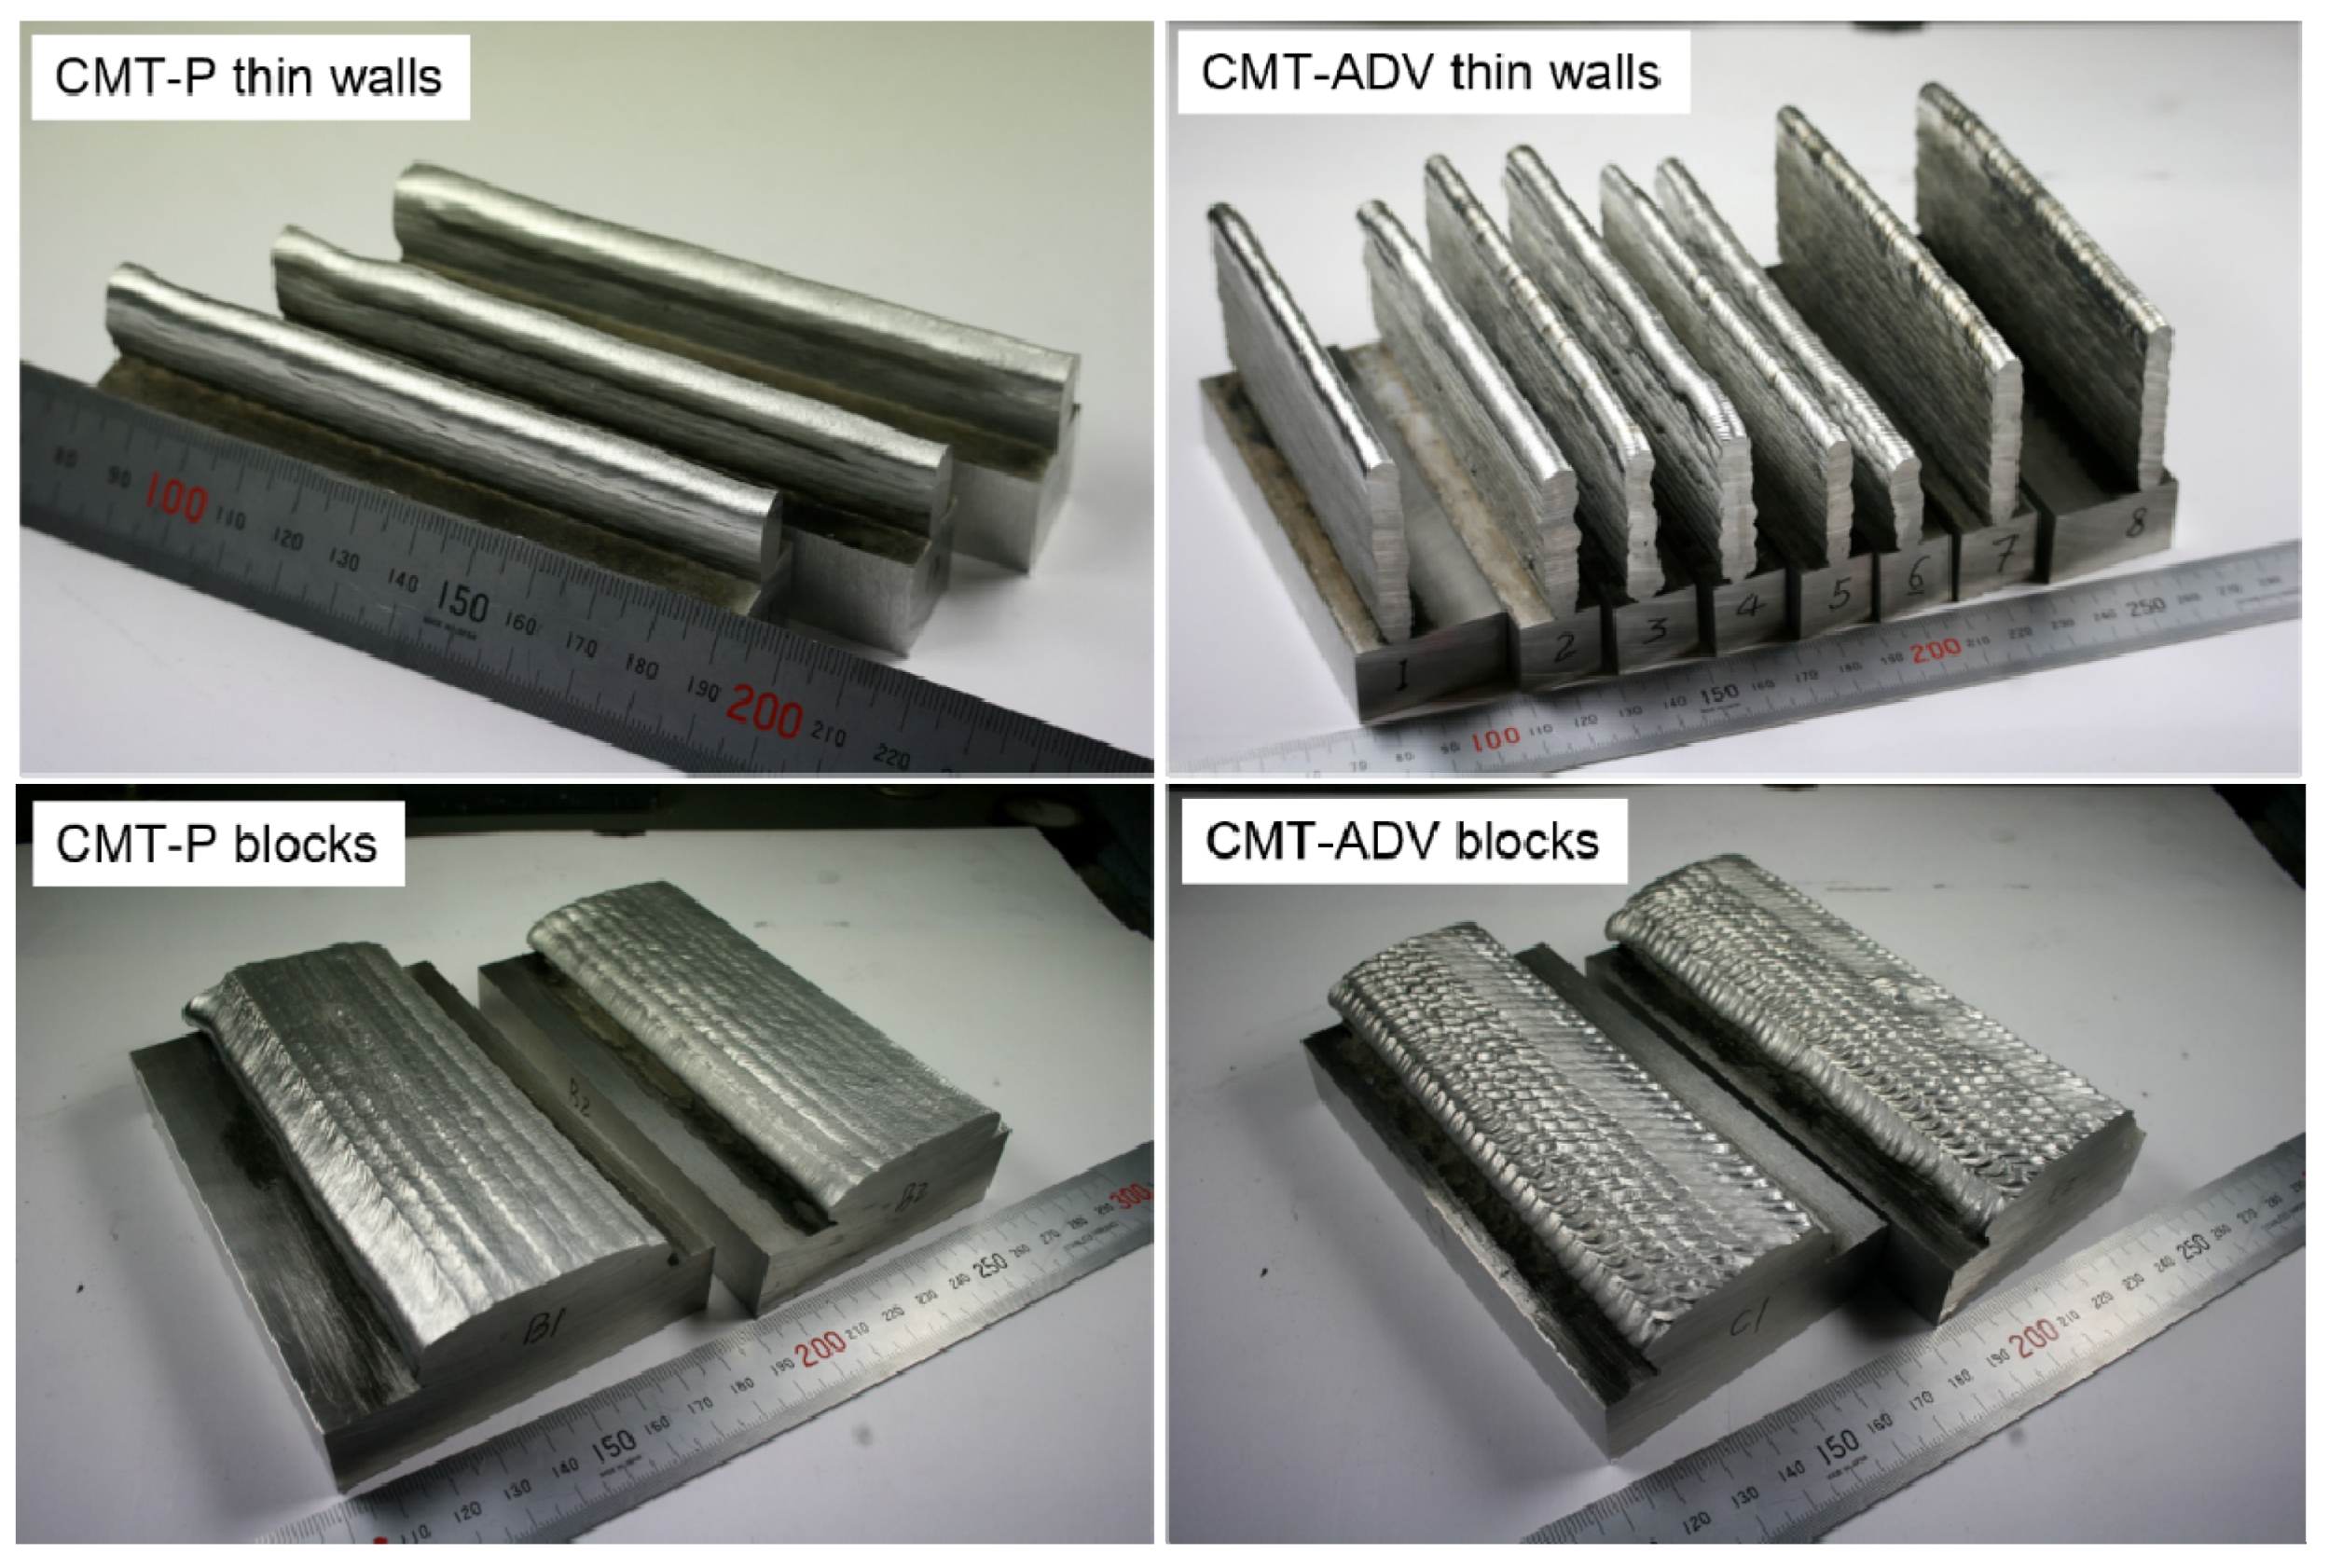
16]. TS is the travel speed (mm/min). Some WAAM structures are presented in
Figure 4.
Samples of cross sections for microstructure analysis and samples of longitudinal sections for porosity analysis were both taken from the middle parts of these components. An optical microscope (OM) (Nikon OPTIPHOT) (Nikon, Tokyo, Japan) was employed for taking images of porosity and microstructure. The resin mounted specimens were ground with 400, 800, 1200 and 2000 meshes waterproof abrasive paper in order, and then polished with 3 μm diamond paste and SiO
2 suspension, respectively. Porosity distribution was observed firstly. Etching was performed with Keller’s reagent solution (6% HNO
3; 2% HF; 92% H
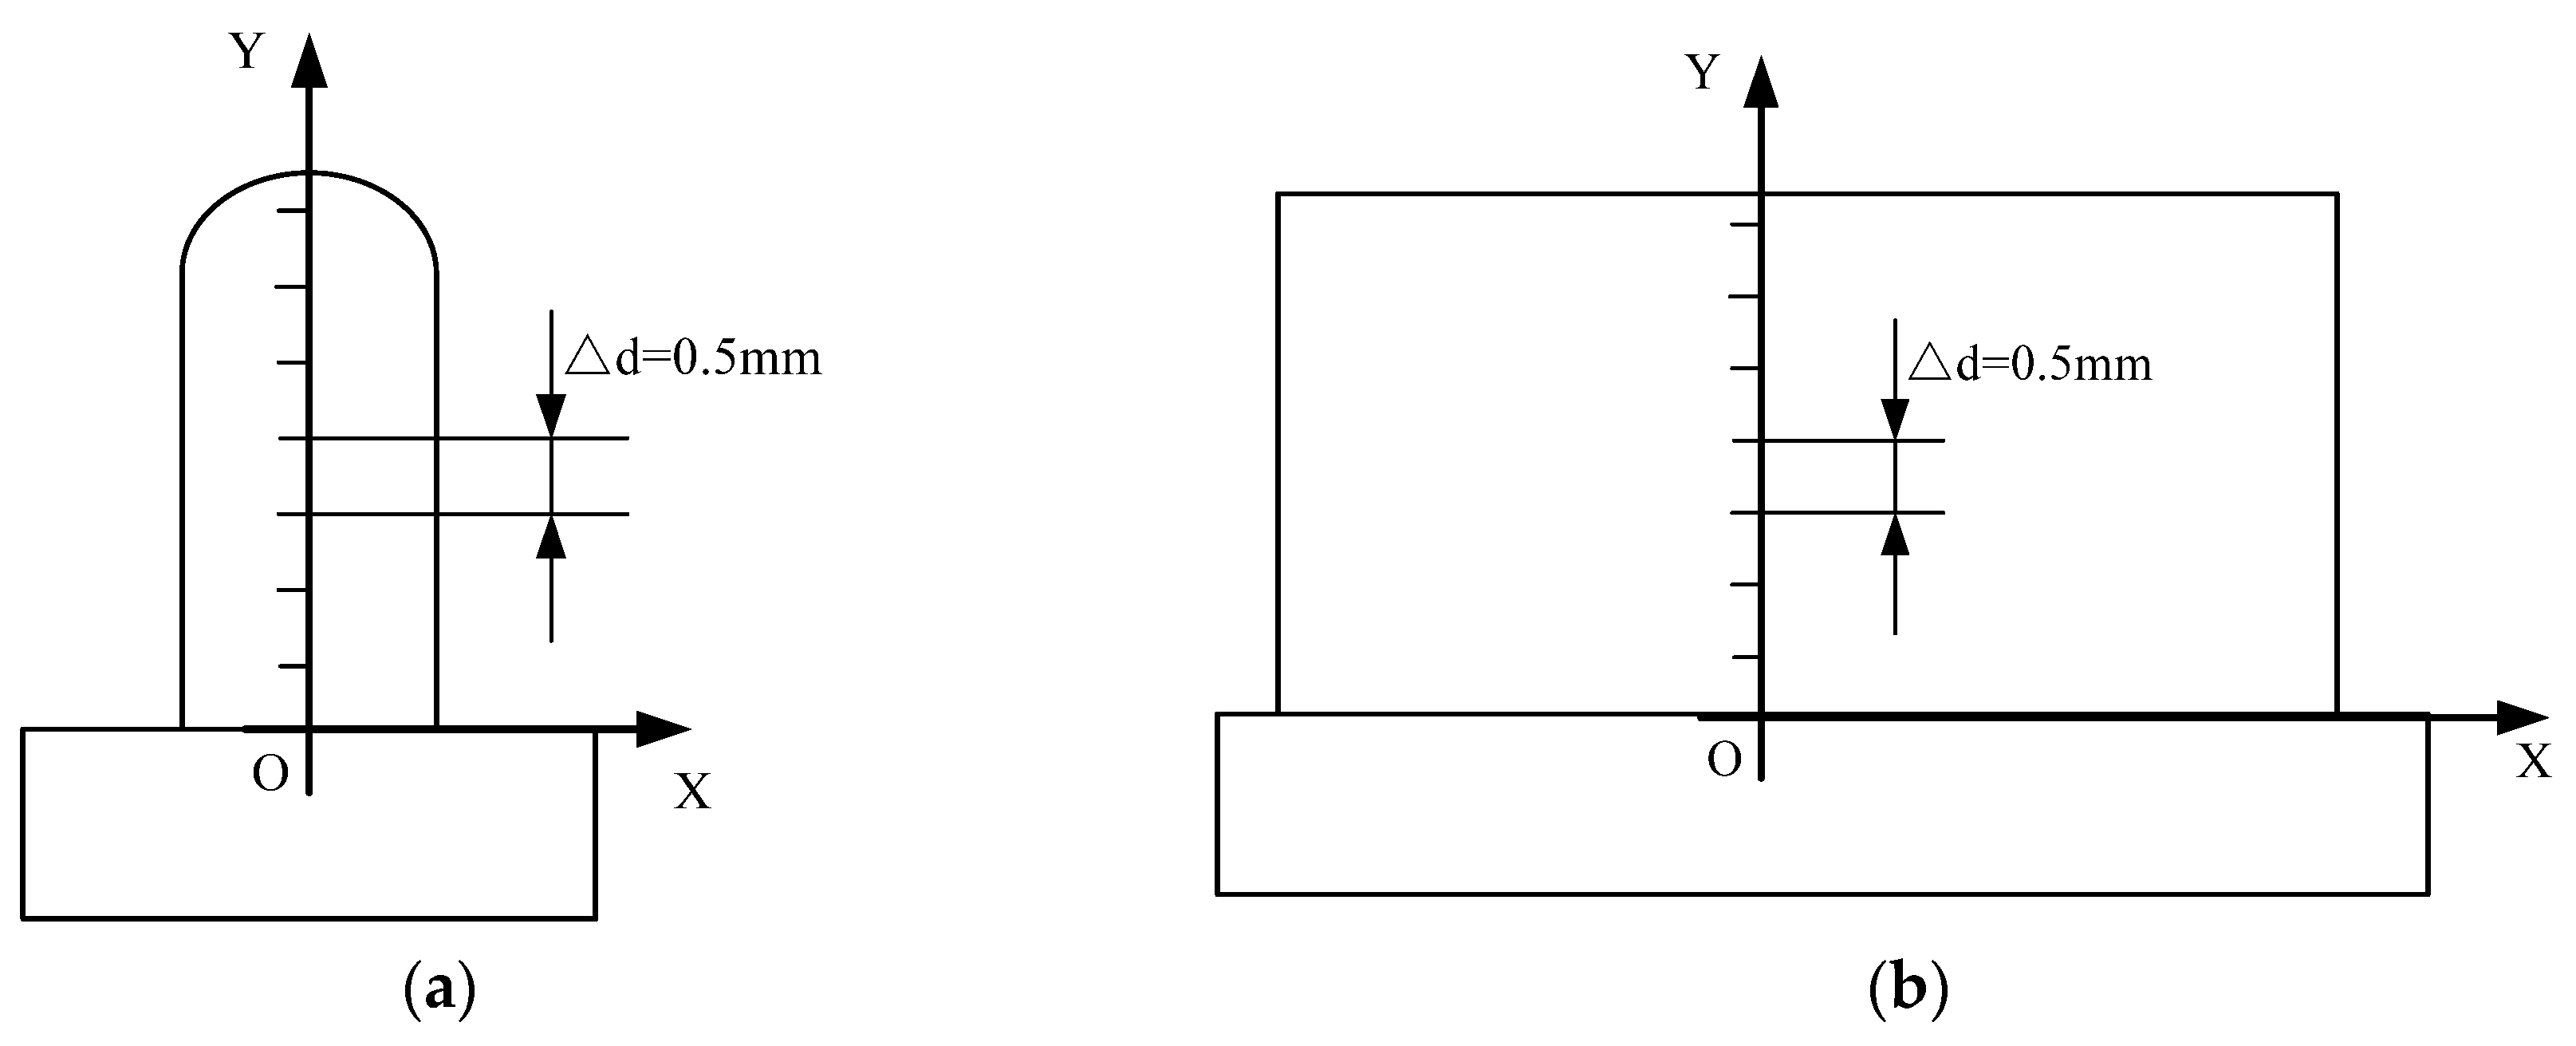
2O) before microstructure observation. Micro hardness testing was performed using Zwick/Roell ZHV30 (Zwick/Roell, Ulm, Germany) with 200 g load for 10 s duration, from the bottom of each sample along the vertical direction with 0.5 mm intervals, as shown in
Figure 5.
3. Results and Discussion
3.1. Pore Distribution
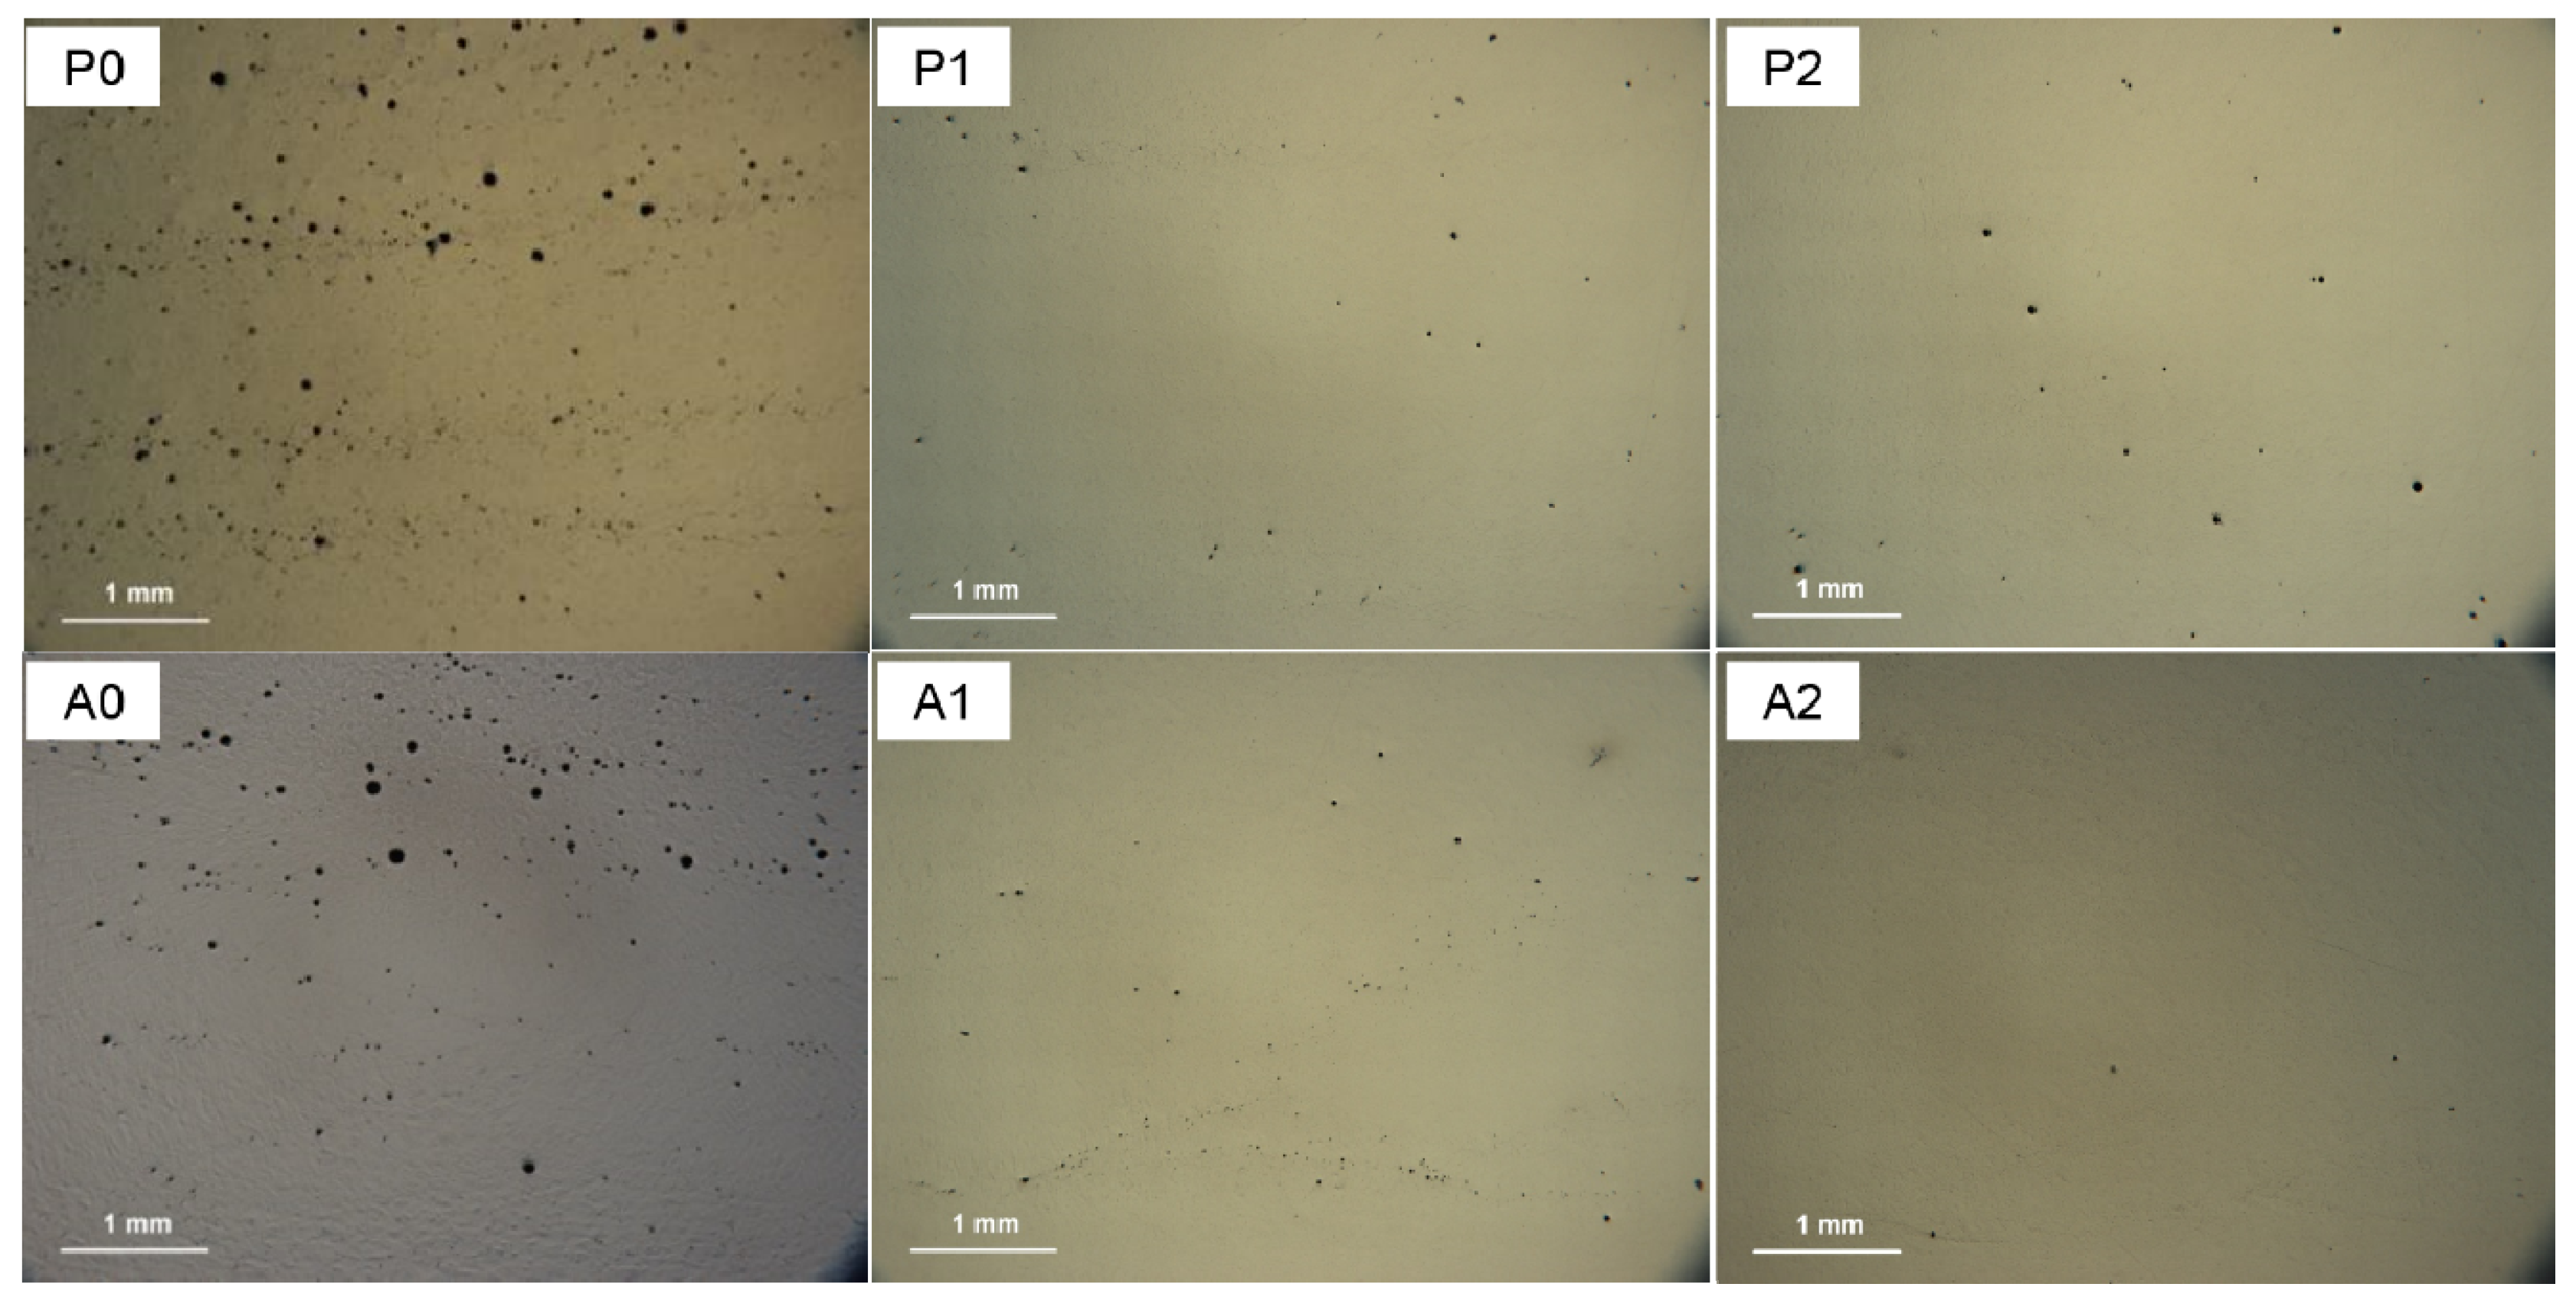
The metallographic observations of pore distribution in the central regions for these six samples are shown in
Figure 6.
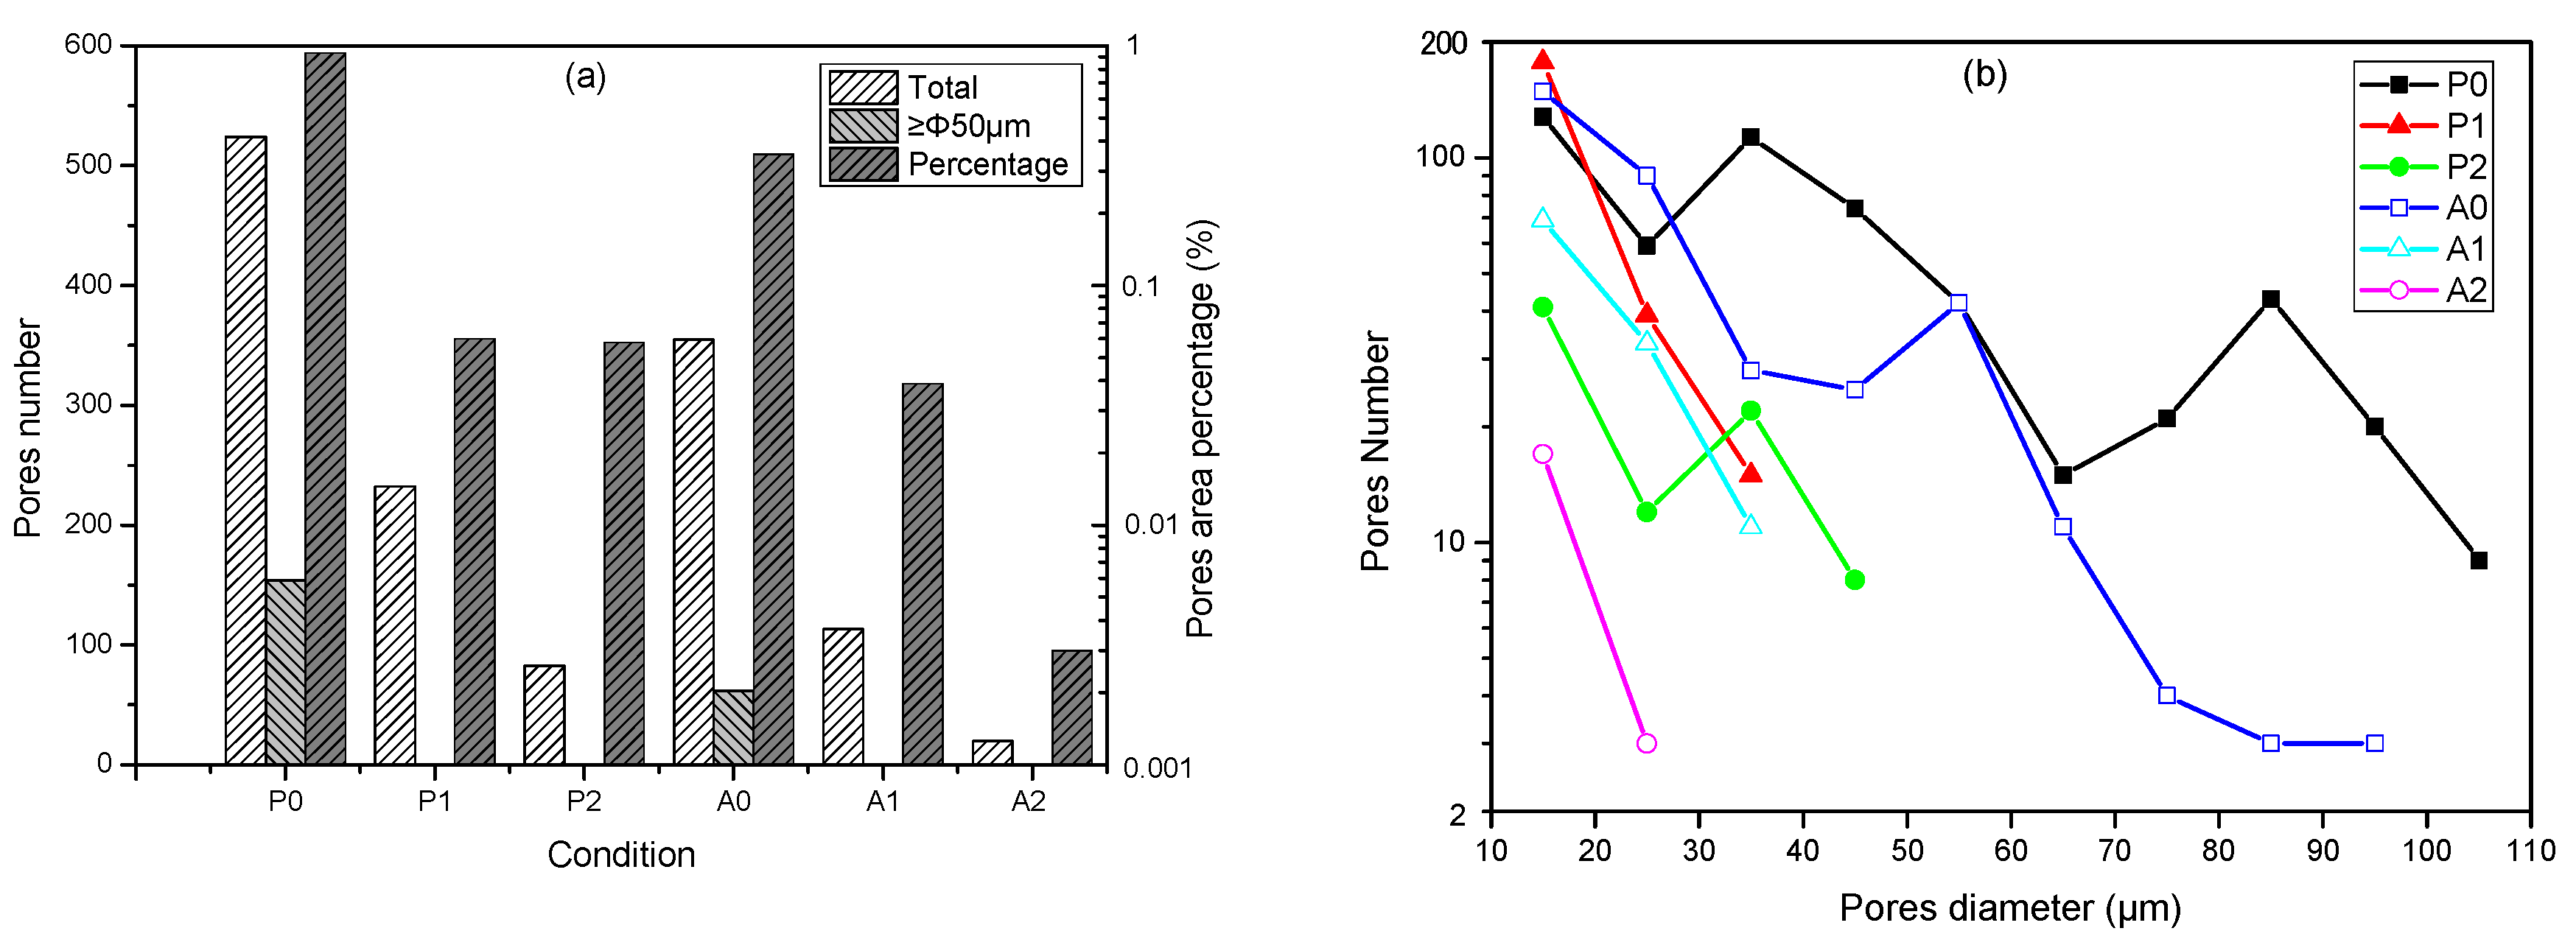
Figure 7 illustrates the pore characteristics, such as diameter, number and area percentage. This pore counting was performed on a section with an area of 15 mm × 15 mm. The pore area percentage was calculated by dividing the total inspection area by the pore area in the inspection section. Limited by the resolution of the optical microscope, only pores larger than 10 μm in diameter were counted.
There are various sized pores distributed in WAAM 2319 alloy, as presented in
Figure 6 and
Figure 7. As shown in
Figure 7a, the total number and area percentage of pores in the block specimens (P1, P2, A1 and A2) distinctly decreases, compared with the thin-wall ones (P0 and A0). Moreover, no pores larger than 50 μm in diameter exist in the block samples. By contrast, there is a certain number of pores larger than 50 μm in the thin wall samples. In addition, the CMT-ADV process (A0, A1 and A2) can further reduce the number of pores and area percentage compared with the CMT-P process (P0, P1 and P2). For all the samples, most pores are smaller than 50 μm in diameter, as shown in
Figure 7b. There is a trend that the number of pores decreases with increased pore size. Furthermore, no pore larger than 110 μm existed in any of the samples.
Hydrogen has been widely recognized as the dominant cause of porosity in aluminum alloy welds and the WAAM process. The hydrogen pores are mainly formed through heterogeneous nucleation, and grow in the form of self-diffusion or combination in the solidification of the aluminum alloy. The nucleation rate of hydrogen pores is closely related to the grain size with certain hydrogen content [
14,
17,
18,
19]. Meanwhile, the temperature gradient, cooling rate and heat input are the key factors affecting the grain size. With the increase of temperature gradient and cooling rate, and the decrease of heat input, the grain can be refined and pores can be reduced effectively. Compared with thin wall deposits (P0 and A0) where the heat from the weld pool is conducted though the underlying layers in a 2D planer manner, the temperature gradient and cooling rate of the molten pool of the block samples (P1, P2 and A1, A2) are higher as the heat from the weld pool is conducted radially though the surrounded material in a 3D manner. Therefore, the grain size is refined, and the nucleation rate of hydrogen pores is reduced, which results in the decrease of the gas pores.
Compared with the CMT-P process, the heat input of the CMT-ADV process significantly decreases in the block building process, as shown in
Table 2. The microstructure of the depositions with the CMT-ADV process is also refined, as described in
Section 3.2. Furthermore, the oxidation film on the end of the filling wire, which can be the nucleating particle of hydrogen pores, is cleaned effectively due to the alternating current arc in the CMT-ADV process. Therefore, the number of pores in the CMT-ADV block samples are comparatively less.
However, it can be found in
Figure 6 and
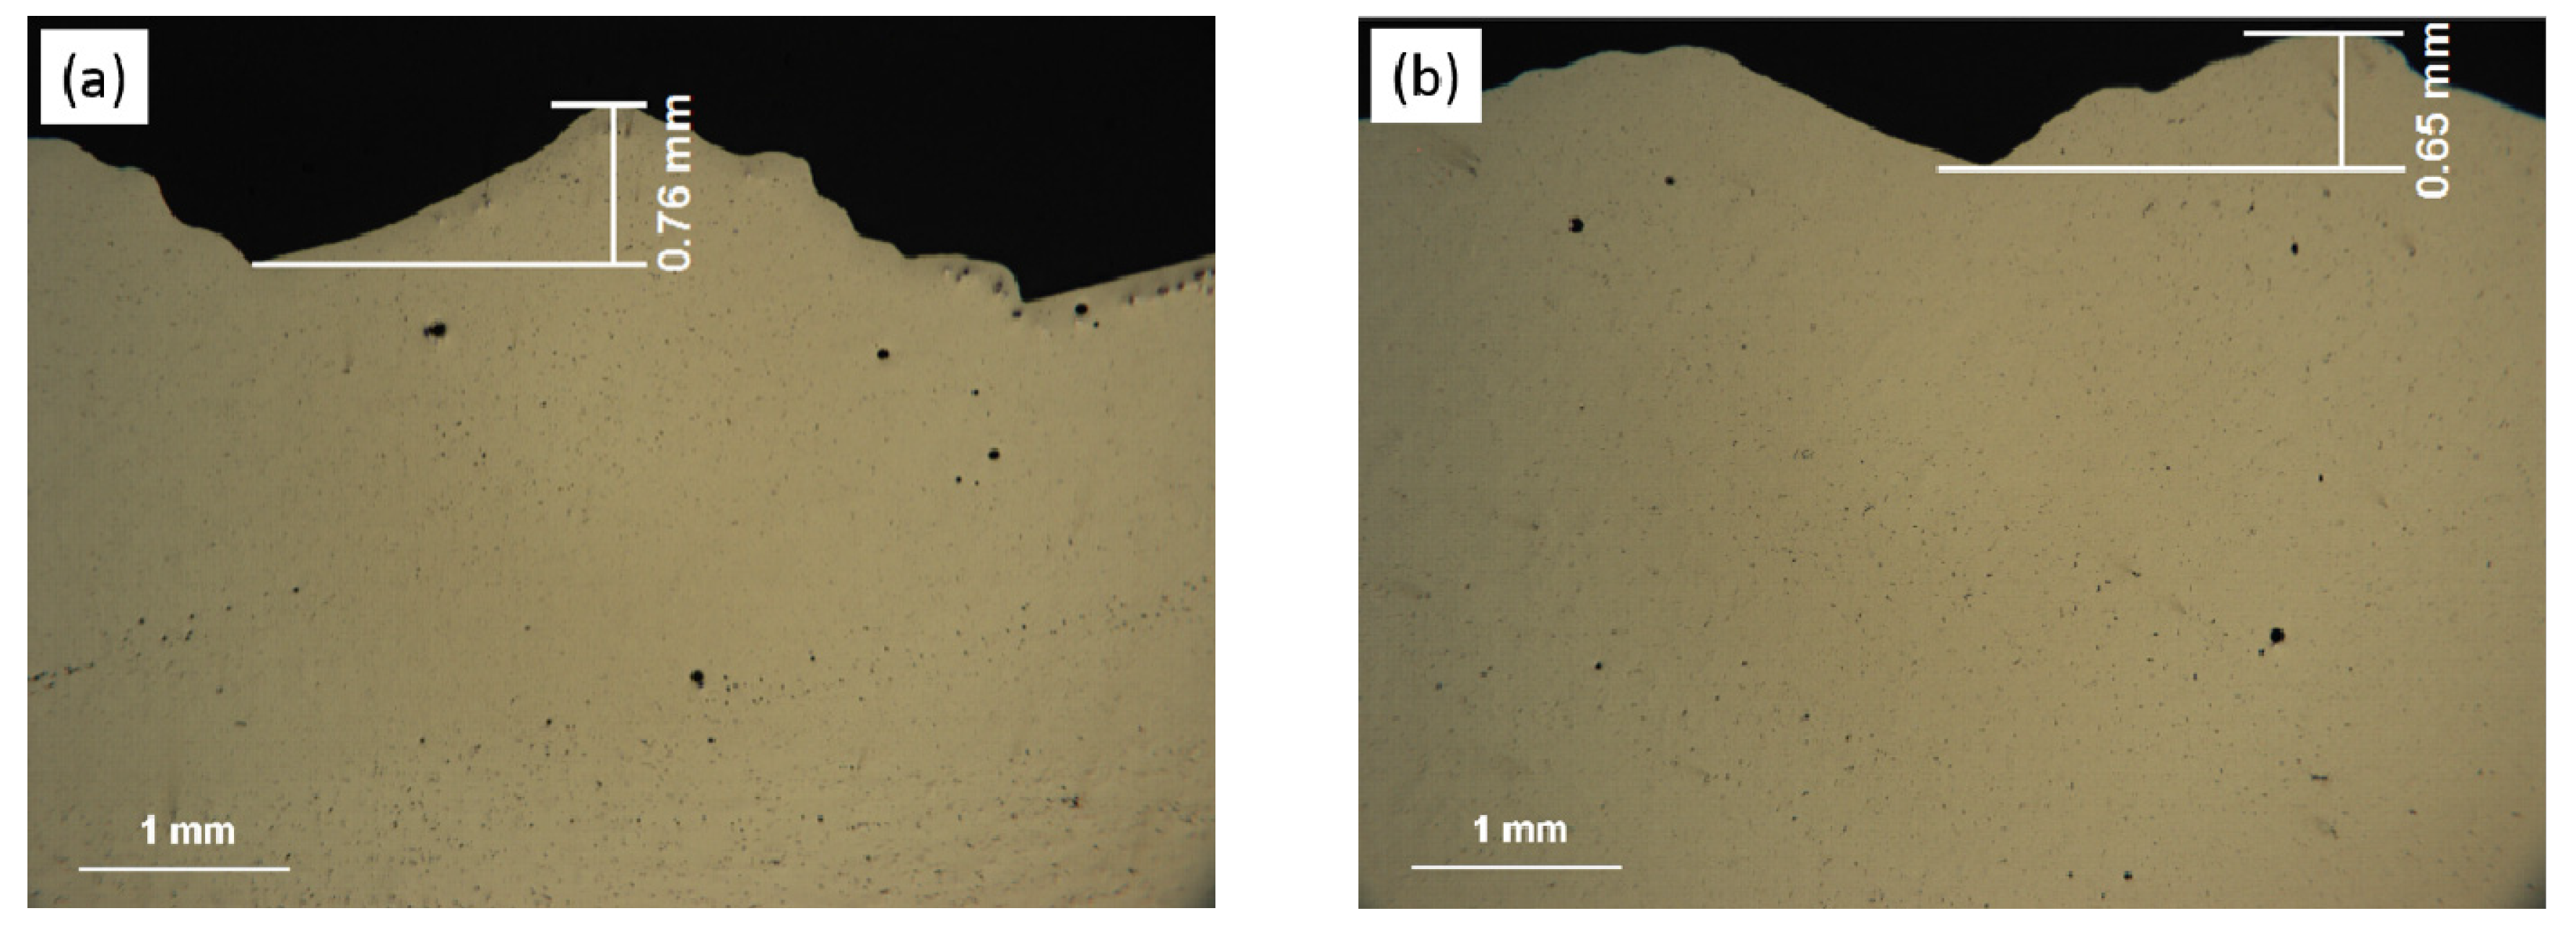
Figure 7 that with 0.5 m/min travel speed (A2), the number of pores is less than that in the sample built with 0.6 m/min travel speed (A1), the heat input of which is lower. The reason for this phenomenon is that the weld beads generated by the CMT-ADV process are rough, and the oxidation film in the bottom of the depositing layer surface cannot be eliminated radically and thus turns into the nucleating particles of hydrogen pores. As shown in
Figure 8, the mean distance between the peak and the valley of the depositing layer surface in 30 mm length beads with 0.5 m/min travel speed (0.65 mm) is shorter than the ones with 0.6 m/min travel speed (0.76 mm). Thus, the stability of the droplet transfer with 0.5 m/min travel speed may be better, and the oxidation film is much more easily eliminated thanks to the smoother surface. Therefore, less pores are observed in the sample built with 0.5 m/min travel speed.
3.2. Microstructure
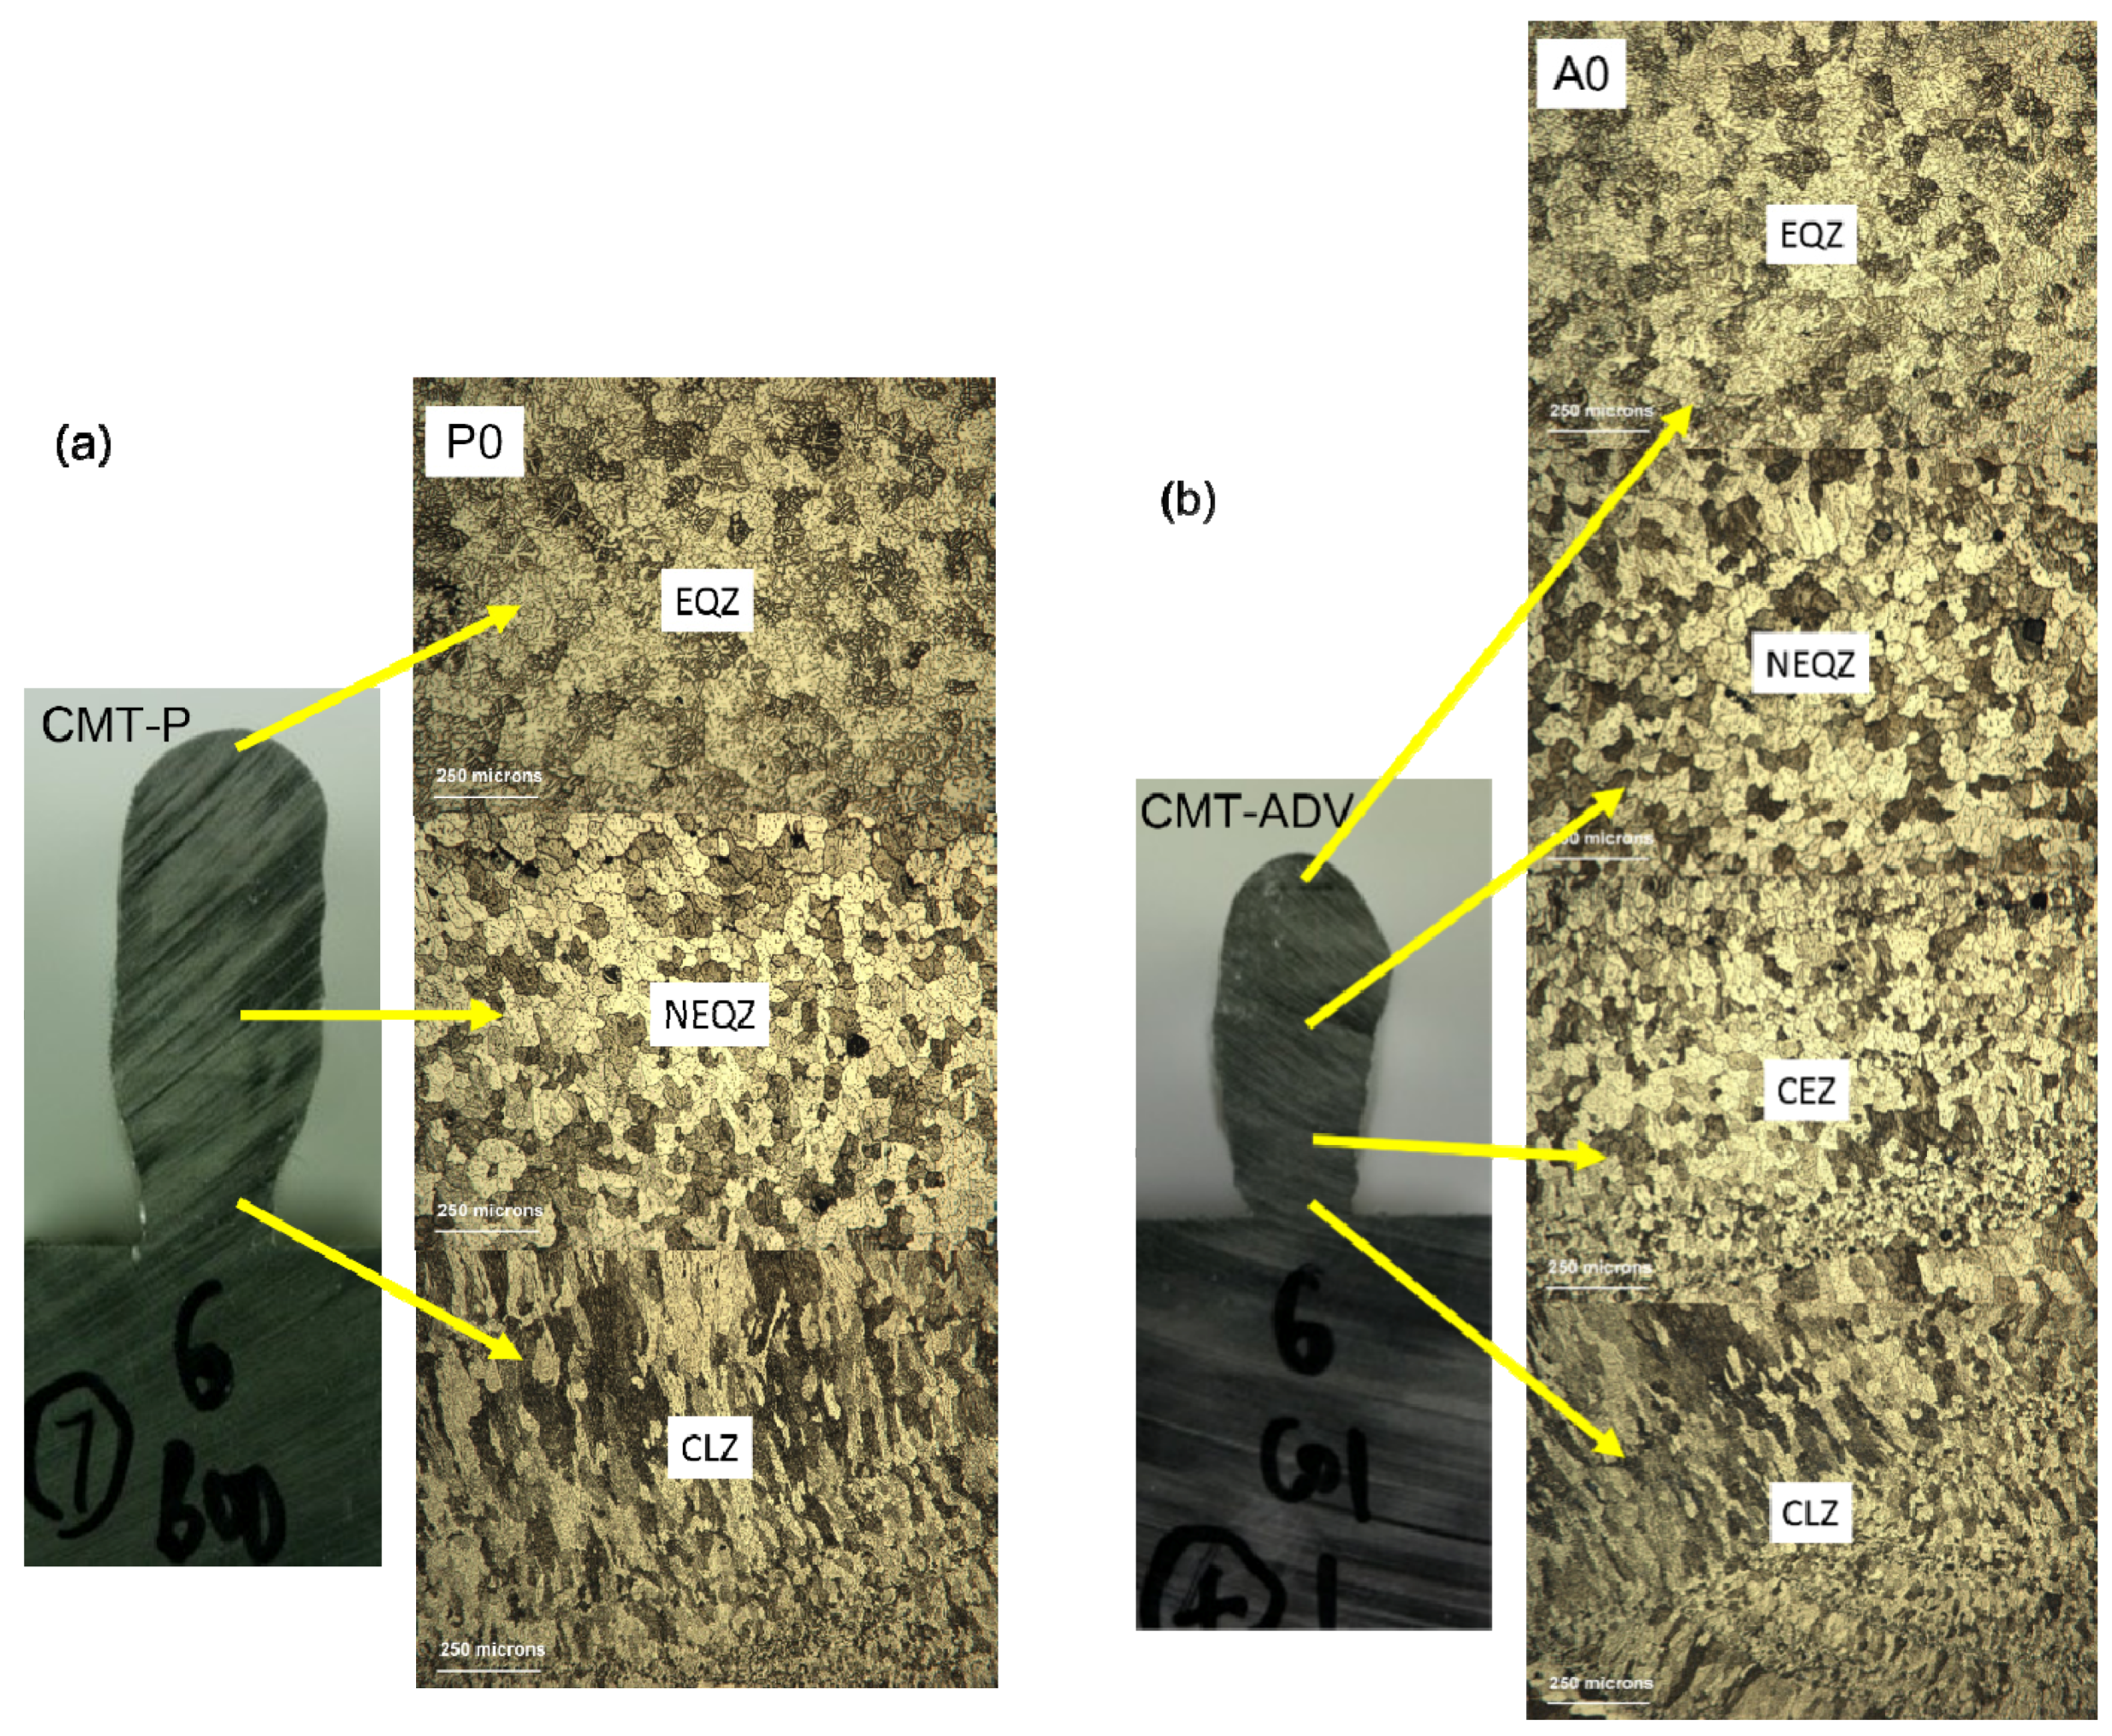
Figure 9 shows the microstructures of thin wall samples. It can be seen that the microstructure grows from columnar zone (CLZ) to equiaxed non-dentrite zone (NEQZ) from the bottom to the middle, and NEQZ to equiaxed dentrite zone (EQZ) from the middle to the top region of the CMT-P specimen. While, the sample with the CMT-ADV process is characterized by CLZ, cellular zone (CEZ), NEQZ and EQZ from the bottom to the top area.
The heat mainly dissipates along the deposited parts towards the substrate in first few layers of the depositing process. As the direction of the grain growth is mainly along the largest temperature gradients, the microstructures in the bottom to the middle are mainly slender columnar grains perpendicular to the substrate. With the increase of the deposition height, the dissipation of the heat slows down as a result of the increase of the distance between the heat source and the substrate. Moreover, due to the preheating effect of the former layers on the latter ones, the heat is accumulated gradually until a thermal balance is reached. As a result, the grains grow at almost the same speed along each direction, eventually forming the equiaxed dentrite grains. These equiaxed dentrite grains will be re-melted by the deposition of the next layer, thus forming equiaxed non-dentrite grains. So, the equiaxed dentrite grains only exist in the region of the top one or two layers. Compared to the CMT-P process, the lower heat input and the AC arc mode in CMT-ADV process result in the tiny cellular structure formation during the transition from CLZ to EQZ in WAAM Al-6.3Cu alloy.
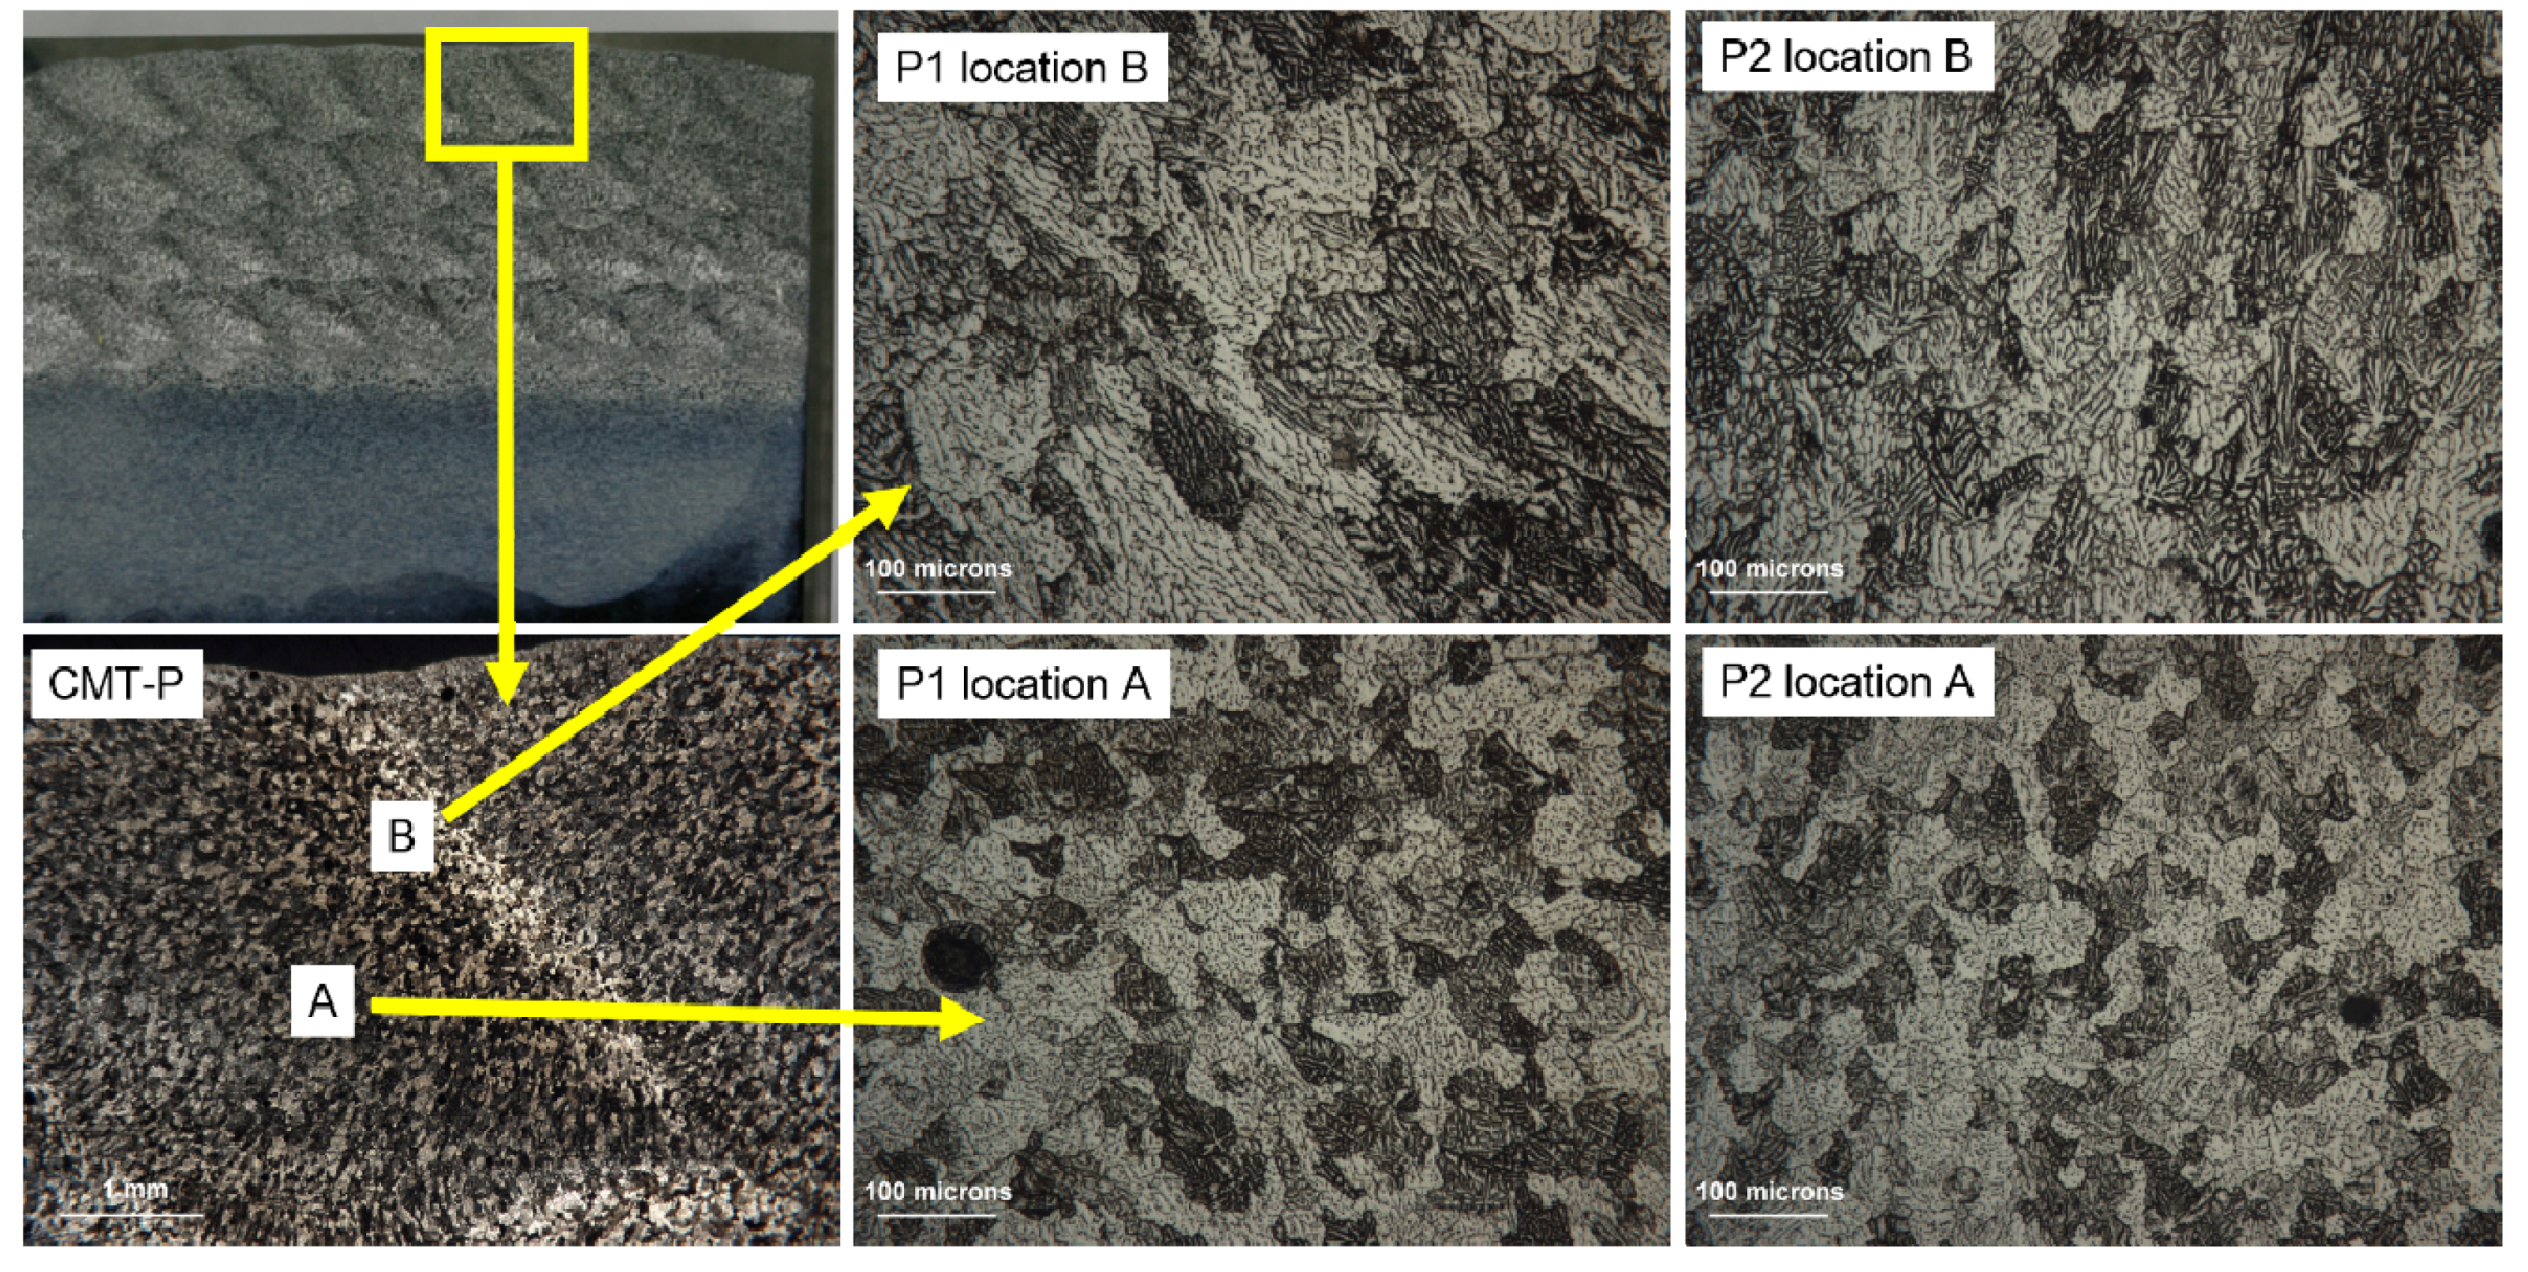
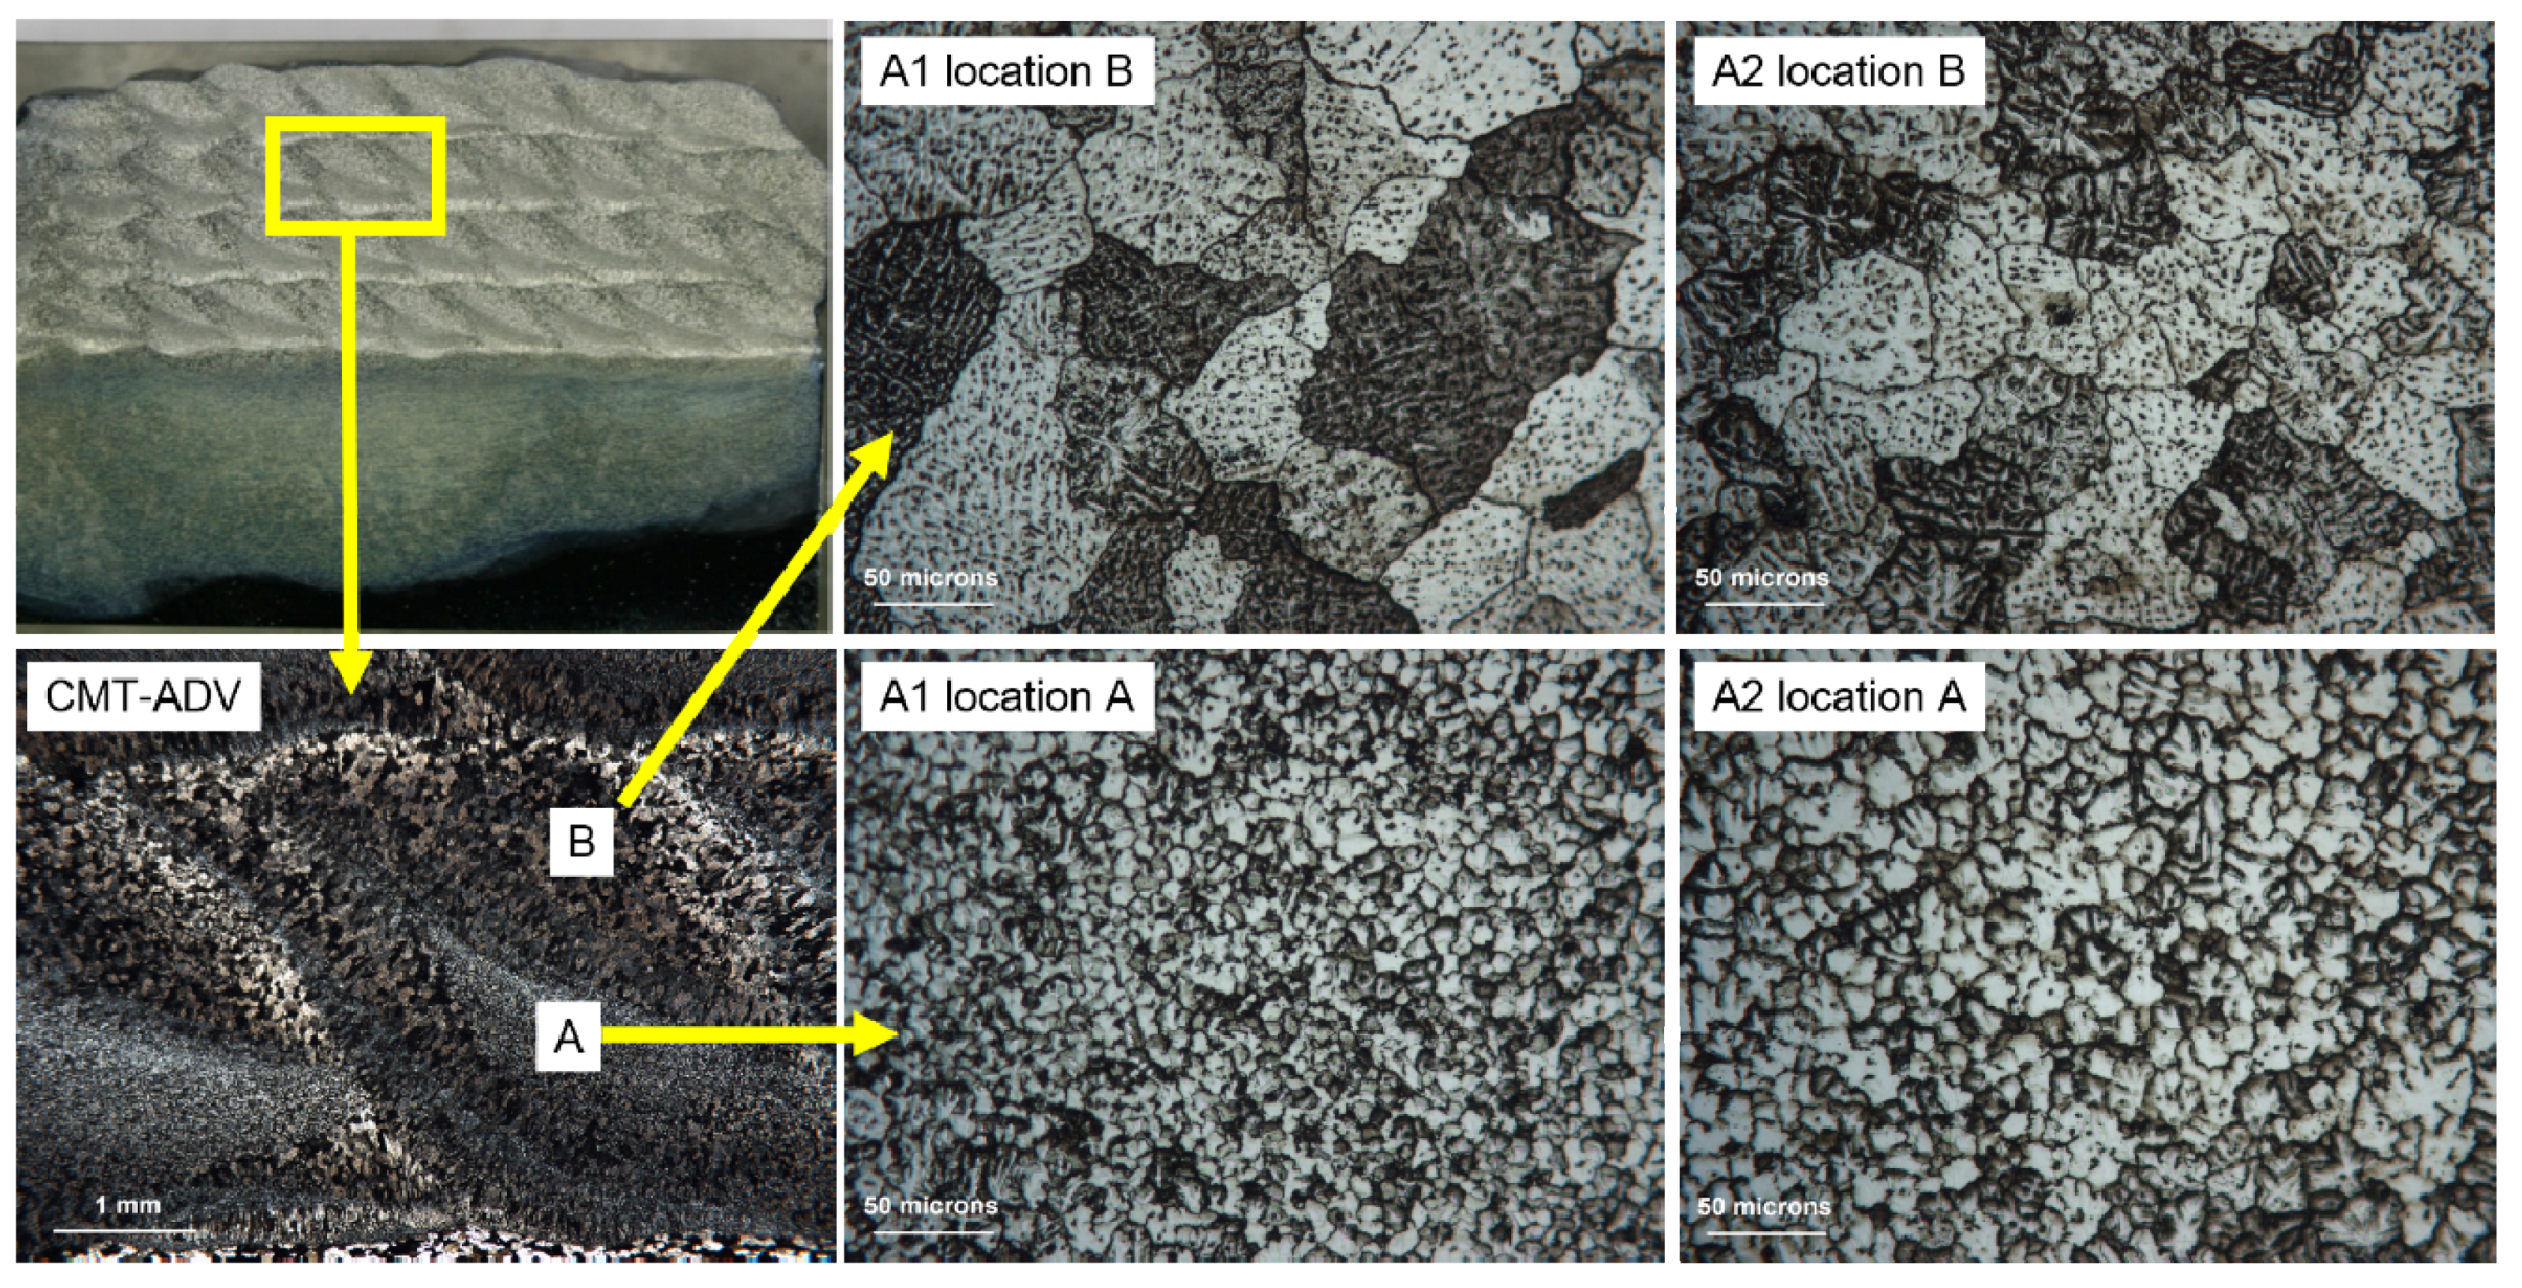
Figure 10 and
Figure 11 give the microstructures of block samples built with the CMT–P process and the CMT-ADV process, respectively. It is observed that the microstructure differs even in the same pass. As shown in
Figure 10, the microstructure grows from CLZ to NEQZ from the surrounding (location B) to the center (location A) region of every pass in the samples created with the CMT-P process. The samples manufactured by the CMT-ADV process consist of NEQZ and coarse EQZ in sequence along the center (location A) to the surrounding (location B) region, as shown in
Figure 11.
This phenomenon can be explained by the following. For block deposits formed with the CMT-P process, the temperature gradient of liquid metal at the bottom of the molten pool is larger than that at the top, because the heat can distribute to the former pass and layer during the cooling and solidification process. The grains at the bottom grew perpendicularly to the substrate or the former pass/layer, forming CLZ, while NEQZ formed in the middle and top areas. However, the top area is re-heated or re-melt by the newly deposited layer, and the grains in this area grow to coarse columnar crystals, leaving NEQZ in the center region. Compared with the CMT-P process, the lower heat input of the CMT-ADV process leads to a larger temperature gradient, resulting in the formation of EQZ around NEQZ. For the same arc mode, the lower heat input (P1 and A1) can refine the grain size.
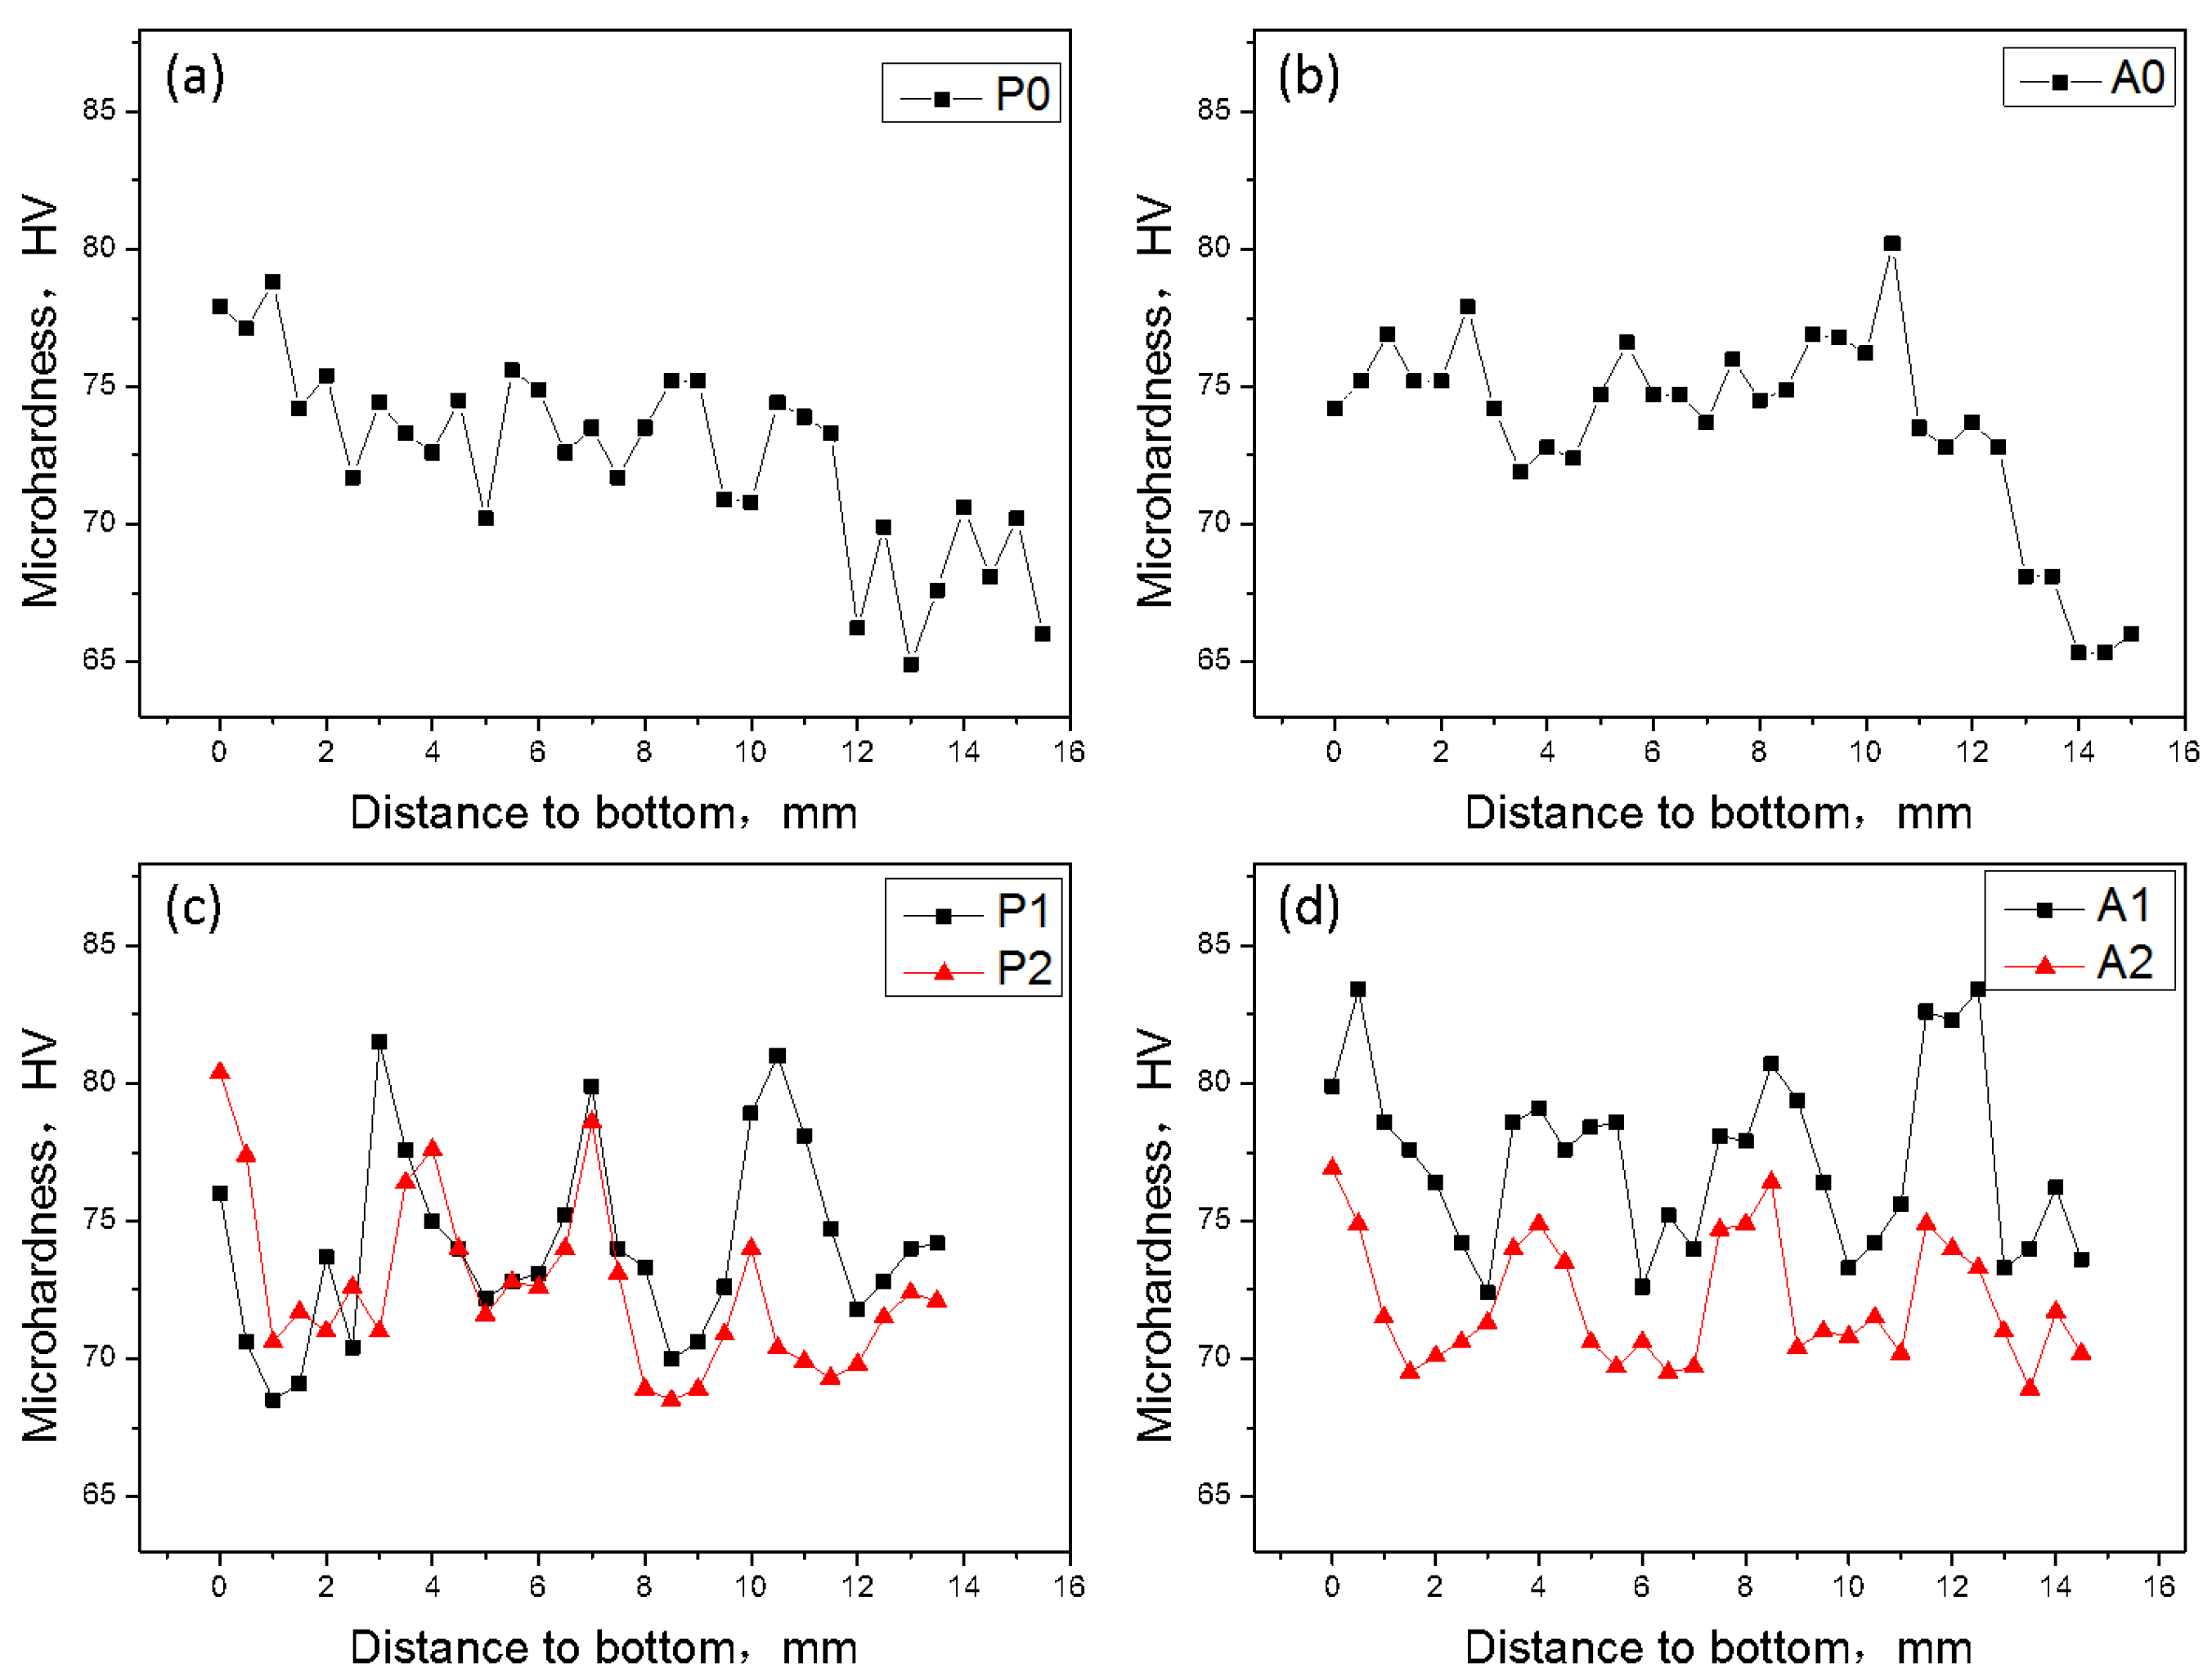
3.3. Micro Hardness
Figure 12 describes the micro hardness distributions along the height direction of these six thin wall and block samples. It can be found that the variation of micro hardness values of thin wall samples is between 70 HV and 80 HV, and evidently changes along the height direction of the deposition with the CMT-P process. However, this change is not obvious with the CMT-ADV process. The hardness value from the bottom to the middle of the samples vibrated around 75 HV, and it gradually decreased to about 68 HV in the top two layers. The mean hardness value is 72 HV (P2) and 74 HV (P1) for the block samples formed with the CMT-P process, and 72 HV (A2) and 77 HV (A1) for the block samples formed with the CMT-ADV process. The micro hardness of the block samples periodically varies along the vertical direction.
It is well known that the micro hardness is affected by the microstructure characteristics of the material. With a finer microstructure, there are more grain boundaries, which make the micro hardness increase by improving the material’s ability to resist deformation. From the analysis of
Section 3.2, it can be found that the hardness values of the samples are in accordance with the grain distribution. As shown in
Figure 12c,d, with the same process, the micro hardness value of the sample can be enhanced by reducing the heat input.
Compared with thin wall deposits, the molten pool of block samples can distribute heat to the lower and former layers effectively. In addition, there is a certain interval of cooling time between layers for the block samples, which can weaken the preheating effect of the former layer. As a result of these two aspects, the cooling rate and temperature gradient in the vertical direction of the deposition layer changed moderately, resulting in the periodical change of hardness values in block deposits.


