Article

The Reduction of Vertical Interchannel Crosstalk: The Analysis of Localisation Thresholds for Natural Sound Sources

Applied Psychoacoustics Lab, University of Huddersfield, Huddersfield HD1 3DH, UK
*
Author to whom correspondence should be addressed.
Appl. Sci. 2017, 7(3), 278; https://doi.org/10.3390/app7030278
Submission received: 8 February 2017 / Revised: 1 March 2017 / Accepted: 10 March 2017 / Published: 14 March 2017
(This article belongs to the Special Issue Spatial Audio)

Abstract

:
In subjective listening tests, natural sound sources were presented to subjects as vertically-oriented phantom images from two layers of loudspeakers, ‘height’ and ‘main’. Subjects were required to reduce the amplitude of the height layer until the position of the resultant sound source matched that of the same source presented from the main layer only (the localisation threshold). Delays of 0, 1 and 10 ms were applied to the height layer with respect to the main, with vertical stereophonic and quadraphonic conditions being tested. The results of the study showed that the localisation thresholds obtained were not significantly affected by sound source or presentation method. Instead, the only variable whose effect was significant was interchannel time difference (ICTD). For ICTD of 0 ms, the median threshold was −9.5 dB, which was significantly lower than the −7 dB found for both 1 and 10 ms. The results of the study have implications both for the recording of sound sources for three-dimensional (3D) audio reproduction formats and also for the rendering of 3D images.

1. Introduction

In audio reproduction systems for three-dimensional (3D) sound, such as Auro 3D [1] and Dolby Atmos [2], the loudspeakers can generally be divided into two layers: the lower (main) layer and the upper (height) layer. In the context of sound recording made using a microphone array in an acoustic space, the frontal loudspeakers of the main layer, which are located on the horizontal plane, are predominantly used for sound source positioning. Conversely, the height layer, which is typically elevated by between 30° and 45°, primarily aims to enhance the perceived listener envelopment (LEV) by presenting ambient signals, although it can also be used to reproduce elevated sound sources. When recording for such formats, it is necessary to pay close attention to the amount of direct sound present in the height layer signal. The reason for this is as follows. Should there be excessive direct sound in the height layer then, at the reproduction stage, sound sources may be perceived as vertically-oriented phantom images at intermediate positions between the main and height loudspeaker layers. Additional spatial and timbral effects may also be perceived, depending on the time and level relationships between the direct sounds in the respective layers. Collectively, these properties comprise an interference effect referred to as ‘vertical interchannel crosstalk’.
To date, the few studies that have considered vertical interchannel crosstalk have primarily been concerned with preventing the direct sound present in the height layer from affecting the perceived location of the main channel signal. Although this has received little attention in the literature, suggestions as to the nature of the effect can be garnered from studies undertaken within the context of vertical amplitude panning. Within such studies, the literature generally agrees that increases in interchannel level difference (ICLD) between vertically arranged stereophonic loudspeakers will cause the resultant phantom image to be localised in a position biased towards the loudspeaker of greater amplitude [3,4,5,6,7]. Despite this, such studies do not necessarily indicate that sufficient ICLD alone will prevent the signal in the height layer from affecting the perceived location of the main channel signal. For example, whilst Barbour [5] demonstrated that ICLDs between 6 and 9 dB resulted in the perceived phantom image position matching the physical position of the lower loudspeaker for pink noise and speech sources, Somerville et al. [3] and Kimura and Ando [7] found that the phantom images remained somewhat elevated for ICLDs up to and including 15 dB when the test stimuli were musical sources, pink noise and speech. It should be noted that differences in the experimental setup and, in particular, the physical position of the loudspeakers might have contributed to these differences in results.
With respect to more direct experiments into the effects of vertical interchannel crosstalk, Lee [8] conducted an analysis into the ‘localisation threshold’, which was defined as the minimum amount of attenuation of direct sound necessary in the height layer for the main channel signal to be localised at the position of the main layer. It is important to note that the localisation threshold is not a complete masking of the direct sound in the height layer. Instead, although the perceived location of the main channel signal would be unaffected, the aforementioned spatial and timbral effects of vertical interchannel crosstalk would remain somewhat audible. In [8], cello and bongo sources were presented from vertically-arranged stereophonic loudspeakers located directly in front of the listening position. With respect to the listening position, the lower (main) loudspeaker was not elevated, whilst the upper (height) loudspeaker was elevated by 30°. Delays ranging from 0 to 50 ms were applied to the height loudspeaker with respect to the main. A subsequent study conducted by Stenzl et al. [9] was generally similar, although for that study phantom images were formed between diagonally-arranged loudspeakers (e.g., the left loudspeaker in the main layer and right loudspeaker in the height layer). In addition, their test stimuli also included male speech alongside the cello and bongo sources. The results of both studies revealed the following with respect to localisation thresholds. Firstly, for delays in the range of 0–10 ms, they were not significantly affected by interchannel time difference (ICTD). In addition to this, the effect of sound source was not significant. The thresholds reported by each study then, for ICTDs up to 10 ms, were in the range of −6 to −7 dB, which shows good agreement with the amplitude panning experiments of Barbour [5] and Wendt et al. [6].
From a practical standpoint, the results presented in [8] and [9] can be used to influence techniques both for the rendering of 3D images and for the design of microphone configurations for recording in 3D audio formats. In either case, the results are informative as to the maximum levels of direct sound that can be present in the height layer without the perceived location of the main channel signal being affected. For example, with respect to microphone techniques, it can be seen that the direct sound in the height layer must be attenuated by a minimum of 6 dB when the spacing between the main and height layers of microphones is less than 3.4 m (corresponding to an ICTD of 10 ms). This can be achieved through the use of cardioid microphones in the height layer. In the case that a vertically-coincident configuration is used, angling the height microphones at least 90° away from the sound source should provide the necessary attenuation, as was suggested in [8]. The microphones in the main layer should be positioned on axis with respect to the sound source.
In a more recent study conducted by the authors [10], it was demonstrated that localisation thresholds have a frequency dependency. Octave bands of pink noise, with centre frequencies ranging from 125 Hz to 8 kHz, as well as broadband pink noise, were presented to subjects from vertically-arranged stereophonic loudspeakers in an anechoic chamber. Delays ranging from 0 to 10 ms were applied to the height layer with respect to the main. The results of the study showed that the localisation thresholds were not significantly affected by ICTD, which agreed with the results reported in [8,9]. The thresholds for the 125 and 250 Hz bands were in the range of −3 to −5 dB, which was significantly higher than the −9 to −11 dB thresholds found for the 1, 2 and 8 kHz bands. In addition, the threshold for the broadband source was the lowest of all stimuli tested, being −11.5 dB. These results seem to provide an implication for the analysis of localisation thresholds for natural sound sources with different spectral balances; it might be suggested that the threshold for a high frequency dominant source would be lower than that for a low frequency dominant source. As mentioned above, previous studies [8,9] reported that the localisation threshold was not source dependent. However, since the sources used in those studies were somewhat limited (cello and bongo in [8], cello, bongo and speech in [9]), a wider range of sources would need to be tested in order to confirm the source dependency of the localisation threshold.
Of further interest in the present study is how localisation thresholds are affected by the way in which the test stimuli are presented to subjects (the presentation method). In two recent localisation experiments conducted by the authors [11,12], continuous broadband pink noise was presented to subjects from loudspeakers arranged in two layers. The loudspeakers positioned on the main layer were not elevated with respect to the listening position, whilst those in the height layer were elevated by 30°. In the first experiment [11], each layer consisted of a single loudspeaker positioned with 0° azimuth. Under such conditions, localisation judgments for the pink noise sources were accurate. Conversely, in the second experiment [12] each layer consisted of stereophonic loudspeakers with a base angle of 60° (±30°). The results of this study showed that the pink noise was perceived as being elevated with respect to the physical position of each layer. This difference in results is indicative of the phantom image elevation effect, in which stimuli are perceived as being more elevated when presented as stereophonic phantom images compared to single source only presentation [13,14]. This has notable implications for the reduction of vertical interchannel crosstalk. If main channel images are elevated with respect to the physical position of the main channel layer as a result of the phantom image elevation effect then it could be argued that the location-based effects of vertical interchannel crosstalk would be less distracting. Consequently, the localisation threshold might be much lower under such circumstances or, alternatively, might not be necessary at all. It is therefore of interest to determine how the localisation thresholds would vary when stimuli are presented as vertically-arranged quadraphonic phantom images compared to for vertical stereophonic presentation.
From the above background the following research questions were derived:
  • Does there exist a sound source dependency for localisation thresholds?
  • How do localisation thresholds vary for vertical quadraphonic stimulus presentation compared to vertical stereophonic?
The present paper is organised as follows. An experiment is first described in which the effects of sound source, presentation method and ICTD on localisation threshold were analysed. Following this, a second experiment is presented in which the thresholds obtained in the first experiment were applied to sound sources and verified in localisation tests. The paper concludes with discussions pertaining to the results of each experiment, as well as the implications for image rendering and microphone techniques. This also includes suggestions for future work.

2. Experiment One: Localisation Thresholds for Natural Sound Sources

2.1. Materials and Methods

2.1.1. Physical Setup

Figure 1 shows the physical setup used for the experiment, which was conducted in the ITU-R BS.1116-compliant listening room [15] at the University of Huddersfield. The experiments utilised six Genelec 8040A loudspeakers, which were arranged in two layers, ‘height’ and ‘main’. The main layer consisted of centre (C), left (L) and right (R) loudspeakers, which were each positioned 1.2 m above the ground and 2 m from the listening position. With respect to the listening position, the centre loudspeaker was located at 0° azimuth, with the left and right loudspeakers at ±30°. The height layer comprised the three remaining loudspeakers each positioned 1.15 m directly above a loudspeaker in the main layer: Height Left (HL), Height Right (HR) and Height Centre (HC). With respect to the listening position, the main layer was not elevated, whilst the height layer was elevated by 30°. Appropriate time and level alignment was applied to the main layer with respect to the height layer to accommodate for the difference in distance between the loudspeakers in each layer and the listening position. An acoustically-transparent curtain was positioned between the listening position and the loudspeakers in order to obscure the nature of the test setup from subjects. The ear height of subjects was aligned to the centre point between the woofer and tweeter on the main layer of loudspeakers using a height-adjustable chair.

2.1.2. Test Stimuli

The test stimuli used for the experiment were anechoically-recorded guitar, speech, conga, quartet and oboe excerpts (Figure 2). These stimuli were chosen primarily due to their variations in spectral content. The predominant energy of the oboe source, for example, was in the range of 600 Hz–2 kHz, with notable peaks around 700 Hz and 1.5 kHz, whilst that for the conga ranged from 150 to 500 Hz. Given that in [10] it was reported that the localisation thresholds for low frequency octave bands were significantly higher compared to those for the mid-high frequency bands, it was thought that these two sources in particular would be beneficial in analysing the source dependency of localisation thresholds for natural sound sources. The speech source was chosen due to its broadband nature. It was reasoned that if a source dependency could be identified based on frequency then the inclusion of a wideband source would potentially make it possible to identify the frequency region that is more dominant when determining the localisation threshold for broadband sources. The guitar and quartet sources were chosen due to their varying balance between low and high frequency content, which was greater for the quartet compared to the guitar (although both were more dominant in the region below 1 kHz). This again was due to the aim of analysing whether or not the frequency dependency of localisation thresholds could translate to complex sound sources. It should also be noted that the sources contained a varied blend of continuous and transient characteristics, as can be seen in Figure 2, although it has not yet been reported in the literature how this would affect the localisation threshold.
The test stimuli were presented to subjects as vertically oriented phantom images using the following two conditions (Figure 3):
  • Vertical stereophonic: stimulus presentation from the C (main layer) and HC (height layer) loudspeakers.
  • Vertical quadraphonic: stimulus presentation from the L, R (main layer), HL and HR (height layer) loudspeakers.
For each condition, the resultant phantom image was formed directly in front of the subject (i.e., on the median plane). The height layer was delayed with respect to the main layer for both conditions by 0, 1 and 10 ms. The delay times were chosen to emulate different spacings between the main and height microphone layers in the context of concert hall recording, with 10 ms being a likely maximum spacing (3.4 m path difference between the direct sound arriving at the main and height layers, respectively). In total, there were 30 stimuli (five sources, three delay times and two presentation methods). The amplitude of each stimulus at the listening position when presented from the main layer only (either C or L and R) was 70 dB LAeq. The amplitude of the stimulus when presented as a phantom image was dependent on the amplitude of the height layer relative to the main, which was to be varied by the subject as described in Section 2.1.4.

2.1.3. Subjects

Ten subjects, comprising staff and both postgraduate and final year undergraduate students from the University of Huddersfield’s Music Technology courses, participated in the listening tests. These subjects were chosen due to their critical listening experience in spatial audio, making them better suited than more naïve subjects to determine the subtle localisation differences caused by vertical interchannel crosstalk. They all reported normal hearing.

2.1.4. Test Method

For each stimulus, subjects were presented with a ‘test’ and ‘reference’ sound. The ‘reference’ was the stimulus presented from the main layer only. The ‘test’ sound was the stimulus presented as a vertically-oriented phantom image with one of the three test ICTDs applied to the height layer. For each ‘test’ sound, subjects were required to reduce the amplitude of the height layer until they perceived the location of the resultant phantom image to be matching that of the ‘reference’. To ensure the localisation threshold was found in each case, they were asked to set the amplitude of the height layer to the highest possible point at which this condition was met.
The threshold detection method used in the current study was based on the method of adjustment (MOA). This is an indirect scaling method that requires subjects to reduce the amplitude of a stimulus until it is equivalent to that of a reference [16]. Cardozo [17] asserted that the principal application of MOA is in situations whereby stimuli differ from one another by more than one attribute. This was applicable to the present study, as, although subjects were tasked with identifying localisation shifts, there would inevitably be some timbral changes due to the use of ICTD. However, despite such benefits, the MOA is limited in that it presents subjects with a large range from which to find the threshold, making it difficult for answers to be precise [18]. This limitation was addressed for the present experiment by requiring subjects to complete a three-stage MOA for each stimulus. Each stage was designed to be a more refined version of the previous stage as follows:
  • Stage 1: The amplitude of the height layer could be adjusted from 0 to −25 dB in 5-dB steps. The localisation threshold was therefore found to within 5 dB.
  • Stage 2: The amplitude of the height layer could be adjusted in the 5-dB range determined by the previous stage. The step size was 1 dB.
  • Stage 3: The amplitude of the height layer could be adjusted in the 1-dB range determined by the previous stage. The step size was 0.25 dB.
This method can be considered as combining the standard MOA with adaptive testing. Adaptive threshold detection methods, which include Parameter Estimation by Sequential Testing (PEST) [19] and Up-Down [20], present stimuli to subjects at amplitudes determined by the history of the test run. This allows testing to be made at levels closer to the threshold, increasing efficiency [20]. It was however decided against using an adaptive method outright based on research conducted by Hesse [21], which indicated that the subsequent duration of the test is between three and five times longer compared to when MOA is used. As the method used for the present experiment used elements of both MOA and adaptive testing, it was named as an ‘adaptive method of adjustment’ (AMOA). It was considered that this fusion of methods would improve the accuracy of the test, whilst still making it relatively quick and easy for subjects to complete. The graphical user interface for the AMOA task was created using the Max7 software (Cycling’74, Walnut, CA, USA).
During the test, subjects were strictly instructed to face forwards, keeping their head still and using only their eyes to look at the test interface. The heads of subjects were not fixed, however head movements were monitored using a motion tracker device [22]. The tracker instructed subjects if their head position had deviated from an acceptable range of natural motion (10 mm in any direction). Additionally, a guide point for the ear height and distance was placed on the right hand side of the subject to help maintain the correct listening position throughout the test. Prior to the start of each test, all subjects sat a supervised practice, which utilised a speech source, in order to ensure that the instructions were understood. The test was completed in two sittings, each of which contained 15 stimuli and lasted around 20 min. The order of the tests, as well as the stimulus order, was randomised for each subject.

2.2. Results

2.2.1. The Effect of Presentation Method

Figure 4 shows the median localisation thresholds for each stimulus at each ICTD for both presentation methods. The medians have been plotted with notch edges, which is a method suggested by McGill et al. [23]. In general, there is considerable overlap between the notch edges for each presentation method, which, according to [23], indicates that pairs of stimuli are not significantly different from one another with 95% confidence. However, it is clear that in some cases the overlap between notches is minimal (e.g., conga at 1 ms, quartet at 10 ms). In order to analyse this further, the results for vertical stereophonic and quadraphonic presentation were compared for each stimulus using Wilcoxon tests. The critical p value was 0.05. According to this analysis, the effect of stimulus presentation was only significant for the Oboe with ICTD of 0 ms (p = 0.036). However, it is clear from Figure 4 that there is a large overlap between the notch edges for this stimulus. In addition to this, the effect size r calculated based on Cohen [24] was 0.49, which is not considered as being a large effect [24]. It could be argued then that the significant effect identified in the Wilcoxon test was a type-I error, being a false positive when in fact there is no true effect [25]. It can therefore be concluded that the effect of presentation method on the localisation thresholds obtained was not significant.

2.2.2. The Effect of ICTD

As it was identified that the effect of stimulus presentation on the localisation threshold was not significant, the results for stereophonic and quadraphonic presentation were combined. Figure 5 shows the effect of ICTD on the localisation thresholds obtained, with combined results for stimulus presentation. As before, the median localisation thresholds have been plotted with notch edges. Consideration of the notch edges suggests that the effect of ICTD on the localisation threshold was significant for at least some of the sound sources. The median threshold for the guitar, for example, looks significantly lower for 0 ms (−10 dB) than for 1 and 10 ms (−7.5 dB). Equally, the quartet at 0 ms (−9.5 dB) looks significantly lower than for 1 ms (−6 dB). Friedman tests (critical p value = 0.05) showed that the effect of ICTD was significant for the guitar (p = 0.002), speech (p = 0.021) and quartet (p = 0.005). The effect was not significant for the oboe (p = 0.418) and conga (p = 0.788). A Wilcoxon test was subsequently conducted for the guitar, speech and quartet sources, with the Bonferroni correction being applied to reduce type-I errors [26]. The results showed the following: For the guitar, significant differences were identified between the 0-ms ICTD and both the 1-ms (p = 0.015) and 10-ms (p = 0.027) ICTDs. For speech, there were significant differences between the 10 ms ICTD and both the 0 ms (p = 0.012) and 1 ms (p = 0.024) ICTDs. For the quartet, the 0-ms and 10-ms (p = 0.015) ICTDs were significantly different from one another. These results generally agree with the notch edges shown in Figure 5, although there are some small differences. It can therefore be concluded that the effect of ICTD on localisation threshold was significant.

2.2.3. The Effect of Sound Source

Figure 6 shows the median localisation thresholds for each stimulus at each ICTD. The medians have been plotted with notch edges. The notch edges alone suggest that the effect of sound source on the localisation threshold was not significant. However, it should be noted that there are a number of notch edges that have minimal overlap (e.g., the guitar and oboe at 0 ms). A Friedman test conducted on the data indicated that the effect of sound source was significant for the 0 (p = 0.001) and 10 ms (p = 0.039) ICTDs. A Wilcoxon test was subsequently conducted to identify which pairs of stimuli were significantly different from one another, again with the Bonferroni correction being applied. The results of this analysis showed no significantly different pairs for the 10 ms ICTD. This suggests that sound source had no significant effect on the localisation threshold for this ICTD, which agrees with the overlap of notch edges in Figure 6. It should also be noted that although the overlap between conga and speech is notably minimal, the effect size indicated a small effect (r = 0.28). For the 0 ms ICTD, significant differences were identified between the oboe and both the guitar (p = 0.01) and speech (p = 0.05). However, the effect size was not large in either case (r = 0.49 between the oboe and guitar and r = 0.42 between the oboe and speech). In addition, there is overlap between all notch edges. Further, the effect size (Kendall’s W), which was calculated during the Friedman test, was low (0.262). Based on this analysis, it can therefore be concluded that the effect of sound source on localisation threshold was not significant. This would suggest that the same localisation thresholds could be applied to all sources tested in the present study.

2.2.4. Localisation Thresholds for Combined Sources

As it was shown that the effect of sound source on the localisation threshold was not significant, the results for each sound source were combined. This is shown in Figure 7. The median threshold for sources with 0 ms ICTD was −9.5 dB. Based on the notch edges, the threshold for this ICTD appears to be significantly lower than the −7 dB median threshold found for the 1 and 10 ms ICTDs. This significance was confirmed with the results of both Friedman (p = 0.000), and Wilcoxon (p = 0.01 between 0 ms and 1 ms, p = 0.00 between 0 ms and 10 ms) tests. It can therefore be concluded that the only variable whose effect was significant on the localisation thresholds obtained in the present study was ICTD. The effects of sound source and presentation method were not significant.

3. Experiment Two: Verification of the Localisation Thresholds

3.1. Materials and Methods

3.1.1. Physical Setup

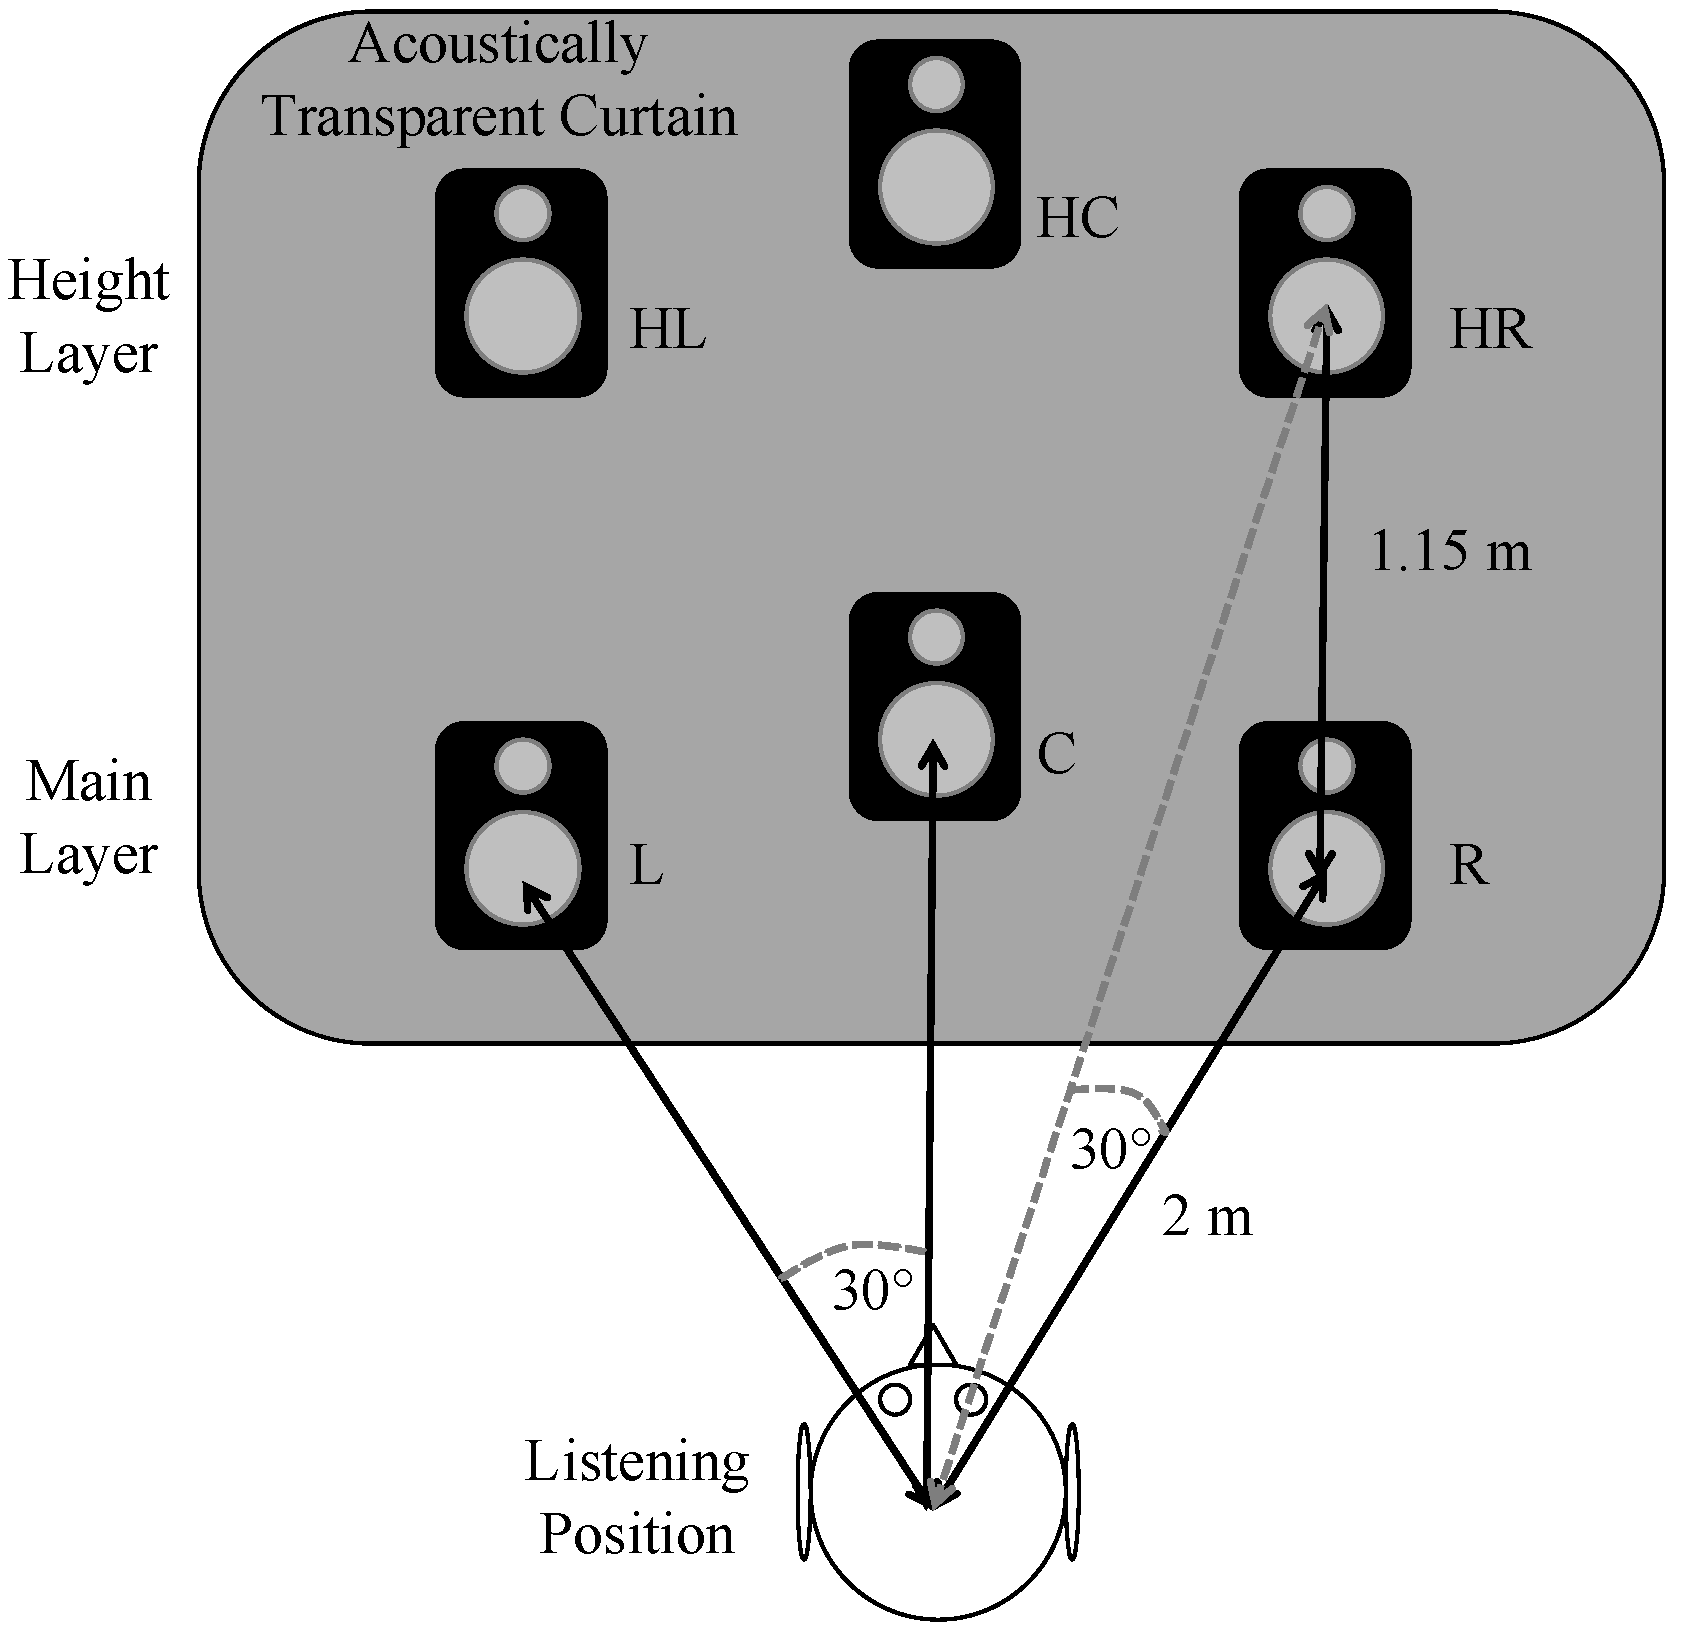
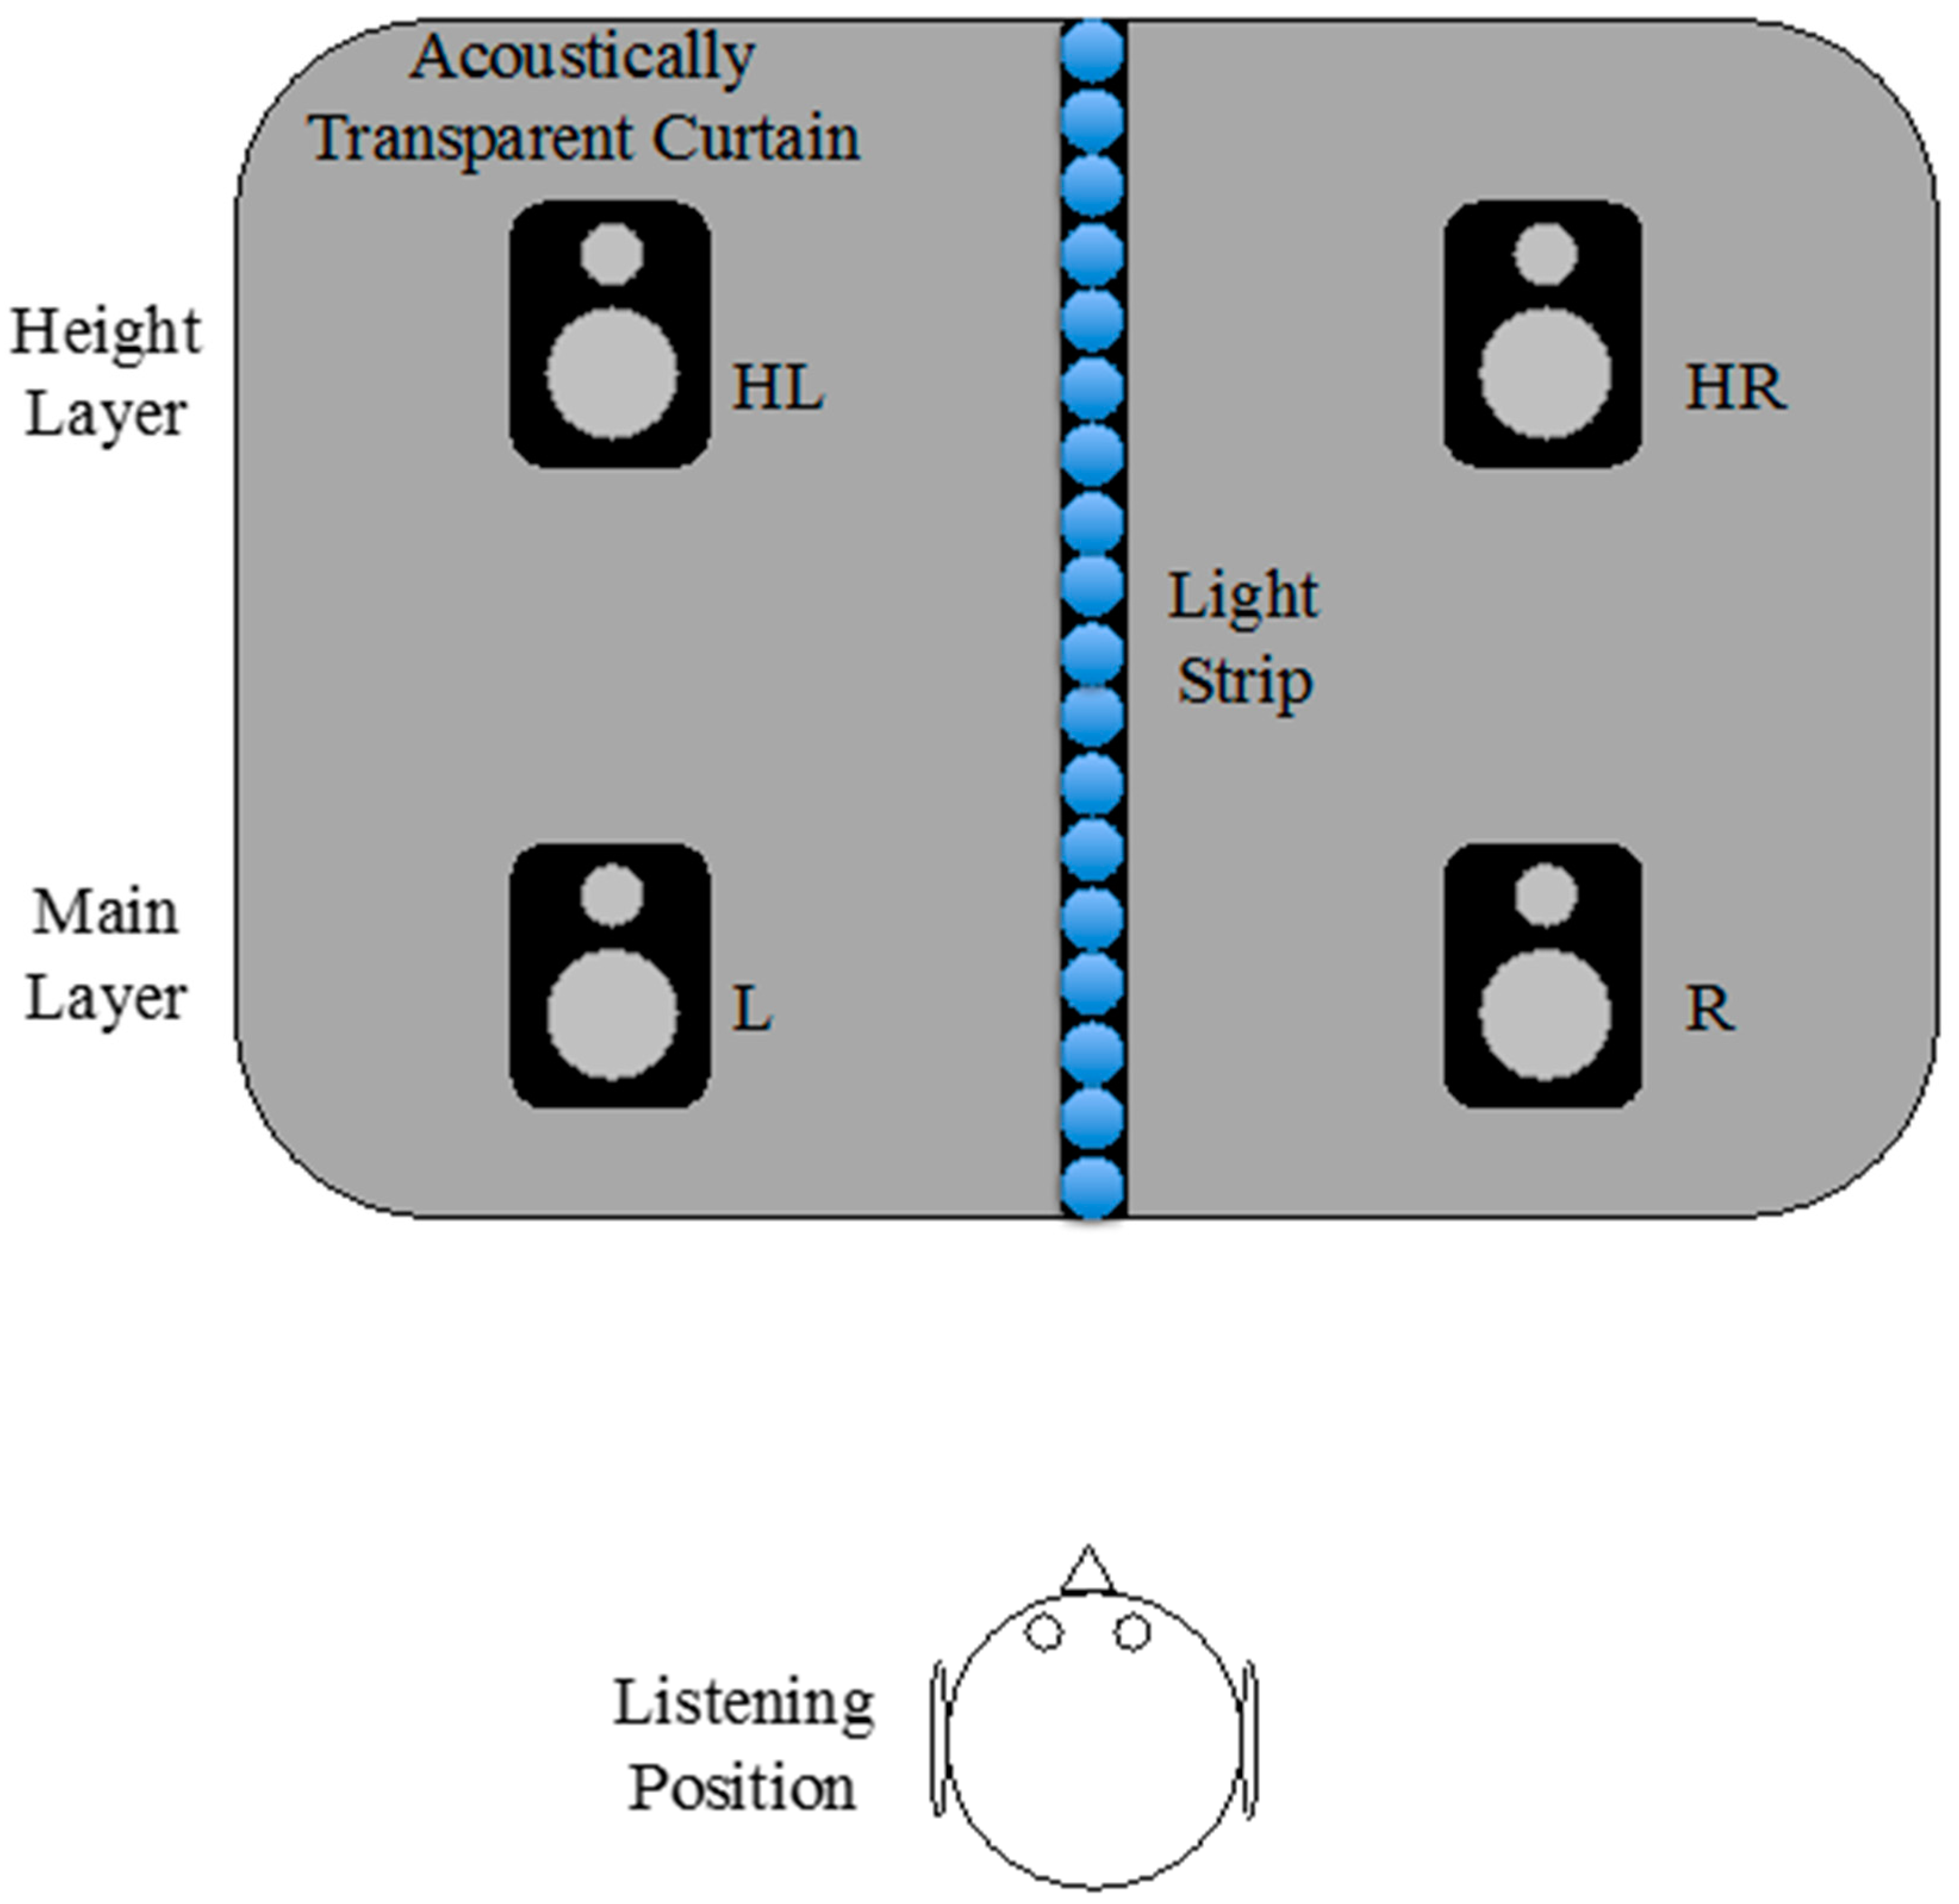
The physical setup for the verification test is shown in Figure 8. The experiment was conducted in the same room as was used in Experiment One and used an almost identical setup. However, as Experiment One demonstrated that the localisation thresholds were not affected by presentation method, only the L, R, HL and HR loudspeakers were used (i.e., the vertical quadraphonic condition); the C and HC loudspeakers were removed. The vertical quadraphonic condition was favoured to the vertical stereophonic condition as existing 3D audio systems, such as Auro 3D [1], tend to make use of elevated L and R loudspeakers, however they do not always use an elevated centre loudspeaker. It was therefore considered that the vertical quadraphonic condition would be more relevant to practical situations. A light-emitting diode (LED) strip was positioned directly in front of the listening position. This was located behind the acoustically-transparent curtain and was to be used by subjects to make localisation judgments.
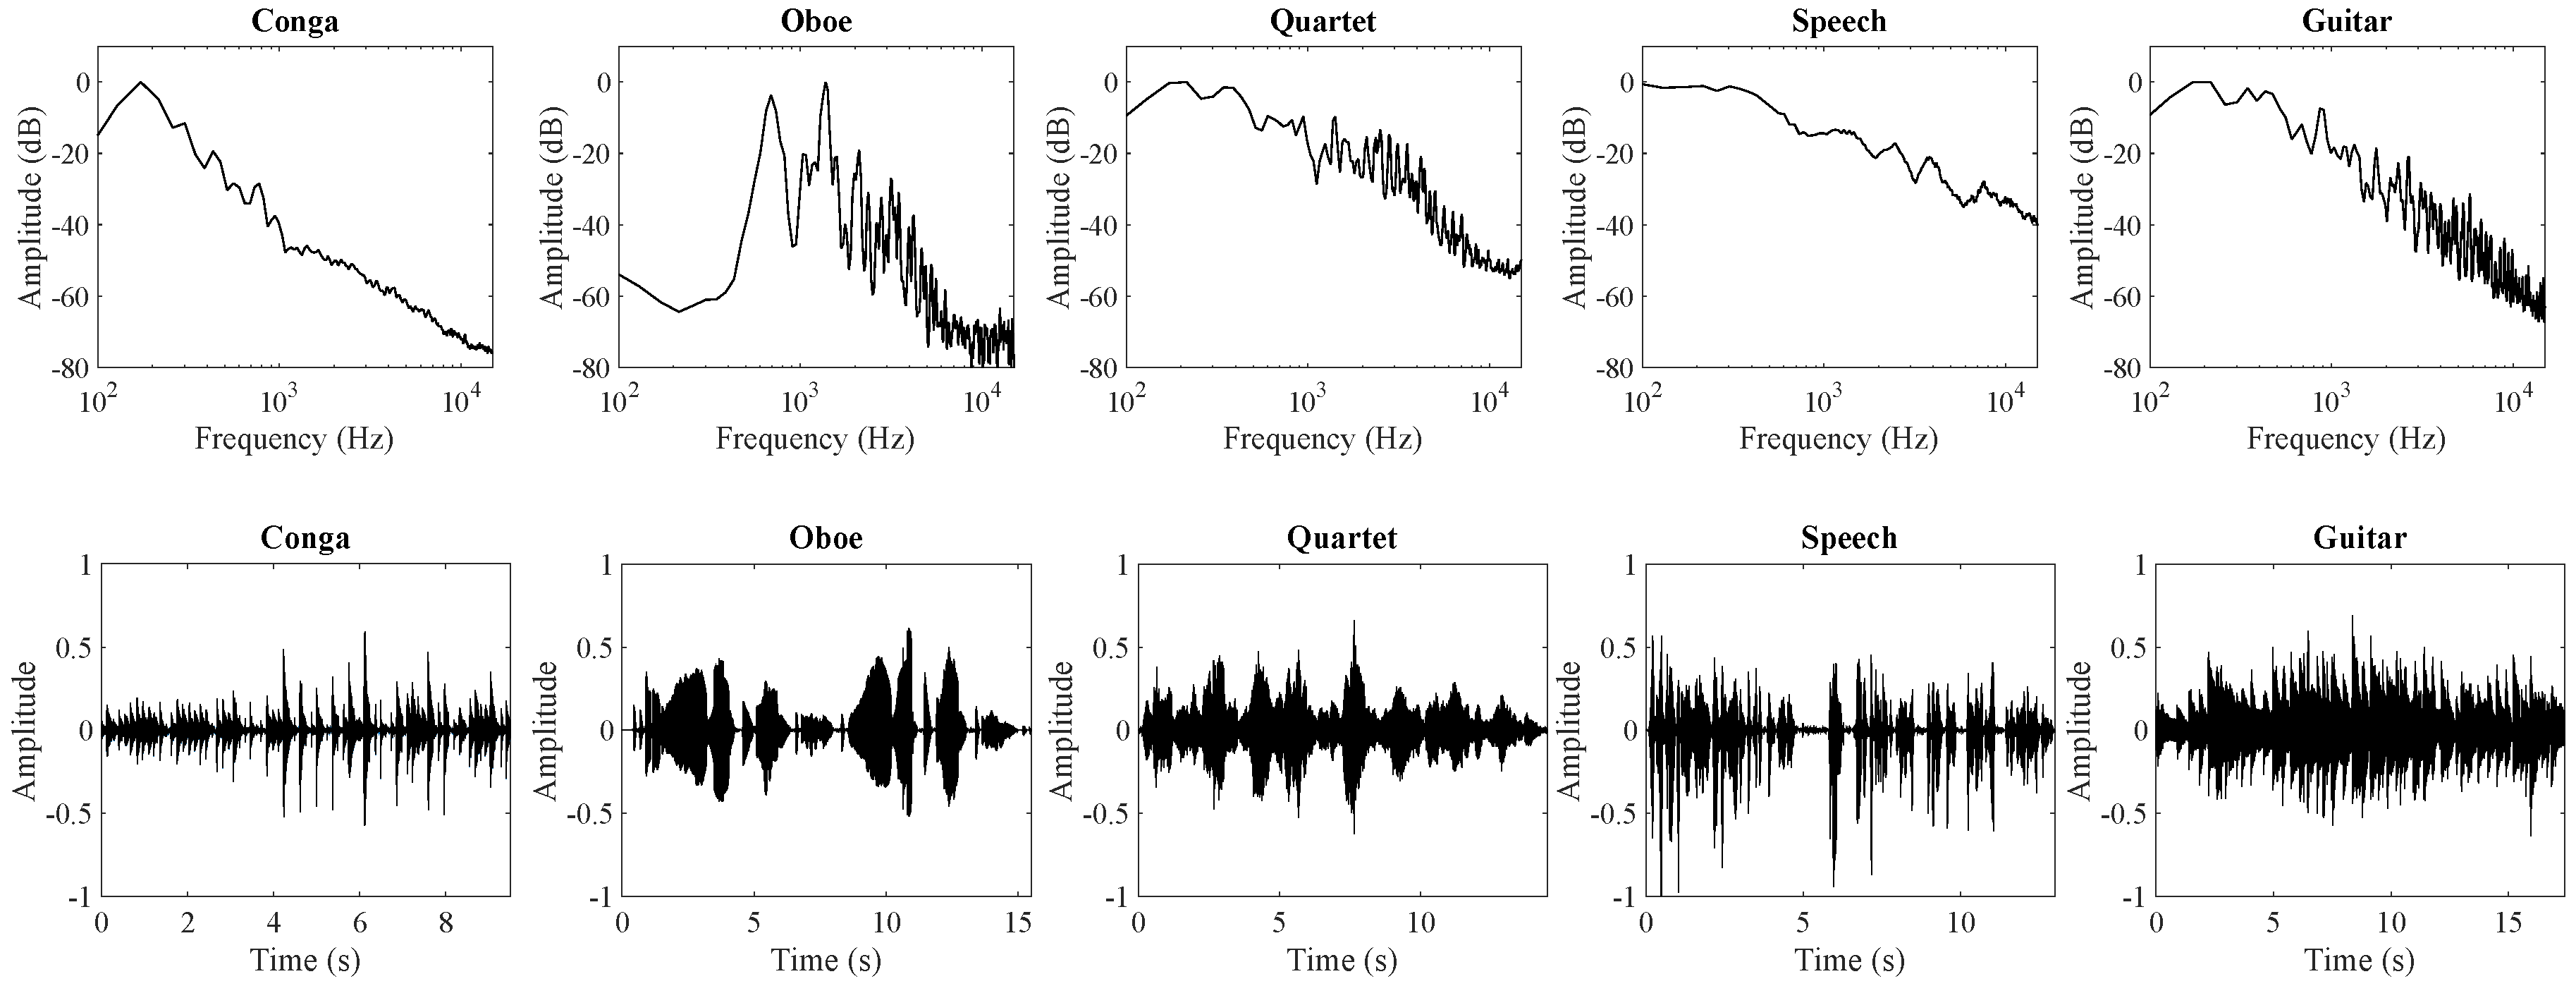
3.1.2. Test Stimuli

The stimuli used for the experiment were the same sources used in Experiment One. The test stimuli were presented to subjects in the following conditions: (1) main layer only; (2) height layer only; (3) vertically oriented phantom image with 0 dB interchannel level difference (ICLD) and; (4) vertically oriented phantom image with the localisation threshold applied to the height layer. The ICTDs applied to the height layer for the phantom image conditions were 0 and 1 ms. The 10 ms condition was not tested for the following reasons. Firstly, as there was no significant difference between the localisation thresholds obtained for 1 and 10 ms it was deemed unnecessary to test both conditions. Furthermore, as discussed earlier, 10 ms represents a condition whereby the path difference between the direct sound arriving the main and height layers respectively is around 3.4 m, which is fairly large in practice. It was therefore decided that the 1-ms condition would be more representative of a practical configuration, with the resultant path difference being only around 0.34 m.
Although not necessarily integral to the verification test, the 0-dB ICLD and height layer only conditions were included in the experiment in order to reduce any expectation biases. During preliminary tests, in which only the main layer only and localisation threshold conditions were considered, subjects reported that hearing all stimuli originate from the same position in a localisation test was confusing. Furthermore, some were led to believe that the stimuli could not all be coming from the same location and this forced them to provide different answers to what was actually being perceived. The height layer only and 0-dB conditions were therefore included in order to introduce stimuli that were in a position away from the main layer only condition. This was found to prevent the issue.
All stimuli were presented at 70 dB LAeq at the listening position when presented from the main layer only. The increase in amplitude when the stimuli were presented as vertically arranged quadraphonic phantom images was dependent on the localisation threshold applied to the height layer. In the case of the 0-ms condition, the height layer was attenuated by 9.5 dB with respect to the main layer, whilst for 1 ms the attenuation was 7 dB, which was based on the results from Experiment One. In total, there were 30 stimuli, being the main and height layer-only conditions (10), the localisation threshold conditions (10—five sources, two ICTDs) and the 0-dB ICLD conditions (10—five sources, two ICTDs).

3.1.3. Test Method

The test was completed by the same 10 subjects who participated in Experiment One. Localisation judgments were made using the LED strip located directly in front of the listening position. For each test, subjects were provided with a handheld knob, which controlled which LED on the strip was turned on. Subjects were required to adjust the knob until the position of the active LED matched the perceived location of the focal point of each stimulus. This method was chosen following research conducted by Lee et al. [27], who found that it was faster and produced results with greater accuracy and consistency compared to the numbered scale method, which had been used in a number of previous vertical localisation studies [11,28,29]. The position of the LED selected for each stimulus was converted into an elevation angle. The heads of subjects were not fixed, however they were instructed to sit up and face forwards at all times, using only their eyes to look at the light strip. To help maintain the correct seating position, a small headrest was positioned behind the head of each subject. The test was completed four times by each subject, with each sitting containing all 30 stimuli and taking around 10 min to complete. The presentation order of stimuli was randomised for each test.

3.2. Results

Levene and Shapiro–Wilk tests were first conducted, using the SPSS Statistics 22 software (IBM, New York, NY, USA), in order to determine the suitability of the collected data for parametric statistical analysis. The Shapiro–Wilk test showed that not all scores in each condition featured normal distribution, although the results of the Levene test showed homogeneity of variance for all sound sources. For these reasons, non-parametric tests were chosen for the statistical analysis.
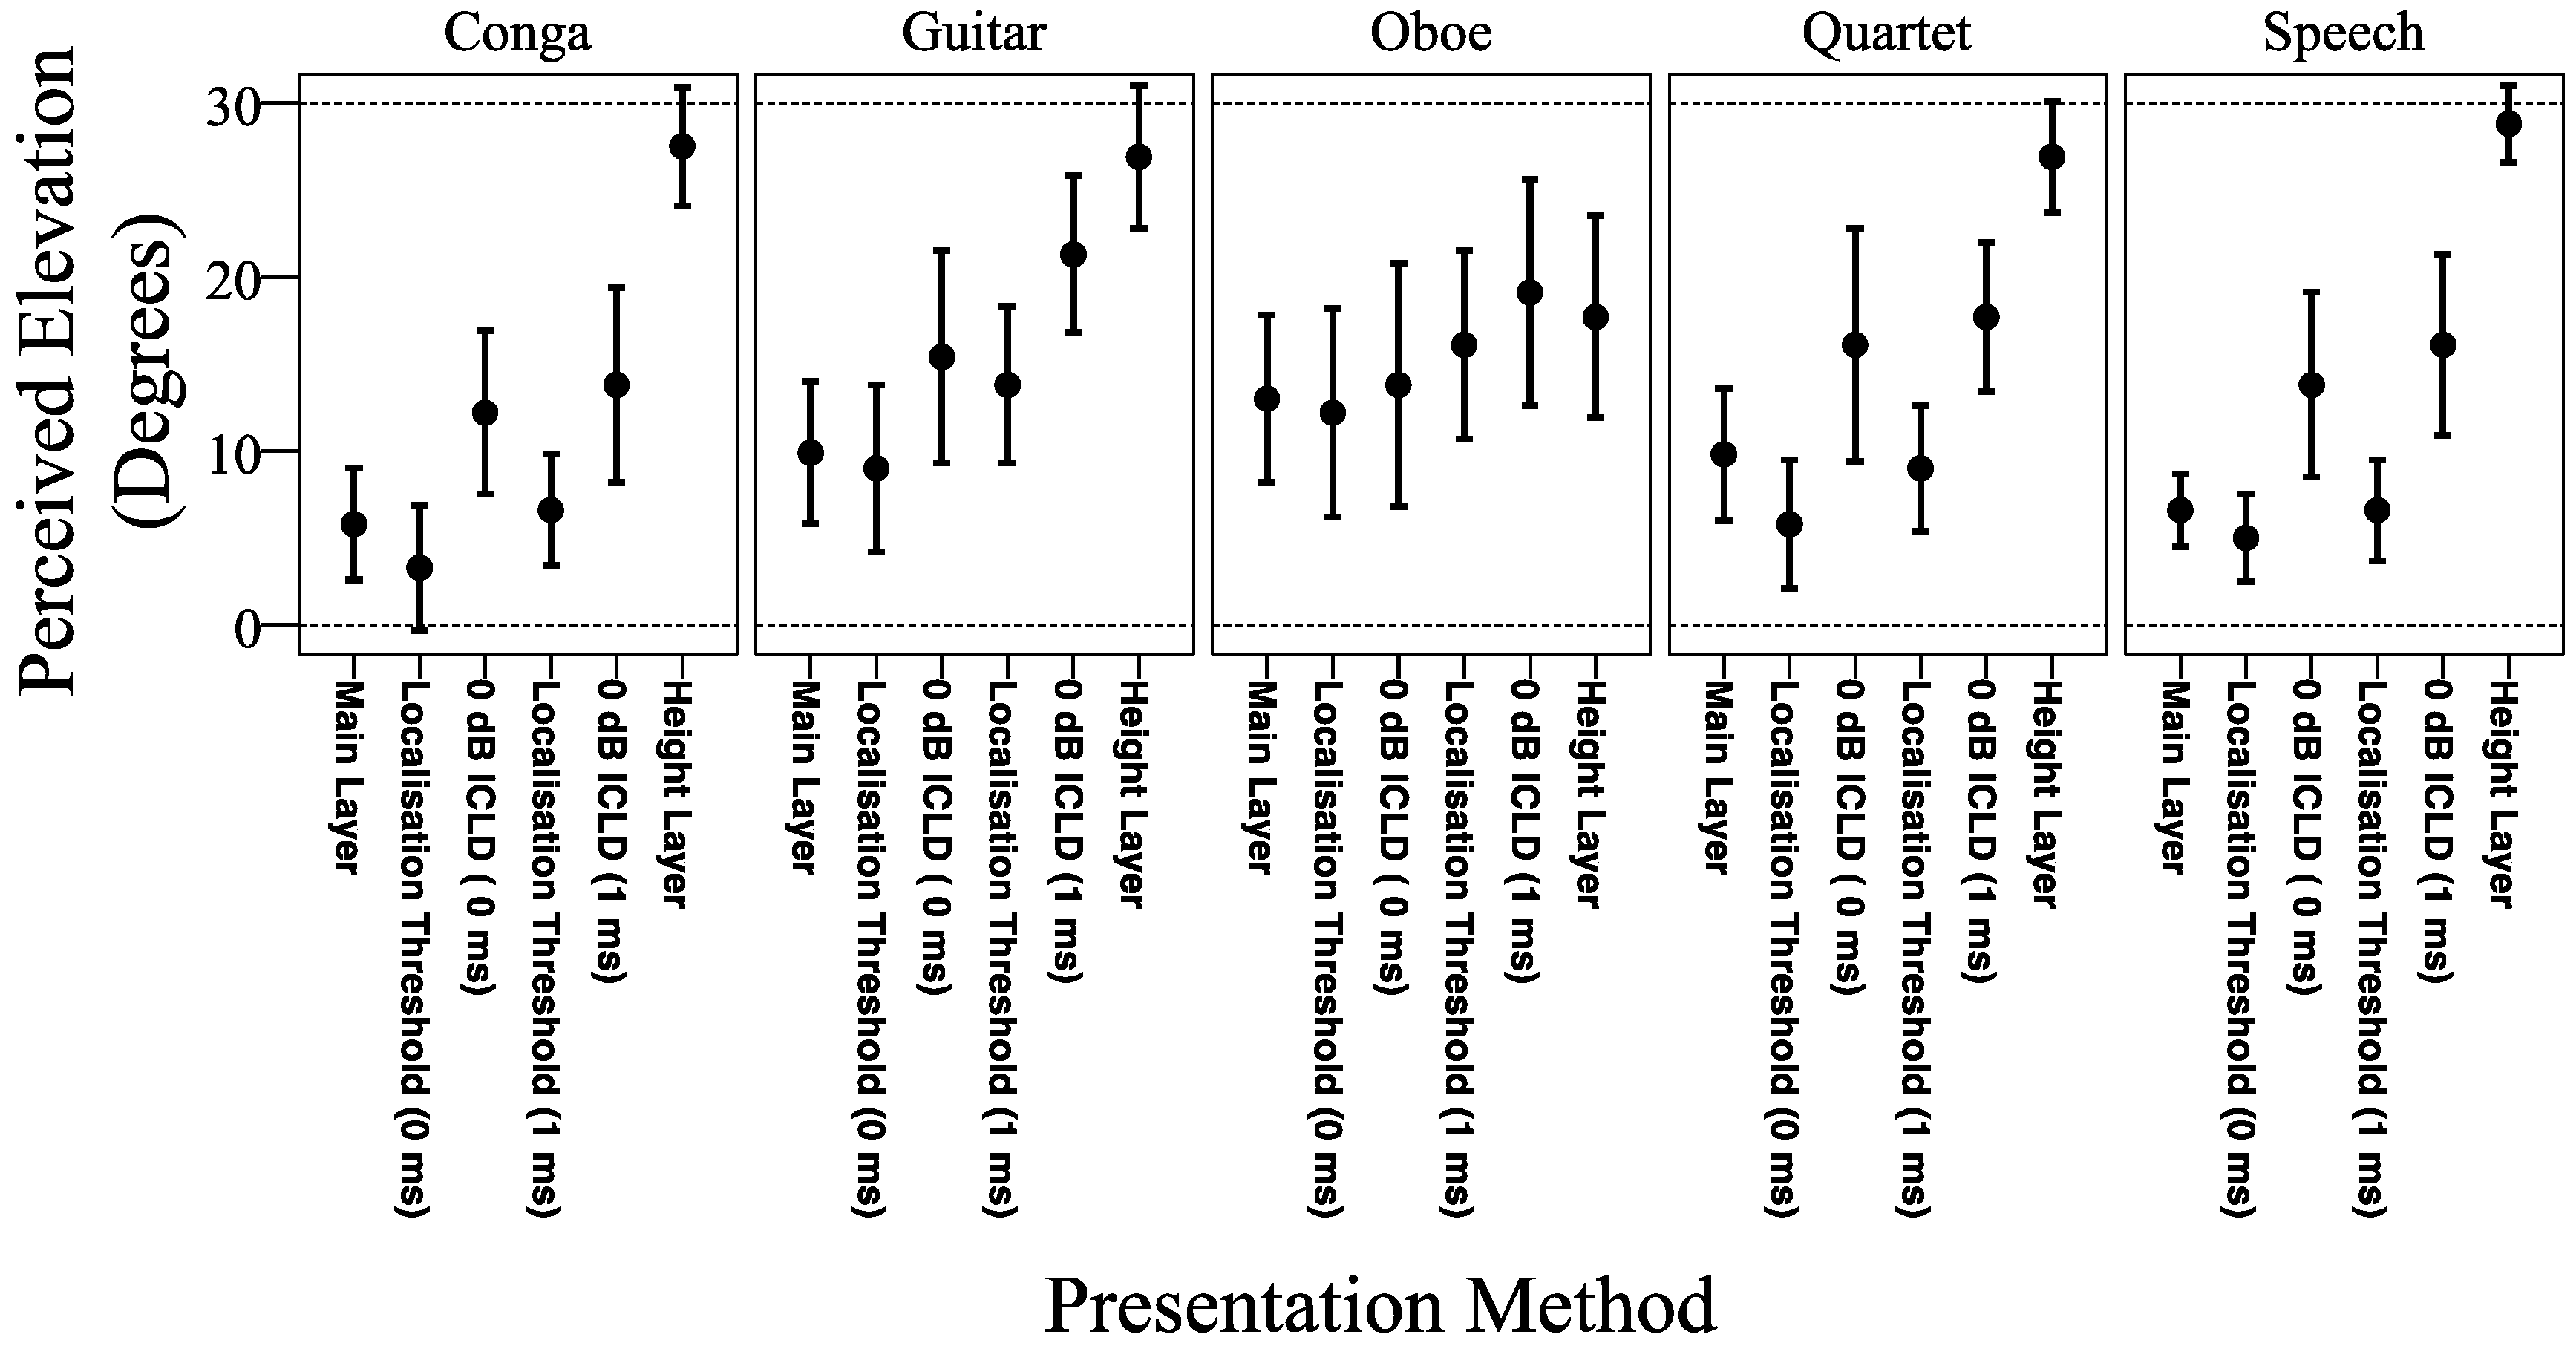
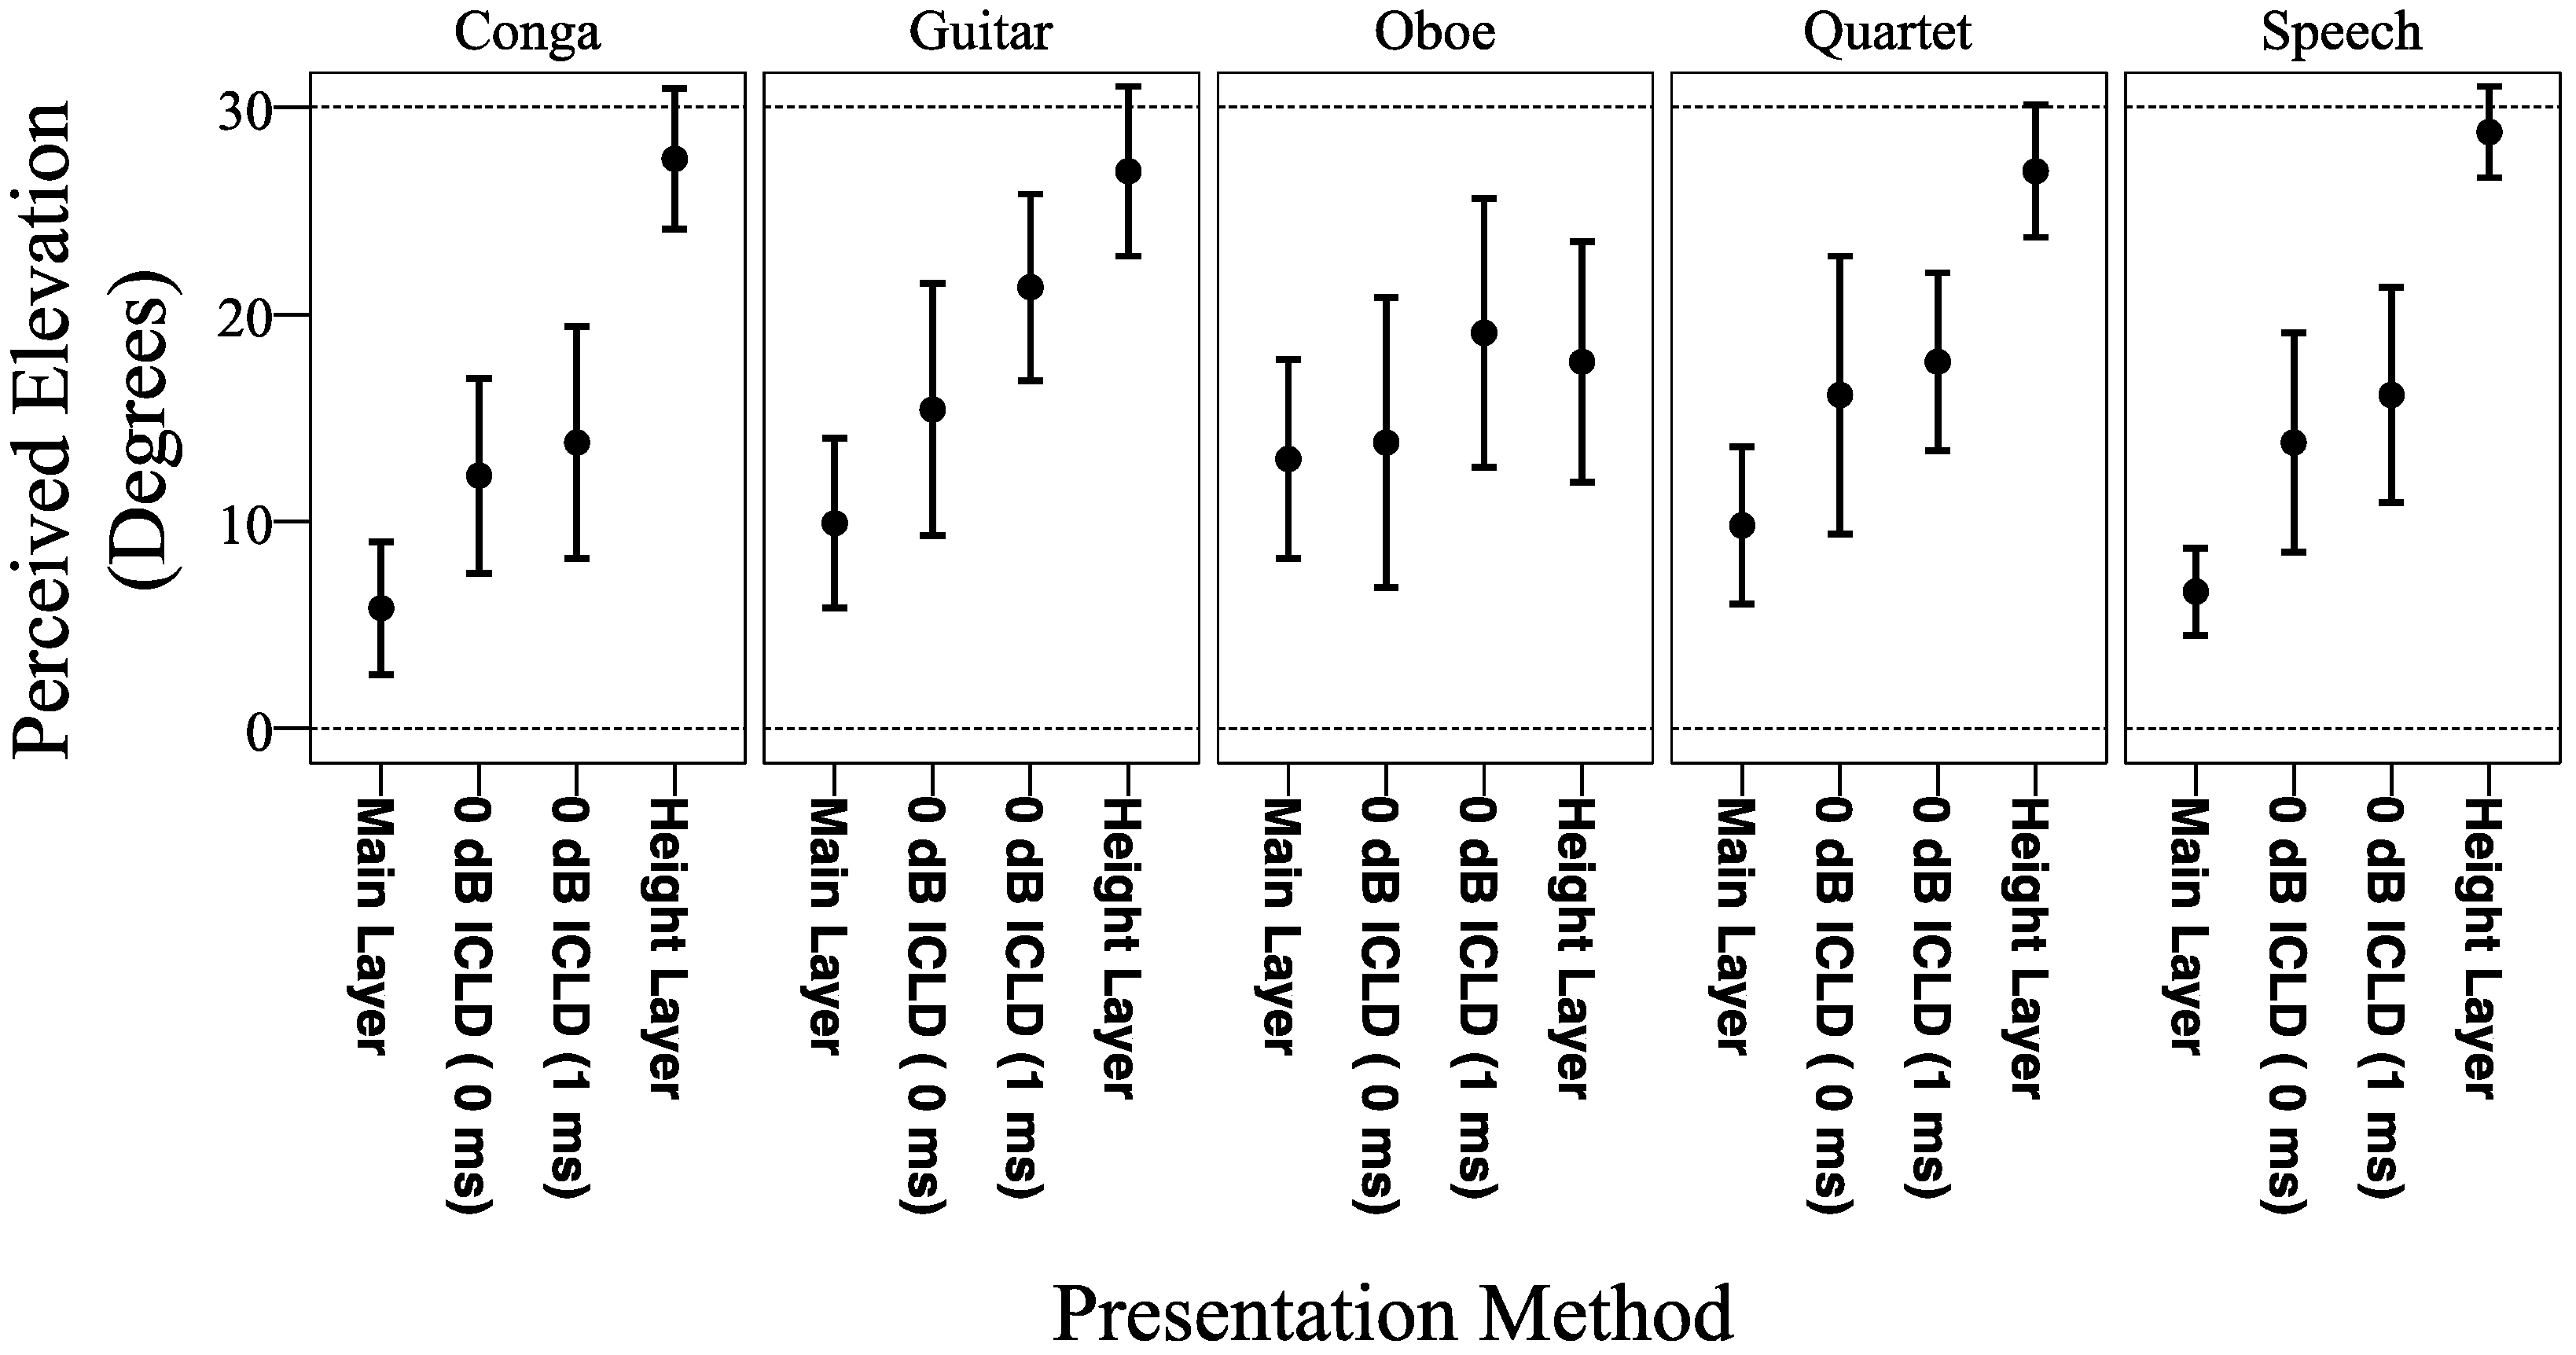
Figure 9 shows the median perceived elevation of each of the test stimuli, plotted with notch edges. Consideration of the data reveals the following. Firstly, the localisation thresholds derived in Experiment One resulted in perceived elevation judgments similar to those for the same source presented from the main layer only. This was the case for all sources, with the median difference in perceived elevation between the main layer only and localisation threshold conditions ranging between −4.0° and −0.8° for the 0-ms ICTD and between 3.9° and 0.0° for the 1-ms ICTD. In addition to this, the notch edges for all the localisation threshold conditions overlap with those for main layer-only presentation. It is also interesting to note that, for the 0-ms ICTD, the median perceived elevation for the stimuli with the localisation threshold applied was slightly lower than the main layer only condition for all sources.
In order to further determine whether or not the localisation thresholds derived from Experiment One were successful in preventing vertical interchannel crosstalk from affecting the perceived location of the main channel signal, Wilcoxon tests were conducted. The results suggested that, generally, there were no significant differences between the elevation judgments for the localisation threshold and main layer-only conditions. However, the data did suggest that the difference was significant for the quartet at 0 ms (p = 0.041) and for both the guitar (p = 0.002) and speech (p = 0.025) at 1 ms. Despite this, there is a clear overlap between the notch edges for each of these stimuli. In addition, the Pearson’s correlation coefficient did not show a large effect in any case (r = 0.25 for quartet at 0 ms, r = 0.39 for guitar at 1 ms, r = 0.28 for speech at 1 ms). It can therefore be suggested that the difference in median perceived elevation between the localisation threshold and main layer only conditions was not significant. Consequently, the localisation thresholds derived in the present study are appropriate in preventing vertical interchannel crosstalk from affecting the perceived location of the main channel signal.
With respect to the 0-dB ICLD conditions, a series of interesting results can be seen. Firstly, for the oboe it is clear that perceived elevation was not significantly affected by changes in how the stimulus was presented to subjects. In all cases, the perceived elevation was similar, which would indicate that this source was less affected by the migration of the main channel signal from the main layer as a result of vertical interchannel crosstalk. This result might suggest that the application of localisation thresholds would not always be necessary. Furthermore, for the other stimuli it is clear that the median perceived elevation was greater for the 0-dB ICLD condition compared to the main layer only condition. For 0 ms, the difference in median perceived elevation ranged from 5.5° to 7.2°, whilst for 1 ms the difference ranged from 7.9° to 11.4°. This result indicates that the perceived location of the main channel signal would be more affected by vertical interchannel crosstalk when the height layer is delayed with respect to the main. However, despite this result it is clear that the difference was not always significant, with there being a notable overlap between notch edges between the 0-dB ICLD conditions and the main layer-only conditions. This is particularly noticeable for the guitar and quartet sources at 0 ms. Nevertheless, is clear that vertical interchannel crosstalk at the very least resulted in an increase in the median perceived elevation of the main channel signal, which was notably reduced when the localisation thresholds derived from Experiment One were applied.
A further result of note can be seen with respect to the main and height layer-only conditions. Firstly, for the latter condition it would appear that perceived elevation judgments were generally accurate for all sources, excluding the oboe, with respect to the physical position of the height layer. Conversely, for the main layer-only condition the judgments were less accurate, with perceived source elevation being in the range of 5.8°–13.0° with respect to the main layer’s physical location. This elevation of the sound source with respect to the main layer was also maintained for the conditions whereby a localisation threshold was applied to the height layer. The results of a Wilcoxon signed rank test, which compared the results for the main layer-only condition to the physical position of the main layer (0°), showed that each source was perceived to be significantly higher than the physical height from which the source was presented (p = 0.000 for all sources).
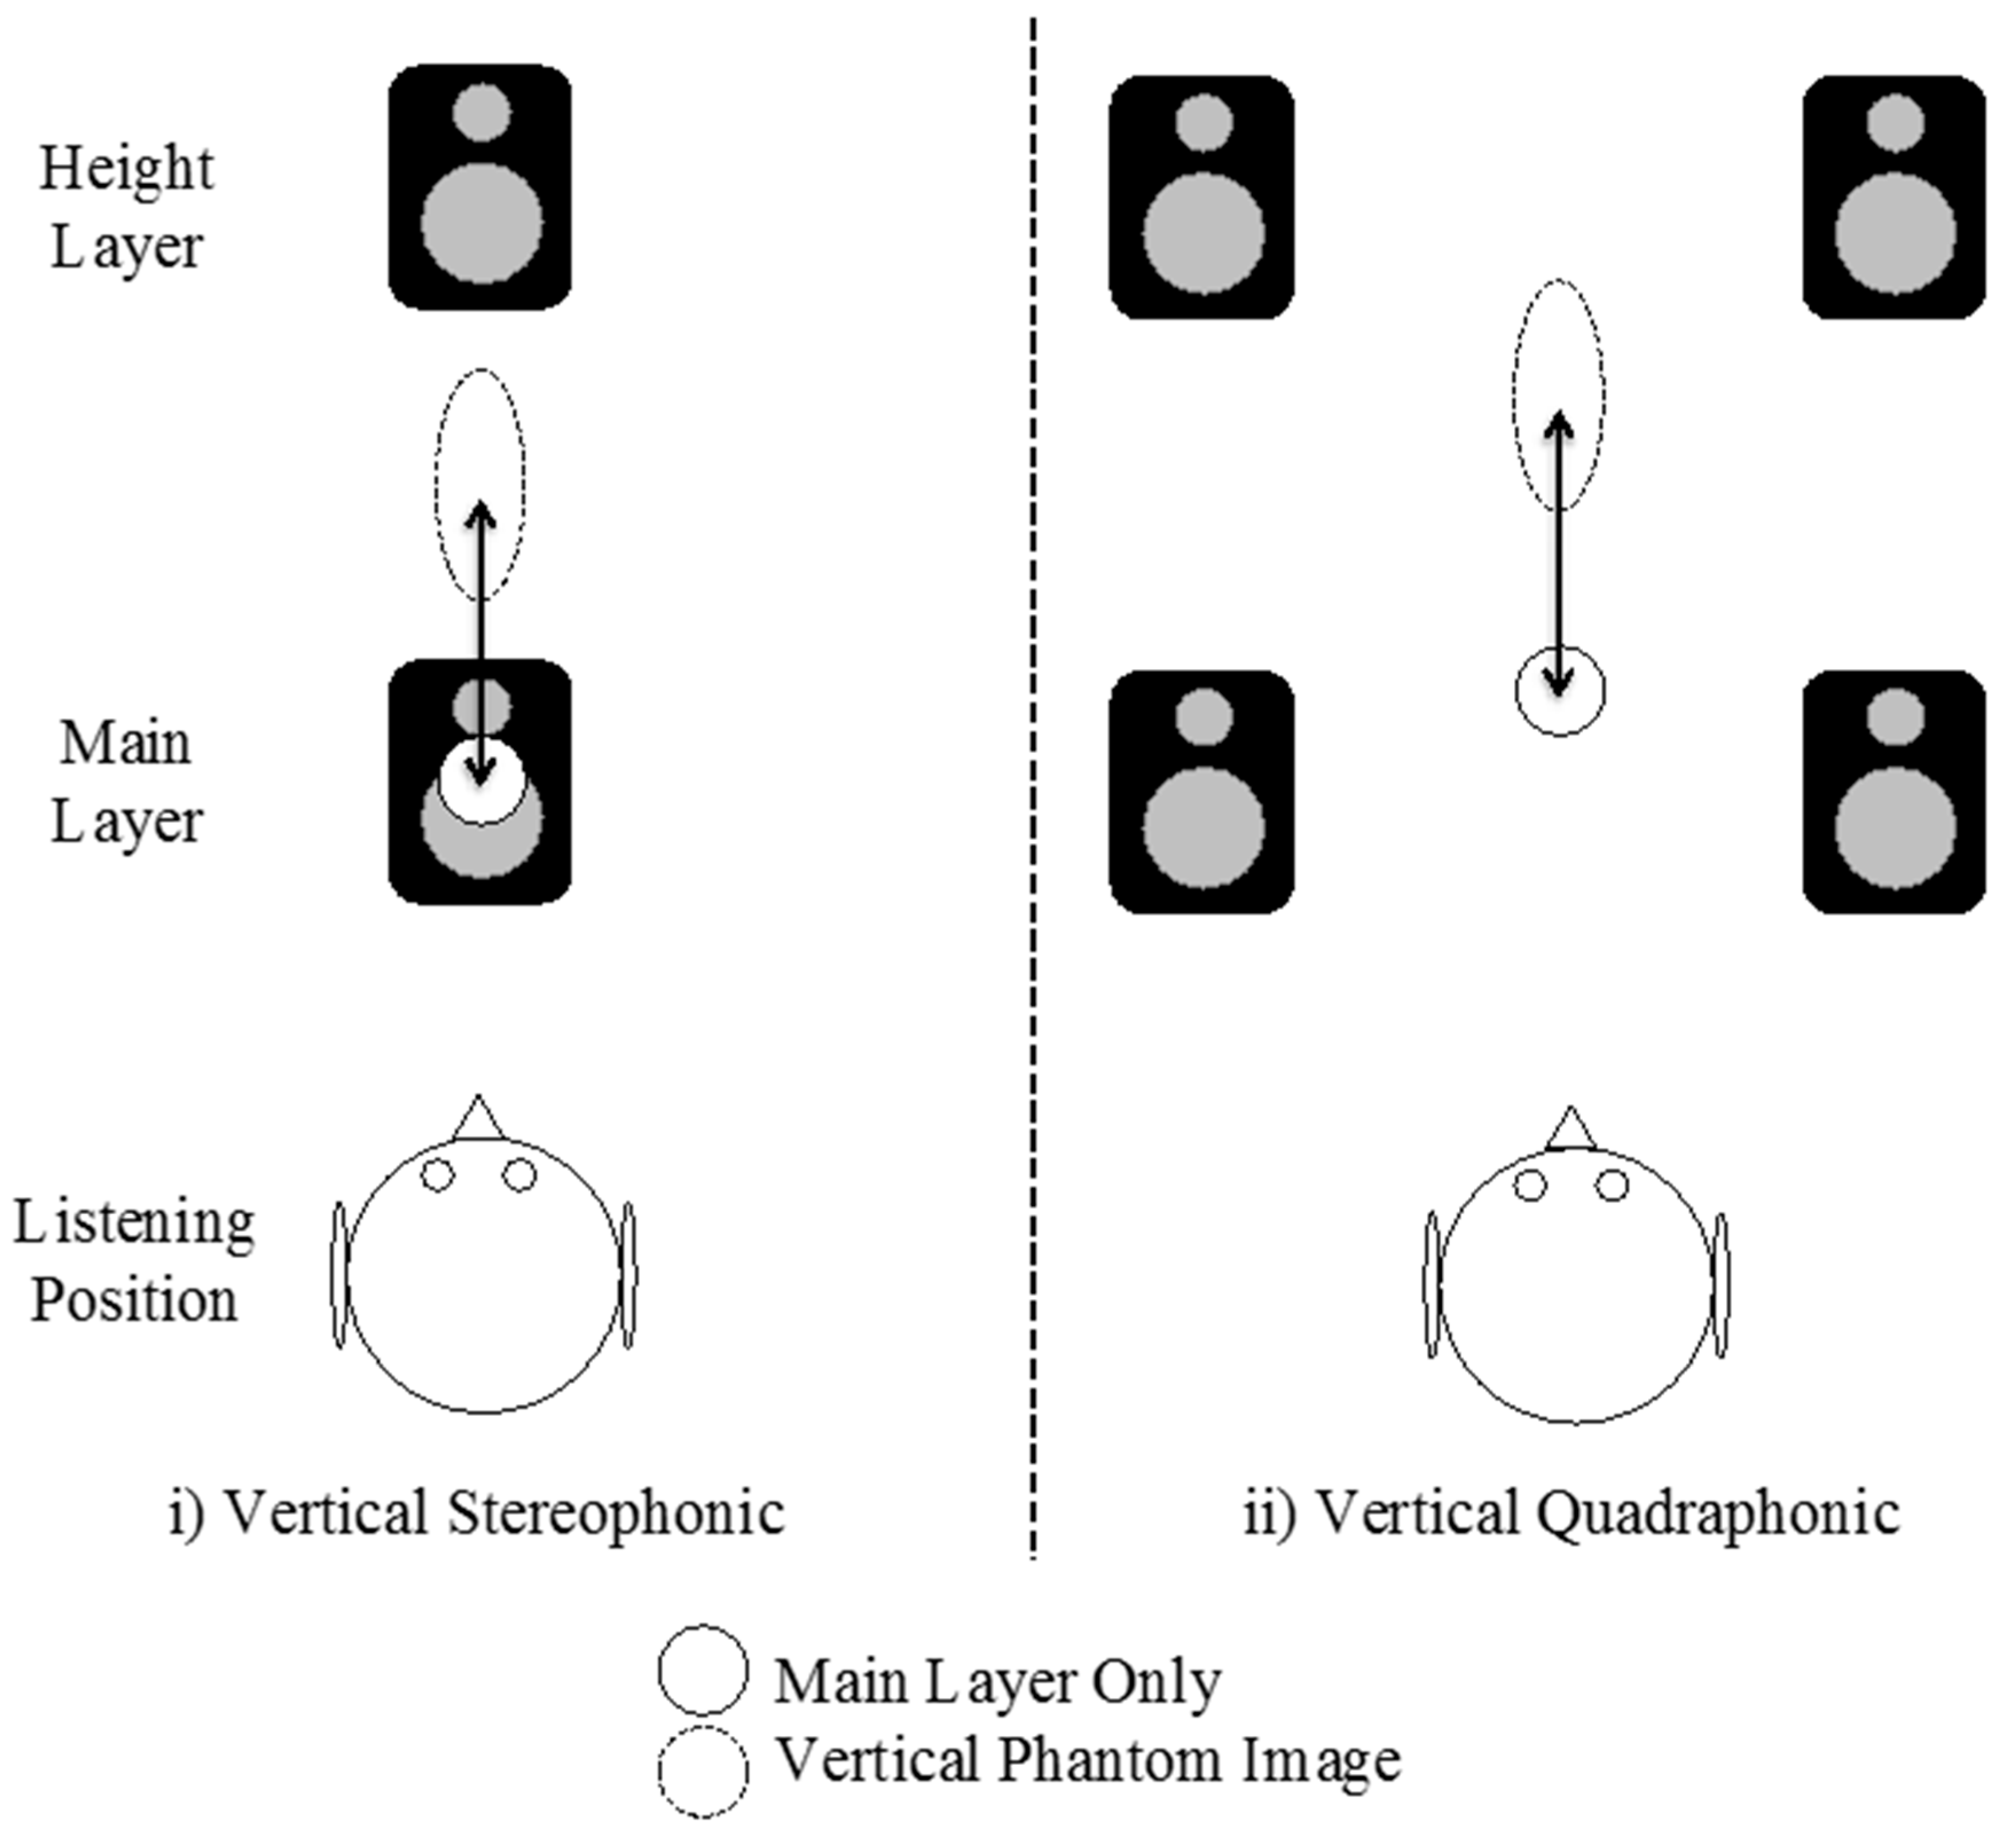
4. Discussion

The experimental data obtained in Experiment One showed that localisation thresholds for natural sound sources are not significantly affected either by sound source or presentation method. Instead, the only variable whose effect was significant was ICTD. When the ICTD was 0 ms, the threshold was found to be −9.5 dB, which was significantly lower than the −7 dB found for ICTDs of both 1 and 10 ms. In verification tests (Experiment Two), these thresholds were found to be effective at preventing vertical interchannel crosstalk from affecting the perceived location of the main channel signal. This section discusses potential physical causes for the subjective results and suggests practical implications of the results.

4.1. Sound Source Dependency

One of the key aims of the present study was to determine whether or not there existed a sound source dependency of localisation thresholds. The results of Experiment One showed that, although the median localisation threshold varied for different sound sources, these differences were not significant, which agrees with the results reported in [8,9]. Additionally, in Experiment Two the non-significant effect of sound source on the localisation threshold was demonstrated further. In this regard, the results showed that, when the same threshold was applied to each source, the resultant phantom image position was not significantly different from that for main layer only presentation. In order to explain the reasons for these results, considerations were given to three different aspects of vertical localisation: (1) the spectral energy distribution of the ear input signal; (2) the so-called ‘pitch-height’ effect [29]; and (3) the effect of vertical image spread (VIS) on vertical localisation.
Since the primary cue for elevation perception is known to be the spectral filtering of the pinnae in the 4–10 kHz range [30], it was first considered how the ear input spectra are affected by the presence of the height layer. In Figure 10, the difference in spectral energy between main and height layer only presentation has been shown for both presentation methods as delta spectra. The head-related impulse responses (HRIRs) used for this exercise were taken from the Massachusetts Institute of Technology (MIT)’s HRIR database created using the KEMAR dummy head microphone [31]. Any points where the line falls below 0 dB represents dominance of the main layer over the height layer and vice versa. From both delta spectra, it can be seen that the predominant difference in energy between the two layers is a peak (height layer dominant) in the range of 7–9 kHz, a region that is associated with localisation above the subject [30,32]. It is therefore reasonable to suggest that the increased energy in this region is a key reason that stimuli presented from the height layer only were perceived as being more elevated than those presented from the main layer only in Experiment Two. Since the resultant spectrum for phantom image presentation will depend on the relative strengths of each layer, the following can be suggested. When the ICLD is small, the contribution of each layer to the resultant spectrum will be similar. As a consequence of this, a given source presented as a vertically oriented phantom image will feature more energy in the 7–9 kHz region compared to the same source presented from the main layer only. This will manifest in differences in perceived elevation between the two conditions, as was demonstrated in [33]. However, as the ICLD increases, the main layer becomes more dominant in determining the resultant ear input spectrum, which means that the differences between the phantom image and main layer only conditions in the 7–9 kHz region would decrease. At the localisation threshold then, this difference is not sufficient enough to be interpreted as an elevation difference and therefore the main layer only and phantom image conditions are perceived as being in the same location. Based on this hypothesis, it can be argued that the primary mechanism used for the subject’s localisation threshold judgment might be the relative spectral energy weighting between the main and height layers in head-related transfer function (HRTF), rather than being related to the fine spectral details of the sound source, which agrees with a previous study conducted by the authors [10]. It should be noted, however, that the ear input spectra are dependent on the subject and that it is therefore difficult to generalise HRTF characteristics. Based on this, it is apparent that further study is necessary, using measured HRTFs of different subjects, before the importance of the 7–9 kHz region in particular in determining the localisation threshold can be confirmed.
An interesting point of note with respect to the non-significant effect of sound source relates to the results of Experiment Two, which showed that localisation judgments for the oboe source were generally consistent regardless of how the source was presented to subjects. A potential explanation as to why this result was obtained is offered thus. According to the literature, narrowband stimuli incident from the median plane are localised on the basis of frequency, with increases in frequency corresponding to increases in perceived elevation [11,30,34]. This phenomenon is known as the ‘pitch-height effect’ [29]. As can be seen from Figure 2, the spectrum for the oboe source was notably narrow, with a bandwidth ranging from around 500 Hz to 4 kHz and with its predominant energy focused around 1 to 2 kHz. According to the literature, band-limited stimuli in this frequency range are localised at a similar vertical position regardless of which loudspeaker layer presented the source for both vertical stereophonic [11,29] and vertical quadraphonic [12] loudspeaker arrangements. Therefore, it might be that localisation judgments for the oboe were determined by the pitch-height effect rather than the HRTF-based vertical localisation mechanism discussed above. This would indicate that the latter mechanism is predominantly applicable to broadband sources, with less relevance to sources that are both narrowband and absent in high frequency energy.
That ICLD was always necessary to reach the localisation threshold for the oboe source, despite there being no significant difference in perceived elevation between the 0 dB and main layer only conditions, might be explained by an alternative hypothesis proposed by the authors [10]. When sound source presentation shifts from main layer only to vertical phantom image, a key difference is an increase in perceived VIS. Such an increase contributes to an increase in localisation blur [35], which inevitably makes the sound source more difficult to localise in vertical space. Therefore, given that the test conditions required a direct comparison between the positions of stimuli presented using the main layer only and vertical phantom image conditions, it is possible that differences in perceived VIS were perceived as elevation differences. Further, these differences would have decreased as the amplitude of the height layer was reduced. At the localisation threshold then, the difference in VIS is sufficiently small for stimuli presented using the two conditions to be perceived as being in the same location. As with the hypothesis regarding the importance of the spectral energy weighting in determining the localisation threshold, this hypothesis is able to explain why the effect of sound source was not significant in Experiment One. Simply, the difference in perceived VIS between main layer only and vertical phantom image presentation is primarily a function of ICLD and is not affected by the sound source itself. Based on these discussions, it is clear that the exact mechanisms that determine whether or not the localisation threshold has been met requires further study.

4.2. The Effect of Presentation Method

A further aim of the present study was to analyse how the localisation thresholds would be affected by changing the presentation method from vertical stereophonic to vertical quadraphonic, with the results of Experiment One showing that the effect was not significant. In Section 4.1 it was discussed how a key mechanism in determining whether or not the localisation threshold had been met might be the balance of spectral cues provided by the main and height layers respectively. The results of Experiment One would seemingly indicate that this balance was not affected when source presentation changed from vertical stereophonic to vertical quadraphonic. This is apparent when Figure 10 is considered, which shows that the difference in spectral energy between the main and height layer-only conditions were somewhat similar for both presentation methods. In order to gain further objective insights into this result, the influence of the height layer on the frequency spectrum of the ear-input signal was analysed for each presentation method. For this, the spectral magnitude of the ear-input signal resulting from the main layer only was subtracted from that from both the main and height layers, using the MIT’s KEMAR HRIR database [31]. Figure 11 plots the analysis results obtained when the ICLD was 0 dB (no height layer level reduction applied) and when the localisation threshold (−9.5 dB) was applied. From the plots, the following can be observed. Firstly, the spectral energy in the 7–9 kHz range for the 0-dB ICLD condition was dominant over that for the main layer-only condition, for both presentation methods, in a manner similar to that hypothesised in Section 4.1. In addition to this, when the localisation threshold was applied for each method, the difference in energy in this region was decreased between 8 and 10 dB, whereas that below this region was about 5 dB or less. This therefore supports the hypothesis that decreases in spectral energy in the 7–9 kHz region will result in the localisation threshold being met, with similar reductions for both presentation methods for a given ICLD likely being the reason for the non-significant effect of presentation method. There is also good agreement with the results of a previous study conducted by the present authors [10], which showed that the main layer only and two-layer conditions did not have to have equal energy in the frequency range in which the spectral cues for elevation lie for the localisation threshold to be met.
The non-significant effect of presentation method is interesting when the results of previous localisation studies are considered. As shown in [11,28,29], for a single loudspeaker placed in front of the listener in the median plane, the perceived image of broadband noise tends to be localised accurately at the physical position of the loudspeaker. Conversely, the phantom centre image of the noise produced from stereophonic loudspeakers at the ear height (i.e., the main layer of the quadraphonic condition in the current study) would be elevated with respect to the physical position of the loudspeaker as reported in [12,13,14] (this was also observed for natural sound sources in Experiment Two of the present study). Furthermore, a similar degree of difference between real and phantom image conditions in perceived elevation would be observed also for elevated loudspeakers (i.e., the height layers of the current study), based on data presented in [11,12]. From the above, it can be inferred that, for 0-dB ICLD, sound sources presented using the vertical quadraphonic condition would be elevated with respect to those presented using the vertical stereophonic condition, with the difference in perceived elevation being similar to that for the same sources presented from the main layer only. This would therefore imply that the perceived differences in elevation between the main layer-only and phantom image conditions for a given ICLD would be similar for both presentation methods, as is demonstrated in Figure 12, which would further explain why the effect of presentation method was not significant.

4.3. The Localisation Dominance Effect

The results of the present experiment suggest that the only variable that had a significant effect on the localisation threshold was ICTD, with delays of both 1 and 10 ms requiring significantly less level reduction than did 0 ms. However, there was no condition whereby ICTD alone was sufficient for the localisation threshold; ICLD was always necessary. This result indicates that the precedence effect, in which an ICTD greater than 1.1 ms between coherent loudspeakers located on the horizontal plane will cause the resultant sound source to be localised at the exact position of the earlier loudspeaker [36], is not a feature of median plane localisation. This agrees with the conclusions reported in [8,9,10,11]. What is suggested, however, is somewhat of a localisation dominance effect, whereby the presence of an ICTD biases localisation towards the earlier loudspeaker. This can be considered as being similar to summing localisation [31] and has been shown to operate in numerous median plane localisation studies [37,38,39]. If it is the case that the earlier loudspeaker becomes dominant in determining perceived source location in the median plane, then this might explain why significantly less ICLD was necessary to meet the localisation threshold for the 1 and 10 ms ICTDs compared to for the 0 ms condition. It should be noted, however, that higher localisation thresholds as a result of a localisation dominance effect have not been reported in previous localisation threshold experiments, with both [8] and [9] reporting that there was no significant difference between the localisation thresholds in the range of 0–10 ms.
The data provided in Experiment Two enables further analysis as to whether or not the significant effect of ICTD was related to the operation of a localisation dominance effect. Figure 13 shows the experimental data for the main and height layer-only conditions alongside those for the 0-dB ICLD conditions (both 0- and 1-ms ICTD). The median perceived elevation for each has been plotted with notch edges. From the results, it is clear that there is no evidence to support the existence of a localisation dominance effect, with the median perceived elevation for all stimuli increasing in the presence of an ICTD. This result is somewhat similar to those of a previous study conducted by the authors [11], in which the perceived elevation of broadband pink noise presented from vertically-arranged stereophonic loudspeakers in anechoic conditions increased as the ICTD increased from 0 to 1 ms. It should also be noted in the present study that the differences between the 0- and 1-ms conditions were not significant. Based on these results, the hypothesis that the localisation thresholds are higher in the presence of an ICTD due to the operation of a localisation dominance effect can be rejected. As a consequence of this, further study would be required in order to adequately explain this result.

4.4. Practical Implications

A primary aim of the present study was to obtain localisation thresholds that could be used to influence both the placement of microphones and the rendering of 3D images in the context of 3D audio. The purpose of this was to prevent vertical interchannel crosstalk from affecting the perceived location of the main channel signal. With respect to 3D microphone configurations, a series of techniques have already been proposed in [8]. In that study, it was suggested that, since the localisation threshold needs to be applied to the height-layer microphone signals in order for the source image to be located at the position of the main layer, directional microphones should be used for the height layer rather than omni-directional ones. The results of the present study support this suggestion. In addition, it was proposed that, in case of using microphones with an ‘ideal’ cardioid polar pattern (i.e., −6 dB attenuation at 90°), the necessary ICLD could be achieved for both vertically coincident and spaced configurations by angling the height layer of microphones at least 90° away from the direct sound. However, the data reported in the present study indicates that a minimum angle of 105° would be necessary in the case that the main and height layers are spaced apart, whilst for a coincident configuration the angle should be 115°. This would provide attenuation of direct sounds in the height layer at the localisation thresholds for 0 ms and 1 ms found in the present study: around −7 and −9.5 dB, respectively.
The results of the current study are considered to be also useful for vertical image rendering in 3D sound mixing and upmixing applications. They indicate that direct sounds can be present in the height layer provided they are attenuated with respect to those in the main layer by either 9.5 dB (in the case of 0 ms ICTD) or 7 dB (in the case of 1–10 ms ICTD) without the perceived location of the main channel signal being affected. Such a technique could have potentially pleasing effects such as an increase in perceived VIS. However, it is currently not clear how the timbre of the main channel signal would be affected by such a technique and, further, if the end result would be pleasing. It can be seen from Figure 11, for example, that the resultant spectrum of the signal is different at the localisation threshold compared to main layer-only presentation, with a notable peak in the 7–9 kHz range. Alongside this, Halmrast [40] suggested that secondary vertical sources would result in orchestral music sounding ‘boxy’, whilst Barron and Marshall [41] indicated that timbral colouration as a result of vertical reflections are more audible than for lateral reflections. It would be necessary then to evaluate first of all what the perceptual differences are between the main layer only and vertical phantom image conditions with the localisation thresholds applied and further if the threshold conditions are considered as being preferable. Such a study would make it possible to determine whether the localisation threshold should be applied or, conversely, if the direct sound in the height layer should be either masked or absent entirely. This would provide further insights on both image rendering and microphone techniques in the context of 3D audio production.
It should also be noted that there are some, limited, applications with respect to the vertical panning of sound sources. It is indicated by the results that, depending on the ICTD, the threshold value for a source to be fully panned to the main loudspeaker layer is in the range of 7–9 dB, which agrees with the vertical localisation studies of both Barbour [5] and Wendt et al. [6]. However, further study would be needed to determine if this value is applicable to source localisation at the position of the height layer and, further, how changes in both ICLD and ICTD affect the perceived localisation of the resultant phantom image in between these extremes.

5. Conclusions

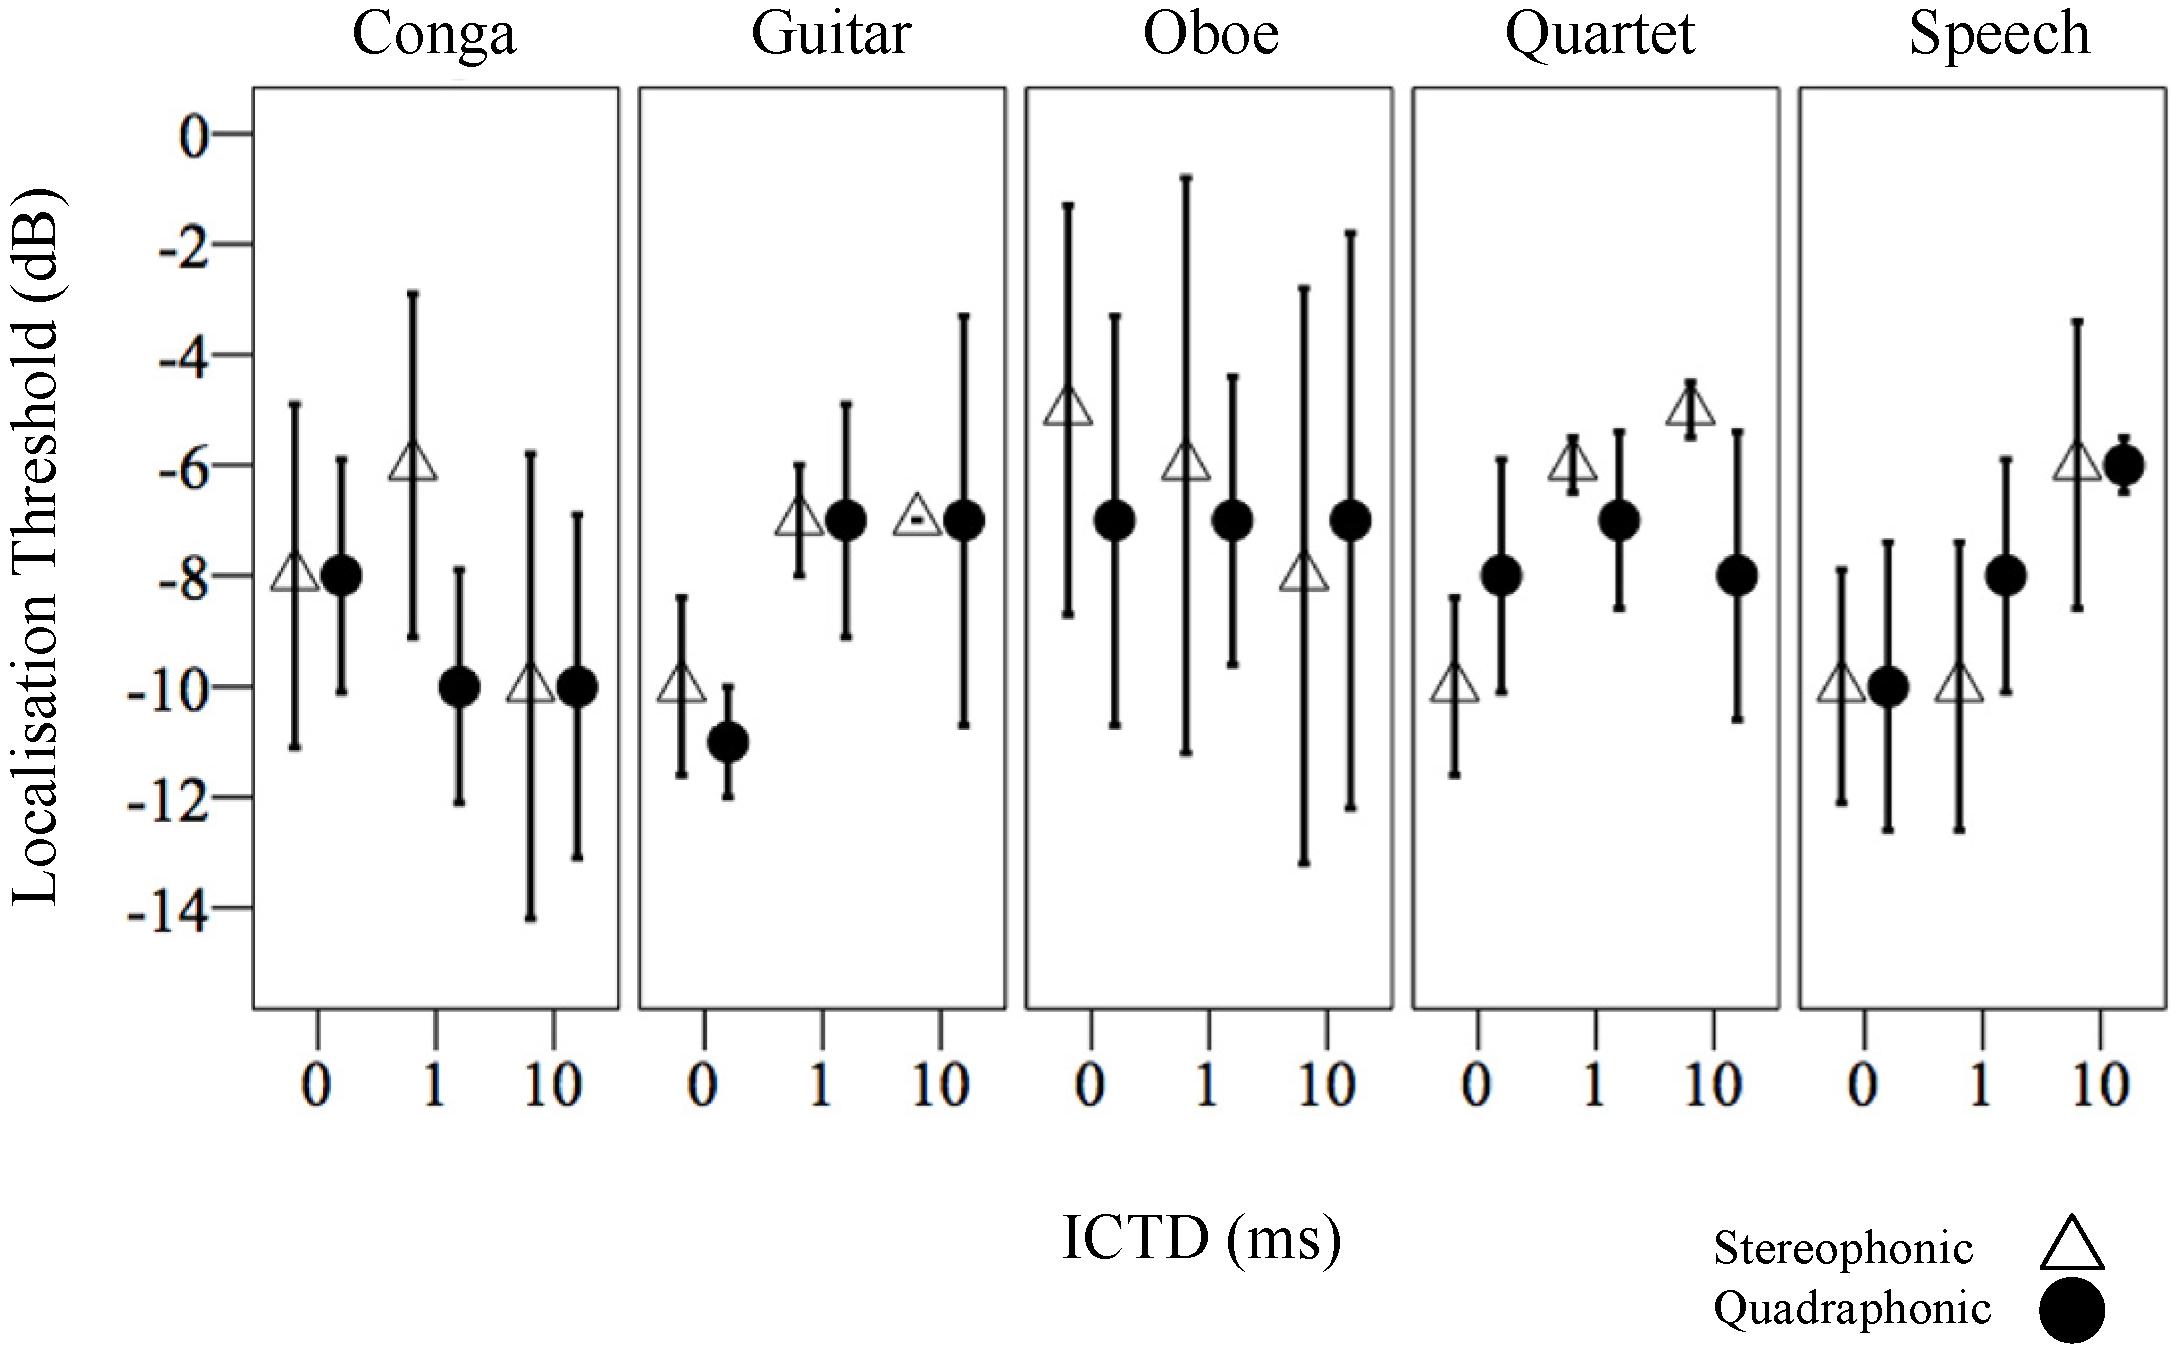
The present study carried out an analysis of localisation thresholds for natural sound sources. The study was divided into two experiments. In the first (Experiment One) the effects of sound source, ICTD and presentation method were examined. Anechoically recorded conga, quartet, speech, guitar and oboe sources were presented to subjects in a natural listening environment using two conditions: vertical stereophonic and vertical quadraphonic. For each condition, the loudspeakers were divided into two layers, being ‘height’ (30° elevation) and ‘main’ (0° elevation). Delays ranging from 0 to 10 ms were applied to the height layer with respect to the main. Subjects sat a listening test in which the minimum amount of attenuation necessary in the height layer for the resultant phantom image to match the position of the same source presented from the main layer alone was considered.
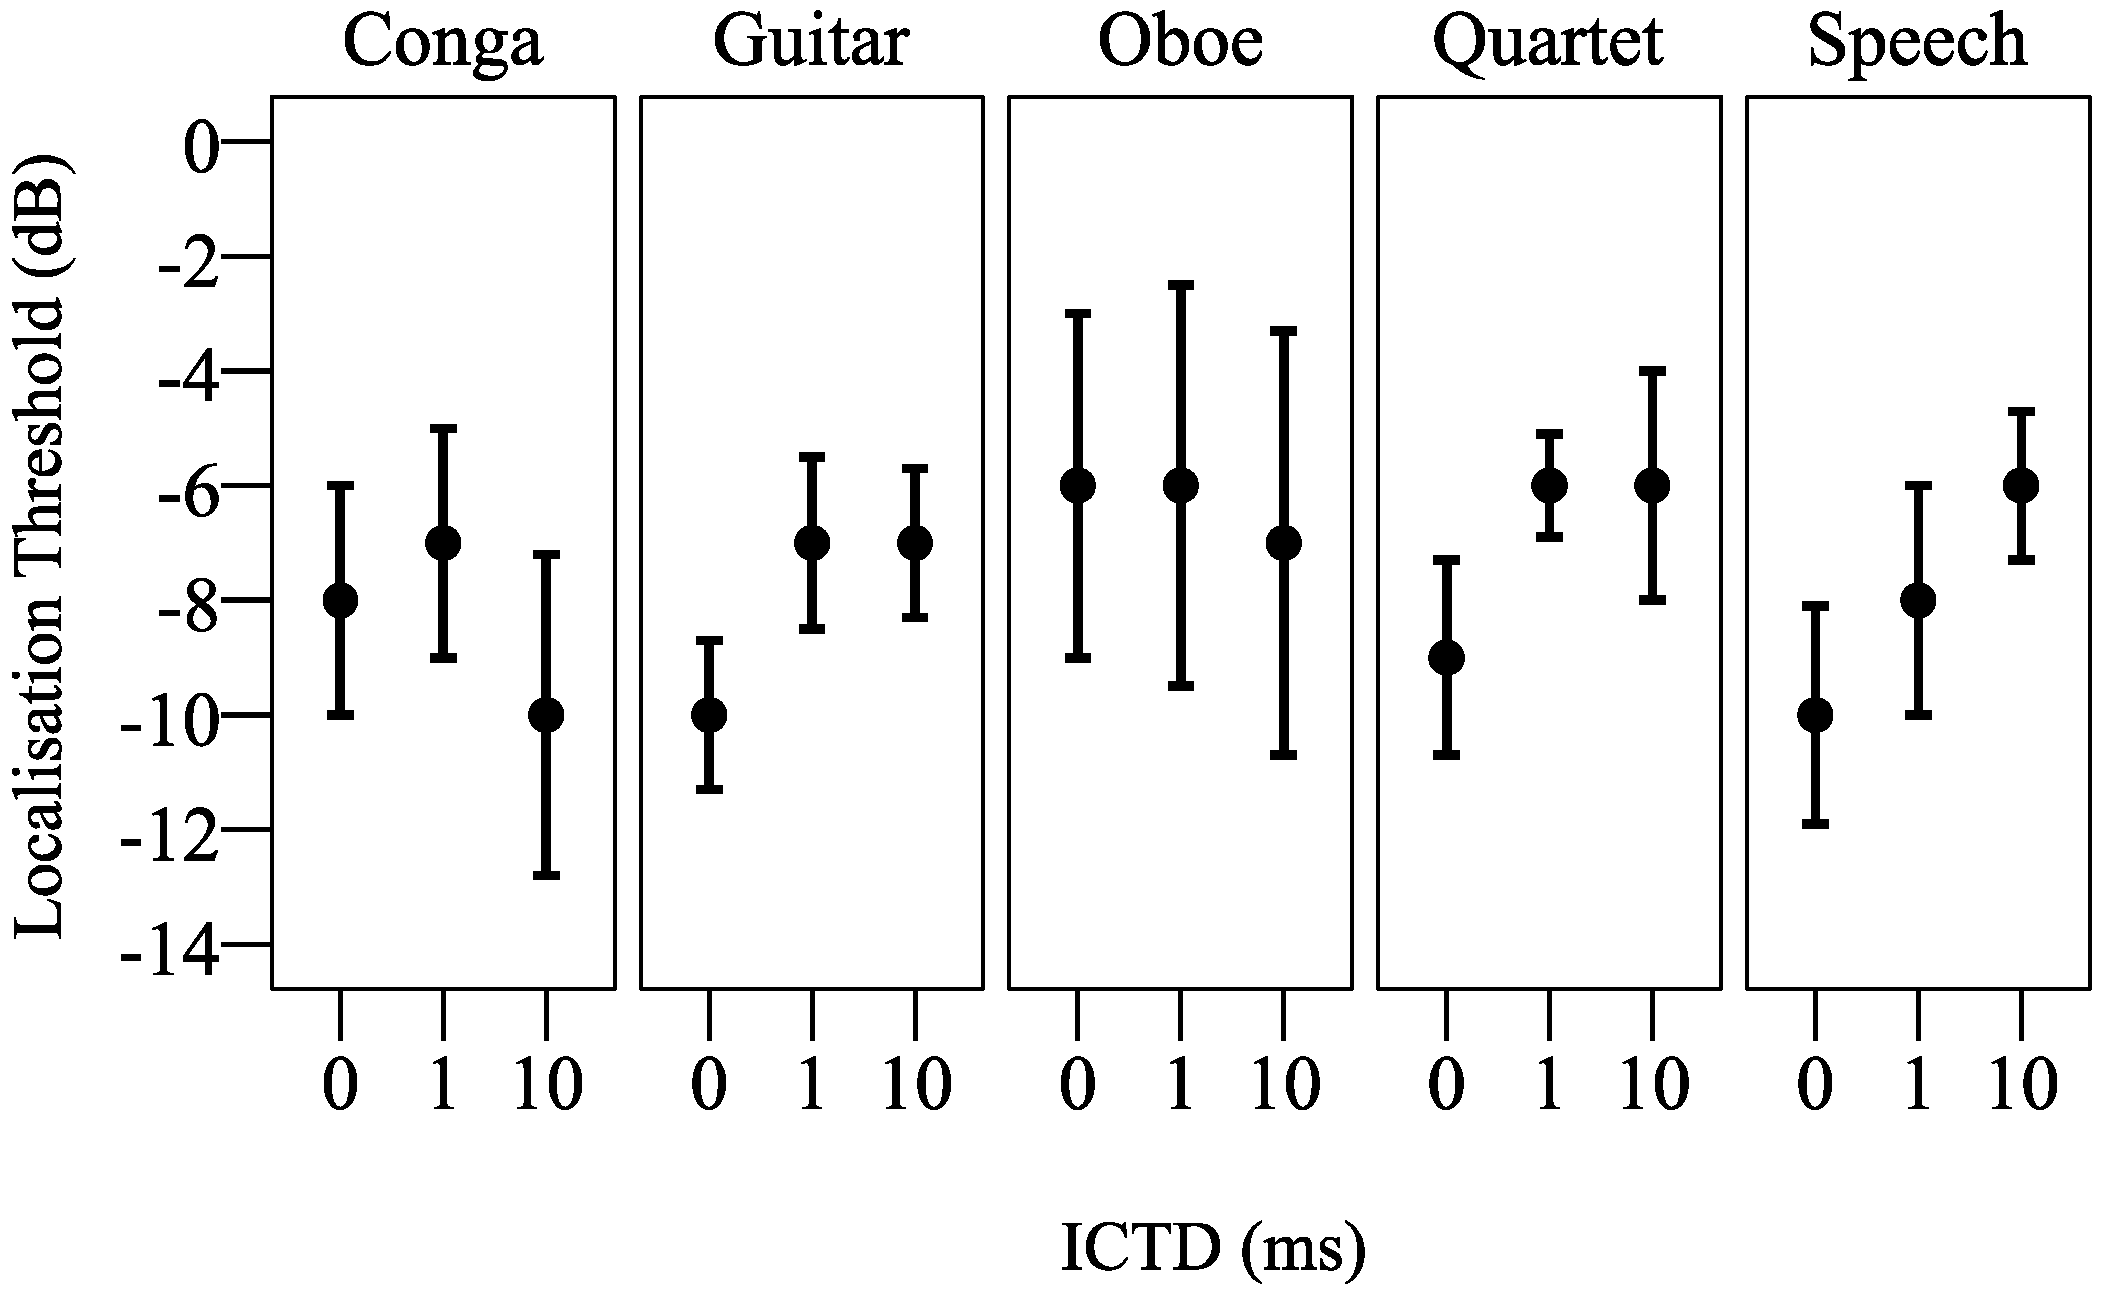
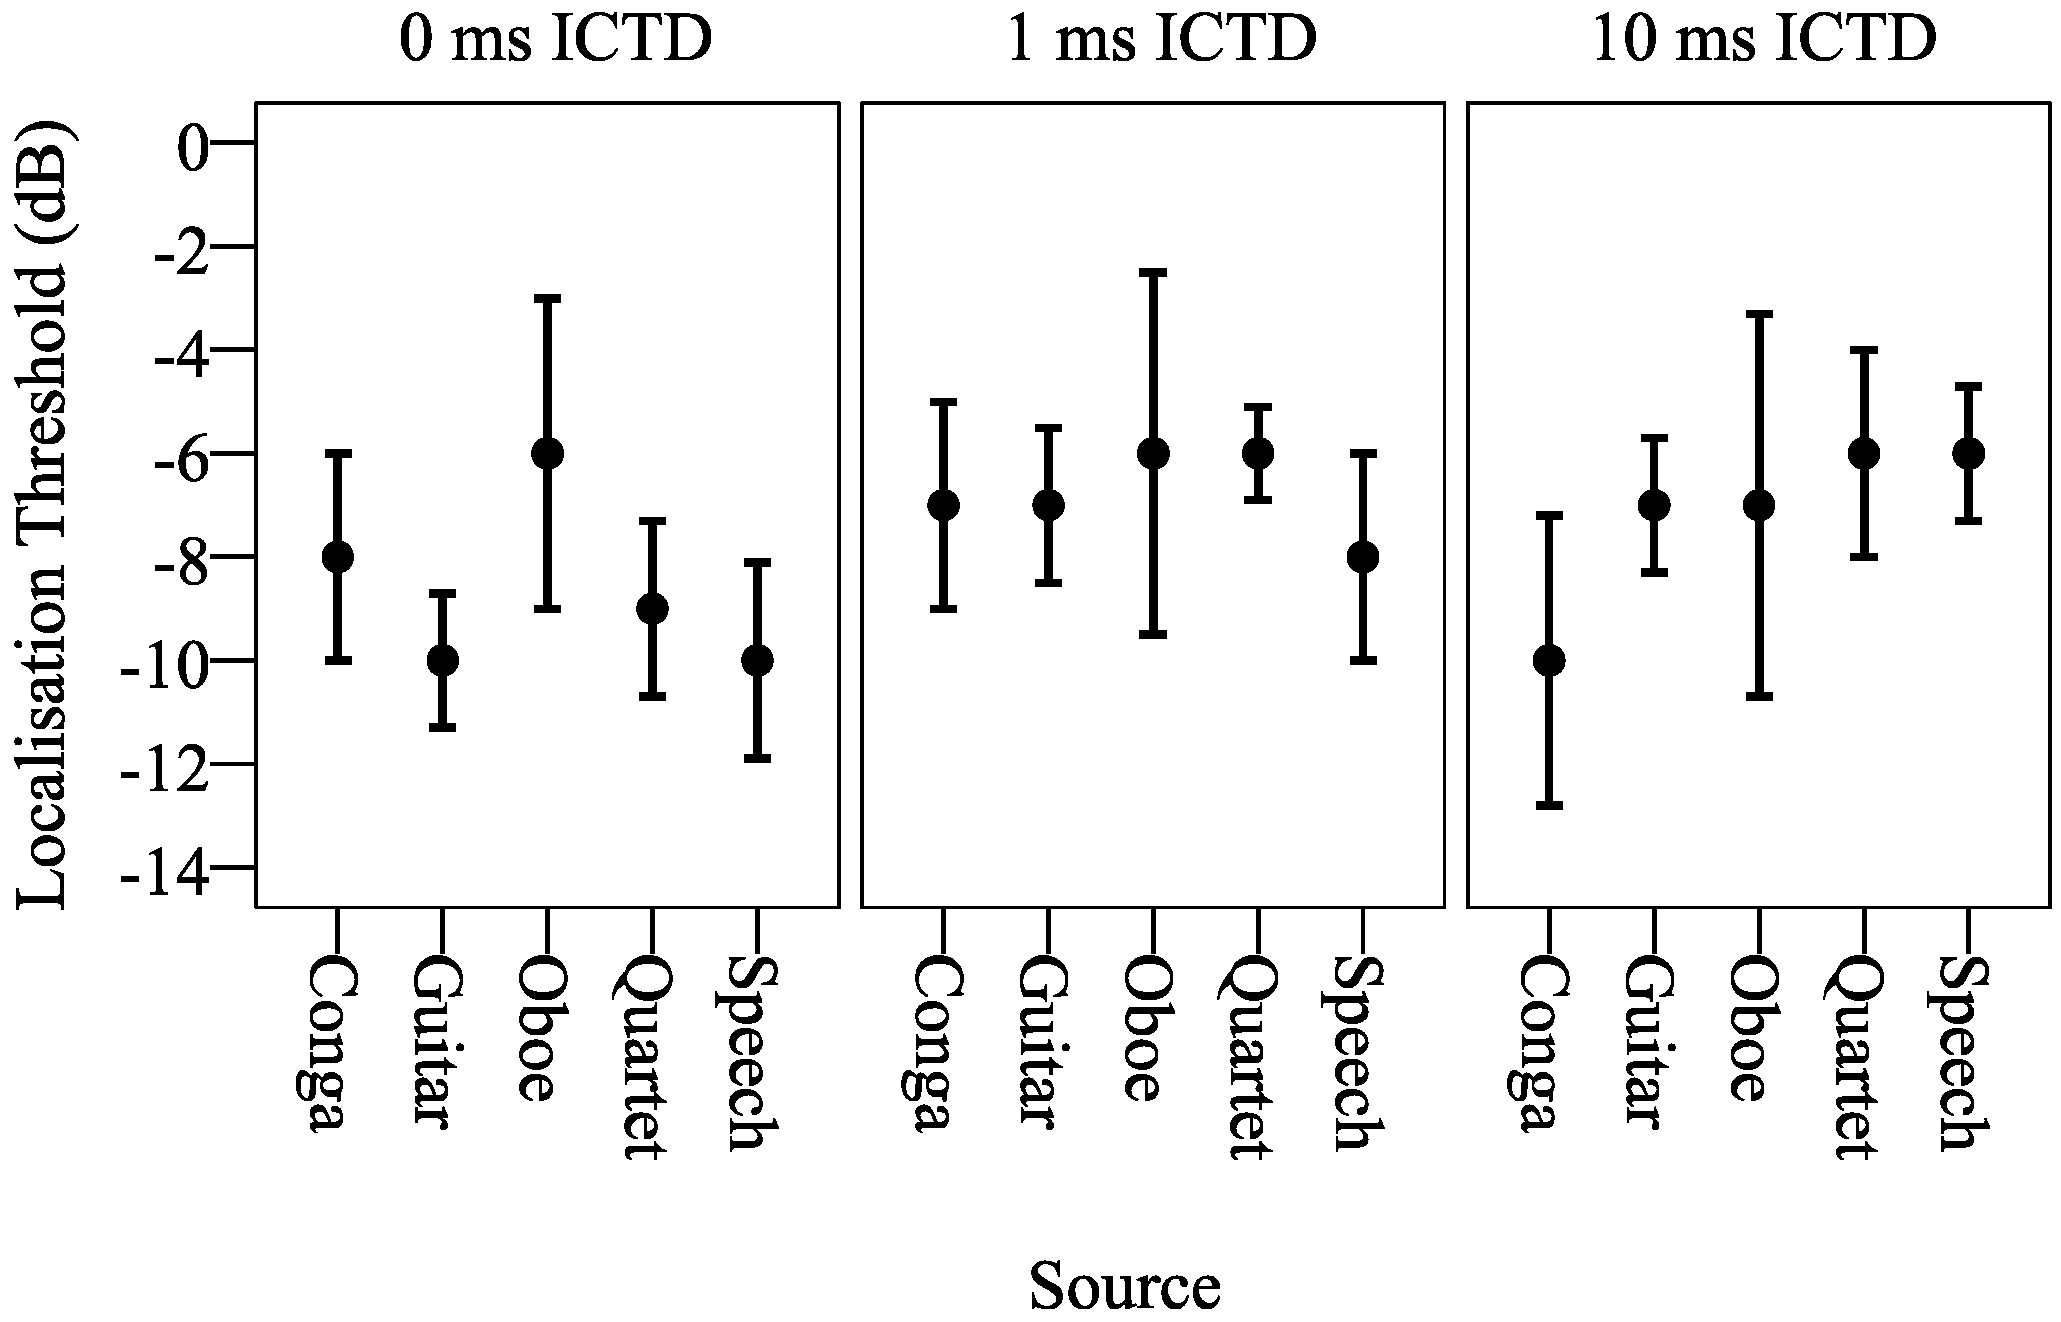
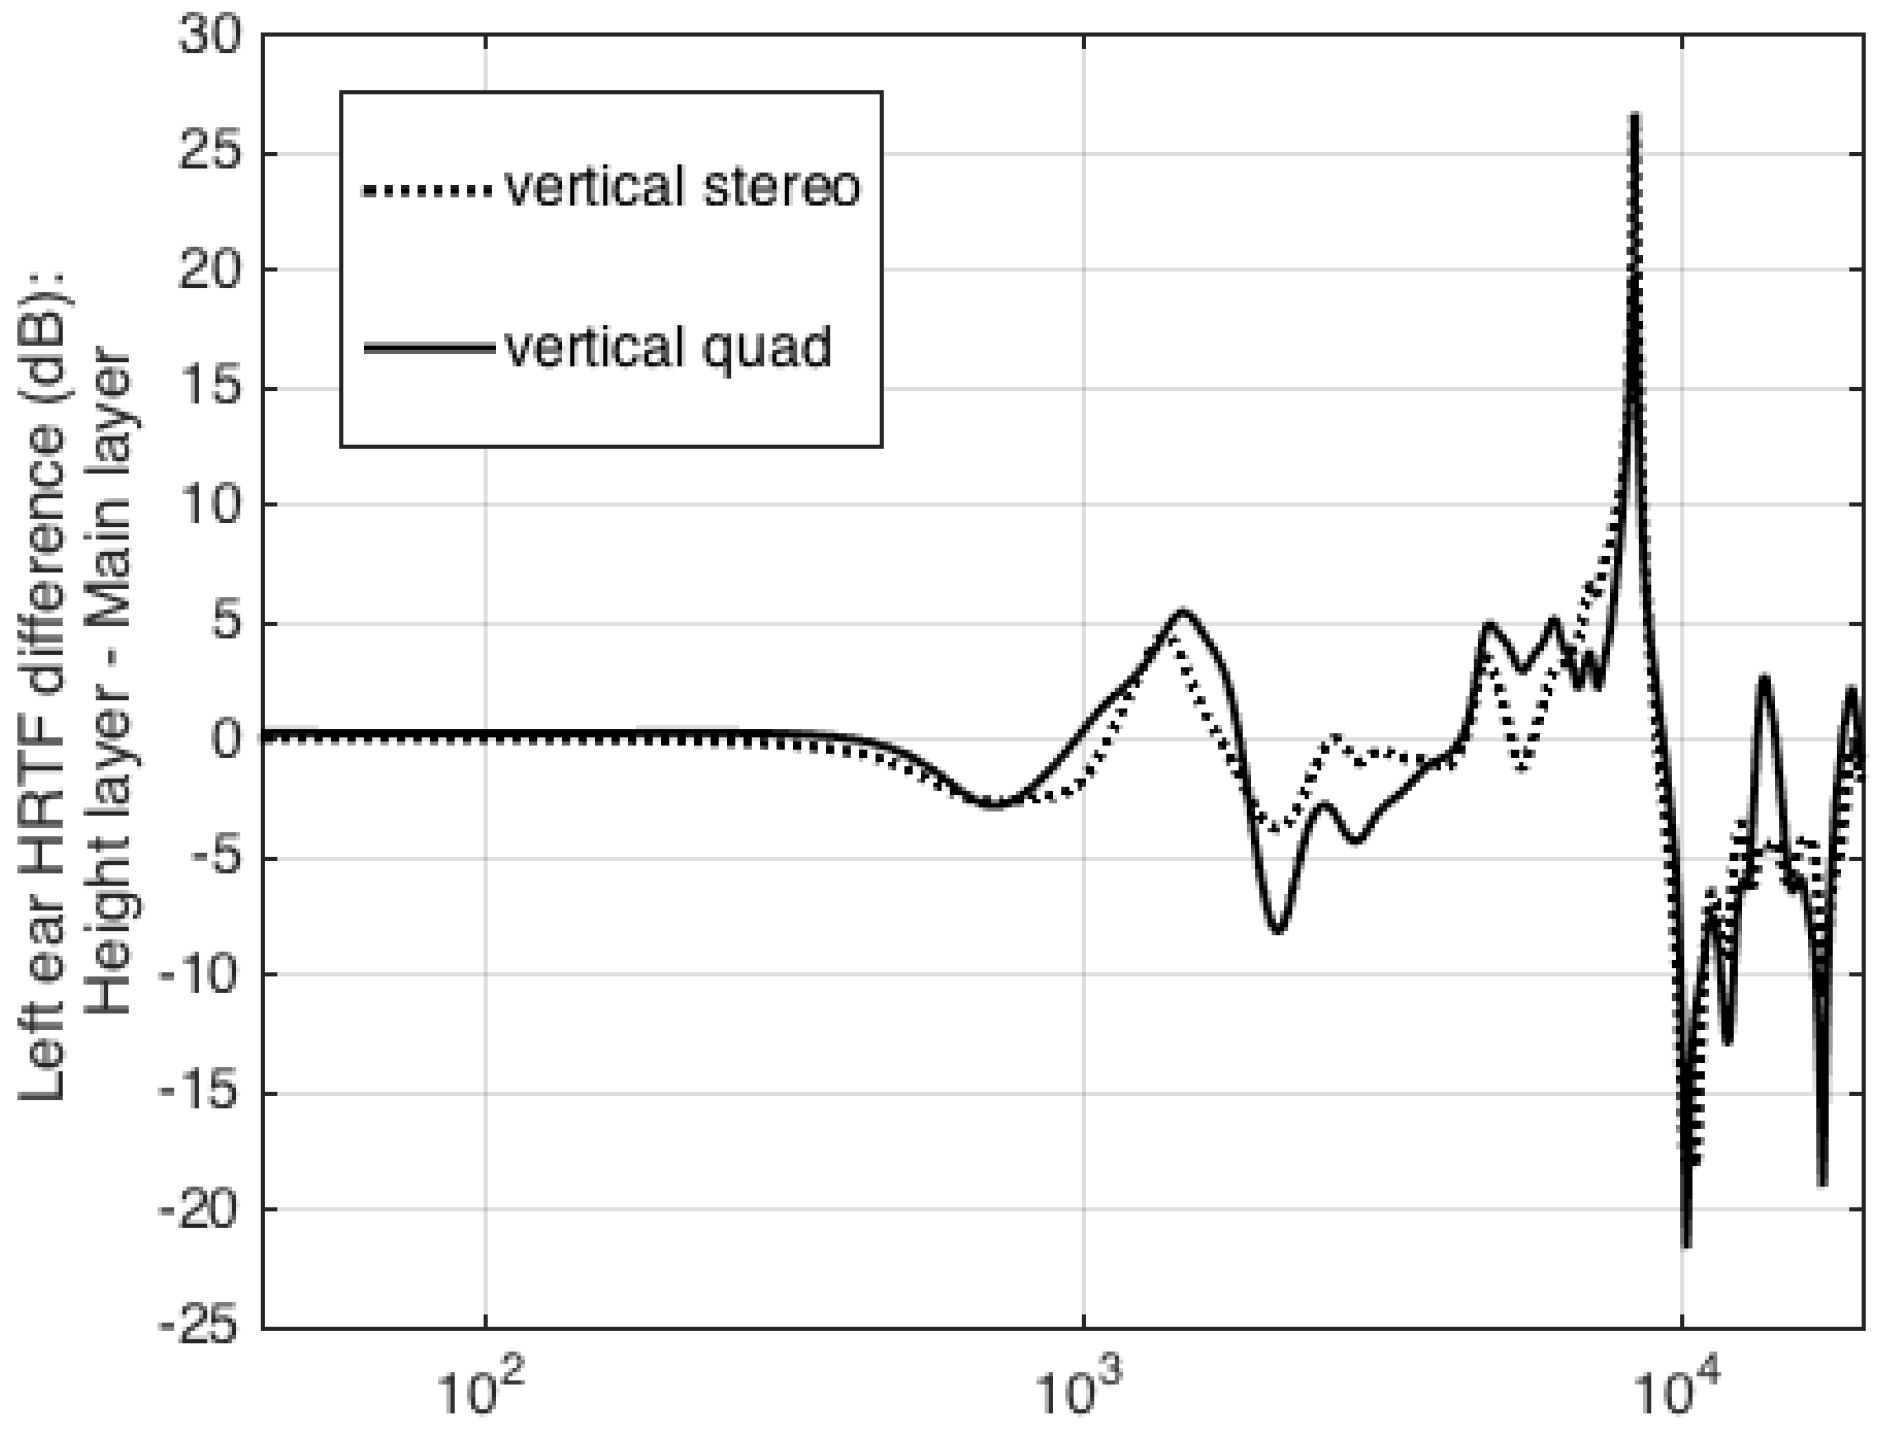
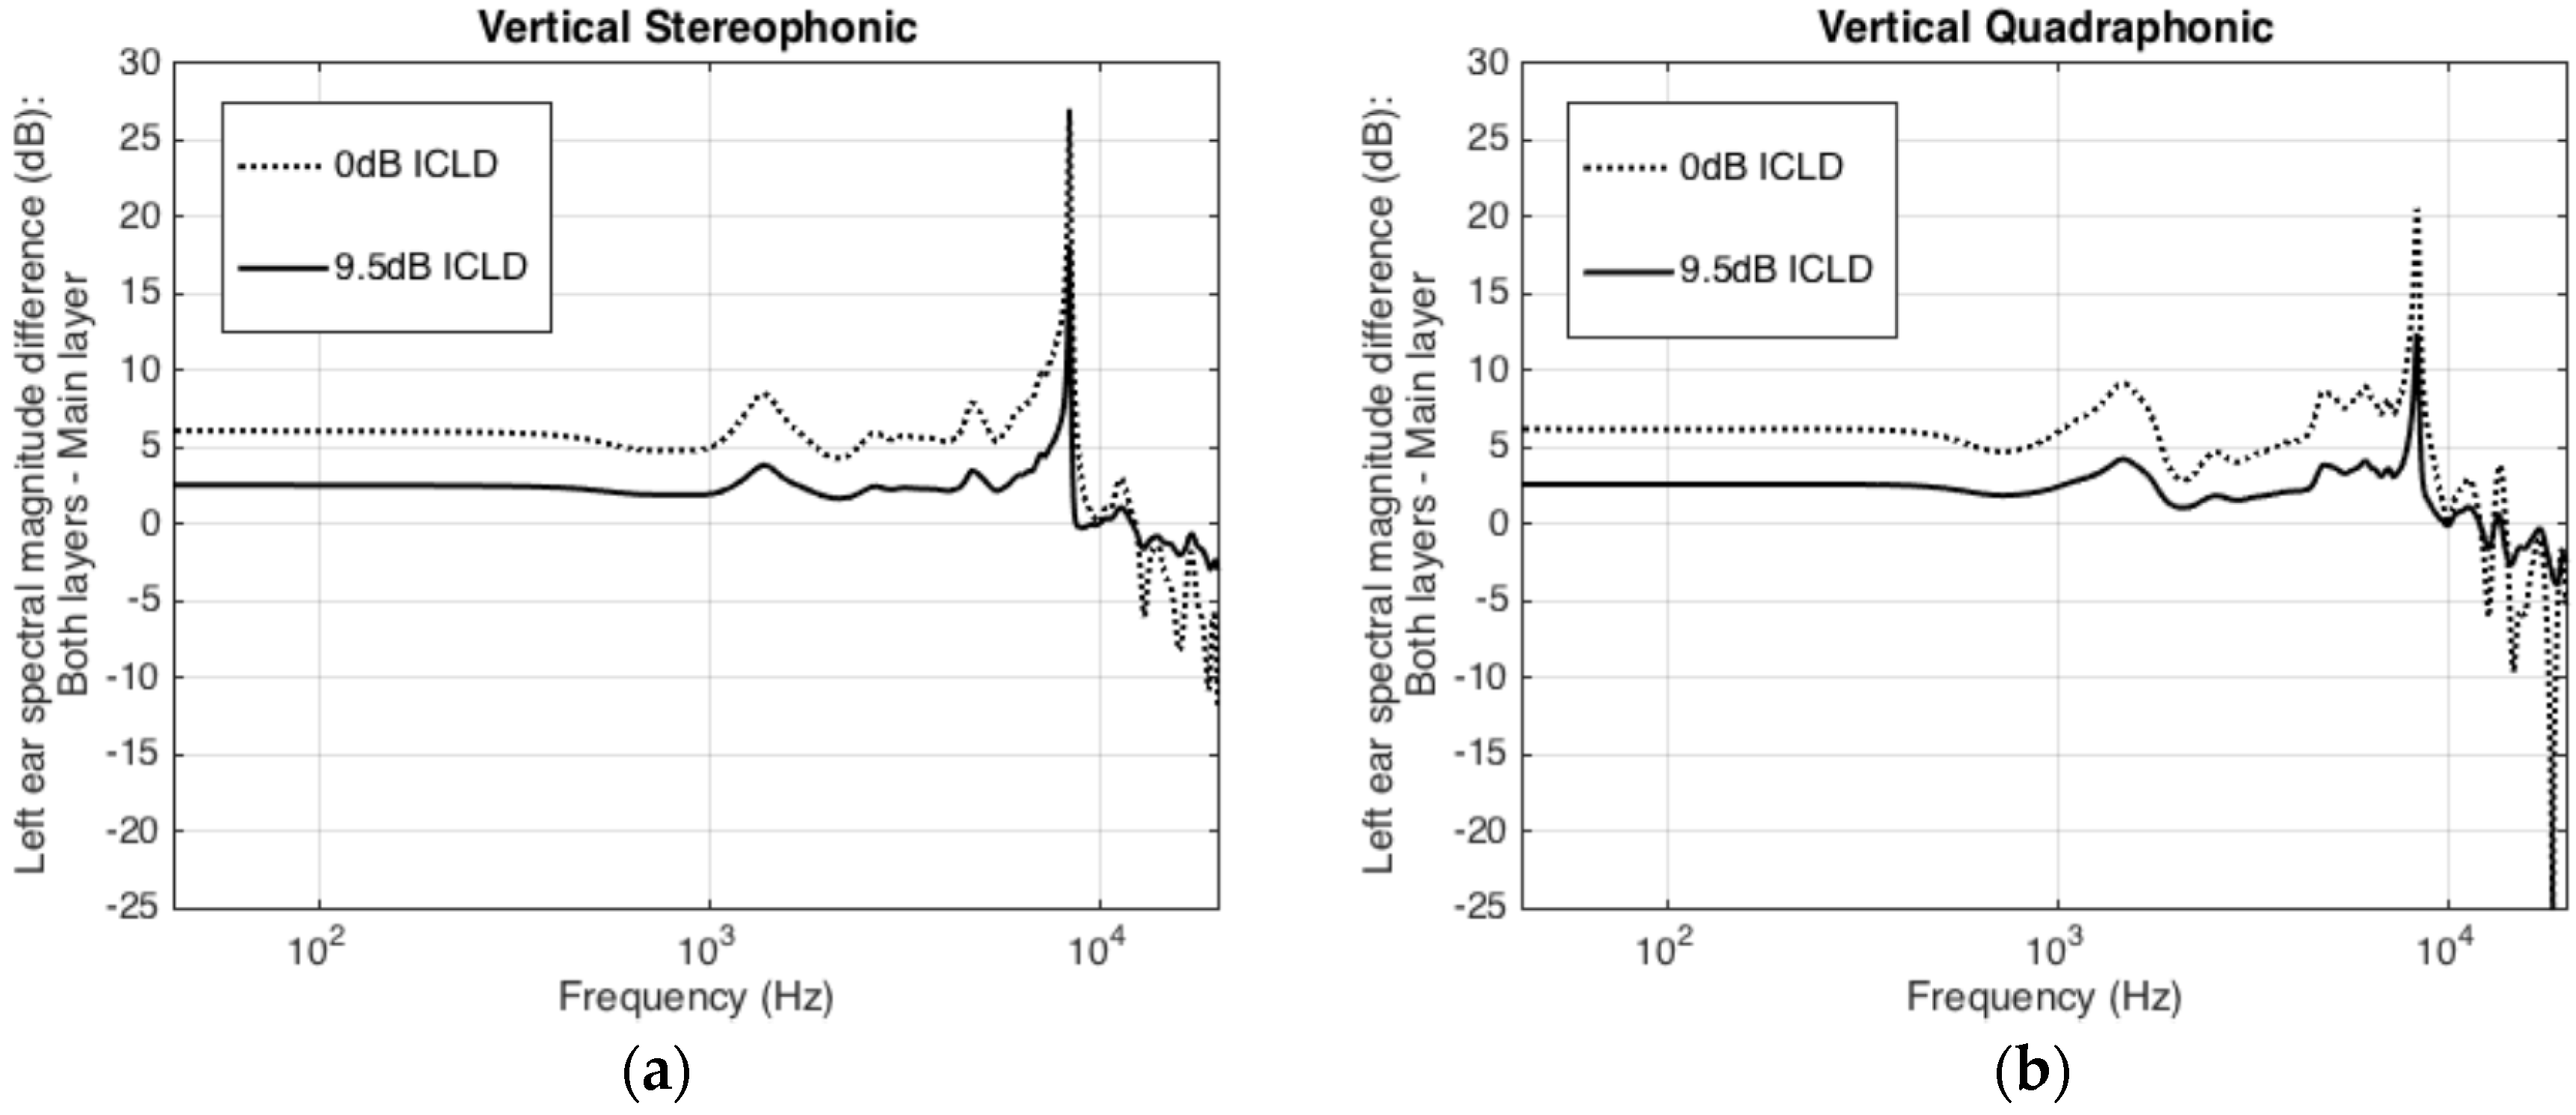
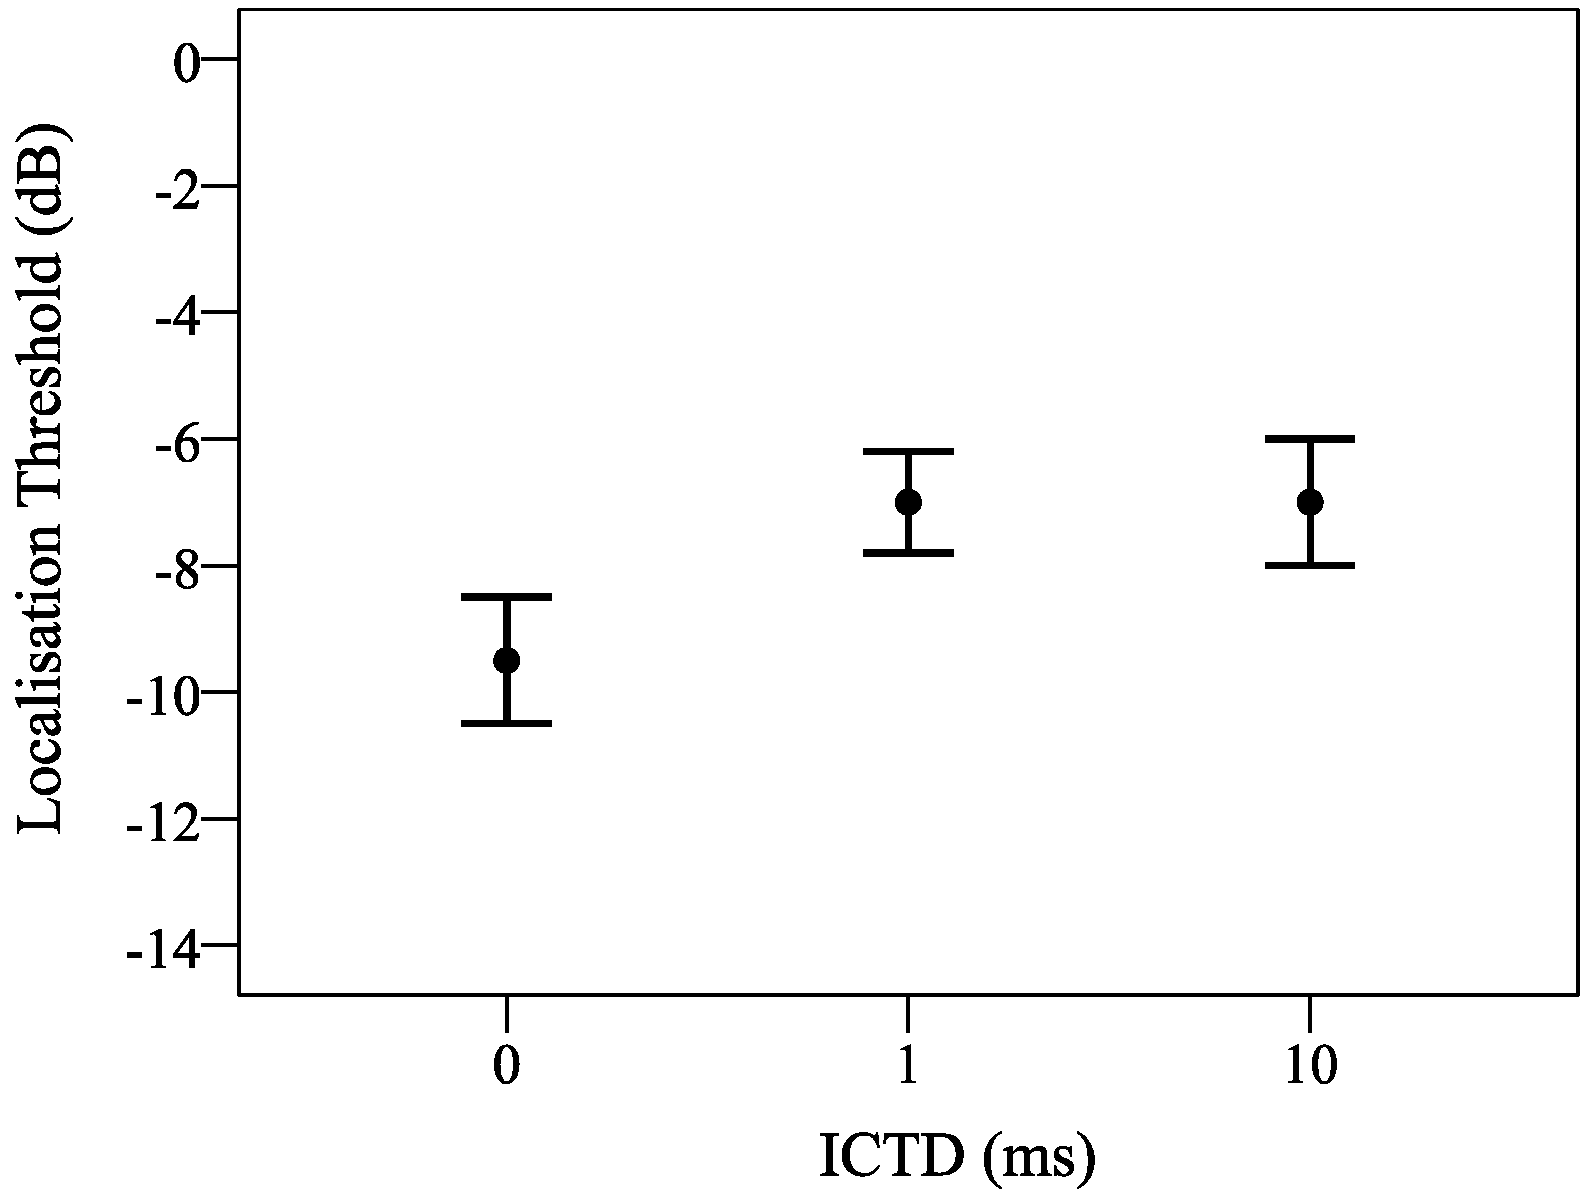
The results of the experiment showed that the localisation thresholds were affected only by ICTD. For delays of 0 ms the threshold was −9.5 dB, which was significantly lower than the −7 dB found for 1 and 10 ms. That less ICLD was necessary in the presence of a delay was initially interpreted based on the existence of a localisation dominance effect. In addition, attempts to explain the non-significant effect of sound source were made based on the hypothesis that the primary mechanism to determine whether or not the localisation threshold had been met was the balance of spectral energy provided by the main and height layer, particularly in the 7–9 kHz range, which is not related to the spectrum of the source itself. This hypothesis also explained the non-significant effect of presentation method, with it being demonstrated that the reduction in the difference in energy between the main layer only and phantom image conditions in the 7–9 kHz region was similar for both methods for a given ICLD.
In Experiment Two, the localisation thresholds obtained in Experiment One were applied to natural sound sources, with localisation tests being conducted in order to verify that they were effective at preventing vertical interchannel crosstalk from affecting the perceived location of the main channel signal. Stimuli were presented using the vertical quadraphonic condition, with the main and height layer-only, 0-dB ICLD and localisation threshold conditions all being tested. ICTDs of 0 and 1 ms were applied to the height layer with respect to the main. Subjects used a light strip, which was controlled by a handheld knob, in order to identify the perceived location of each stimulus. For all stimuli, there was no significant difference in perceived elevation between the main layer only and localisation threshold conditions.
A key result from Experiment Two was that no evidence was found to support the existence of a localisation dominance effect, with the perceived elevation of the sources with 1-ms ICTD being higher than those with 0-ms ICTD. It is therefore unclear why less level reduction was necessary in Experiment One in the case that an ICTD was present. The results also showed evidence of the phantom image elevation effect, which was used to suggest that the perceived difference in elevation between the main layer only and phantom image conditions would be similar for both presentation methods for a given ICLD. This therefore further explained why the effect of presentation method was not significant in Experiment One. In addition, the results implied that the oboe source was localised based on the pitch-height effect. This meant that the hypothesis regarding the balance of spectral cues provided by the main and height layers did not adequately explain the localisation thresholds obtained for this source. As a result of this, it was suggested that the results might be explained based on differences in perceived VIS between the main layer-only and phantom image conditions.
The practical implications of the results obtained in the study were also discussed. In particular, differences between suggestions made in previous studies and those indicated by the present results were considered. It was also stated that further study would need to be conducted into the spatial and timbral effects when the localisation thresholds are applied in order to determine whether or not it would be more appropriate for the direct sound in the height layer to be masked.

Acknowledgments

This work was supported by the Engineering and Physical Sciences Research Council (EPSRC), UK, Grant Ref. EP/L019906/1. The authors thank the staff members and students of the University of Huddersfield’s music technology courses who participated in the listening tests.

Author Contributions

Rory Wallis conducted the experiment, analysed the data and wrote the paper. Hyunkook Lee supervised the project and contributed to the data analysis and discussion presented in the paper.

Conflicts of Interest

The authors declare no conflict of interest.

References

  1. Listening Formats: Auro 3D. Available online: http://www.auro-3d.com/system/listening-formats (accessed on 13 October 2016).
  2. Dolby Atmos. Available online: http://www.dolby.com/us/en/brands/dolby-atmos.html (accessed on 13 October 2016).
  3. Somerville, T.; Gilford, C.L.S.; Spring, N.F.; Negus, R.D.M. Recent Work on the Effects of Reflectors in Concert Halls and Music Studios; British Broadcasting Corporation: London, UK, 1965. [Google Scholar]
  4. Pulkki, V. Localization of Amplitude-Panned Virtual Sources II: Two- and Three-Dimensional Panning. J. Audio Eng. Soc. 2001, 49, 753–767. [Google Scholar]
  5. Barbour, J. Elevation Perception: Phantom images in the vertical hemisphere. In Proceedings of the AES 24th International Conference on Multichannel Audio, Banff, AB, Canada, 26–28 June 2003.
  6. Wendt, F.; Frank, M.; Zotter, F. Panning with height on 2, 3 and 4 loudspeakers. In Proceedings of the 2nd International Conference on Spatial Audio, Erlangen, Germany, 21–23 February 2014.
  7. Kimura, T.; Ando, H. 3S Audio System Using Multiple Vertical Panning for Large-Screen Multiview 3D Video Display. ITE Trans. MTA 2014, 2, 33–45. [Google Scholar]
  8. Lee, H. The relationship between interchannel time and level differences in vertical sound localisation and masking. In Proceedings of the Audio Engineering Society 131st Convention, New York, NY, USA, 20–23 October 2011. Preprint 8556.
  9. Stenzl, H.; Scuda, U.; Lee, H. Localisation and masking thresholds of diagonally positioned sound sources and their relationship to interchannel time and level differences. In Proceedings of the International Conference on Spatial Audio, Erlangen, Germany, 21–23 February 2014.
  10. Wallis, R.; Lee, H. Vertical Stereophonic Localisation in the Presence of Interchannel Crosstalk: The Analysis of Frequency-Dependent Localisation Thresholds. J. Audio Eng. Soc. 2016, 64, 762–770. [Google Scholar] [CrossRef]
  11. Wallis, R.; Lee, H. The Effect of Interchannel Time Difference on Localisation in Vertical Stereophony. J. Audio Eng. Soc. 2015, 63, 767–776. [Google Scholar] [CrossRef]
  12. Lee, H. Perceptual Band Allocation (PBA) for the Rendering of Vertical Image Spread with a Vertical 2D Loudspeaker Array. J. Audio Eng. Soc. 2016, 64, 1003–1013. [Google Scholar] [CrossRef]
  13. De Boer, K. A Remarkable Phenomenon with Stereophonic Sound Reproduction. Philips Tech. Rev. 1947, 9, 8–13. [Google Scholar]
  14. Lee, H. Investigation on the phantom image elevation effect. In Proceedings of the Audio Engineering Society 139th Convention, New York, NY, USA, 29 October–1 November 2015. Preprint 9441.
  15. International Telecommunication Union. Recommendation ITU-R BS.1116-1: Methods for the Subjective Assessment of Small Impairments in Audio Systems Including Multichannel Sound Systems; International Telecommunications Union: Geneva, Switzerland, 1994. [Google Scholar]
  16. Bech, S.; Zacharov, N. Perceptual Audio Evaluation: Theory, Method and Application; Wiley: Chester, UK, 2006. [Google Scholar]
  17. Cardozo, B.L. Adjusting the Method of Adjustment: SD vs. DL. J. Acoust. Soc. Am. 1965, 37, 786–792. [Google Scholar] [CrossRef]
  18. Lawless, H.T. Quantitative Sensory Analysis: Psychophysics, Models and Intelligent Design; Wiley-Blackwell: Chichester, UK, 2013. [Google Scholar]
  19. Taylor, M.M.; Creelman, C.D. PEST: Efficient Estimates on Probability Functions. J. Acoust. Soc. Am. 1967, 41, 782–787. [Google Scholar] [CrossRef]
  20. Levitt, H. Transformed Up-Down Methods in Psychoacoustics. J. Acoust. Soc. Am. 1970, 49, 467–477. [Google Scholar] [CrossRef]
  21. Hesse, A. Comparison of Several Psychophysical Procedures with Respect to Threshold Estimates, Reproducibility and Efficiency. Acta Acust. United Acust. 1986, 59, 263–273. [Google Scholar]
  22. Johnson, T.; Gibson, I.; Evans, B.; Wendl, M. An Investigation into Kinect and Middleware Error and Their Suitability for Academic Listening Tests. In Proceedings of the Audio Engineering Society 140th Convention, Paris, France, 4–7 June 2016. eBrief 273.
  23. McGill, R.; Tukey, J.W.; Larsen, W.A. Variations of Box Plots. Am. Stat. 1978, 32, 12–16. [Google Scholar] [CrossRef]
  24. Cohen, J. Statistical Power Analysis for the Behavioral Sciences; Lawrence Erlbaum Associates: New York, NY, USA, 1988. [Google Scholar]
  25. Lieberman, M.D.; Cunningham, W.A. Type I and Type II Error Concerns in fMRI Research: Re-balancing the Scale. Soc. Cog. Affect. Neurosci. 2009, 4, 423–428. [Google Scholar] [CrossRef] [PubMed]
  26. Simner, R. An Improved Bonferroni Procedure for Multiple Tests of Significance. Biometrika 1986, 73, 751–754. [Google Scholar]
  27. Lee, H.; Johnson, D.; Mironovs, M. A new response method for auditory localisation and spread tests. In Proceedings of the Audio Engineering Society 140th Convention, Paris, France, 4–7 June 2016. e-Brief 240.
  28. Roffler, S.K.; Butler, R.A. Factors that Influence the Localisation of Sound in the Vertical Plane. J. Acoust. Soc. Am. 1968, 43, 1255–1259. [Google Scholar] [CrossRef] [PubMed]
  29. Cabrera, D.; Tiley, S. Vertical localisation and image size effects in loudspeaker reproduction. In Proceedings of the AES 24th International Conference on Multichannel Audio, Banff, AB, Canada, 26–28 June 2003.
  30. Hebrank, J.; Wright, D. Spectral Cues used in the Localisation of Sound Sources on the Median Plane. J. Acoust. Soc. Am. 1974, 56, 1829–1834. [Google Scholar] [CrossRef] [PubMed]
  31. Gardener, B.; Martin, K. HRTF Measurements of a KEMAR Dummy-Head Microphone. 2000. Available online: http://sound.media.mit.edu/resources/KEMAR.html (accessed on 17 November 2016).
  32. Blauert, J. Sound Localisation in the Median Plane. Acta Acust. United Acust. 1969, 22, 205–213. [Google Scholar]
  33. Chun, C.J.; Kim, H.K.; Choi, S.H.; Jang, S.; Lee, S. Sound Source Elevation Using Spectral Notch Filtering and Directional Band Boosting in Stereo Loudspeaker Reproduction. IEEE Trans. Consum. Electron. 2011, 57, 1915–1920. [Google Scholar] [CrossRef]
  34. Pratt, C.C. The Spatial Character of High and Low Tones. J. Exp. Psychol. 1930, 13, 278–285. [Google Scholar] [CrossRef]
  35. Blauert, J. Spatial Hearing: The Psychophysics of Human Sound Localisation; MIT Press: Cambridge, UK, 1997. [Google Scholar]
  36. Wallach, H.; Newman, E.B.; Rosenzweig, M.R. The Precedence Effect in Sound Localisation. Am. J. Psychol. 1949, 52, 315–336. [Google Scholar] [CrossRef]
  37. Blauert, J. Localisation and the Law of the First Wavefront in the Median Plane. J. Acoust. Soc. Am. 1971, 50, 466–470. [Google Scholar] [CrossRef] [PubMed]
  38. Litovsky, R.Y.; Rakerd, B.; Tin, T.C.T.; Hartmann, W.M. Psychophysical and Physiological Evidence for a Precedence Effect in the Median Sagittal Plane. J. Neurophysiol. 1997, 77, 2223–2226. [Google Scholar] [PubMed]
  39. Tregonning, A.; Martin, B. The Vertical Precedence Effect: Utilising Delay Panning for Height Channel Mixing in 3D Audio. In Proceedings of the Audio Engineering Society 139th convention, New York, NY, USA, 29 October–1 November 2015. Preprint 9469.
  40. Halmrast, T. Orchestral Timbre: Comb-Filter Coloration from Reflections. J. Sound Vib. 2000, 232, 53–69. [Google Scholar] [CrossRef]
  41. Barron, M.; Marshall, A.H. Spatial Impression due to Early Lateral Reflections in Concert Halls: The Derivation of a Physical Measure. J. Sound Vib. 1981, 77, 211–232. [Google Scholar] [CrossRef]
Figure 1. The physical setup used for Experiment One. C: centre loudspeaker; L: left loudspeaker; R: right loudspeaker; HC: height centre loudspeaker; HL: height left loudspeaker; HR: height right loudspeaker.
Applsci 07 00278 g001
Figure 2. Long-term average spectra and waveforms of test stimuli used for Experiment One.
Applsci 07 00278 g002
Figure 3. Presentation methods for test stimuli.
Applsci 07 00278 g003
Figure 4. Medians and associated notch edges for each experimental condition. ICTD: interchannel time difference.
Applsci 07 00278 g004
Figure 5. Medians and associated notch edges with the results for both presentation methods combined.
Applsci 07 00278 g005
Figure 6. Medians and associated notch edges with the results for both presentation methods combined, arranged to compare the localisation thresholds for each sound source at each ICTD.
Applsci 07 00278 g006
Figure 7. Localisation thresholds for combined sources.
Applsci 07 00278 g007
Figure 8. Physical setup for the localisation threshold verification test.
Applsci 07 00278 g008
Figure 9. Medians and associated notch edges for the results of the verification test showing the perceived elevation of each of the test stimuli. The dotted lines at 0 and 30° represent the physical positions of the main and height layers respectively. ICLD: interchannel level difference.
Applsci 07 00278 g009
Figure 10. The differences in spectral energy between the main and height layer only conditions for both vertical stereophonic and vertical quadraphonic source presentation.
Applsci 07 00278 g010
Figure 11. Difference in spectral energy between the main layer only and phantom image conditions for both presentation methods with 0-dB ICLD between the main and height layers and 9.5-dB ICLD (localisation threshold): (a) vertical stereophonic condition; (b) vertical quadraphonic condition.
Applsci 07 00278 g011
Figure 12. Illustration to show how presentation method would not affect localisation thresholds despite the presence of the phantom image elevation effect.
Applsci 07 00278 g012
Figure 13. Medians and associated notch edges for the verification test results arranged for the analysis of the localisation dominance effect.
Applsci 07 00278 g013

