Article

Experimental Study of Imbibition Characteristics of Silica Sol in Coal-Measure Mudstone Matrix

1
Key Laboratory of Deep Coal Resource Mining, Ministry of Education of China, China University of Mining and Technology, Xuzhou 221116, China
2
Department of Energy and Mineral Engineering, G3 Center and Energy Institute, Pennsylvania State University, University Park, PA 16802, USA
*
Author to whom correspondence should be addressed.
Appl. Sci. 2017, 7(3), 300; https://doi.org/10.3390/app7030300
Submission received: 28 December 2016 / Revised: 27 February 2017 / Accepted: 16 March 2017 / Published: 20 March 2017

Abstract

:
Coal-measure mudstone is a typical dual-porosity media, and grouting in a matrix system is dominantly controlled by the imbibition effect for silica sol. This paper studies the imbibition effect using mudstone in the Huaibei mining area and silica sol as grouting material as an example. Groutability, driving force, and diffusion difficulty affecting the imbibition effect were tested by a mercury porosimeter, nanoparticle size analyzer, optical contact-angle measuring device, surface tension meter, and rotary viscosity meter. After finely grinding a mudstone sample, a pressureless imbibition process was conducted through nuclear magnetic resonance equipment for 216 h to study colloid spontaneous migration and phase characteristics. Results show that silica sol absorption rate follows a power function and that the spectrograms of T2 are distributed in a triple peak pattern, with a tendency to move to the right of vertex time. The paper lays a theoretical and experimental foundation for field grouting in the coal mine.

Graphical Abstract

1. Introduction

Coal-measure mudstone has low bounding strength and developed micropores. When invaded by underground water through a dynamically developed fracture system, it showed nonlinear large deformation and significant creep characteristics. Mudstone is highly sensitive to mining and driving disturbances; these are the key weaknesses of the durability of the roadway surrounding rock-controlling structure, under the coupling effect of rock stress, water, and wind [1]. Many engineering practices (Figure 1) showed that grouting was an effective technology for fundamentally utilizing and developing the bearing capacity of surrounding rock, and was a key measure to prevent the degradation of mudstone by water.
Coal-measure mudstone is a typical heterogeneous dual-porosity media. A cement slurry that is most commonly used in mining had a minimum groutability width of 0.1 mm, with almost no effect on the matrix system (nanoscale). Bleeding of the cement slurry would muddy and close the fracture surface, changing the seepage path and even blocking the grouting channels [2,3]. The groutability of sodium silicate materials and high-polymer materials was higher than the cement slurry, but also had little effect on the matrix system [4]. Hence, micropore sealing and reinforcement remained a difficulty that engineers committed to solve; this is an unavoidable fundamental question for serious deformation control of mudstone.
Silica sol is an environment-friendly, nanoscale, unimolecular aerogel [5,6], consisting of nanometer-sized particles of amorphous SiO2 cores with hydroxylated surfaces. Therefore, it can be expressed as mSiO2·nH2O suspended in water [7]. The gelation does not take place in a stabilized silica sol before it is destabilized by the addition of appropriate electrolytes (such as NaCl and CaCl2). When silica sol starts to aggregate, a stable network comprising silica particles forms [8].
Bolisetti built a shear gelation model and analyzed the experimental observations on silica sol grout injection into a sand column [9]. Gallagher and Lin modeled silica sol as fully soluble in UTCHEM (the University of Texas Chemical Flood Simulator) to simulate silica sol transport through sand columns [10,11]. Funehag studied how the penetration length of silica sol in a fracture system can be computed analytically both as a 1-D channel flow and a 2-D radial flow [12]. In conclusion, studies to date have concentrated on the transport mechanism of silica sol in sand and in a fracture system; characteristics of silica sol flow in low-permeability porous media are insufficient.
Using mudstone in the Huaibei mining area and silica sol as the grouting material as an example, this paper studies the imbibition effect of silica sol in coal-measure mudstone matrix. Groutability, driving force, and diffusion difficulty affecting the imbibition effect were tested by an AutoPore IV 9510 mercury porosimeter (Micromeritics Instrument Corporation, Norcross, GA, USA), ZS90 nanoparticle size analyzer (Malvern Instruments, Worcestershire, UK), DSA100 optical contact-angle measuring device (KRÜSS GmbH, Hamburg, Germany), K100 surface tension meter (KRÜSS GmbH, Hamburg, Germany), NDJ-5S rotary viscosity meter (Shanghai Pingxuan Scientific Instrument Co., Ltd., Shanghai, China), and other devices. Finally, in order to study colloid spontaneous migration and phase characteristics, the pressureless imbibition process was conducted using nuclear magnetic resonance (NMR) equipment (Niumag Electronics and Technology Corporation Limited, Shanghai, China) for 216 h.

2. Theory of Grout Transport in Dual-Porosity Media

In this analysis, the permeability medium is assumed to be homogeneous and isotropic, and the grout and air are incompressible and immiscible. Grout is the wetting phase and air is the nonwetting phase. The governing equations in fracture system are:
C p t ( p a p g ) + · [ k int k r , g μ g ( p g + ρ g g D ) ] = 0
C p t ( p a p g ) + · [ k int k r , a μ a ( p a + ρ a g D ) ] = 0
where Cp is the specific capacity; p is pressure (Pa); t is time; kint is the intrinsic permeability of the porous medium (mm2); kr is the relative permeability; μ is the fluid’s dynamic viscosity (Pa·s); ρ is the fluid density (kg/m3); g is acceleration of gravity; D is the coordinate of vertical elevation (m); and the subscripts g and a indicate grout and air, respectively.
The pressure differential in the interface between grout and air is the capillary force.
p c = p a p g
Imbibition capacity between in fracture and matrix system is
q a + q g = 0
The equation of qg can be measured by experiment, generally close to
q g ( t ) = R ( α β e λ t )
where R is the ultimate grouting capacity per unit rock under imbibition effect; α and β are parameters indicating the imbibition intensity.

3. Basic Characteristics of Coal-Measure Mudstone and Silica Sol

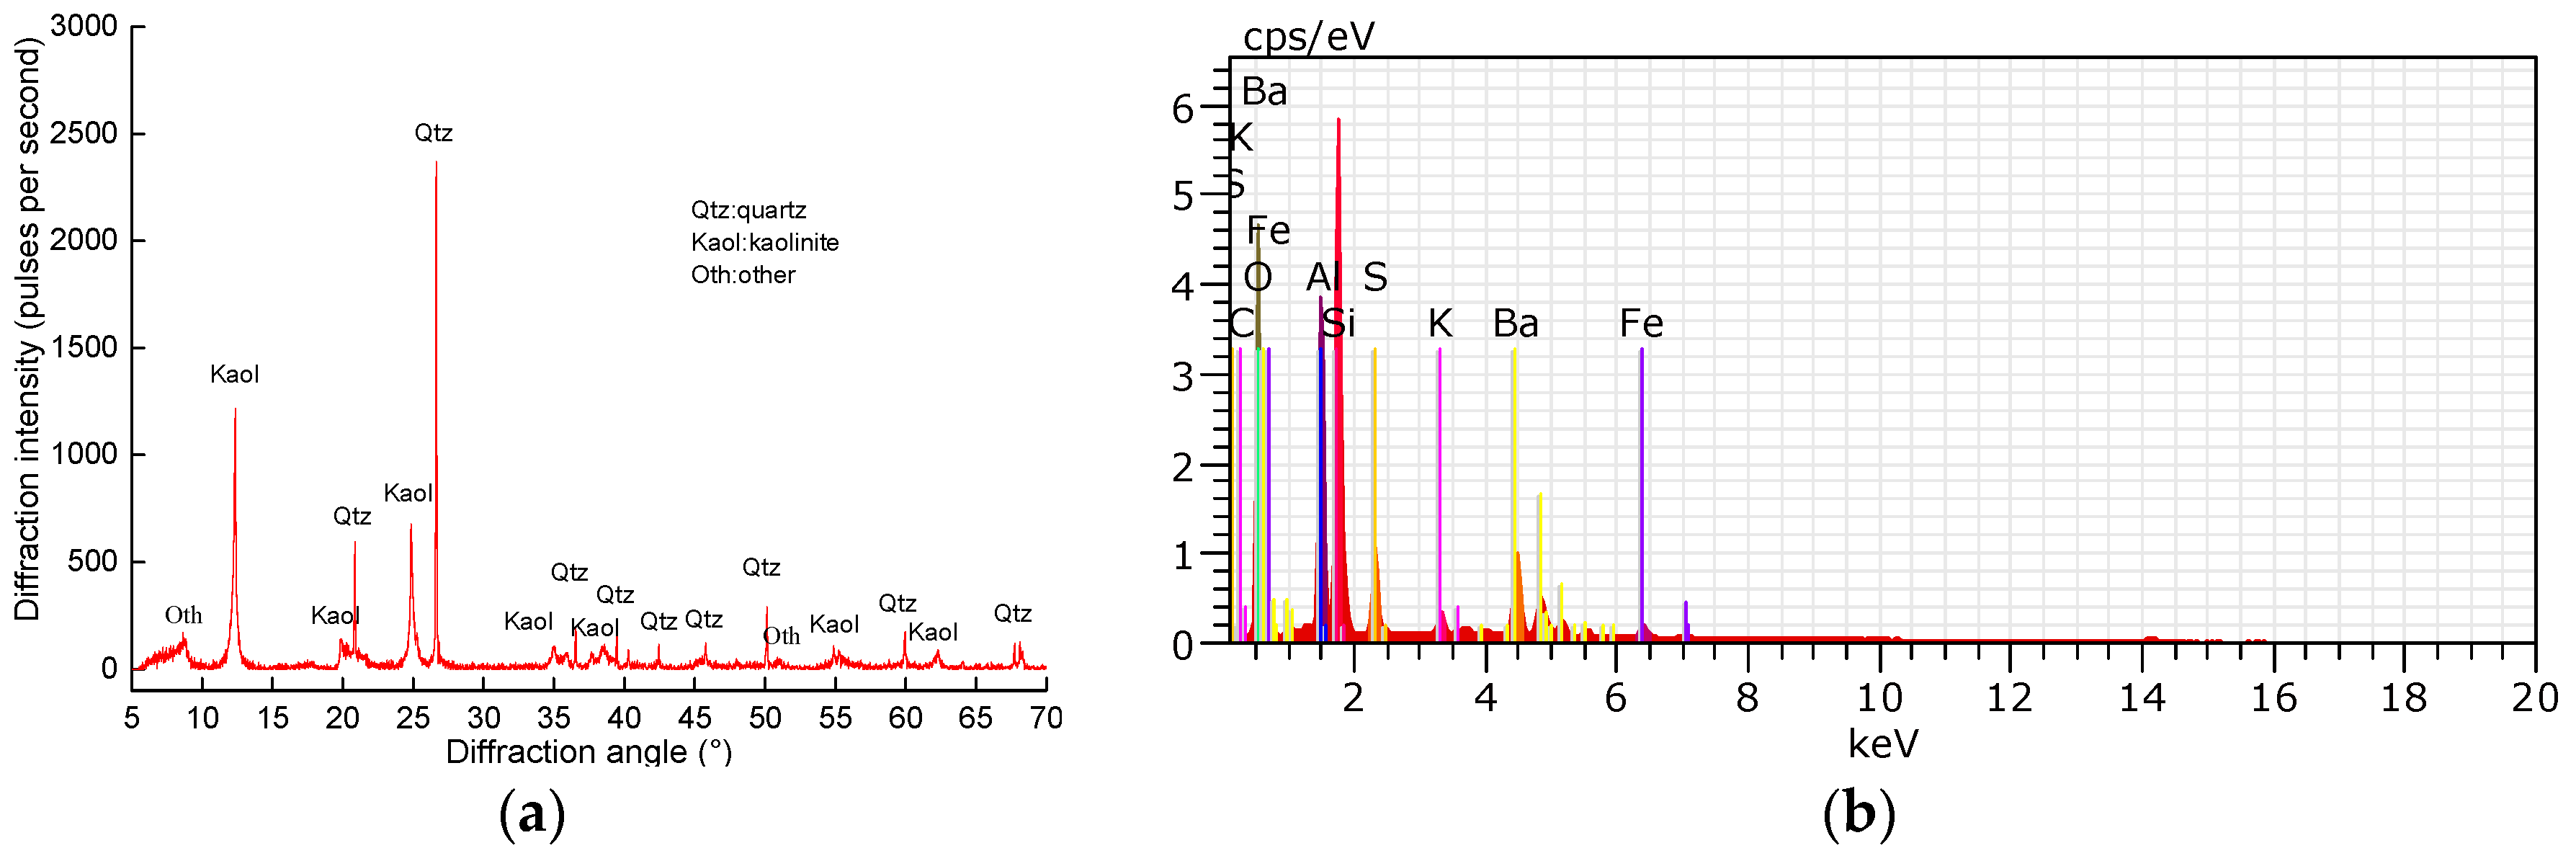
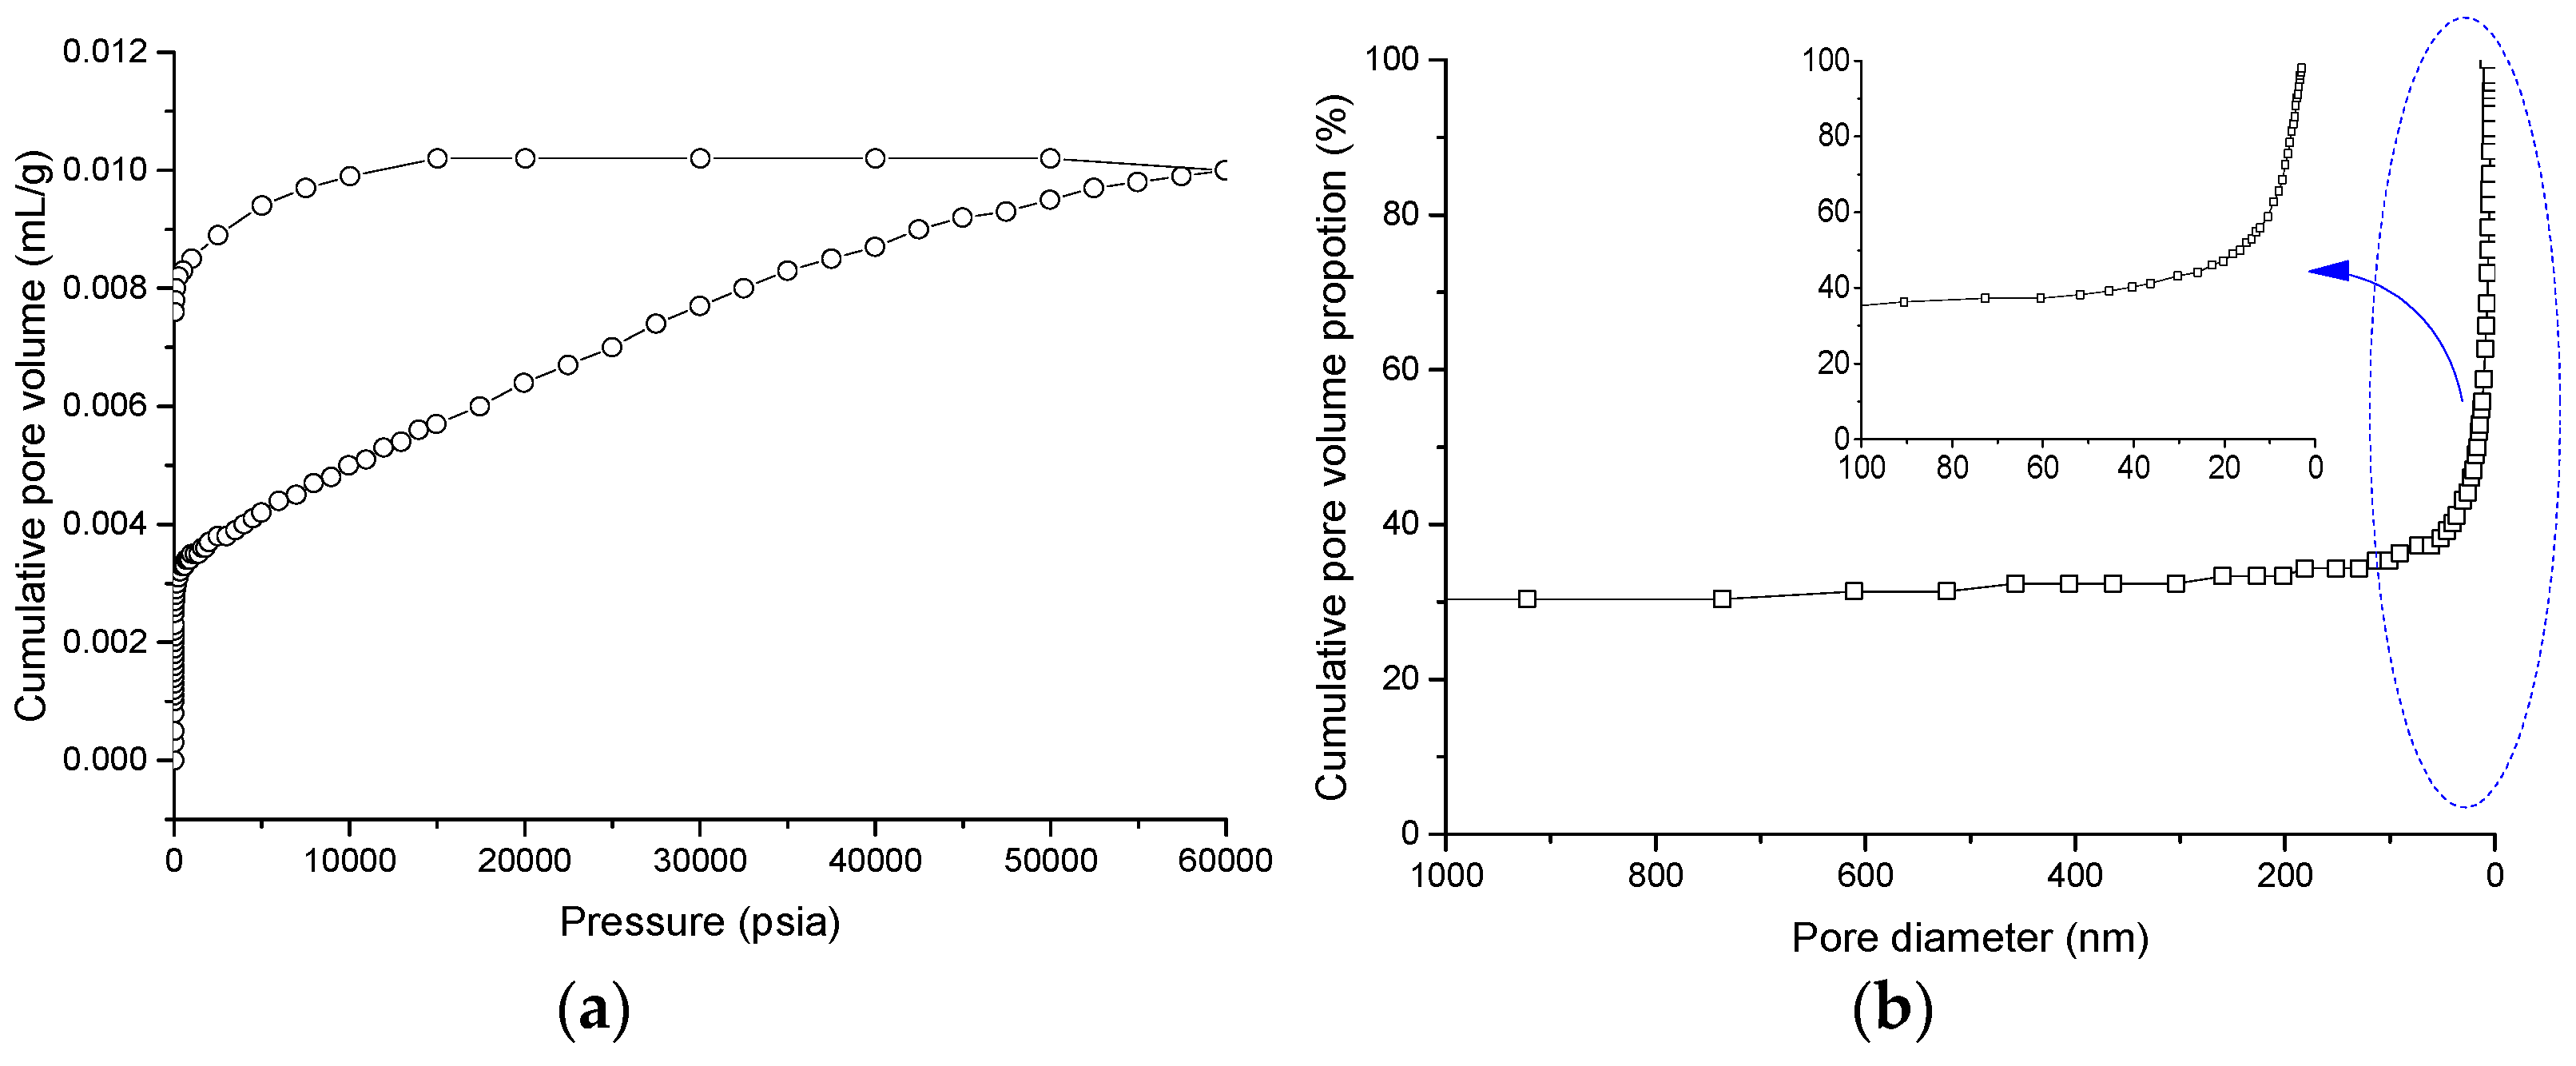
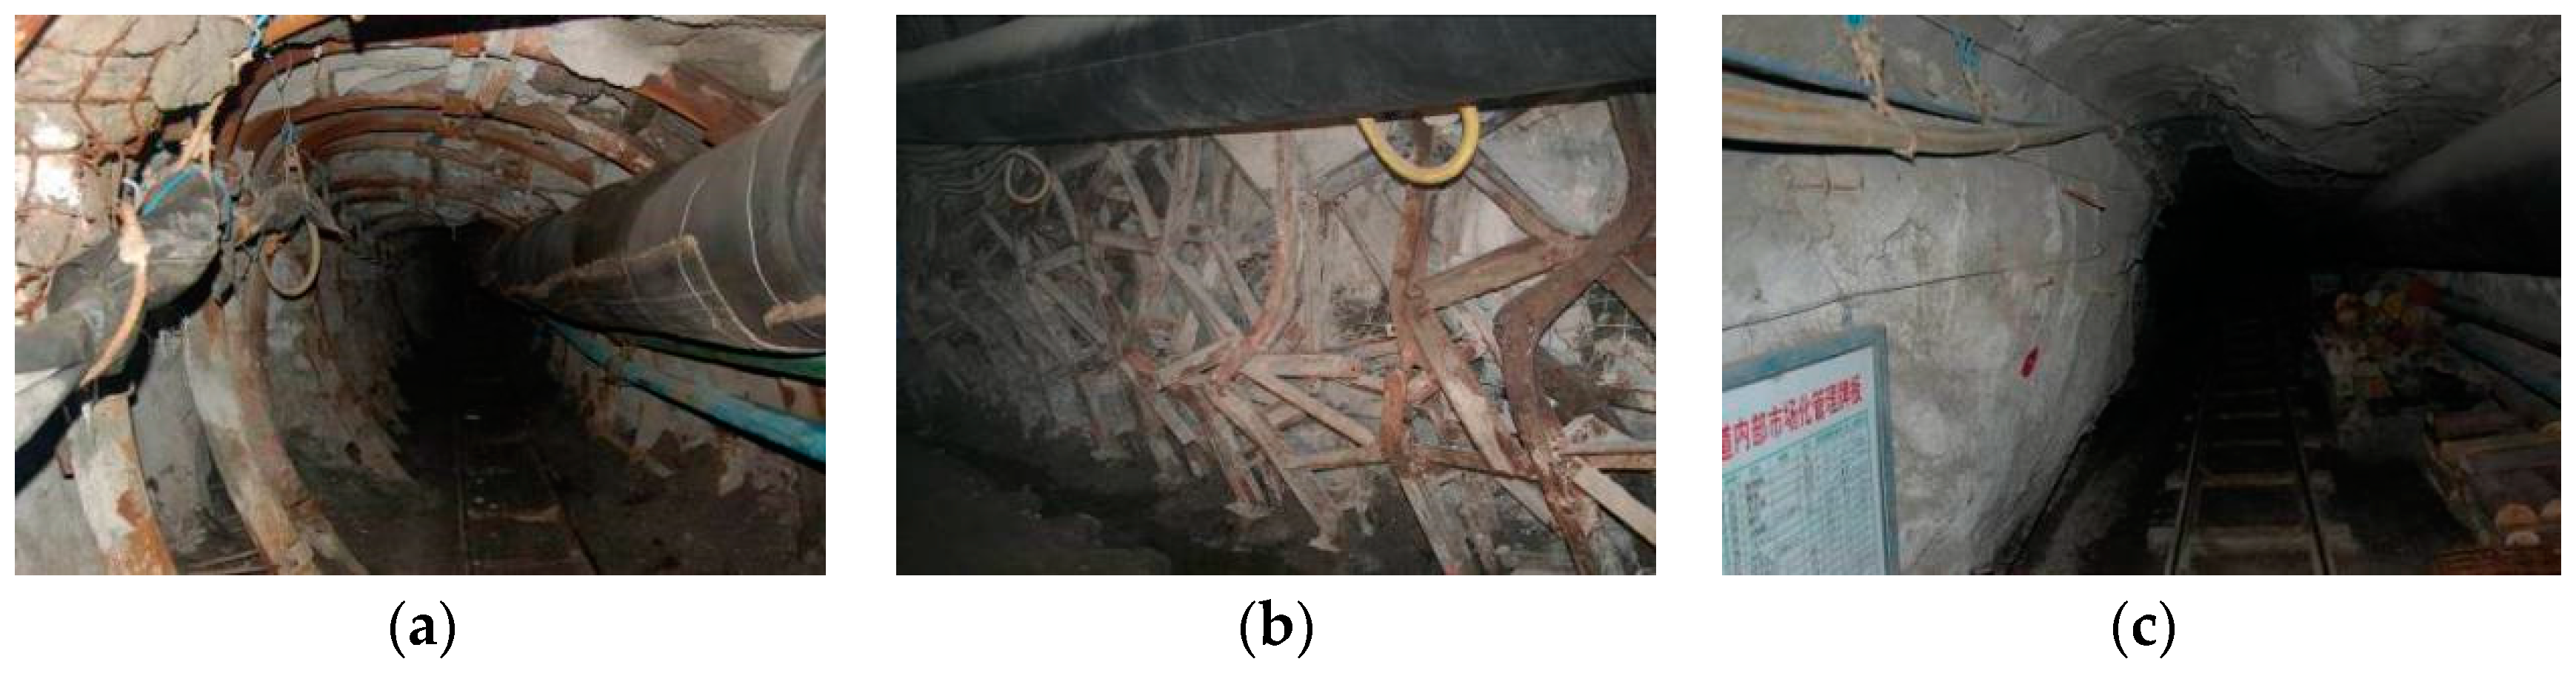
3.1. Coal-Measure Mudstone
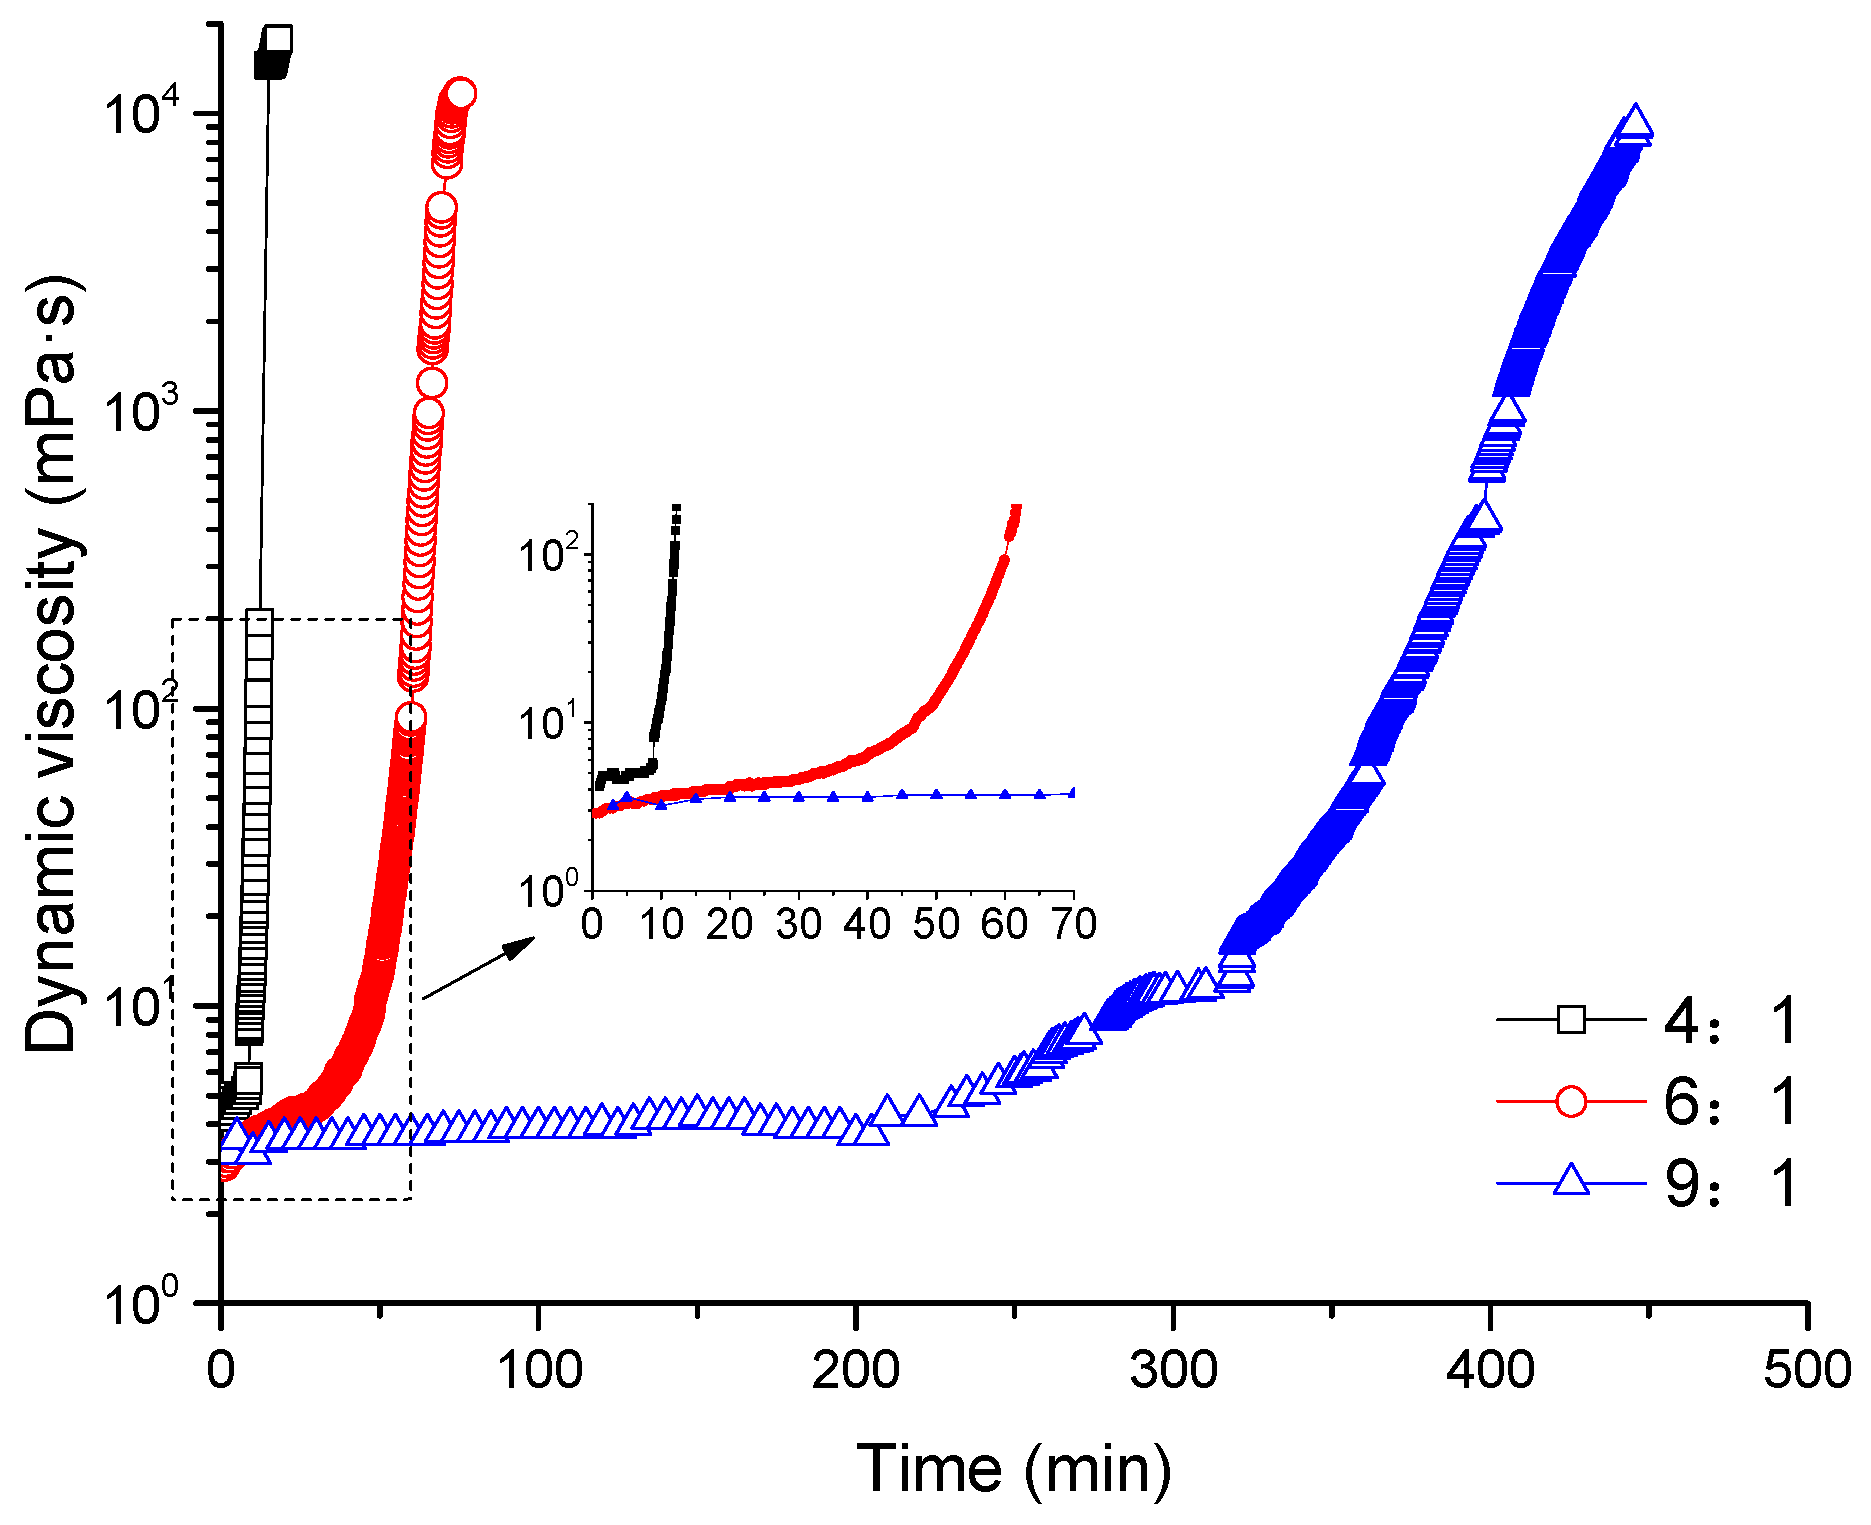
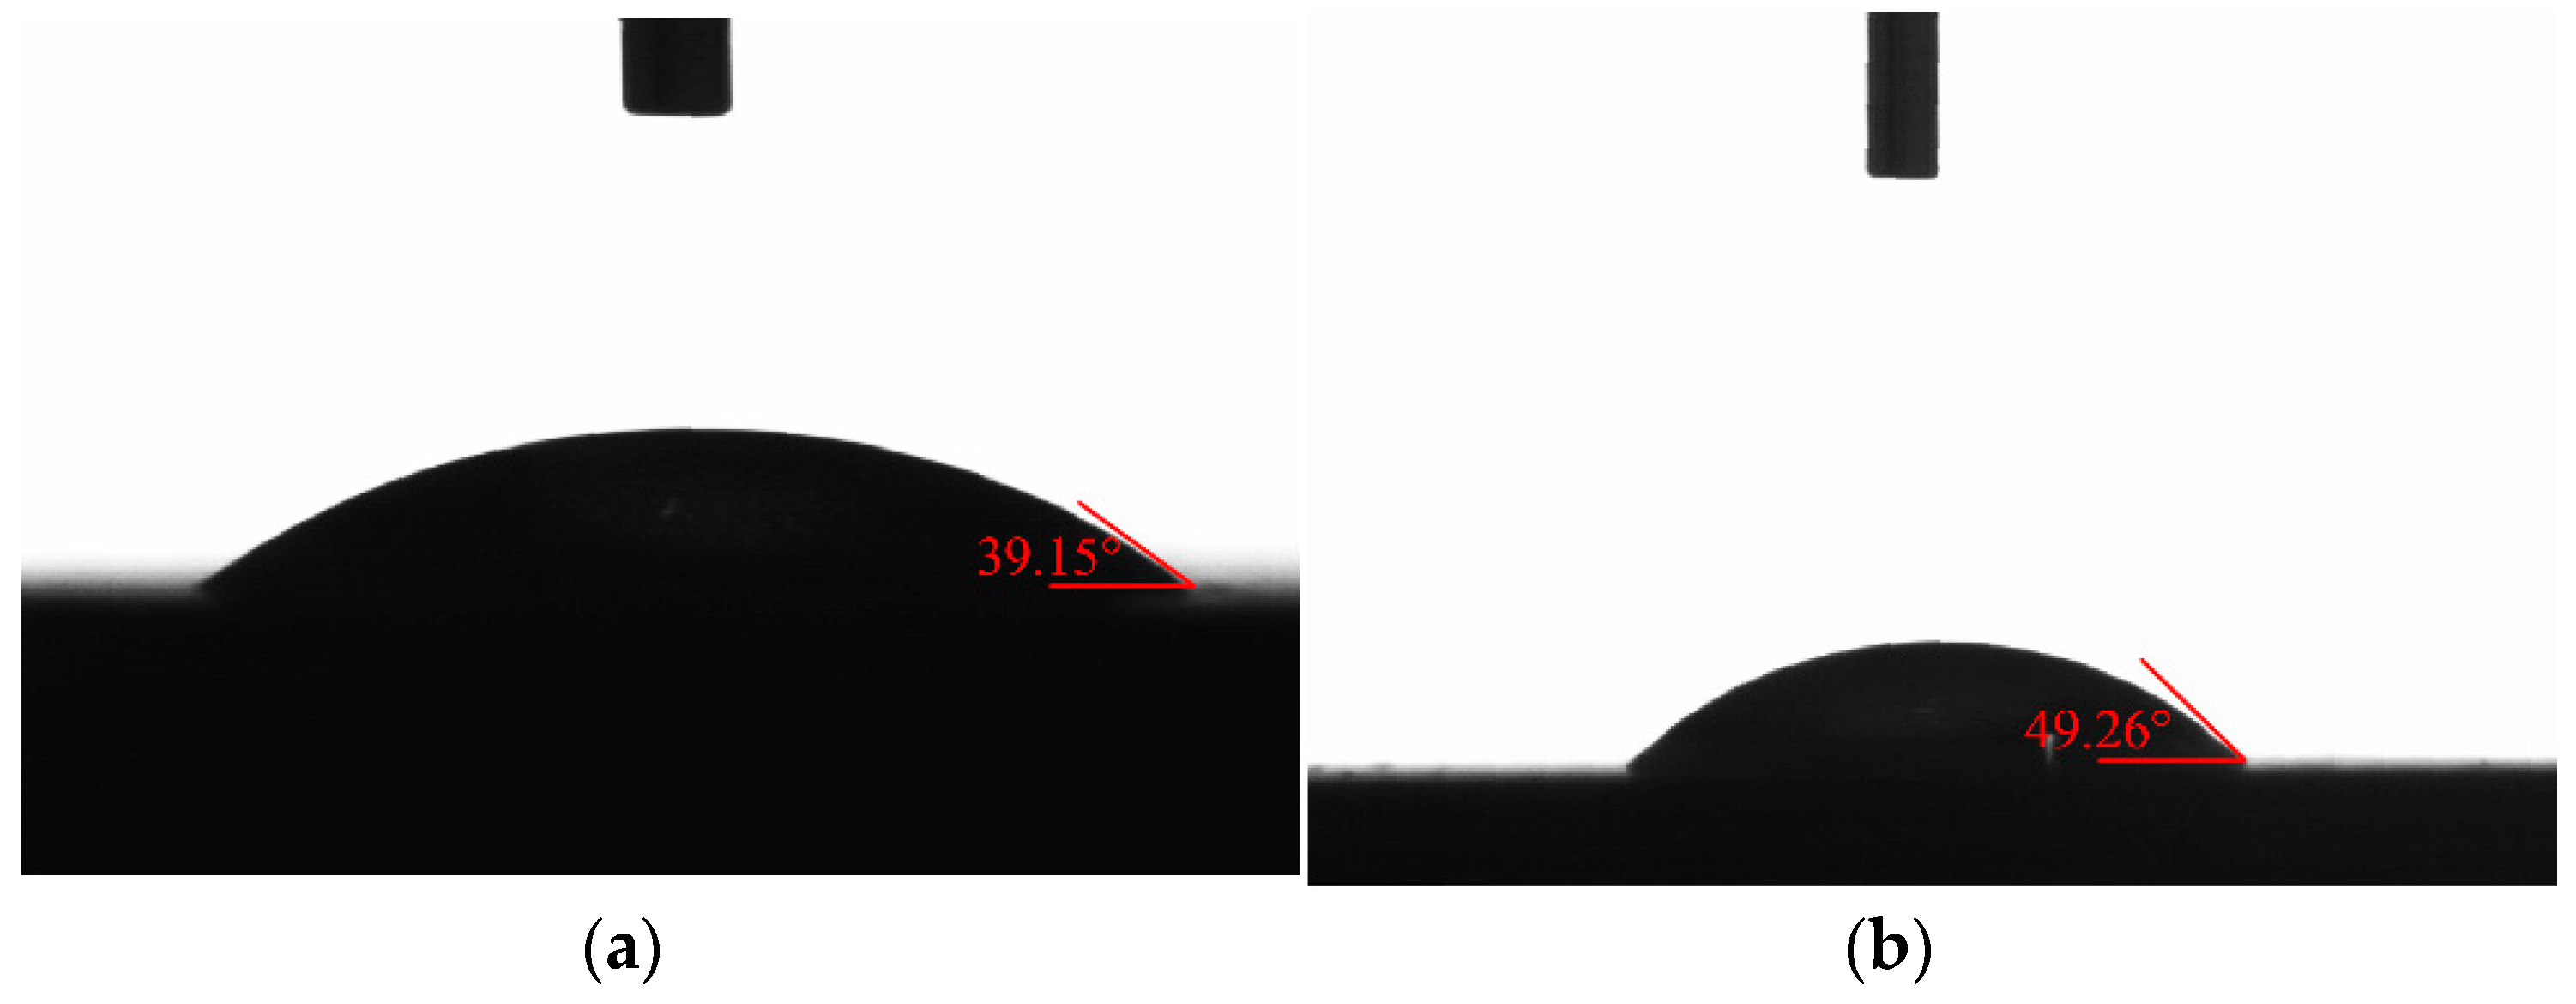
Mudstone samples were taken from the Permian stone box set of the Huaibei coalfield, from the floor of the 82 coal seam in Tongting Mine. The sample was grey-black with substantial texture and contained siderite. The test for composition characteristics was conducted at the Advanced Analysis & Computation Center of China University of Mining and Technology using a D8 Advance X-ray diffractometer (XRD), FEI Quanta™ 250 Environment Scanning Electron Microscope (SEM) (Hillsboro, OR, USA), and mercury porosimeter. The result is shown in Figure 2.
Based on XRD and energy dispersive spectrometer (EDS) analysis, the samples were composed of quartz, kaolinite, and barite. Kaolinite contains a small amount of Fe2O3. Semiquantitative statistical results showed compositions of 33.90% quartz, 63.60% kaolinite, and 2.50% other. The sample had a low permeability with 5.8687 mdarcy.

3.2. Silica Sol

Silica sol, MP325, was taken from BASF HOCK Mining Chemical (China) Company Limited (Jining, China) [5,6]. Silica sol is workable between 5 and 40 °C and is nontoxic and environmentally preferable, with a pH of approximately 9.8 and a concentration (wt %) of 15%. The gel time of MP325 grout is controlled by the dosage of the accelerator. The accelerator was NaCl solution with a density of 1.07 kg/L and a concentration (wt %) of 10%.
Other grouting materials commonly used in the coal mine include P.O 425R cement and MP364 [6]. P.O 425R is a quick-solidification grouting cement from China United Cement Group Corporation Limited. MP364 is a chemical high-polymer adhesive for fractured rock from BASF HOCK Mining Chemical (China) Company Limited. Part A of MP364 is a colorless or pale-yellow resin and Part B of MP364 is a dark-brown catalyst.

4. Test Analysis of Key Factors Affecting Imbibition Effect
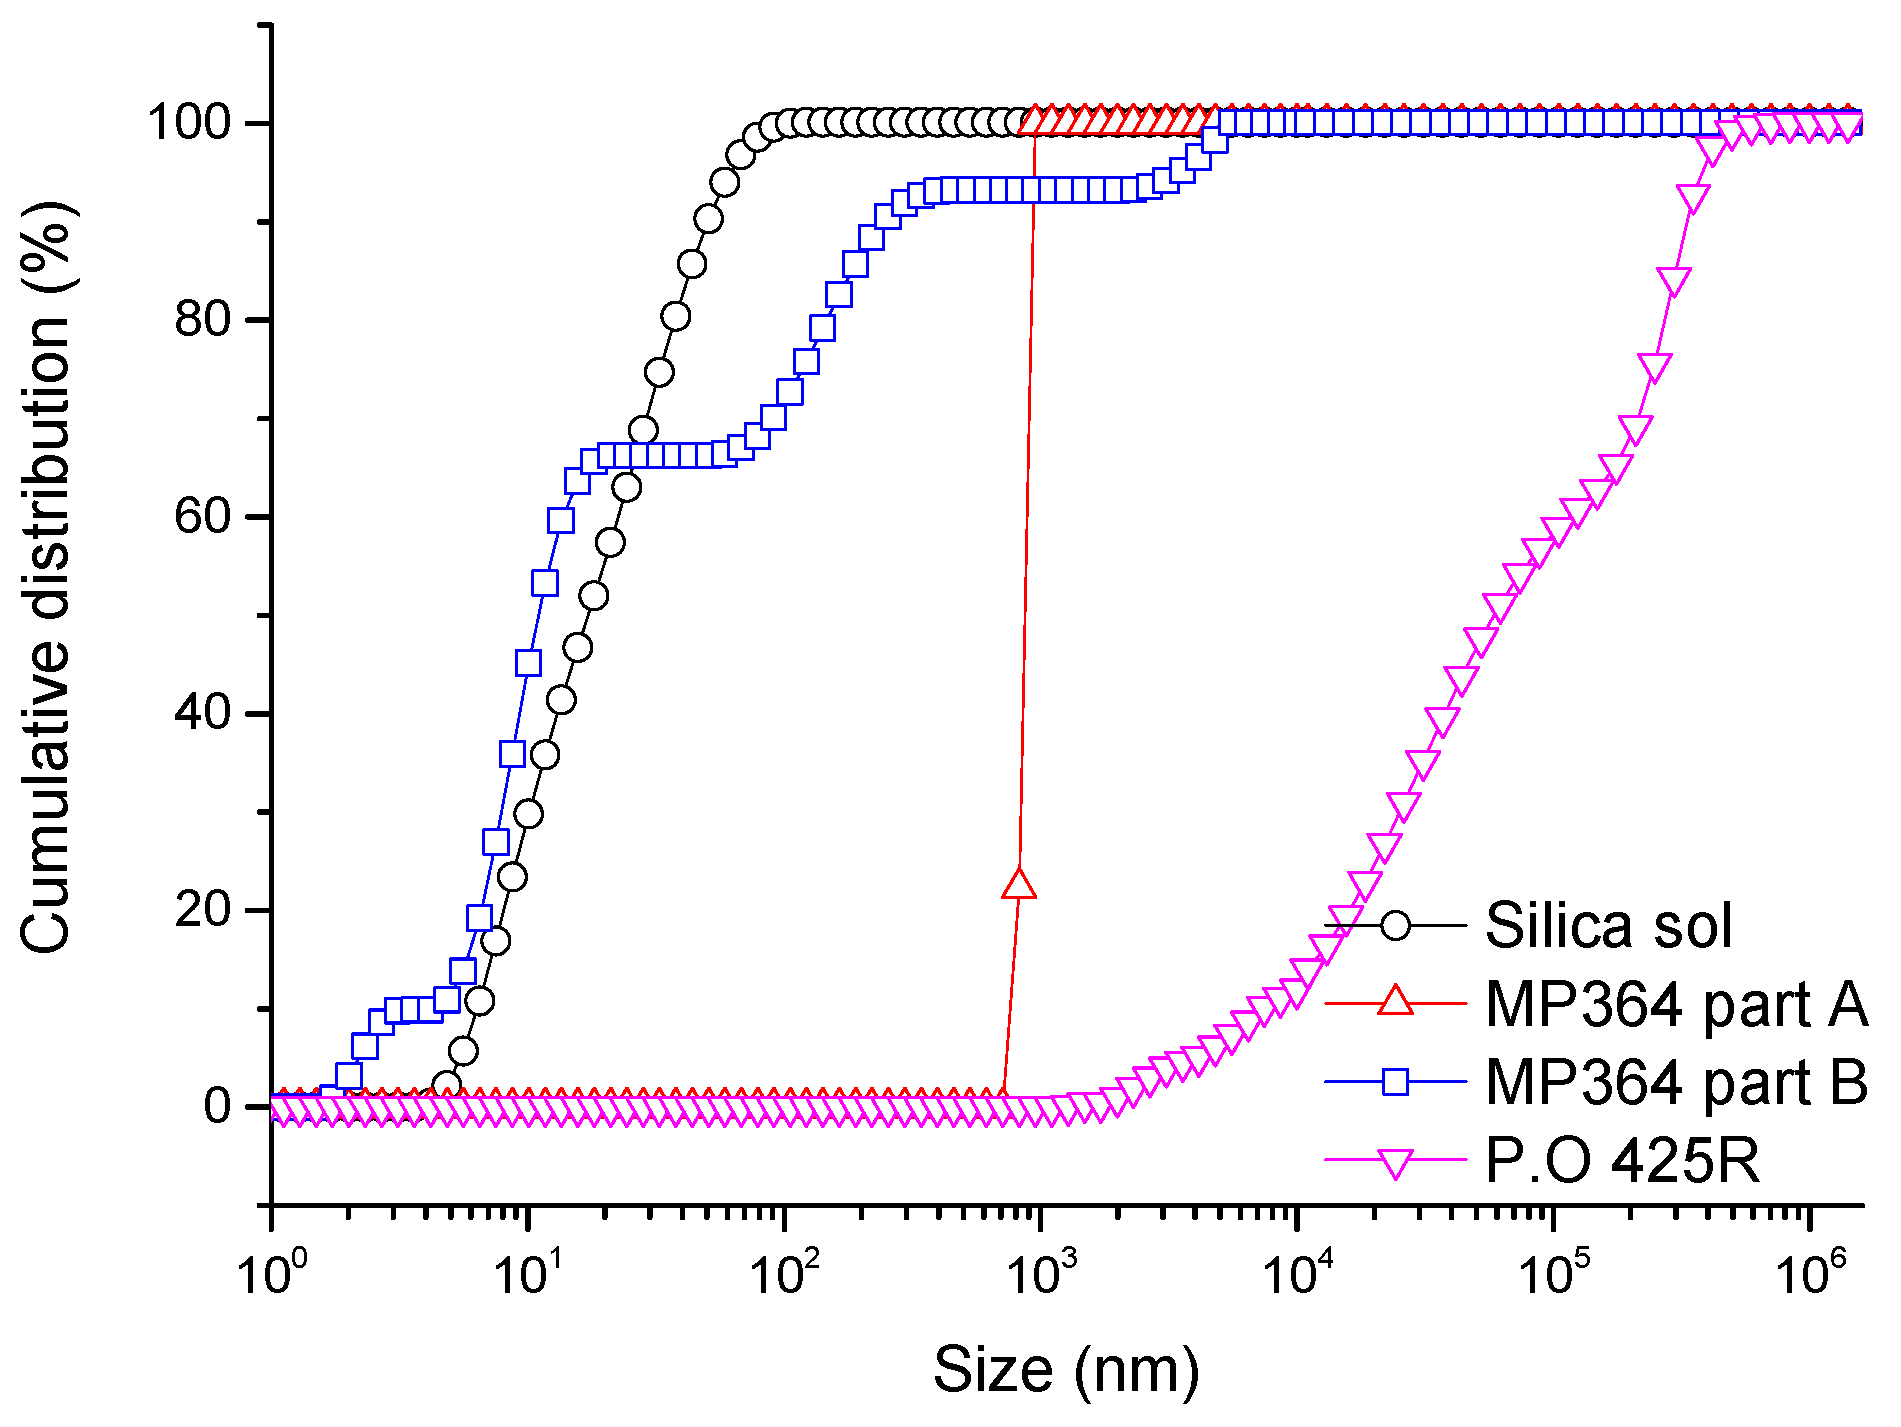
4.1. Groutability

Groutability is a prerequisite for the occurrence of imbibition effect, and the specific research purpose of this study is to investigate the ratio between the particle size of grout and the diameter of microporosity in rock sample chosen as grouting target. The pore size distribution test was conducted using an AutoPore IV 9510 mercury porosimeter. As shown in Figure 3, capillary force increases with mercury intrusion and mercury hysteresis. Mercury hysteresis and retention obviously occur, indicating that the pore structure is extremely complicated. Figure 3b shows that proportion of micropores in the sample with diameters smaller than 20 nm exceeds 50%.
Silica sol particle size was tested using a ZS90 nanoparticle size analyzer. Particle sizes of P.O 425R cement and MP364 were tested by a Microtrac S3500 laser granulometer (Microtrac Inc., North Largo, FL, USA). N,N-dimethylformamide (Shanghai Demand Chemical Co., ltd, Shanghai, China) was used as a dispersant when testing MP364. The test results are presented in Figure 4.
The fracture width or pore diameter should be greater than triple the particle size. Maximum frequency size of silica sol (dmax) is 8–12 nm. The diameter of the grout cumulative distribution curve corresponding to 95% (d95) for silica sol is 62 nm. The proportion of particle size more than triple the dmax on the cumulative distribution curve of sample ( R 3 × d max ) is 49.31%, and the proportion of particle size more than triple the d95 on the cumulative distribution curve of sample ( R 3 × d 95 ) is 41.10%. At the same time, this paper takes R 3 × d max and R 3 × d 95 as indexes of theoretical groutability. As shown in Table 1, the theoretical groutability ratio of silica sol is optimum compared with MP364 and P.O 425R.

4.2. Driving Force

The one-dimensional flow in fracture system is described by the following Equation (6) [13,14]:
v p = k μ g i
where vp is the pressure effect seepage velocity; k is the permeability; i is the hydraulic gradient of grout.
Meanwhile, some researches [13] have shown that flow velocity in a matrix system can be expressed by:
v i = K n σ g cos θ [ K r , g K r , a μ g K r , a + μ w K r , a × J ( S g ) S g × S g x ]
where vi is the imbibition effect seepage velocity; i is the hydraulic gradient of grout; K is the hydraulic conductivity; n is the porosity; σg is the surface tension of grout; θ is the contact angle between mudstone and grout; Kr is the relative hydraulic conductivity.
J(Sg) is the Leverett equation, which can be described as:
J ( S g ) = p c ( S g ) σ g w cos θ K n
where pc(Sg) is the capillary force; J(Sg) is determined by experiment; Sg is the effective saturation of grout.
Through Equations (6)–(8), we can see that v p k , but v i K . For silica sol (unit weight 10.78 kN/m3, dynamic viscosity 10 mPa·s), Kk × 1 × 10⁶/(m·s). The mudstone matrix system is extremely difficult to grout under certain confined pressures on account of its low permeability of 10−6–10−8 cm/s. However, it is easier to imbibition grout with a wondrous equivalent permeability [14,15,16] of 10−5–10−6.5 cm/s. These are of great significance for grouting in low-permeability mudstone. Therefore, it is considered that the driving force in a fracture system is grouting pressure, but the permeability of a matrix system is so low that grouting pressure is negligible [15] and is dominantly controlled by the imbibition effect.
As Equations (7) and (8) show, we can see that the driving force of spontaneous imbibition is the wetting ability and affinity of grout on rock. The smaller the contact angle, the stronger the wetting ability, and affinity between the solid and liquid can be defined as F:
F = σ g cos θ
The contact angle and the surface tension were tested at a room temperature of 15 °C using a DSA100 optical contact-angle measuring device and a K100 surface tension meter, respectively. The contact angle between water and rock sample is 39.15 ± 0.04°, and between silica sol and rock sample is 49.26 ± 0.06° (Figure 5). The surface tension of silica sol is 73.2 mN/m. Thus, the affinity between the sample and the silica sol is 47.77 mN/m. Additionally, as shown in Table 2, the wetting ability of silica sol is slightly larger than that of water, and the affinity of silica sol is slightly smaller than that of water. Hence, the spontaneous imbibition driving force of dry mudstone is strong, but the force is restricted for mudstone saturated with water. Natural mudstone is mostly in the unsaturated state; thus, the imbibition potential in the process of grouting is very significant.
The wetting ability and affinity in the mercury injection experiment behave as a capillary force. Mercury is in the non-wetting phase, but silica sol is in the wetting phase. Thus, there is a contrast in the capillary force changing rule with a saturation level between silica sol and mercy. The capillary force of silica sol decreases with the saturation level, as shown in Figure 3a.

4.3. Diffusion Difficulty

The grout viscosity is the key index to reflect diffusion difficulty. Viscosity test results are shown in Figure 6, obtained using a NDJ-5S rotary viscosity meter. The experimental data was fitted by Origin software (Table 3).
The experimental data can be expressed by the first-order decay exponential function. Dynamic viscosity of silica sol has maintained at a low level below 10 mPa·s before gelling.
The initial viscosity of MP364 is 250–450 mPa·s [6]. Before the water cement ratio reaches 0.8, the initial viscosity of Portland cement decreases sharply as the water cement ratio increases. When the ratio of the water cement exceeds 0.8, the initial viscosity attenuation rate dramatically decreases and it is basically in a stable stage. Considering the strength characteristics, the water cement ratio of cement type grout is 0.7 generally on the field, and the initial viscosity is about 10 mPa·s. Hence, silica sol has a relatively stronger diffusivity.

5. Pressureless Imbibition Experiment

In view of above tests, silica sol has three potential advantages in the field of imbibition grouting in coal-measure mudstone matrix, namely: extremely small particle size, strong wetting ability and affinity, and low initial viscosity. Then, the pressureless imbibition process was conducted with the assistance of NMR equipment to study colloid spontaneous migration and phase characteristics.

5.1. Sample Pretreatment

The test samples are cylindrical with a diameter of 25 ± 1 mm and a height–diameter ratio of 1.0 ± 0.2. To reduce the influence of sample surface roughness and impurities, samples were finely polished and ultrasonically cleaned in advance. The samples were then placed in an electrothermal blowing dry box to dry for 24 h at a temperature of 105 °C.
Fine polish: samples were ground step-by-step using P120, P600, and P2000 silicon carbide sandpaper. The polishing time with each sandpaper was approximately 5 min. The speed of the polishing machine was 900 revolutions per minute.
Ultrasonic cleaning: when the polishing was finished, samples were placed into anhydrous ethanol for ultrasonic cleaning for 15 min to remove the impurities remaining on the surface from the polishing process.

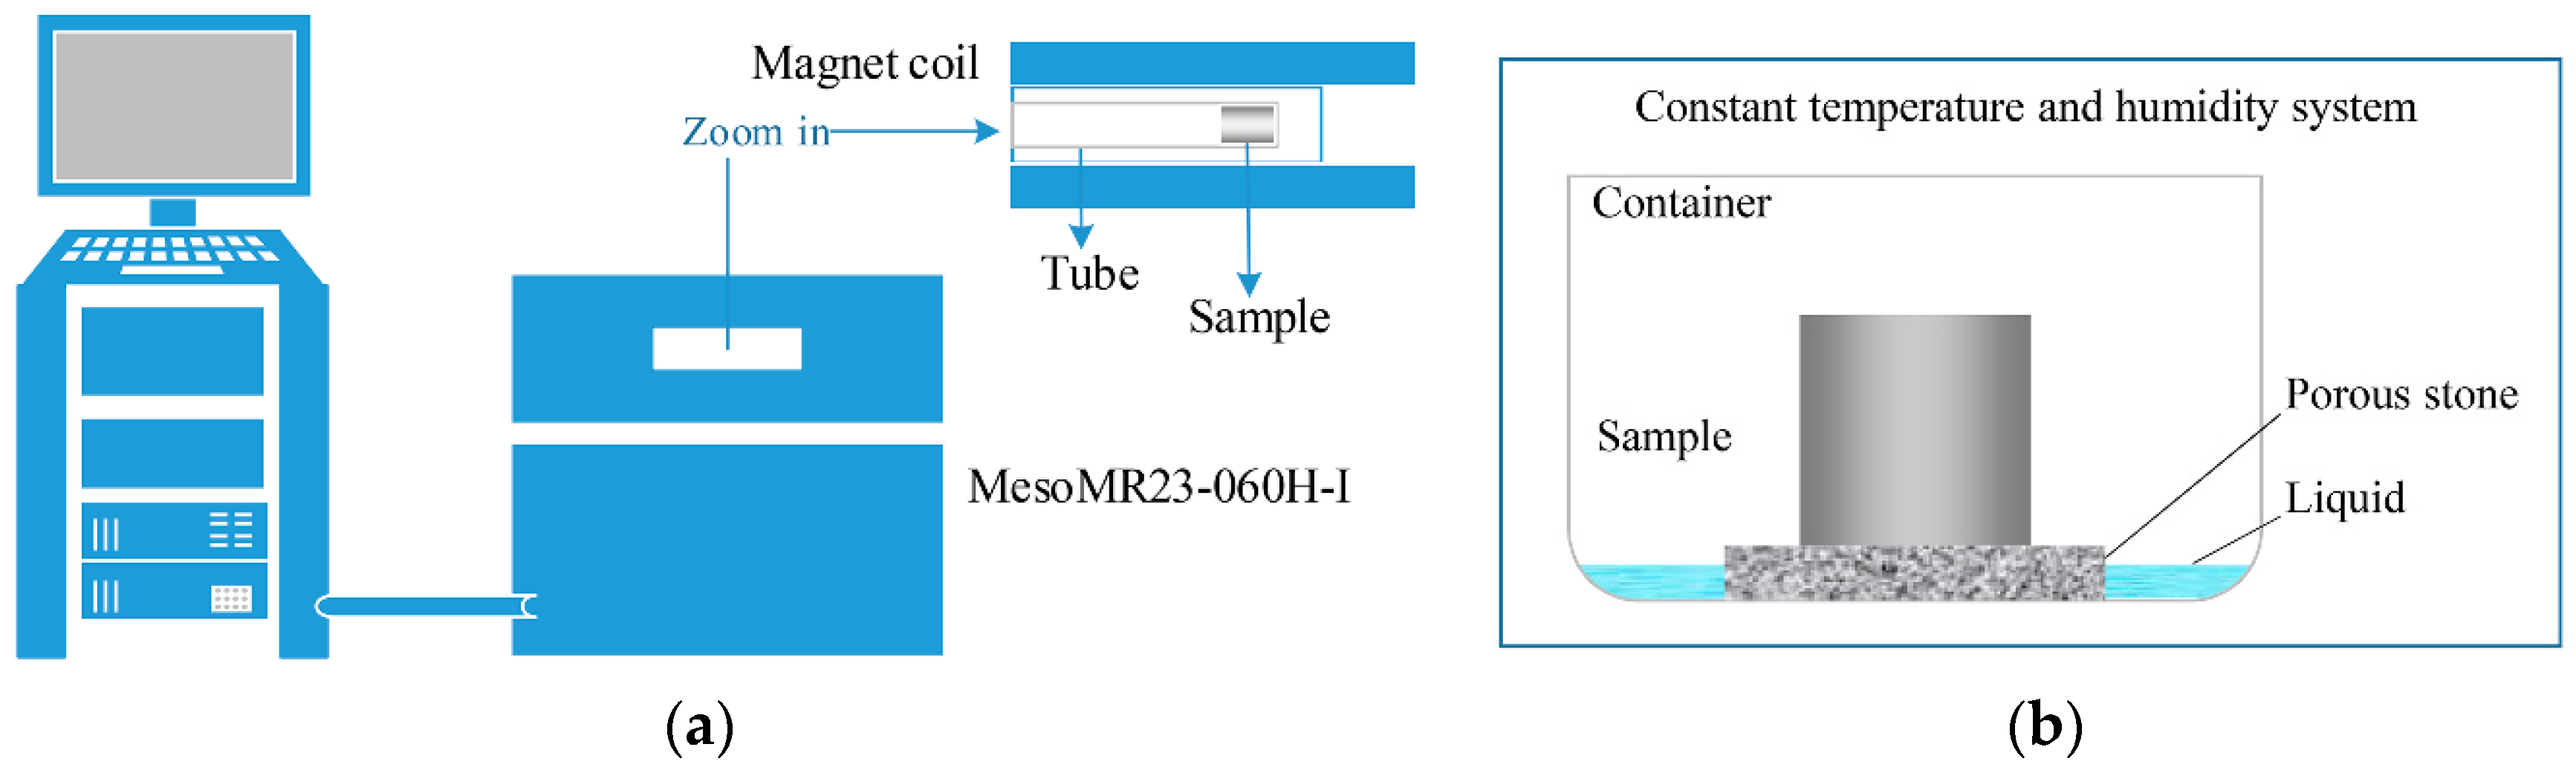
5.2. Experimental Principle and Process

NMR is a physical phenomenon of nuclei in a static magnetic field under the action of another alternating magnetic field. It is a newly emerged testing technique specified by rapid and nondestructive properties, simultaneously. The main parameters include longitudinal relaxation time (T1) and transverse relaxation time (T2). Based on the difference of relaxation time, the characteristics of hydrogen proton can be measured quickly and accurately. The measure of T1 is time-consuming, so T2 is usually used to reflect the physical properties and fluid characteristics of the sample. Based on NMR diffusion with a surface relaxation model [17], nuclear relaxation in a single pore of a sample can be described by relaxation time.
1 T 2 = 1 T 2 B + ρ 2 S V + γ 2 G 2 D τ 2 / 3
where T2B is volume (free) relaxation time of liquid; ρ 2 is the surface relaxation strength, a parameter to characterize fluid properties in rocks depending on the pore surface properties and mineral composition; S V is the specific surface area of a single pore, inversely proportional to the pore radius; D is the diffusion coefficient; G is the internal magnetic field gradients; τ is echo spacing; and γ is the gyromagnetic ratio.
The first item on the right side of the formula can be ignored for T2B >> T2. The third item is the diffusion relaxation term, and the experiment used the uniform magnetic field to eliminate the influence of diffusion relaxation. Therefore, it can be simplified into:
1 T 2 ρ 2 S V
Thus, the T2 distribution reflects the distribution of the inner surface of rock and the strength of the fluid force on the surface [18]. Research shows that when T2 is inferior to 10 ms, the fluid in the pores has difficulty flowing because of the larger flow resistance, appearing as bound fluid and containing an adsorption bound state and a capillary bound state. When T2 exceeds 10 ms, the fluid in the pores is movable.
The apparatus used in the pressureless imbibition experiment is a MesoMR23-060H-I (Figure 7a), produced by Niumag Electronics and Technology Corporation Limited, with a resonance frequency of 23.423 MHz, a magnet temperature of 32.00 ± 0.02 °C, a probe coil diameter of 25 mm, and a lab climate humidity of 68%.
As shown in Figure 7b, the sample was placed on the porous stone. The sample was then removed for the T2 test after short intervals (a few seconds) early during the testing, then at long intervals (hours) later in the testing. The sample was returned to the porous stone after testing to continue to absorb grout. When the sample became saturated, NMR imaging and SEM imaging were carried out. The total duration was 9 days.

5.3. Results and Analysis

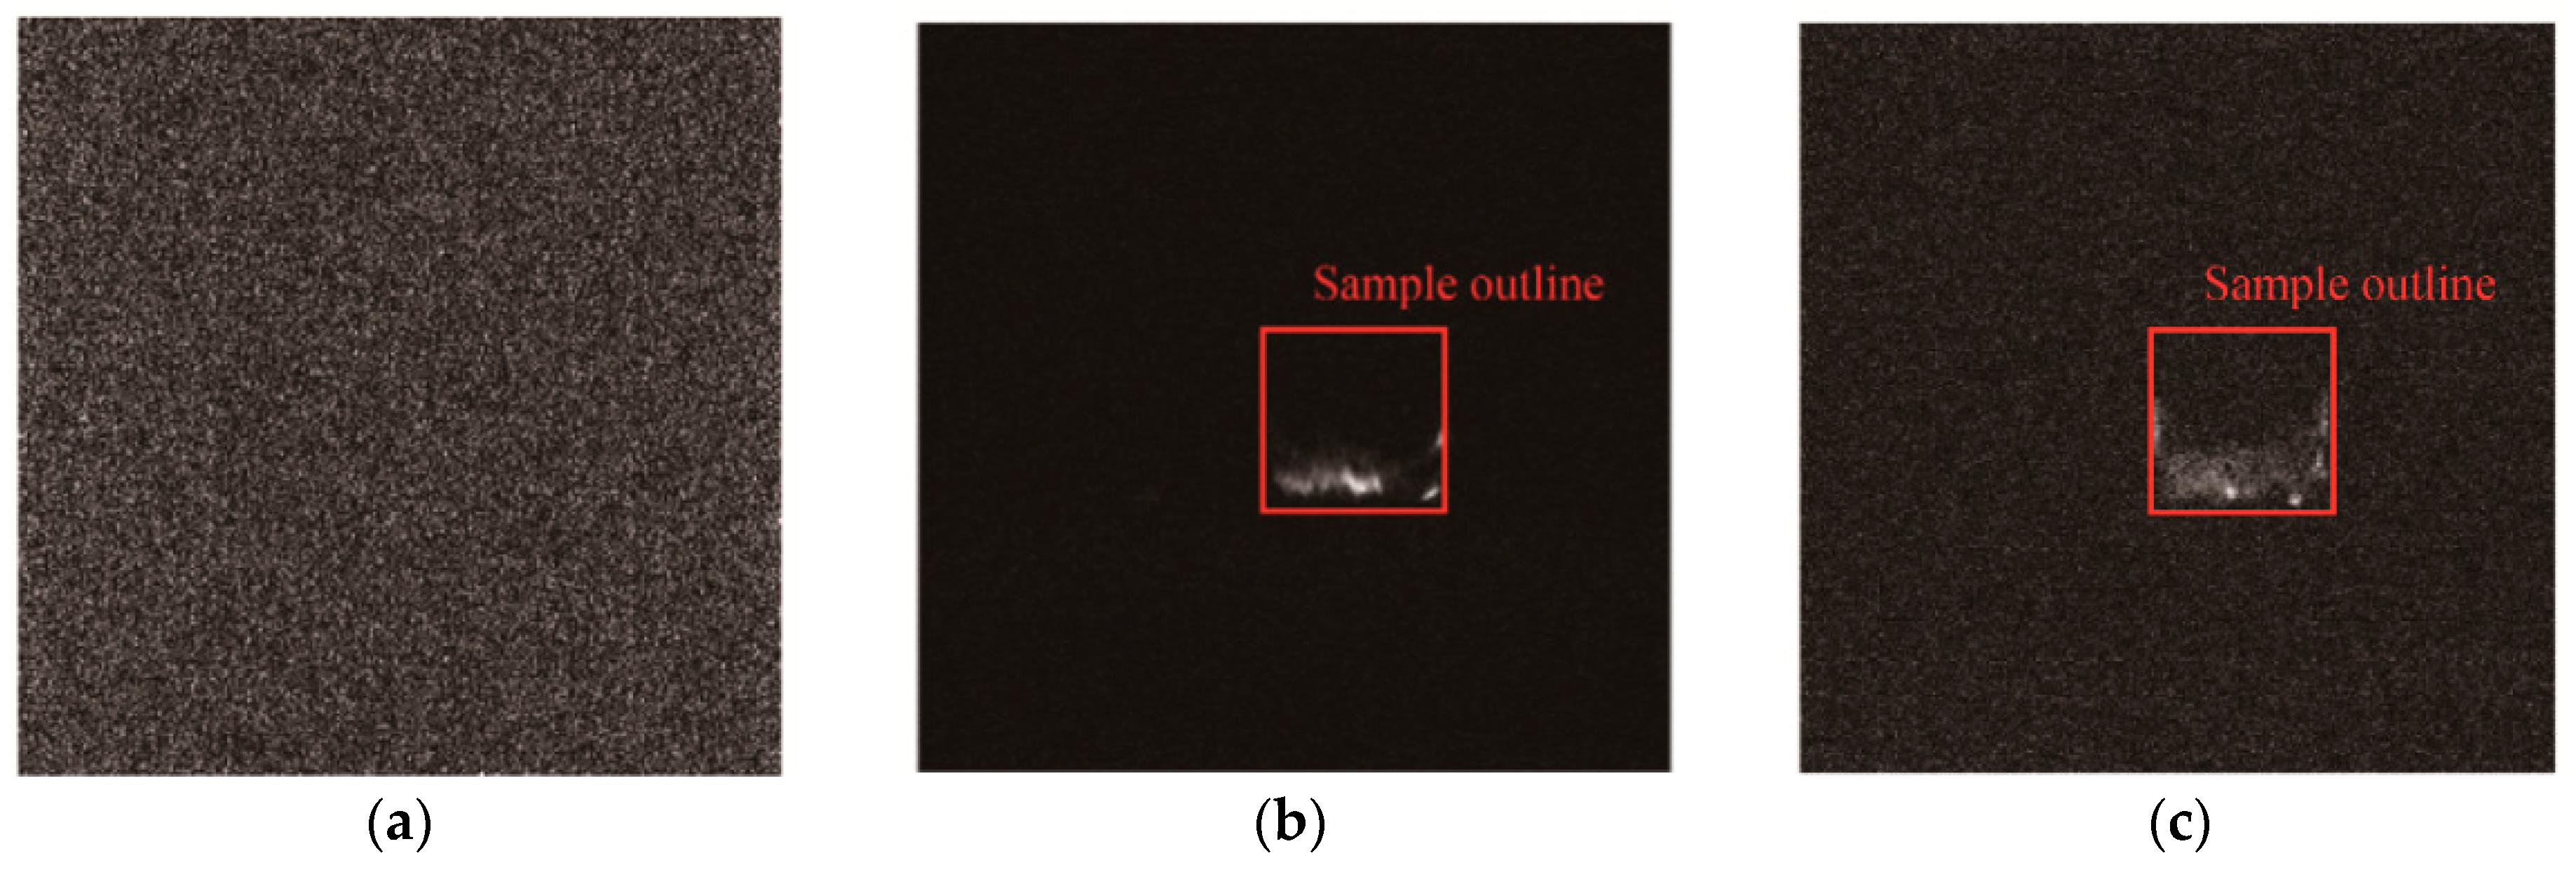
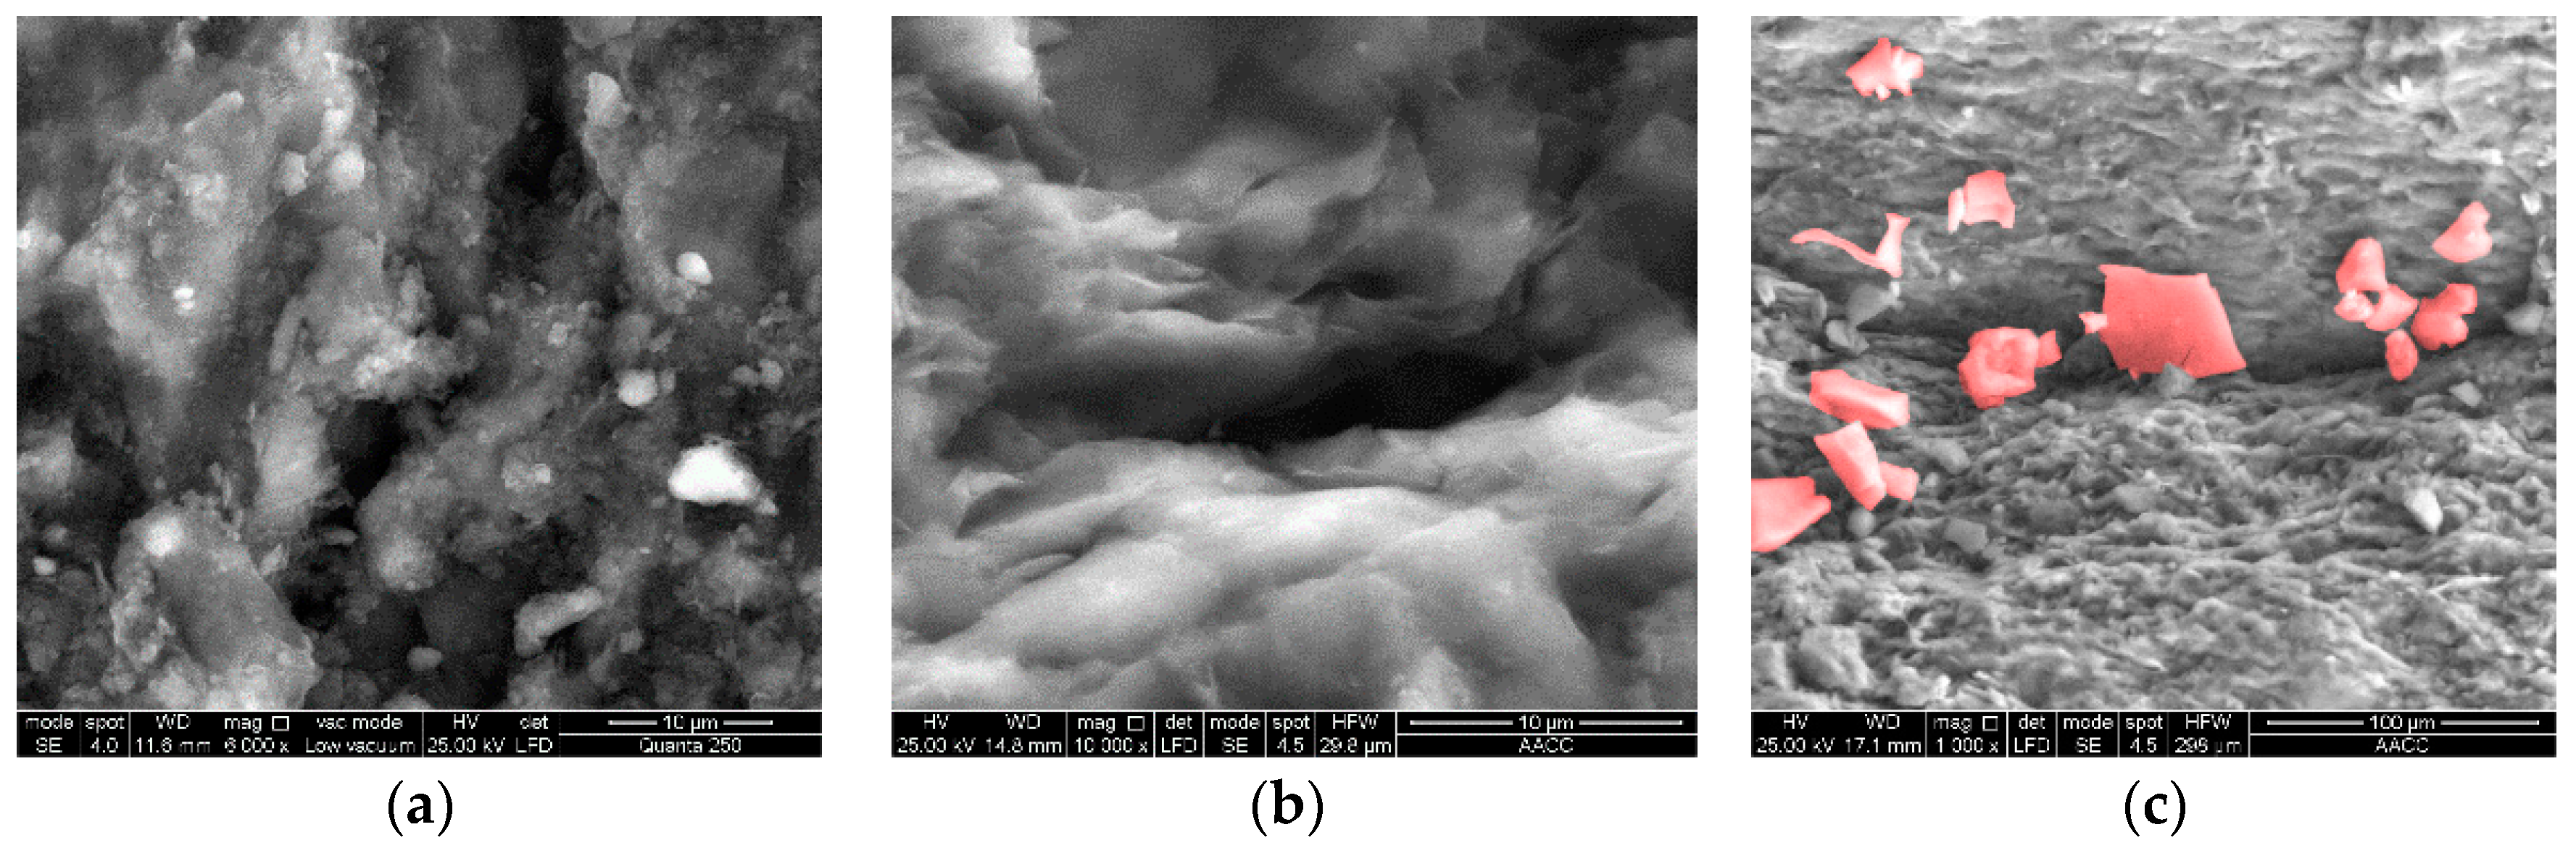
5.3.1. NMR-Imaging and SEM-Imaging Characteristics

The background in Figure 8 is black, and the white areas are hydrogen atom areas that are representative of the region of the pores. The brightness of the image reflects the amount of silica sol in the sample; the brighter the spot, the larger the amount. It can be observed that imaging is concentrated in the bottom of the sample and decreases with increasing imbibition height. This result is comprehensively caused by the capillary force and dead weight effects of moisture. Silica sol extends upward under the effect of the capillary force with a tendency of downward movement under the action of dead weight.
The saturated sample was placed in the electrothermal blowing dry box to dry for 2 h at a temperature of 50 °C. Later, the paper studies the micropore, microfracture, and gel filling forms in the surface of the rock sample. As shown in Figure 9, the original sample has an obvious scaly texture that is widely distributed with small holes with apertures less than 3 μm. There are many mineral particles, but microfractures are rare. The surface of the saturated sample after drying has a cloud-form in good cemented condition, is covered with a layer of SiO2, and is smoother than the original surface of the sample. Particles and microfractures are both rare. A fresh cut of the saturated sample after drying also has few microfractures. However, there are many silica gels filling the microfractures. These prove the success of the pressureless imbibition experiment.

5.3.2. Staged Characteristics of Imbibition

Because the imbibition effect of silica sol in coal-measure mudstone is related to time and the contact surface area, the silica sol absorption rate can be defined as the quantity of silica sol increase in the unit time and unit area. Test results are shown in Figure 10.
The paper introduces the nonlinear curve-fitting method to analyze the experimental data using Origin software. Silica sol absorption rate follows the power function:
A R = 0.0003 t 0.63743 , R 2 = 0.9954
Combined with Figure 10, the whole process can be divided into four stages: intense stage (0–1 min), rapid stage (1 min to 3 h), lag stage (3–212 h), and saturation stage (>212 h). In the intense stage, the accumulated silica sol absorption proportion increases sharply to 0.19% with an absorption rate of 3.31 × 10⁻⁵ to 2.36 × 10⁻⁵ g/mm2/s. In the rapid stage, the proportion increases rapidly to 0.50% with a rate of 2.58 × 10⁻⁷ to 1.33 × 10⁻⁶ g/mm2/s. Then, a long-drawn lag stage begins, and the proportion increases slowly to 2.57% with a rate of 2.46 × 10⁻⁸ to 7.91 × 10⁻⁸ g/mm2/s. The last stage is the saturation stage, when the accumulated silica sol is stabilized at 2.58%. These results are consistent with the capillary force test in the mercury injection. The capillary force of silica sol decreases with saturation level, and then the absorption rate slows down.

5.3.3. Spectrogram Characteristics of T2

As shown in Figure 11, the spectrogram of T2 is distributed in a triple peak pattern throughout the whole process. There is a tendency to move to the right of the vertex time with silica sol absorption. This indicates that grout molecules attach to the pore surface and gradually unite, and the volume of bound fluid gradually becomes larger, filling the entire pore.
The first peak area increases continuously, but the second and third peak areas increase for a short time and then slowly decrease. The characteristics indicate that silica sol wets the sample surface in the early stage, displayed by the dominant increase of movable fluid; movable fluid gradually decreases with silica sol gelled in the later stage, and bound fluid increases under the wetting power and affinity.

5.4. Comparative Experiment

Additionally, this study also carried out an NMR experiment for water imbibition. After being coated with polyolefin heat-shrinkable tubing, the sample in the experiment did not collapse or break before saturation. However, the exchange between moisture absorption in the sample and indoor air humidity decreased. Because the main composition of the sample is kaolinite (low-expansive clay mineral), the polyolefin heat-shrinkable tubing had no effect on the water absorption experiment. The test result is shown in Figure 8c and Figure 12.
The process for water absorption and silica sol is similar with four stages: intense stage, rapid stage, lag stage and saturation stage. This result is consistent with He et al. [19], proving the correctness of this experiment. Compared with water absorption, the silica sol absorption rate is slower. By volume, the water absorption final proportion is 6.10%, and the silica sol absorption final proportion is 2.58%, with 42.30% of the water. This shows that the feasibility of silica sol imbibition is extremely high. However, because the absorption proportion reflects the pore volume and the sealing degree, the effective pore-filling ratio is approximately equal to the ratio of the silica sol absorption proportion to the water absorption proportion (i.e., 42.30%). Qian et al. [20] simulated the sandstone with sand and cement in the lab and made a grout experiment with ZK-III chemical grout. They tested the pore-filling ratio in their experiment and found it to be 9%–41%. This also indirectly shows that the sealing effect of silica sol is excellent.

6. Conclusions

(1)
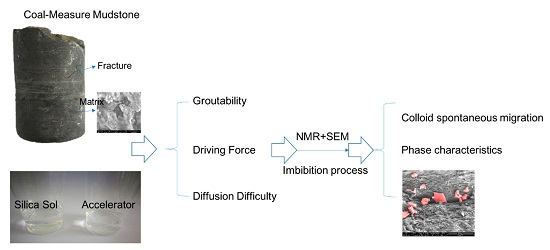
This paper reveals the silica sol grouting mechanism by two-phase displacement theory in dual-porosity media and confirms that grouting in a matrix system is dominantly controlled by the imbibition effect for silica sol.
(2)
Tests of key factors affecting imbibition show that the theoretical groutability ratio of silica sol is optimum compared with MP364 and P.O 425R. The imbibition potential of silica sol is quite significant, which is slightly lower than water. Moreover, silica sol has a low viscosity and a strong diffusivity.
(3)
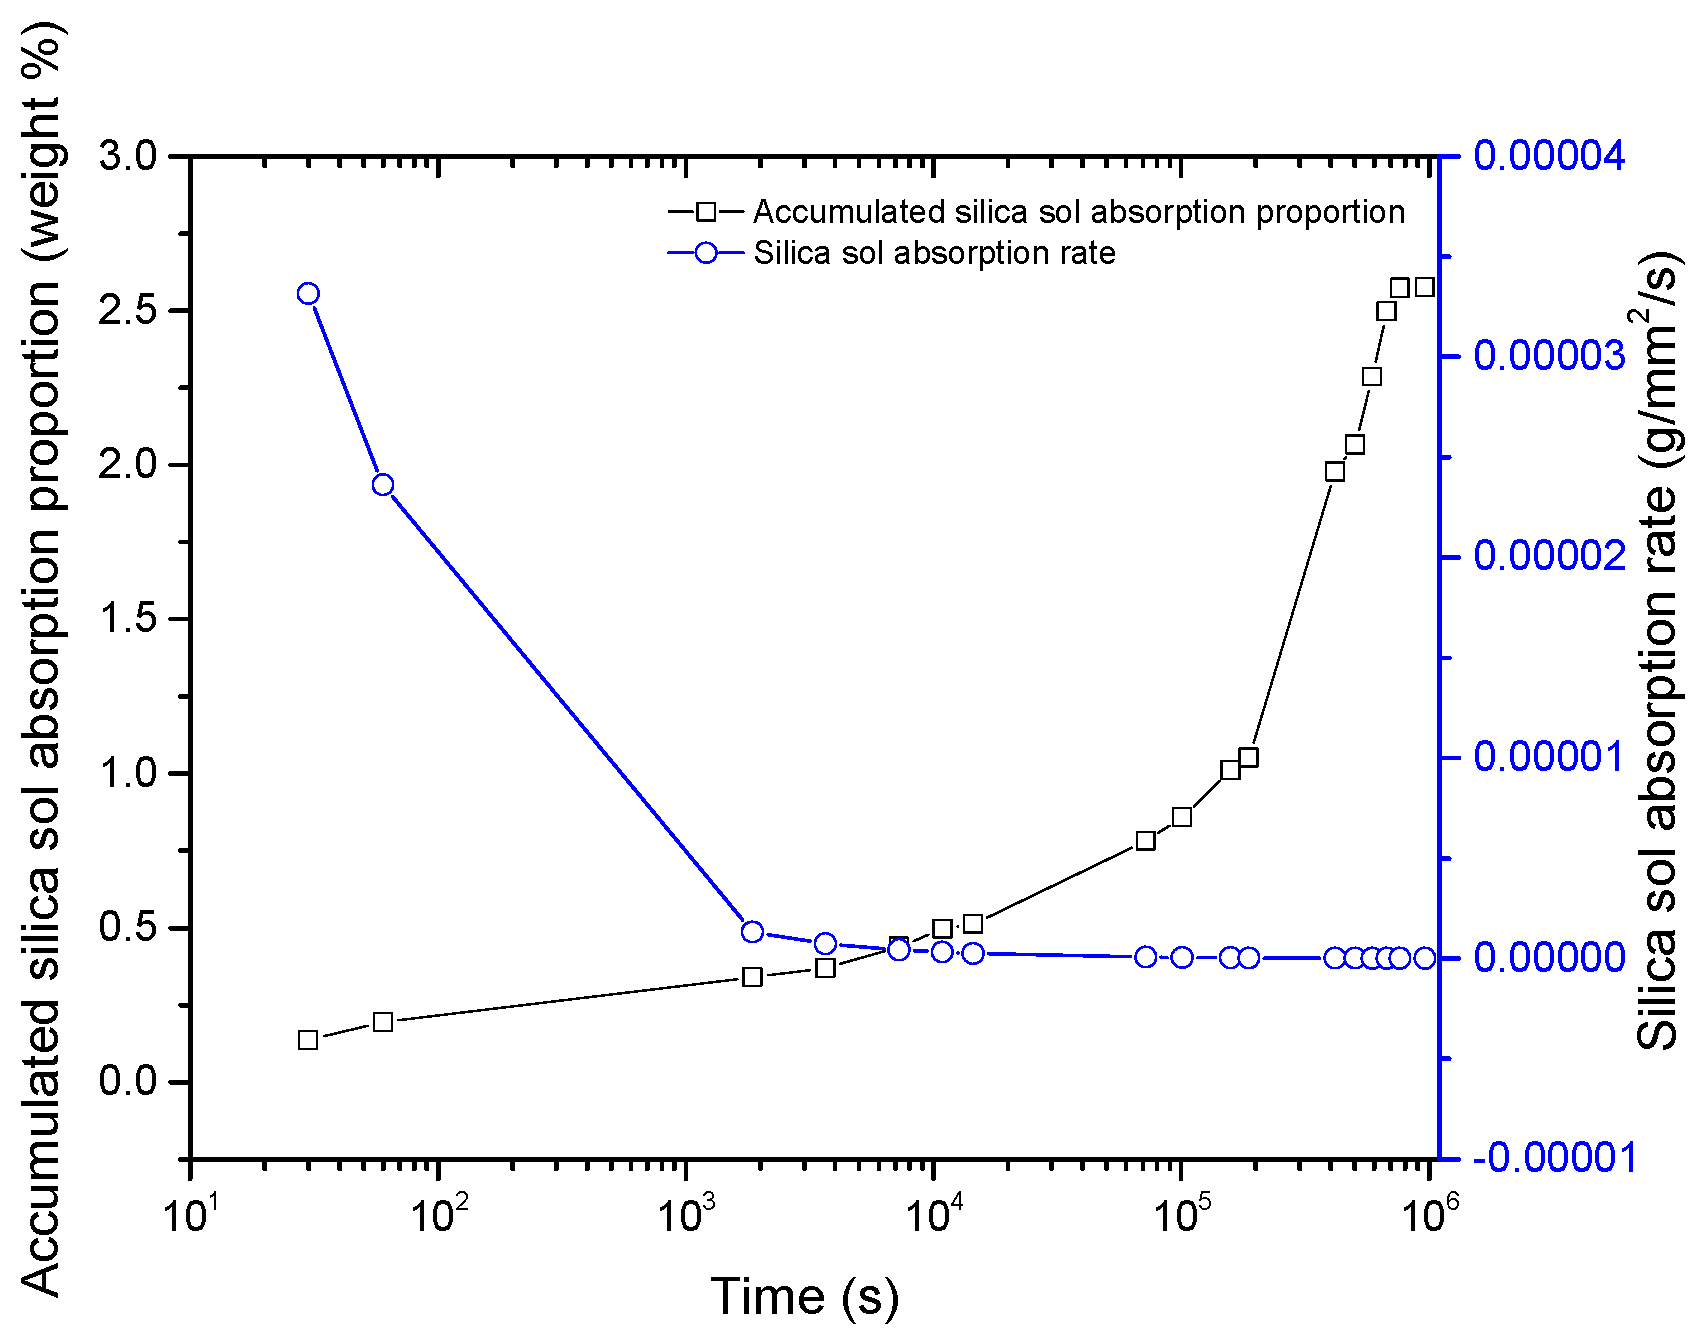
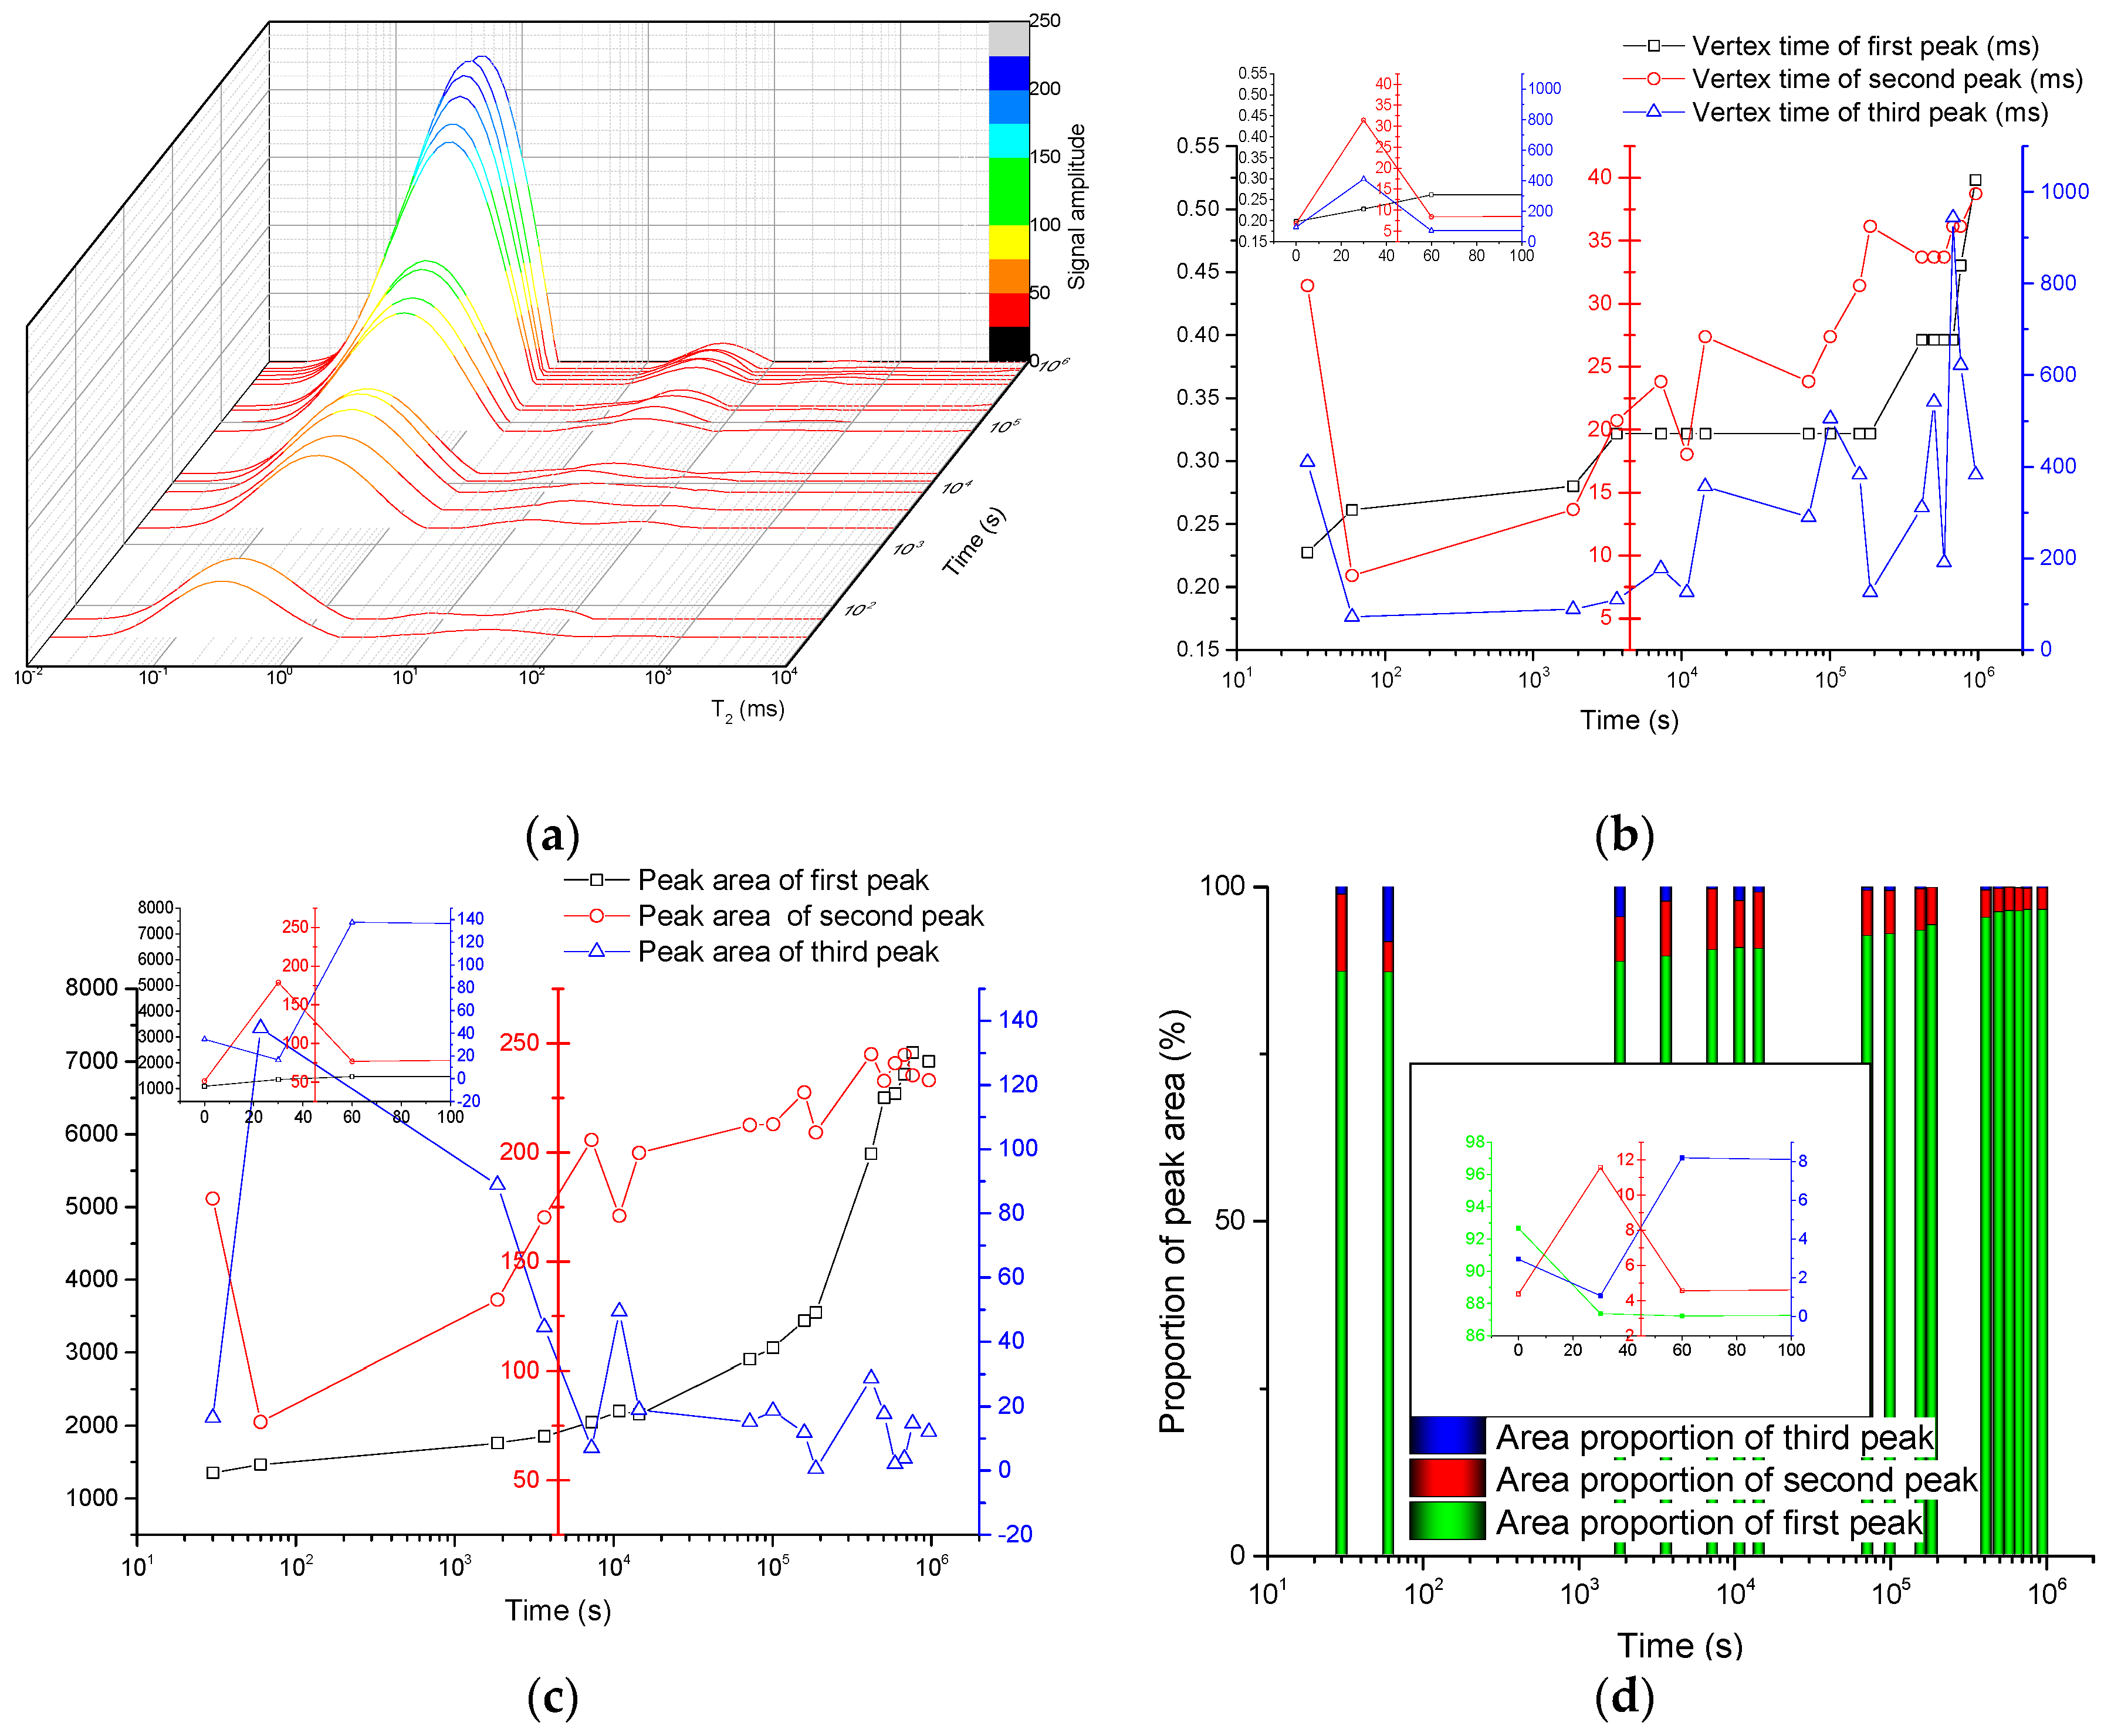
The pressureless imbibition experiment shows that the silica sol absorption rate follows a power function. Colloid spontaneous migration features and phase characteristics were analyzed by the tests of time-varying spectrograms of T2.
(4)
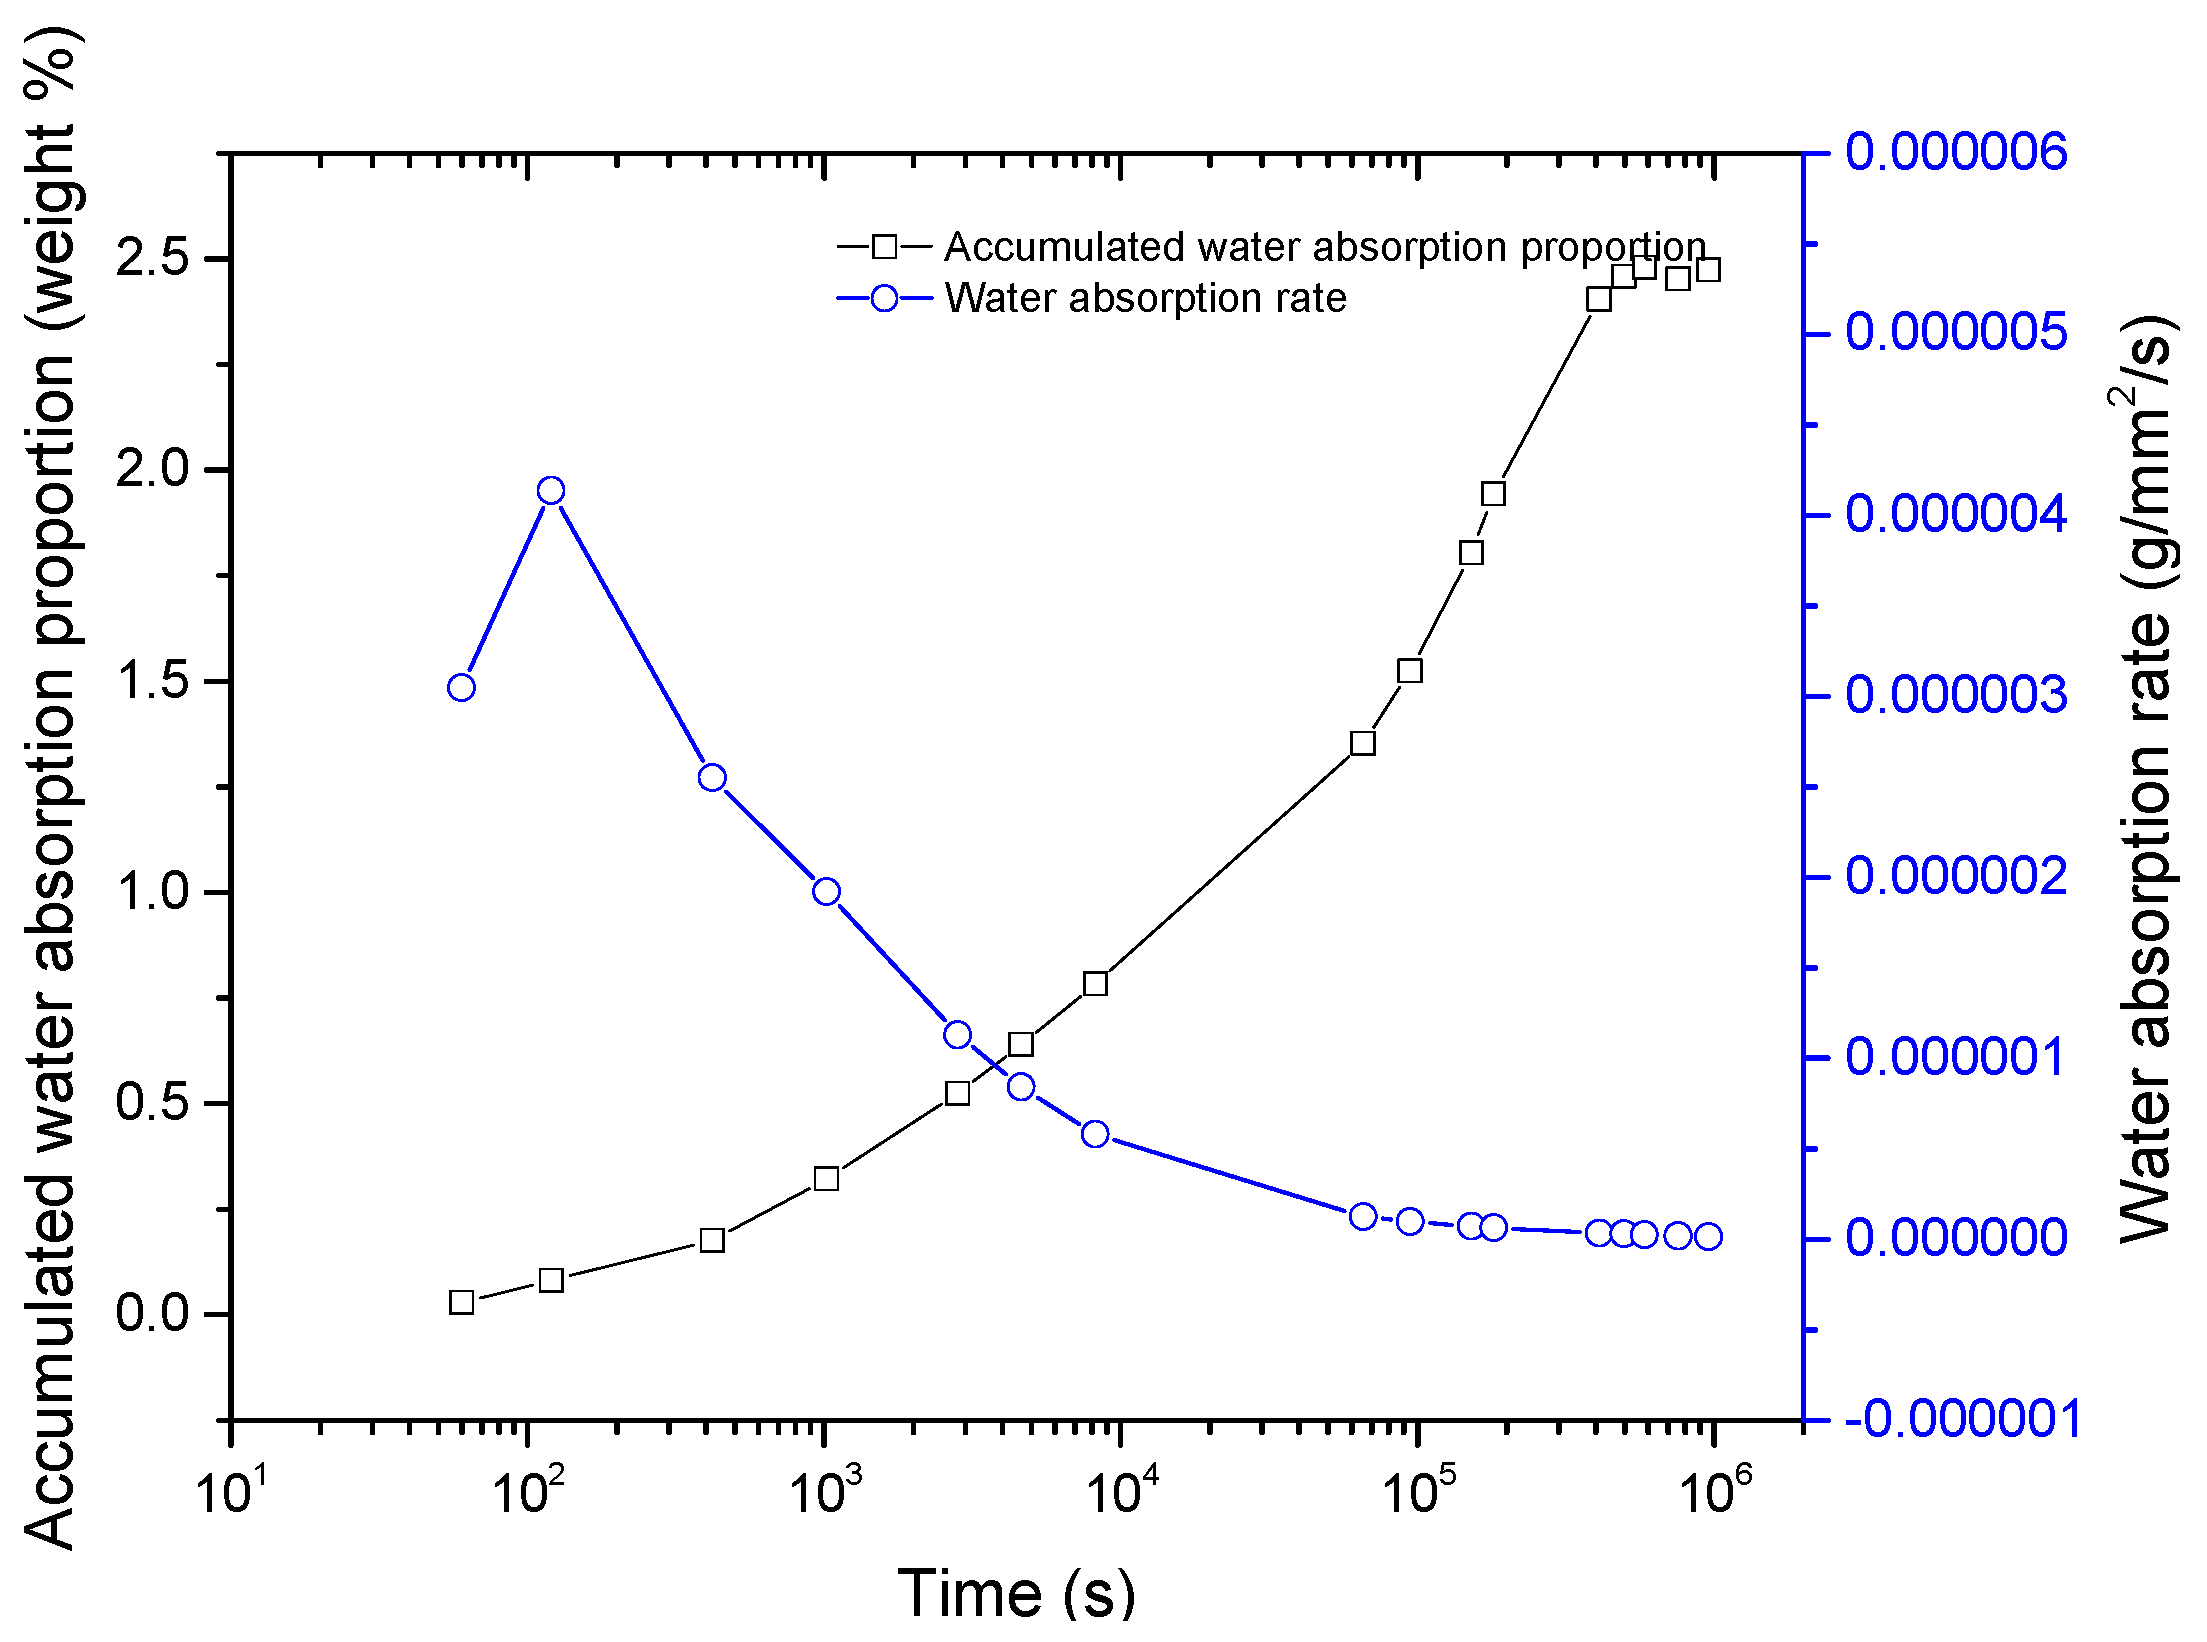
The water absorption experiment, NMR imaging, and SEM imaging show the correctness of the pressureless imbibition experiment.
(5)
The silica sol groutability in coal-measure mudstone is extremely powerful. The paper lays a theoretical and experimental foundation for field grouting in the coal mine.

Acknowledgments

The paper is financially supported by the National Natural Science Foundation of China (No. 51674244), the Natural Science Foundation of Jiangsu Province of China (No. BK20140198) and the Research Innovation Program for College Graduates of Jiangsu Province (No. KYLX16_0562).

Author Contributions

Nong Zhang, Dongjiang Pan and Changliang Han conceived and designed the experiments; Dongjiang Pan and Zhengzheng Xie performed the experiments; Dongjiang Pan and Chenghao Zhang analyzed the data; Sen Yang contributed analysis tools and checked the paper; Dongjiang Pan wrote the paper.

Conflicts of Interest

The authors declare no conflict of interest.

References

  1. Li, G.C.; Jiang, Z.H.; Lv, C.X.; Huang, C.; Chen, G.; Li, M. Instability mechanism and control technology of soft rock roadway affected by mining and high confined water. Int. J. Min. Sci. Technol. 2015, 25, 573–580. [Google Scholar] [CrossRef]
  2. Xu, X.L.; Zhang, N. Study of Control Process Deformation Behavior and of Soft Rock Drift under Rich Water Condition. J. China Univ. Min. Technol. 2007, 36, 298–302. [Google Scholar]
  3. Zhang, C.L. Experimental evidence for self-sealing of fractures in claystone. Phys. Chem. Earth 2011, 36, 1972–1980. [Google Scholar] [CrossRef]
  4. Zhang, N.; Pan, D.J.; Xie, Z.Z. Reinforcement Method with Silica Sol by Slow-Penetration for Argillaceous Soft Rock. Patent CN105201528A, 30 December 2015. [Google Scholar]
  5. BASF Corporation. Underground Construction Solutions. Available online: http://www.master-builders-solutions.basf.us/en-us/products/masterroc (accessed on 29 August 2016).
  6. BASF Corporation. Solvent-Free, Low Viscosity, Hydrophilic Grout for Rock Injection and Consolidation of Sand and Silt Strata. Available online: http://assets.master-builders-solutions.basf.com/Shared%20Documents/EB%20Construction%20Chemcials%20-%20US/Admixture%20Systems/Data%20Sheets/MasterRoc/basf-masterroc-MP-325-tds.pdf (accessed on 29 August 2016).
  7. Wilhelm, E. Physical Chemistry of the Silicate; The University of Chicago Publishing House: Chicago, IL, USA, 1954; p. 426. [Google Scholar]
  8. Jia, G.Y.; Deng, Y.X. Investigation on the gelation process of silica sol. Bull. Chin. Ceram. Soc. 2004, 6, 91–93. [Google Scholar]
  9. Bolisetti, T.; Balachandar, R.; Reitsma, S. Simulation of Colloidal Silica Grout Injection Using Shear Effects. In Proceedings of the Fourth International Conference on Grouting and Deep Mixing, Louisiana, NO, USA, 15–18 February 2012; American Society of Civil Engineers Geotechnical Special Publication: Washington, DC, USA, 2012; pp. 1045–1054. [Google Scholar]
  10. Hamderi, M.; Gallagher, P.M.; Lin, Y. Numerical Model for Colloidal Silica Injected Column Tests. Vadose Zone J. 2014, 13, 1–6. [Google Scholar] [CrossRef]
  11. Gallagher, P.M.; Lin, Y. Colloidal Silica Transport through Liquefiable Porous Media. J. Geotech. Geoenviron. 2009, 135, 1702–1712. [Google Scholar] [CrossRef]
  12. Funehag, J.; Gustafson, G. Design of grouting with silica sol in hard rock—New methods for calculation of penetration length, Part I. Tunn. Undergr. Space Technol. 2008, 23, 1–8. [Google Scholar] [CrossRef]
  13. Mei, J.Y.; Ren, K.C. Study and Practice of Epoxy Grout in Low-Permeability Saturated Weak Intercalations; China Environmental Science Press: Beijing, China, 2013; pp. 89–100. [Google Scholar]
  14. Zhang, L.H.; Xiong, H.J.; Zhang, Q. Analyses of the unsteady permeation process of grout. Chin. J. Rock Mech. Eng. 1997, 16, 564–570. [Google Scholar]
  15. Kuang, J.Z.; Zan, Y.W.; Wang, J.; Du, J.H. Grouting Theory and Engineering Examples of Rock and Soil; Science Press: Beijing, China, 2001; pp. 92–94. [Google Scholar]
  16. Wang, L.F.; Weng, X.Z.; Zhang, R.Y.; Yao, Z.H.; Gu, Q.K.; Li, W.; Li, Y. Permeating-chemical grouting treatment method of sulphate saline soil. J. Traffic Transp. Eng. 2015, 15, 10–16. [Google Scholar]
  17. Valfouskaya, A.; Adler, P.M.; Thovert, J.F.; Fleury, M. Nuclear magnetic resonance diffusion with surface relaxation in porous media. J. Colloid Interface Sci. 2006, 295, 188–201. [Google Scholar] [CrossRef] [PubMed]
  18. Yang, Z.M.; Guo, H.K.; Liu, X.W.; Zhang, Y.P.; Xiong, S.C. Characteristic Experimental Technique of Extra-Low and Super-Low Permeability Reservoirs; Petroleum Industry Press: Beijing, China, 2012; pp. 19–23. [Google Scholar]
  19. He, M.C.; Zhou, L.; Li, D.J.; Wang, C.G.; Nie, W. Experimental research on hydrophilic characteristics of mudstone in deep well. Chin. J. Rock Mech. Eng. 2008, 27, 1113–1120. [Google Scholar]
  20. Qian, Z.W.; Jiang, Z.Q.; Cao, L.W.; Sun, Q. Experiment study of penetration grouting model for weakly cemented porous media. Rock Soil Mech. 2013, 34, 139–142. [Google Scholar]
Figure 1. Argillaceous roadway site with different support. (a) U-shaped steel support in Zhuxianzhuang Mine; (b) truss in Liuhai Mine; (c) cable and grout in Liuhai Mine. U-shaped steel support and truss cannot effectively restrain the deformation of surrounding rock mass.
Applsci 07 00300 g001
Figure 2. Composition characteristics analysis of sample. (a) X-ray diffraction pattern; (b) energy spectrum analysis.
Applsci 07 00300 g002
Figure 3. Micropore size analysis. (a) Graph of pore volume vs. pressure showing Hg hysteresis and retention; (b) pore diameter distribution.
Applsci 07 00300 g003
Figure 4. Particle size cumulative distribution of different grouts.
Applsci 07 00300 g004
Figure 5. Contact angle between liquid and sample. (a) Contact angle between water and sample; (b) contact angle between silica sol and sample; water has a slightly better spreadability on the sample.
Applsci 07 00300 g005
Figure 6. Time-varying curves of viscosity with different ratios between silica sol and accelerator (volume).
Applsci 07 00300 g006
Figure 7. Spontaneous imbibition device. (a) Schematic plot of MesoMR23-060H-I; (b) schematic diagram of experiment.
Applsci 07 00300 g007
Figure 8. NMR-imaging contrast of sample drying state and saturation state. (a) Original dry; (b) saturated with silica sol; (c) saturated with water.
Applsci 07 00300 g008
Figure 9. Micropore, microfracture, and gel filling form of sample. (a) Original rock sample; (b) surface of saturated rock sample after drying; (c) fresh cut of saturated rock sample after drying, rendering pseudo-color with Adobe Photoshop CS6. The red pseudo-color regions are silica gels.
Applsci 07 00300 g009
Figure 10. Silica sol content of the sample in the whole experiment.
Applsci 07 00300 g010
Figure 11. Spectrogram of T2 and distribution of each peak. (a) Spectrogram of T2; (b) vertex time of each peak; (c) peak area of each peak; (d) area proportion of each peak.
Applsci 07 00300 g011
Figure 12. Sample water content during the whole experiment.
Applsci 07 00300 g012
Table 1. Theoretical groutability of different grouts.
GroutSilica SolMP364P.O 425R
IndexPart APart B
3 × dmax24–36 nm2865 nm24–36 nm747–1056 μm
3 × d95186 nm3205 nm10,740 nm1150 μm
R 3 × d max 49.31%34.24%49.31%0
R 3 × d 95 41.10%32.87%21.92%0
Table 2. Driving force of different liquids.
IndexContact Angle (°)Surface Tension (mN/m)Affinity (mN/m)
Liquid
Silica sol49.26 ± 0.0673.247.77
Water39.15 ± 0.0473.557.00
Table 3. Fitting formula of time-varying curves of viscosity with different ratios.
Ratios between Silica Sol and AcceleratorFitting FormulaRelated Coefficient R2
4:1 μ = 55.267 e t 3.01544 824.41615 0.9335
6:1 μ = 0.00254 e t 4.8555 66.05023 0.9668
9:1 μ = 5.83191 × 10 6 e t 20.97351 77.03688 0.9962

