Fatigue Life Estimation of Medium-Carbon Steel with Different Surface Roughness


School of Mechanical Engineering and Automation, Northeastern University, Shenyang 110004, China
*
Author to whom correspondence should be addressed.
Appl. Sci. 2017, 7(4), 338; https://doi.org/10.3390/app7040338
Submission received: 2 March 2017
/
Revised: 24 March 2017
/
Accepted: 24 March 2017
/
Published: 29 March 2017
Abstract
:Medium-carbon steel is commonly used for the rail, wire ropes, tire cord, cold heading, forging steels, cold finished steel bars, machinable steel and so on. Its fatigue behavior analysis and fatigue life estimation play an important role in the machinery industry. In this paper, the estimation of fatigue life of medium-carbon steel with different surface roughness using established S-N and P-S-N curves is presented. To estimate the fatigue life, the effect of the average surface roughness on the fatigue life of medium-carbon steel has been investigated using 75 fatigue tests in three groups with average surface roughness (Ra): 0.4 μm, 0.8 μm, and 1.6 μm, respectively. S-N curves and P-S-N curves have been established based on the fatigue tests. The fatigue life of medium-carbon steel is then estimated based on Tanaka-Mura crack initiation life model, the crack propagation life model using Paris law, and material constants of the S-N curves. Six more fatigue tests have been conducted to validate the presented fatigue life estimation formulation. The experimental results have shown that the presented model could estimate well the mean fatigue life of medium-carbon steel with different surface roughness.
1. Introduction
Medium-carbon steel is usually referred to as the carbon steel that contains approximately 0.30–0.60% carbon content. It balances ductility and strength, and has good wear resistance [1]. It is commonly used for rails, wire ropes, tire cord, cold heading, forging steels, cold finished steel bars, machinable steel, and so on [2]. Its fatigue behavior analysis and fatigue life estimation play an important role in the safety and reliability in the machinery industry. From a raw steel piece to a part meeting the design requirements, a manufacturing process must be used. The surface roughness of a part as a result of the manufacturing process plays a major role in determining the fatigue behavior of the part [3]. To ensure the high safety and reliability of the part of medium-carbon steel in service, it is important to investigate S-N curve, P-S-N curve, and fatigue life of medium-carbon steel with different surface roughness.
A method has been reported where the effect of the surface roughness on fatigue behavior was commonly considered by using surface condition modification factor, which was:
where Sut was the minimum tensile strength, b1 and b2 are statistical values and determined by the material and the machining method such as ground, machined or cold-drawn, hot-rolled, and as-forged [4]. Then, the endurance limit Se at the critical location of a machine part in the geometry and condition of use is proportional to the product of and :
where is the rotary-beam test specimen endurance limit. However, it is very difficult for this method to estimate the fatigue life of the given material with the different surface roughness. Other methods have also been proposed. For example, the surface groove due to the manufacturing process was considered to result in stress concentration similar to a notch. The fatigue stress concentration factor Kf was used for describing the effect of the surface roughness on the fatigue limit. It was the function of the stress concentration factor Kt which can be estimated by the finite element method [5,6] or the empirical formula including the average geometric parameters of surface roughness [7,8]. A method has been also reported to estimate the fatigue life by:
where Nf, Ni, and Np were fatigue life (the number of cycles to failure), crack initiation life, and crack propagation life, respectively. The fatigue life can be computed as:
where and are determined by plotting Ni as a function of the stress amplitude S. The crack propagation life could be estimated by iterative numerical integration of Paris’ law where the surface fatigue crack propagation threshold is multiplied by Kt and the fatigue crack propagation threshold in depth is not affected [5]. For the large surface roughness, the stress concentration due to the surface groove might be obvious and the methods of estimating the fatigue life based on the stress concentration factor might have high accuracy. However, the stress concentration factor might be very close to 1 for small surface roughness. Moreover, accurately computing the stress concentration factor is a time-consuming and complex process. Therefore, the method has been reported where the surface groove due to machining was considered to be an initial micro-defect. The analytic formulation of the crack initiation life Ni can be estimated based on the dislocation dipole accumulation model [9,10,11] and the crack propagation life Np can calculated using the analytic solution of Paris’ law integral [12,13,14]. Since the reported method has been validated by six types of ultra-high strength steel [11] and high-strength martensitic stainless steel [12], it will be employed to estimate the fatigue life of medium-carbon steel with the different surface roughness in this paper.
The remainder of this paper is organized as follows: In Section 2, the material, the specimen geometry, and the testing apparatus will be described, the scatterplot of the fatigue experiment results shown, and the mean fatigue life of the specimens with different average surface roughness contrasted. In Section 3, S-N and P-S-N curves will be established and their curve-fitting parameters listed. In Section 4, the formulation for estimating the mean fatigue life of medium-carbon steel with different average surface roughness will be explained along with its validation. The conclusions are, finally, drawn in Section 5.
2. Material and Experimental Results
2.1. Material and Testing Apparatus
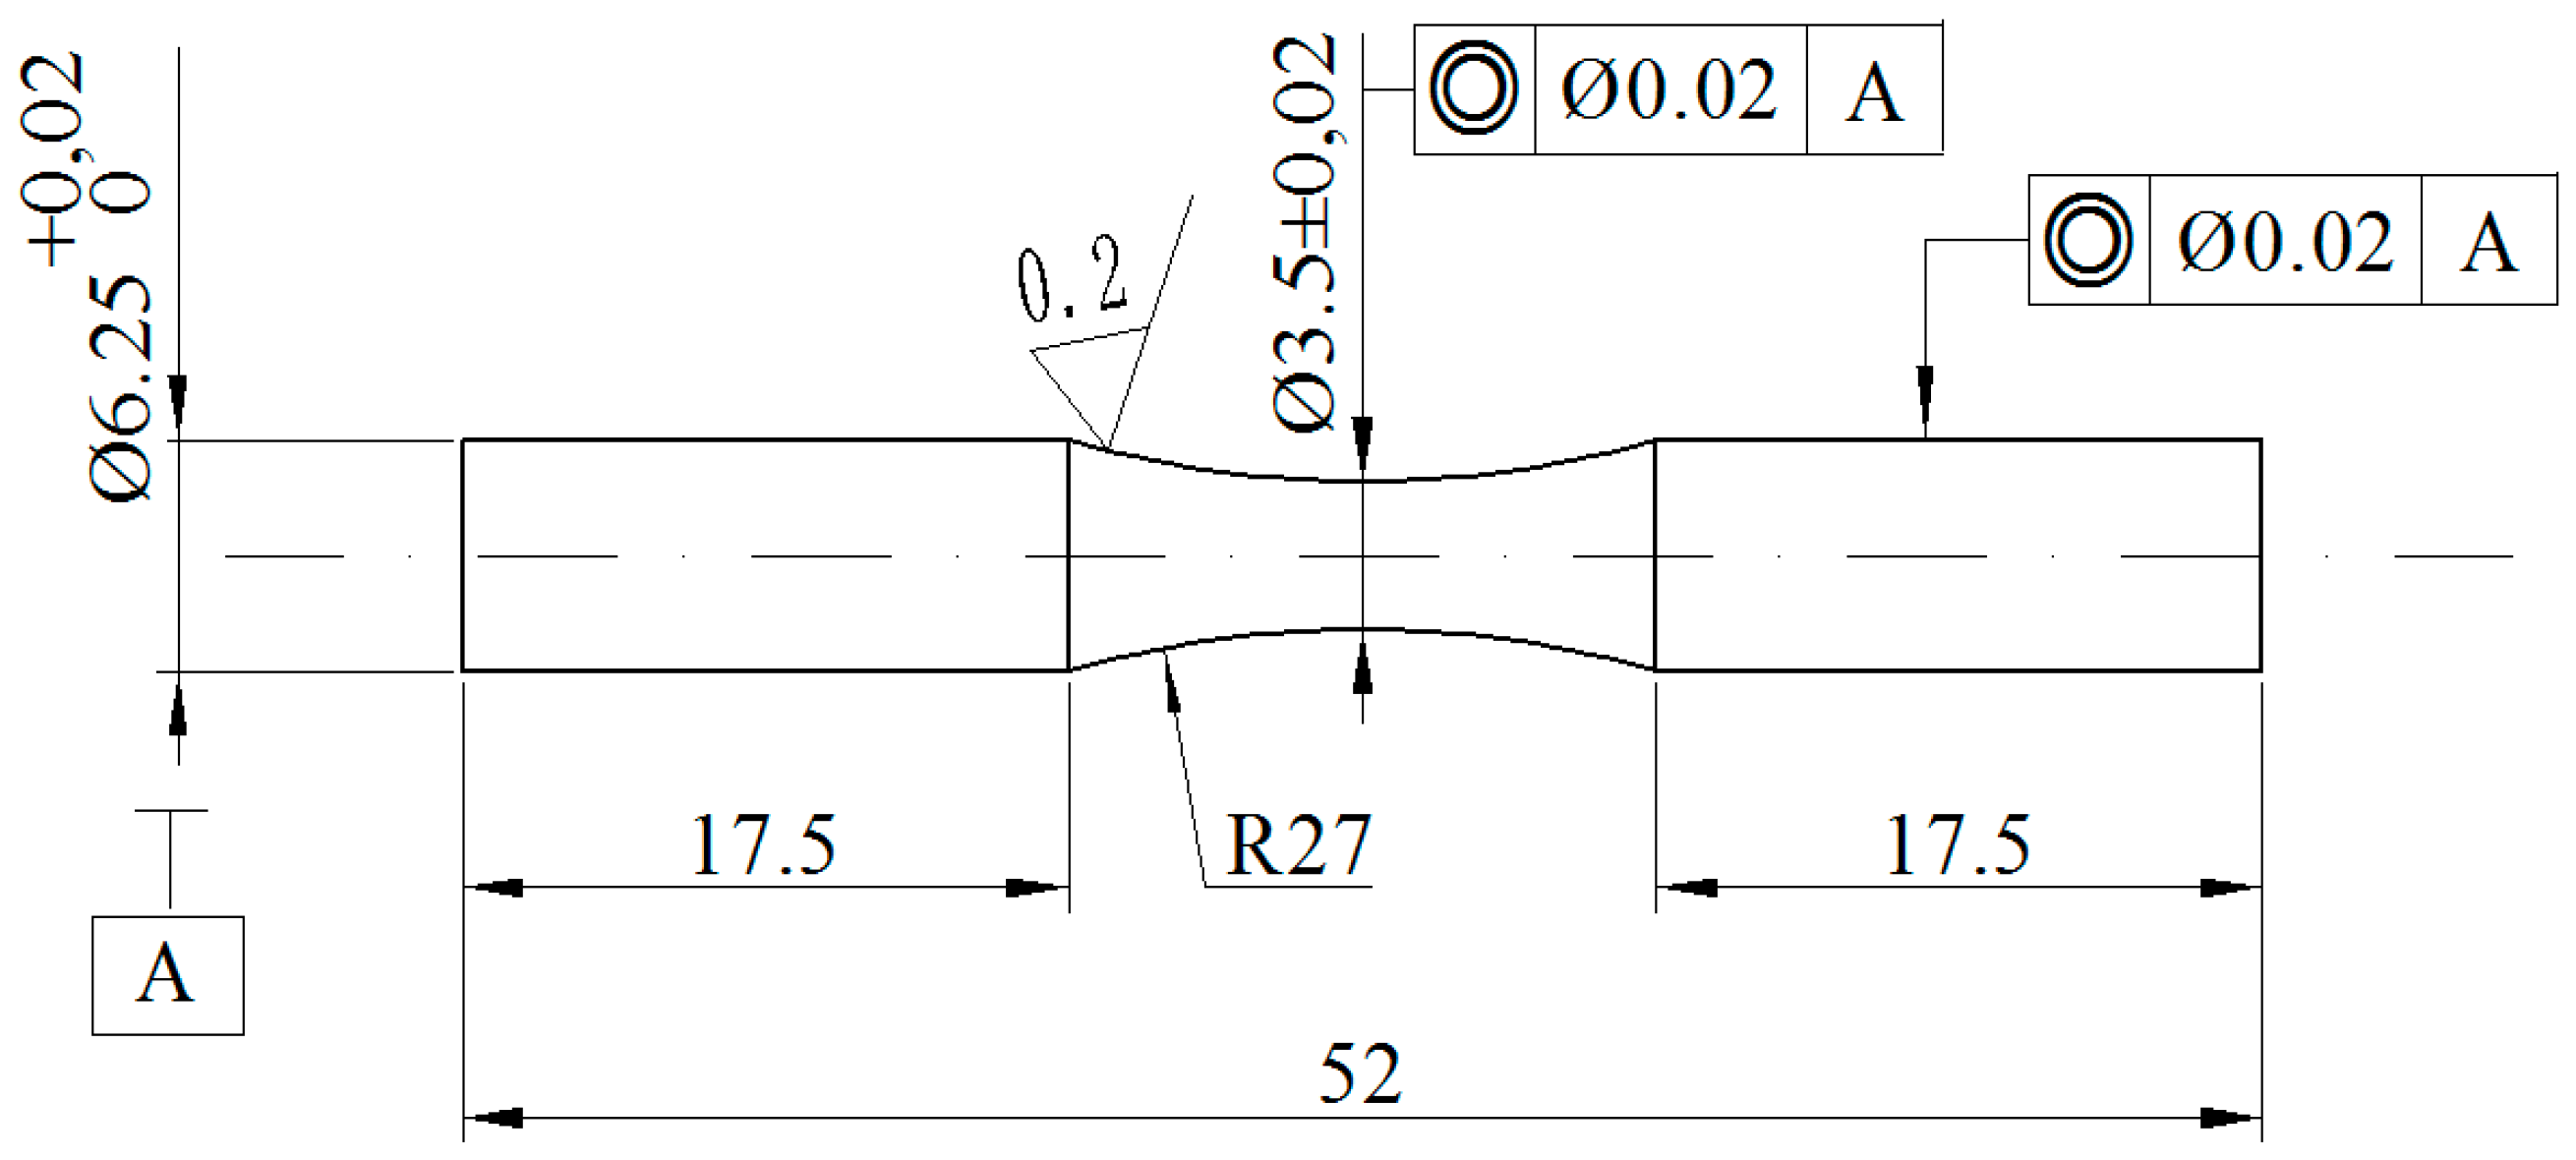
The material investigated in this work is the medium-carbon steel and its composition and mechanical properties are presented in Table 1 and Table 2, respectively. The raw material is a hot rolled steel bar and is machined into the funnel specimen. The geometry of the specimen is shown in Figure 1. The specimens were polished to the specified average surface roughness. To investigate the effect of the different surface roughness of the specimens on the fatigue life, specimens were machined into three groups with average surface roughness (Ra): 0.4 μm, 0.8 μm, and 1.6 μm, respectively. The rotating bending fatigue tests were performed. The testing apparatus is shown in Figure 2. The cycle frequency was 25 Hz.
2.2. Experimental Results
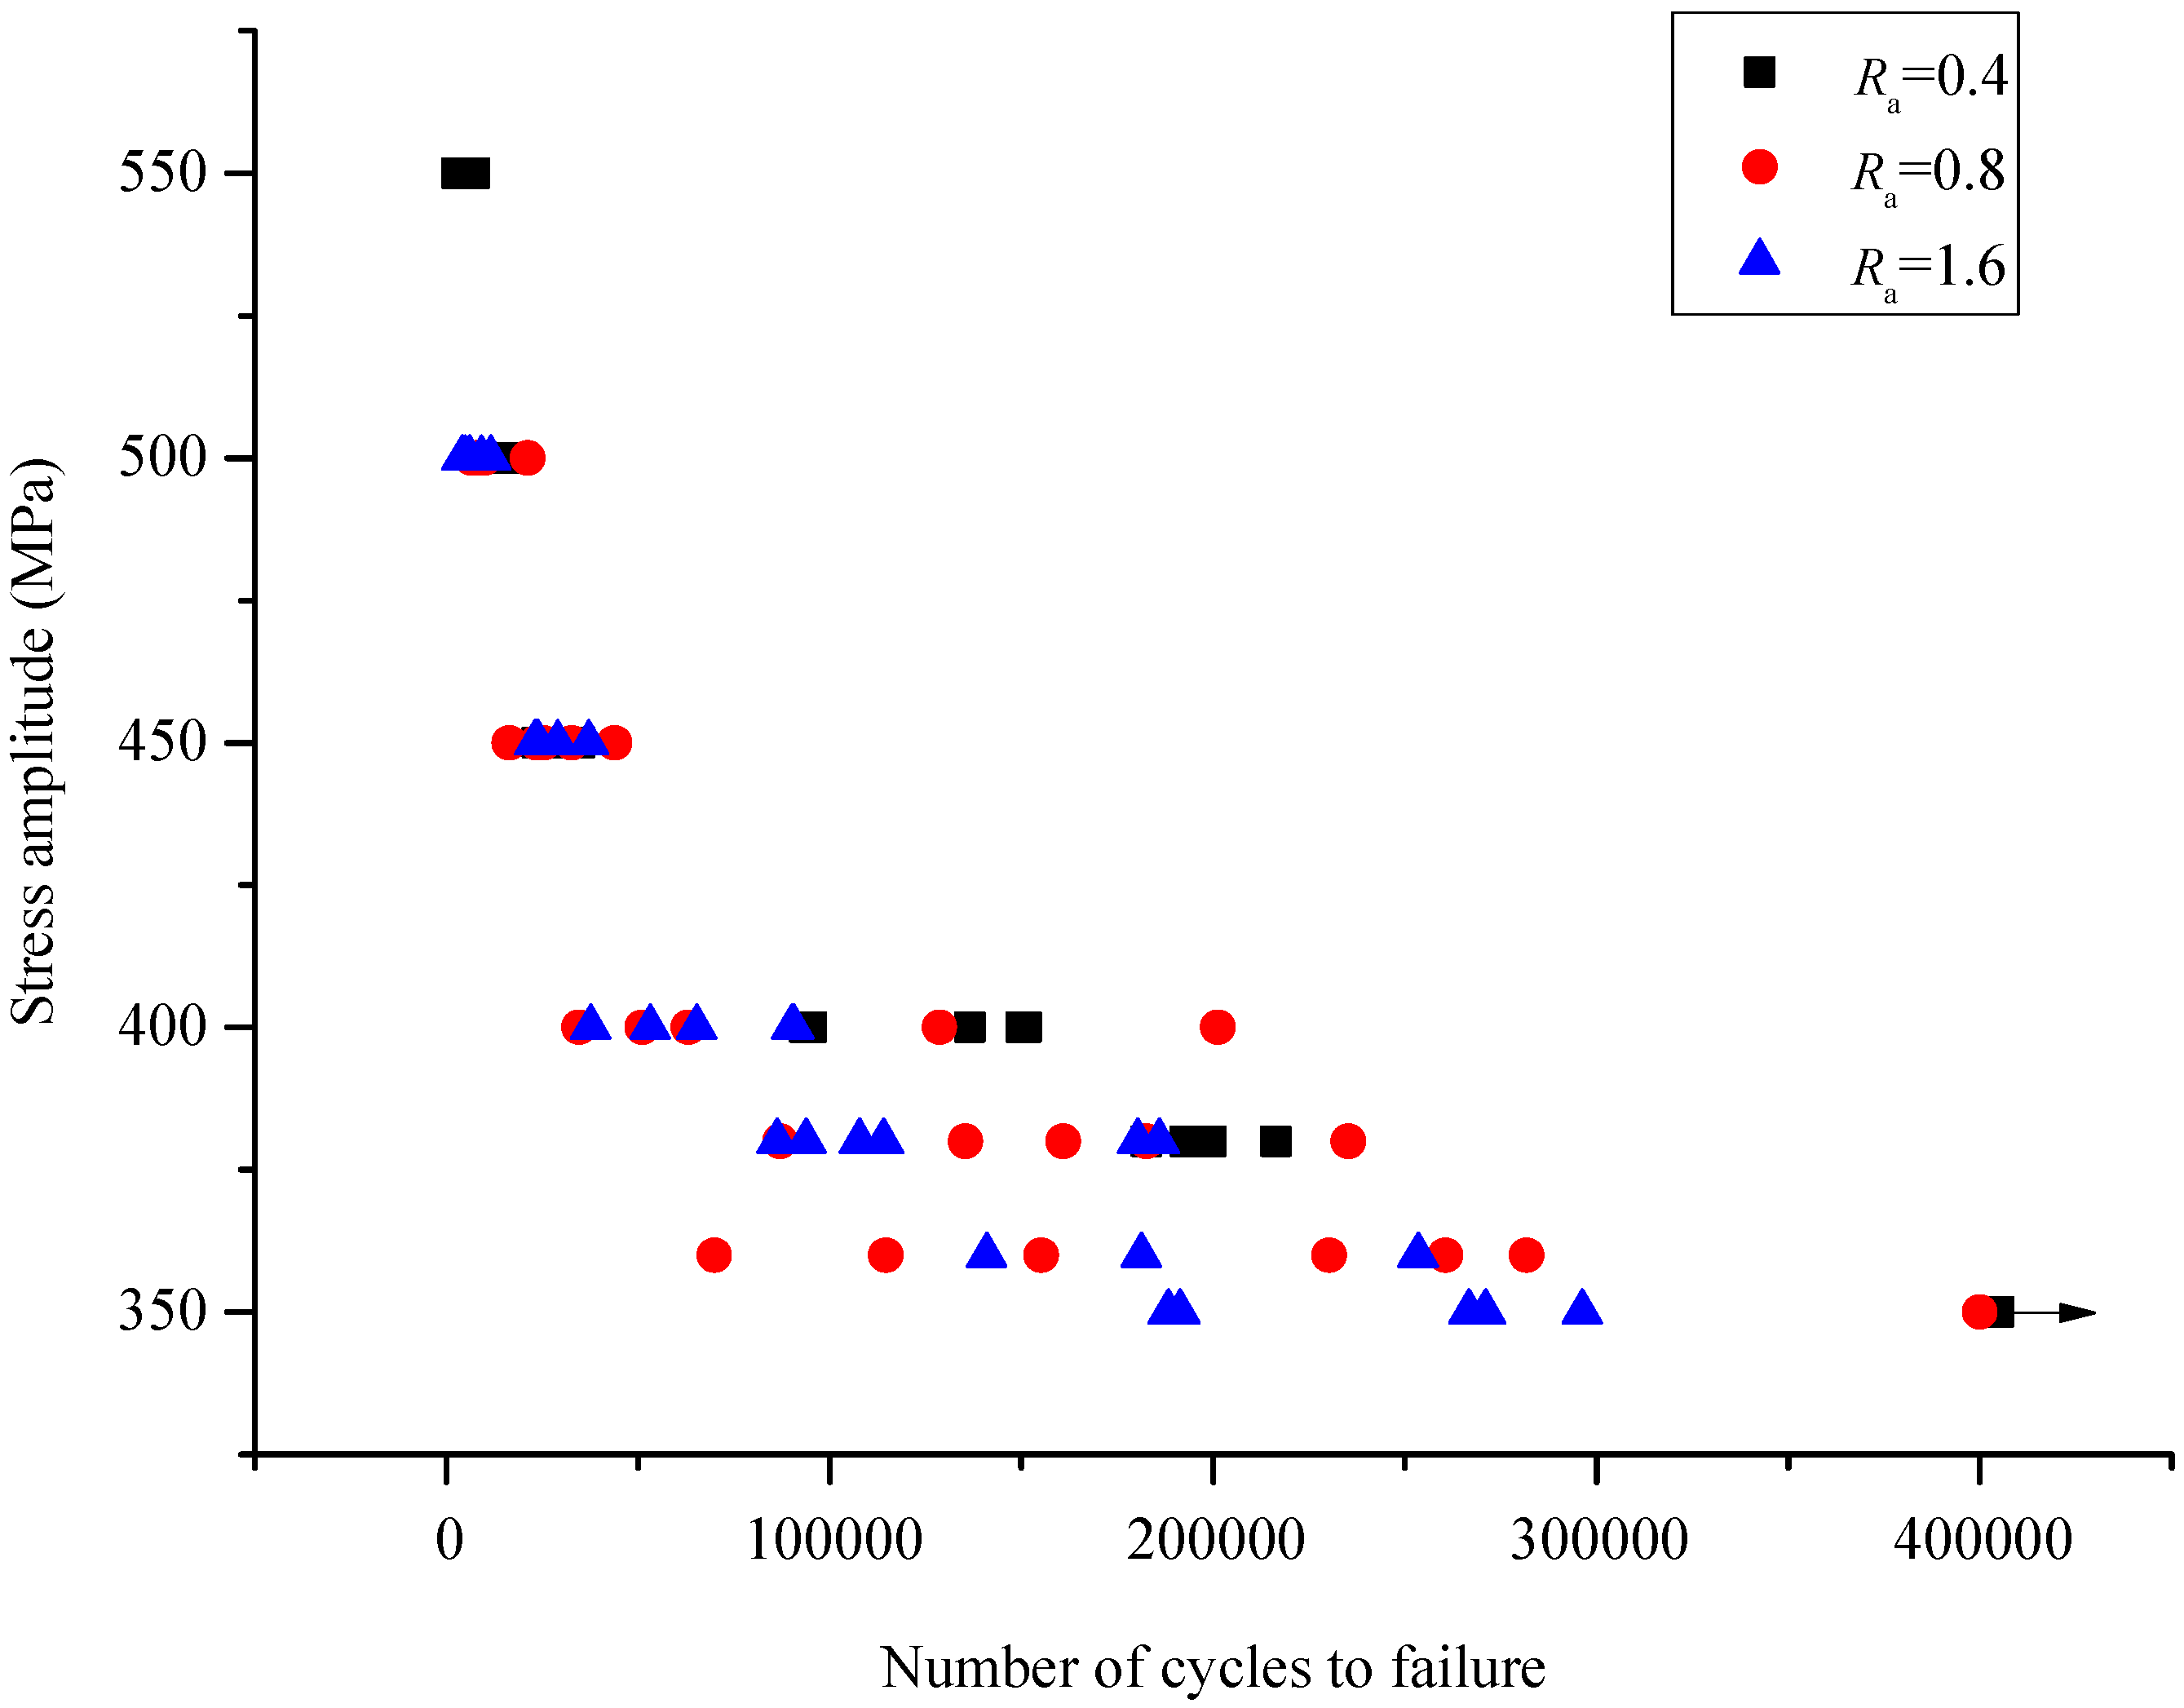
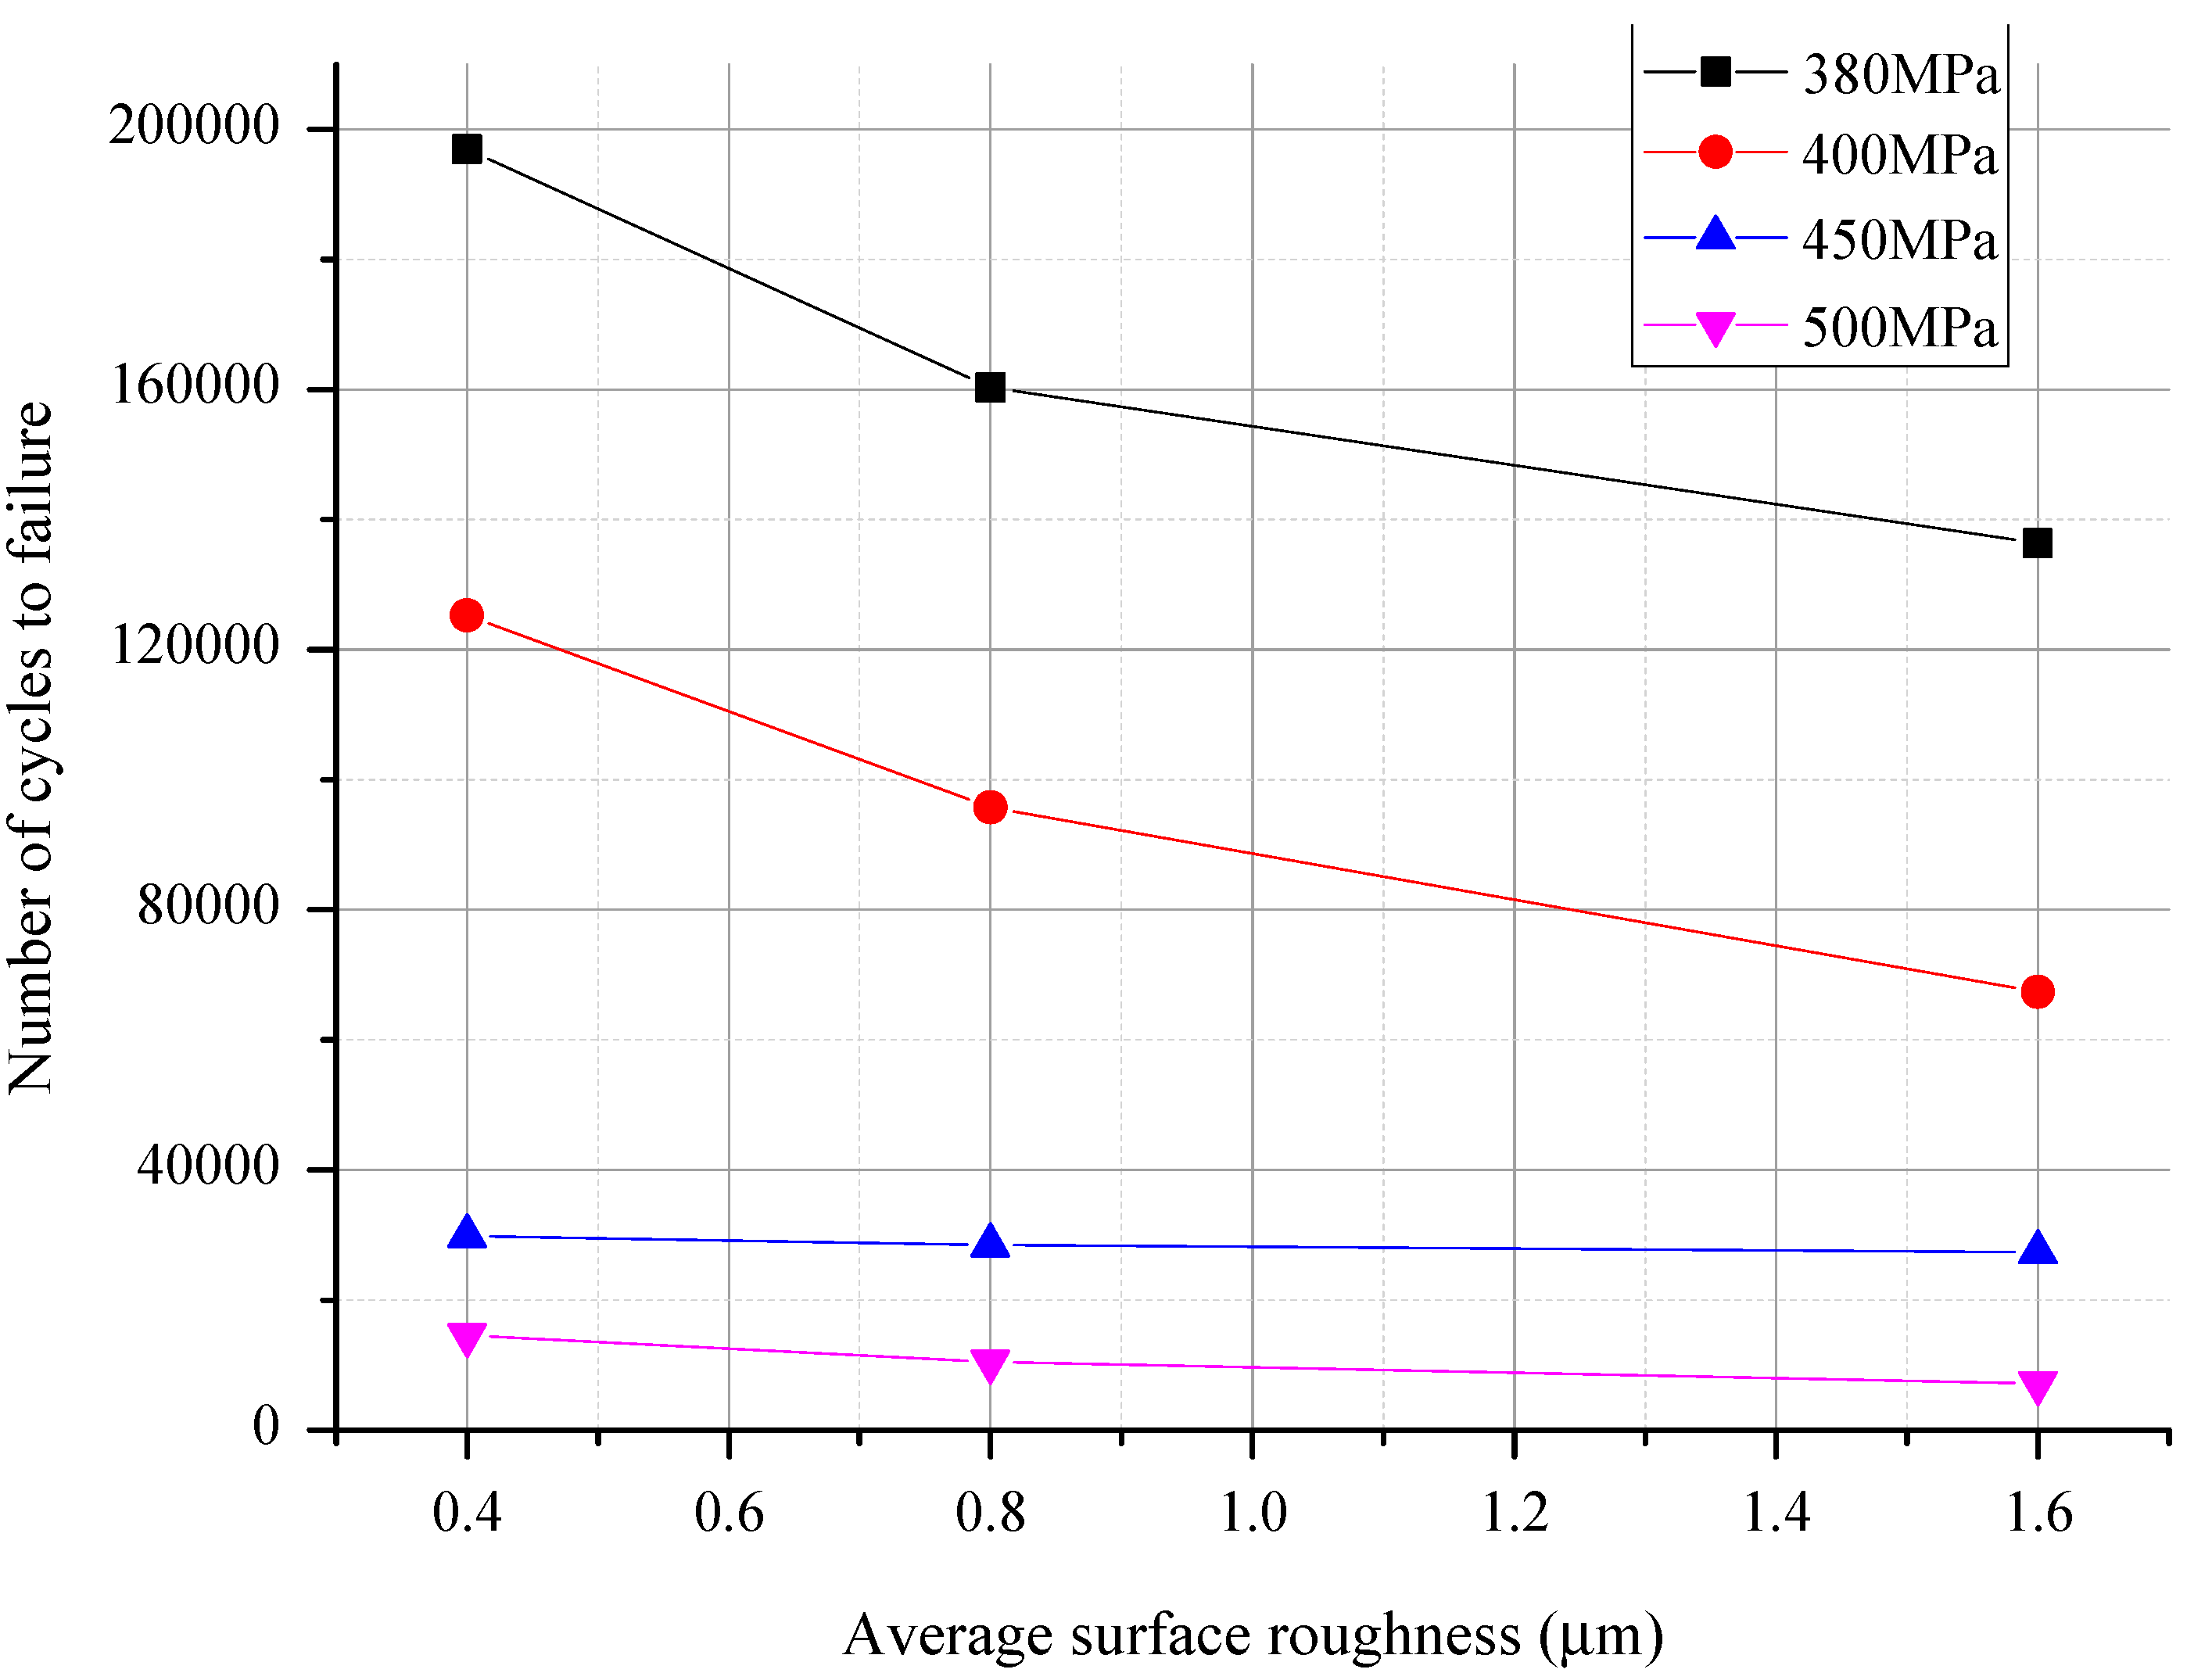
In this work, 75 fatigue tests were conducted. They were divided into three groups with average surface roughness (Ra) of 0.4 μm, 0.8 μm, and 1.6 μm, respectively. The stress amplitudes of the first group (Ra = 0.4 μm) included 550, 500, 450, 400, and 380 MPa, and those of other two groups included 500, 450, 400, 380, and 360 MPa. A total of five fatigue tests were performed under each stress amplitude. The scatterplot of all the experimental results is shown in Figure 3. Under each stress amplitude, it can be seen that the fatigue life has the conspicuous dispersion. The means of fatigue life with different average surface roughness and stress amplitude are compared in Figure 4. The average surface roughness is clearly effective in reducing mean of fatigue life for medium-carbon steel. In high stress amplitude (for example 500 MPa), there is about 15% decrease while there is about 30% decrease in low stress amplitude (for example 380 MPa) when the average surface roughness increased from 0.4 μm to 0.8 μm or from 0.8 μm to 1.6 μm. This could confirm that the surface roughness plays a vital role in the fatigue life of medium-carbon steel.
3. S-N Curves and P-S-N Curves
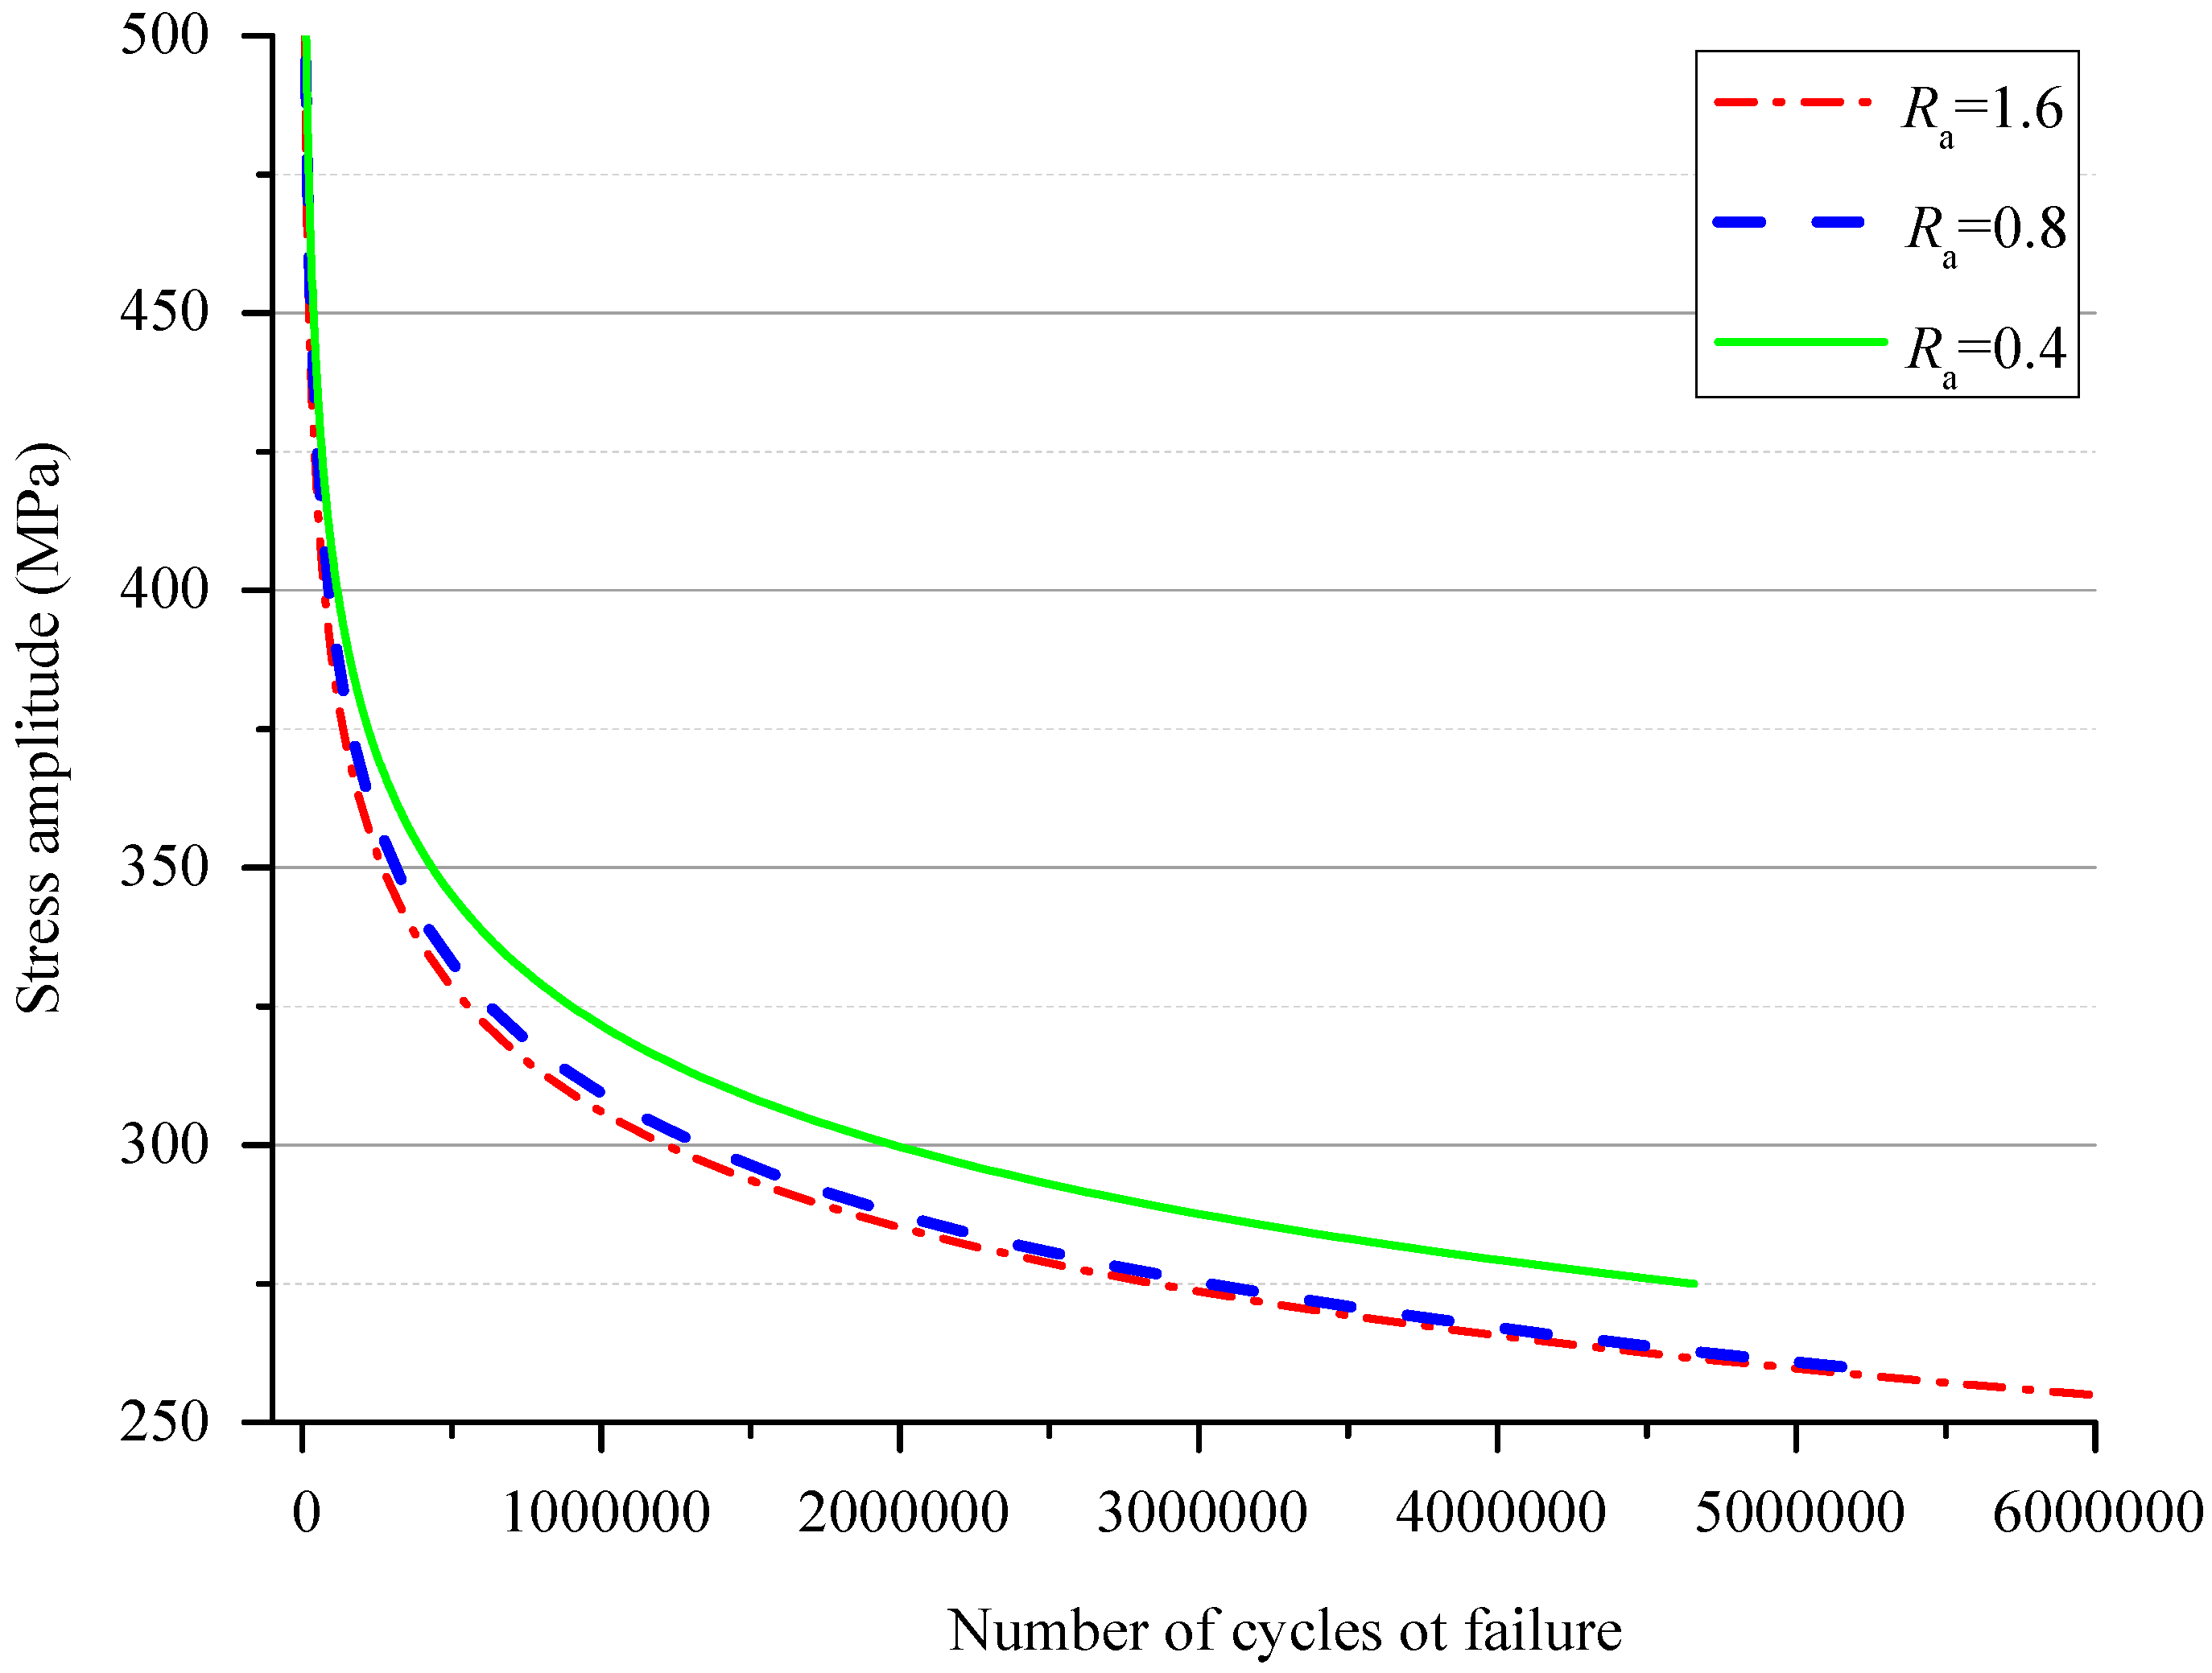
The S-N curves with the different average surface roughness are shown in Figure 5. The input data points of the curve fitting were obtained by taking the logarithm of the means of the fatigue life data and stress amplitudes. The material constants were estimated by the least square method and are listed in Table 3. The material constants satisfy the logarithmic Basquin equation , where S is the stress amplitude. As shown in Figure 5, (1) the mean of the fatigue life with Ra = 0.4 μm is very close to that with Ra = 0.8 μm or Ra = 1.6 μm when the stress amplitude is very high; and (2) the mean of the fatigue life with Ra = 0.8 μm is very close to that with Ra = 1.6 μm, while the mean of the fatigue life with Ra = 0.4 μm is significantly different from that with Ra = 0.8 μm or Ra = 1.6 μm when the stress amplitude is low. This phenomenon can be explained as surface damage due to machining not being the key factor of fatigue crack initiation and development of medium-carbon steel at higher-stress amplitudes than the endurance limit. It might be concluded that the mean of the fatigue life of the medium-carbon steel cannot be observably decreased when the average surface roughness is increased from Ra = 0.8 μm to Ra = 1.6 μm or even high at the low-stress amplitude.
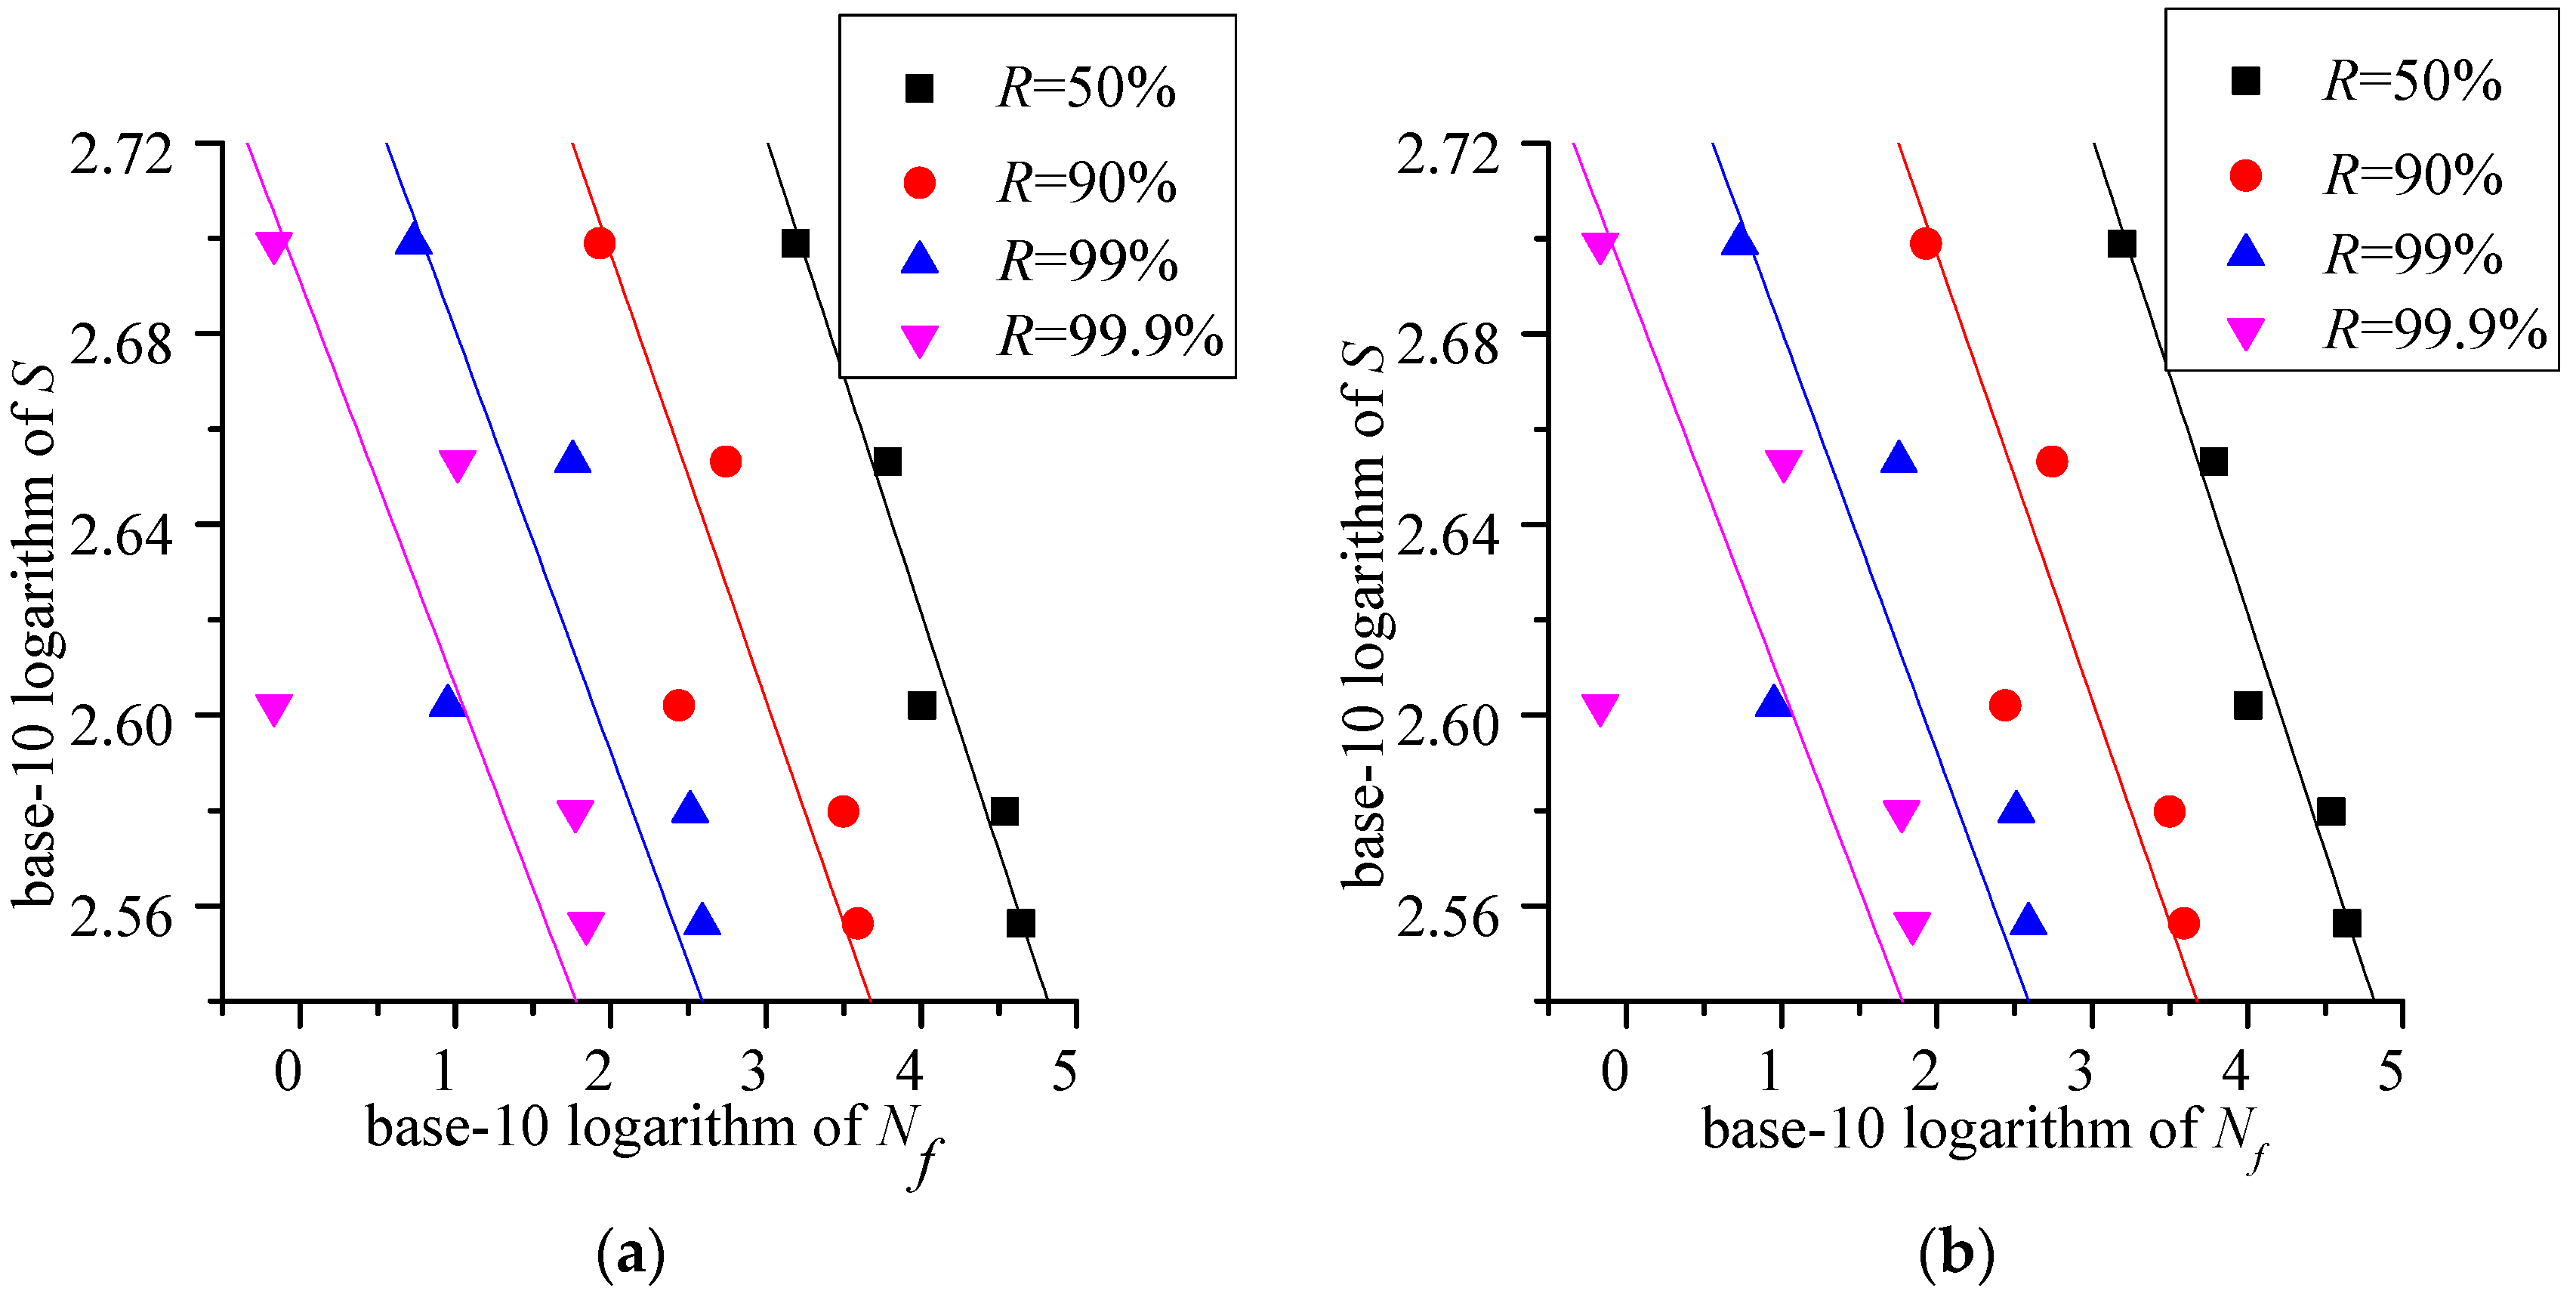
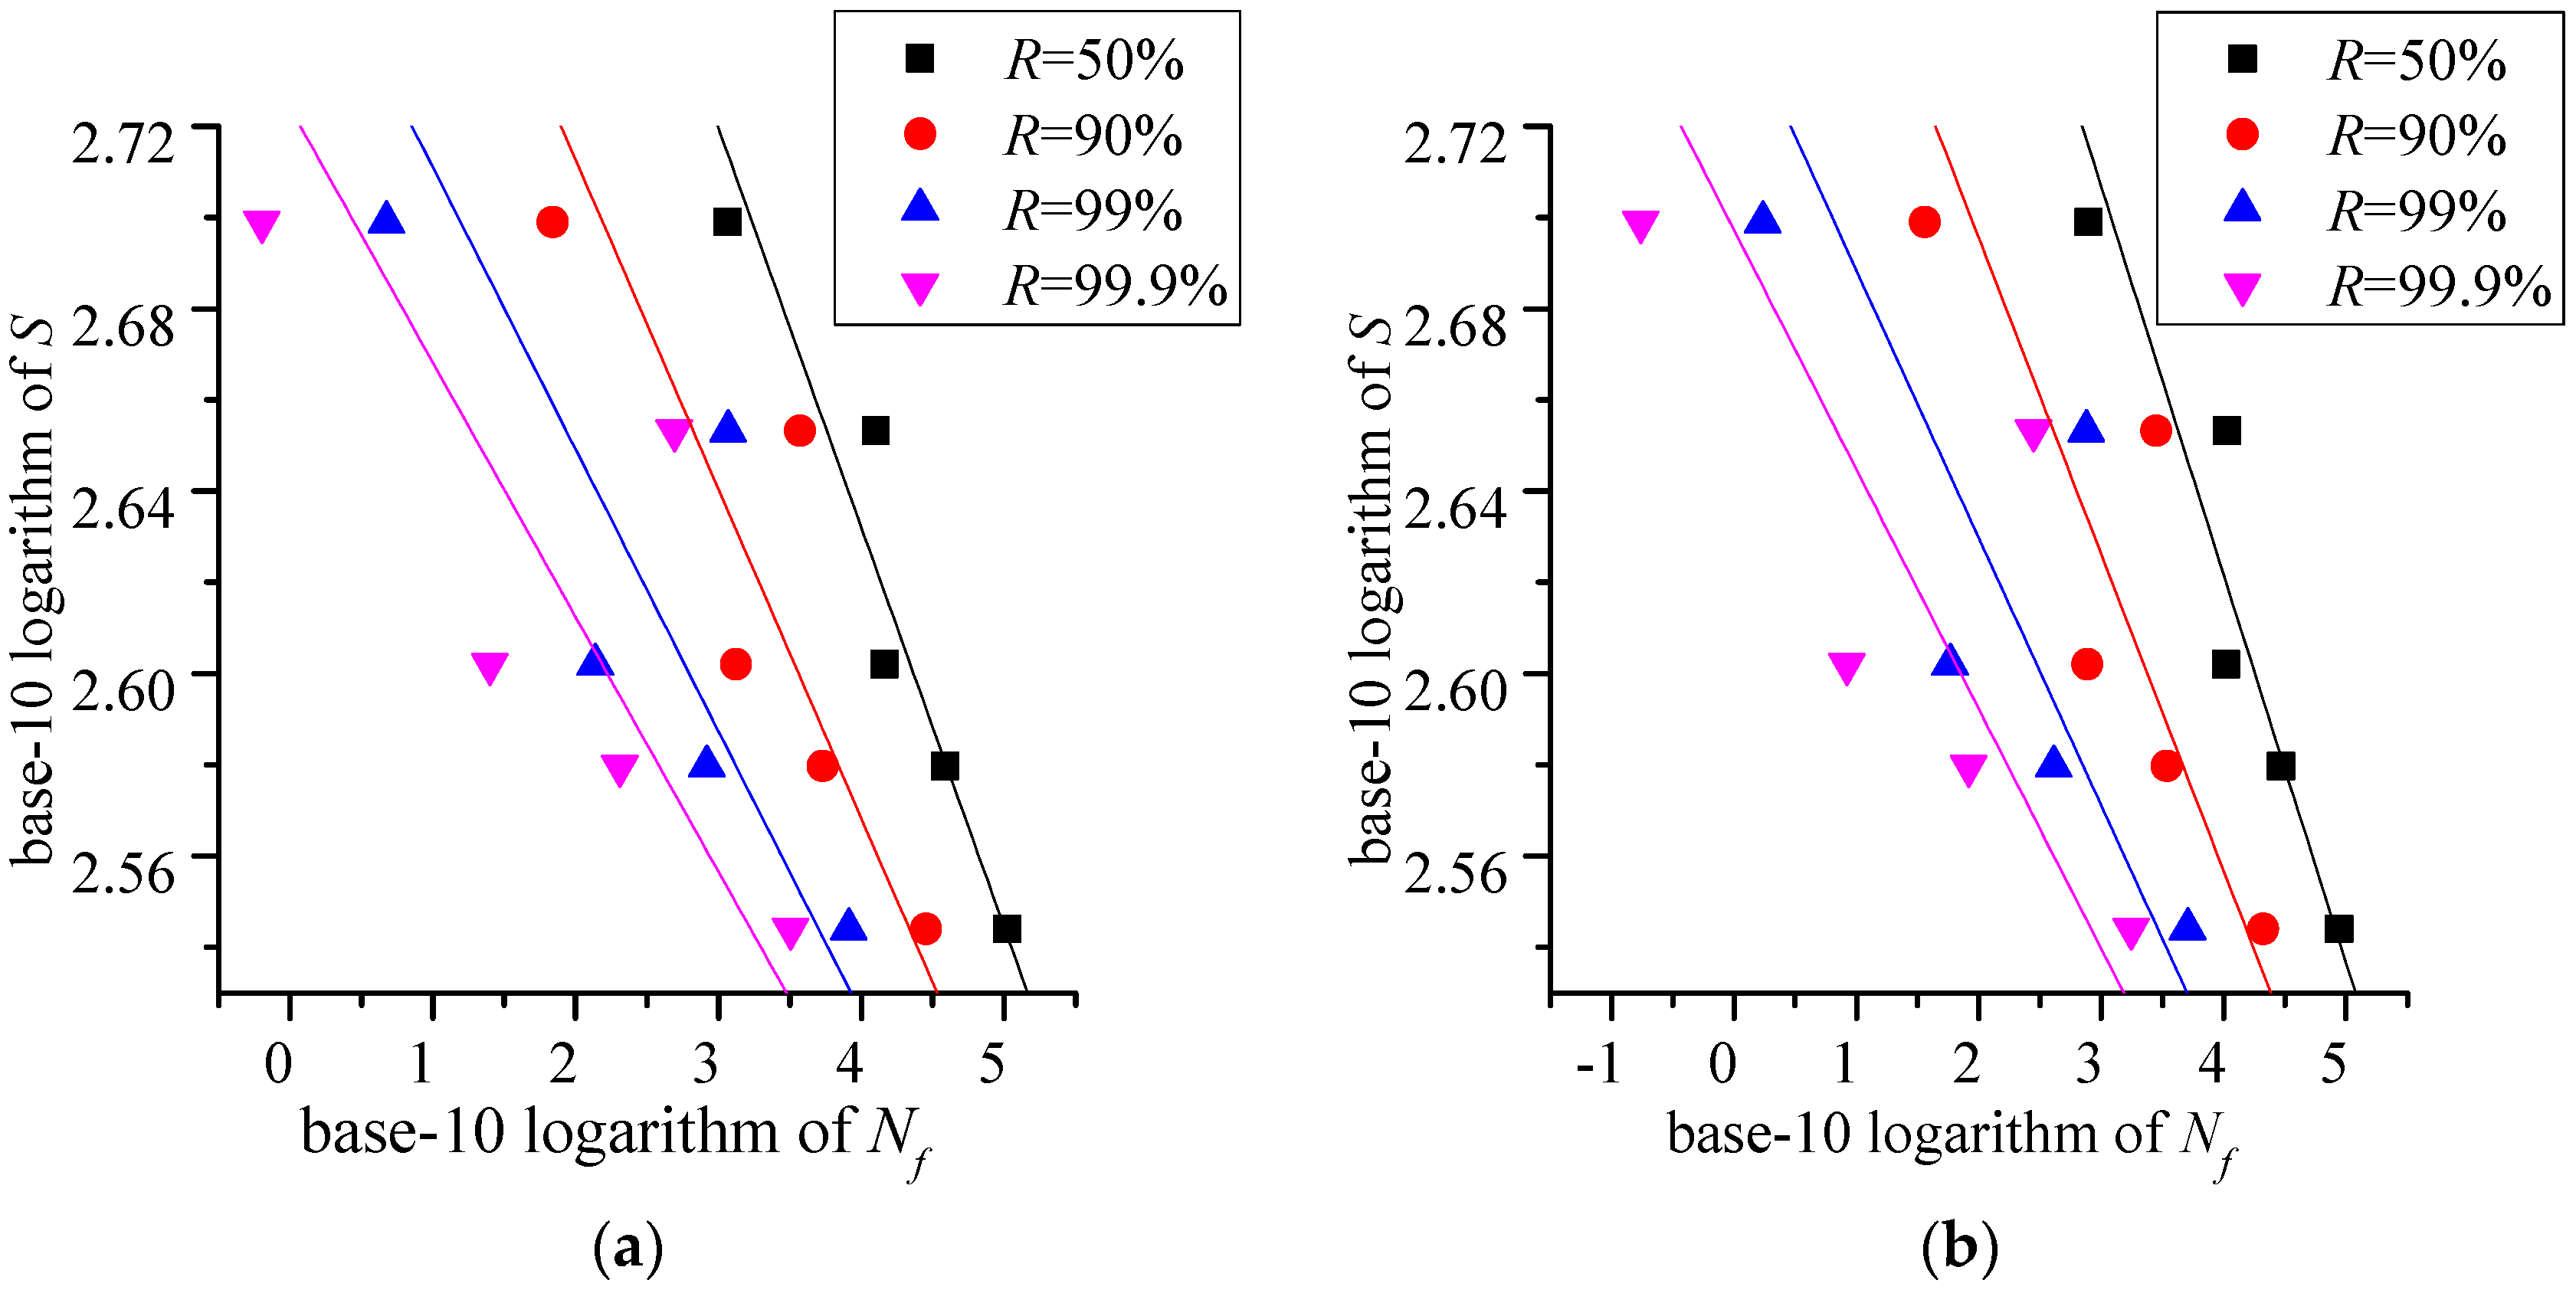
The P-S-N curves with Ra = 0.4 μm, Ra = 0.8 μm, and Ra = 1.6 μm are shown in Figure 6, Figure 7 and Figure 8, respectively. R is the survival probability. The data point (pink inverted triangle, blue triangle, red dot and black square) is the confidence lower limit which is calculated by [13]:
where and are the mean and the standard deviation of the experimental fatigue life, h is the one-sided tolerance factor which is calculated by:
In Equation (6), , is the inverse function of the standard normal distribution function, the correction factor, , the inverse function of the distribution function of Student’s t-distribution with ns − 1 degrees of freedom, and ns the sample size. When the survival probability R and the confidence level are given, the confidence lower limit can be calculated by Equation (5). Then, the P-S-N curve is described by the similar logarithmic Basquin equation , where parameters a1 and a2 are estimated by the least square method with Ra = 0.4 μm, Ra = 0.8 μm, and Ra = 1.6 μm shown in Table 4, Table 5 and Table 6, respectively.
4. Fatigue Life Estimation
The fatigue life Nf is composed of the crack initiation life Ni and the crack propagation life Np and can be calculated by Equation (3). The analytic formulation of the crack initiation life Ni was presented by Tanaka and Mura [9,10] and was based on the dislocation dipole accumulation model. It was extended to estimate the crack initiation life Ni of the specimen with the different surface roughness by Wang et al. [12]. It is [9,10,11,12]:
here is the threshold of stress intensity factor, G is the shear modulus, E is the elastic modulus, Se is the endurance limit, is the Poisson’s ratio, and a0 is the equivalent initial micro-defect size. a0 could be estimated as [12,14]:
The number of cycles necessary to grow the crack from the initial micro-defect size to failure can be described by Paris’ law as:
where is the amplitude of stress intensity factor, C the material constant, and a the crack size. The crack propagation life Np can be calculated by the analytic solution of Paris’ law integral as [12,15,16]:
where: asc is the critical crack size for identifying long and short cracks, af the crack size of final failure, and . Generally, the number of crack growth cycles from a0 to asc is much greater than the cycles needed to grow from asc to af. Then Np can be taken as [17]:
It can be written by:
where:
By taking logarithms in Equation (12), then:
The material constant n in Equation (12) is the same as n in the S-N curves. The material constant C can be solved by Equation (13). n and c have been listed in Table 3 in Section 3. The material constants C and n in Equation (11) are listed in Table 7.
Then, the fatigue life Nf of medium-carbon steel is computed as:
where the shear modulus G is 79.40 GPa, the elastic modulus E is 206.00 GPa, and the threshold of stress intensity factor is 6.26. Substituting the material constants C and n in Table 7 into Equation (12), the mean fatigue life Nf of the medium-carbon steel with different average surface roughness is:
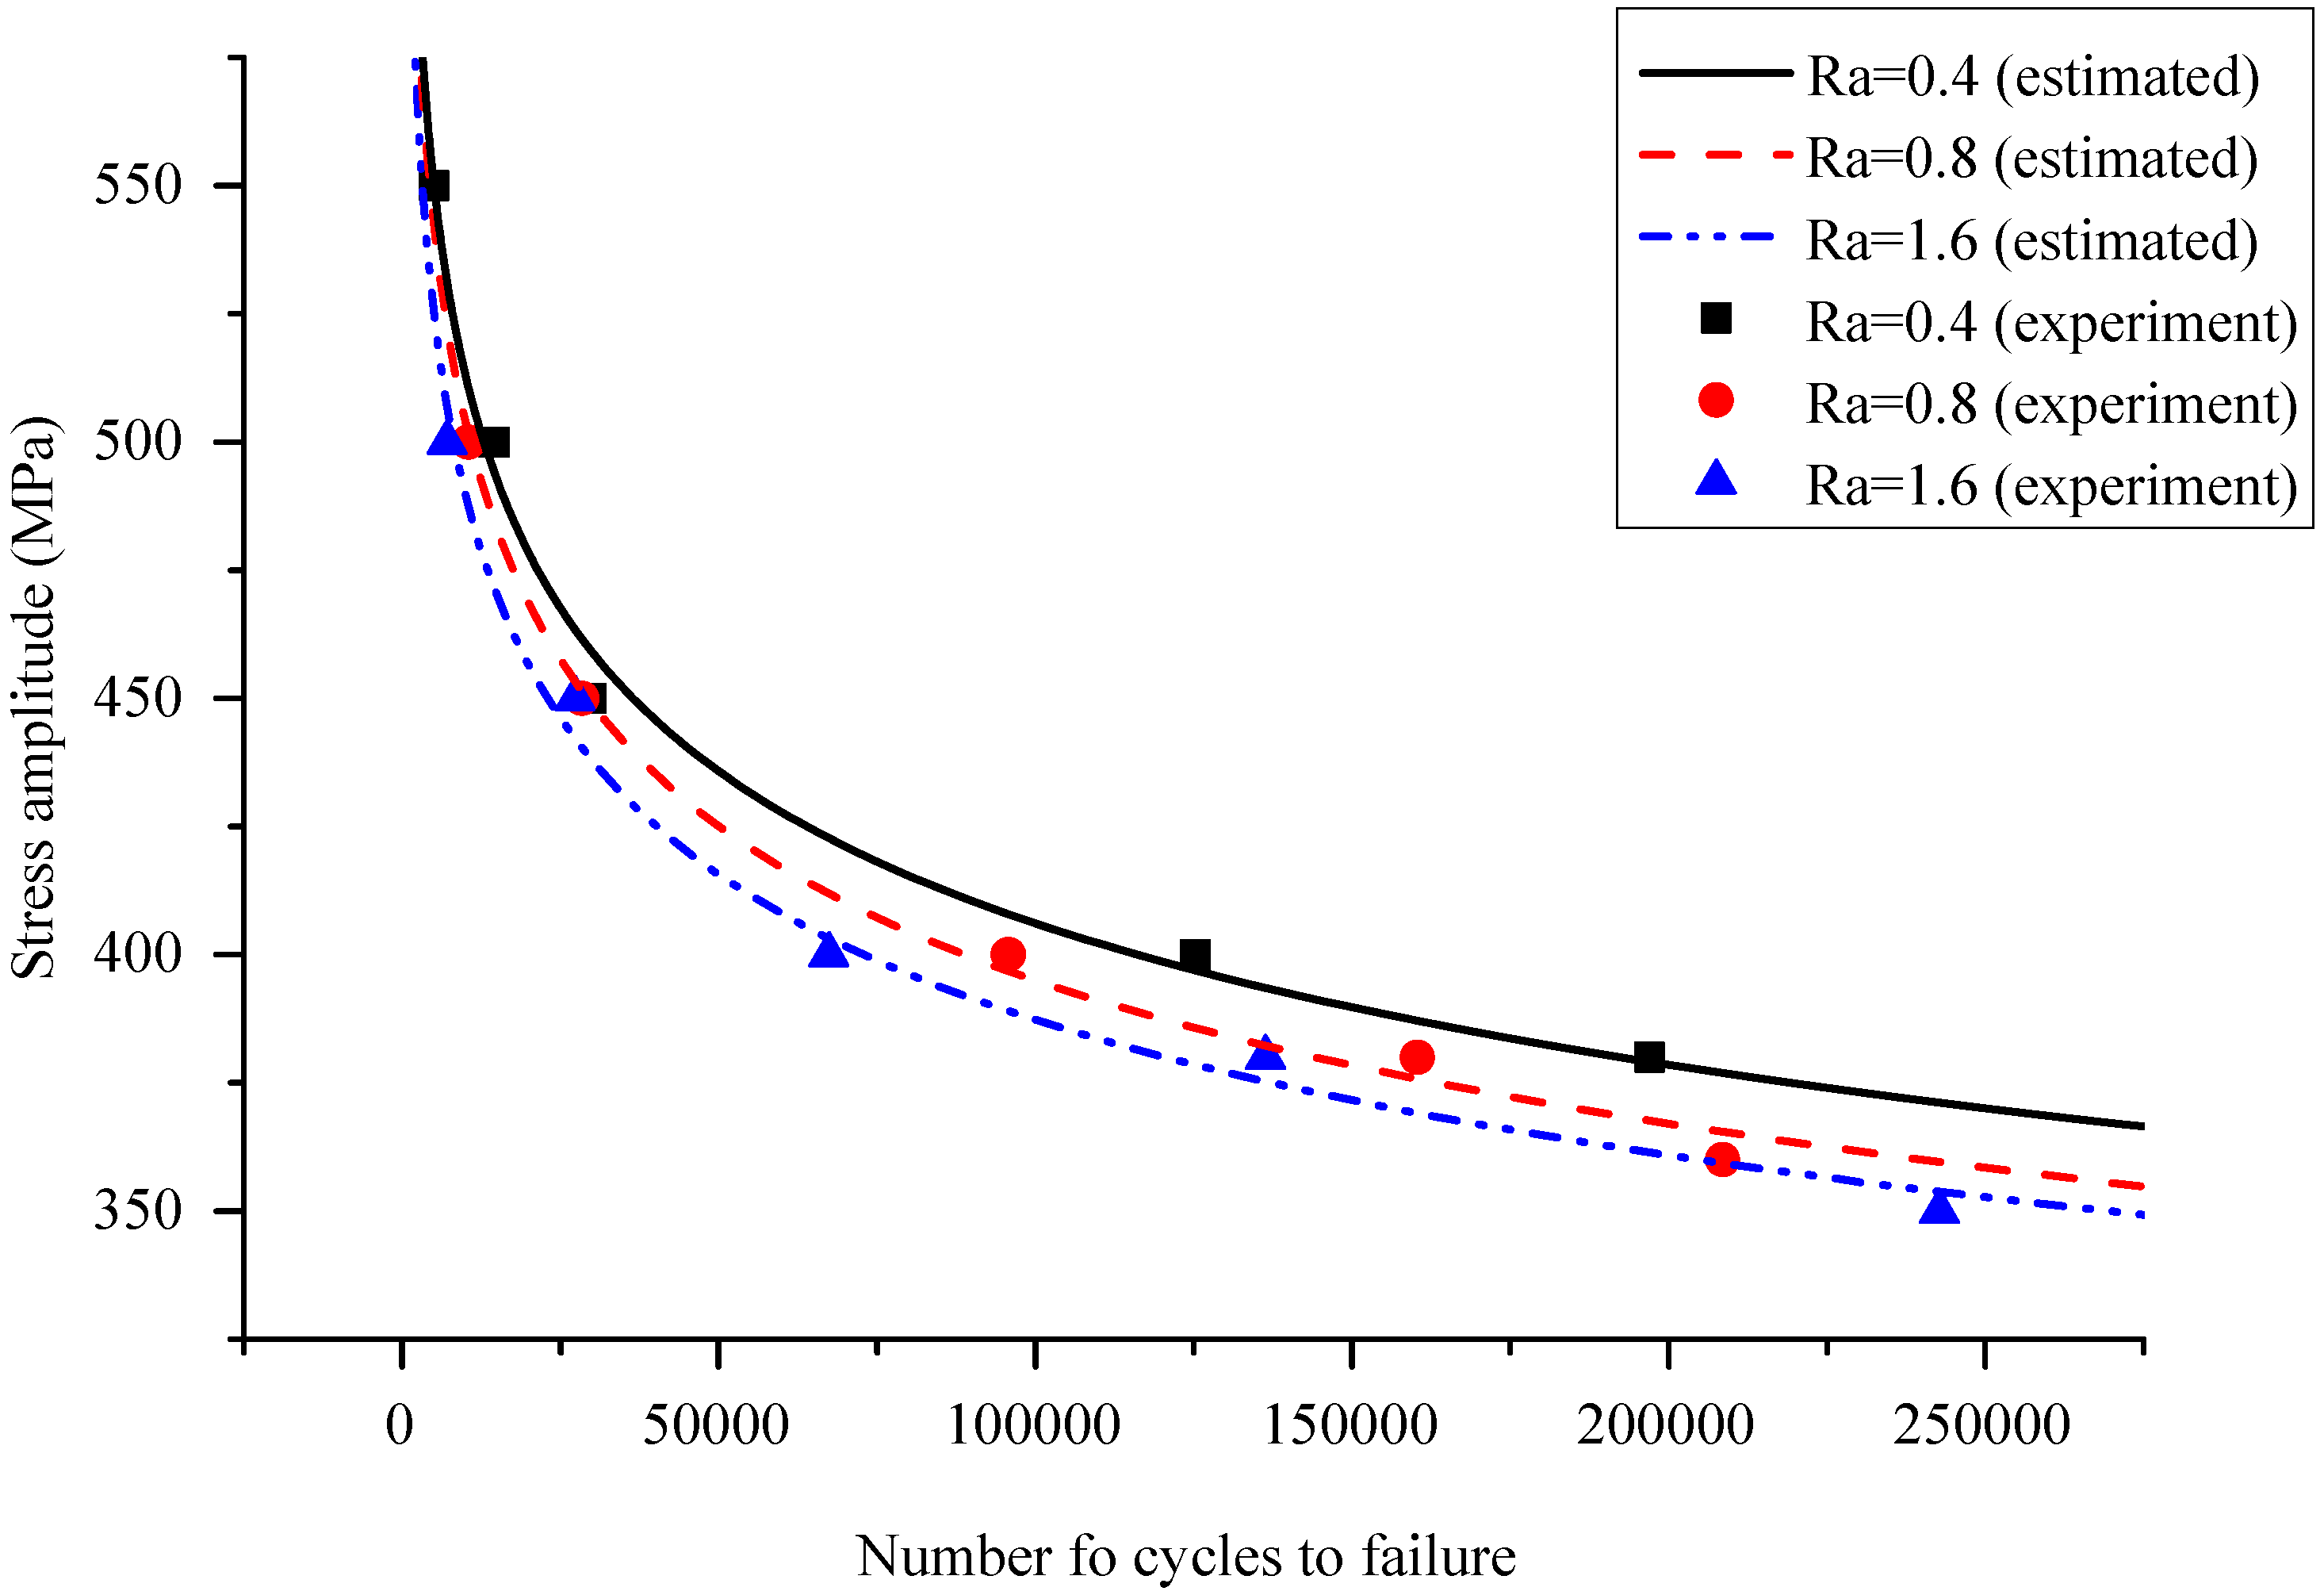
When the average surface roughness is 0.4, 0.8, and 1.6, respectively, the mean fatigue life curves of medium-carbon steel calculated by Equation (16) are shown in Figure 9. It can be seen that the fatigue life estimation model agrees with the experiment value well. To validate the presented formulation for estimating the mean fatigue life of medium-carbon steel, six more fatigue tests were conducted and the experimental results are shown in Table 8. The stress amplitude was 420 MPa and was not equal to any stress amplitude in the previous experiments. The maximum and minimum estimation errors are 15.83% and 1.99%, respectively. Therefore, it is obvious that the presented model for estimating the mean fatigue life of medium-carbon steel gives good results for roughness Ra = 0.4 μm, Ra = 0.8 μm, and Ra = 1.6 μm.
5. Conclusions
To estimate the fatigue life of medium-carbon steel specimen, the effect of the average surface roughness on the fatigue life has been investigated in this paper using 75 fatigue tests in three groups with average surface roughnesses of (Ra): 0.4 μm, 0.8 μm, and 1.6 μm, respectively. S-N curves and P-S-N curves were established based on the fatigue tests. It was shown that there is about 15% decrease of the mean fatigue life in high stress amplitude (for example, 500 MPa), while there is about 30% decrease in low stress amplitude (for example, 380 MPa) when the average surface roughness increased from 0.4 μm to 0.8 μm or from 0.8 μm to 1.6 μm. Then, one new method was presented to estimate the fatigue life of the medium-carbon steel with different average surface roughness (Ra). The experiment results show that the maximum estimation error of the mean fatigue life by the presented model is less than 16%.
Acknowledgments
The work is supported by National Natural Science Foundation of China (grant no. 51575095, 51675089), and Major State Basic Research Development Program of China (973 Program) (grant no. 2014CB046303).
Author Contributions
Changyou Li, Weibing Dai and Fei Duan conceived and designed the experiments and analyzed the experiment data; Yimin Zhang and David He contributed to the method for estimating the fatigue life of the medium-carbon steel with different average surface roughness; David He refined the language of this manuscript.
Conflicts of Interest
The authors declare no conflict of interest.
Nomenclature
| a | Crack size |
| a0 | Equivalent initial micro-defect size |
| a1 | Parameter of P-S-N curve |
| a2 | Parameter of P-S-N curve |
| af | Crack size of final failure |
| asc | Critical crack size for identifying long and short cracks |
| b1 | Parameter of surface condition modification factor |
| b2 | Parameter of surface condition modification factor |
| C | Material constant in Paris law |
| c | Material constant in Basquin’s relation (NSn = c) |
| E | Elastic modulus |
| G | Shear modulus |
| h | One-sided tolerance factor |
| Surface condition modification factor | |
| Kf | Fatigue stress concentration factor |
| Kt | Stress concentration factor |
| N | Number of cycle |
| Np | Crack propagation life |
| Ni | Crack initiation life |
| Nf | Fatigue life (number of cycles to failure) |
| n | Material constant in Basquin’s relation(NSn = c) |
| Sample size | |
| P-S-N | Probabilistic stress-life |
| Ra | Average surface roughness |
| R | Survival probability |
| S | Stress amplitude |
| S-N | Stress-life |
| Se | Endurance limit of a machine part |
| Endurance limit of the rotary-beam test specimen | |
| Sut | Minimum tensile strength |
| Confidence lower limit | |
| Mean of the experimental fatigue life | |
| Parameter in Equation (4) | |
| Parameter in Equation (4) | |
| Confidence level | |
| Correction factor in Equation (6) | |
| Poisson’s ratio | |
| Standard deviation of the experimental fatigue life | |
| Amplitude of stress intensity factor | |
| Threshold of stress intensity factor |
References
- The Wikipedia Page on Carbon Steel. Available online: https://en.wikipedia.org/wiki/Carbon_steel#cite_note-10 (accessed on 25 October 2016).
- Gladman, T. Medium/High Carbon Steels for Rails, Rods, Bars and Forgings. In Materials Science and Technology; John Wiley & Sons, Inc.: Hoboken, NJ, USA, 2006; pp. 401–432. [Google Scholar]
- Moussaoui, K.; Mousseigne, M.; Senatore, J.; Chieragatti, R. The effect of roughness and residual stresses on fatigue life time of an alloy of titanium. Int. J. Adv. Manuf. Technol. 2015, 78, 557–563. [Google Scholar]
- Budynas, R.G.; Nisbett, J.K. Shigley’s Mechanical Engineering Design, 10th ed.; McGraw-Hill Education: New York, NY, USA, 2015; pp. 294–301. [Google Scholar]
- Suraratchai, M.; Limido, J.; Mabru, C.; Chieragatti, R. Modelling the influence of machined surface roughness on the fatigue life of aluminum alloy. Int. J. Fatigue 2008, 30, 2119–2126. [Google Scholar] [CrossRef]
- As, S.K.; Skallerud, B.; Tveiten, B.W.; Holme, B. Fatigue life prediction of machined components using finite element analysis of surface topography. Int. J. Fatigue 2005, 27, 1590–1596. [Google Scholar]
- Arola, D.; Ramulu, M. An examination of the effects from surface texture on the strength of fiber-reinforced plastics. J. Compos. Mater. 1999, 33, 102–123. [Google Scholar] [CrossRef]
- Arola, D.; Williams, C.L. Estimating the fatigue stress concentration factor of machined surfaces. Int. J. Fatigue 2002, 24, 923–930. [Google Scholar] [CrossRef]
- Tanaka, K.; Mura, T. A dislocation model for fatigue crack initiation. Int. J. Appl. Mech. 1981, 48, 97–103. [Google Scholar] [CrossRef]
- Tanaka, K.; Mura, T. A theory of fatigue crack initiation at inclusions. Metall. Mater. Trans. A Phys. Metall. Mater. Sci. 1982, 13, 117–123. [Google Scholar]
- Wang, Q.Y.; Bathias, C.; Kawagoishi, N.; Chen, Q. Effect of inclusion on subsurface crack initiation and gigacycle fatigue strength. Int. J. Fatigue 2002, 24, 1269–1274. [Google Scholar] [CrossRef]
- Wang, J.L.; Zhang, Y.L.; Sun, Q.C.; Liu, S.J.; Shi, B.W.; Lu, H.T. Giga-fatigue life prediction of FV520B-I with surface roughness. Mater. Des. 2016, 89, 1028–1034. [Google Scholar] [CrossRef]
- Fu, H.M.; Gao, Z.T.; Xu, R.P. A confidence lower limit of population percentile. J. Beijing Univ. Aeronaut. Astronaut. 1990, 3, 1–8. [Google Scholar]
- Murakami, Y. Metal Fatigue: Effects of Small Defects and Nonmetallic Inclusions; Elsevier Science Ltd.: Kidlington, UK, 2002; pp. 11–24. [Google Scholar]
- Zhang, Y.L.; Wang, J.L.; Sun, Q.C.; Zhang, H.; Jiang, P.S. Fatigue life prediction of FV520B with internal inclusions. Mater. Des. 2015, 69, 241–246. [Google Scholar] [CrossRef]
- Wang, Q.Y.; Pidaparti, R.M.; Palakal, M.J. Comparative study of corrosion–fatigue in aircraft materials. AIAA J. 2001, 39, 325–330. [Google Scholar] [CrossRef]
- Wang, Q.Y.; Berard, J.Y.; Rathery, S.; Bathias, C. High-cycle fatigue crack initiation and propagation behaviour of high-strength spring steel wires. Fatigue Fract. Eng. Mater. Struct. 1999, 22, 673–677. [Google Scholar] [CrossRef]
Figure 1.
Fatigue specimen geometry (dimensions in mm).

Figure 2.
The testing apparatus.
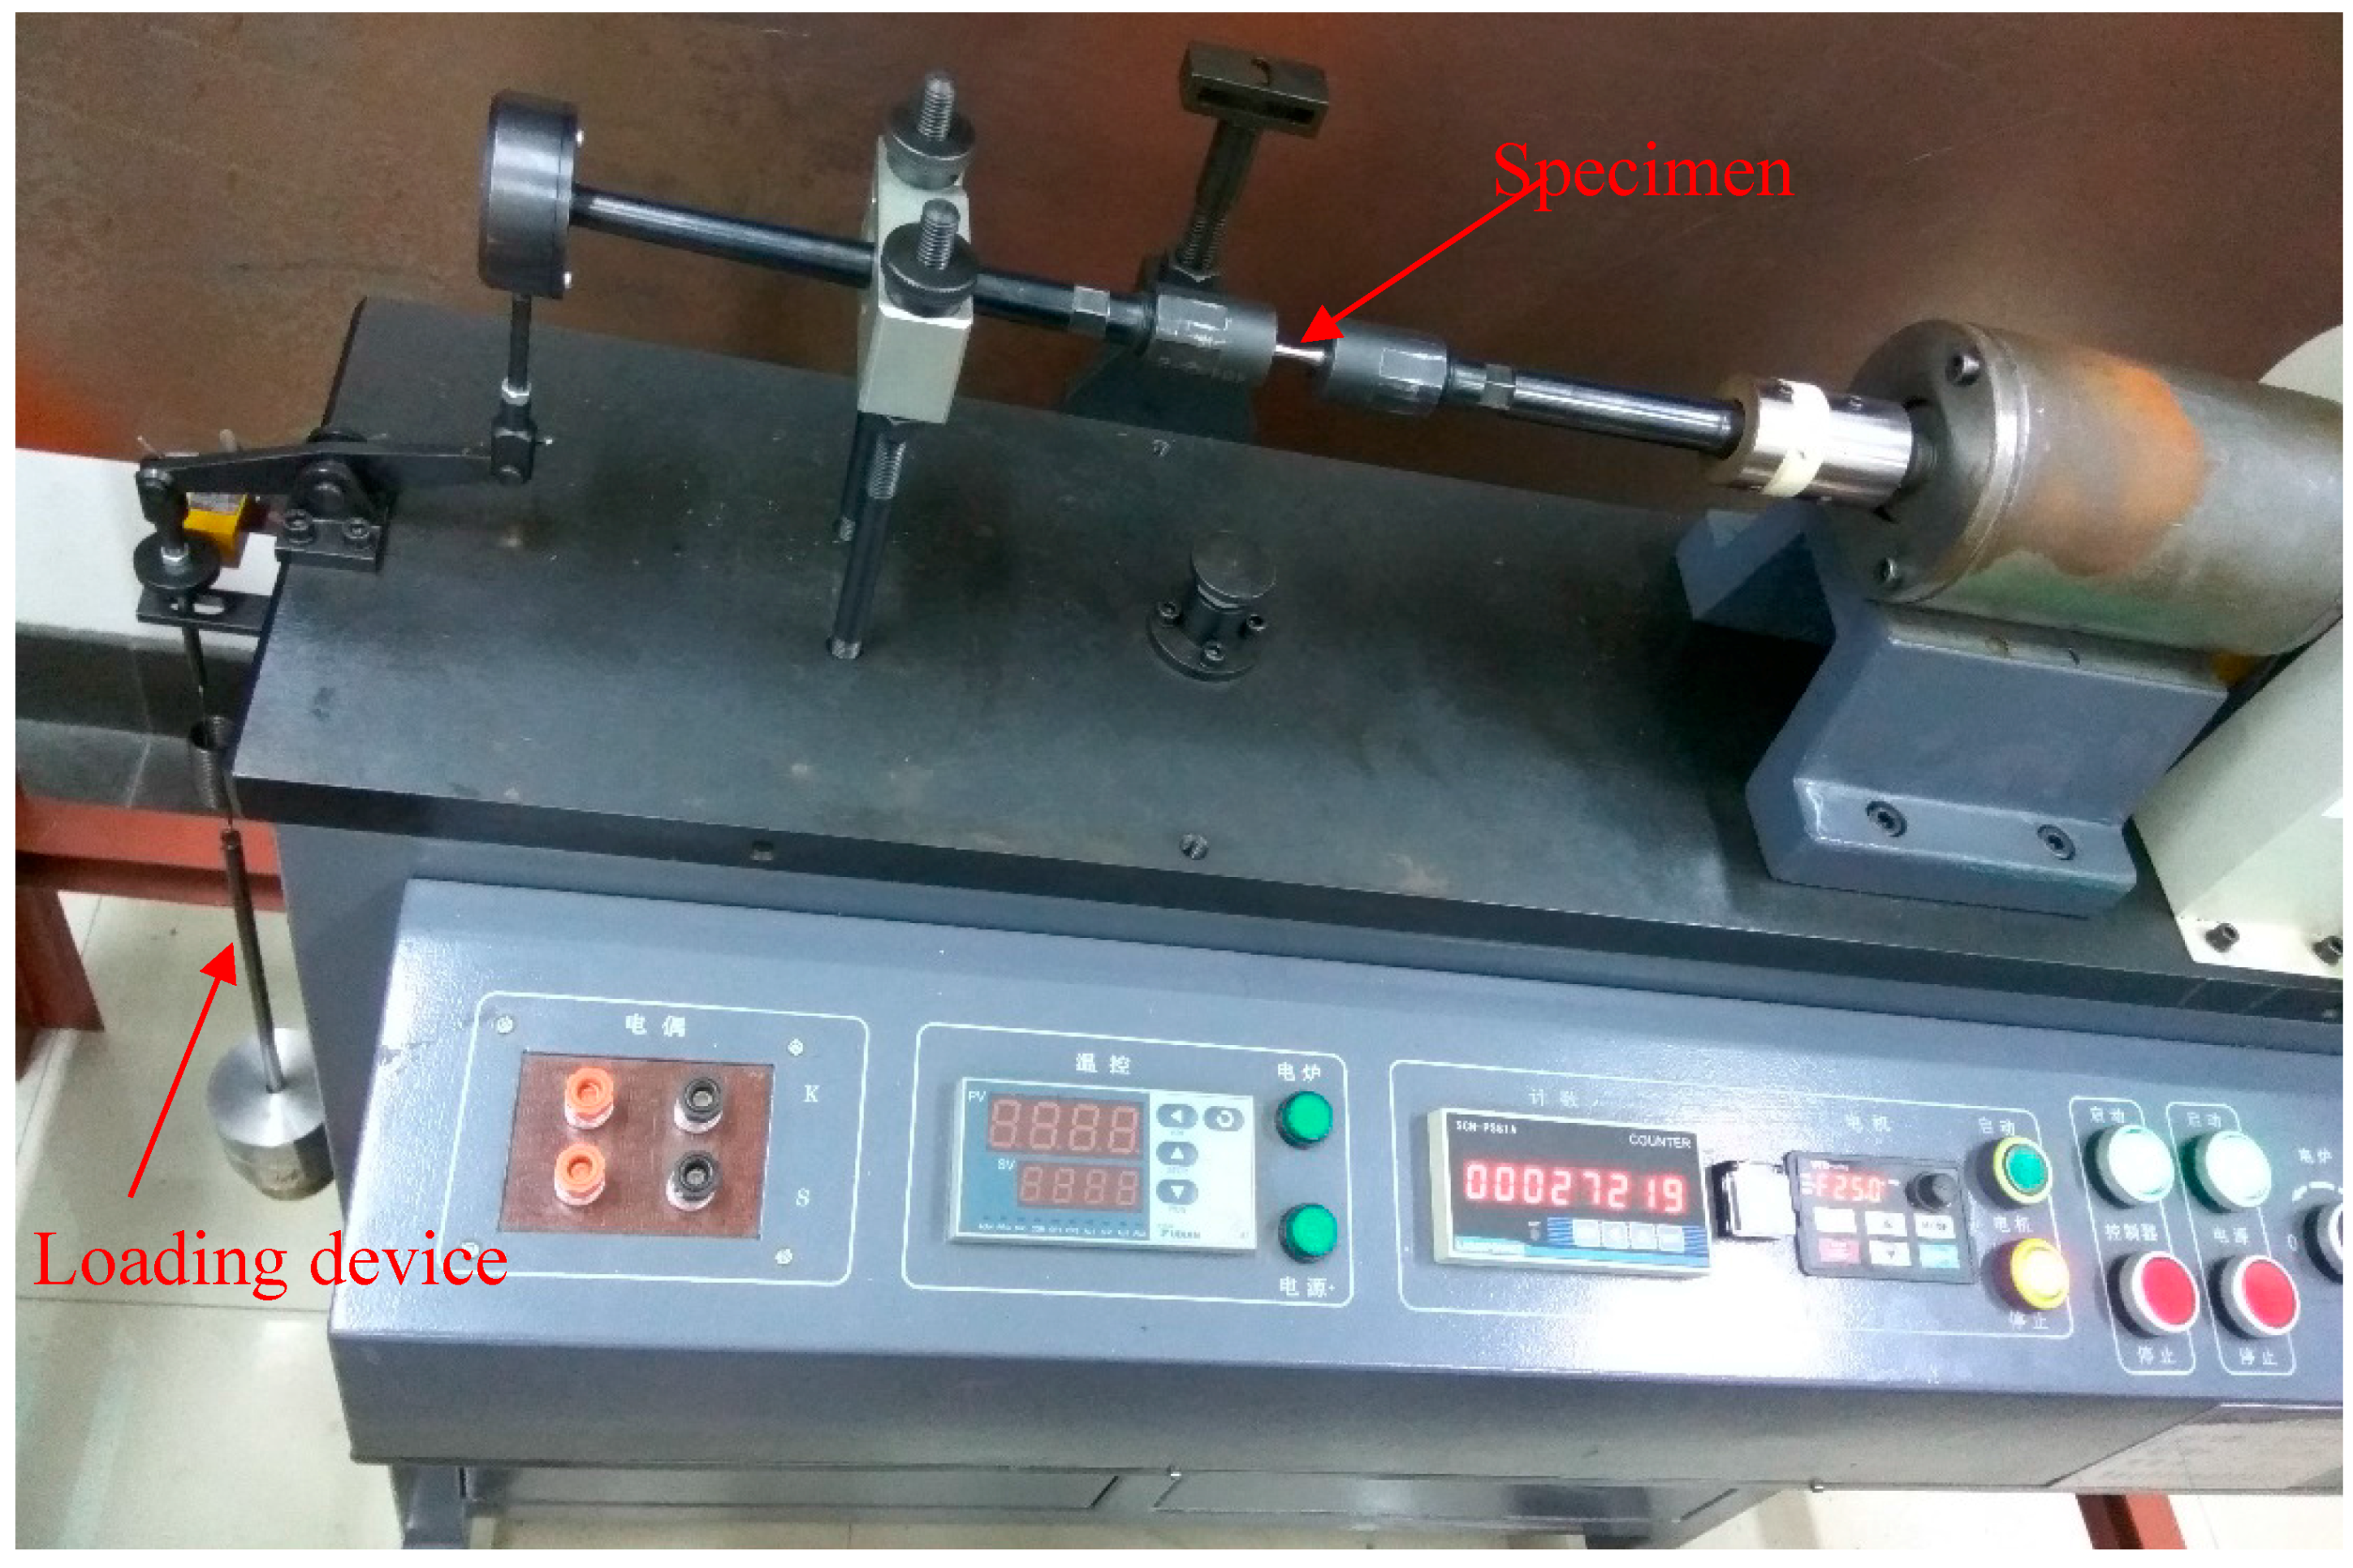
Figure 3.
Scatterplot of the 75 fatigue tests.

Figure 4.
Contrast of mean fatigue life with Ra = 0.4 μm, Ra = 0.8 μm, and Ra = 1.6 μm.

Figure 5.
The S-N curves with Ra = 0.4 μm, Ra = 0.8 μm, and Ra = 1.6 μm.

Figure 6.
The P-S-N curves with Ra = 0.4 μm and confidence level (a) ; and (b)
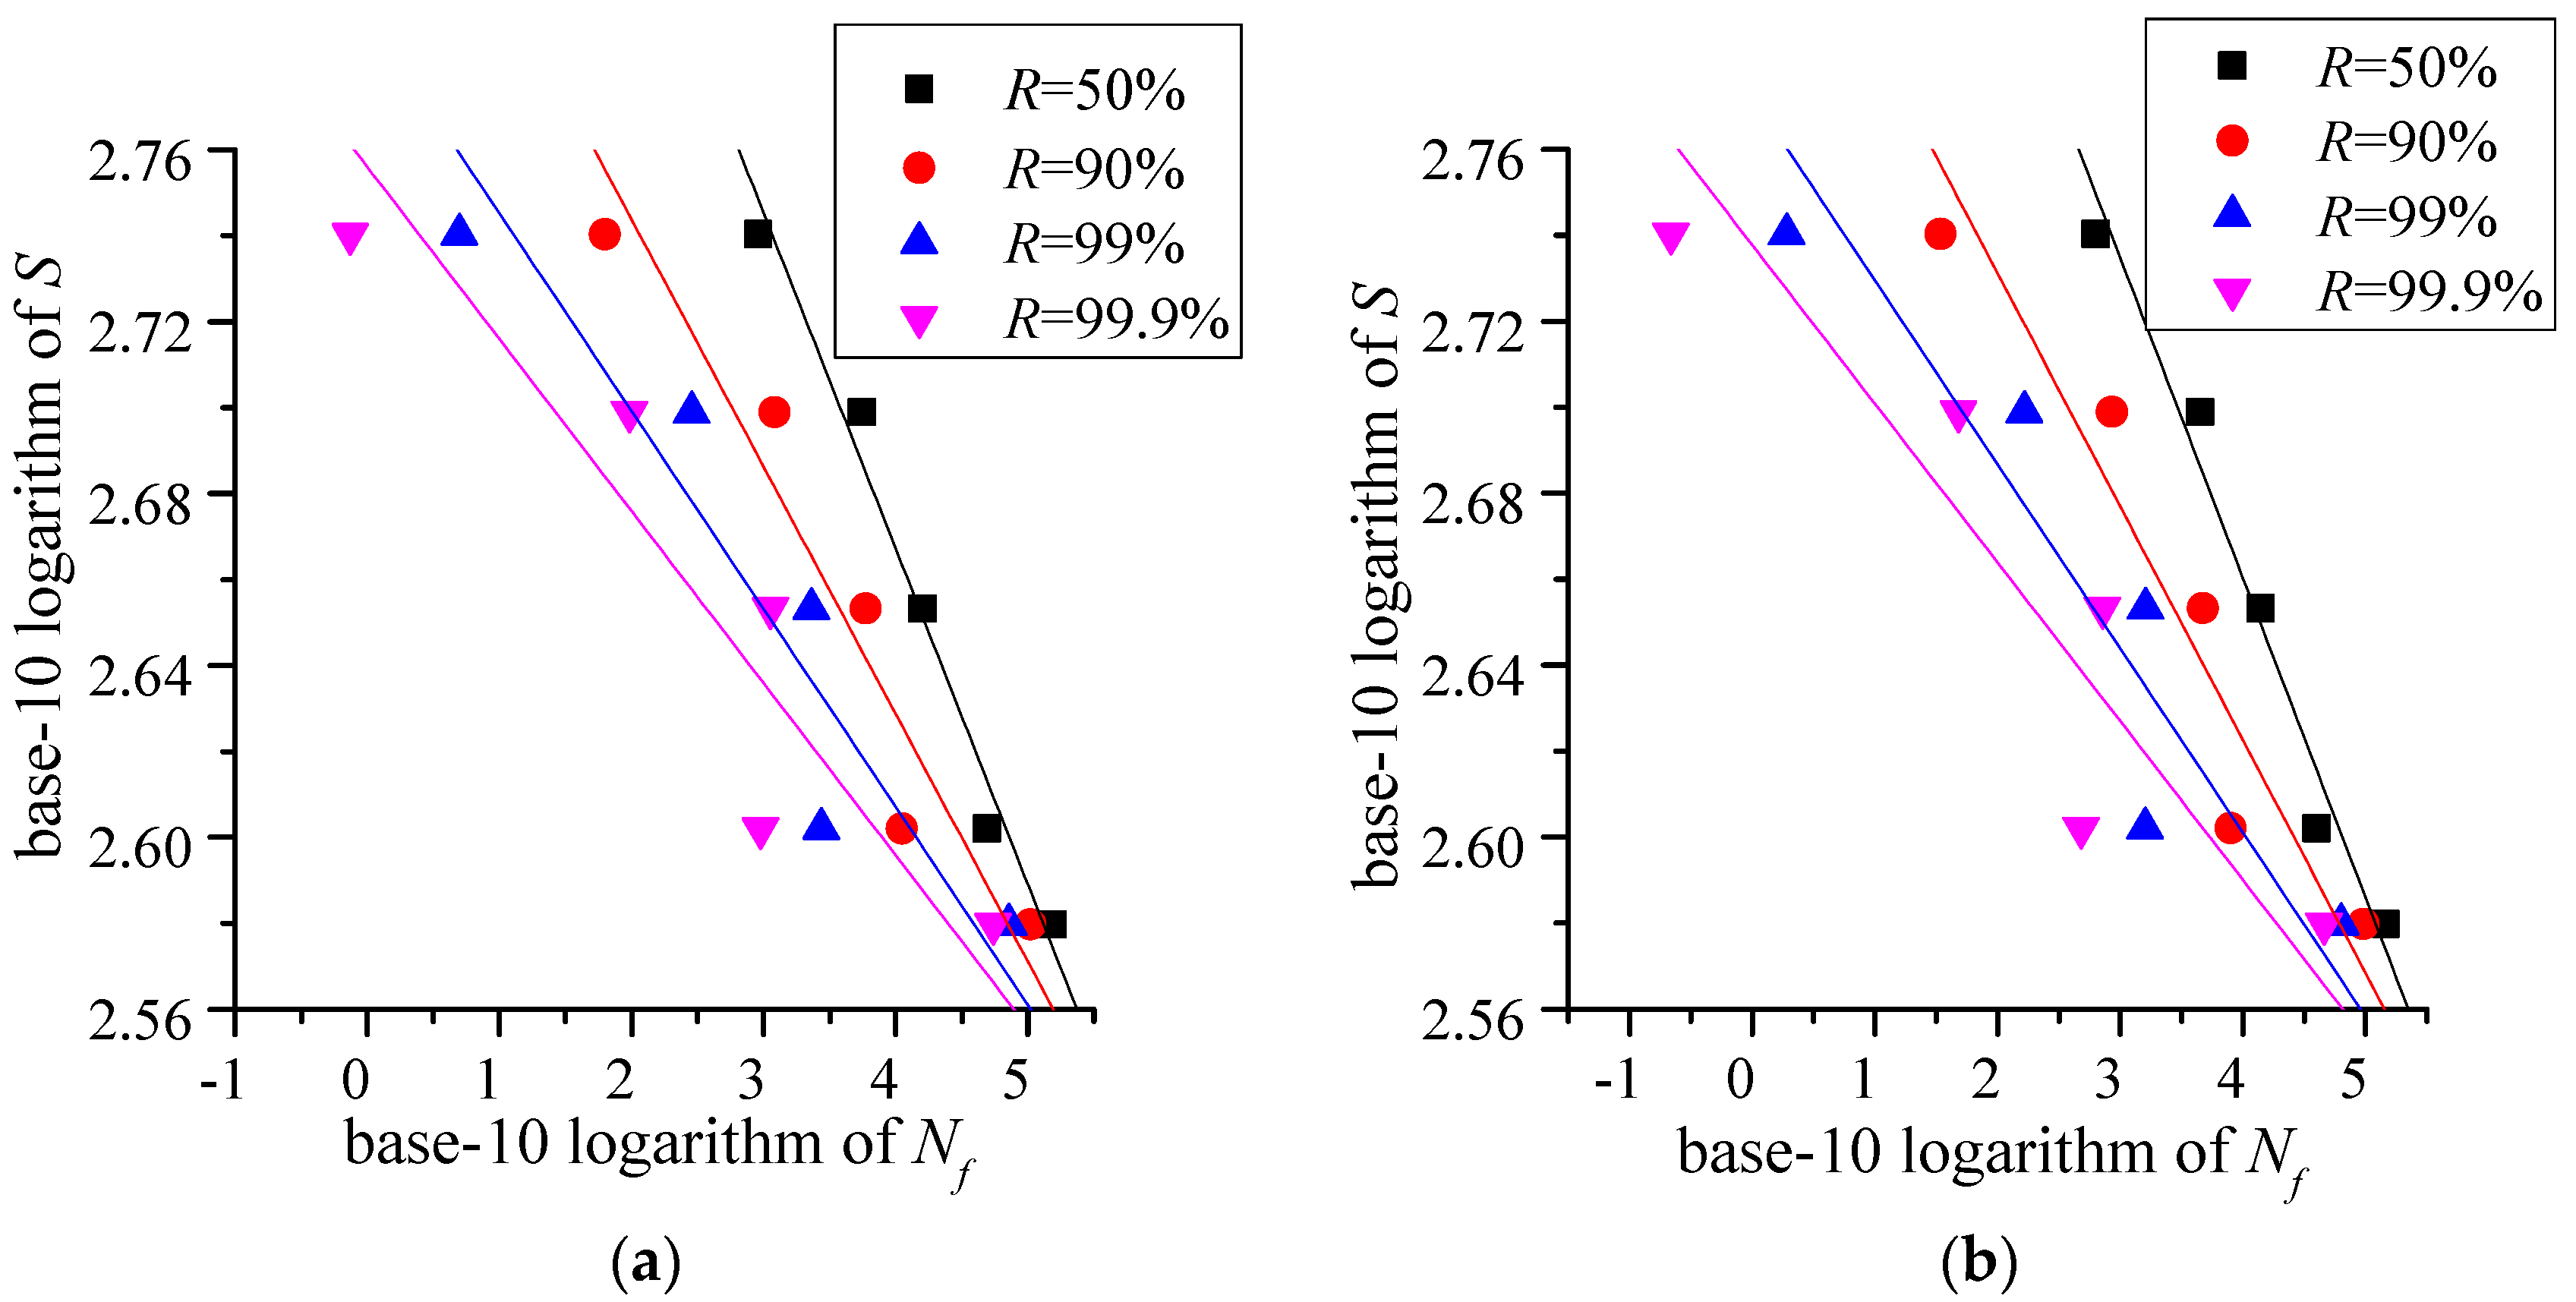
Figure 7.
The P-S-N curves with Ra = 0.8 μm and confidence level (a) ; and (b)

Figure 8.
The P-S-N curves with Ra = 1.6 μm and confidence level (a) ; and (b)

Figure 9.
Estimated mean fatigue life curves and the experiment values.


Table 1.
Chemical composition of the medium-carbon steel.
| Element | C | Cr | Mo | Si | Mn | S | P | Ni |
|---|---|---|---|---|---|---|---|---|
| Weight (%) | 0.44 | 0.04 | 0.02 | 0.23 | 0.57 | 0.016 | 0.024 | 0.002 |
Table 2.
Mechanical properties of the medium carbon steel.
| Tensile Strength (MPa) | Yield Strength (MPa) | Elongation at Break (%) |
|---|---|---|
| 710 | 490 | 19.17 |
Table 3.
Material constants with the different average surface roughness.
| Average Surface Roughness (μm) | n | c |
|---|---|---|
| Ra = 0.4 | 9.84 | 4.56 × 1030 |
| Ra = 0.8 | 9.44 | 3.16 × 1029 |
| Ra = 1.6 | 9.80 | 2.32 × 1030 |
Table 4.
Parameters of P-S-N curves with Ra = 0.4 μm.
| R (%) | 50 | 90 | 99 | 99.9 | Parameters | |
|---|---|---|---|---|---|---|
| (%) | ||||||
| 95 | 40.7137 | 54.1796 | 66.9757 | 76.5668 | a1 | |
| −13.9865 | −19.3591 | −24.4740 | −28.3078 | a2 | ||
| 99 | 42.5752 | 57.2561 | 71.7960 | 82.7595 | a1 | |
| −14.7206 | −20.5889 | −26.4008 | −30.7832 | a2 | ||
Table 5.
Parameters of P-S-N with Ra = 0.8 μm.
| R (%) | 50 | 90 | 99 | 99.9 | Parameters | |
|---|---|---|---|---|---|---|
| (%) | ||||||
| 95 | 28.6827 | 29.3268 | 29.9388 | 30.3976 | a1 | |
| −9.4241 | −10.1261 | −10.7931 | −11.2931 | a2 | ||
| 99 | 28.7717 | 29.4739 | 30.1694 | 30.6938 | a1 | |
| −9.5212 | −10.2864 | −11.0444 | −11.6159 | a2 | ||
Table 6.
Parameters of P-S-N curves with Ra = 1.6 μm.
| R (%) | 50 | 90 | 99 | 99.9 | Parameters | |
|---|---|---|---|---|---|---|
| (%) | ||||||
| 95 | 34.0511 | 39.5910 | 44.8554 | 48.8012 | a1 | |
| −11.4174 | −13.8578 | −16.1769 | −17.9151 | a2 | ||
| 99 | 34.8170 | 40.8567 | 46.8385 | 51.3489 | a1 | |
| −11.7547 | −14.4154 | −17.0504 | −19.0374 | a2 | ||
Table 7.
Material constants C and n in Equation (11) with different average surface roughness.
| Average Surface Roughness (μm) | n | C |
|---|---|---|
| Ra = 0.4 | 9.84 | 4.11 × 10⁻³⁴ |
| Ra = 0.8 | 9.44 | 4.81 × 10⁻³⁴ |
| Ra = 1.6 | 9.80 | 3.02 × 10−36 |
Table 8.
Validation experiment results.
| Average Surface Roughness (μm) | Stress Amplitude | Estimated Fatigue Life | Experimental Fatigue Life | Mean of Experimental Fatigue Life | Error |
|---|---|---|---|---|---|
| Ra = 0.4 | 420 MPa | 72,420 | 70,569 | 73,863 | 1.99% |
| 77,156 | |||||
| Ra = 0.8 | 56,060 | 57,824 | 51,120 | 8.81% | |
| 44,416 | |||||
| Ra = 1.6 | 45,190 | 66,174 | 52,345 | 15.83% | |
| 38,516 |
© 2017 by the authors. Licensee MDPI, Basel, Switzerland. This article is an open access article distributed under the terms and conditions of the Creative Commons Attribution (CC BY) license (http://creativecommons.org/licenses/by/4.0/).
Share and Cite
MDPI and ACS Style
Li, C.; Dai, W.; Duan, F.; Zhang, Y.; He, D. Fatigue Life Estimation of Medium-Carbon Steel with Different Surface Roughness. Appl. Sci. 2017, 7, 338. https://doi.org/10.3390/app7040338
AMA Style
Li C, Dai W, Duan F, Zhang Y, He D. Fatigue Life Estimation of Medium-Carbon Steel with Different Surface Roughness. Applied Sciences. 2017; 7(4):338. https://doi.org/10.3390/app7040338
Chicago/Turabian StyleLi, Changyou, Weibing Dai, Fei Duan, Yimin Zhang, and David He. 2017. "Fatigue Life Estimation of Medium-Carbon Steel with Different Surface Roughness" Applied Sciences 7, no. 4: 338. https://doi.org/10.3390/app7040338
Note that from the first issue of 2016, this journal uses article numbers instead of page numbers. See further details here.