
Performance Analysis of a Fluidic Axial Oscillation Tool for Friction Reduction with the Absence of a Throttling Plate

1
Key Laboratory of Ministry of Land and Resources on Complicated Conditions DrillingTechnology, Jilin University, Changchun 130026, China
2
College of Construction Engineering, Jilin University, Changchun 130026, China
3
Engineering and Technology Research Institute, CNPC Bohai Drilling Engineering Company Limited, Tianjin 300280, China
*
Author to whom correspondence should be addressed.
Appl. Sci. 2017, 7(4), 360; https://doi.org/10.3390/app7040360
Submission received: 13 January 2017
/
Revised: 29 March 2017
/
Accepted: 30 March 2017
/
Published: 5 April 2017
Abstract
:An axial oscillation tool is proved to be effective in solving problems associated with high friction and torque in the sliding drilling of a complex well. The fluidic axial oscillation tool, based on an output-fed bistable fluidic oscillator, is a type of axial oscillation tool which has become increasingly popular in recent years. The aim of this paper is to analyze the dynamic flow behavior of a fluidic axial oscillation tool with the absence of a throttling plate in order to evaluate its overall performance. In particular, the differences between the original design with a throttling plate and the current default design are profoundly analyzed, and an improvement is expected to be recorded for the latter. A commercial computational fluid dynamics code, Fluent, was used to predict the pressure drop and oscillation frequency of a fluidic axial oscillation tool. The results of the numerical simulations agree well with corresponding experimental results. A sufficient pressure pulse amplitude with a low pressure drop is desired in this study. Therefore, a relative pulse amplitude of pressure drop and displacement are introduced in our study. A comparison analysis between the two designs with and without a throttling plate indicates that when the supply flow rate is relatively low or higher than a certain value, the fluidic axial oscillation tool with a throttling plate exhibits a better performance; otherwise, the fluidic axial oscillation tool without a throttling plate seems to be a preferred alternative. In most of the operating circumstances in terms of the supply flow rate and pressure drop, the fluidic axial oscillation tool performs better than the original design.
1. Introduction
Drilling a structurally complex well, irrespective of whether it is a horizontal well, a directional well, an extended reach well, or a multilateral well, has become commonplace in the oil and natural gas industry, as companies seek to drill deeper and further optimize the oil and gas production in the target field [1,2,3]. As a result, the high frictional resistance of a drill-string against the borehole rock has become a concern in the drilling process [4,5,6]. This source of additional torque and drag will lead to a low rate of penetration (ROP), the wear of drilling tools, short runs, wellbore instability, and complex stress of the drill string, etc. [1]. In particular, wellbore instability sometimes leads to the pipe becoming stuck, which may require plugging and side tracking, significantly driving up the cost of reservoir development [7]. Moreover, the driller’s ability to maintain tool face control and to transfer weight to the bit can be severely limited because of the excessive friction, which limits the depth and accuracy of the drilled boreholes [1,8].
There are a series of methods and tools used for torque and drag reduction, and which ultimately allow the drill-string to drill to the total depth. Axial oscillation tools (AOTs) and lateral vibration tools (LVTs) are the two most common tools used to generate benign vibrations within the drill-string and/or bottom-hole assembly (BHA) to reduce friction [9]. AOTs usually employ sliding or rotating valves driven by mud to generate pressure pulses, and the pressure pulses can be converted into an axial oscillating motion by a shock tool that is run above or incorporated into the AOT [10]. LVTs usually employ eccentric rotating masses driven by mud to create a vibration between the borehole wall and the tool, thereby reducing friction. Both of these tools have been previously demonstrated to be effective, although AOTs exhibit a better performance than LVTs [9,11]. One of the most popular AOTs currently on the market is the Drilling Agitator System (DAS), which was developed by National Oilwell Varco® and was introduced into the market in 2002 [6,12,13]. It has been used for drilling practices in thousands of runs globally and has shown a clear improvement in drilling performance by reducing the drag and torque at the drill-string. The Friction Drag Reducer (FDR) tool is another AOT on the market which has been widely used for coiled tubing (CT) [14]. This tool is a double acting hydraulic cylinder, generating axial oscillation in the BHA by mechanical valves, causing a minor reciprocating movement. A representative LVT is the drag reduction tool based on a rotary-eccentric mass [15]. It can generate lateral vibration by the internal periodic rotation of an eccentric shaft driven by a screw motor. There are still some less common friction reduction tools on the market, such as the LoTADTM drilling system of Weatherford®, which is neither an AOT nor an LVT, using innovative rollers to minimize torque, drag, and tool-joint wear while drilling [16]. The Surface Acoustic Pulse Generator (SAPG) is another friction reduction tool, generating an intense pressure pulse by creating a water hammer in flowing mud at a location at the surface to vibrate the drill-string, resulting in a reduced torque requirement [17]. All of the friction reduction tools motioned above have been successfully used in numerous drilling engineering projects. However, due to the complicated structure with deformable or movable parts and the subsequent maintenance, technical difficulties associated with erosion, wear, and failures have slowed down the improvement of these tools and made it challenging to use them within practical applications.
By using a no-moving-component output-fed bistable fluidic oscillator to control fluid which alternatively flows into a parallel path where a piston moves forth and back, generating an intense pressure pulse by creating a water hammer at the stoke end of the piston, Liu [18] proposed a novel AOT, namely the fluidic axial oscillation tool(FAOT). Its feasibility in terms of its application to horizontal directional well drilling was verified by He et al. [19], by using CFD (Computational Fluid Dynamics) simulations and experimental tests. Because of the absence of any movable or deformable parts and the manufacture with an all-metal construction, the working life of an FAOT can be remarkably extended, exhibiting a resistance to high temperatures, corrosive environments, and other extreme ambient conditions. A number of field tests have shown that the drilling efficiency of FAOTs in directional well drilling can be improved by more than 50% (on average) compared with the conventional drilling method [20,21]. Moreover, this tool can work for more than 155 h without failure in a down-hole complex environment [21]. Therefore, FAOTs seem to be a promising solution to develop the new generation of friction reduction tools for the drilling process of a complex well.
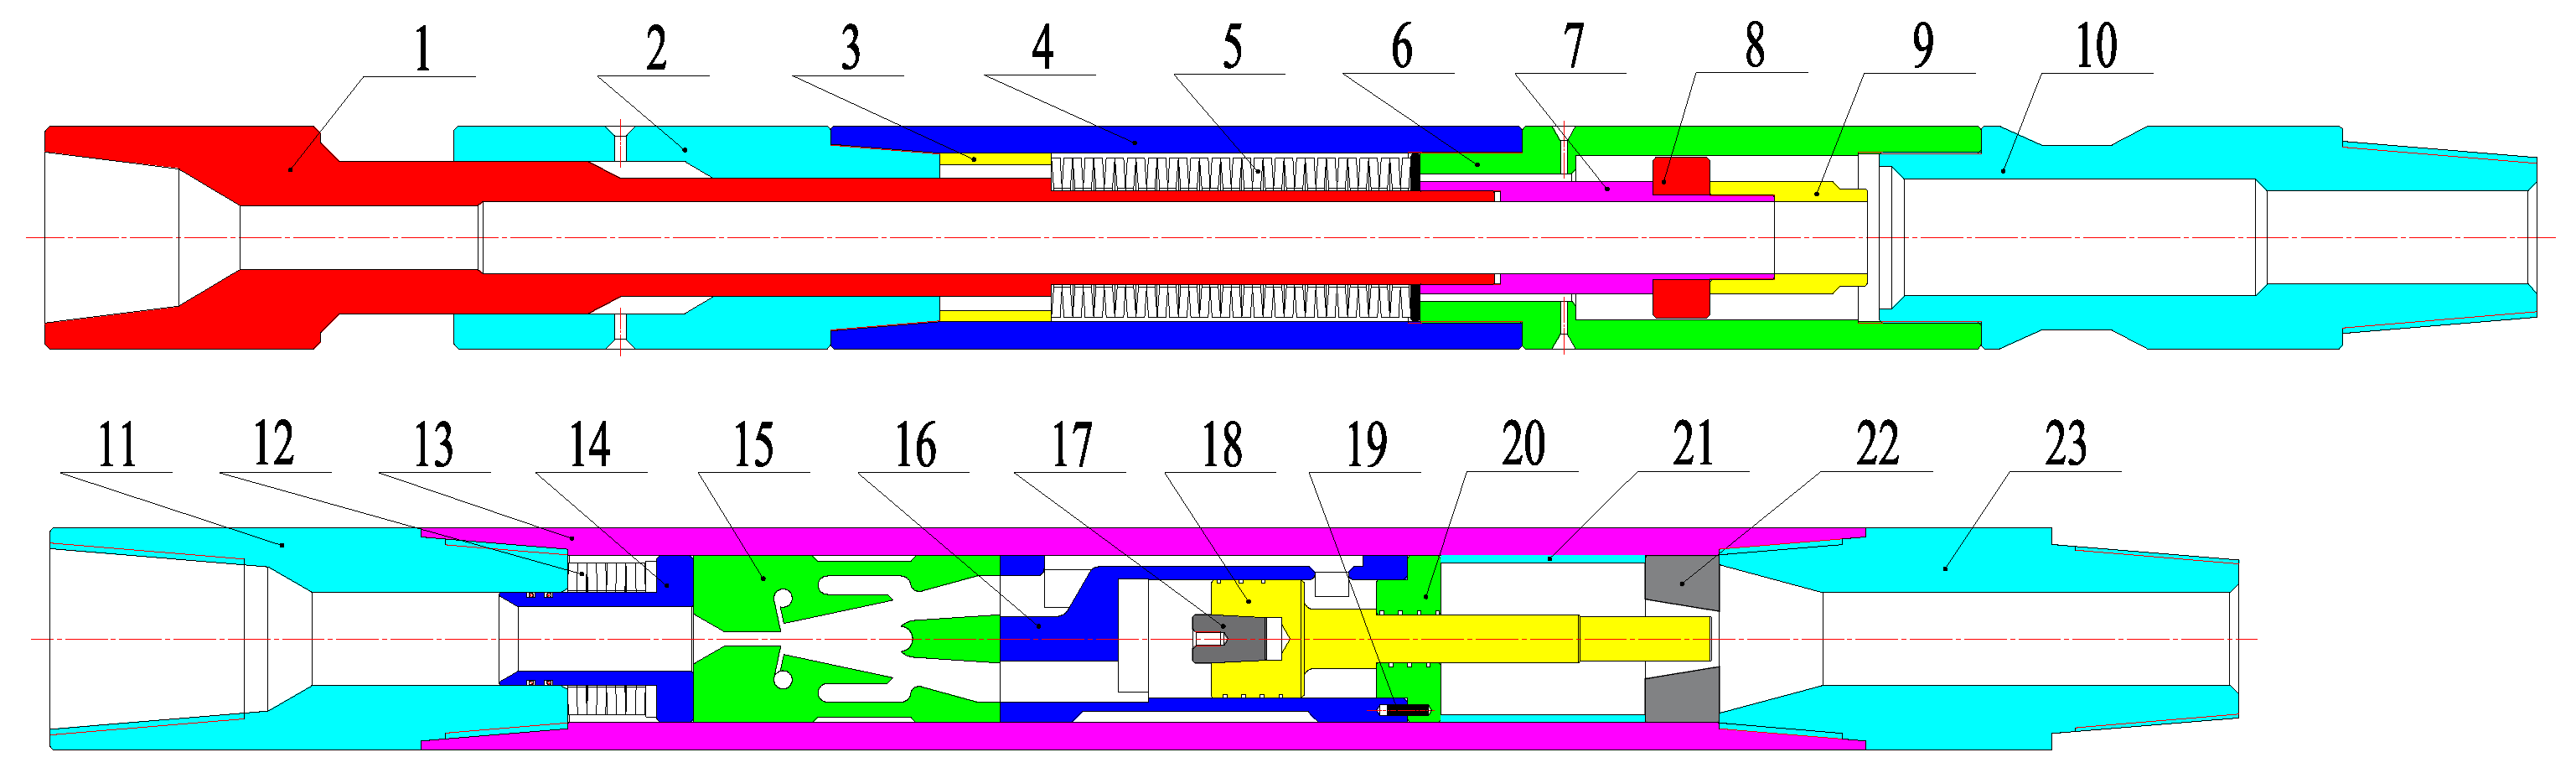
The FAOT is not a totally new design, as it seems to be an analogue of the fluidic hammer patented in the 1970s—based on an output-fed bistable fluidic oscillator—as discussed by Zhang et al. [22]. As presented in Figure 1, in the original design of an FAOT, a throttle plate was introduced into the pressure pulsation assembly to enhance the intensity of pressure pulsation. When the fluidic oscillator actuates the piston to move forth and back, cyclical restrictions are generated in the flow path as the piston rod passes over the taper hole of the throttle plate. The total flow area changes from the maximum to minimum value, generating the desired pressure pulses which can be superimposed on the pressure pulses generated in the working chamber caused by the sudden stop of the piston. Following this, the superimposed pressure pulses propagate to the axial oscillation assembly, where they are converted into an axial oscillating motion. However, this specially designed structure may be questionable or even counterproductive, as it can also serve as a cushion which may buffer the forward movement of the piston, resulting in a lower stroke end velocity of the piston. According to Joukowsky’s law [23], the produced water hammer pressure is proportional to the stroke end velocity of the piston (ignoring the velocity rebounded), which implies that a lower stroke end velocity leads to weaker pressure pulses being generated in the working chamber. This impairment may be stronger than the enhancement of the synergistic effect, or at least counteract it to some extent. Besides, an additional pressure drop caused by this throttling structure is not desired. Therefore, the performance analysis of an FAOT with the absence of a throttling plate is meaningful and poses some possibilities for making improvements.
2. Numerical Simulations
By means of CFD approaches, performance analyses of a fluidic hammer which is analogous to the FAOT was investigated by Zhang et al. [22]. With the help of CFD dynamic mesh modeling, the velocity distribution of the flow domain in a fluidic hammer was described in detail, and the attachment and detachment process of the supply jet was numerically modeled [24]. By using CFD simulations, the effect of the geometric parameters of the bistable fluidic oscillator on its threshold flow velocity was investigated by Peng et al. [25]. Besides, there are also many other fluidic devices that have been numerically investigated by using CFD simulations and have retained a high level of predictive accuracy [26,27,28].
The fluidic axial oscillation tool in this study was a follow-up study of He et al. [19], where the FAOT was experimentally studied and numerically analyzed by CFD simulations. The present study is intended to computationally investigate the pressure drop and oscillation frequency of the FAOT.
2.1. Computational Domain and Boundary Conditions
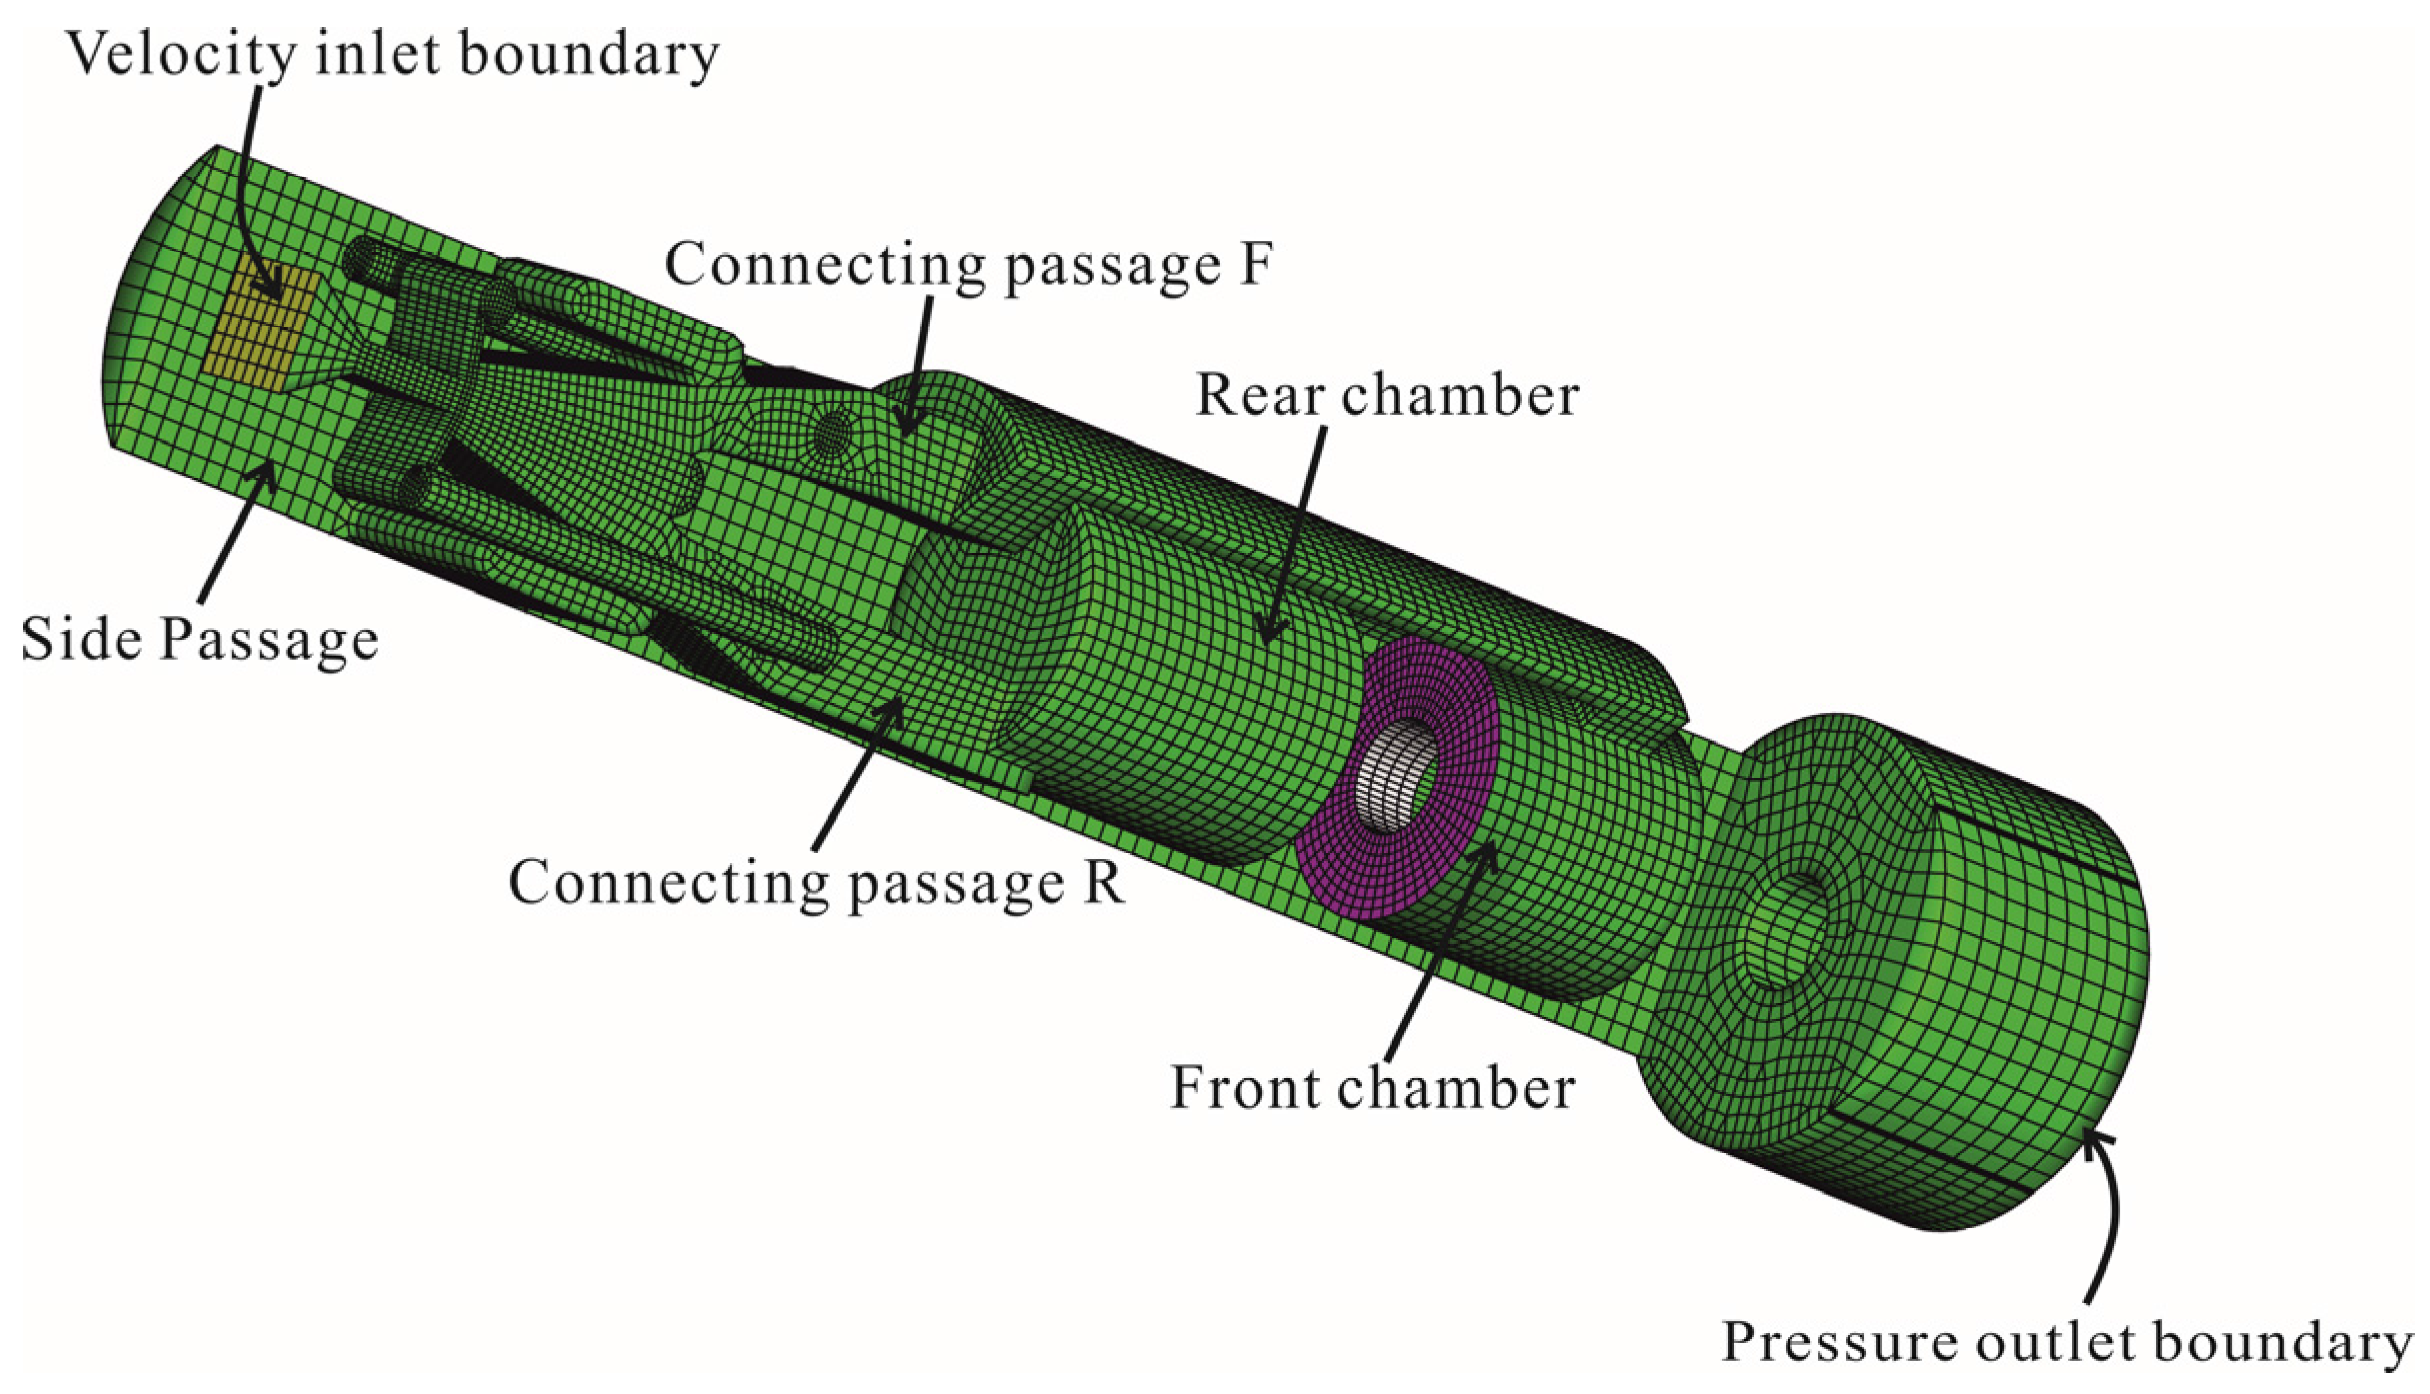
The computational flow domain of a typical FAOT includes the flow field of a fluidic oscillator, the front and rear chambers of the cylinder, the connecting passage F connected with the front chamber, the connecting passage R connected with the rear chamber, the flow field in front of the cylinder lid, and the side passages connecting to the vents and the flow field in front of the cylinder lid. A typical computational domain, as presented in Figure 2, consists of around 80,000 cells and is generated in such a way that nearly all the features of the FAOT can be reflected. Note that one of the side passages was masked in Figure 2, in order to visualize the partial structures of the computational domain. The computational domain is a fine, mapped grid, moderately clustered in the interaction region of the fluidic oscillator.
Figure 2 also indicates the imposed boundary conditions of the computational domain. A velocity inlet boundary condition was adopted at the inlet of the fluidic oscillator, and a pressure outlet boundary was applied at the bottom face of the flow domain in front of the cylinder lid. The pressure outlet boundary condition was set to atmospheric pressure, corresponding to the operating conditions in the experimental tests. Besides, the no-slip boundary conditions were imposed upon all the walls.
2.2. Dynamic Mesh and Solver Settings
The flow solver used in this study is the commercial solver FLUENT® (Release 6.3.26, Ansys Inc., Pittsburgh, PA, USA), based on the finite volume, by which the continuity equation and the Navier–Stokes equations are solved using iterative methods. The convective terms are calculated by the use of an upwind first-order-accurate differencing scheme based on the well-known SIMPLE (Semi-Implicit Method for Pressure-Linked Equations) method.
The dynamic mesh modeling method in this simulation is almost the same as that used in He et al. [19]. The only difference is that the sliding interfaces described in Ref. [19] are not used to connect the moving and static parts of the computational domain in this study, as the throttling plate is removed. The so-called User-Defined-Functions (UDFs) are employed to update the positions of the moving mesh in the simulations and the governing equations for the movement of the piston are presented in Peng et al. [29]. However, the gravity of the piston is not included in the current UDFs definition, as this study focuses on horizontal well drilling and the corresponding experimental tests were carried out on level ground. Details of the other relevant settings involved in this procedure can be found in He et al. [19], and will thus not be repeated here.
2.3. Time-Step and Grid Independence
The time step per iteration is appropriately selected to obtain details of the switching process of the supply jet and should be short enough to describe the movement with desired precision. It should be noted that divergence problems may occur when the time step is increased too much, since the moving grid is sensitive to the scale of the time step. According to the previous computational results, the time step of 1E-4 is reasonable for the current simulations [22,25,29].
On the other hand, a fine grid (around 120,000) and a coarser grid (around 50,000 cells) have been created to investigate the grid independence. As shown in Table 1, the maximum difference between all of the obtained results was less than 6%. It has been observed that even the coarse grid can provide a sufficient grid independency. Considering the reasonable computational time and the satisfactory model accuracy, the original computational model is indicated to be adequate.
3. Experimental Apparatus and Approach
The original design of the FAOT with a throttling plate is here described as the LFT design and the present focused case with the absence of a throttling plate is described as the ZFT design. An LFT tool with a 120 mm diameter was manufactured, and subsequently, a ZFT could be modified from the LFT. As displayed in Figure 3, in order to experimentally evaluate the working performance of an FAOT, three pressure transducers (Sensata Technologies, Inc., Attleboro, MA, USA) with the same specifications were used to sense the pressure fluctuation at three different positions of the oscillation tool, i.e., (i) the inlet of the fluidic oscillator; (ii) one of the side passages; and (iii) the front chamber of the cylinder. Besides, a displacement transducer (Sensata Technologies, Inc., Attleboro, MA, USA) was mounted on the sleeve to measure the amplitude of axial oscillation. All of the experimental tests were carried out on level ground and the drilling mud in the experiments was the conventional drilling fluid successfully used in directional well drilling. The tested FAOT was driven by a high pressure truck-mounted pump (Yantai Jereh Oilfield Services Group Co., Ltd., Yantai, China), which supplied it with drilling mud. Various quantities (volume flow rate, QV) of drilling fluid were supplied to the fluidic oscillator, to drive the oscillation tool to work. As depicted in Figure 3, both the pressure and displacement at the measuring positions of the oscillation tool were acquired and recorded by a data acquisition system. The statistic of the measured pressure and displacement spectrum was 0.5%, at a 95% confidence level. In the end, the received data were analyzed and displayed by a computer.
In order to study the performance of the fluidic axial oscillation tool with the absence of a throttling plate and try to figure out the differences between the ZFT and LFT designs, a comparison analysis in terms of the pressure drop, oscillation amplitude, and pressure fluctuations in the measured positions between the two designs was performed by the experimental system. In addition, the oscillation frequency and the dependence between the supplied volume flow rate and the oscillation frequency are also some of our main concerns.
4. Results and Discussion
Figure 4 illustrates the measured pressure P (static pressure) at three different positions of a ZFT versus the measuring time T when the supply volume flow rate QV was 16 L/s. As displayed, periodic pressure pulses were produced at (i), (ii), and (iii), respectively. Both of the pressure values and the pulse amplitude measured at (i) were larger than that at (ii) and (iii), and the pressure values at (iii) were the smallest. However, in the study of He et al. [19], the pressure values at the front chamber (iii) were larger than the pressure at the side passage. This difference is caused by the throttling action of the throttling plate, which raised the pressure in the front chamber to a certain level. In our study, we focus more on the pressure at (i), as this is the direct power actuating the oscillation assembly to implement oscillation movement. Besides, if we use the pressure at the outlet of the oscillation tool as the reference for the evaluation of pressure difference and ignore the kinetic energy at the inlet of the fluidic oscillator, the pressure drop of the system is equal to the pressure measured at (i). The pulse amplitude of pressure drop A is defined as:
where Pmax and Pmin are the maximum and minimum of the pressure at (i), respectively. Additionally, Pmea is the mean value of the pressure drop (mean value of the pressure drop in a working cycle) of the system. Another dimensionless performance index is defined as the relative pulse amplitude of pressure drop AP', which can be calculated from:
AP = Pmax − Pmin
AP′ = AP/Pmea
A larger pulse amplitude AP implies a stronger ability of pressure pulse production and a smaller mean pressure drop Pmea implies lower system power consumption. Combining both AP and Pmea, it can be concluded that an FAOT exhibits a better performance at a higher value of relative pulse amplitude AP′.
In order to investigate the working process of a ZFT, a unit (cycle) of pressure fluctuation (curve i) is divided into four sections by five highlighted circles corresponding to four working states of the fluidic oscillation tool. At the a-b state, the value of pressure drop P decreases with increasing time T and reaches the minimum at b; this phenomenon conforms to the case when the piston is moving forward and the main jet is attached to the attachment wall flowing to the rear chamber of the cylinder. This is because, while the piston is moving forward, its velocity increases with the increase of time, which leads to an increase of flow recovery. An increased flow recovery means a lower hydraulic resistance downstream of the output channel connected to the rear chamber, as issuing flow can easily enter the working chamber of the cylinder. Therefore, a decrease of pressure drop will be obtained. Because of the existence of the piston rod, the liquid action area of the rear chamber is larger than that of the front chamber, and the forward stroke end velocity of the piston is greater than the backward stroke end velocity. That is why the pressure drop at d is higher than b, and the state of c-d should be the case when the piston is moving backward. The subsequent state of b-c represents the jet switching process which occurred at the forward stroke end of the piston. A pressure pulse caused by the sudden stop of the piston is produced and the value of P reaches the maximum at c. Analogously, the d-e state corresponds to the jet switching process when the piston moves to the backward stroke end and is rebounded to move forward again. It can be found that per unit of pressure fluctuation includes two pulses—one large and one small. The pressure value at e (or a) is smaller than c, which can be attributed to the fact that the forward stroke end velocity is faster than the backward stroke end velocity, resulting in a higher water hammer pressure. As displayed in Figure 4, corresponding velocity contours of the computed flow fields are presented to describe the four working states of the fluidic oscillation tool.
Figure 5 compares the numerical data of the mean pressure drop and oscillation frequency with the experimental data. The data of the numerical and experimental mean pressure drop and oscillation frequency are almost identical, where only a slight difference is noticed, and the difference does not exceed 15%, showing considerable agreement between the results. The data obtained by the CFD simulations are slightly larger than those of the experimental tests. This is probably due to the fact that the leakage and frictional force were ignored in the numerical simulations.
Figure 6 shows the comparison of variation of pressure drop P with time T, between LFT and ZFT. It indicates that the pressure pulse amplitude increases when increasing the supply flow rate. When the supply flow rate is at a given constant value, the pressure drop of the ZFT will be lower than that of the LFT. The absence of the throttling plate effectively minimizes the pressure drop of an FAOT, and at the same time, the pressure pulse amplitude AP of the ZFT does not absolutely decline, but even increases compared with the LFT.
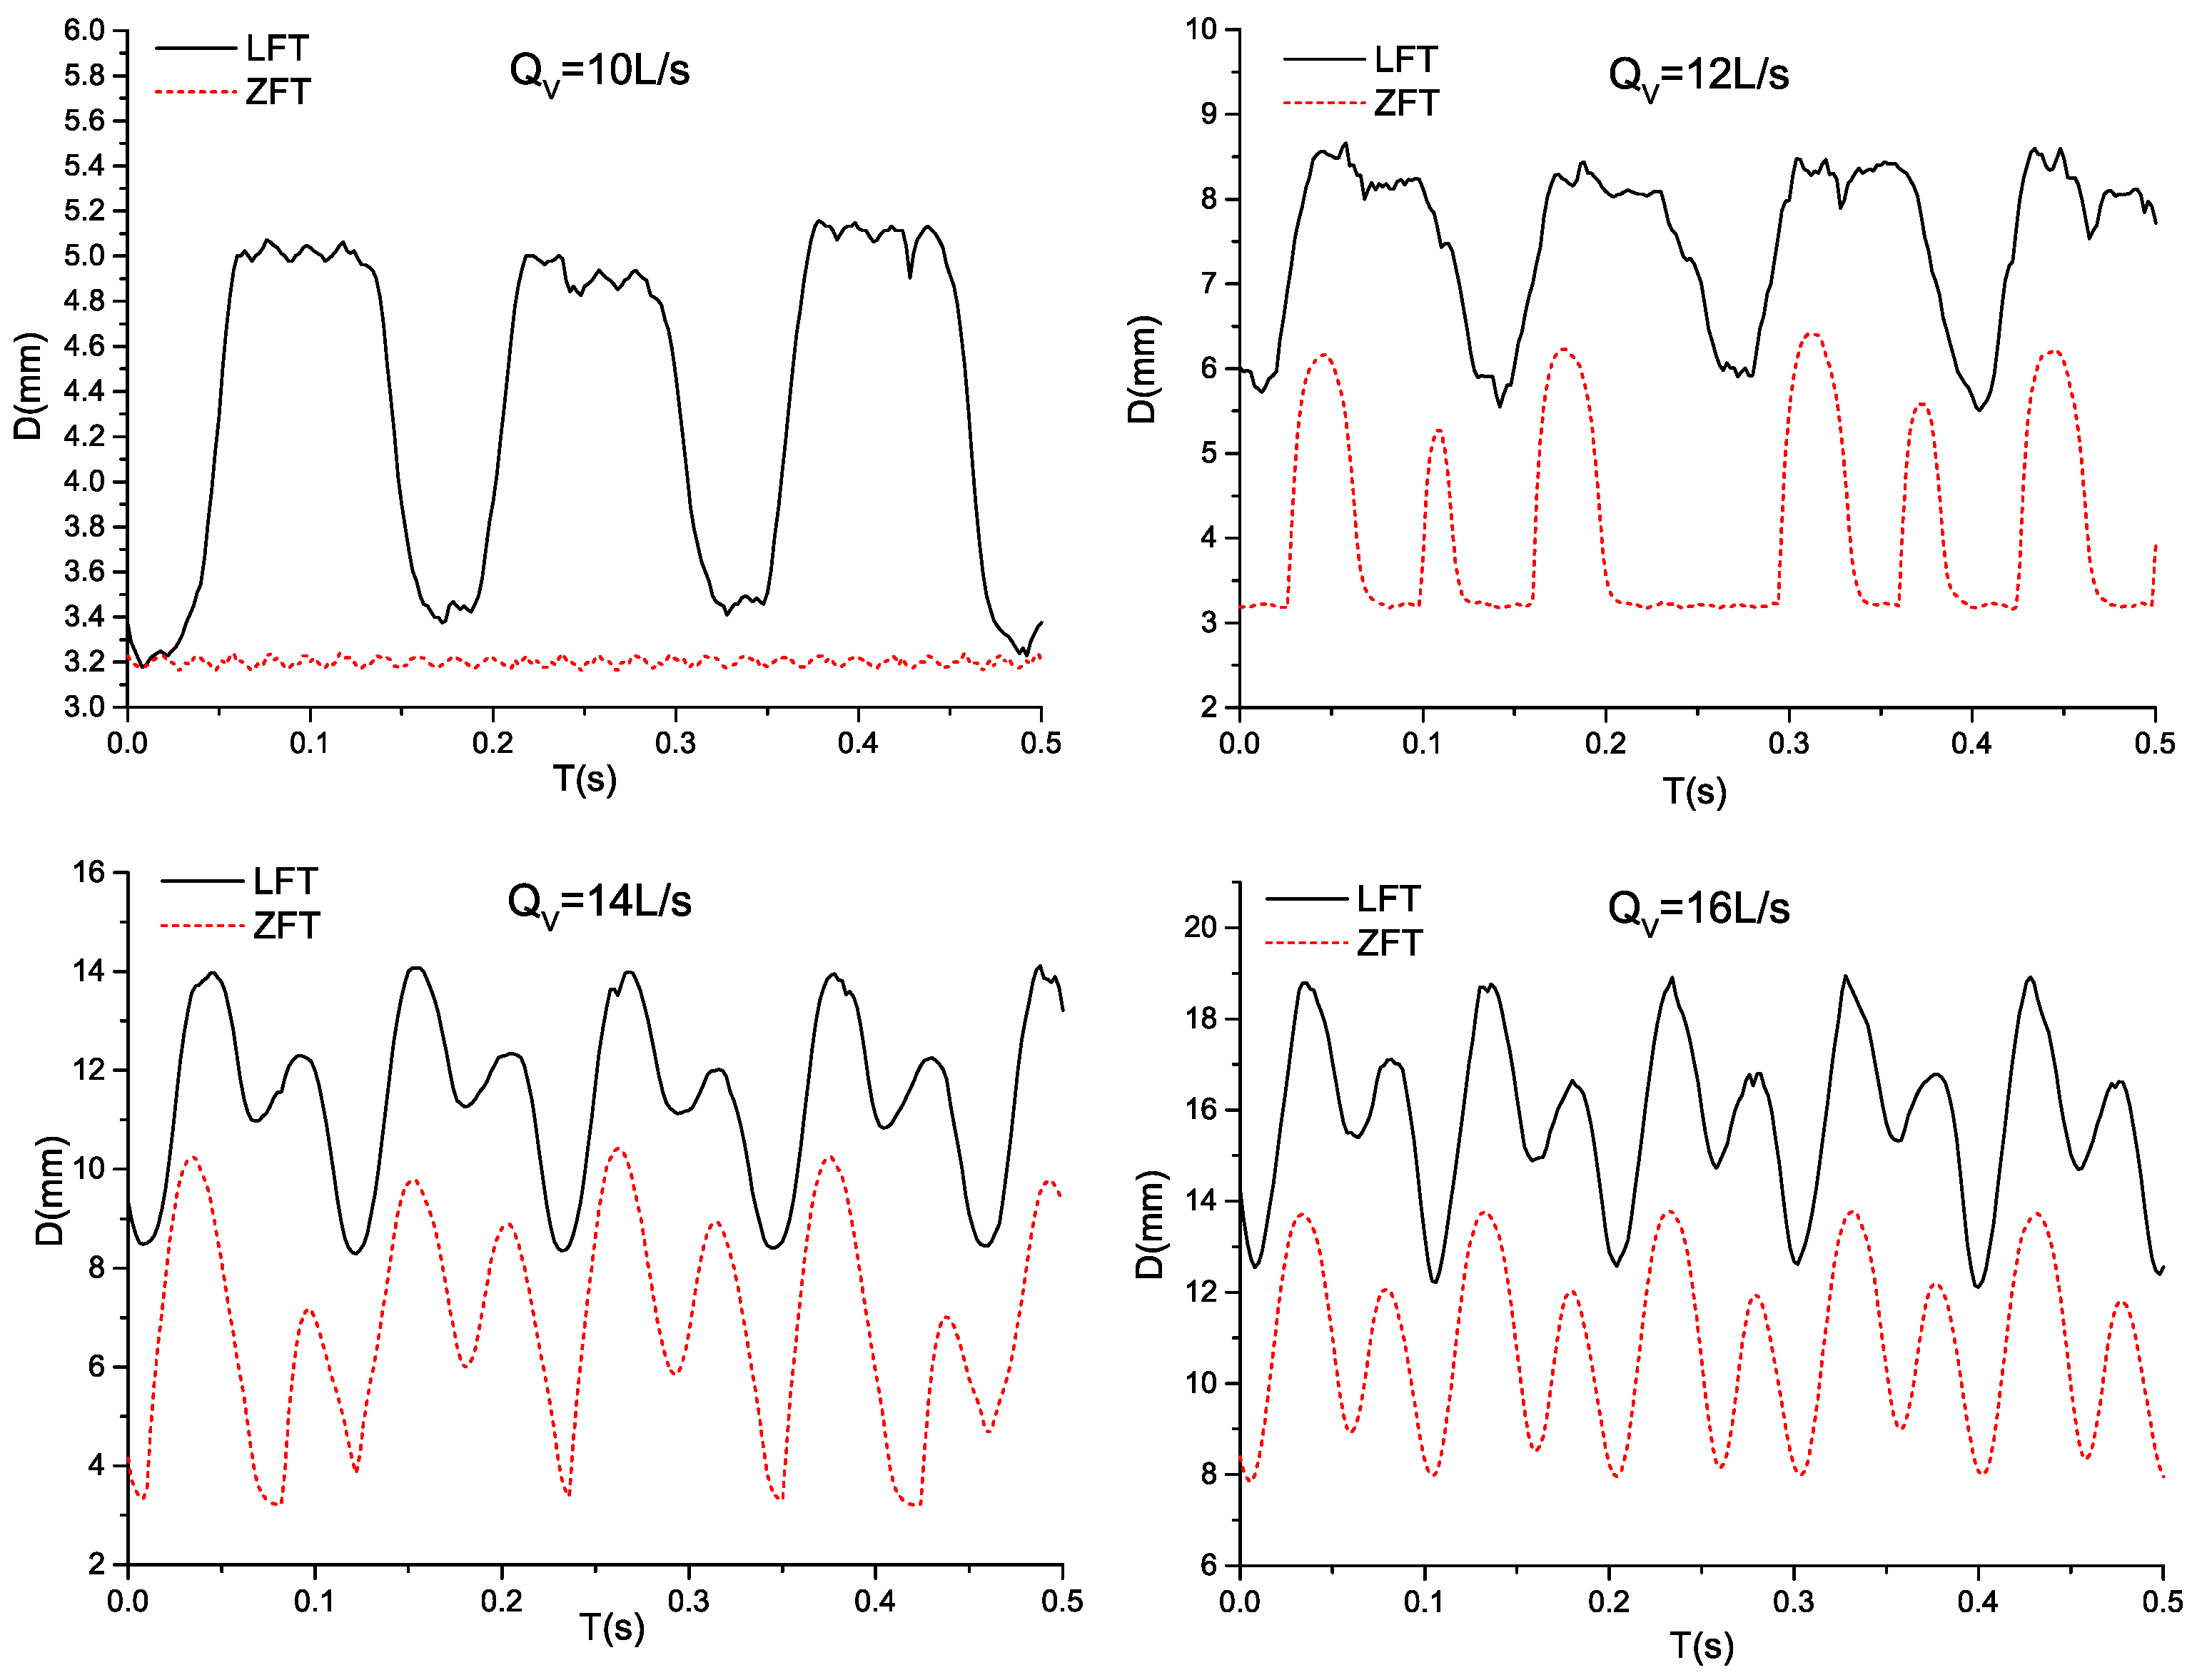
Figure 7 provides the variation of measured displacement D with time T for different supply volume flow rates QV. The oscillation motion of an FAOT is quantified by the measured displacement D which is nearly proportional to the pressure measured at (i). As illustrated in Figure 7, when QV = 10 L/s, the measured displacement for ZFT is hovering in a narrow range around a certain value of about 3.2 mm, while the displacement of LFT exhibits relatively obvious fluctuations. The reason for this is that the ZFT the pressure at (i) is not strong enough to prevail over the pre-tightening force of the disc springs (Numbering 5 in Figure 1), thus the oscillation motion of the mandrel is not distinguished. Besides, in another case when QV = 12 L/s, the measured displacement for ZFT levels off to a steady value (about 3.2 mm), which is maintained in the bottom of the curve. Hence, it can be inferred that the initial value of the displacement transducer is about 3.2 mm. In addition, similar variation trends of displacements are obtained in the cases when QV = 14 L/sand QV = 16 L/s. In these cases, there exists two pulses of displacement in a cycle, which coincides with the variable pressure drop displayed in Figure 6. Therefore, the frequency of pulses is double the oscillation frequency of the fluidic oscillator. In order to sufficiently generate benign oscillations and to minimize the impact on the Measurements While Drilling (MWD) and Logging While Drilling (LWD) tools, the pulse frequency is encouraged to be limited to 10 per second [1]. According to the study of Zhang et al. [22], increasing the diameter of the piston rod will significantly reduce the backward stroke end velocity of the piston, thus decreasing the amplitude of the smaller pulse, as displayed in Figure 6. Moreover, when the liquid force caused by the decreased pressure pulse is lower than the pre-tightening force of the disc springs, the pulse frequency of the displacement will be consistent with the oscillation frequency of the fluidic oscillator, which is about 5~10 Hz. In addition, comparing Figure 6 and Figure 7, it can be found that the variation of displacements lags behind the pressure measured at (i).
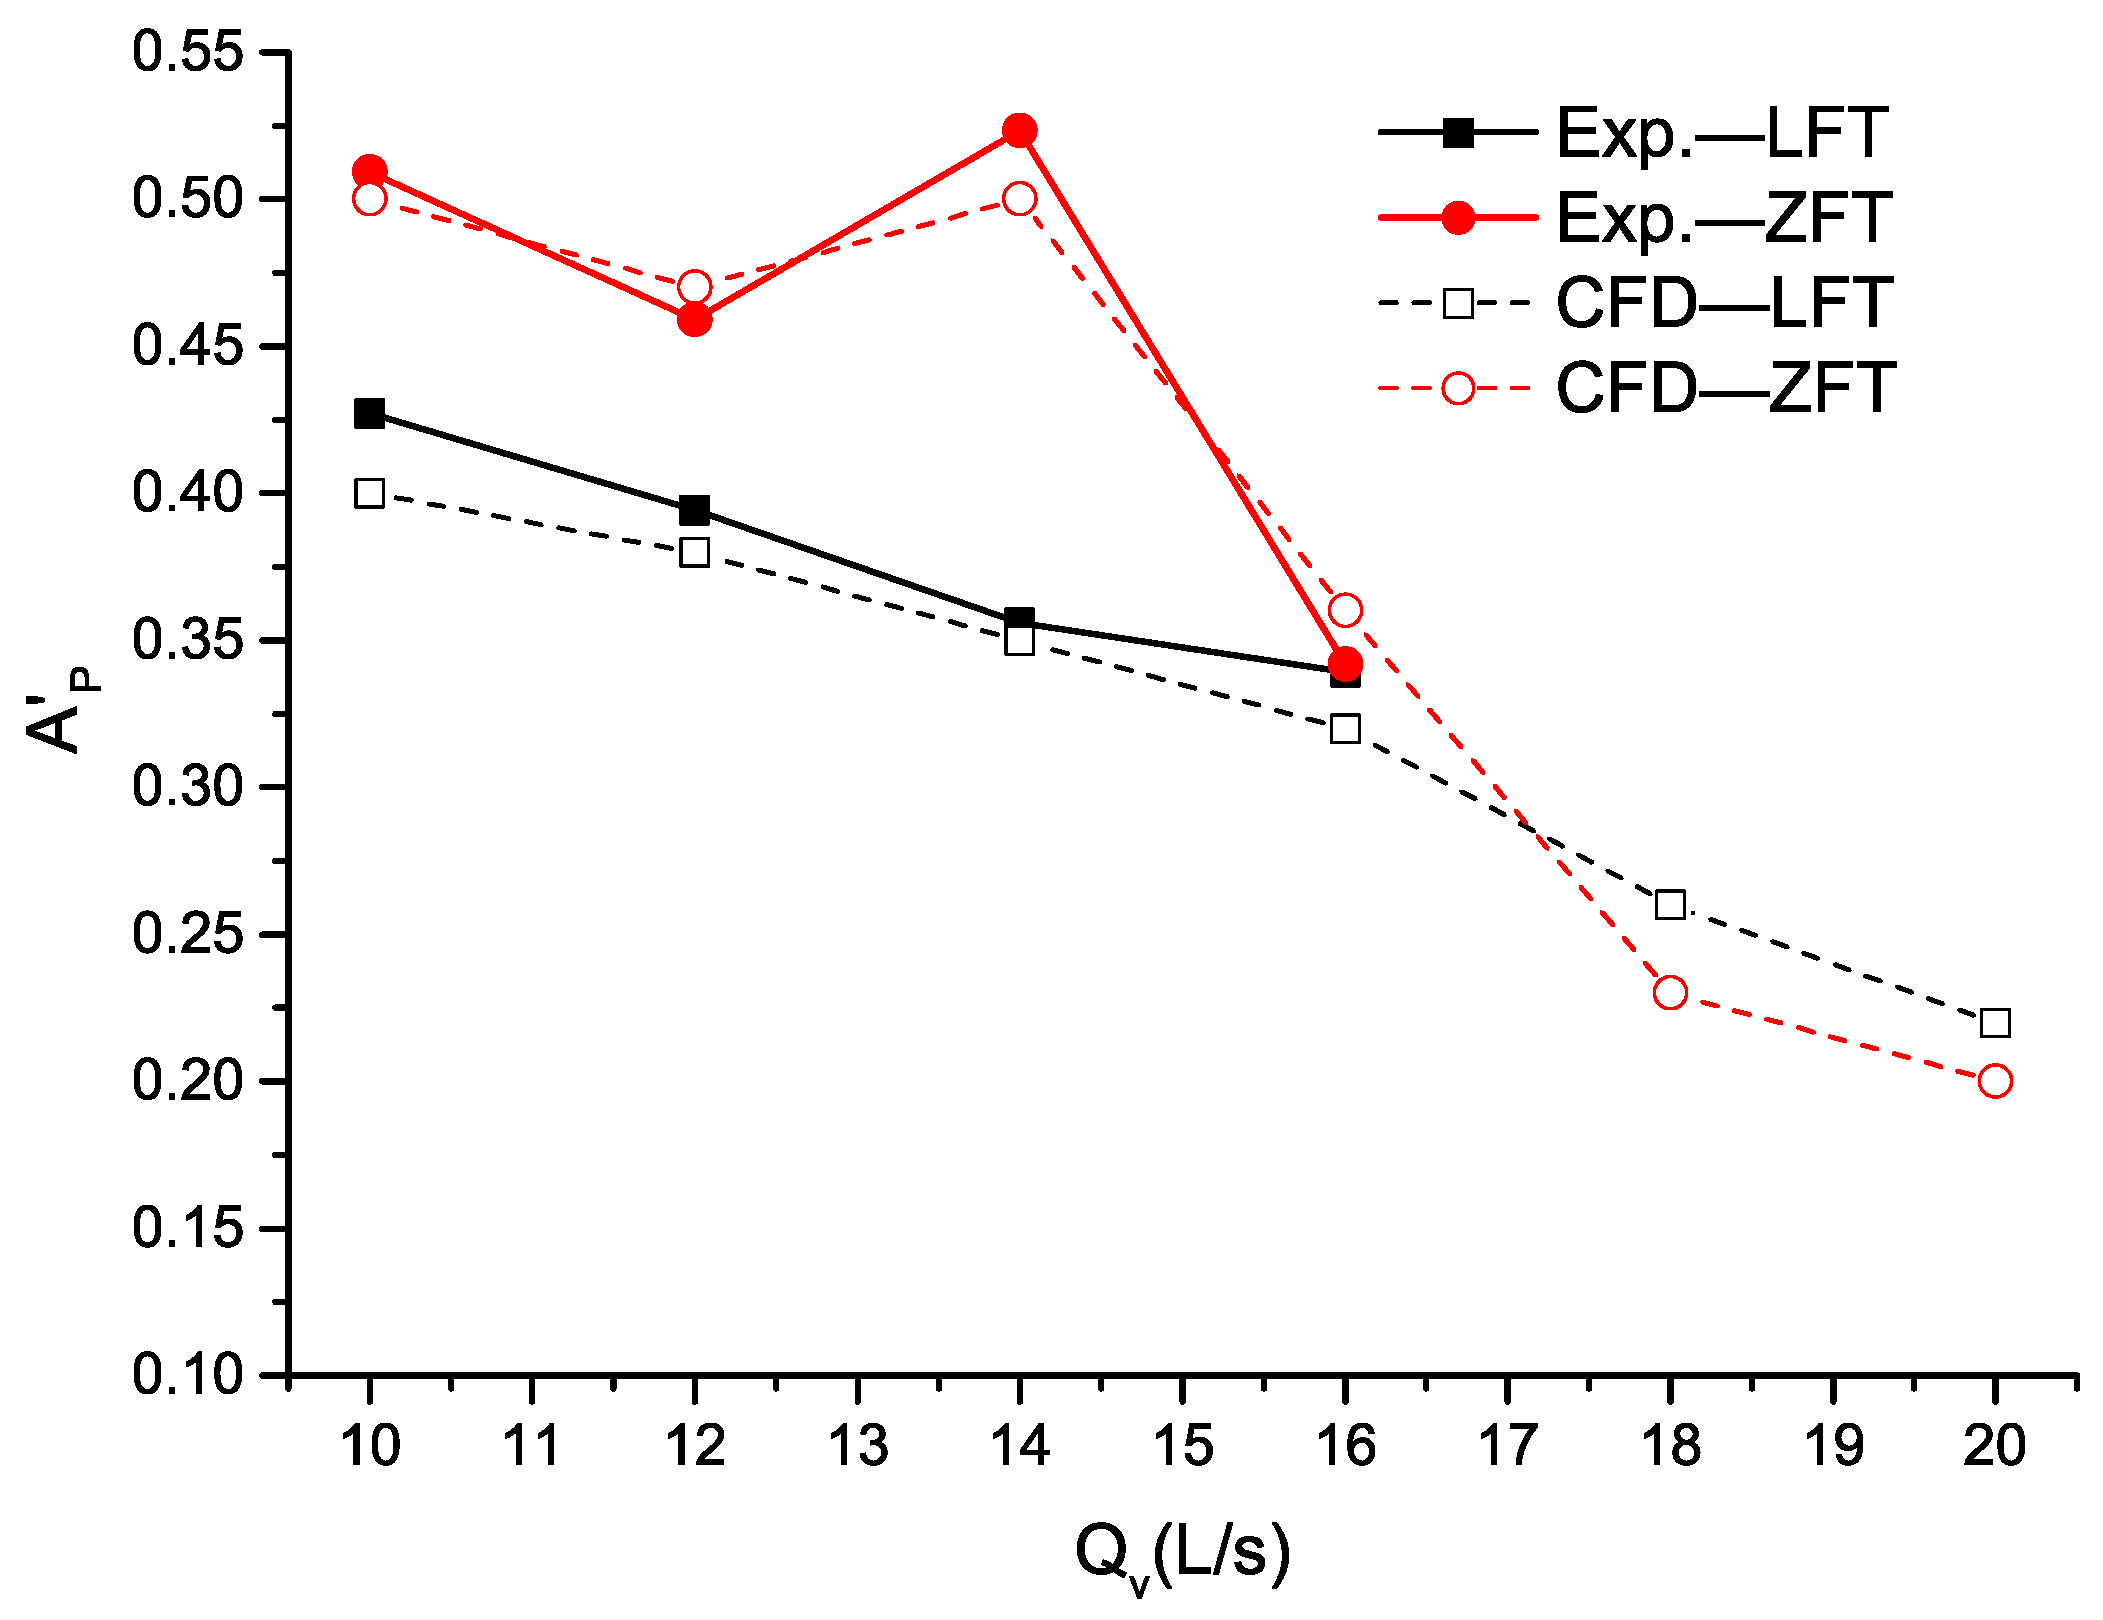
Figure 8 shows the variation of the relative pulse amplitude of the pressure drop with the supply flow rate. Numerically predicted results of the relative pulse amplitude of the pressure drop are in good agreement with those calculated from experimental data. It indicates that when the supply flow rate QV is no greater than 16 L/s, the relative pulse amplitude of the pressure drop of ZFT is higher than that of LFT, and QV = 14 L/s seems to be the optimum operating condition for ZFT as AP′ reaches its maximum value under this circumstance. It can also be concluded from the CFD simulation results that when the supply flow rate QV is greater than a certain value, the relative pulse amplitude of the pressure drop of LFT will be higher than that of ZFT.
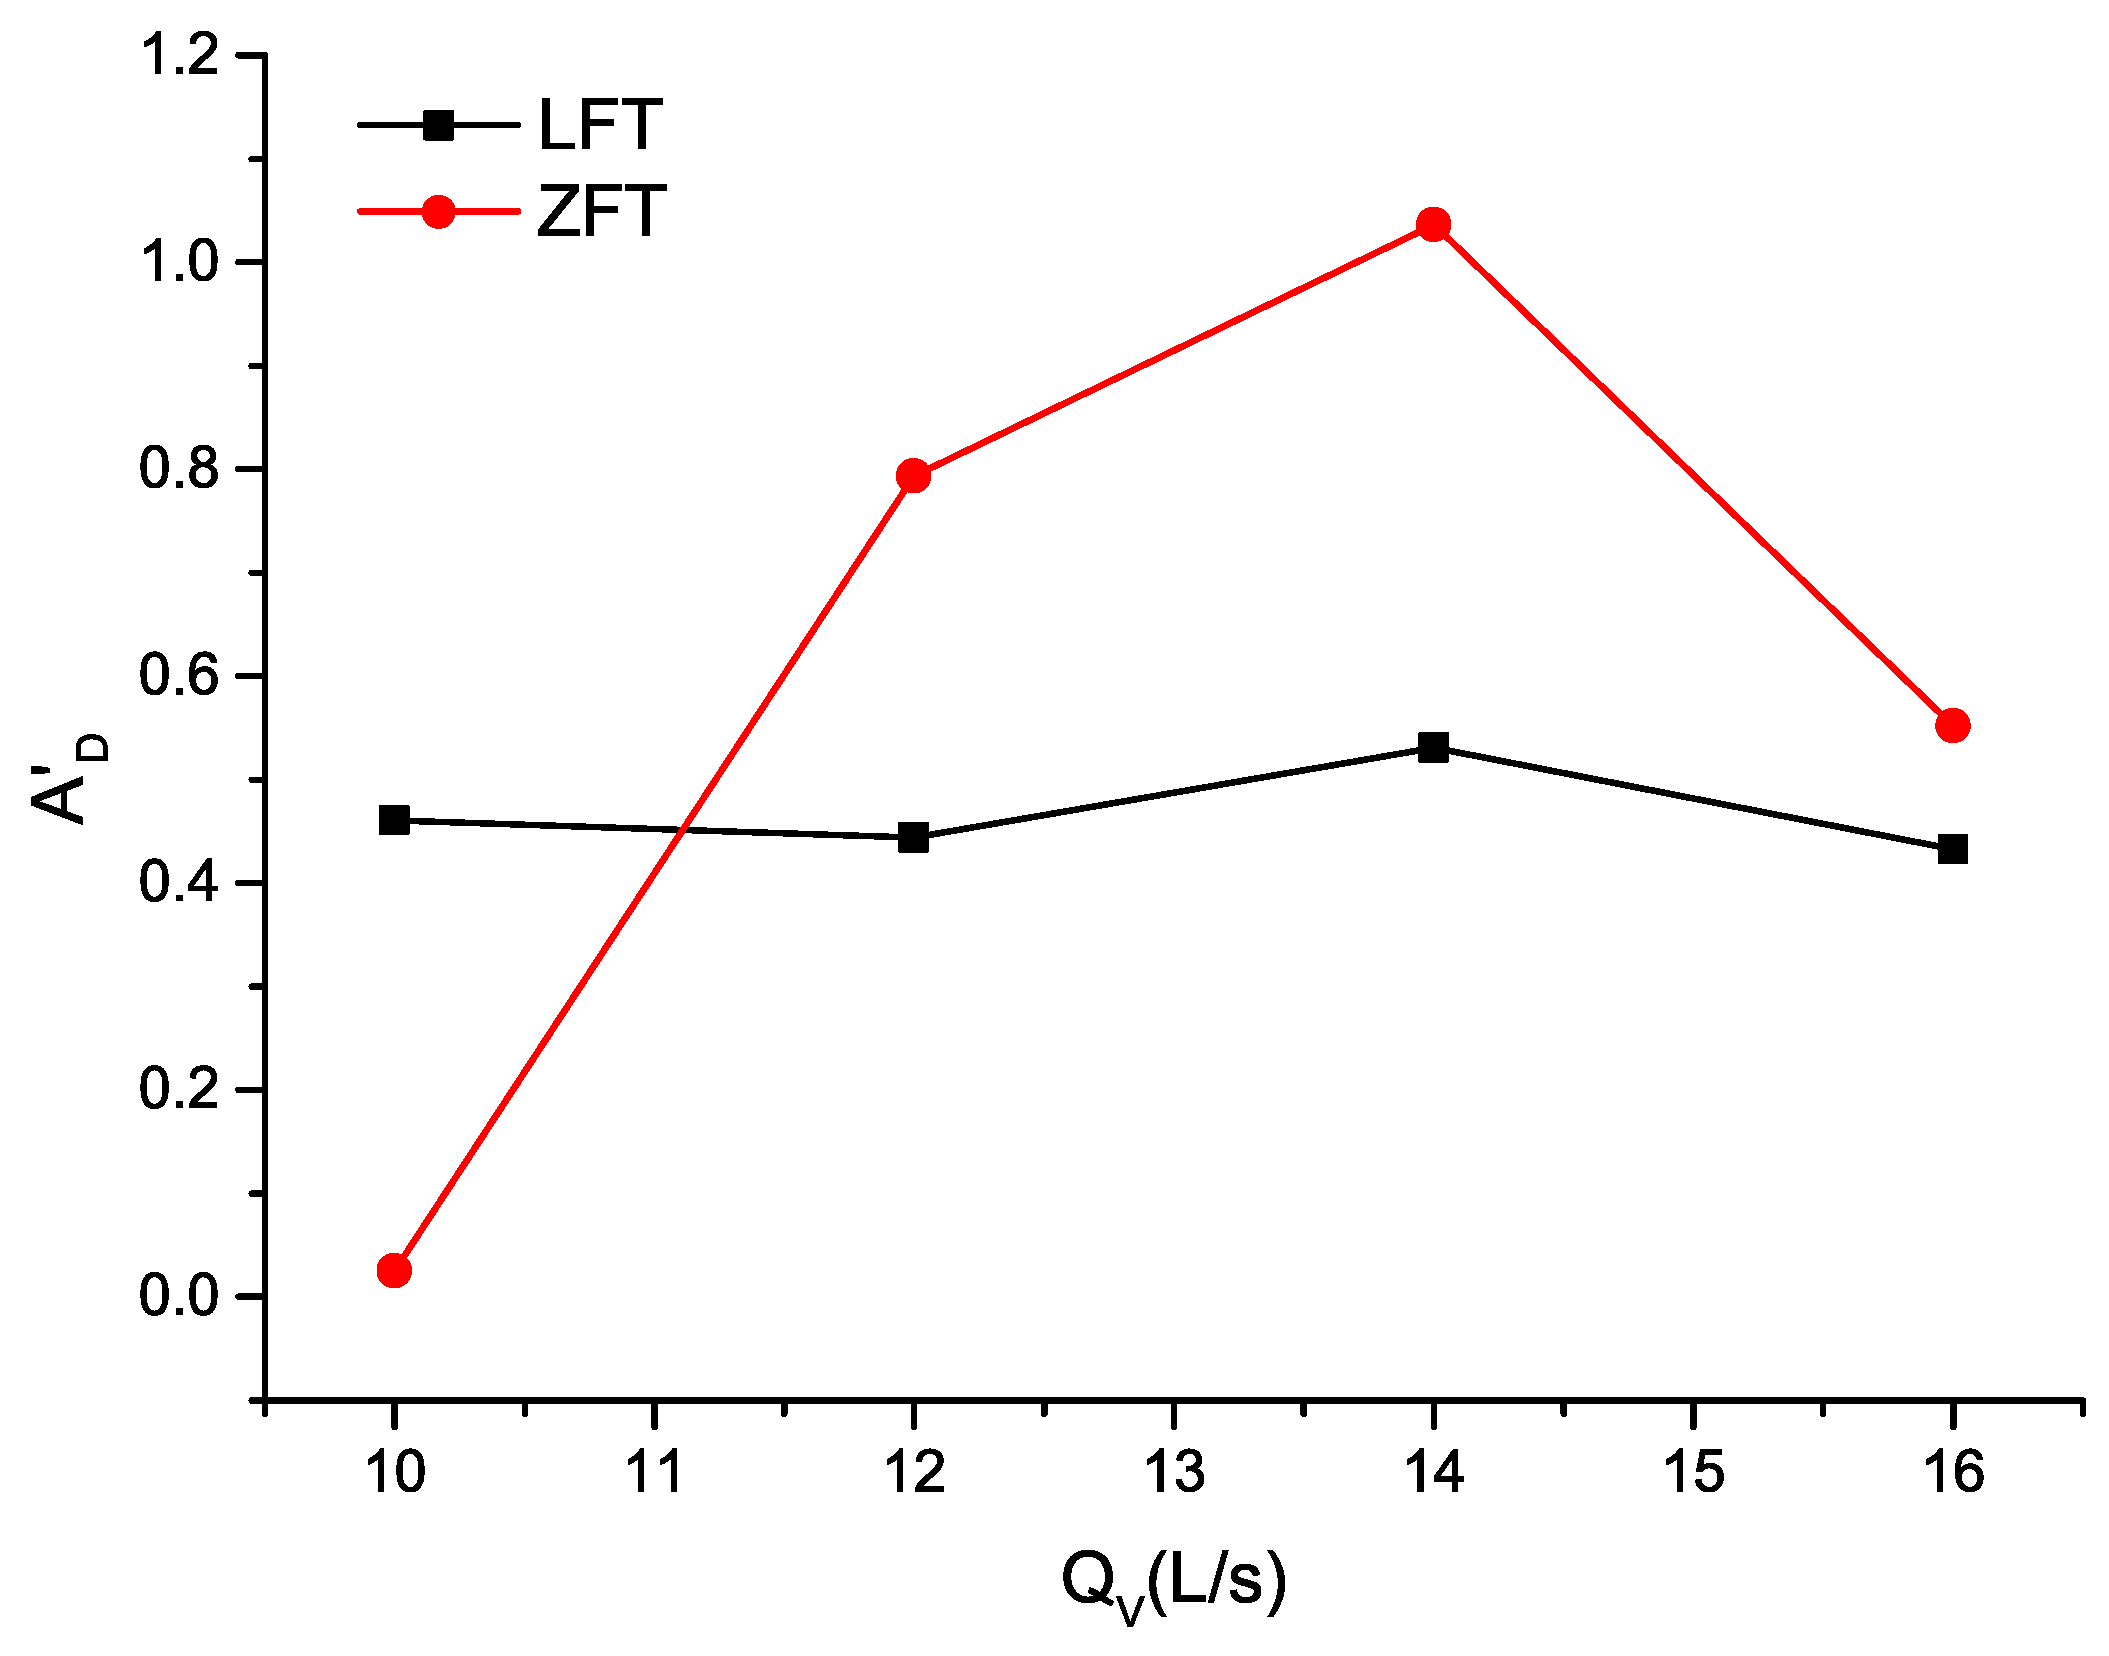
In a similar manner, the pulse amplitude of displacement can also be nondimensionalized and defined as the relative pulse amplitude of displacement:
where AD represents the difference between the minimum and maximum values of the measured displacement D and Dmea denotes the mean value of displacement (mean value of the measured displacement in a working cycle). The trend of the relative pulse amplitude of displacement AD′ with respect to the supply flow rate QV is provided in Figure 9. When QV = 10 L/s, the value of AD′ for ZFT is near to zero. This is because the pressure at (i) is not strong enough to prevail over the pre-tightening force of the disc springs, which have been discussed previously, and the amplitude of the oscillation is thus very weak. A similar result is obtained for the AD′ value of ZFT, which reaches its maximum at QV = 14 L/s. In addition, as shown in Figure 9, the AD′ differences between LFT and ZFT reduce remarkably after QV = 14 L/s. According to the CFD results of AP′ displayed in Figure 8, it can be inferred that when the value of QV continually increases, the AD' value of LFT will be higher than that of ZFT. If the pressure pulses generated are considered as important as the pressure drop, higher values of AP′ and AD′ can be regarded as demonstrating a better FAOT performance. It seems reasonable to draw the conclusion that when the supply flow rate QV is relatively low or higher than a certain value, the LFT poses a better performance; otherwise, the ZFT seems to be a preferred alternative.
AD′ = AD/Dmea
5. Conclusions
A fluidic axial oscillation tool for friction reduction with the absence of a throttling plate has been fabricated and demonstrated. A comparison analysis between the ZFT and LFT designs has been experimentally investigated and it was found that the two type designs were shown to produce a different pressure drop and relative amplitude. As expected, the absence of the throttling plate effectively minimized the pressure drop of an FAOT. For engineering practice, the optimum design will take into account both the pulse amplitude and pressure drop of the oscillation tool. By inducing two performance indexes, AP′ and AD′, to evaluate the performance of an FAOT, it can be concluded that when the supply flow rate QV is relatively low or higher than a certain value, the LFT exhibits a better performance; otherwise, the ZFT seems to be a preferred alternative. In most of the operating circumstances in terms of the supply flow rate and pressure drop, the ZFT design case performs better than the LFT. In addition, a CFD approach with the dynamic mesh technique was used to predict the pressure drop and oscillation frequency of the ZFT type oscillation tool. Although the data obtained by the CFD simulations are slightly larger than the experimental results, the differences are acceptable, demonstrating considerable agreement between them.
Acknowledgments
The authors disclosed receipt of the following financial support for the research, authorship, and/or publication of this article: This study was supported by the Public Science and Technology Research Funds Projects of Ministry of Land and Resources of China (No. 201311112) and the Project of CNPC Bohai Drilling Engineering Company Limited (No. 2016ZD17Y-01). The authors are also grateful to the reviewers for their helpful advice.
Author Contributions
Jianming Peng and He Liu conceived and designed the study. Xinxin Zhang performed the numerical simulations. Xinxin Zhang and Dongyu Wu conducted the experiments. Xinxin Zhang wrote the paper. Jianming Peng reviewed and edited the manuscript. All authors read and approved the manuscript.
Conflicts of Interest
The authors declare no conflict of interest.
References
- Barton, S.; Baez, F.; Alali, A. Drilling Performance Improvements in Gas Shale Plays using a Novel Drilling Agitator Device. In Proceedings of the AADE National Technical Conference and Exhibition, Houston, TX, USA, 14–16 June 2011. [Google Scholar]
- Mccormick, J.E.; Chiu, T.F. The Practice and Evolution of Torque and Drag Reduction: Theory and Field Results. In Proceedings of the SPE Annual Technical Conference and Exhibition, Bangkok, Thailand, 15–17 November 2011. [Google Scholar]
- Liu, Y.; Chen, P.; Wang, X.; Ma, T. Modeling friction-reducing performance of an axial oscillation tool using dynamic friction model. J. Nat. Gas Sci. Eng. 2016, 33, 397–404. [Google Scholar] [CrossRef]
- Abdo, J.; Al-Sharji, H. Investigation of inducing vibration to reduce friction of coiled tubing in deep drilling operations. In Proceedings of the ASME International Mechanical Engineering Congress and Exposition, Montreal, QC, Canada, 14–20 November 2014. [Google Scholar]
- Clausen, J.R.; Schen, A.E.; Forster, I.; Prill, J.; Gee, R. Drilling With Induced Vibrations Improves ROP and Mitigates Stick/Slip in Vertical and Directional Wells. In Proceedings of the SPE Drilling Conference and Exhibition, Fort Worth, TX, USA, 4–6 March 2014. [Google Scholar]
- Martinez, J.; Carson, C.R.; Canuel, L.A.P.; Burnett, T.G.; Gee, R. New Technology Enables Rigs With Limited Pump Pressure Capacity to Utilize the Latest Friction Reduction Technology. In Proceedings of the SPE Eastern Regional Meeting, Pittsburgh, PA, USA, 20–22 August 2013. [Google Scholar]
- Mohiuddin, M.A.; Khan, K.; Abdulraheem, A.; Al-Majed, A.; Awal, M.R. Analysis of wellbore instability in vertical, directional, and horizontal wells using field data. J. Petrol. Sci. Eng. 2007, 55, 83–92. [Google Scholar] [CrossRef]
- Panchal, N.; Bayliss, M.T.; Whidborne, J.F. Attitude control system for directional drilling bottom hole assemblies. IET Control Theory Appl. 2012, 6, 884–892. [Google Scholar] [CrossRef]
- Gee, R. Axial oscillation tools vs. lateral vibration tools for friction reduction—What’s the best way to shake the pipe? In Proceedings of the SPE/IADC Drilling Conference and Exhibition, London, UK, 17–19 March 2015. [Google Scholar]
- Alali, A.; Akubue, V.A.; Barton, S.P.; Gee, R.; Burnett, T.G. Agitation tools enables significant reduction in mechanical specific energy. In Proceedings of the SPE Asia Pacific Oil and Gas Conference and Exhibition, Perth, Australia, 22–24 October 2012. [Google Scholar]
- Zheng, S.; Jeffryes, B.P.; Thomeer, H.V.; Leising, L.J. Method and Apparatus to Vibrate a Downhole Component. U.S. Patent 6,571,870, 6 March 2003. [Google Scholar]
- Al-Buali, M.H.; Dashash, A.A.; Shawly, A.S.; Al-Guraini, W.K.; Al-Driweesh, S.M.; Bugrov, V.; Nicoll, S. Maximizing Coiled Tubing Reach during Logging of Extended Horizontal Wells Using E-line Agitator. In Proceedings of the Kuwait International Petroleum Conference and Exhibition, Kuwait City, Kuwait, 14–16 December 2009. [Google Scholar]
- National Oilwell Varco. Agitator System. Available online: http://www.nov.com/agitator/ (accessed on 20 December 2016).
- Sola, K.I.; Lund, B. New downhole tool for coiled tubing extended reach. In Proceedings of the SPE/ICoTA Coiled Tubing Roundtable, Houston, TX, USA, 5–6 April 2000. [Google Scholar]
- Zhang, H.; Guan, Z.; Liu, Y.; Dou, Y. Development of drill string excitation drag reduction tool based on rotary excitation. China Pet. Mach. 2015, 43, 9–12. [Google Scholar]
- Weatherford International. Mechanical Friction Reduction Tools. Available online: http://www.weatherford.com/doc/wft154945 (accessed on 20 December 2016).
- Walter, B. Acoustic Flow Pulsing Apparatus and Method for Drill String. U.S. Patent 6,910,542, 28 June 2005. [Google Scholar]
- Liu, H. Theoretical Analysis and Experimental Research on Liquid Jet Oscillation Tool. Ph.D. Thesis, Jilin University, Changchun, China, 2014. [Google Scholar]
- He, J.F.; Yin, K.; Peng, J.M.; Zhang, X.X.; Liu, H.; Gan, X. Design and feasibility analysis of a fluidic jet oscillator with application to horizontal directional well drilling. J. Nat. Gas Sci. Eng. 2015, 27, 1723–1731. [Google Scholar] [CrossRef]
- Liu, H.; Feng, Q.; Zhou, J.; Wu, X.; Zhao, P.; Wang, J. Vibration Frequency Analysis of Jetting Hydraulic Oscillator. China Pet. Mach. 2016, 44, 20–24. [Google Scholar]
- CNPC Bohai Drilling Engineering Company Limited. BH-HVT Jetting Hydraulic Oscillator for Drilling; Technical Report; CNPC Bohai Drilling Engineering Company Limited: Tianjin, China, 2016. [Google Scholar]
- Zhang, X.; Peng, J.; Ge, D.; Bo, K.; Yin, K.; Wu, D. Performance study of a fluidic hammer controlled by an output-fed bistable fluidic oscillator. Appl. Sci. 2016, 6, 305. [Google Scholar] [CrossRef]
- Simpson, A.R.; Wylie, E.B. Large water-hammer pressures for column separation in pipelines. J. Hydraul. Eng. 1991, 117, 1310–1316. [Google Scholar] [CrossRef]
- Zhang, X.; Peng, J.; Chen, J.; Bo, K.; Yin, K.; Wu, D. The effect of actuator parameters on the performance of a liquid-jet hammer associated with its jet behavior. In Proceedings of the Institution of Mechanical Engineers, Part C: Journal of Mechanical Engineering Science; SAGE Publications: Thousand Oaks, CA, USA, 26 December 2016. [Google Scholar]
- Peng, J.M.; Zhang, Q.; Li, G.L.; Chen, J.W.; Gan, X.; He, J.F. Effect of geometric parameters of the bistable fluidic amplifier in the liquid-jet hammer on its threshold flow velocity. Comput. Fluids 2013, 82, 38–49. [Google Scholar] [CrossRef]
- Tesař, V.; Smyk, E. Fluidic low-frequency oscillator with vortex spin-up time delay. Chem. Eng. Process. 2015, 90, 5–15. [Google Scholar] [CrossRef]
- Yamamoto, K.; Hiroki, F.; Hyodo, K. Self-sustained oscillation phenomena of fluidic flowmeters. J. Vis. 1999, 1, 387–396. [Google Scholar] [CrossRef]
- Uzol, O.; Camci, C. Experimental and computational visualization and frequency measurements of the jet oscillation inside a fluidic oscillator. J. Vis. 2002, 5, 263–272. [Google Scholar] [CrossRef]
- Peng, J.M.; Yin, Q.L.; Li, G.L.; Liu, H.; Wang, W. The effect of actuator parameters on the critical flow velocity of a fluidic amplifier. Appl. Math. Model. 2013, 37, 7741–7751. [Google Scholar] [CrossRef]
Figure 1.
Schematic diagram of a fluidic axial oscillation tool [18]. 1–Mandrel, 2–Top tie-in of axial oscillation assembly, 3–Inner sleeve of axial oscillation assembly, 4–External sleeve of axial oscillation assembly, 5–Disc springs, 6–Middle tie-in of axial oscillation assembly, 7–Middel tie-in of mandrel, 8–Step seal, 9–Bottom tie-in of mandrel, 10–Bottom tie-in of axial oscillation assembly, 11–Top tie-in of pressure pulsation assembly, 12–Disc springs, 13–External sleeve of pressure pulsation assembly, 14–Gland, 15–output-fed bistable fluidic oscillator, 16–Cylinder, 17–Adjusting rod, 18–Piston, 19–Dowel pin, 20–Cylinder lid, 21–Inner sleeve of pressure pulsation assembly, 22–Throttle plate, and 23–Bottom tie-in of pressure pulsation assembly.

Figure 2.
A typical grid model of flow domain and the imposed boundary conditions.

Figure 3.
Schematic of the experimental system.
Figure 4.
The measured pressure at three different positions ((i) the inlet of the fluidic oscillator; (ii) one of the side passages and (iii) the front chamber of the cylinder) of a fluidic axial oscillation tool with the absence of a throttling plate when QV = 16 L/s: relation with the measuring time T and the computed flow field (Velocity contours).
Figure 5.
Comparison between experimental tests and CFD (Computational Fluid Dynamics) of mean pressure drop Pmea and stroke frequency f.
Figure 5.
Comparison between experimental tests and CFD (Computational Fluid Dynamics) of mean pressure drop Pmea and stroke frequency f.
Figure 6.
Variation of pressure drop P with time T for different supply volume flow rates QV.
Figure 7.
Variation of the measured displacement D with time T for different supply volume flow rates QV.
Figure 7.
Variation of the measured displacement D with time T for different supply volume flow rates QV.

Figure 8.
Relative pulse amplitude of pressure drop versus supply flow rate QV.

Figure 9.
Experimental results of relative pulse amplitude of displacement versus supply flow rate QV.
Figure 9.
Experimental results of relative pulse amplitude of displacement versus supply flow rate QV.


Table 1.
The details of the grid independence analysis of a fluidic axial oscillation tool.
| Specification | Number of Cells | Mean Pressure Drop (MPa) | Oscillation Frequency (Hz) |
|---|---|---|---|
| Coarse grid | 50,000 | 2.21 | 7.64 |
| Medium grid | 80,000 | 2.13 | 7.52 |
| Fine grid | 120,000 | 2.10 | 7.47 |
| %Difference a | - | 5.24 | 2.28 |
a The percentage difference between the coarse and fine grids.
© 2017 by the authors. Licensee MDPI, Basel, Switzerland. This article is an open access article distributed under the terms and conditions of the Creative Commons Attribution (CC BY) license (http://creativecommons.org/licenses/by/4.0/).
Share and Cite
MDPI and ACS Style
Zhang, X.; Peng, J.; Liu, H.; Wu, D. Performance Analysis of a Fluidic Axial Oscillation Tool for Friction Reduction with the Absence of a Throttling Plate. Appl. Sci. 2017, 7, 360. https://doi.org/10.3390/app7040360
AMA Style
Zhang X, Peng J, Liu H, Wu D. Performance Analysis of a Fluidic Axial Oscillation Tool for Friction Reduction with the Absence of a Throttling Plate. Applied Sciences. 2017; 7(4):360. https://doi.org/10.3390/app7040360
Chicago/Turabian StyleZhang, Xinxin, Jianming Peng, He Liu, and Dongyu Wu. 2017. "Performance Analysis of a Fluidic Axial Oscillation Tool for Friction Reduction with the Absence of a Throttling Plate" Applied Sciences 7, no. 4: 360. https://doi.org/10.3390/app7040360
Note that from the first issue of 2016, this journal uses article numbers instead of page numbers. See further details here.