
Time Reversal Method for Guided Waves with Multimode and Multipath on Corrosion Defect Detection in Wire


School of Civil Engineering, Dalian University of Technology, Dalian 116024, China
*
Author to whom correspondence should be addressed.
Appl. Sci. 2017, 7(4), 424; https://doi.org/10.3390/app7040424
Submission received: 30 March 2017
/
Revised: 15 April 2017
/
Accepted: 18 April 2017
/
Published: 21 April 2017
Abstract
:This study identified depths of artificial pitting corrosion on the galvanized steel wires, frequently used in bridge cables, based on the time reversal method (TRM). Specifically, the multimode longitudinal ultrasonic guided waves are excited in terms of characteristics of radical distribution of the normalized average energy flow density (NAPFD) in a wire. Furthermore, the complex defect scattered signals are difficult to interpret, which are attributed to multimode, multipath and dispersion, but are considered to enhance the focused energy through the TRM while the different depths of defect are explicitly identified by the normalized amplitudes of reconstructed wave packets. Finally, in contrast to the traditional monitoring approach relying on the amplitude of defect echo, the proposed method in this study is demonstrated to have a higher sensitivity to recognize the progressive increase of corrosion depth.
1. Introduction
Corrosion is one of the primary factors for durability and security of structures. Compared with uniform corrosion, pitting corrosion is prone to impose more adverse impacts on the mechanical properties of structures [1]. Since the generation and development of pitting corrosion are stochastic, the prediction of its influence is inaccurately implemented using the mathematical models [1,2,3]. However, towards the pitting corrosion diagnosis, beyond that realizing the approximate prediction, one has to assess the current corrosion state, which drives a requirement to non-destructive evaluation techniques, and even has to complete more specific predetermination according to the updated destructive data to reduce the uncertainty [4].
Guided waves based techniques are proven as accurate and efficient in local damage detection and structural health assessment of aerospace and civil infrastructures. When the dispersion equation was solved by numerical methods, the researchers had been practically applying ultrasonic guided waves in rods for length measurement and defects recognition conveniently [5]. Combining with intelligent algorithms, Wu et al. detected a flaw of different positions and depths on the surface of a steel bar. mode was selected considering its particular sensitivity to superficial defects [6]. Reference-free algorithms were proposed to estimate the cross-section loss based on the differential time-of-flight of propagating guided waves in rod-like waveguides [7,8]. Pavlakovich and Beard extensively studied the attenuation properties of guided waves determined by the material properties, propagation distance, frequency et al. in an imbedded bar, and then applied it to the anchor structures detection [9,10,11,12]. Surface and core seeking guided waves were excited and respectively used to monitor reinforced-concrete beams suffering from damages with different corrosion mechanisms, such as delamination and pitting corrosion on steels [13,14].
For guided waves in either cylinders or plates, numerous vibrating modes propagate simultaneously at one single excitation frequency, and with its growth the number of modes also increase, that is multimode nature of guided waves. Multipath nature denotes that guided waves propagate along numerous possible paths between the transducers. As a result of the two native characteristics along with dispersion, the response signals are sometimes difficult to interpret definitely and then give rise to troubles for defect detection. In order to overcome the stringent constraints, lots of research was carried out to enhance resolution of signals, such as optimizing excitation mode, signal processing and loading compensation [15,16]. However, the characteristics of guided waves mentioned above have their strengths in damage detection. A refined method, considering the multimode nature and multipath nature with rich defect information, is able to improve the flexibility in selecting appropriate modes based on NAPFD distribution, and hence increase the quality of damage identification.
TRM is a testing technique that signals captured by transducers are inverted in time domain and then reemitted by the same transducers. The identical modes traveling in the same forward and backward propagation paths will arrive simultaneously at the trigger point of excitation, so the discrepancy due to multimode and multipath in time domain can be eliminated. Furthermore, the effect of the within-mode dispersion can be completely compensated. Numerous works relating to TRM have been done in damage detection with guided waves mainly including waveform reconstruction and signal focus [17,18,19]. Wang and Rose et al. established the theoretical basis of the Lamb wave focus and reconstruction in plate using the simplified Mindlin plate theory [20]; Park et al. improved the time reversal theory of Lamb wave with multimode and applied it to damage identification in composite plate [21,22]. A method to bring about higher focusing energy in pipe, by controlling the delay time of each element in the piezoelectric transducer array and adjusting the amplitude coefficient of each excitation channel, was introduced elaborately in Ref. [23,24,25]. In a thick-walled pipe with large diameter, Liu et al. utilized the multichannel time reversal focusing method (MTRF) to focus the circumferential Lamb wave from independent channels, and located the defect by the aid of direct waves which were partially compensated [26]. Up to now, time reversal technique is conducted extensively in plates and pipes, whereas the application in rod-shaped waveguide is rarely reported. Zhou et al. excited a single-mode of longitudinal guided waves in a steel rod to identify a notch, and used TRM to eliminate the dispersion to increase the resolution of the defect echo signal [27]. Mustapha et al. came up with a reference-free method to detect the delamination in a rebar-reinforcement concrete beam. A damage index was also defined based on the correlation coefficient between the actuated and reconstructed signals which were derived from TRM [28]. Both previous literatures mentioned above limited TRM in a single mode in rod-shaped waveguides, and only dealt with removing the within-mode dispersion.
In this paper, ultrasonic guided waves with multiple modes are excited intentionally in differently damaged galvanized steel wires used in bridge cables, and the coupling defect signals attributed to multimode and multipath natures are focused by TRM. Compared with the conventional method for damage detection, not only is the proposed method with higher resolution to the variation of the damage degree, but is proved to supply the entire historical information of the pitting corrosion development.
2. Multimode and Multipath Time Reversal in a Rod
Supposing that a rod is separated into parts by defects, mode reflection or conversion occurs at boundaries or structural defects, and so guided waves will transmit through various routes in different modes from an actuator to a sensor, which results in multimode and multipath natures of guided waves propagation in a rod.
As to a specified transmission route from an actuator to a sensor, the response signal is a composition of modes with their individual propagating process defined specially for the aims of this study. The explanation to the multiple propagating ways is schematically shown in Figure 1. For brevity, assume that a rod is divided into two transmission parts by one defect, and the direct path among multiple transmission routes is the only one considered here. Mode 1 is excited by transducer A and then propagates right through the Part 1. Supposing that the energy of Mode 1 is separated into sections at the defect, one will still transmit through the Part 2 as Mode 1, but another one converts to Mode 2 and propagates along the remaining path. Therefore, the response signals captured by transducer B on the other side are composed of Mode 1 and Mode 2 which derive from the identical direct path but with different propagating processes.
In general, as to a rod with multiple defects, the transfer function of the propagating process in a specified transmission route can be expressed in the frequency domain as follows:
where, is the angular frequency, is the number of disturbance due to discontinuities (including defects and boundaries), is the amplitude dispersion function after the disturbance, and denote the wave number of the mode after the disturbance and length of transmission part between the and the disturbance respectively. For simplified expression, is the total length of the specified transmission route, and indicate the equivalent amplitude dispersion function and the equivalent wave number of the propagating process respectively.
When an excitation signal is applied to the actuator, the response signal at the sensor can be represented in the frequency domain as follows:
and are the electro-mechanical efficiency coefficients of the actuator and the sensor respectively, and can be defined as the total number of propagating processes in the specified transmission route.
We truncate at time , reverse the acquired signal in the time domain, and then reload it to the sensor rather than the actuator. Noticing that reversion in time domain is equivalent to taking a complex conjugate of the signal in frequency domain, the reconstructed signal captured by the transducer which is acted previously as an actuator is shown below:
where, , and .
The reconstructed signal in the time domain can be obtained by taking the inverse Fourier transform to :
when an original input signal is a narrowband tone burst with a center frequency , then
when , in Equation (4) can be rewritten as follows:
reverse in Equation (6) in time domain, then the reconstructed input signal is represented as follows:
when , the in Equation (4) can be rewritten alternatively as follows:
is expanded using a Taylor series near the center frequency up to the first order term [21]
By using the relationships among the equivalent wave number , the equivalent group velocity , and the equivalent phase velocity of the propagating process, Equation (10) is expressed as follows:
take Equation (10) into Equation (9), then
where, , .
Using Equation (11), Equation (8) is expressed as follows:
then, the reconstructed input signal is represented as follows:
when , that means the propagating processes are identical in both forward and backward of the specified transmission route. The scaling factor in Equation (7) is a real number, which indicates that multiple modes are fully compensated and converge to a reconstructed main band. Alternatively, when , that means the propagating processes are different in both forward and backward of the specified transmission route. The scaling factor in Equation (13) is no longer a real number because of the item representing phase shift. As a result, multiple modes are partially compensated and form side bands which are shifted from by in time domain.
According to another transmission route from the actuator to the sensor, the time reversal process can be validated in a similar manner. Only a sufficiently large truncation window is required to acquire all the captured signals originating from multiple transmission routes, can the response signals of multimode and multipath be spatially and temporally focused and converge to be a main band as a reconstructed input signal.
3. Experimental Investigation
3.1. Experimental Setup
As shown in the Figure 2, the measurement system used for signal generation and data acquisition is mainly constituted by National Instruments (NI). The kit includes an arbitrary waveform generator card (PXI-5441), a 8 channel digitizer (PXIe-5105) and a machine (PXIe-1073) for the cards to be inserted in. LabVIEW software is used to control the modular unit through a computer. Two identical wideband FUJI acoustic emission transducers (AE1045S), which have a very flat frequency response from 0.1 MHz to 1.5 MHz, are used as an actuator and a sensor. The response signal is promoted by a preamplifier (PXPA6) before acquisition. The galvanized steel wires under test have the same diameter of 7 mm and approximate length of 1 m. The transducers are coupled perpendicularly to the wire’s cross section at two sides by the designed clamps.
3.2. Time Reversal Focusing of Longitudinal Modes
Considering the entire symmetry of the testing system, the longitudinal modes are mainly excited and received. Alternatively, the bending modes are hardly captured by transducers due to their anti-symmetric vibrating characteristic with respect to the axis of circular section. To verify the system reliability of realizing TRM for focus and reconstruction of signals with multimode and multipath in a rod, the guided waves consisting of multiple longitudinal modes are generated. Afterwards, a truncated captured signal including multiple paths is inverted in the time domain and then reemitted. To reduce the complexity of hardware system and experimental operation, the modified TRM [29], which always allows one transducer to work as an actuator while the other as a receiver during the whole process, is used to achieve TRM in all the experiments in this study.
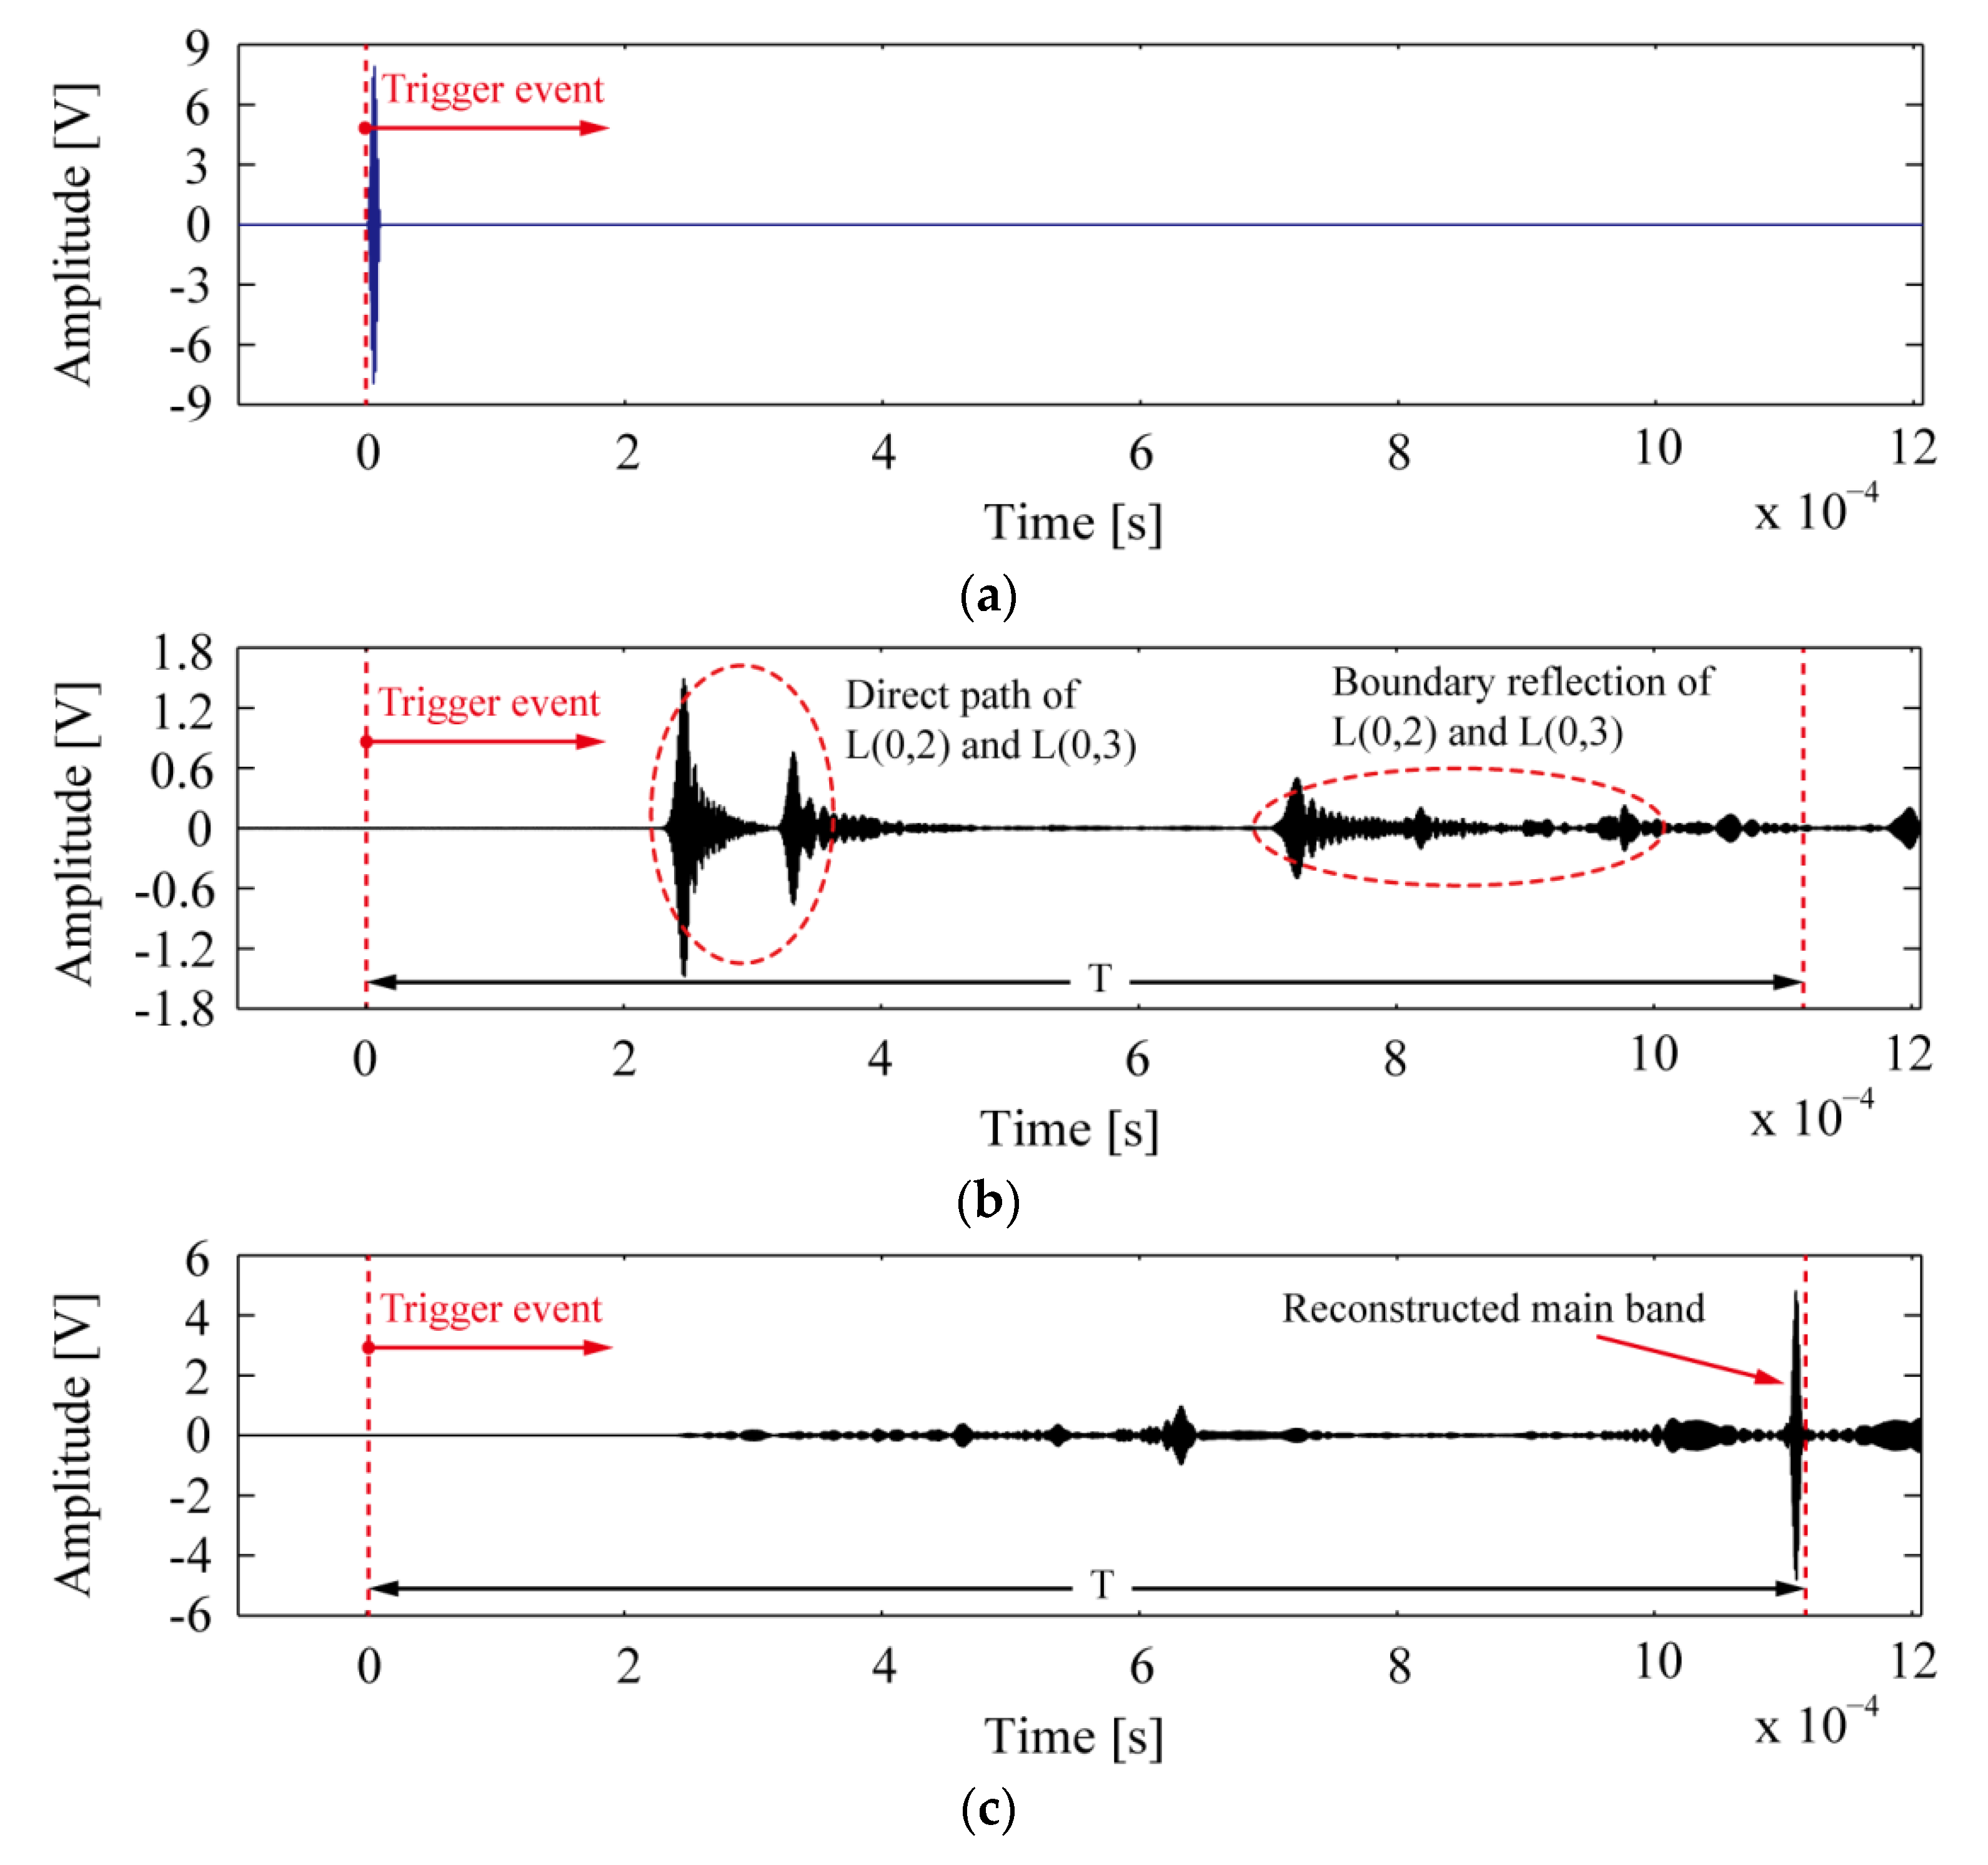
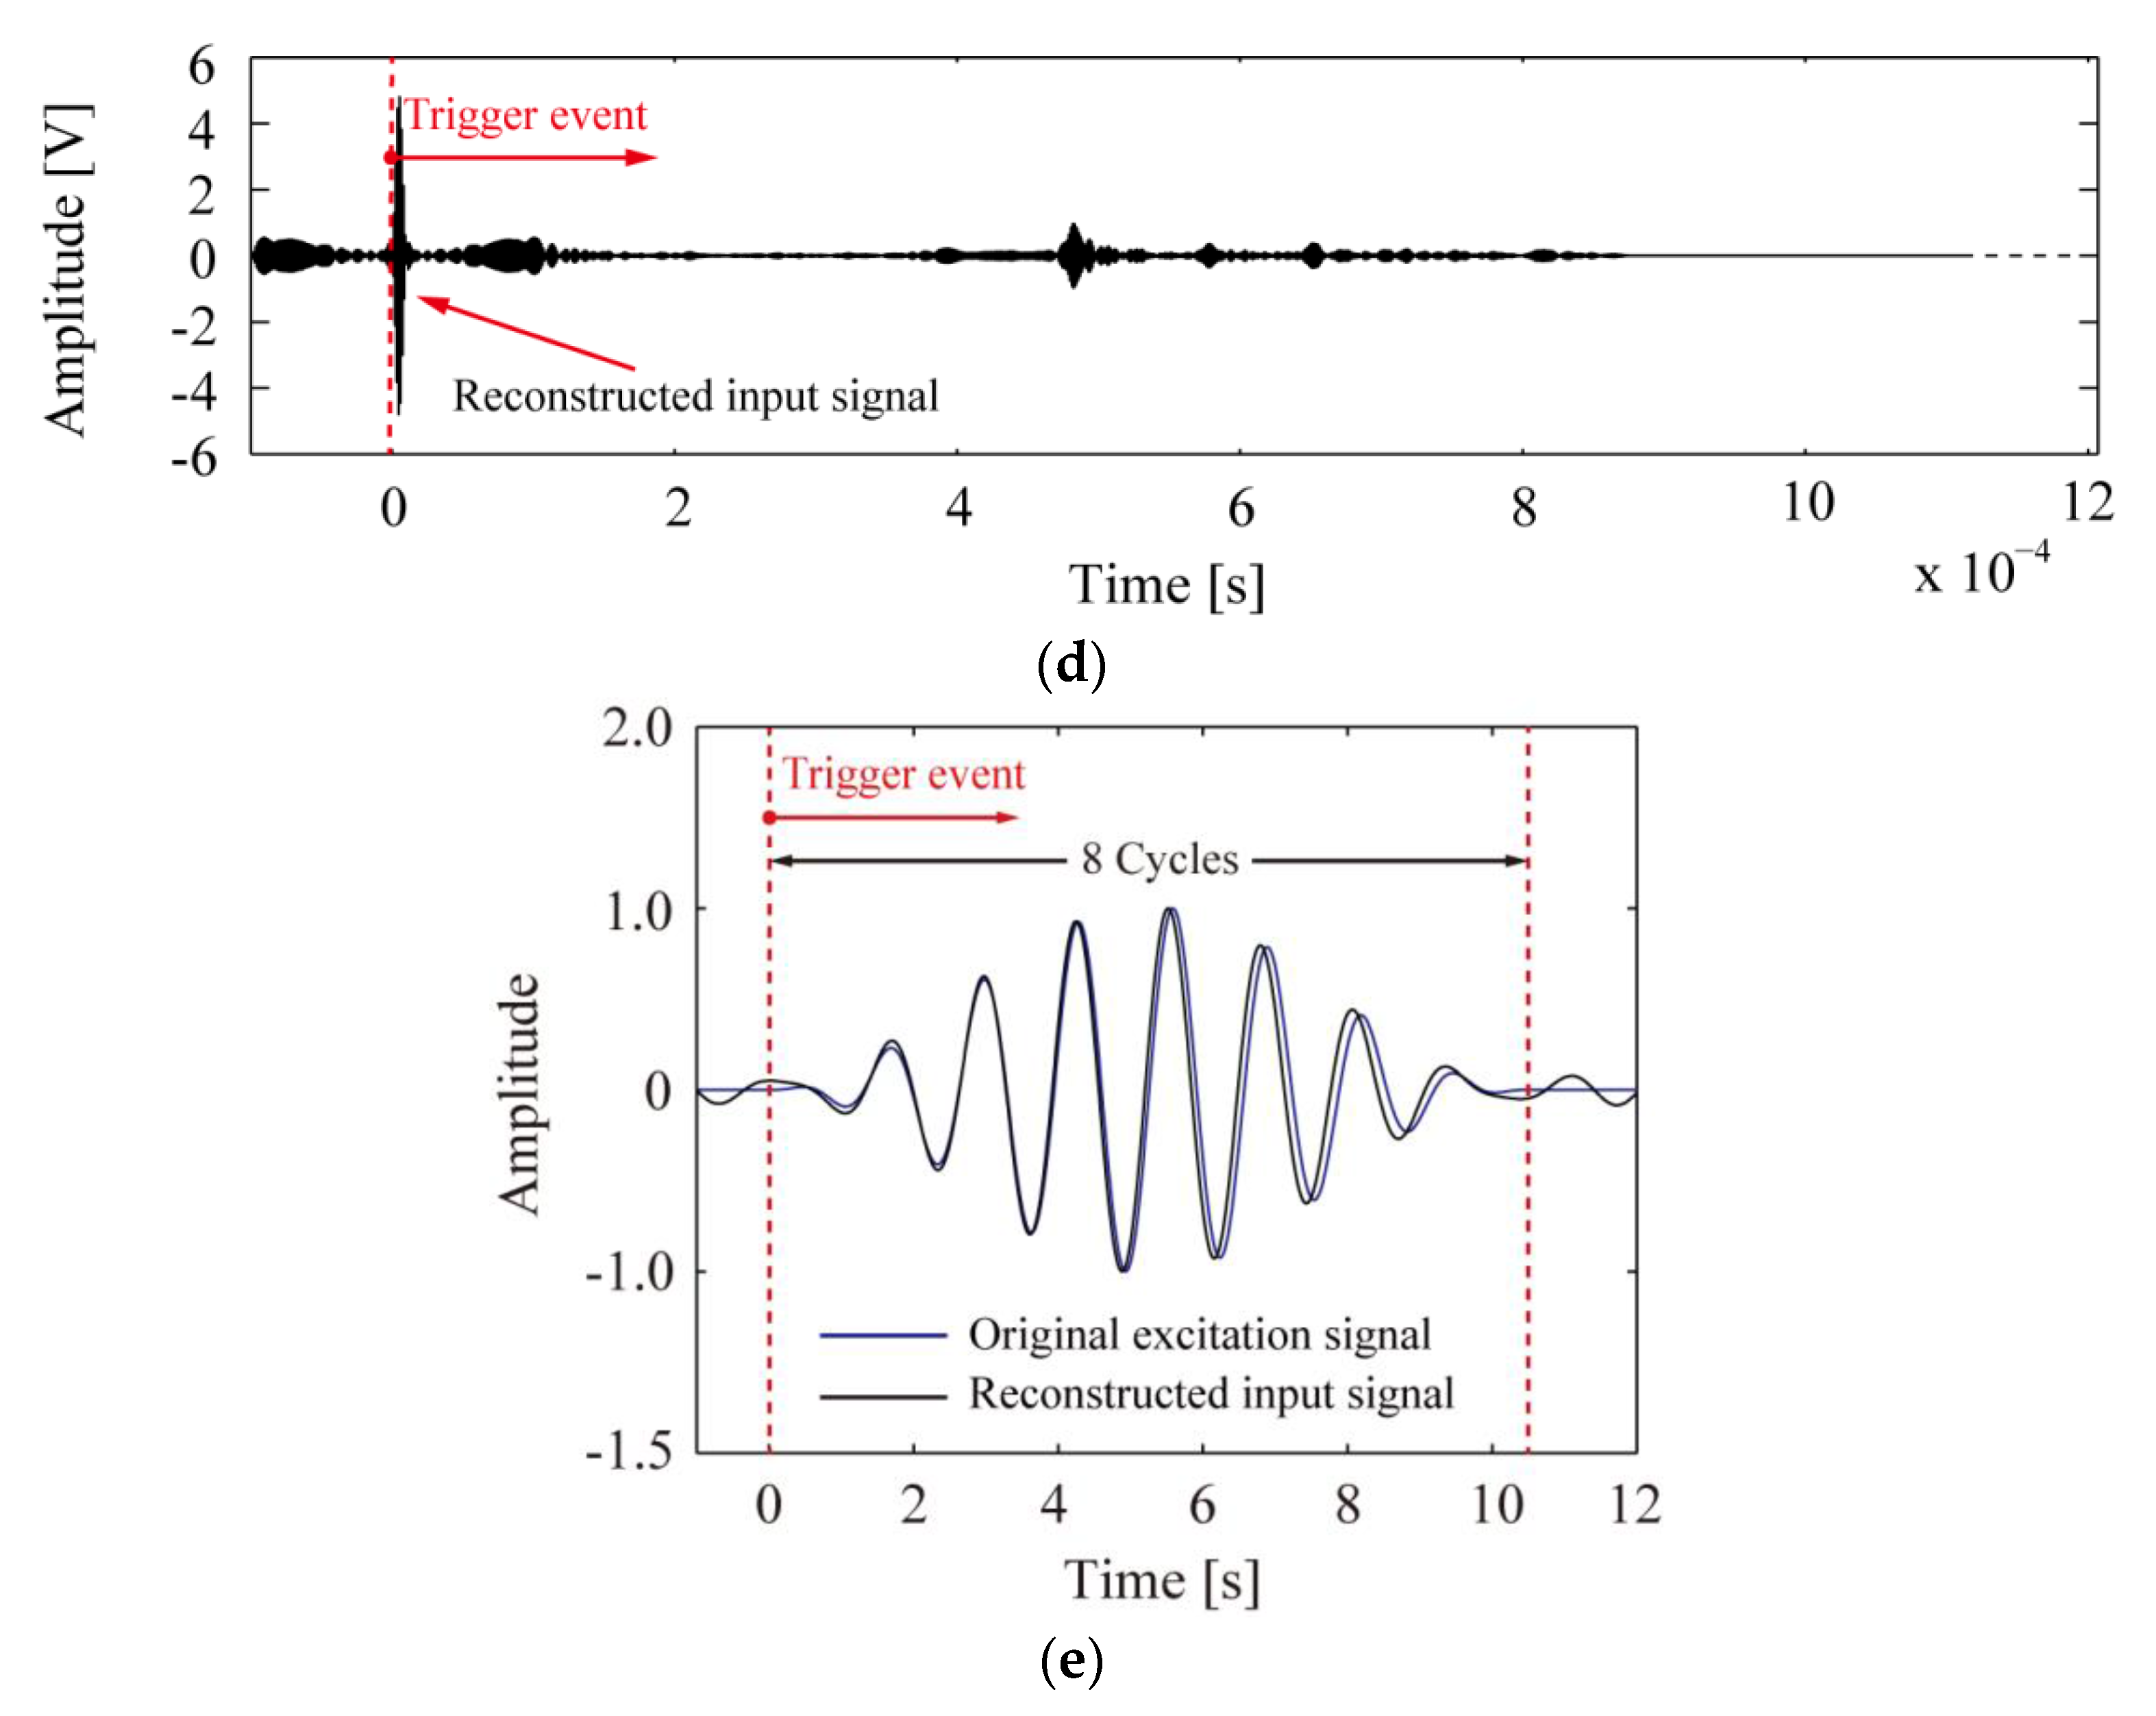
When a 8-cycle Hanning-windowed tone burst with the central frequency 760 kHz and the amplitude of 8 V shown in Figure 3a is applied to the actuator as an input signal, the response signal at the receiver mainly contains multiple modes of and , dispersion of which is relatively severe at the frequency. Furthermore, the both modes are of different transmission routes, namely, the direct path and the boundary reflected paths, as shown in Figure 3b. After the signal in Figure 3b is truncated at time , the extracted part is time reversed, normalized to the same amplitude as the original input signal, and then reemitted by the same actuator. Figure 3c shows the received signal after TRM and the reconstructed main band with no dispersion and more than 3 times improved amplitude. Reversing the signal in Figure 3c with respect to an axis of in accordance with Equation (7), the reconstructed input signal focuses on the trigger position exactly, which is obvious to see in Figure 3d, and bears a striking similarity to the original excitation signal particularly exhibited in Figure 3e.
4. Damage Detection Using TRM
4.1. Wave Selection for TRM
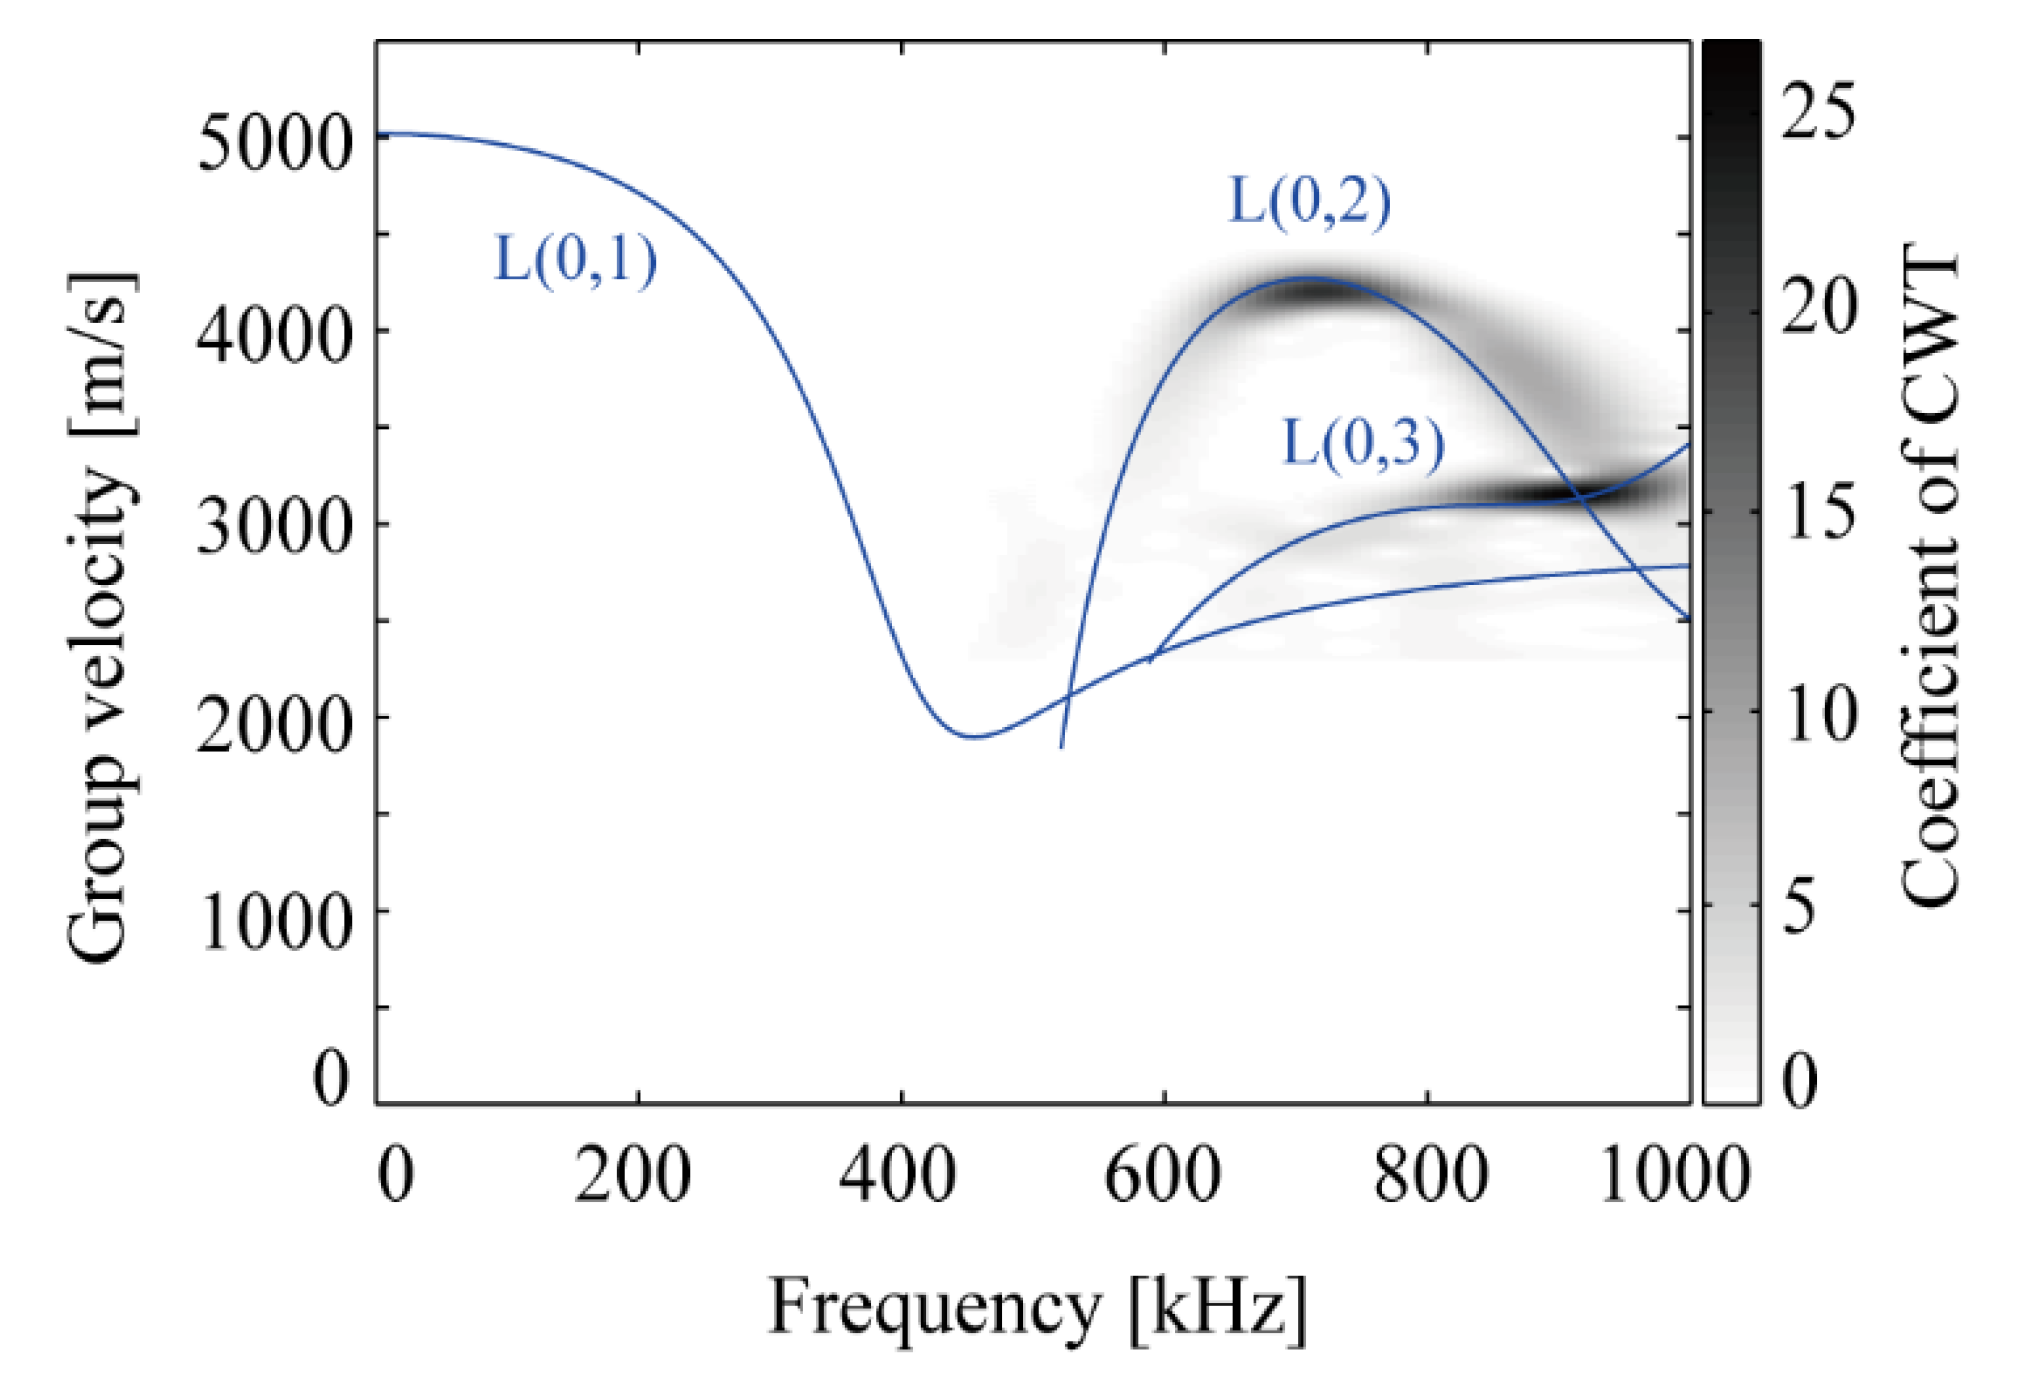
The propagation properties of guided waves along the rod are evaluated at frequencies from 500 to 1000 kHz, and the sweep frequency test is performed through exciting narrowband impulses in 10 kHz intervals. Continuous wavelet transform (CWT) is applied to analyze received signals, and the time and frequency information are presented along with the dispersion curve of a 7 mm diameter galvanized steel wire.
As shown in Figure 4, only mode is generated when the central frequencies of excitation are below 740 kHz. With the central frequencies progressively promoted above 750 kHz, mode is gradually increasing and coexists with mode . The 790 kHz is determined as the central frequency of excitation for damage detection, which will be elaborated in Section 5. Both the received modes and are approximately the same amplitude under the excitation of such frequency as illustrated in Figure 5.
4.2. Truncation Window Determination
The inevitability that both the direct waves and echoes from boundary will focus at the trigger point of data acquisition can breed confusion of damage detection. The practicable approach of solving this problem is to extract the defect scattered signal through a properly designed truncation window. , the signal of mode received by the sensor at 790 kHz, will last emerge in time domain within the direct guided waves due to the lowest group velocity shown in the Figure 4, and hence , the right side of are taken as the left side of the truncation window. Notably, because can be conveniently simulated depending on the equation
then can be predetermined consequently. Where, is the number of sampling points of frequency, and is the length of the rod. In terms of the right side of the truncation window , it should be set as the time when the first boundary reflection of the fastest mode arrives. The arriving time of direct mode can be clearly identified, so the time of its first boundary reflection is easily deduced as . The designed truncation window is shown in Figure 6.
4.3. Damage Detection Using TRM
The samples are divided into three groups to reduce the impact of machining error on the test results. Each group contains 5 galvanized steel wires with 7 mm diameter, approximate 1 m length and an artificial pitting corrosion in their respective middle position. The pitting gradually increases from 1 to 5 mm at 1 mm intervals, keeping 3 mm and 1 mm diameter on the surface and bottom respectively unchanged to highlight the influence of depth variation. The manufactured corrosive samples of one group and the sketch of configuration are shown in Figure 7.
As the inevitable discrepancies due to the different coupling conditions between the specimen and the transducers, a direct comparison between the signals from different testing samples may lead to an incorrect conclusion. A factor based on the energy of the received signal is introduced to approximately normalize the amplitudes of and after each time measurement for a more effective damage assessment. The factor is the Root-Mean-Square (RMS) of , represented as
where, is the number of sampling points before the first boundary echo of mode , is amplitude of sampling point. The normalized received signal and reconstructed input signal are shown as follows:
A 12-cycle Hanning-windowed tone burst is imposed on the actuator with a peak voltage of 8 V. The normalized received signals of the second group are exhibited in Figure 8a. It is illustrated that a quantitative evaluation for damages depending on is impossible, since the captured signals are extremely difficult to interpret in virtue of multimode, multipath and dispersion of guided waves propagation.
The defect scattered signals included in the truncation window are reversed, normalized to 8 V as the original excitation and then relaunched. In Figure 8b, with reference to the wires with 1 mm to 5 mm corrosive depths, focusing packets of emerge at the trigger point and their amplitudes increase evidently along with the aggravation of corrosion. However, in terms of a compared intact wire, there is no distinct focusing packet at the trigger point, which indicates that the truncated signals are not the defect scattered ones, but the system noise which can not be focused. It can be seen from Figure 9 that the reconstructed signal amplitudes of the three test samples exhibit almost the same linearly increasing trend in line with the growth of corrosive depth. The amplitudes of the focused wave packets improved by TRM is about 10 times that of the defect echoes directly used for damage quantification in the conventional testing method described in Section 5. In conclusion, TRM is a technique of relatively higher resolution corresponding to the variation of corrosive defects.
5. Comparison of Conventional Testing Method and TRM
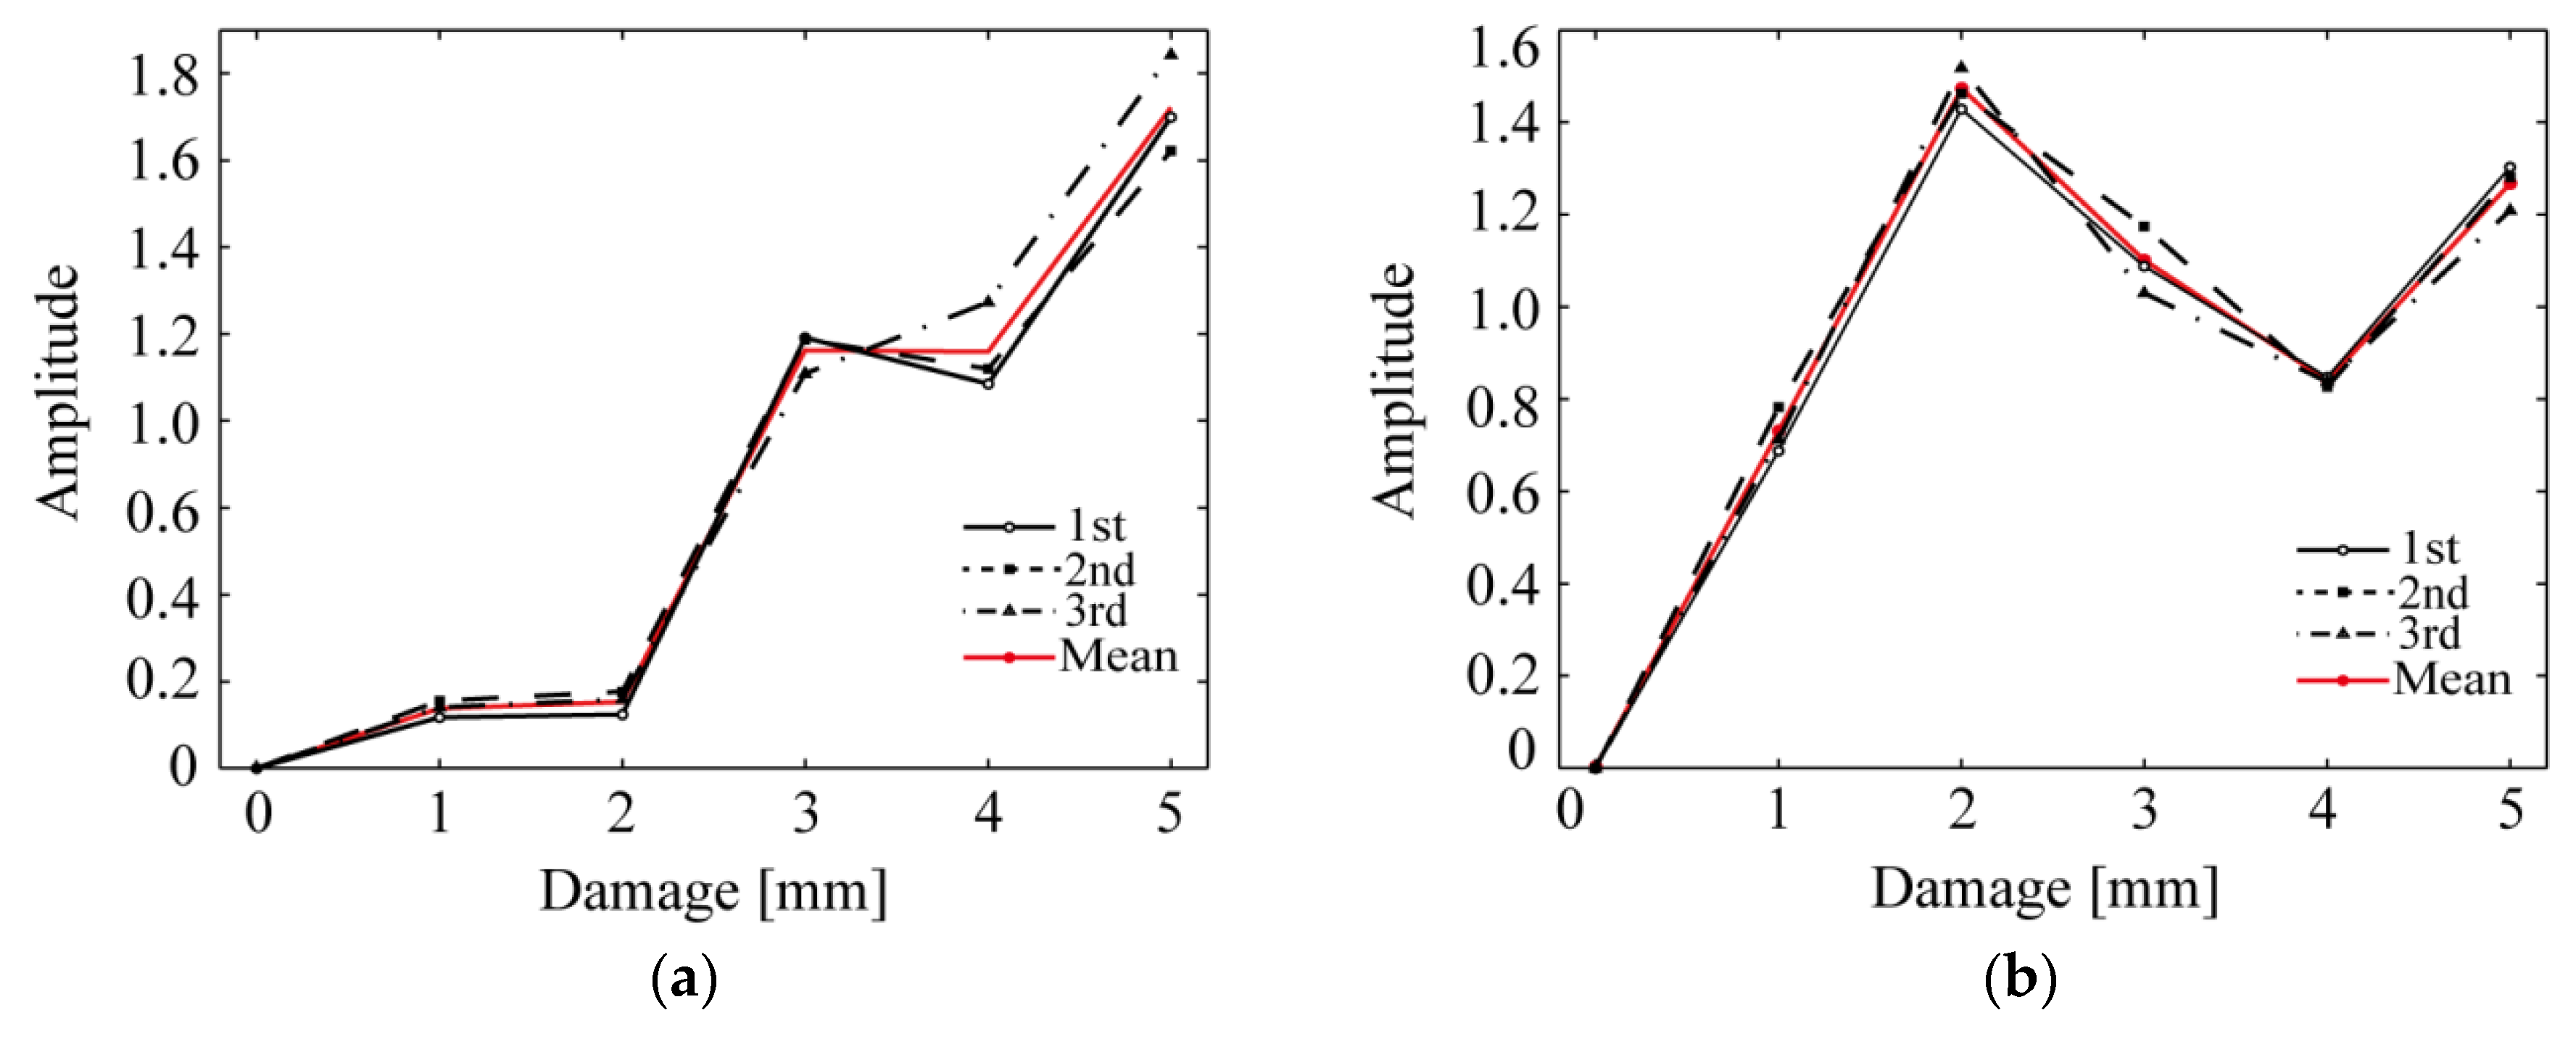
The dispersive behaviors of different modes are represented by dispersion curves like the ones shown in Figure 4. Mode , the only one which can be generated and received by the testing system in the frequency range between 0–200 kHz, is preferred as a candidate for damage detection because it is unnoticeably dispersed and apparently identified without disturbance from other modes. The point of minimum dispersion in mode at 700 kHz is at the point of maximum group velocity, which leads to the wave packet of mode easily separated from others to make accurate interpretation. For the foregoing reasons, modes and are generated at the central frequencies of 150 kHz and 700 kHz respectively under an excitation of 8 V, and then the normalized amplitudes of their defect echoes are applied to evaluate the damages as the conventional testing method in Ref. [5,6,27]. The results towards different depths are shown in Figure 10.
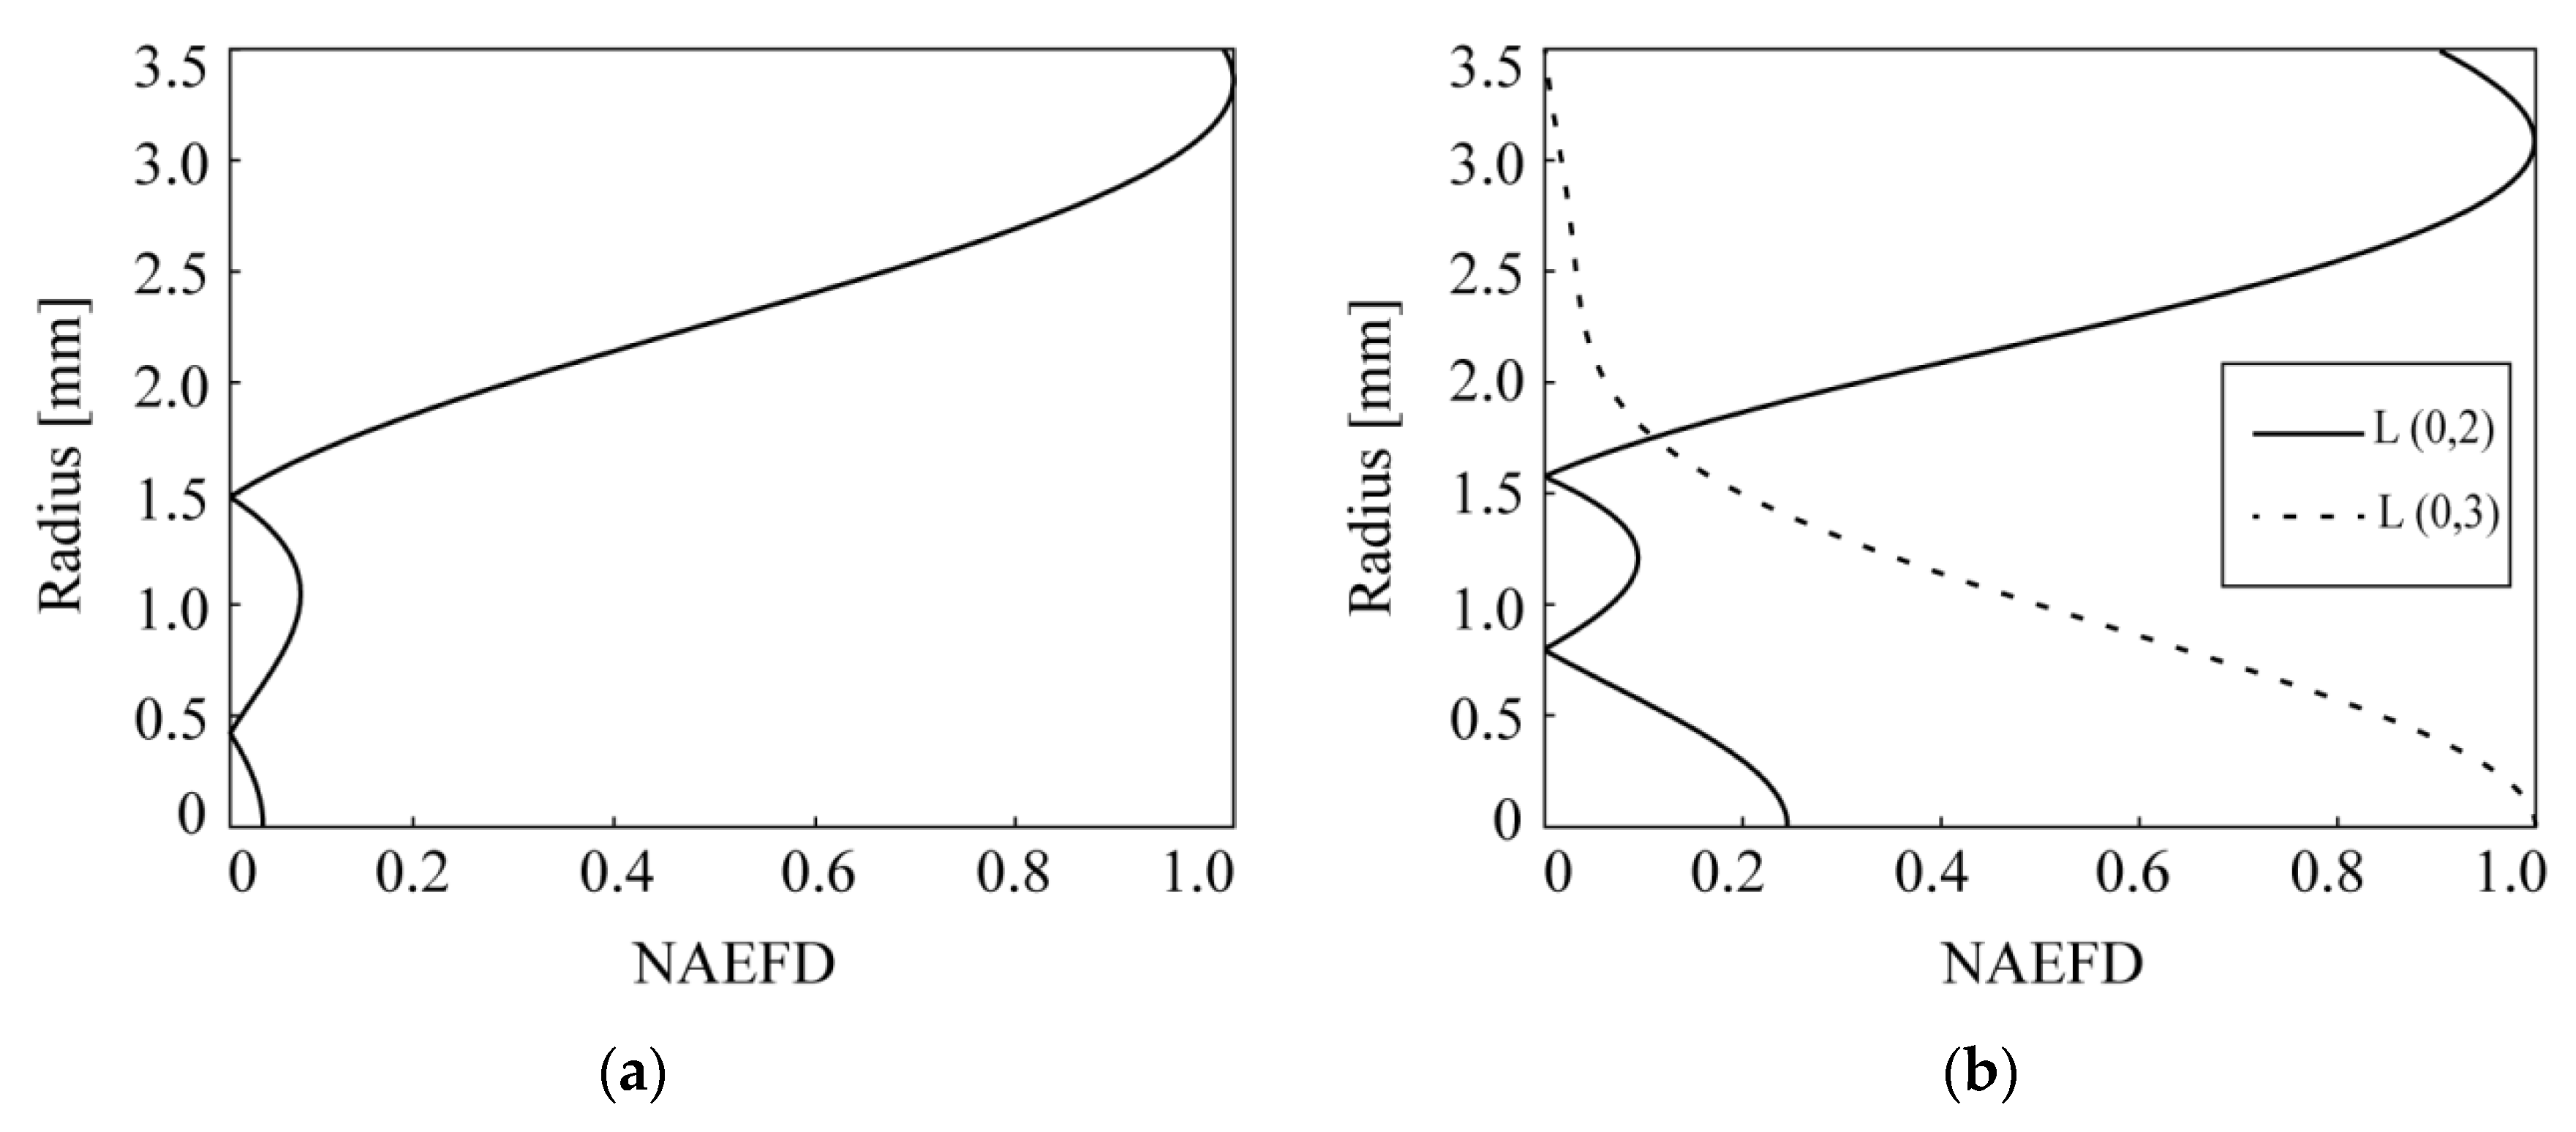
Regarding the results of mode shown in Figure 10a, the amplitudes corresponding to the aggravating damages rise with immensely different rates. Distinct increases occur at depths of 3 and 5 mm, but subtle changes occur at other points. It is reasonably deduced that only when the damage accumulates to some extent can feedback be given by mode , but the sensitivity is not sufficiently high to identify tiny variations for its excessively large wavelength at 150 kHz. With regard to the results of mode shown in Figure 10b, the amplitudes can properly indicate the damage increase within the depth of 2 mm. When the depth goes up to 3 mm, the amplitudes turn around to decrease unexpectedly, and then bounce up at 5 mm. The wavelength of mode at 700 kHz is much shorter; other than that, the NAPFD which is defined to describe the spatial distribution and transmitting direction of the wave energy has a significant surface distribution with respect to mode at 700 kHz, as illustrated in Figure 11a.
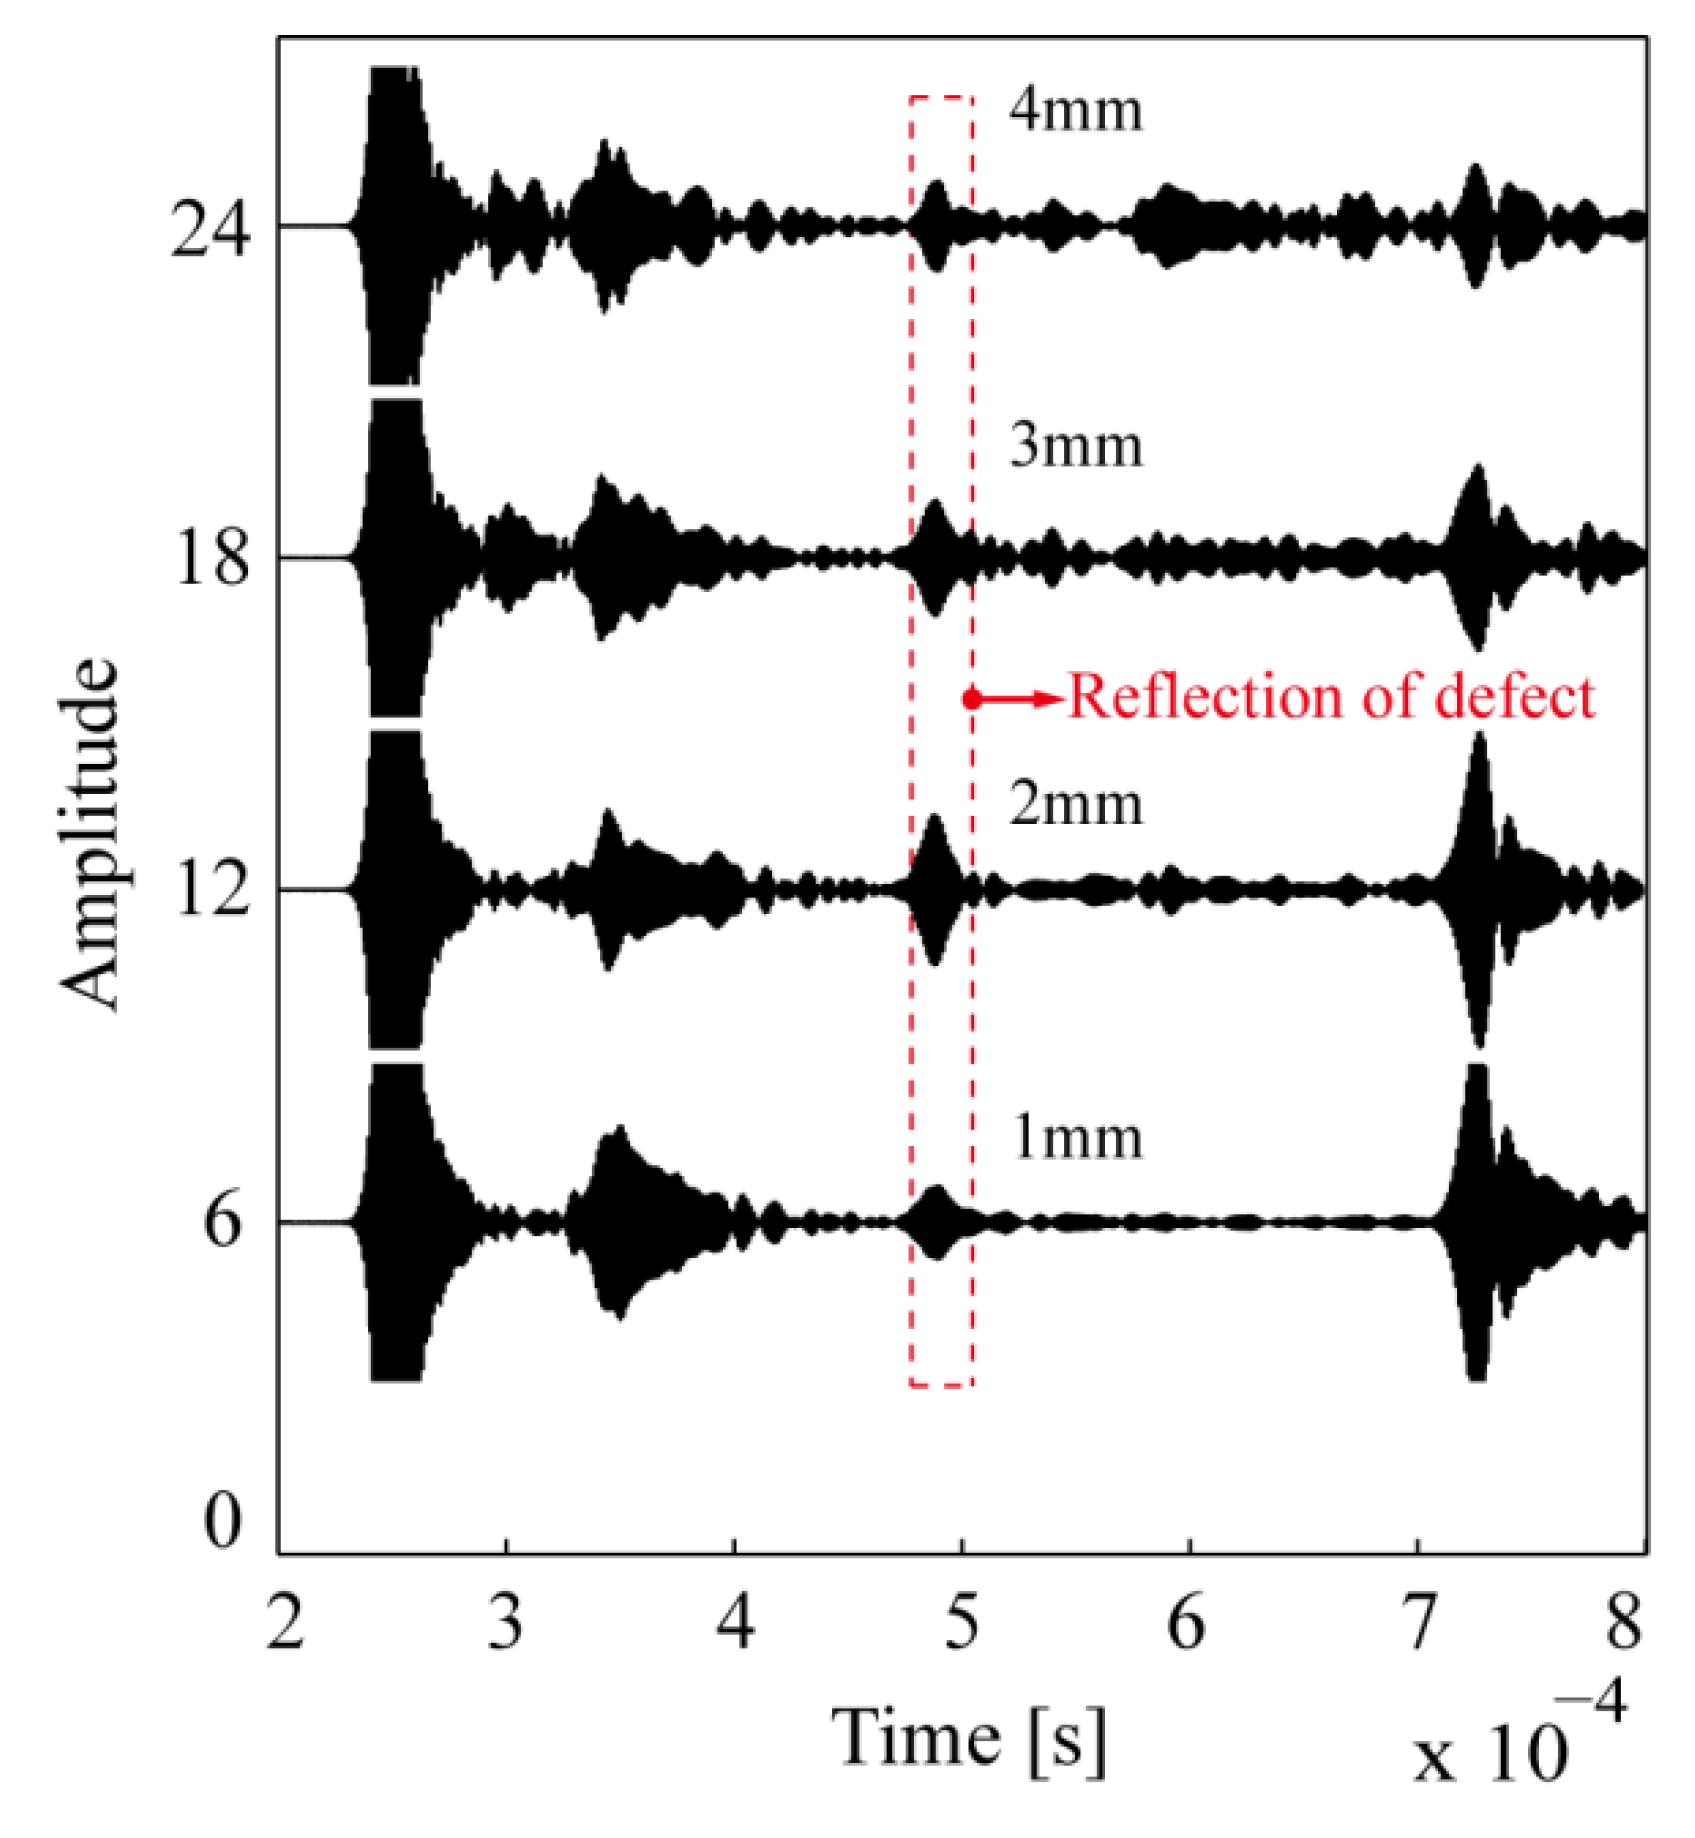
Both the characteristics demonstrate that mode is sensitive to superficial damage. However, with the continuous development of pitting, the interaction of the guided waves and the defect becomes increasingly complex, therefore mode is no longer the only component of the defect echoes. Other modes, which should have been suppressed, are aroused as well, and share the energy with mode . On the other hand, Figure 11a shows that the NAPFD of mode has a negligible component at the core area of the wire, which means that the energy increment contributing to the defect echo is bound to be minimal. As can be seen from Figure 12, when the damage depths are within 2 mm, the defect echoes of mode are evident while the other modes are suppressed well. Due to the increasingly remarkable multimode nature of guided waves at 3 mm depth, the amplitudes of defect echoes can not keep growing any more. When pitting reaches 4 mm, the defect echo of mode is hardly distinguished from the others, for it is no longer a dominant signal. To sum up, the amplitude of defect echo of mode at 700 kHz can not be utilized to indicate the entire historical development of corrosion damage.
Refer to the damage qualification using TRM presented in Section 4.3, mode is simultaneously generated with a large amplitude approximately equal to mode to indicate different damages universally. Notably, the NAPFD of mode , which concentrates in the core area of a wire, is strongly complementary with that of mode at 790 kHz, as illustrated in Figure 11b. Therefore, besides mode maintained for superficial damage detection, when the pitting further penetrates into the core area of the wire, a dramatical energy increment of the defect scattered signals is still ensured by mode . Attributing to the application of TRM, the highly dispersed energy resulting from multimode, multipath and dispersion of guided waves is utilized efficiently. An accurate interpretation towards pitting corrosion can be made based on the normalized amplitudes of wave packets focusing at the trigger point.
6. Conclusions
In this paper, a high-resolution monitoring method is proposed for the depth development diagnosis of pitting corrosion in rod-like waveguide. According to the multimode and multipath natures of guided waves propagation, two modes with a complementary radial distribution of the NAPFD are excited simultaneously to identify the defect development. The energy of the defect scattered signal is focused by TRM, which effectively overcomes the problem that the damage is inconclusively evaluated rooting in the hard interpreted signal originating from multimode, multipath and dispersion of guided waves propagation.
The method is verified to evaluate the 1 mm to 5 mm artificial pitting corrosion in the middle positions of galvanized steel wires. Mode , with the NAPFD profile concentrating on the surface of a wire, is suitable for seeking the tiny superficial defect in early time. Mode whose radial distribution of the NAPFD is centered in the core area of a wire is turned out to track the defect deep inside instead of Mode . The time-frequency representation of the swept signals at 790 kHz shows that modes and can be excited simultaneously and they are of approximately the same energy. The defect scattered signals were extracted by a truncation window determined by the proposed method to eliminate the direct signals that may cause erroneous judgment towards defect. In consideration of the inevitable discrepancies due to the different coupling conditions between the specimen and transducers, the amplitudes of the reconstructed signals are normalized by the RMS of the signals captured before the reflected wave packet of mode from the boundary. It is demonstrated that the amplitudes of the normalized reconstructed signals focused at the trigger point exhibit almost linearly increasing trend in line with the growing depth of pitting corrosion.
The conventional method of straight forward detection through the differential amplitudes of single mode echo from different defects is also applied to corrosion assessment. By contrast, the proposed approach integrating multimode excitation with TRM is proved to be able to potentially supply more definite entire historical information of pitting corrosion.
Acknowledgments
The authors are grateful for the financial support from National Natural Science Foundation of China (NSFC) under Grant Nos. 51478079 the Fundamental Research Funds for the Central Universities (Project No. DUT15LAB11) and Science and technology project of Fujian Province (Grant Nos. 2012Y0021).
Author Contributions
Yaoye Zhang, Dongsheng Li and Zhi Zhou conceived and designed the experiments; Yaoye Zhang performed the experiments and analyzed the data; Dongsheng Li contributed analysis and checked the paper; Yaoye Zhang wrote the paper.
Conflicts of Interest
The authors declare no conflicts of interest.
References
- Li, S.; Xu, Y.; Li, H.; Guan, X.C. Uniform and pitting corrosion modeling for high-Strength bridge wires. J. Bridge Eng. 2014, 19, 04014025. [Google Scholar] [CrossRef]
- Fougeres, A.L.; Holm, S.; Rootzen, H. Pitting corrosion: Comparison of treatments with extreme-Value-Distributed responses. Technometrics 2006, 48, 262–272. [Google Scholar] [CrossRef]
- Valor, A.; Caleyo, F.; Alfonso, L.; Velázquez, J.; Hallen, J. Markov chain models for the stochastic modeling of pitting corrosion. Math. Probl. Eng. 2013, 2013. [Google Scholar] [CrossRef]
- Catbas, F.N.; Susoy, M.; Frangopol, D.M. Structural health monitoring and reliability estimation: Long span truss bridge application with environmental monitoring data. Eng. Struct. 2008, 30, 2347–2359. [Google Scholar] [CrossRef]
- Rose, J.L. Ultrasonic Waves in Solid Media; Cambridge Press: Cambridge, UK, 2004. [Google Scholar]
- Wu, B.; Qi, W.; He, C.; Zhou, J. Recognition of defects on steel rod using ultrasonic guided waves bases on neural network. Eng. Mech. 2013, 30, 470–476. (In Chinese) [Google Scholar]
- Amjad, U.; Yadav, S.K.; Kundu, T. Detection and quantification of diameter reduction due to corrosion in reinforcing steel bars. Struct. Health Monit. 2015, 14, 532–543. [Google Scholar] [CrossRef]
- Farhidzadeh, A.; Salamone, S. Reference-Free corrosion damage diagnosis in steel strands using guided ultrasonic waves. Ultrasonics 2015, 57, 198–208. [Google Scholar] [CrossRef] [PubMed]
- Beard, M.D. Guided Wave Inspection of Embedded Cylindrical Structures; Imperial College: London, UK, 2002. [Google Scholar]
- Beard, M.D.; Lowe, M.J.S.; Cawley, P. Development of a guided wave inspection technique for rock bolts. Quant. Nondestruct. Eval. API Publ. 2002, 615, 1318–1325. [Google Scholar]
- Pavlakovic, B.N. Leaky Guided Ultrasonic Waves in NDT; Imperial College of Science Technology and Medicine: London, UK, 1998. [Google Scholar]
- Pavlakovic, B.N.; Lowe, M.J.S.; Cawley, P. High-Frequency low-Loss ultrasonic modes in imbedded bars. J. Appl. Mech. ASME 2001, 68, 67–75. [Google Scholar] [CrossRef]
- Ervin, B.L.; Kuchma, D.A.; Bernhard, J.T.; Reis, H. Monitoring Corrosion of Rebar Embedded in Mortar Using High-Frequency Guided Ultrasonic Waves. J. Eng. Mech. ASCE 2009, 135, 9–19. [Google Scholar] [CrossRef]
- Sharma, S.; Mukherjee, A. Longitudinal Guided Waves for Monitoring Chloride Corrosion in Reinforcing Bars in Concrete. Struct. Health Monit. 2010, 9, 555–567. [Google Scholar] [CrossRef]
- Philtron, J.H.; Rose, J.L. Mode perturbation method for optimal guided wave mode and frequency selection. Ultrasonics 2014, 54, 1817–1824. [Google Scholar] [CrossRef] [PubMed]
- Ma, S.Y.; Wu, Z.J.; Liu, K.H.; Wang, Y.S. Longitudinal guided waves in pipes excited by non-Axisymmetric multielement surface loading. J. Vib. Shock 2015, 90–97. (In Chinese) [Google Scholar] [CrossRef]
- Draeger, C.; Aime, J.C.; Fink, M. One-Channel time-Reversal in chaotic cavities: Experimental results. J. Acoust. Soc. Am. 1999, 105, 618–625. [Google Scholar] [CrossRef]
- Draeger, C.; Fink, M. One-Channel time-Reversal in chaotic cavities: Theoretical limits. J. Acoust. Soc. Am. 1999, 105, 611–617. [Google Scholar] [CrossRef]
- Fink, M. Time-Reversal of ultrasonic fields 1. basic principles. IEEE Trans. Ultrason. Ferroelectr. 1992, 39, 555–566. [Google Scholar] [CrossRef] [PubMed]
- Wang, C.H.; Rose, J.T.; Chang, F.K. A computerized time-reversal method for structural health monitoring. In Proceedings of the SPIE—The International Society for Optical Engineering, San Diego, CA, USA, 3–5 March 2003; pp. 48–58. [Google Scholar]
- Park, H.W.; Kim, S.B.; Sohn, H. Understanding a time reversal process in Lamb wave propagation. Wave Motion 2009, 46, 451–467. [Google Scholar] [CrossRef]
- Park, H.W.; Sohn, H.; Law, K.H.; Farrar, C.R. Time reversal active sensing for health monitoring of a composite plate. J. Sound. Vib. 2007, 302, 50–66. [Google Scholar] [CrossRef]
- Kang, T.; Lee, D.H.; Song, S.J.; Kim, H.J.; Jo, Y.D.; Cho, H.J. Enhancement of detecting defects in pipes with focusing techniques. NDT E Int. 2011, 44, 178–187. [Google Scholar] [CrossRef]
- Li, J.; Rose, J.L. Implementing guided wave mode control by use of a phased transducer array. IEEE Trans. Ultrason. Ferroelectr. 2001, 48, 761–768. [Google Scholar] [CrossRef]
- Luo, W.; Rose, J.L. Phased array focusing with guided waves in a viscoelastic coated hollow cylinder. J. Acoust. Soc. Am. 2007, 121, 1945–1955. [Google Scholar] [CrossRef] [PubMed]
- Liu, Z.H.; Xu, Q.L.; Gong, Y.; He, C.F.; Wu, B. A new multichannel time reversal focusing method for circumferential Lamb waves and its applications for defect detection in thick-walled pipe with large-Diameter. Ultrasonics 2014, 54, 1967–1976. [Google Scholar] [CrossRef] [PubMed]
- Zhou, J.; He, C.; Zheng, Y.; Wu, B. Ultrasonic guided wave time reversal method with single transducer fordefect inspection on rod. J. Mech. Eng. 2013, 49, 19–24. (In Chinese) [Google Scholar] [CrossRef]
- Mustapha, S.; Lu, Y.; Li, J.C.; Ye, L. Damage detection in rebar-reinforced concrete beams based on time reversal of guided waves. Struct. Health Monit. 2014, 13, 347–358. [Google Scholar] [CrossRef]
- Watkins, R.; Jha, R. A modified time reversal method for Lamb wave based diagnostics of composite structures. Mech. Syst. Signal Process. 2012, 31, 345–354. [Google Scholar] [CrossRef]
Figure 1.
Illustration of two propagating ways in the direct transmission route.
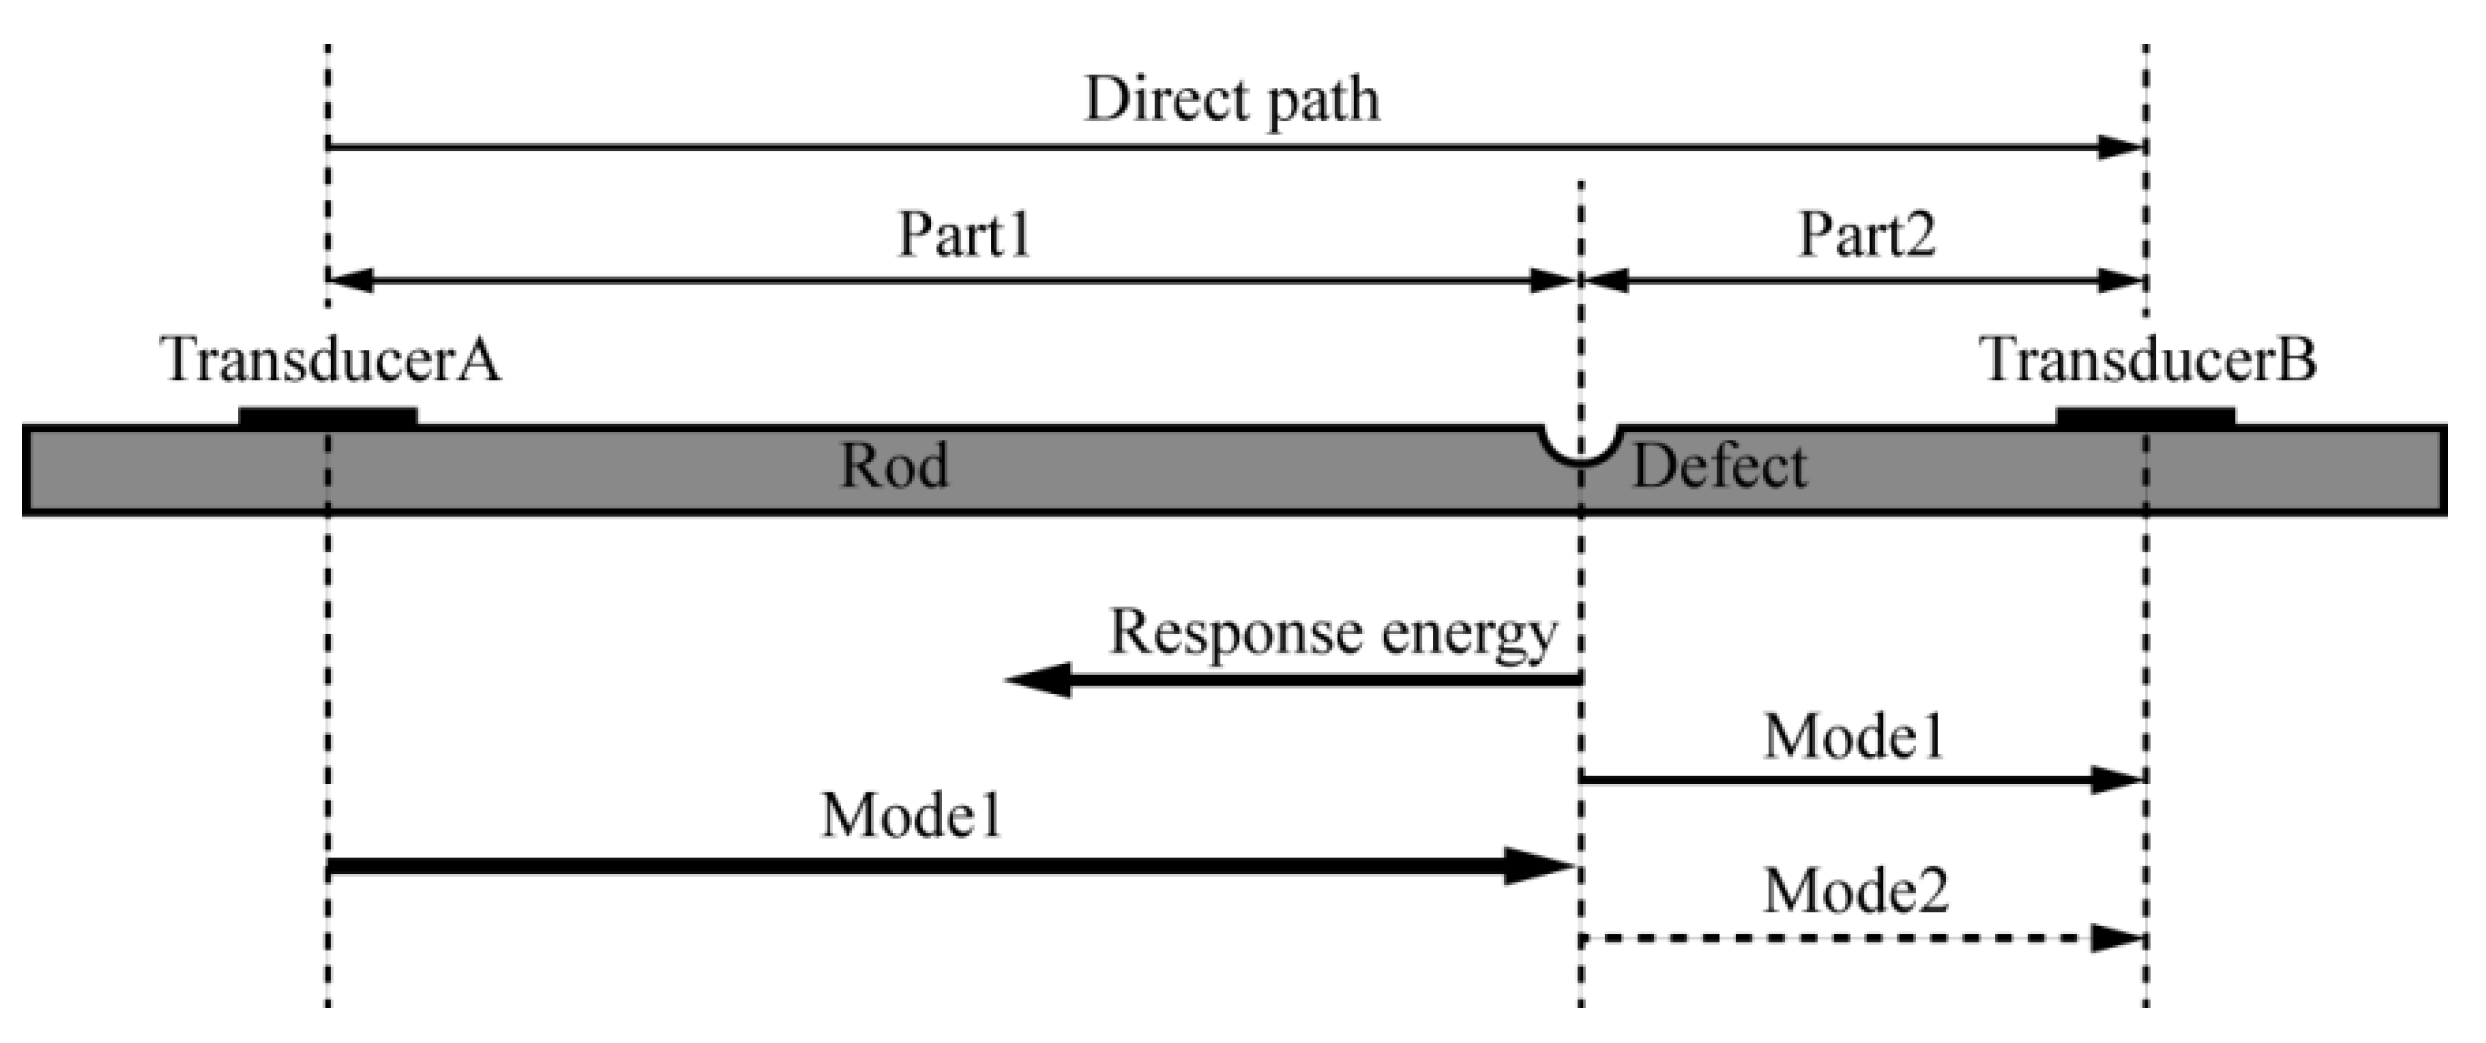
Figure 2.
Experimental setup overview.
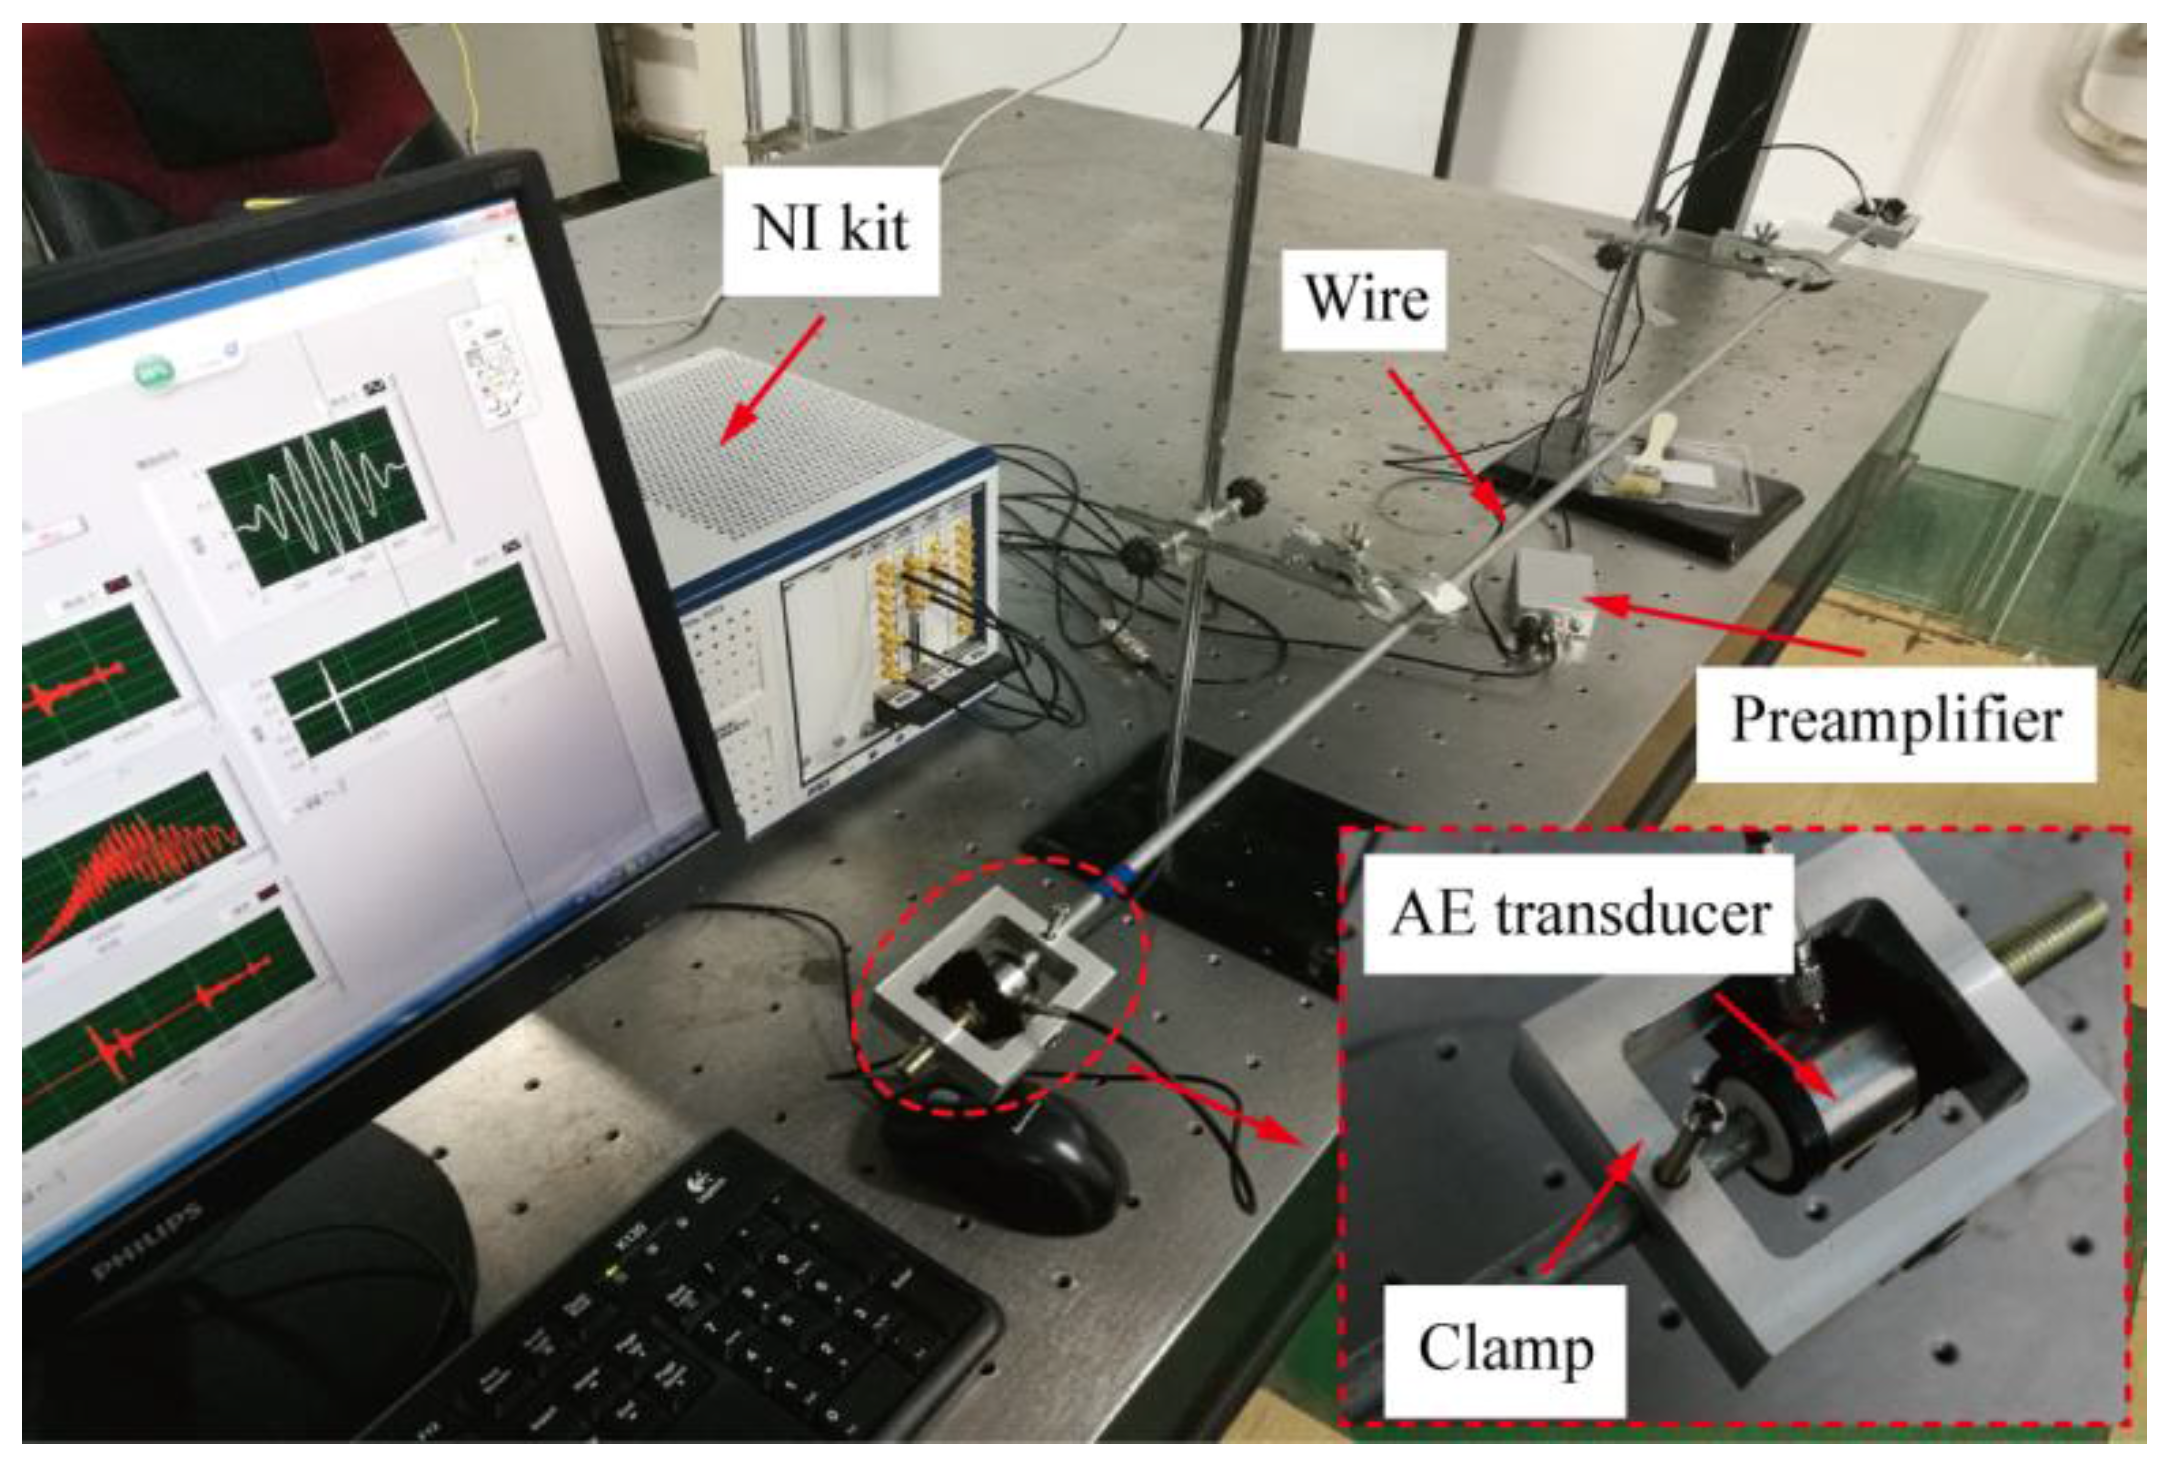
Figure 3.
TRM process of multimode and multipath. (a) Original excitation signal; (b) Received signals of multimode and multipath due to original excitation signal; (c) Received signal after TRM; (d) Reconstructed input signal; (e) Comparison between normalized reconstructed input signal and original excitation signal.


Figure 4.
Group velocity dispersion curves of longitudinal modes for a 7 mm diameter galvanized steel wire.
Figure 4.
Group velocity dispersion curves of longitudinal modes for a 7 mm diameter galvanized steel wire.

Figure 5.
Response signal due to the 12-cycle tone burst excitation at 790 kHz.
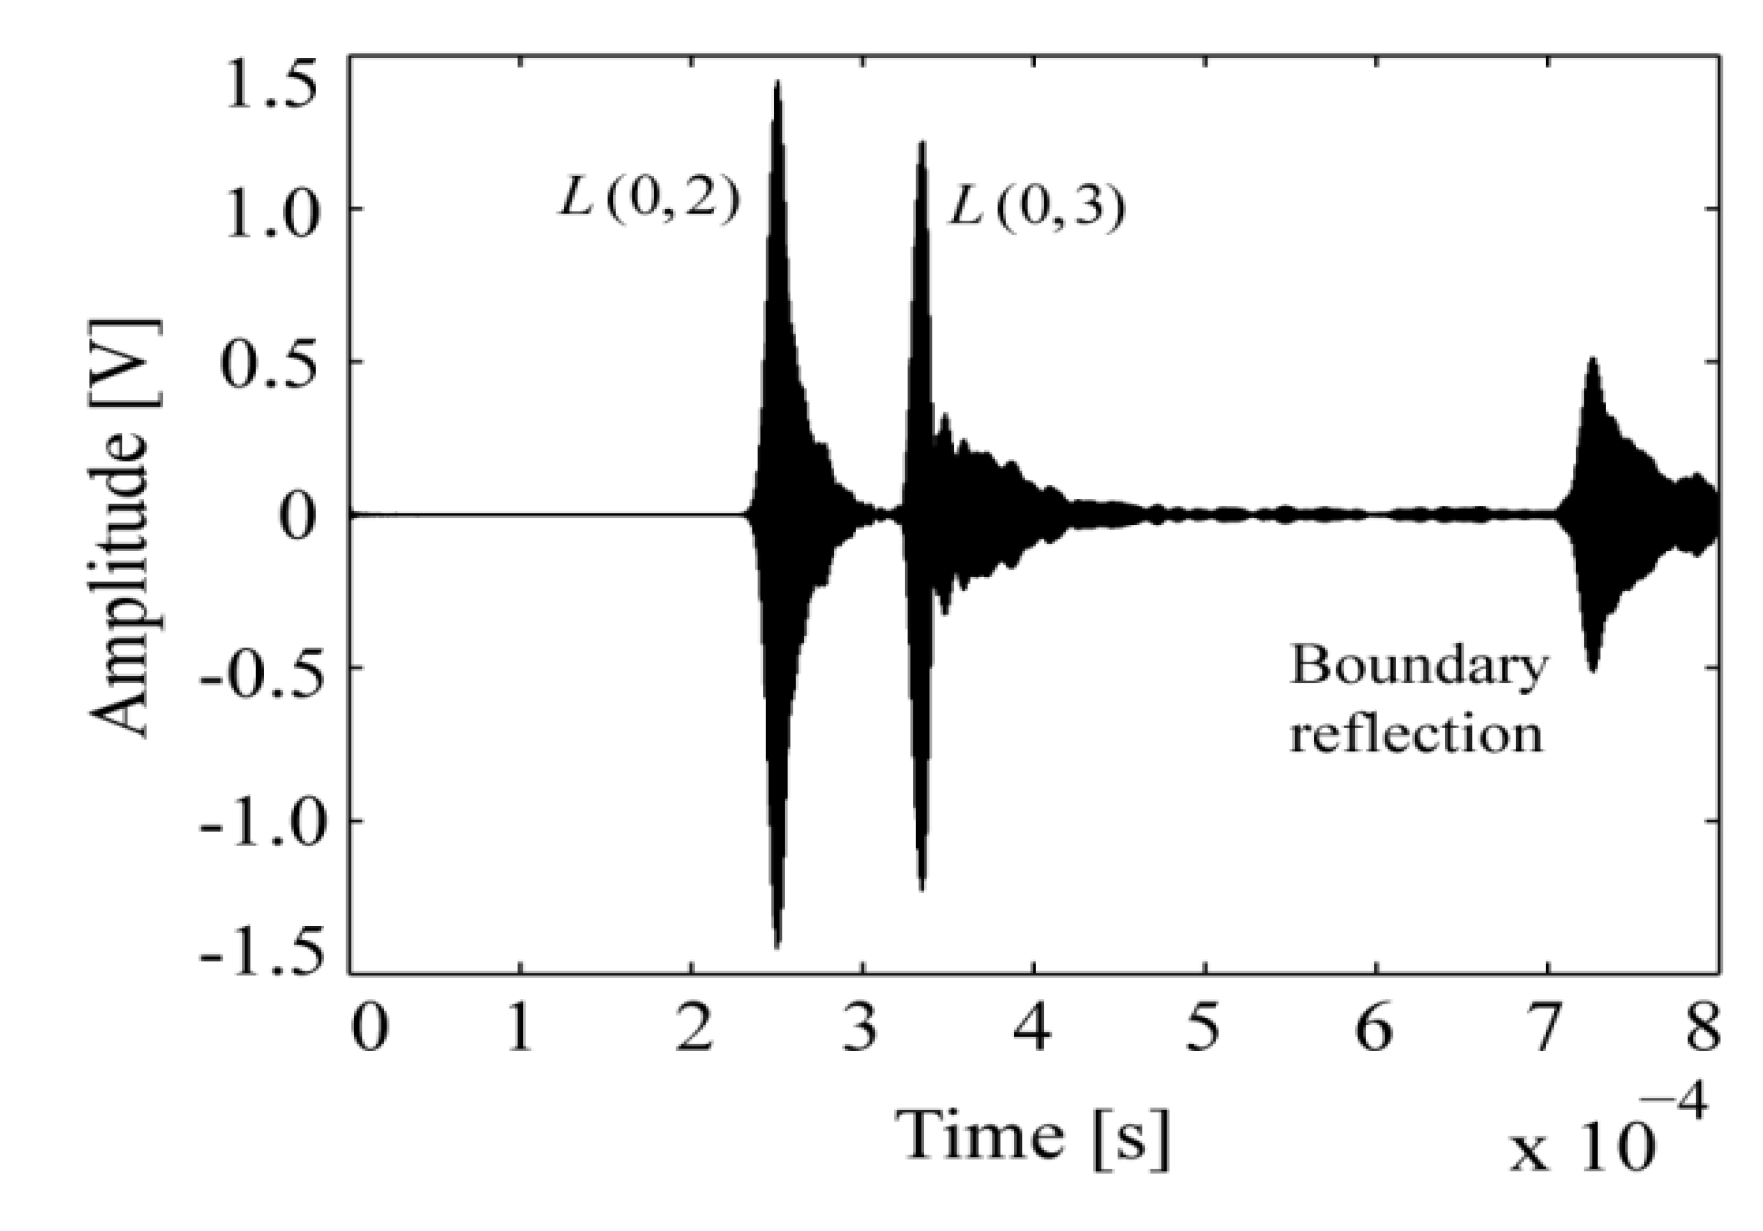
Figure 6.
Truncation window for defect scatter signals extraction.
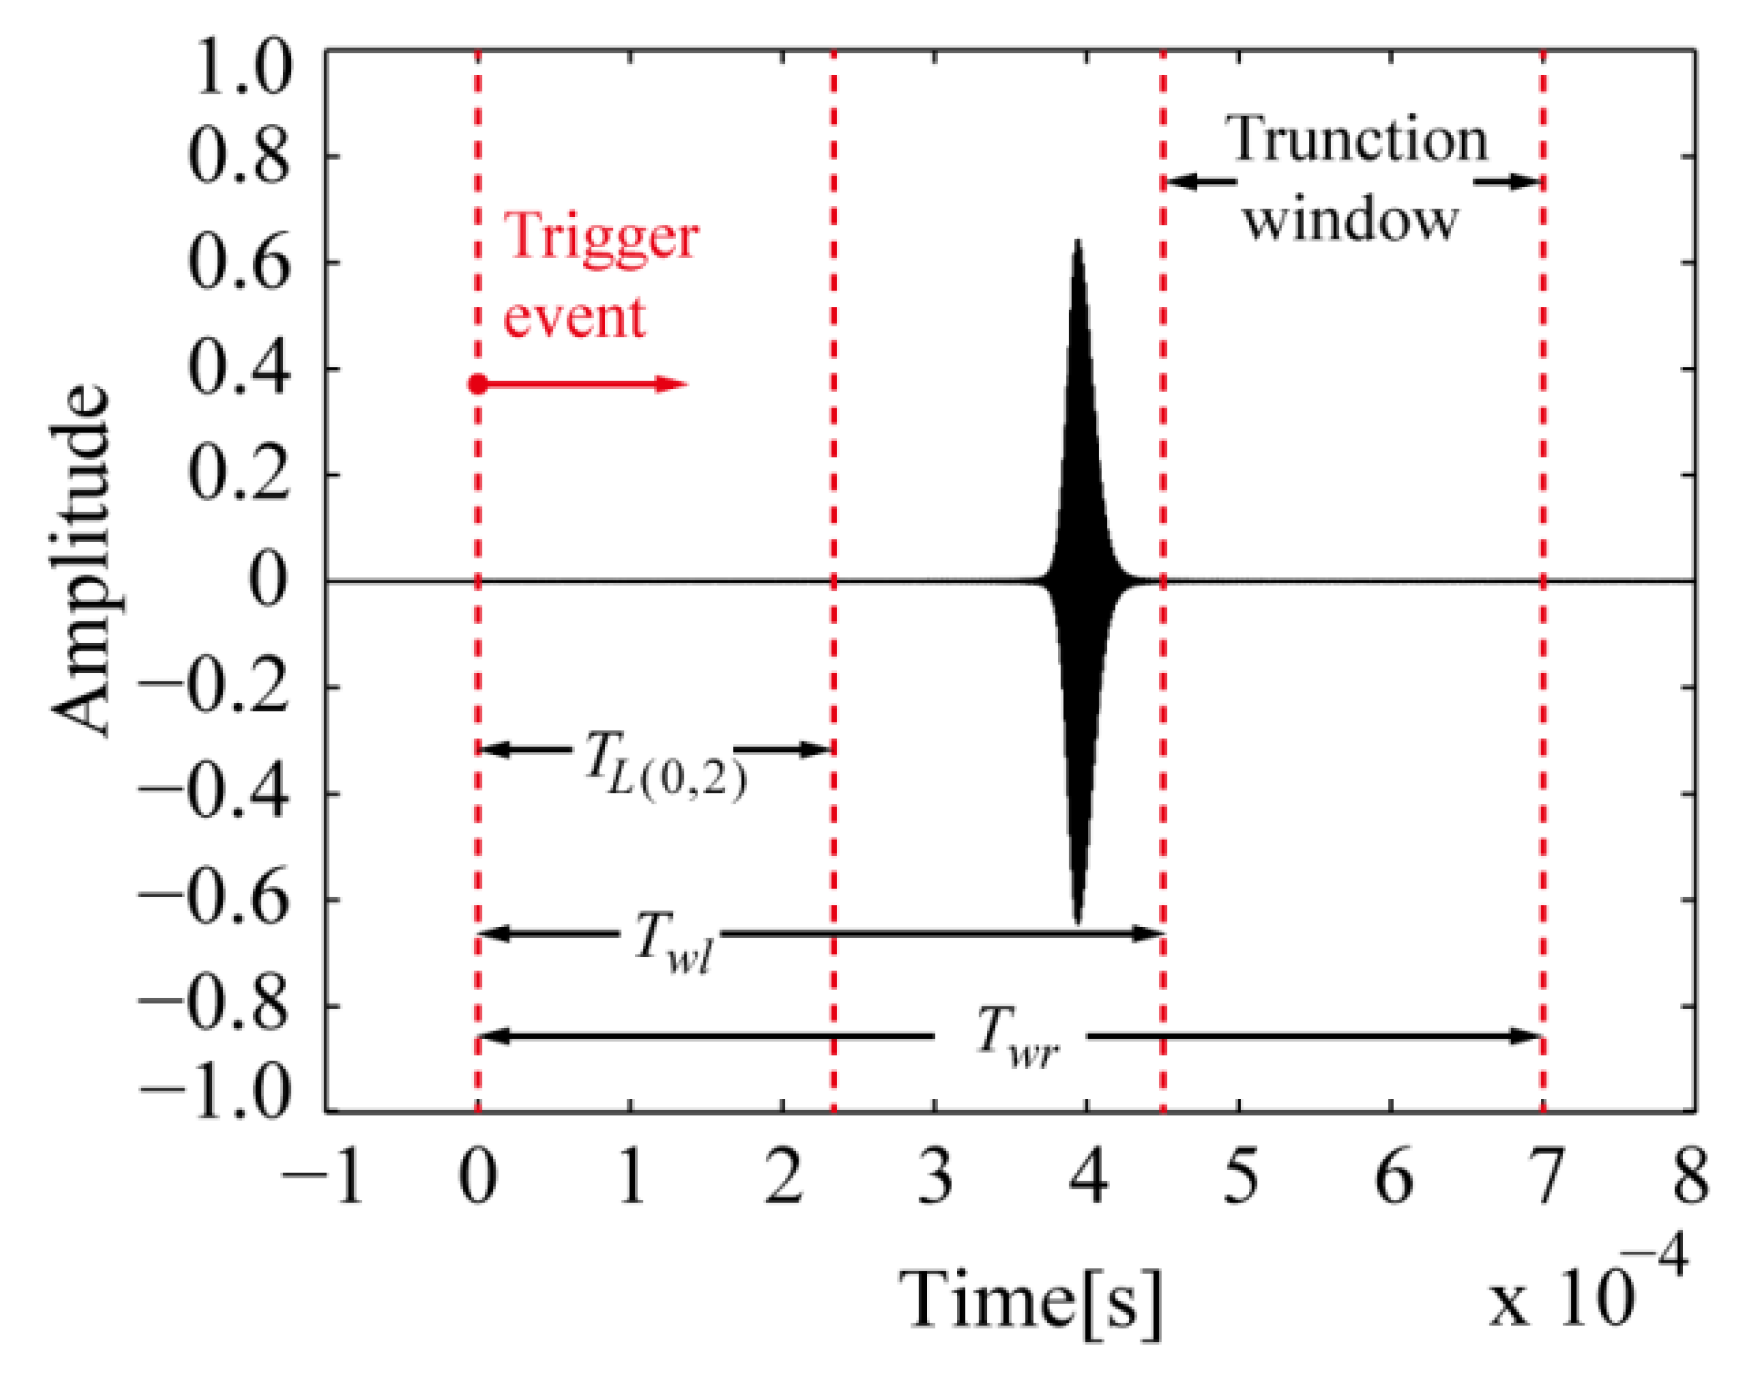
Figure 7.
Artificial pitting corrosion: (a) samples of one group; (b) configuration.
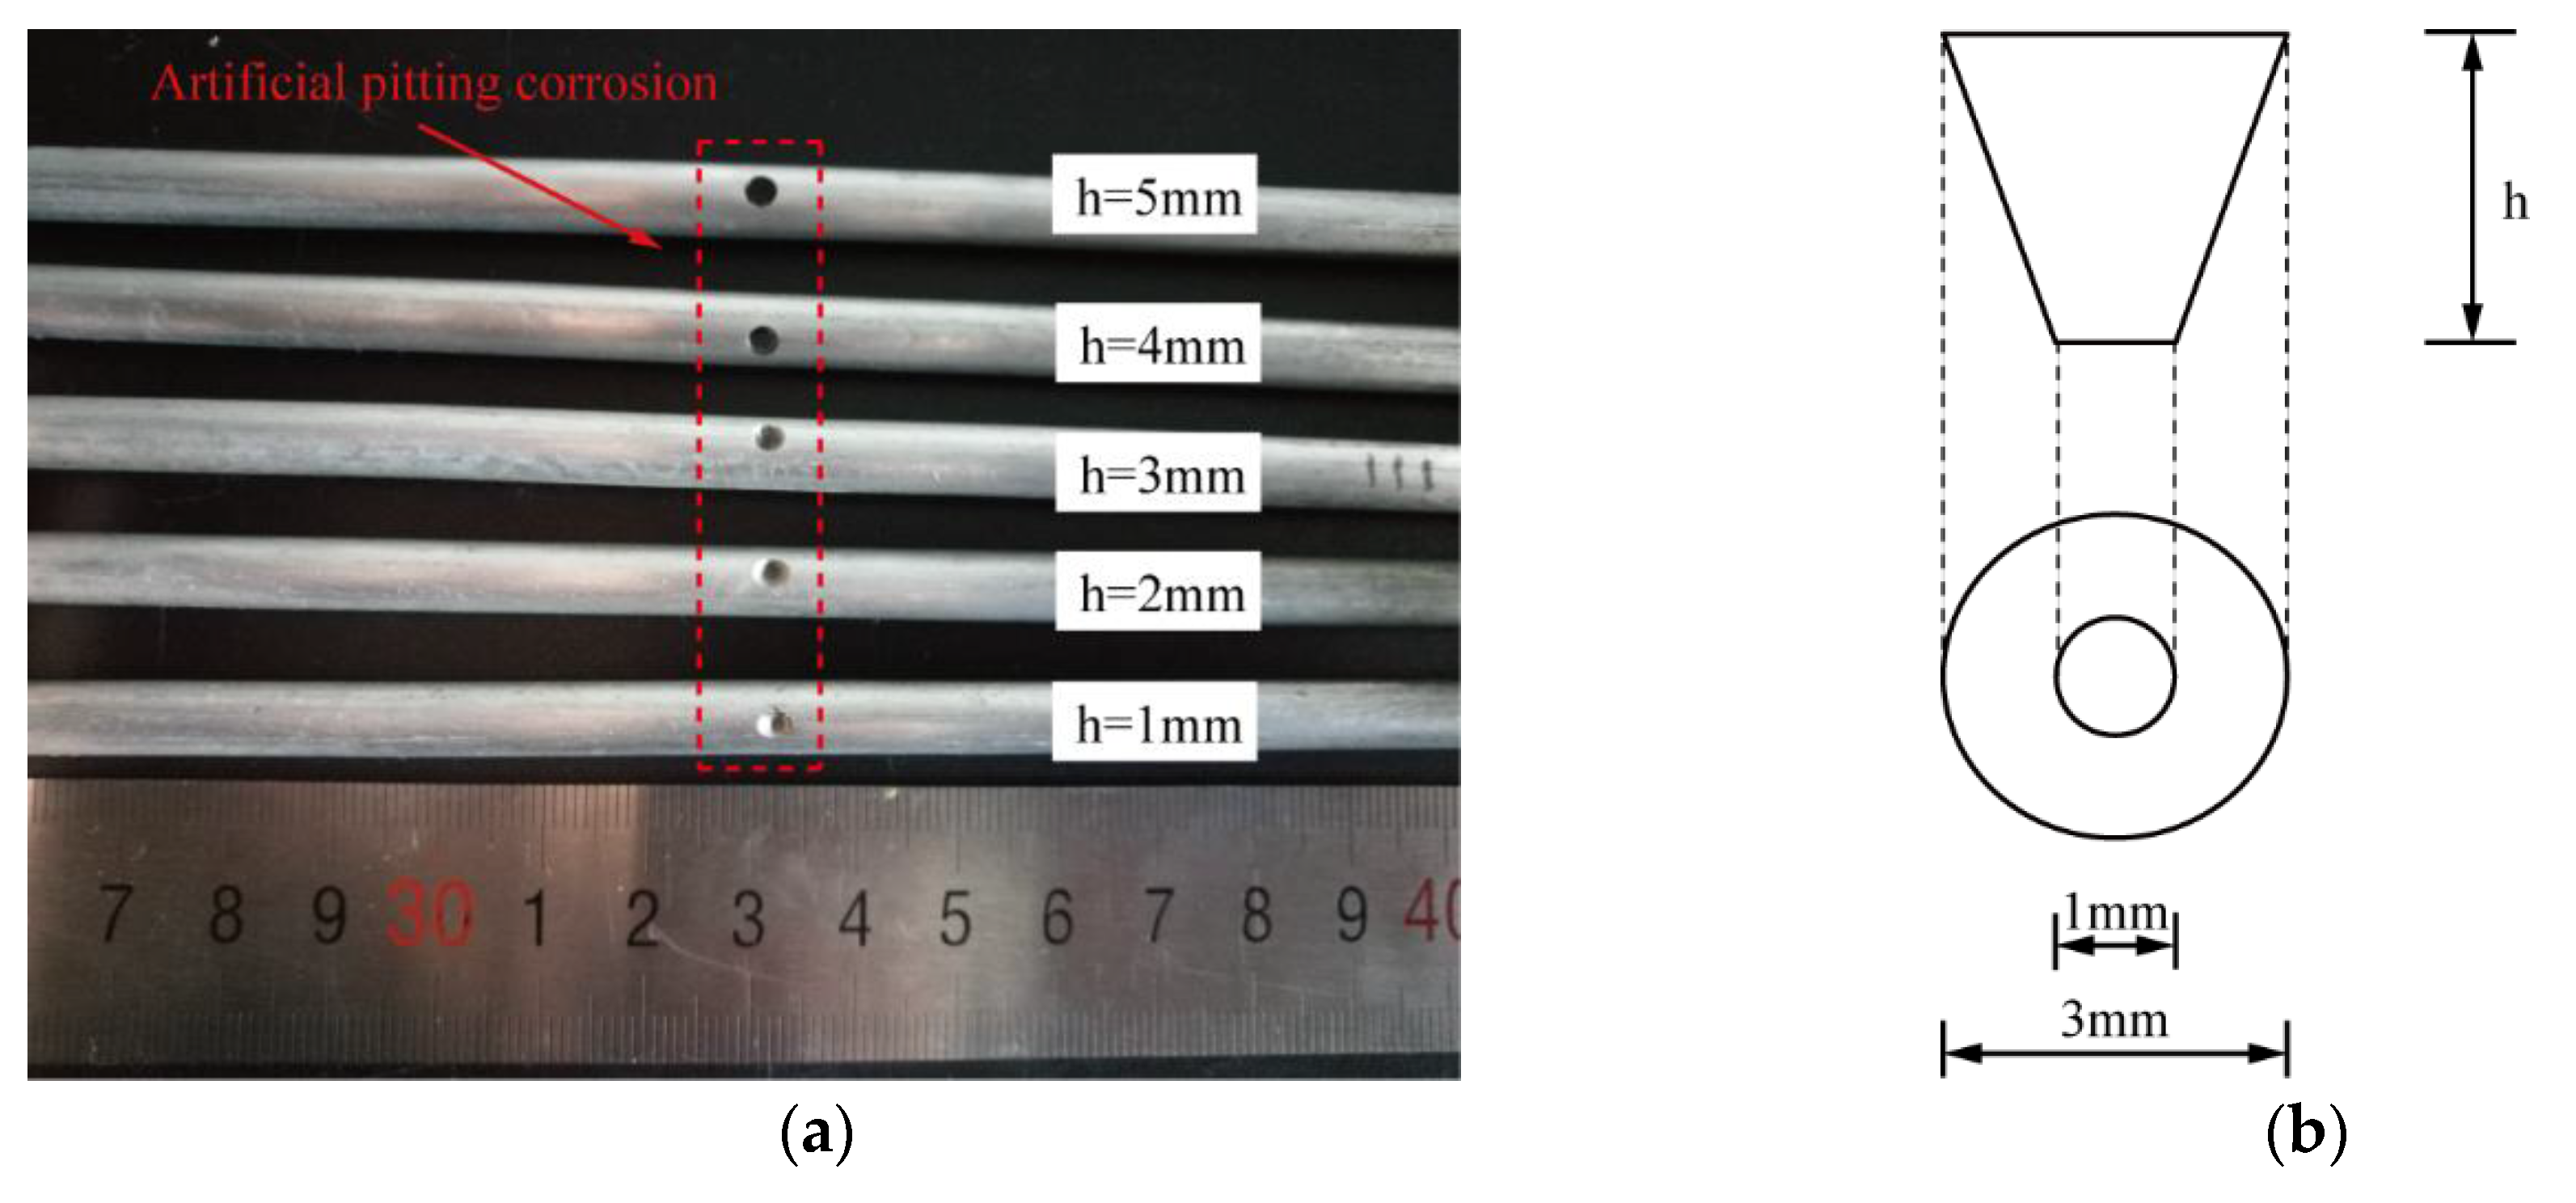
Figure 8.
TRM process of defect assessment: (a) received signals before TRM; (b) received signals after TRM.
Figure 8.
TRM process of defect assessment: (a) received signals before TRM; (b) received signals after TRM.
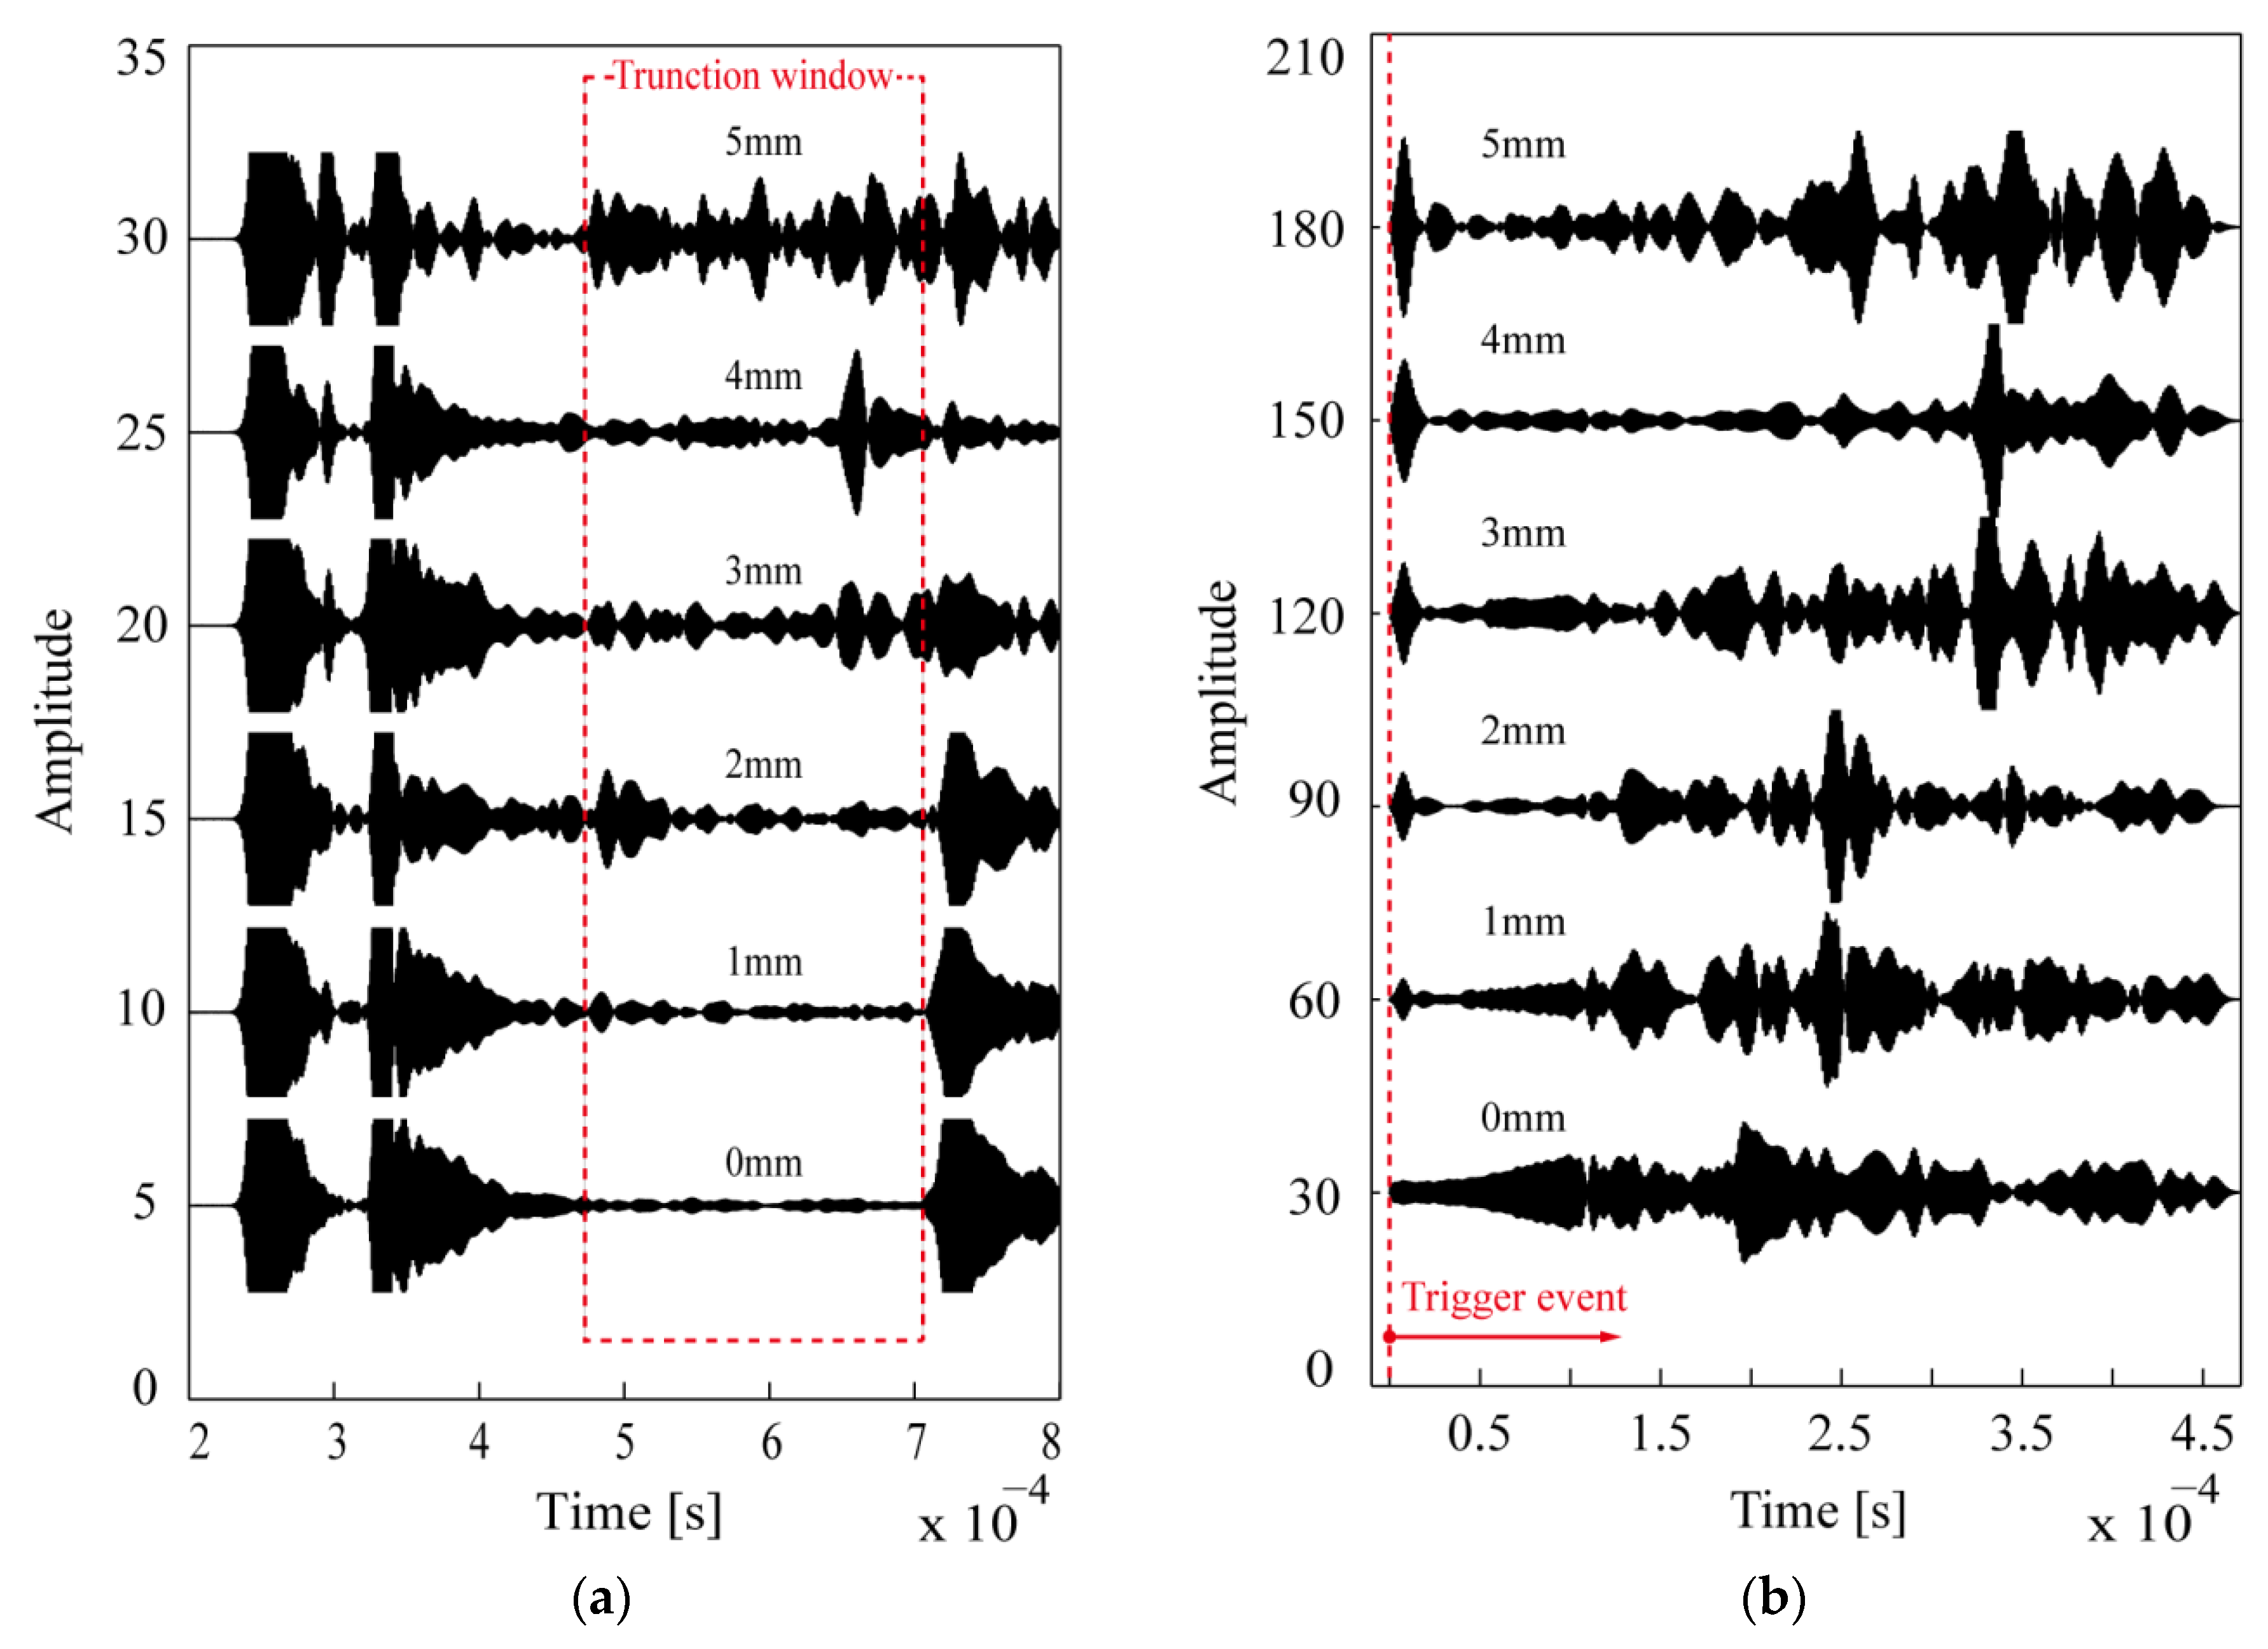
Figure 9.
Damage assessment: tendency of normalized amplitudes of reconstructed input signal versus damage size.
Figure 9.
Damage assessment: tendency of normalized amplitudes of reconstructed input signal versus damage size.
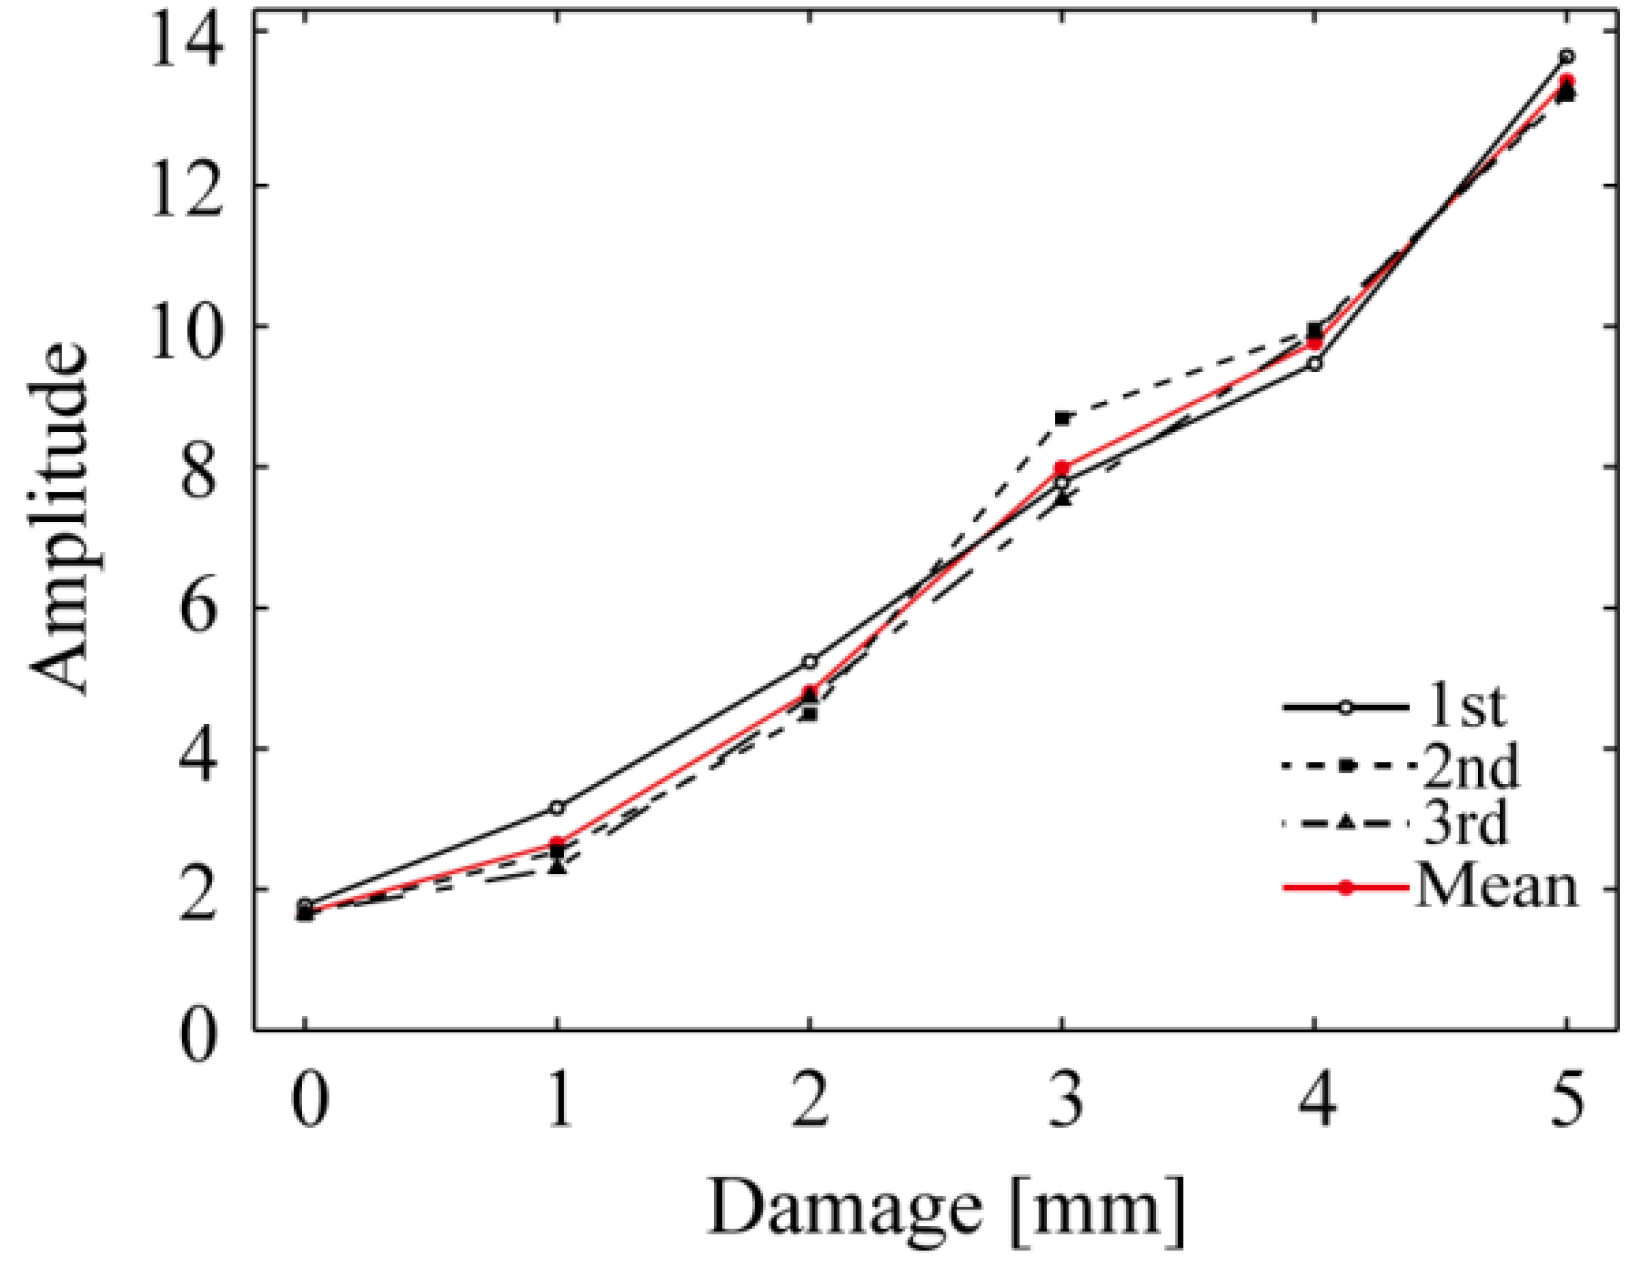
Figure 10.
Damage assessment. (a) Tendency of normalized amplitudes of defect echoes of mode versus damage size; (b) Tendency of normalized amplitudes of defect echoes of mode versus damage size.
Figure 10.
Damage assessment. (a) Tendency of normalized amplitudes of defect echoes of mode versus damage size; (b) Tendency of normalized amplitudes of defect echoes of mode versus damage size.

Figure 11.
NAEFD radial profile of 7 mm galvanized steel wire. (a) Mode at 700 kHz; (b) Modes and at 790 kHz.
Figure 11.
NAEFD radial profile of 7 mm galvanized steel wire. (a) Mode at 700 kHz; (b) Modes and at 790 kHz.

Figure 12.
Normalized defect echoes of mode at 700 kHz versus damage size from 1 mm to 4 mm.

© 2017 by the authors. Licensee MDPI, Basel, Switzerland. This article is an open access article distributed under the terms and conditions of the Creative Commons Attribution (CC BY) license (http://creativecommons.org/licenses/by/4.0/).
Share and Cite
MDPI and ACS Style
Zhang, Y.; Li, D.; Zhou, Z. Time Reversal Method for Guided Waves with Multimode and Multipath on Corrosion Defect Detection in Wire. Appl. Sci. 2017, 7, 424. https://doi.org/10.3390/app7040424
AMA Style
Zhang Y, Li D, Zhou Z. Time Reversal Method for Guided Waves with Multimode and Multipath on Corrosion Defect Detection in Wire. Applied Sciences. 2017; 7(4):424. https://doi.org/10.3390/app7040424
Chicago/Turabian StyleZhang, Yaoye, Dongsheng Li, and Zhi Zhou. 2017. "Time Reversal Method for Guided Waves with Multimode and Multipath on Corrosion Defect Detection in Wire" Applied Sciences 7, no. 4: 424. https://doi.org/10.3390/app7040424
Note that from the first issue of 2016, this journal uses article numbers instead of page numbers. See further details here.