
Improved Ultrasonic Computerized Tomography Method for STS (Steel Tube Slab) Structure Based on Compressive Sampling Algorithm

1
College of Resource and Civil Engineering, Northeastern University, Shenyang 110819, China
2
Shenyang Metro Co., Ltd., Shenyang 110011, China
3
Department of Civil and Environmental Engineering, University of Michigan, Ann Arbor, MI 48109-2125, USA
*
Author to whom correspondence should be addressed.
Appl. Sci. 2017, 7(5), 432; https://doi.org/10.3390/app7050432
Submission received: 9 March 2017
/
Revised: 20 April 2017
/
Accepted: 20 April 2017
/
Published: 26 April 2017
(This article belongs to the Special Issue Advances in Acoustic Emission and Health Monitoring of Materials and Structures)
Abstract
:This paper developed a new ultrasonic computerized tomography (CT) method for damage inspections of a steel tube slab (STS) structure based on compressive sampling (CS). CS is a mathematic theory providing an approximate recovery for a sparse signal with minimal reconstruction error from under-sampled measurements. Considering the natural sparsity of the damage, CS algorithm is employed to image the defect in the concrete-filled steel tube of Shenyang Metro line 9 for reducing the work time. Thus, in the measurement stage, far fewer ultrasonic measurement paths were selected from the dense net of conventional ultrasonic CT techniques to capture the underlying damage information. Then, in the imaging stage, ℓ1-norm minimization algorithm of CS theory is selected to recover the internal damage via fusing measurement data and solving optimization problem. The functionality of the proposed method is validated by three numerical concrete tube models with various conditions. Additionally, both the conventional ultrasonic CT technique and the proposed one are employed for ultrasonic inspection of the STS structure in Shenyang Metro line 9. Both the numerical and experimental results indicate that the proposed ultrasonic CT improved by CS has a great potential for damage detection, which provides an alternative accurate and effective way for non-destructive testing/evaluation (NDT/E).
1. Introduction
Non-destructive testing (NDT) is an effective and compulsory method for the evaluation and testing of significant infrastructures in the civil engineering community. With the rapid development of the infrastructure construction, there is a growing need to monitor the internal environment and damage situation of the structures and their essential components for the assessment and prediction of the structure safety level [1,2,3,4]. As the result of overcrowding in the modern international metropolis, the metro system has become a perfect alternative transportation to the ground one [5], while metro construction projects present significant challenges of nondestructive evaluation for the complex environments, e.g., under existing buildings or crossing under major municipal arteries and pipelines [6,7,8]. Thus, the safety level and durability of metro tunnel structures is of critical importance [9].
In China, after years of research and application, an innovative design method for underground structures, the steel tube slab (STS) structure method, has been extensively employed to succeed the traditional shallow tunneling method (STM) of the metro system, which was commonly used to construct urban subway tunnels [10,11]. The STS structure dramatically improves the transverse load-carrying capacity by adding transverse high strength bolts and a flange plate between the tubes, which eliminate the drawbacks of the traditional pipe-roof. It serves as a primary support to resist the overburden earth pressure and ground overload with a maximum transverse span of 5 m during excavation. The STS structure was employed to construct the Olympic Center subway station in Shenyang Metro line 9 in super shallow buried (soil cover depth less than 5 m) Metro stations in downtown.
The load-carrying capacity is an essential part of the entire project. The mechanical characteristics of the STS structure are different from those of a reinforced concrete structure due to the interaction among the steel tubes, the flange plate, and the concrete between tubes, which results in more complicated mechanics. The absence of concrete in the tubes is the weakest part of the STS structure, which may cause a major catastrophe with heavy losses of lives. Thus, each concrete-fill steel tube of the STS system should be strictly tested and inspected as per corresponding procedure. For the damage inspection part, ultrasonic computerized tomography (CT) is applied to interrogate the internal flaws and defects of the STS structures.
Ultrasonic CT is a digital imaging technique consisting of a numerically reconstructed inverse problem, which is associated with the interaction of ultrasonic waves with the detected structures [12,13,14]. The characteristics that define the reconstruction of the quantitative tissue for the diagnostic application can be the speed of sound, mass density, and attenuation [15]. Ultrasonic CT has been extensively developed and applied in many areas such as medicine, material engineering, aerospace, civil engineering, etc. Greenleaf and Bahn developed an ultrasonic CT technique to diagnose cancer in the breast. The measured arrival time and changes in amplitude are used in a reconstruction algorithm to obtain estimates of the 2-D distribution of acoustic speed and attenuation of the breast. The quality of over 1000 scanned images demonstrating the sensitivity of the ultrasonic CT system approaches the work done by using the X-ray technique [12]. Rahiman et al. obtained the mode tomography imaging for liquid/gas two-phase flow by using an ultrasonic CT technique [16]. Hay et al. used Lamb waves ultrasonic computerized tomography to identify the material loss of real aircraft components by embedding piezoelectric sensors on the surface [17]. Büyüköztürk imaged the complex concrete structure via ultrasonic CT, indicating that this technique has accuracy capability with high resolution [18]. Bond et al. used acoustic travel time tomography to assess a mass concrete dam, presenting cross-sectional images of the structure to locate cracks and other damages [19,20].
However, the conventional ultrasonic CT has its own limitations including heavy workload, a complex reconstructed algorithm, and relatively low-accuracy images [21,22], which is a huge challenge to the damage inspection of the whole STS structure of Shenyang Metro line 9. Thus, the overarching goal of the research effort is to develop an effective and accurate ultrasonic inspecting method to reduce the workload and time for the assessment of the STS structures before their service. To achieve this ambitious functionality, compressive sampling (CS) theory was proposed to improve both the measurement stage and the imaging stage of the conventional ultrasonic CT technique.
In the rest of the paper, the ultrasonic CT technique and basic formula will be introduced briefly in Section 2. Then, in Section 3, CS theory is applied for the reconstruction of ultrasonic CT, and the whole conventional ultrasonic CT program is improved and redesigned to shrink the measurement number in the measurement stage. The internal damage information is reconstructed by using the ℓ1-norm minimization algorithm via fusing measurement data and solving optimization problems. In Section 4, three different numerical models with various damage conditions are completely reconstructed with accurate resolutions based on the proposed algorithm. Additionally, experimental testing of the proposed ultrasonic CT and the conventional one was employed to investigate the concrete-filled steel tube of Shenyang Metro line 9 in Section 5. Finally, conclusions are drawn and the scope of future work is discussed in the last section.
2. Ultrasonic Computerized Tomography
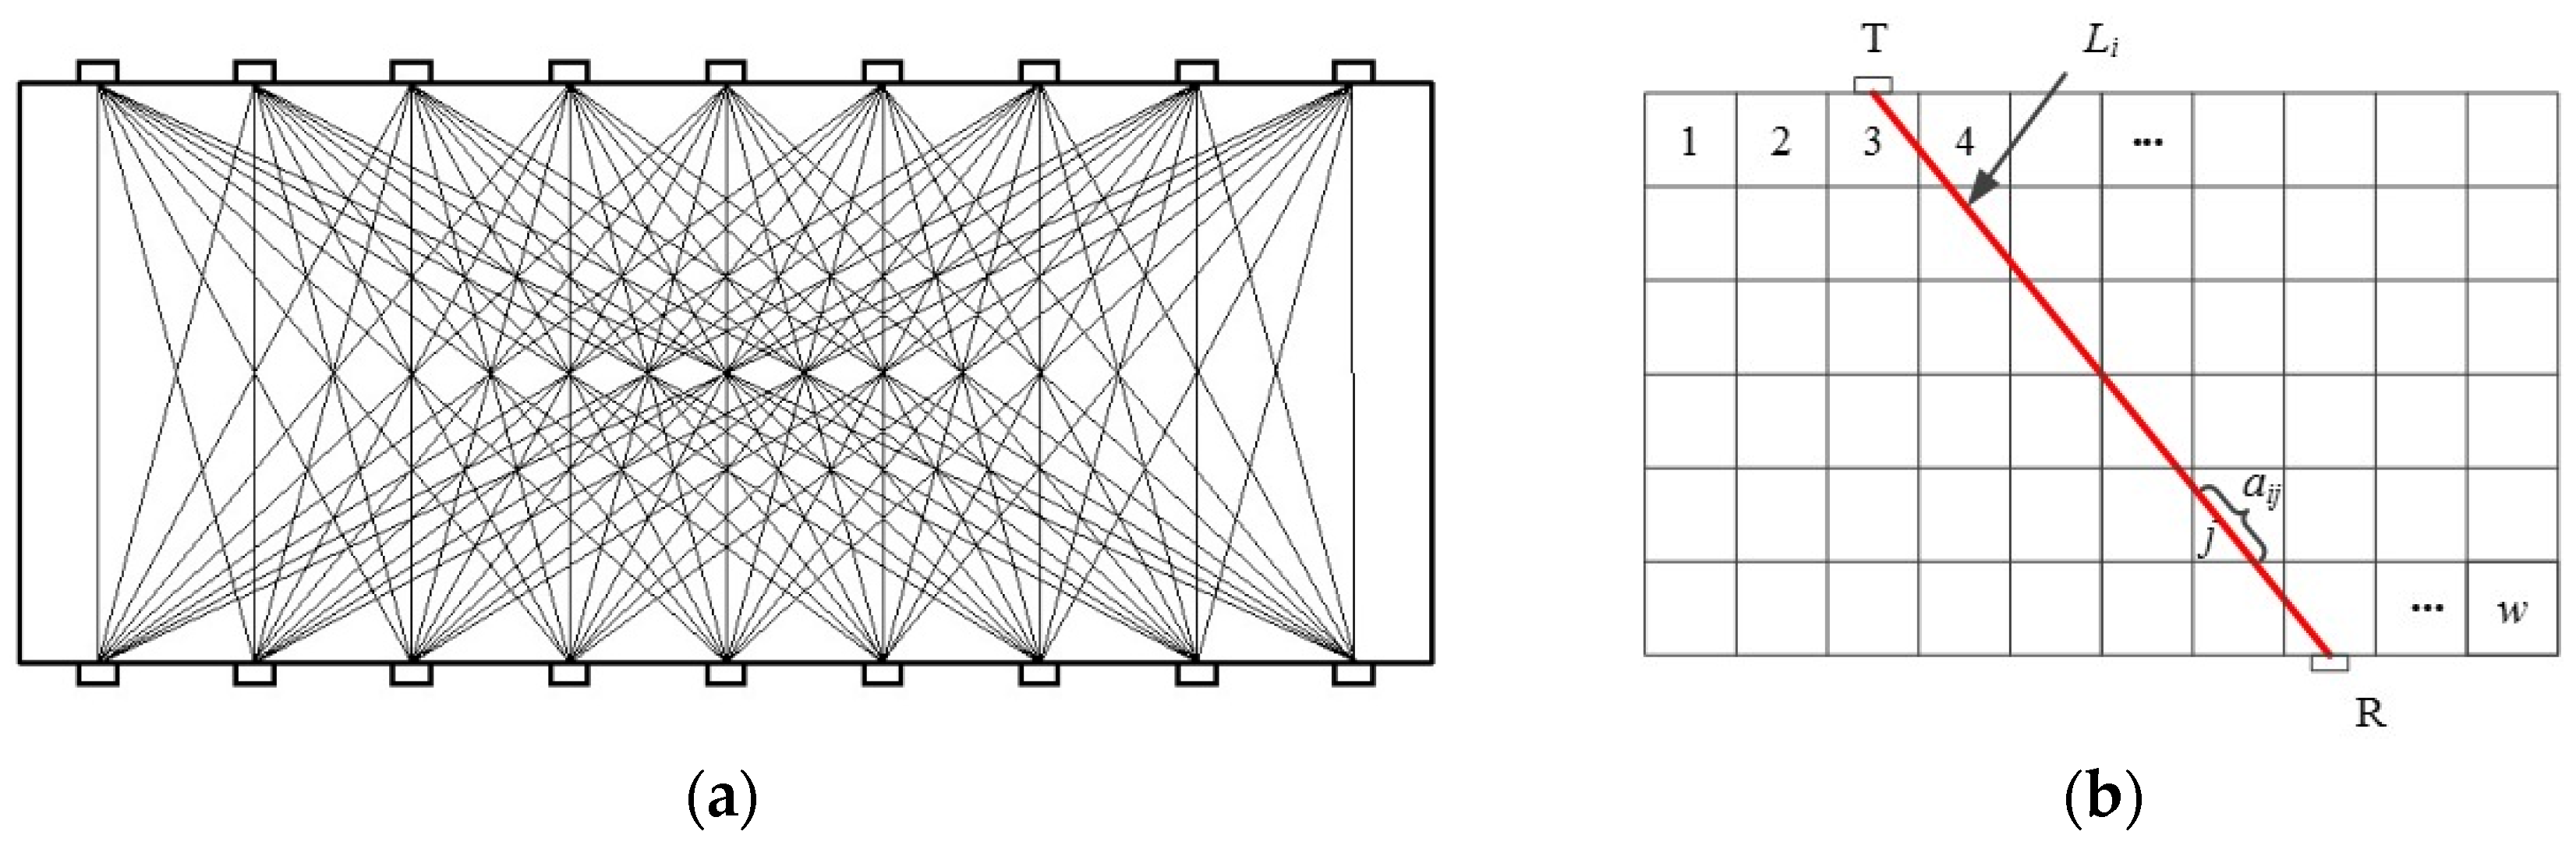
Ultrasonic computerized tomography, which combines ultrasonic waves and X-ray computerized tomography, is an imaging technique pursuing the internal condition of the structures. The aim of using ultrasonic CT is to reconstruct the internal spatial distribution of wave velocities, acoustical impedances, or wave attenuation from the measurements of the structure [15]. The reconstruction algorithm of the ultrasonic CT requires various densely spaced sets of transmitter and receiver positions, which is shown in Figure 1. Before the experimental process, the cross-section of the detected structure is divided into discrete microstructures. Then, the transmitter and receiver are arranged at each position of the specimen to excite and receive the ultrasonic waves. The interaction of ultrasonic waves and the damaged microstructures will alter the acoustic parameters of the ultrasonic wave and cause wave diffraction. On the one hand, the ultrasonic wave will propagate rather quickly in the compact part of the object. On the other hand, the travel time will be longer by diffraction when the ultrasonic wave confronts the defects such as holes and flaws, which is caused by the wave traveling to the observer by crossing the edge in a longer path. Multiple ultrasonic measurements carry the parametric information of the microstructures, including the healthy parts and damaged ones. Then the inverse scattering problem will be solved, and the acoustic parameters of each microstructure will be determined by the reconstructed algorithms. That is to say, by obtaining the travel time of the ultrasonic waves via the external measurements, the internal situation of the detected specimen or structure could be able to be imaged.
Ultrasonic CT represents an improvement in the acoustic transmission testing method, which not only performs the direct mode but also stands for the traveling path of the ultrasonic waves affected by the damage in the structures. By creating a dense net of the measured paths, each of which relates to a particular travel time between the ultrasonic actuator and sensor, the section of the structure is crossed and measured multiple times. The values of the travel time of the ultrasonic waves are used to compute a reconstruction of the velocity distribution across the selected section. The local variations in velocity, which indicate the zones of weakness or flaws in the internal fabric of the structure, are identified. The basic ultrasonic CT formulas are shown as follows. The variation from the expected travel time is attributed to inhomogeneity in the structure or damage occurred. In order to obtain an accurately reconstructed result, the section of the structure has to be adequately covered by the measurement paths, as shown in Figure 1.
The value of travel time in one selected measuring path is determined by the travel path and the microstructures in the section of the structure, which can be expressed as the following relationship:
where, is the travel time of path, is the distance of the measurement path from the actuator to the sensor, is the velocity of ultrasonic waves in the location of , and is the slowness function of the microstructure, which is the reciprocal of the velocity function,
In order to reconstruct the value of the velocity distribution in the structure, the section is divided into numbers of microstructures. The vector of travel time , which contains all the measurement results obtained from the dense net of measurement paths, can be expressed as:
where, is the total number of microstructures, is the number of measurement paths, is the travel time of ultrasonic waves along the measurement path, is the travel length of the microstructure along measurement path, is the matrix of travel length of all the microstructures, is the velocity of the ultrasonic waves propagating in the microstructure, is the slowness of the microstructure, is the vector of the slowness of all the microstructures in the section, is the standard slowness of ultrasonic waves propagating in the structure, and is the difference of the slowness.
After the measurement stage, a number of inversion algorithms are available commercially for tomographic reconstruction, such as algebraic reconstruction techniques (ART), simultaneous iterative reconstruction techniques (SIRT), least squares QR-factorization (LSQR), etc. [23,24,25]. However, these reconstructed algorithms have their own limitations, including high rates of measured paths, redundant data, and a big cost of labor and time. Thus, there is a growing need to image the internal damage conditions with a low-cost and effective reconstructed algorithm. In this paper, an improved measurement dense net is designed and proposed to develop the traditional ultrasonic CT technique and eliminate the drawbacks of the conventional algorithm, providing an equal accuracy.
3. Compressive Sampling Algorithm
The conventional reconstruction algorithm of ultrasonic CT has its own limitations, including redundant paths and a heavy workload caused by the dense net of measurement paths. To eliminate these drawbacks, in this paper, a novel reconstructed algorithm is proposed for reducing the number of measurements and speeding up the damage detection program based on CS. Compressive sampling is a new theory of information acquisition proposed by D. Donoho [26], E. Candès [27], and T. Tao et al. [28,29] in 2006. It asserts that one certain signal can be recovered from far fewer samples or measurements than from the traditional Nyquist sampling methods. Assuming that a real-valued, finite-length, one-dimensional, discrete-time signal consists of (higher-dimensional data can be changed into a long one-dimensional vector by reshaping) and that the unknown signal is defined to be compressible when it can be expressed a K-sparse vector (i.e., it has only non-zero entries) with respect to a specific basis , the unknown signal can be expressed as:
where, is a coefficients vector with nonzero entries (-sparse) and is the basis matrix representing a specific domain to make the unknown signal sparse. Then, the signal can be exactly recovered or approximated through a small number of linear measurements () to compress the information of the unknown signal to a measurement vector , which can be expressed as:
where is the measurement matrix that has fewer rows than the columns, denotes the noise during the measuring process, and is defined as the transfer matrix; thus, the rows of matrix are much fewer than the columns of . Since the number of measurement is smaller than the number of samples in the original signal, it is an ill-posed problem solving for the unknown signal from the measured information [30,31]. However, if the signal is compressible and sparse in the specific basis, as previously mentioned, then an exact or approximate recovery of is possible by solving a -norm optimization problem, which can be used to reconstruct the original unknown signal .
Furthermore, in order to reconstruct the unknown signal, the transfer matrix is required to satisfy the following restricted isometry property (RIP) condition [27]:
where, is all K-sparse vector and . is an isometric constant, which is defined as the smallest value that satisfies Equation (6). Random Bernoulli matrices and random Gaussian matrices have been proved to satisfy RIP conditions and can be used to reconstruct the original signal with high probability [27] under an appropriate linear measurement condition. The number of required measurement is expressed as , where is a constant which is dependent on the basis used for measurement. However, both the RIP and incoherence can be achieved with high probability simply by selecting as a random matrix (Gaussian matrix or Bernoulli matrix).
Thus, if the requirements (1) is -sparse with respect to a specific basis, which means the signal is compressible, (2) the transfer matrix satisfies both the RIP and incoherence conditions, and (3) the smaller measurement number is larger than the required number (generally, ) are satisfied, then, , the sparse coefficients vector of the original signal can be exactly or approximately reconstructed from the random low-rate sampling measurement vector by solving a convex program. The -norm optimization algorithm is a comprehensive recovered algorithm in CS process, which pursues for the least -norm value (which is related to number of nonzero entries) of the sparse vector [27]. The -norm optimization algorithm of CS is expressed as:
where , is the ℓ1-norm, is the ℓ2-norm, and is the noise bound.
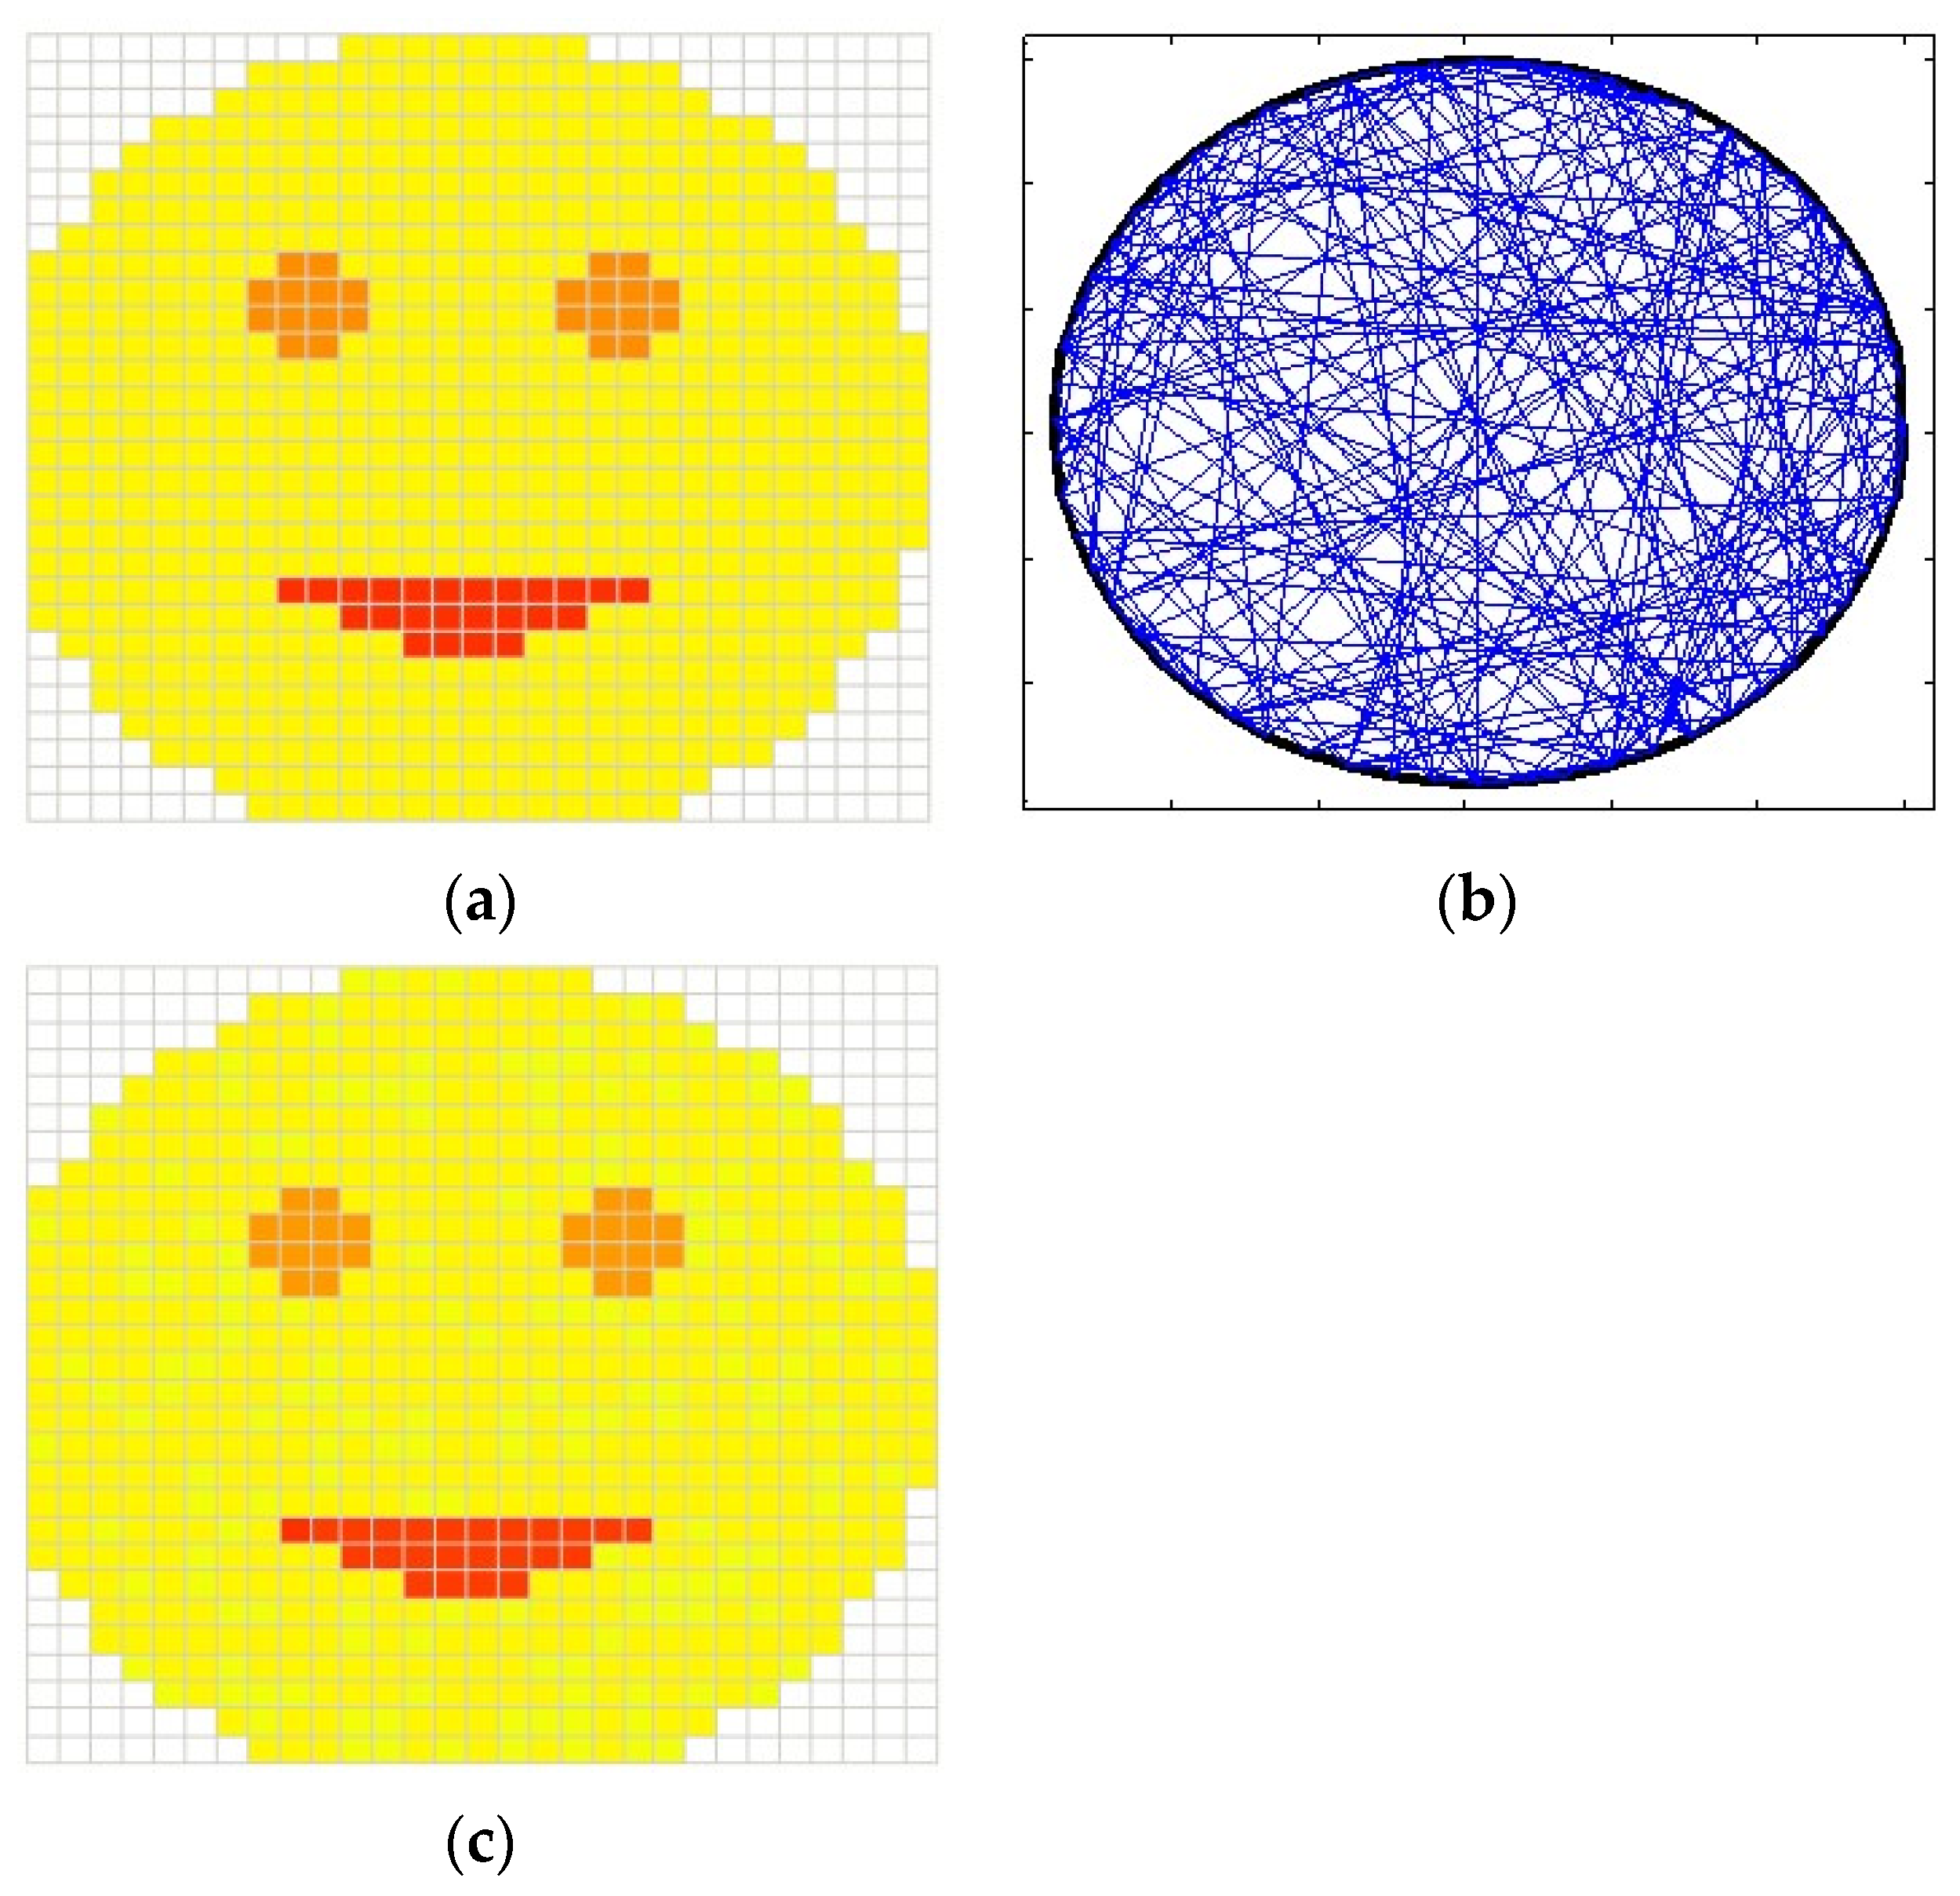
As a practical example, considering the image of a smiley face with 716 valid pixels shown in Figure 2a, each selected ray-path acquires part of the information of the desired image. To collect measurements for reconstruction, ray-paths were employed to capture independently oriented values (Figure 2b). The measured information can be expressed as the inner product between a random Bernoulli distributed matrix and the original image. According to the CS theory presented previously, a ℓ1-minimization optimization approach was used to recover the desired image based on 200 random measurements. Figure 2c indicates the reconstructed result, which has great agreement with the original image.
The flaws and holes are sparsely distributed in the structure (sparse in the spatial domain), which naturally satisfies the requirement of CS and makes the combination of CS and ultrasonic CT technique possible [32]. Thus, by applying the CS theory to the ultrasonic CT detection method, a number of measurement paths will be abandoned from the dense measurement net. Fewer measurement paths are selected from the traditional measurement net of the conventional ultrasonic CT method for reconstruction purposes. Furthermore, the sparse distribution of flaws and holes in the concrete structure means that the slowness of most microstructures is the standard slowness . However, the slowness of microstructures that contain holes or flaws have non-zero values of the sparse property of .
In addition, in order to satisfy the RIP conditions, a random Bernoulli distributed matrix is proposed to choose the measurement paths from the traditional ultrasonic CT measurement net in the measurement stage. The compressed information from the measurement of the structure is expressed as:
where, is the vector of measured travel time through the selected paths, is a random Bernoulli distributed matrix representing the selected paths, is the matrix of travel length of all the microstructures, and are the standard slowness and the change in slowness of all the microstructures, is the standard travel time of the measurement paths, and is the change in the measured travel time compared to the standard travel time of the selected paths.
As shown in Equation (9), the random measurement matrix is determined by the Bernoulli function, which contains only 0 and 1. The elements with the values of ‘1’ represent the real physics measurement paths that are selected in the measurement stage. On the contrary, ‘0’ stands for the related real physics path that is abandoned from the improved measurement net. When all the selected paths have been measured, the flaws and holes of the STS will be reconstructed based on the ℓ1-minimization algorithm of the CS method in the reconstructed stage.
In summary, based on the sparse distribution of the flaws and the randomly selected measurement paths, CS theory can be used to reconstruct the internal situation of the structure with a reasonable accuracy. The random measurement paths samples are sufficient for ℓ1-minimization to accurately recover the slowness vector . If the representation of is truly sparse and the number of the flaws is indeed small, then the measurement times m can be much less than N, which is required by the traditional ultrasonic CT technique for the same accuracy. The proposed ℓ1-minimization algorithm of CS theory is expressed as the following equation to recover , representing the internal situation of concrete-filled steel tube of an STS structure:
where, is the reconstructed slowness, is the regularization parameter, is the ℓ1-norm, and is the ℓ2-norm [33].
The purpose of Equation (10) is to attempt to recover the sparsest solution of slowness vector by solving an ℓ1-minimization optimization problem. This ℓ1-minimization optimization approach has been proven to be a powerful method for computing sparse signals. This optimization problem is solved using the general-purpose convex optimization package CVX (M. Grant and S. P. Boyd, CVX: Matlab Software for Disciplined Convex Programming, version 2.1, available at http://cvxr.com/cvx/download/). The regularization parameter balances the data misfit () and model constraint (), providing various constrained versions of the problem. To pursue a meaningful sparsest solution, the value of parameter can be appropriately determined by solving Equation (10) for different values and then choosing so that (which makes the solution of Equation (10) the same as Equation (7)). The parameter is also called a data consistency tuning constant, which is a variable value related to the variance and signal-to-noise ratio (SNR) in various cases. In this case, the value of parameter is 0.083, determined by signal processing and the numerical simulation.
4. Numerical Simulation
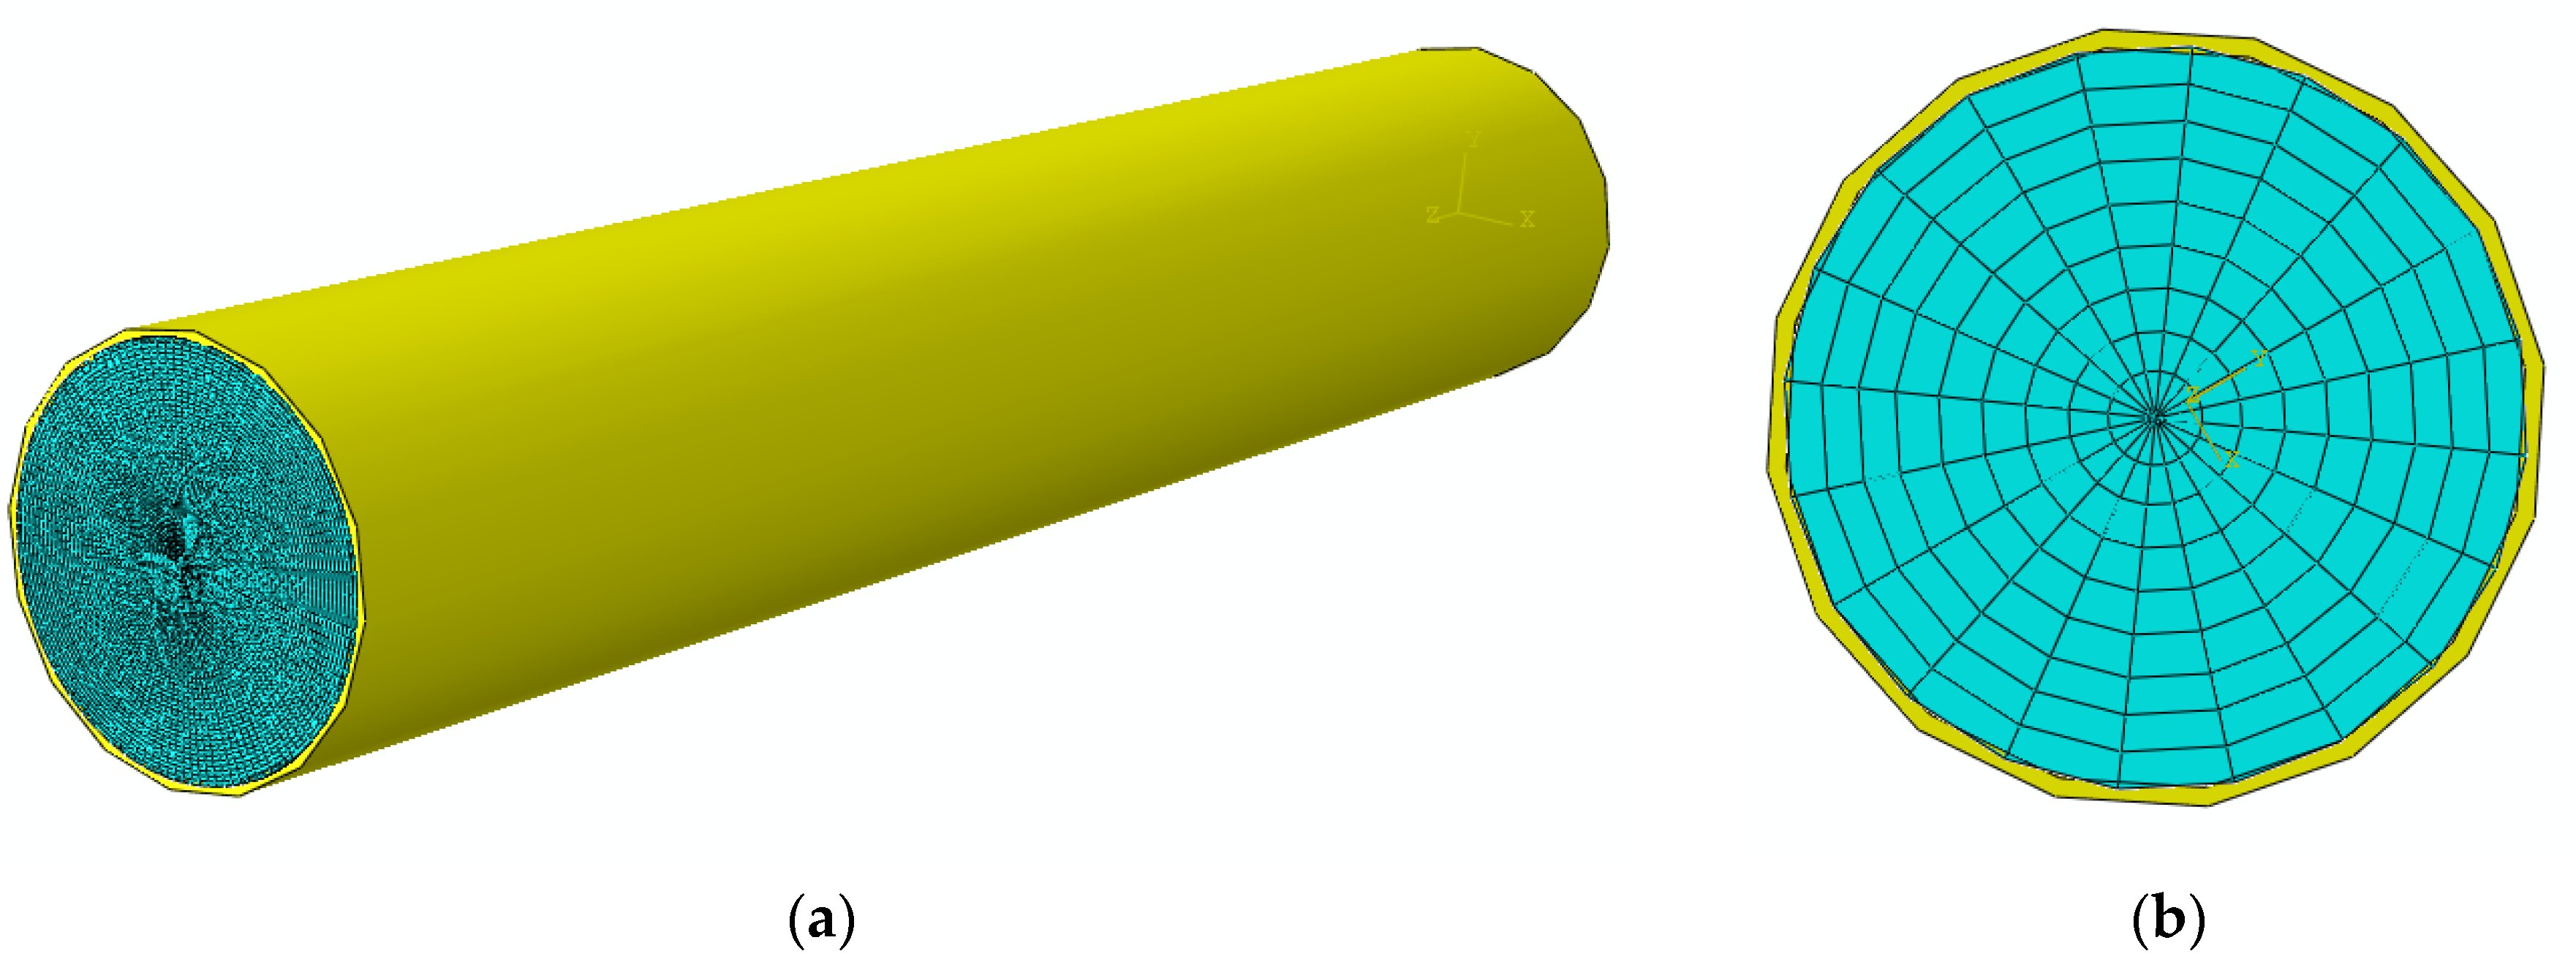
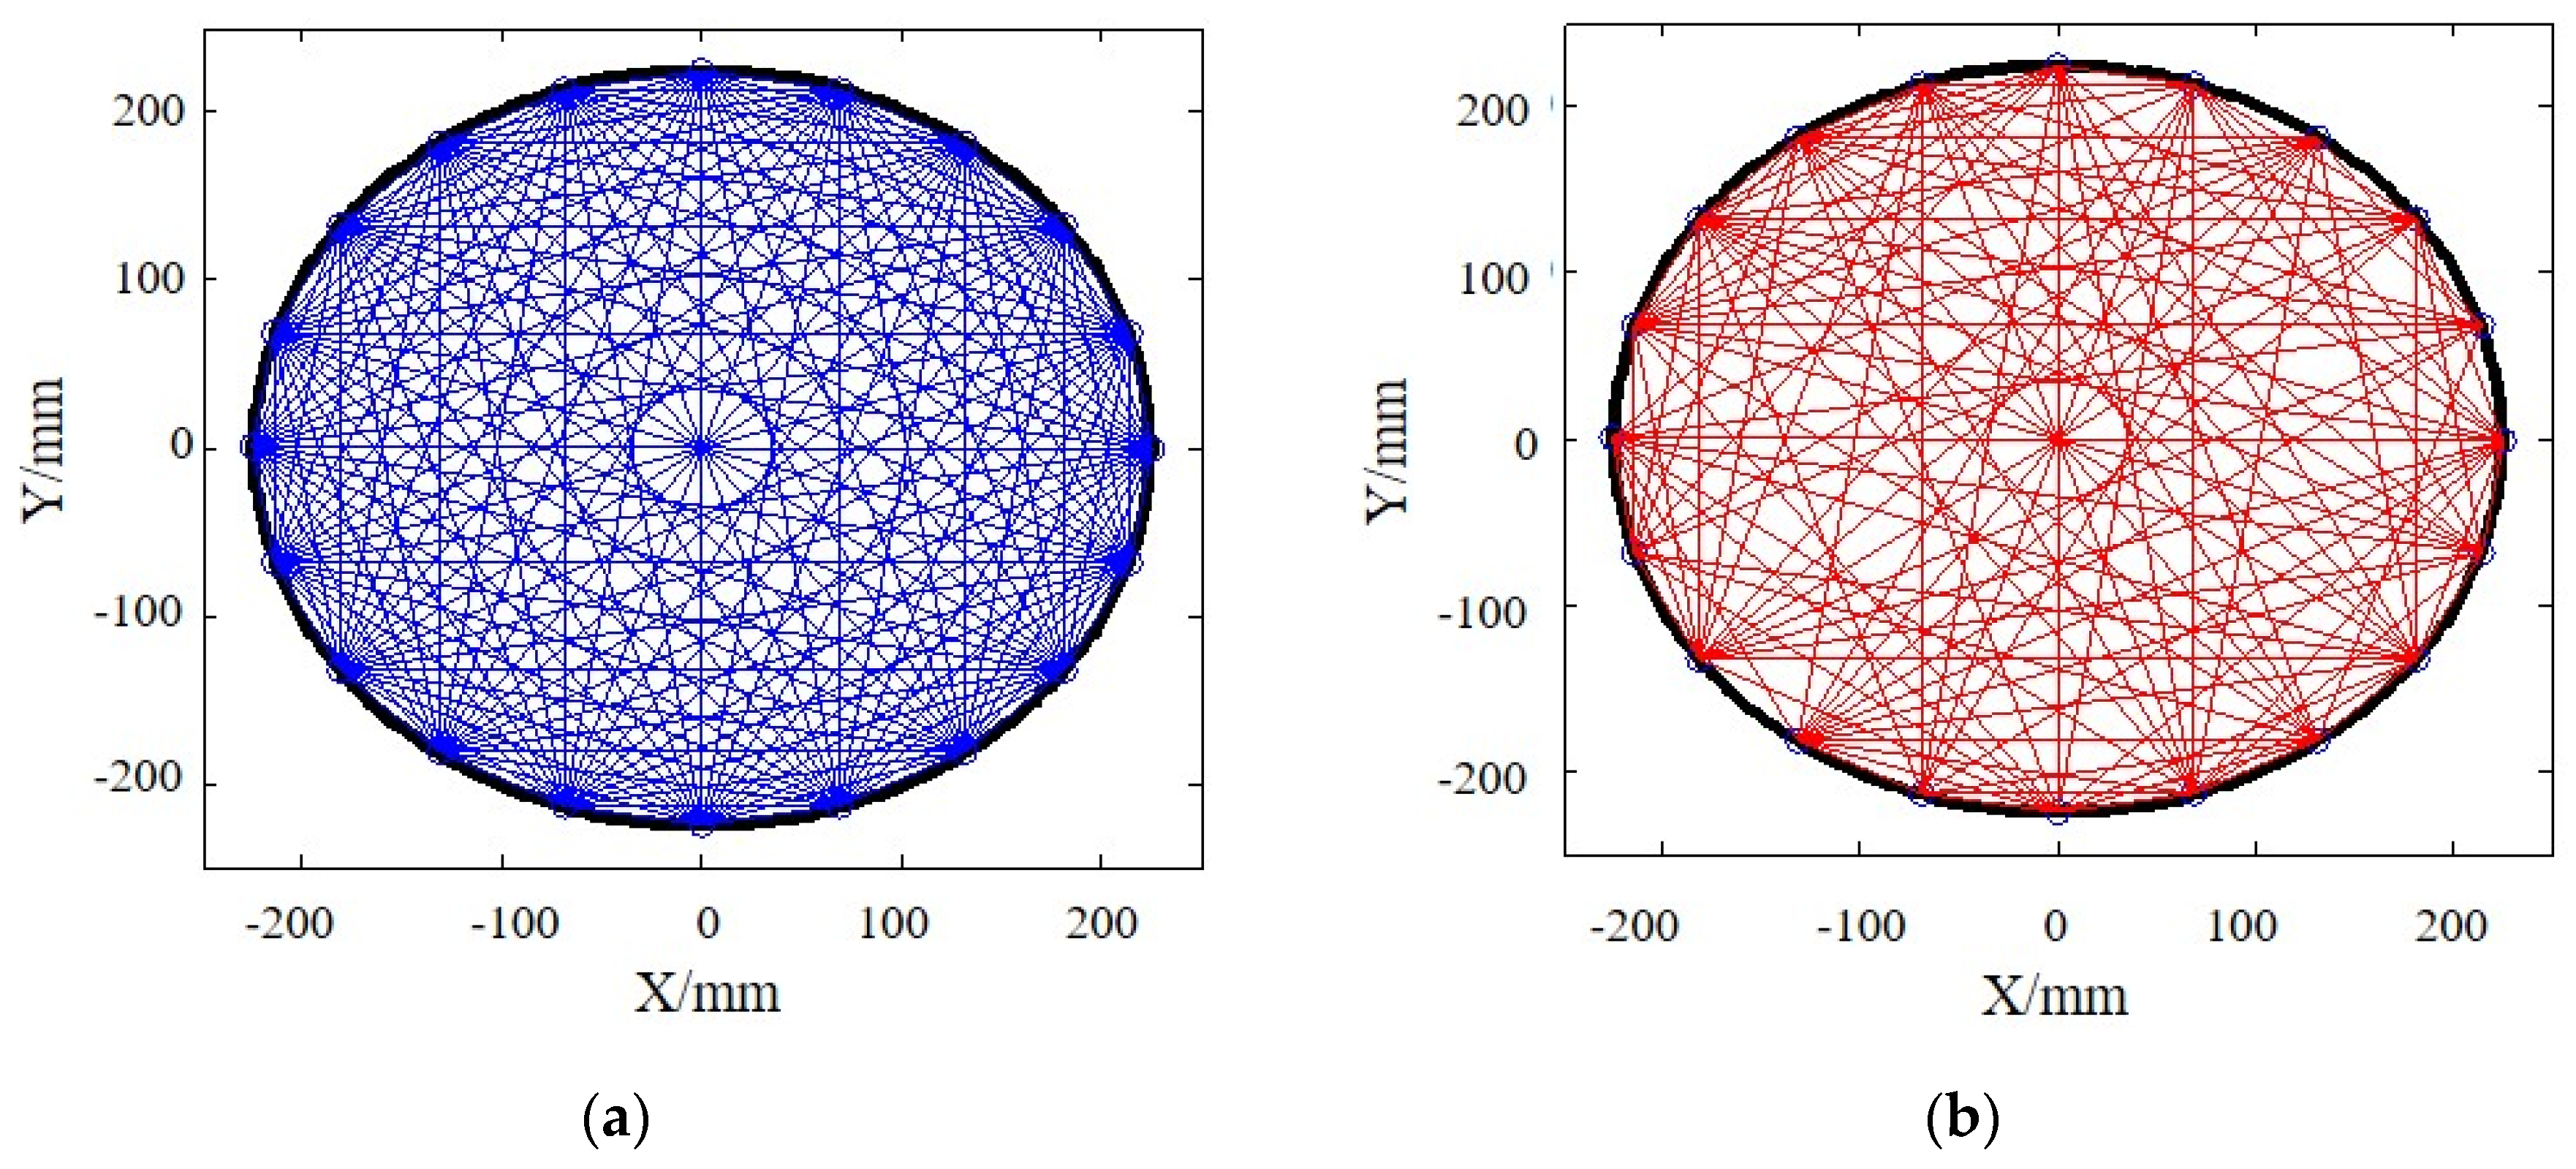
To validate the functionality of the proposed damage detection method in the CS framework, numerical models were established in ABAQUS, a finite elements method (FEM) simulation software, to demonstrate the performance. The geometry of the basic parts of the model was created based on the full scale of the concrete-filled tube of the STS structure in Olympic Center Station including steel tubes, the concrete, and the connecting bolts, which are shown in Figure 3. The diameter of the steel tube is 900 mm with a thickness of 16-mm. The 900 mm diameter steel tube is modeled with an elastic modulus () of 200 GPa, and Poission’s ratio is 0.33. The concrete is modeled with an elastic modulus () of 15.0 GPa, and Possion’s ratio is 0.3. Each of these components are meshed with cubic elements with sizes of 10 mm. This meshing size resulted in a total of 63,480 elements in the concrete, 13,236 in the steel tube, and 48 elements each bolt. C3D8R (8-node, linear) solid element was used for the model. Ultrasonic waves are excited by a series of square waves with the central frequency of 50 kHz. There are two models inspected in this chapter: (1) a single-damage model and (2) a multi-damage model. The entire tube was divided into 180 microstructures to apply the ultrasonic CT for damage inspection of the flaws and holes in the concrete-filled tube. Thus, the conventional ultrasonic CT requires at least 20 measurement points and 190 () measurement paths for the mapping of damage information. The locations of measurement points are represented as small circles on the external shell, and the measurement paths are shown in blue lines in Figure 4a. However, according to the CS theory, the number of measurement paths is chosen as 80, which is larger than the minimum number of detections ( 58.09), meeting the requirement of recovery with minimal reconstruction error. As we can see, the measurement net including 80 paths selected by the Bernoulli distributed matrix is shown in Figure 4b. That indicates that the ultrasonic CT improved by the CS can significantly reduce the measurement times as expected. All three damage cases are measured using the same selected measurement net to detect the damage in the models.
4.1. Single-Damage Situation
For case 1, another tube model was built in ABAQUS containing a 10-mm diameter flaw at the location of in the polar coordinate system. The travel length across the flaw is longer than in the pristine tube based on Huygens principle, which results in the travel time being longer in the simulation as well. Thus, part of the reconstructed vectors and is non-zero, and the location of the non-zero value reveals the exact location of the damage. The mapping results based on the CS improved program are shown in Figure 5b. As we can see, the reconstructed damage has great agreement with the original flaw, which indicates the potential of the proposed ultrasonic CT.
4.2. Multi-Damage Model
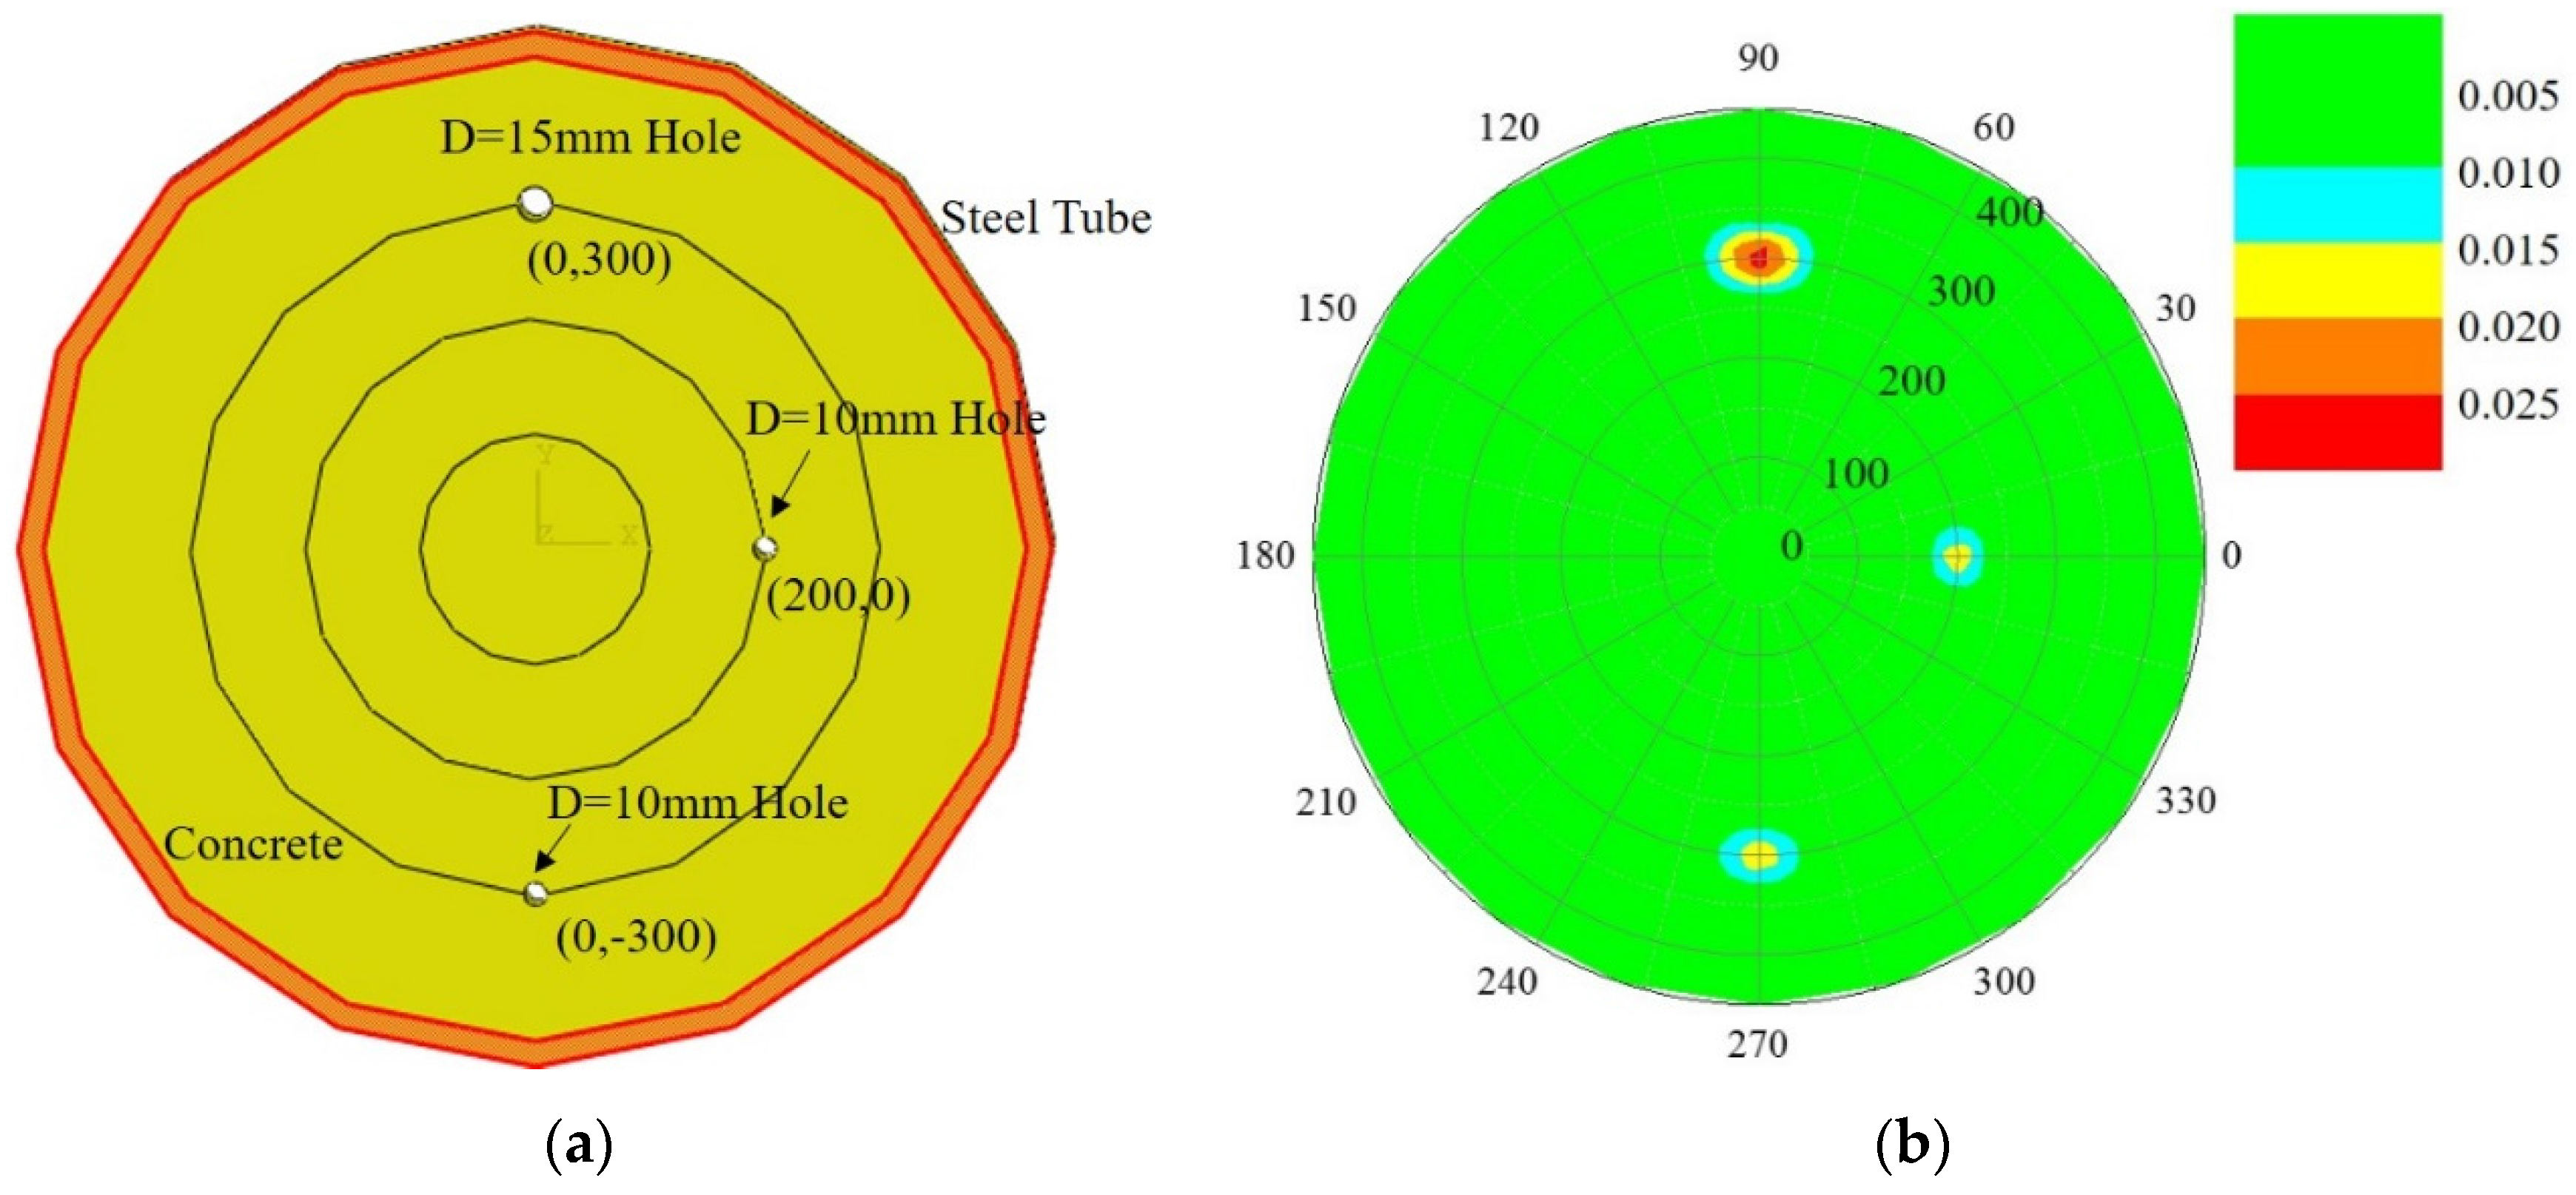
In addition, a multi-damage simulation was contrived and set up in ABAQUS. The defects were arranged at the locations of , and . The hole at the location of has a diameter of 15 mm, and the other two holes have diameters of 10 mm. Thus, the section sketch of concrete-filled steel tube model is shown in Figure 6a. As mentioned before, the measurement paths passing along the flaws will cause longer travel length and longer ultrasonic travel time. Figure 6b demonstrates the damage location reconstructed based on a ℓ1-minimization algorithm of CS theory.
In summary, all the mapping results of these two numerical models indicate that the proposed ultrasonic CT has the capability to significantly shrink the measurement paths, tremendously reduce the workload, and accurately reconstruct the damage information of the filled-concrete tube via CS theory.
5. Experiments and Results
After the numerical simulation, the proposed ultrasonic CT based on CS algorithm was employed to inspect the concrete-filled tube of the pipe-roofing STS structure of Olympic Metro Station on Shenyang Metro line 9.
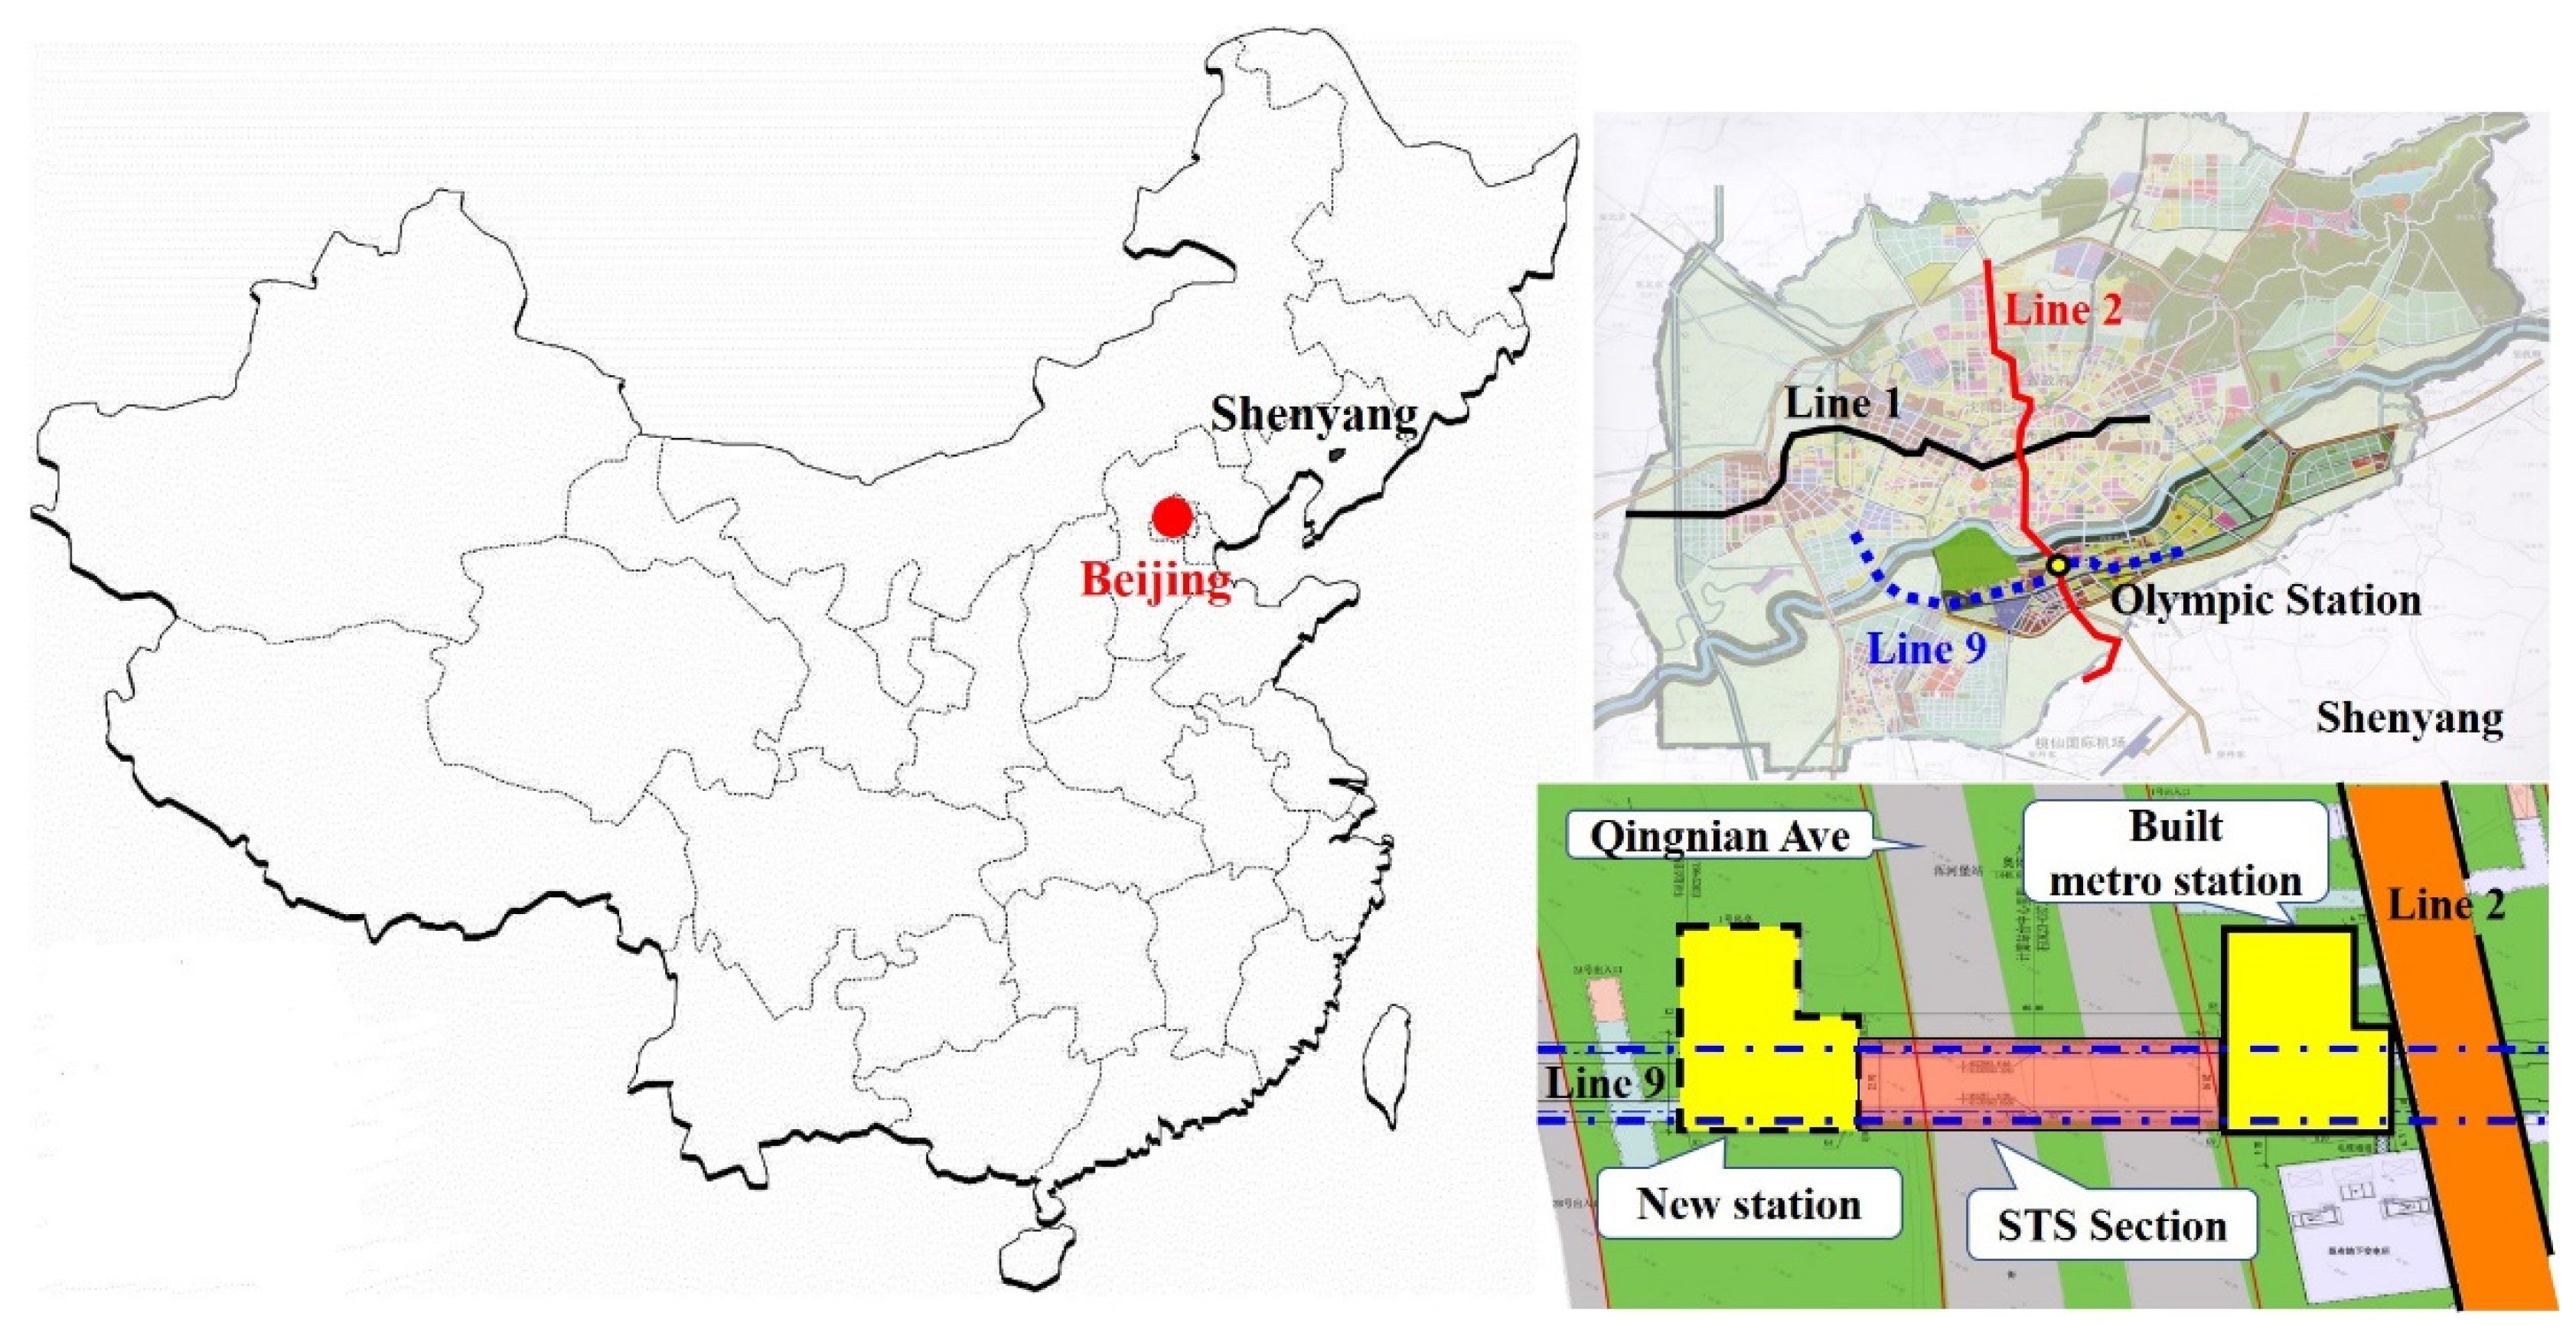
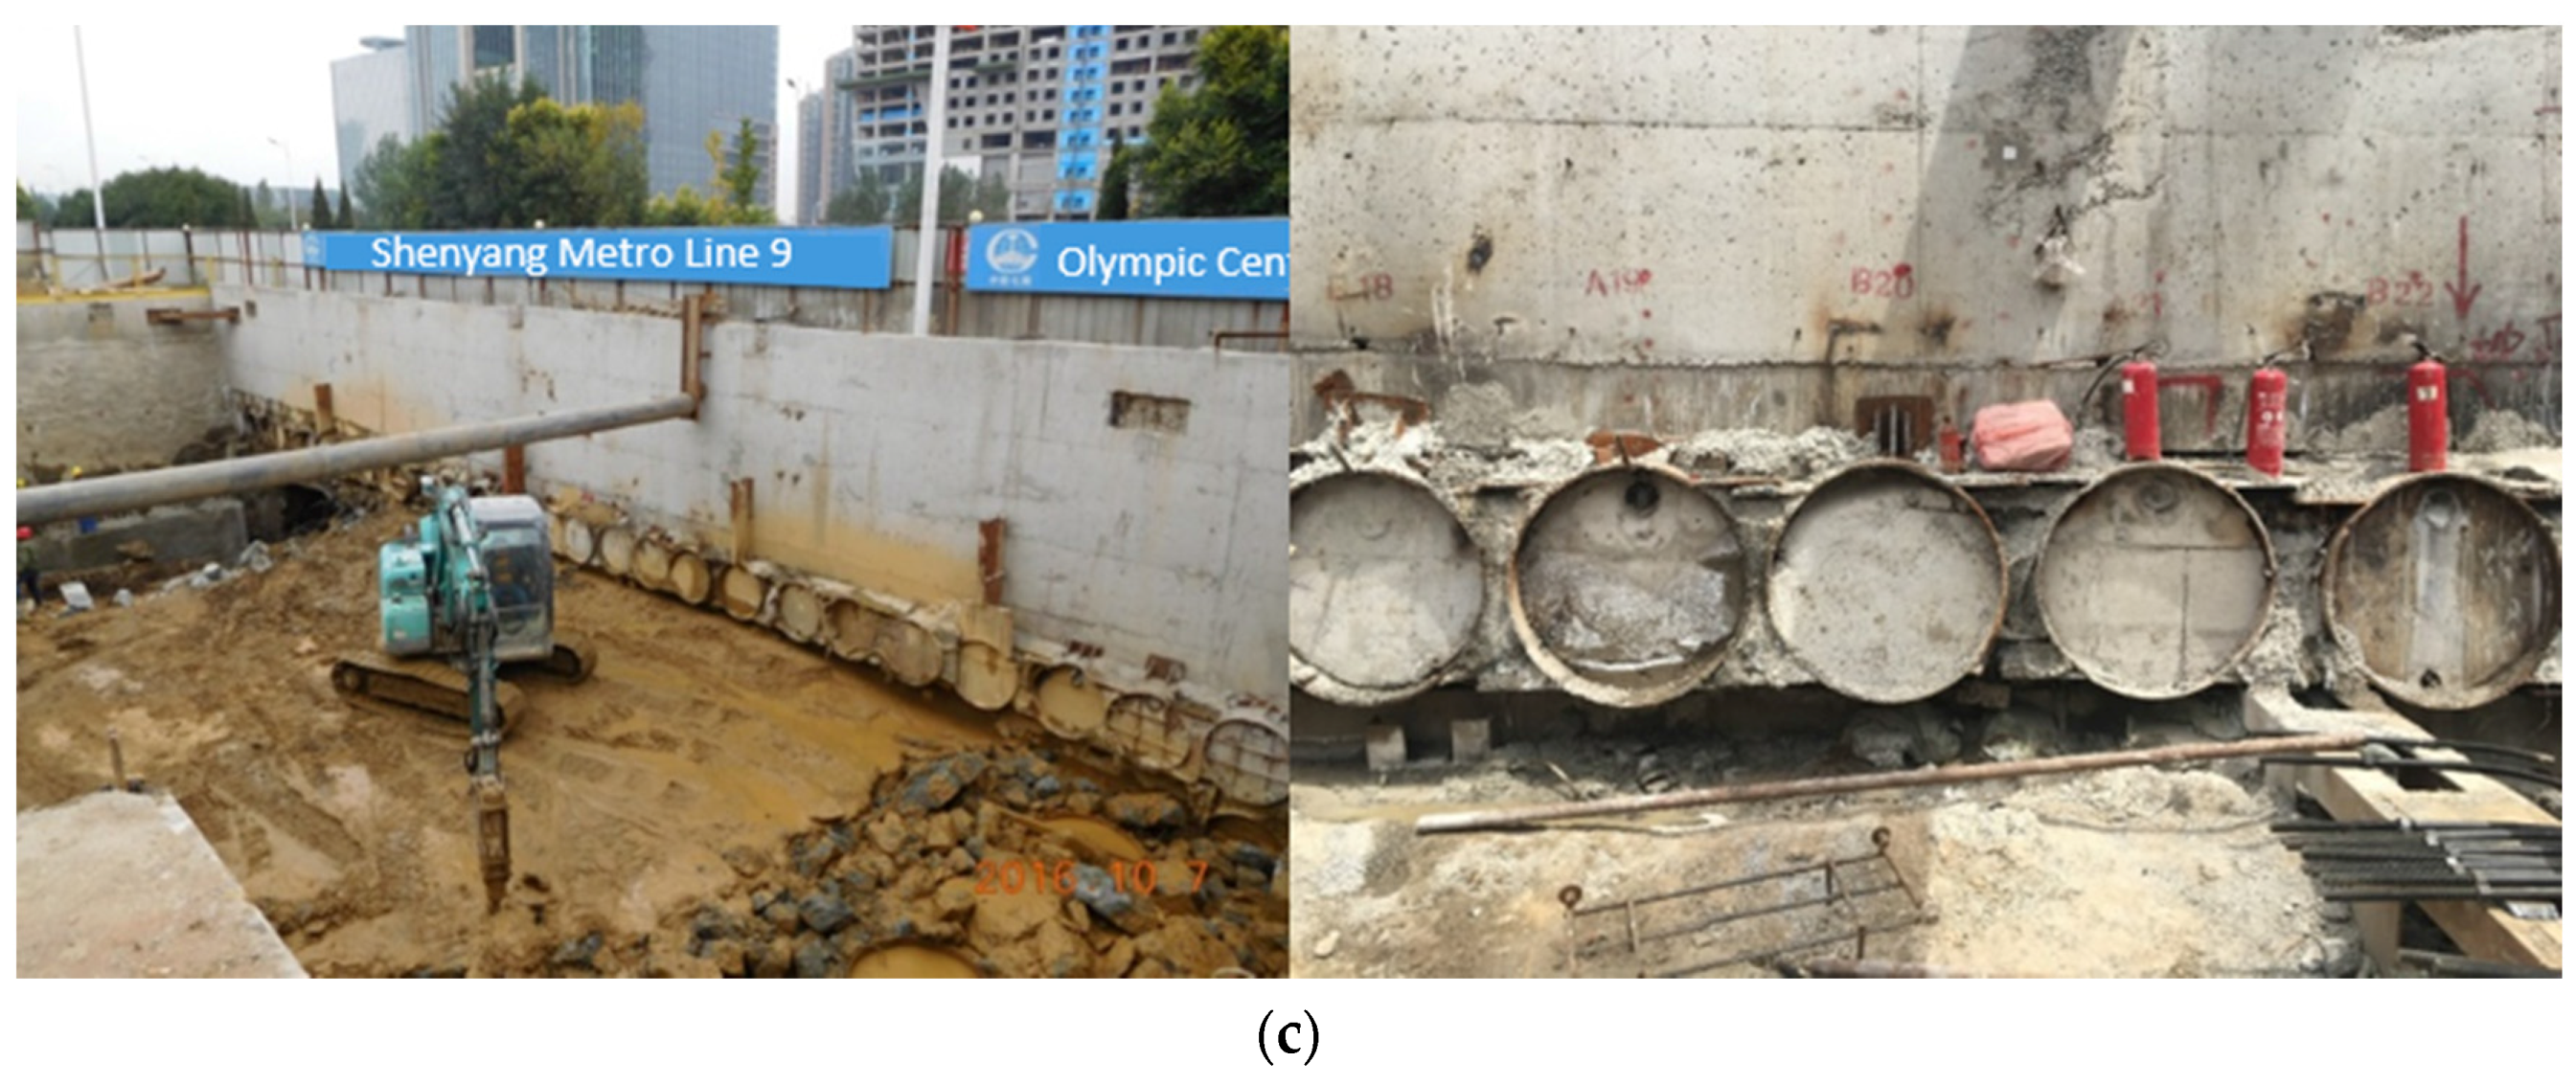
Olympic Metro Station, an interchange station between line 9 and line 2 that was completed in 2016, is an application of the STS curtain method in Shenyang, China (Figure 7a). The station is oriented in an east-west direction across Qingnian Avenue. To connect the new station (line 9) to the built one (line 2), a triple-deck tunnel of rectangular shape was constructed with the cut-and-cover method, and the middle section under the prosperous avenue was tunnelled to three layers with the STS curtain method. The cross-section size is approximately 22.9 m in span and 21.24 m in height, as shown in Figure 7b. There are 40 tubes in total in the STS curtain system, including 28 tubes in the tubular roof.
Considering the complex environments, including an overburden soil depth of more than 4 m, the heavy traffic flows on the Qingnian Avenue, and the high-rise buildings in this modern urban area, each concrete-filled steel tube needs to be inspected using ultrasonic CT before the service stage to guarantee the load-carrying capacity of the STS structure. Thus, all 40 concrete-filled steel tubes are required to be inspected by ultrasonic CT. Both the proposed ultrasonic CT technique and the conventional one are employed to complete the inspection project.
Generally, the implication of sparsity K is the number of microstructures containing construction defects in the concrete-filled tube. However, for the non-destructive ultrasonic inspection, it is impossible to grab the number of anomalous elements before the detection process. Thus, there is an assumption that the number of damaged microstructures is less than 10% of the total number, which is based on the previous damage inspection results of the STS structure. Therefore, the number of selected paths is chosen as 80 to satisfy the requirement of the CS theory in this research.
The accuracy of tomography is dependent on the sensor spacing and microstructure size. In a real situation, the essential goal of both the proposed method and conventional computerized tomography is to identify the significant void part and crack in the concrete, which might cause a major catastrophe instead of minor anomalous events. Although the proposed computerized tomography does not have as dense a net of ray paths as the conventional method, it is capable of capturing the dramatic change of travel time caused by the desired large-scale defect. Considering the size of the aggregate (maximum size aggregate in the concrete is 25 mm) in the concrete-filled tube and the Chinese standard for quality control of concrete, the threshold of the difference of the slowness is determined as 0.004, which means that defects below the size of 15 mm are discarded as ‘noise’.
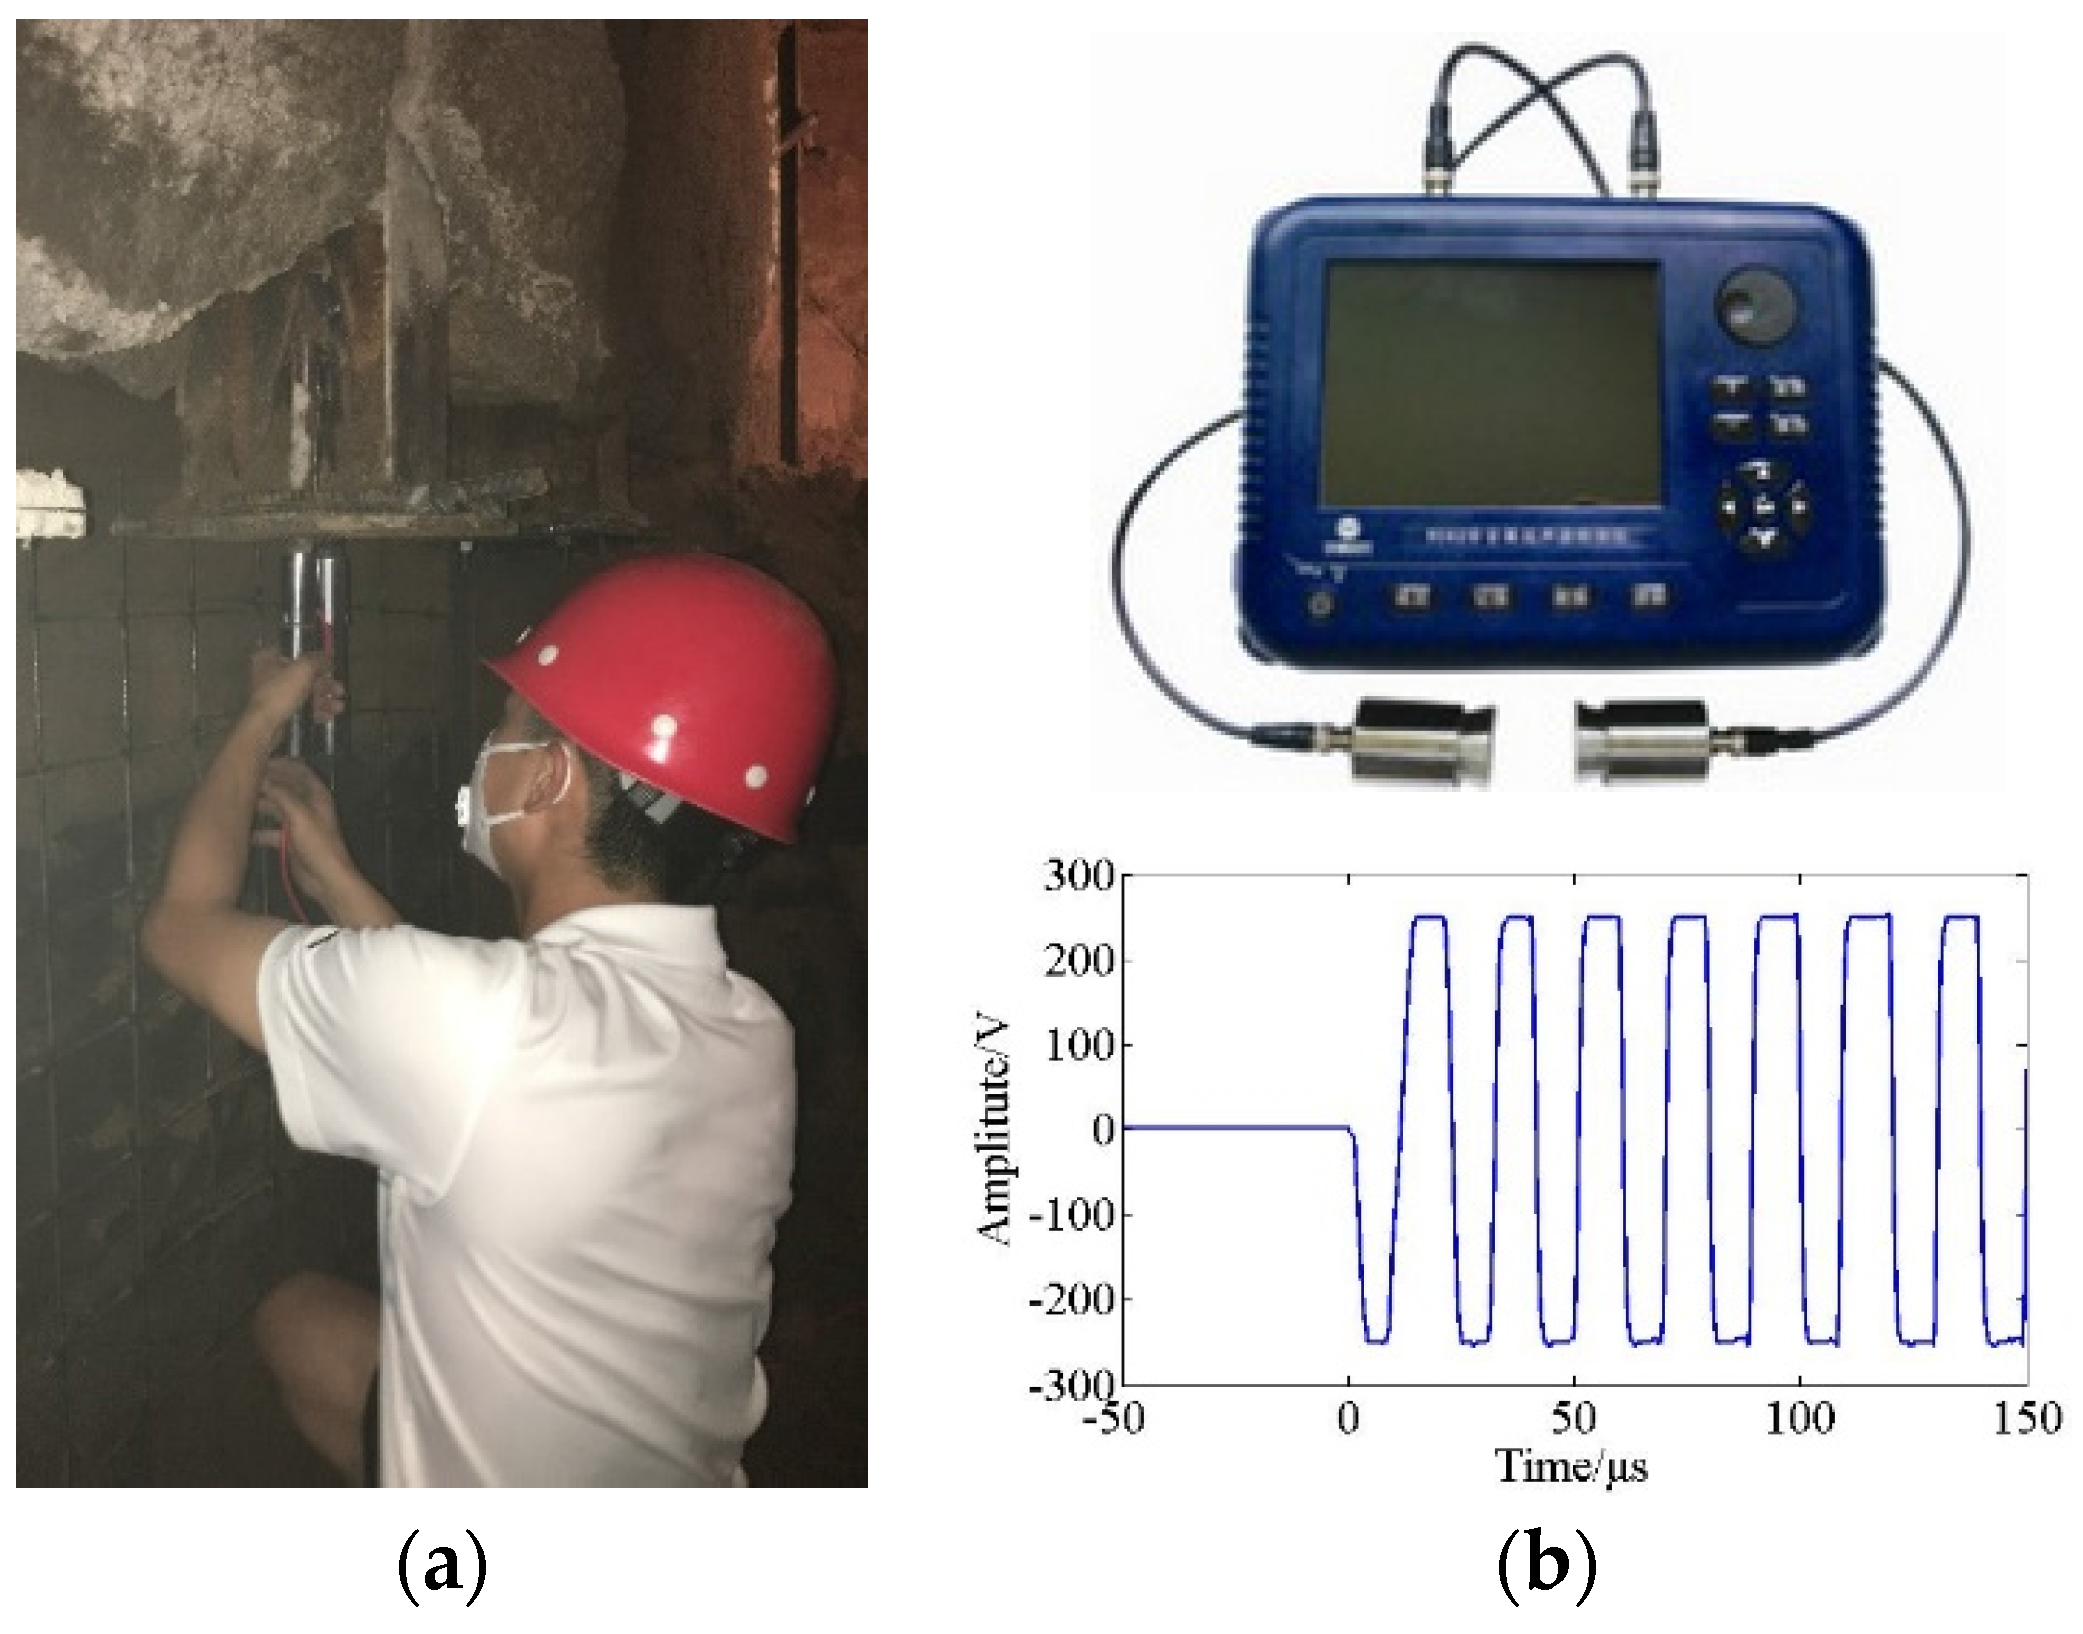
An ultrasonic NDT instrument with two transducers, NU62, is employed as the detection equipment in the experiments. The sampling frequency of the NU62 is 25 MHz, and the launched ultrasonic wave is a series of square waves centered at 50 kHz with the amplitude of 250 V and a 0.08 m wavelength. One transducer emits ultrasonic waves and the other is used as sensor to capture the waves propagating in the structure. The experimental detection process and the NU62 instrument are shown in Figure 8.
The inspection program of the proposed ultrasonic CT is as follows: (1) determining the accuracy and the measurement points, calculating the required measurement number for damage detection; (2) selecting the paths based on a Bernoulli distributed matrix from the measurement net of the conventional ultrasonic CT technique; (3) capturing the travel time of ultrasonic waves in the concrete-filled steel tube by placing the ultrasonic probes on the two points in the selected measurement paths; (4) assembling the measured travel time vector after all the selected paths have been inspected; and (5) reconstructing the slowness vector and imaging the internal situation of the tube based on the proposed ℓ1-minimization algorithm of CS theory. For the conventional ultrasonic CT technique, the second step is removed; in addition, ART were employed in the fifth step.
Based on the selected net mentioned previously, the travel time of the ultrasonic wave in the tube can be obtained according to the time-of-flight between the emission and reception, which is in Equation (8).
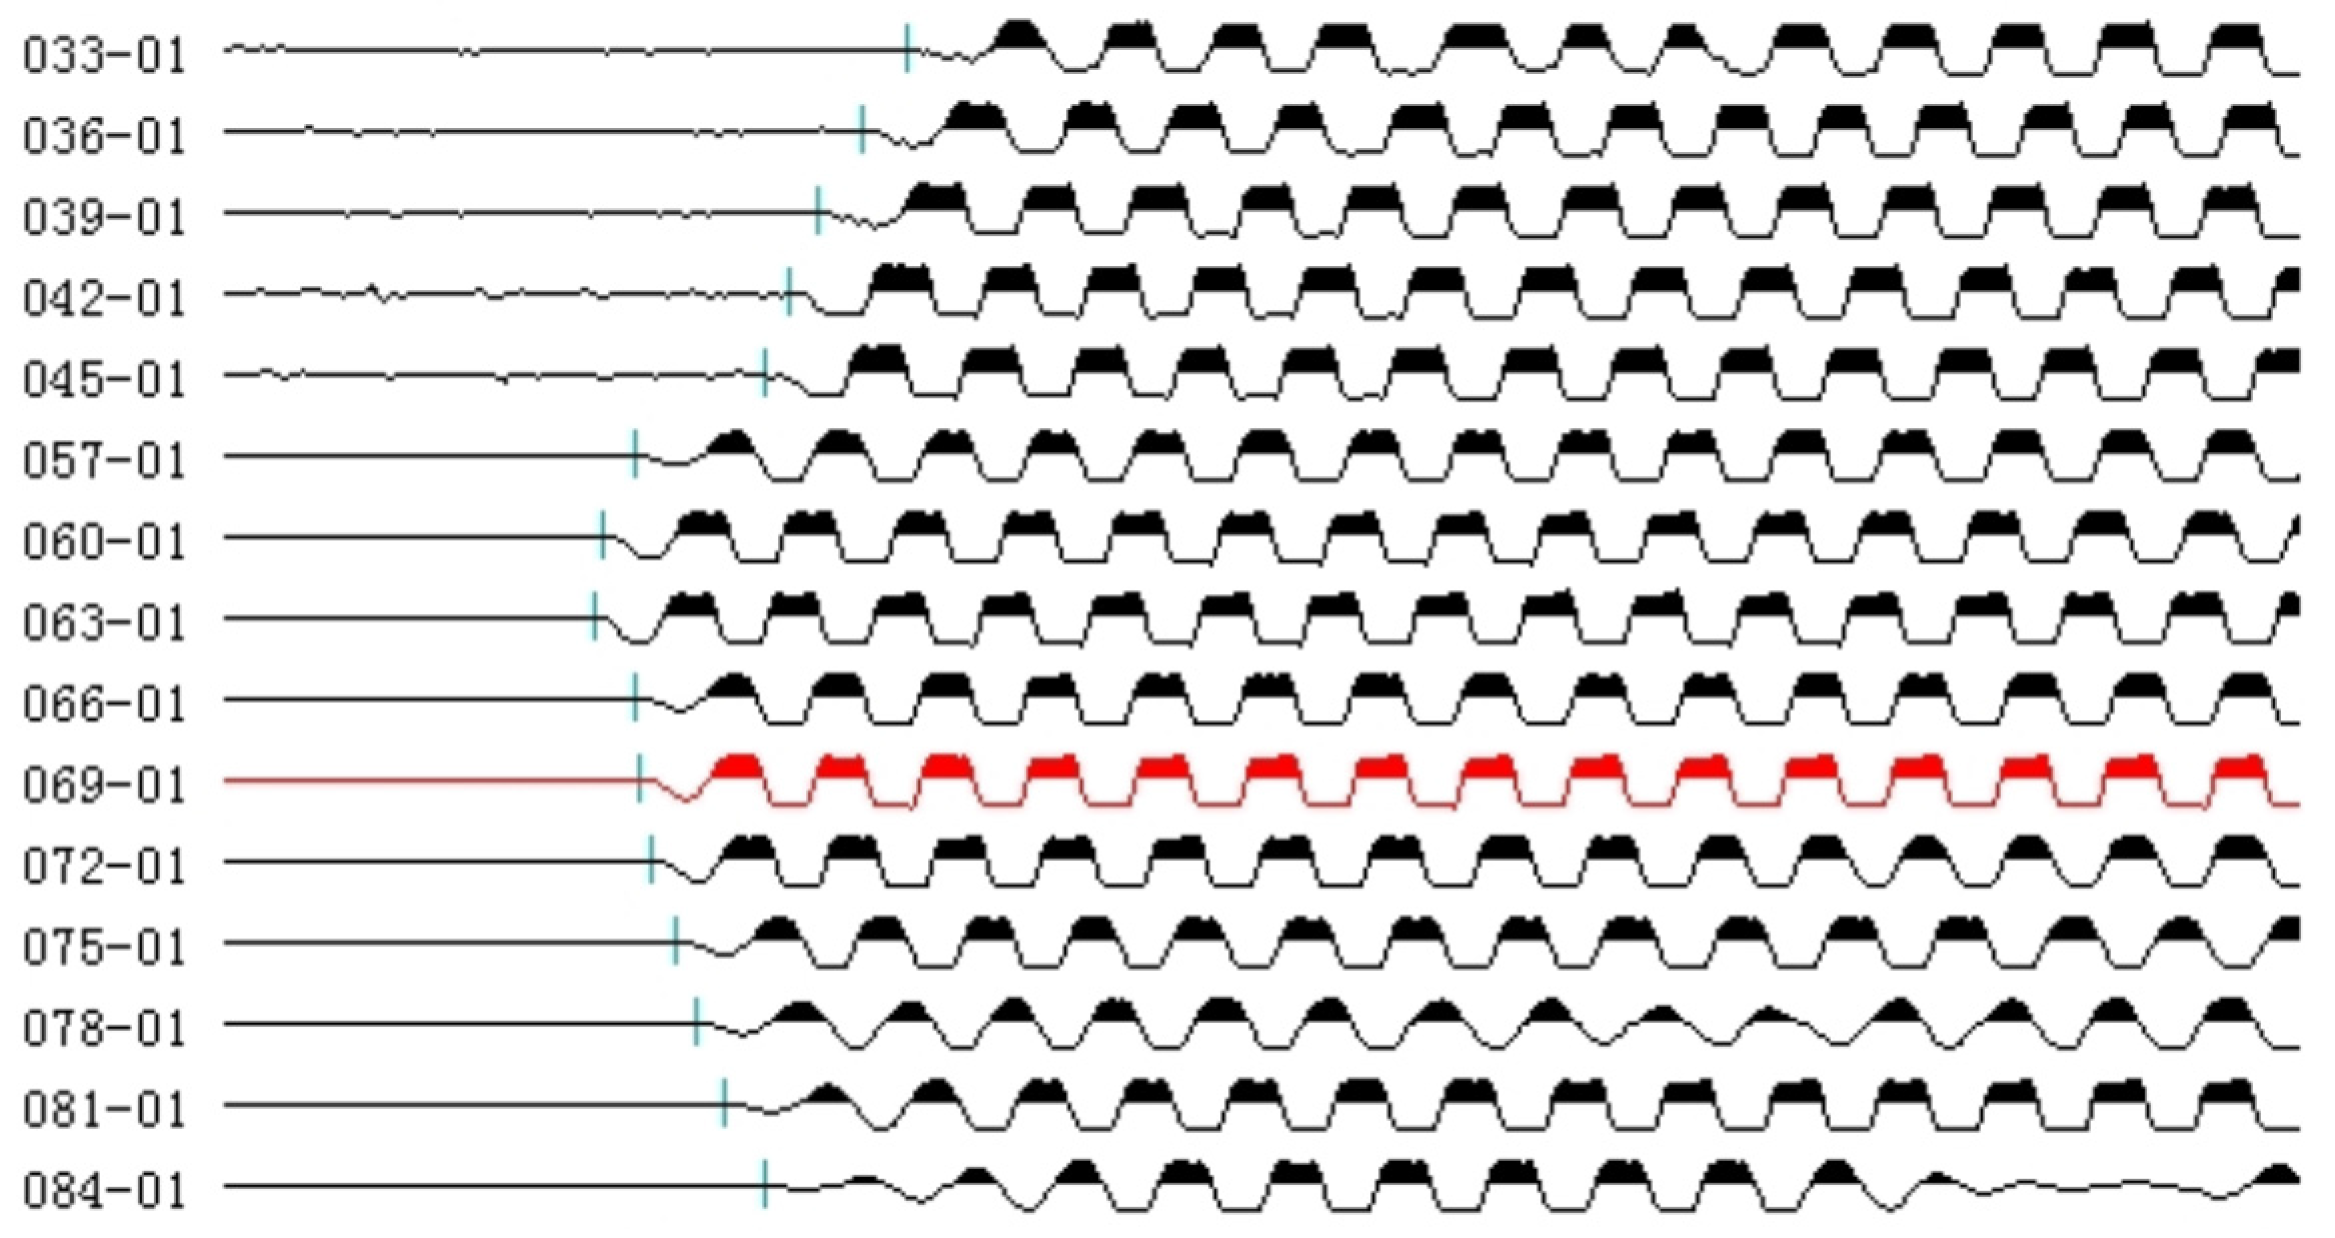
After being measured by the instrument, the waveforms of ultrasonic waves through various selected paths are shown in Figure 9. The travel time of the ultrasonic wave in each path is measured by the arriving time of the first wave in the waveform, which is represented by a blue bar in Figure 9. Each travel time measured by the instrument is assembled as the order of paths to be the selected travel time vector in the Equation (8). Then the difference slownesses of the microstructures, , representing the internal situation of the tube, can be reconstructed by using the ℓ1-minimization algorithm as expressed as Equation (10).
Most inspected results are pristine, indicating that these indiscrete concrete-filled steel tubes of the STS system are without any defect. However, based on the reconstructed results, there are a few tubes containing holes, which should be attributed to construction issues. For instance, tube No. 19 was detected to have two significant flaws. The reconstructed results of that tube are shown in Figure 10. Note that the reconstructed damage vector obtained by the CS algorithm is sparse, indicating critical damage; for the purpose of pursuing a detailed damage report of the tube, conventional ultrasonic CT was employed. As we can see, the improved ultrasonic CT has great agreement with the conventional ultrasonic CT technique, which validates this proposed method via much fewer detections with reasonably accurate damage detection results, especially for the critical damage. There are two severe defects in this tube; the location of one is , and the other is located at about . Several small flaws, the difference slowness of which is larger than 0.010, are also identified by the proposed algorithm.
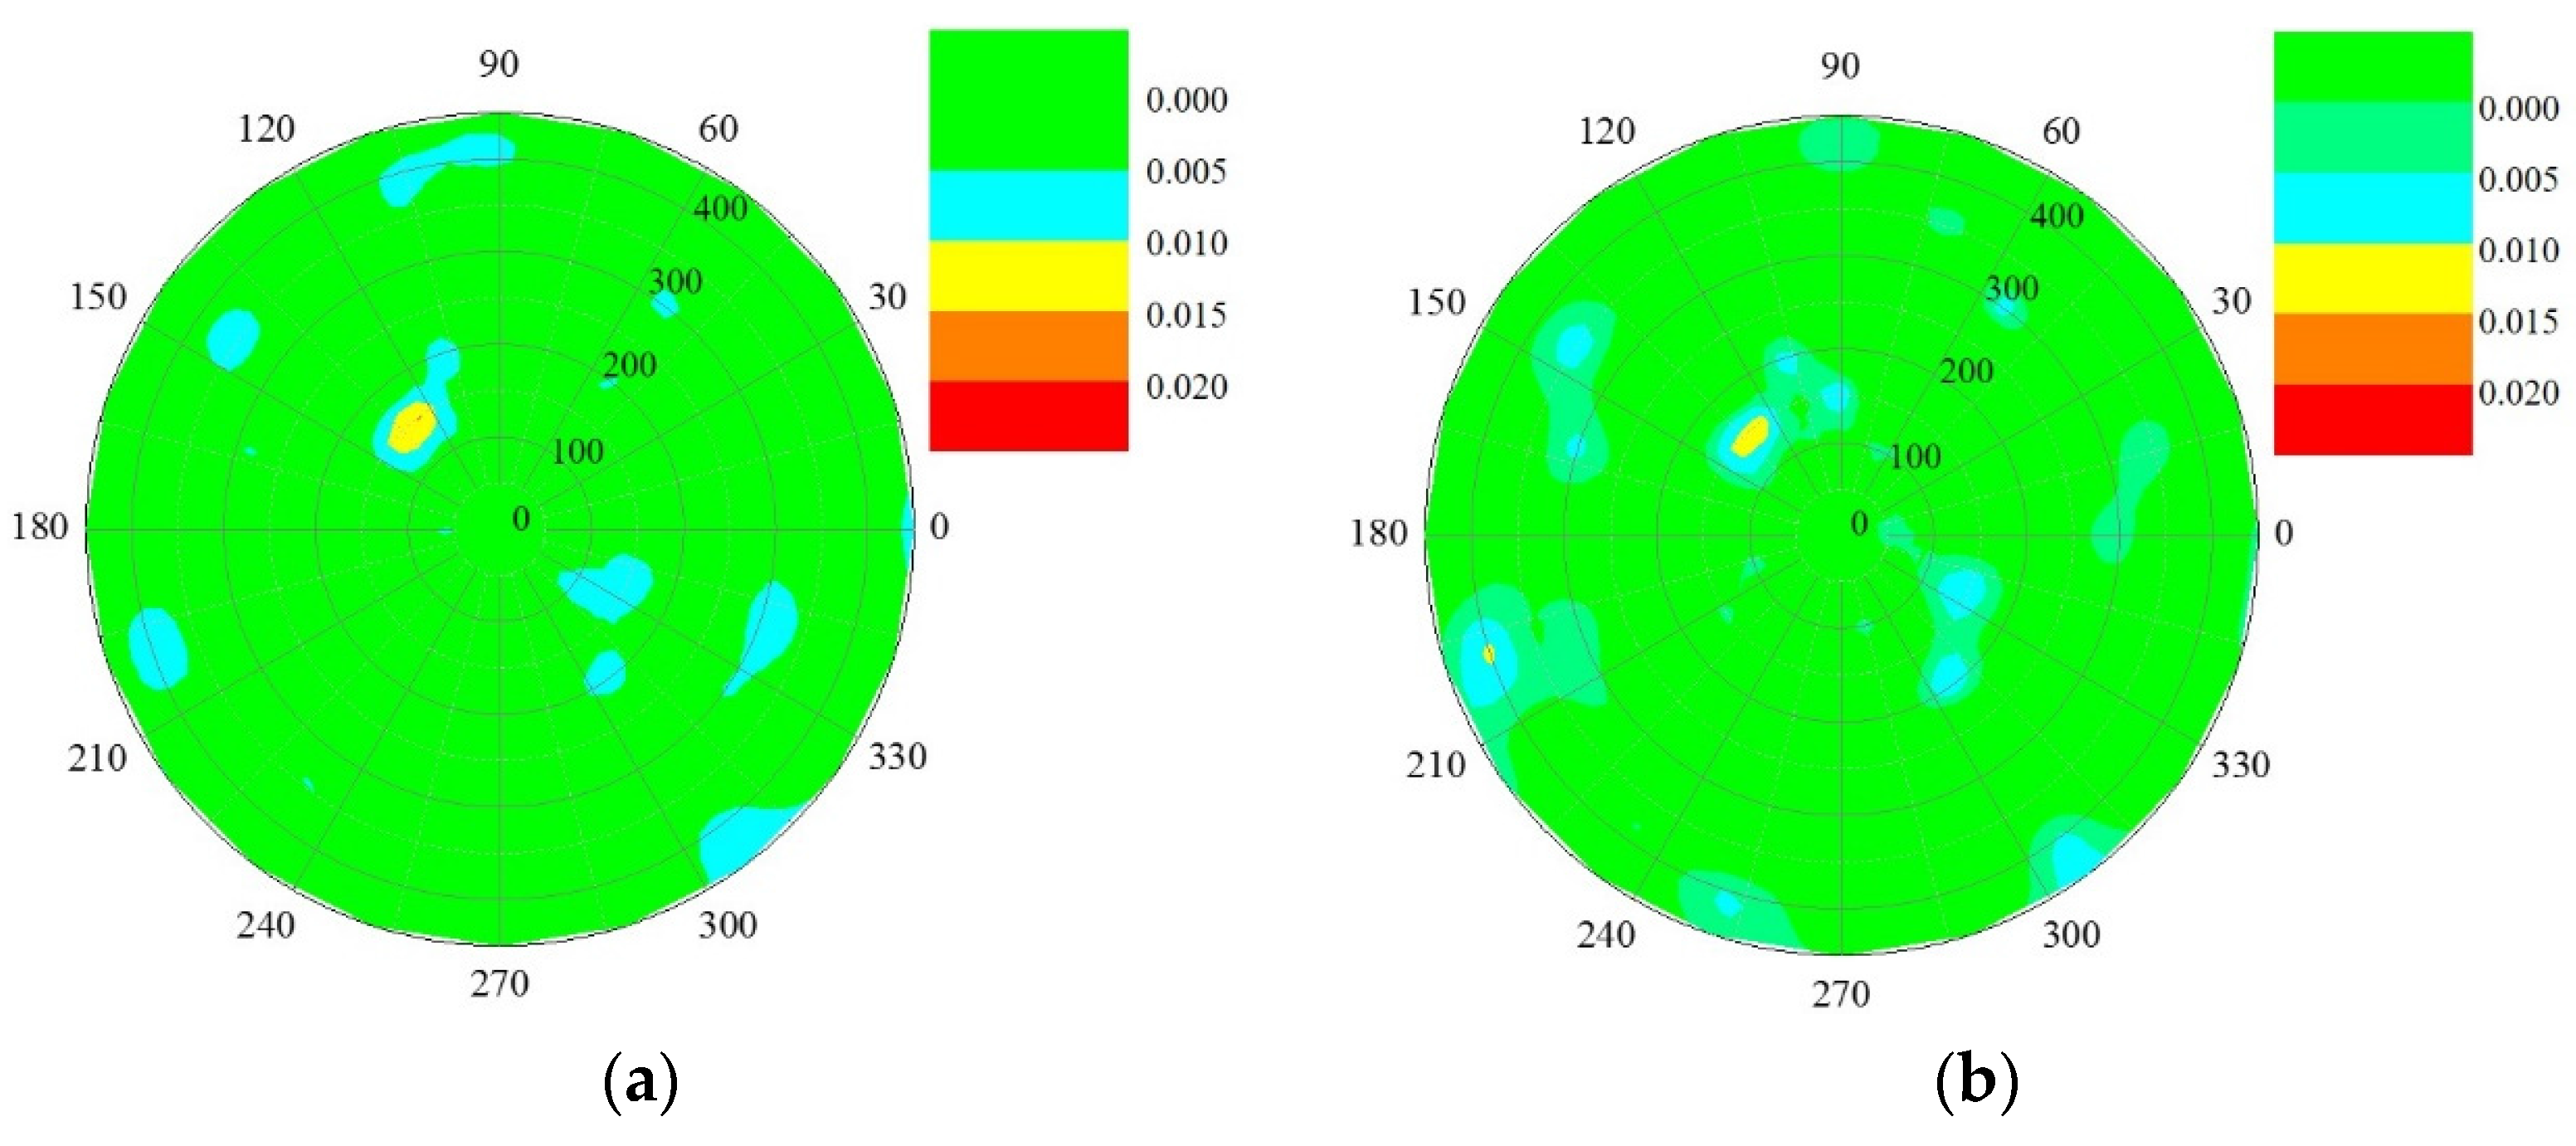
The other concrete-filled steel tube of the STS system (No. 26 tube) was also found to contain one defect. The defect is located at . Its size and the location were first detected by the proposed ultrasonic CT and validated by the conventional one as well, as shown in Figure 11.
Considering the dramatic reduction of the measurement number, the proposed ultrasonic CT improved by CS has a great potential for shortening the work time of damage detection, which provides a more effective approach with good accuracy for NDT.
6. Conclusions
This study presents an improved ultrasonic CT technique based on the CS reconstruction algorithm and low-rate randomly selected measurement paths. It provides an effective alternative to the conventional ultrasonic CT damage detection technique, which requires a dense measurement net.
It is found that the damage detection problem naturally satisfies the requirement of using CS; the damage in the structure is sparse in the spatial domain. Thus, a novel ultrasonic CT detection program in the CS frame was proposed to reduce the work time of the detection project of Shenyang Metro line 9. Two numerical concrete-filled steel tube models of the STS structure, which contained two different damage conditions, are presented for validating the effectiveness of the proposed ultrasonic CT reconstructed algorithm based on CS theory. Additionally, both the improved ultrasonic CT and the conventional one were employed to inspect the damage conditions of all 40 concrete tubes of Olympic Center subway station in Shenyang Metro line 9. Results show that the proposed ultrasonic CT detection method based on the CS reconstructed algorithm can capture the flaws and damage in the concrete tube with much fewer measurement paths or a lower detected number than what is required by the conventional ultrasonic CT technique. Both the numerical and experimental results indicate that the proposed ultrasonic CT improved by CS has a great potential for damage detection, which provides an alternative, accurate, and effective way for NDT.
In future work, the selected measurement paths will be further studied to optimize the detected net. In addition, the authors plan to detect not only the holes and flaws but also the cracks of the STS system, especially in the service stage.
Acknowledgments
This study was financially supported by the project supported by the National Natural Science Foundation of China with grant No. 51578166.
Author Contributions
Baofeng Jiang and Wentao Wang conceived and designed the method; Baofeng Jiang and Wen Zhao analyzed the data; Baofeng Jiang and Wen Zhao wrote the paper.
Conflicts of Interest
The authors declare no conflict of interest.
References
- Chang, P.C.; Flatau, A.; Liu, S. Review paper: Health monitoring of civil infrastructure. Struct. Health Monit. 2003, 2, 257–267. [Google Scholar] [CrossRef]
- Ou, J.; Li, H. Structural health monitoring in mainland China: Review and future trends. Struct. Health Monit. 2010, 9, 219–231. [Google Scholar]
- Farrar, C.R.; Worden, K. An introduction to structural health monitoring. Philos. Trans. R. Soc. Lond. A 2007, 365, 303–315. [Google Scholar] [CrossRef] [PubMed]
- Chang, P.C.; Liu, S.C. Recent research in nondestructive evaluation of civil infrastructures. J. Mater. Civ. Eng. 2003, 15, 298–304. [Google Scholar] [CrossRef]
- Feng, L.; Yi, X.; Zhu, D.; Xie, X.; Wang, Y. Damage detection of metro tunnel structure through transmissibility function and cross correlation analysis using local excitation and measurement. Mech. Syst. Signal Process. 2015, 60, 59–74. [Google Scholar] [CrossRef]
- Delatte, N.; Chen, S.-E.; Maini, N.; Parker, N.; Agrawal, A.; Mylonakis, G.; Subramaniam, K.; Kawaguchi, A.; Bosela, P.; McNeil, S. Application of nondestructive evaluation to subway tunnel systems. Transp. Res. Rec. 2003, 127–135. [Google Scholar] [CrossRef]
- Zhang, W.; Zhang, Z.; Qi, D.; Liu, Y. Automatic crack detection and classification method for subway tunnel safety monitoring. Sensors 2014, 14, 19307–19328. [Google Scholar] [CrossRef] [PubMed]
- Maierhofer, C. Nondestructive evaluation of concrete infrastructure with ground penetrating radar. J. Mater. Civ. Eng. 2003, 15, 287–297. [Google Scholar] [CrossRef]
- Fang, Q.; Zhang, D.; Wong, L.N.Y. Shallow tunnelling method (STM) for subway station construction in soft ground. Tunn. Undergr. Space Technol. 2012, 29, 10–30. [Google Scholar] [CrossRef]
- Meng-Shu, W. Outline of Tunnel Construction by means of Method of Undercutting with Shallow Overburden. Tunn. Constr. 2006, 26, 1–4. [Google Scholar]
- Xie, X.; Zhao, W.; Guan, Y.-P. Numerical Simulation Research on Transverse Anti-bending Characteristics of Concrete Filled Steel Tubes in STS Method for Subway Stations. J. Water Arch. Eng. 2014, 6, 015. [Google Scholar]
- Greenleaf, J.F.; Bahn, R.C. Clinical imaging with transmissive ultrasonic computerized tomography. IEEE Trans. Bio-Med. Eng. 1981, BME-28, 177–185. [Google Scholar] [CrossRef] [PubMed]
- Norose, Y.; Mizutani, K.; Wakatsuki, N. Application of ultrasonic computerized tomography using time-of-flight measured by transmission method to nondestructive inspection for high-attenuation billets. Jpn. J. Appl. Phys. 2014, 53, 07KC19. [Google Scholar] [CrossRef]
- McCann, D.; Forde, M. Review of NDT methods in the assessment of concrete and masonry structures. NDT E Int. 2001, 34, 71–84. [Google Scholar] [CrossRef]
- Kak, A.C. Computerized tomography with X-ray, emission, and ultrasound sources. Proc. IEEE 1979, 67, 1245–1272. [Google Scholar] [CrossRef]
- Rahiman, M.H.F.; Rahim, R.A.; Rahiman, M.H.F.; Tajjudin, M. Ultrasonic transmission-mode tomography imaging for liquid/gas two-phase flow. IEEE Sens. J. 2006, 6, 1706–1715. [Google Scholar] [CrossRef]
- Hay, T.; Royer, R.; Gao, H.; Zhao, X.; Rose, J. A comparison of embedded sensor Lamb wave ultrasonic tomography approaches for material loss detection. Smart Mater. Struct. 2006, 15, 946. [Google Scholar] [CrossRef]
- Büyüköztürk, O. Imaging of concrete structures. NDT E Int. 1998, 31, 233–243. [Google Scholar] [CrossRef]
- Bond, L.J.; Kepler, W.F.; Frangopol, D.M. Improved assessment of mass concrete dams using acoustic travel time tomography. Part I—Theory. Constr. Build. Mater. 2000, 14, 133–146. [Google Scholar] [CrossRef]
- Kepler, W.F.; Bond, L.J.; Frangopol, D.M. Improved assessment of mass concrete dams using acoustic travel time tomography. Part II—Application. Constr. Build. Mater. 2000, 14, 147–156. [Google Scholar] [CrossRef]
- Provost, J.; Lesage, F. The application of compressed sensing for photo-acoustic tomography. IEEE Trans. Med. Imaging 2009, 28, 585–594. [Google Scholar] [CrossRef] [PubMed]
- Van Sloun, R.; Pandharipande, A.; Mischi, M.; Demi, L. Compressed sensing for ultrasound computed tomography. IEEE Trans. Bio-Med. Eng. 2015, 62, 1660–1664. [Google Scholar] [CrossRef] [PubMed]
- Atkinson, C.; Soria, J. Algebraic reconstruction techniques for tomographic particle image velocimetry. In Proceedings of the 16th Australasian Fluid Mechanics Conference, Queensland, Australia, 3–7 December 2007; pp. 191–198. [Google Scholar]
- Willemink, M.J.; de Jong, P.A.; Leiner, T.; de Heer, L.M.; Nievelstein, R.A.; Budde, R.P.; Schilham, A.M. Iterative reconstruction techniques for computed tomography Part 1: Technical principles. Eur. Radiol. 2013, 23, 1623–1631. [Google Scholar] [CrossRef] [PubMed]
- Beister, M.; Kolditz, D.; Kalender, W.A. Iterative reconstruction methods in X-ray CT. Phys. Med. 2012, 28, 94–108. [Google Scholar] [CrossRef] [PubMed]
- Donoho, D.L. Compressed Sensing. IEEE Trans. Inf. Theory 2006, 52, 1289–1306. [Google Scholar] [CrossRef]
- Candès, E.J.; Wakin, M.B. An introduction to compressive sampling. IEEE Signal Proc. Mag. 2008, 25, 21–30. [Google Scholar] [CrossRef]
- Candès, E.J.; Romberg, J.; Tao, T. Robust uncertainty principles: Exact signal reconstruction from highly incomplete frequency information. IEEE Trans. Inf. Theory 2006, 52, 489–509. [Google Scholar] [CrossRef]
- Candes, E.J.; Romberg, J.K.; Tao, T. Stable signal recovery from incomplete and inaccurate measurements. Commun. Pure Appl. Math. 2006, 59, 1207–1223. [Google Scholar] [CrossRef]
- Baraniuk, R.G. Compressive Sensing. IEEE Signal Proc. Mag. 2007, 24, 118–121. [Google Scholar] [CrossRef]
- Malioutov, D.; Cetin, M.; Willsky, A.S. A Sparse Signal Reconstruction Perspective for Source Localization with Sensor Arrays. IEEE Trans. Signal Process. 2005, 53, 3010–3022. [Google Scholar] [CrossRef]
- Wang, W.; Wang, C.; Bao, Y.; Li, H. The study of compressive sampling in ultrasonic computerized tomography. In Proceedings of the 22nd Annual SPIE Smart Structures and Materials + Nondestructive Evaluation and Health Monitoring, San Diego, CA, USA, 8–12 March 2015. [Google Scholar]
- Lustig, M.; Donoho, D.; Pauly, J.M. Sparse MRI: The application of compressed sensing for rapid MR imaging. Magn. Reson. Med. 2007, 58, 1182–1195. [Google Scholar] [CrossRef] [PubMed]
Figure 1.
Schematic of ultrasonic computerized tomography (CT): (a) Densely measurement net; (b) Measurement path and the meshed microstructures of the specimen.
Figure 1.
Schematic of ultrasonic computerized tomography (CT): (a) Densely measurement net; (b) Measurement path and the meshed microstructures of the specimen.

Figure 2.
Practical example of compressive sampling: (a) Original smiley face image; (b) Random selected 200 ray-paths; (c) Reconstructed image.
Figure 2.
Practical example of compressive sampling: (a) Original smiley face image; (b) Random selected 200 ray-paths; (c) Reconstructed image.
Figure 3.
Concrete filled steel tube model of a steel tube slab (STS) structure: (a) Overall view; (b) Microstructures meshed for ultrasonic CT in the cross-section of the model.
Figure 3.
Concrete filled steel tube model of a steel tube slab (STS) structure: (a) Overall view; (b) Microstructures meshed for ultrasonic CT in the cross-section of the model.

Figure 4.
The distinction of measurement net between Nyquist sampling and compressive sampling in the numerical model of the concrete tube of an STS structure: (a) Nyquist sampling needs 190 measurement paths; (b) compressive sampling randomly selects much fewer non-uniform measurement paths (80 paths), which are sufficient for exact recovery of the internal situation.

Figure 5.
Damage detection of numerical model with single damage: (a) Section sketch of concrete-filled steel tube; (b) Reconstructed results.
Figure 5.
Damage detection of numerical model with single damage: (a) Section sketch of concrete-filled steel tube; (b) Reconstructed results.
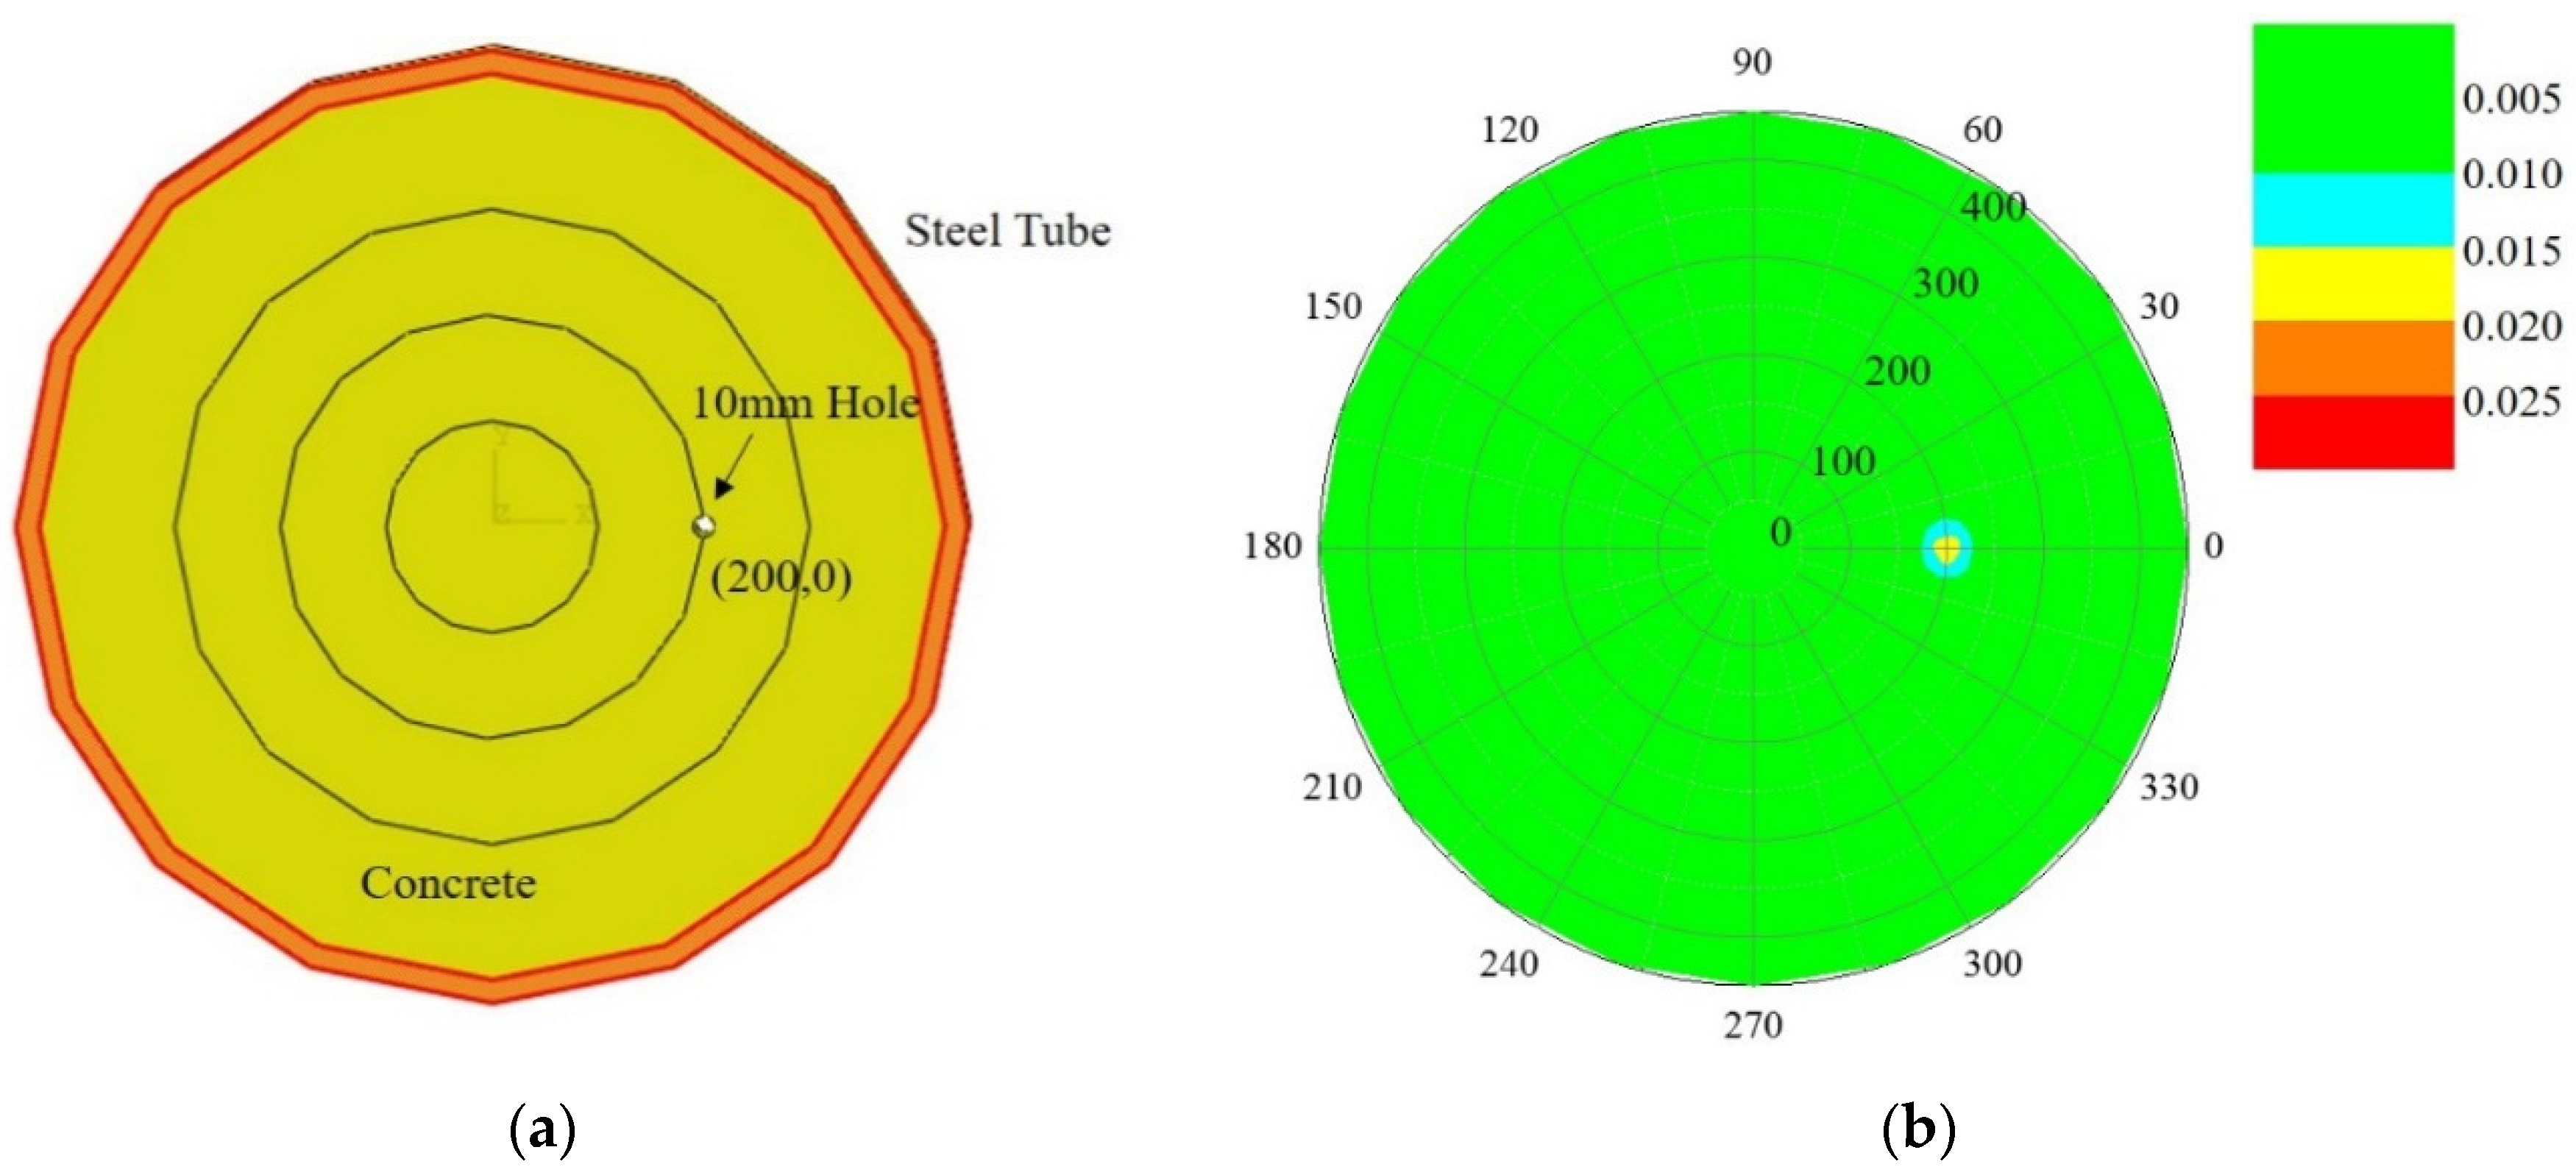
Figure 6.
Damage detection of numerical model with multiple damages: (a) Section sketch of concrete-filled steel tube; (b) Reconstructed results.
Figure 6.
Damage detection of numerical model with multiple damages: (a) Section sketch of concrete-filled steel tube; (b) Reconstructed results.

Figure 7.
The Olympic Center Station in Shenyang Metro line 9: (a) Overview; (b) Cross-section; (c) Concrete-filled steel tubes of the STS structure.
Figure 7.
The Olympic Center Station in Shenyang Metro line 9: (a) Overview; (b) Cross-section; (c) Concrete-filled steel tubes of the STS structure.

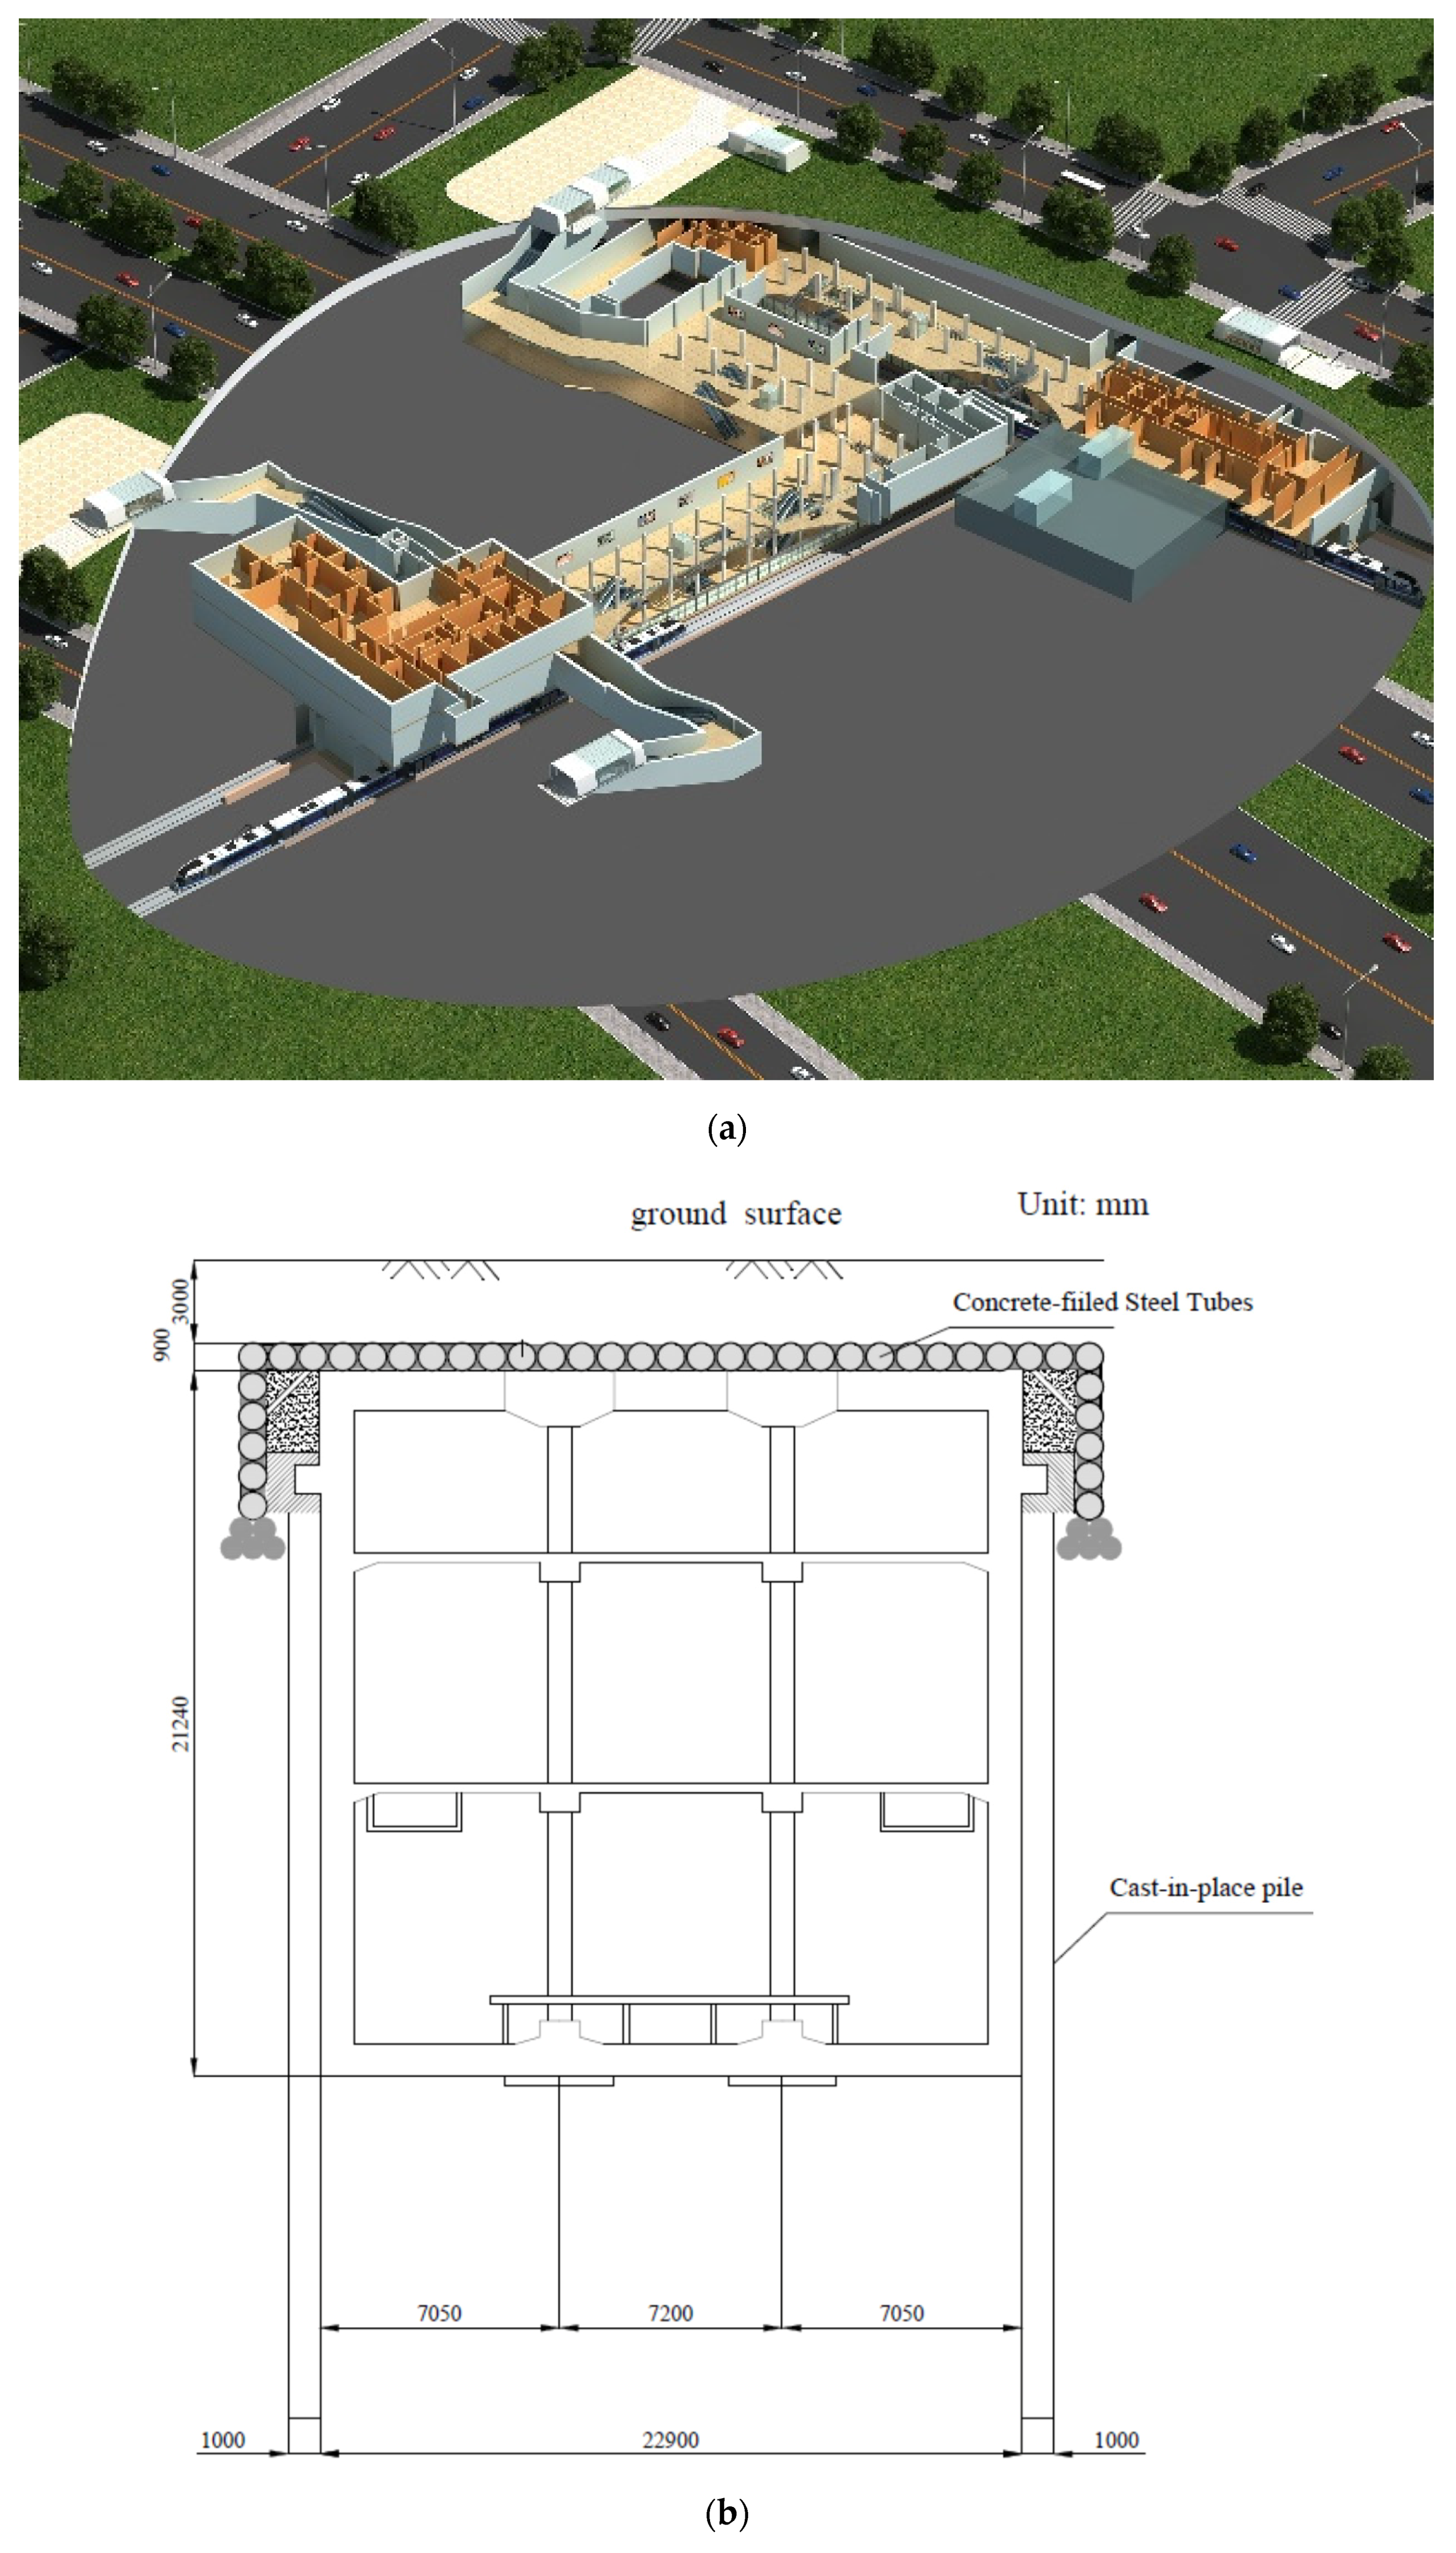

Figure 8.
Ultrasonic inspection for the concrete-filled steel tube of the STS structure: (a) Schematic of damage detection; (b) NU62 equipment and the launched excitation signal.
Figure 8.
Ultrasonic inspection for the concrete-filled steel tube of the STS structure: (a) Schematic of damage detection; (b) NU62 equipment and the launched excitation signal.

Figure 9.
Waveforms of ultrasonic detection through various measurement paths.

Figure 10.
Reconstructed result of No. 19 concrete-filled steel tube in the STS structure of Shenyang Metro line 9: (a) comparison of the improved and conventional ultrasonic CT technique; (b) reconstructed result of the proposed ultrasonic CT reconstructed algorithm based on compressive sampling (CS) theory; (c) reconstructed result of the conventional ultrasonic CT technique and an algebraic reconstruction techniques (ART) algorithm.
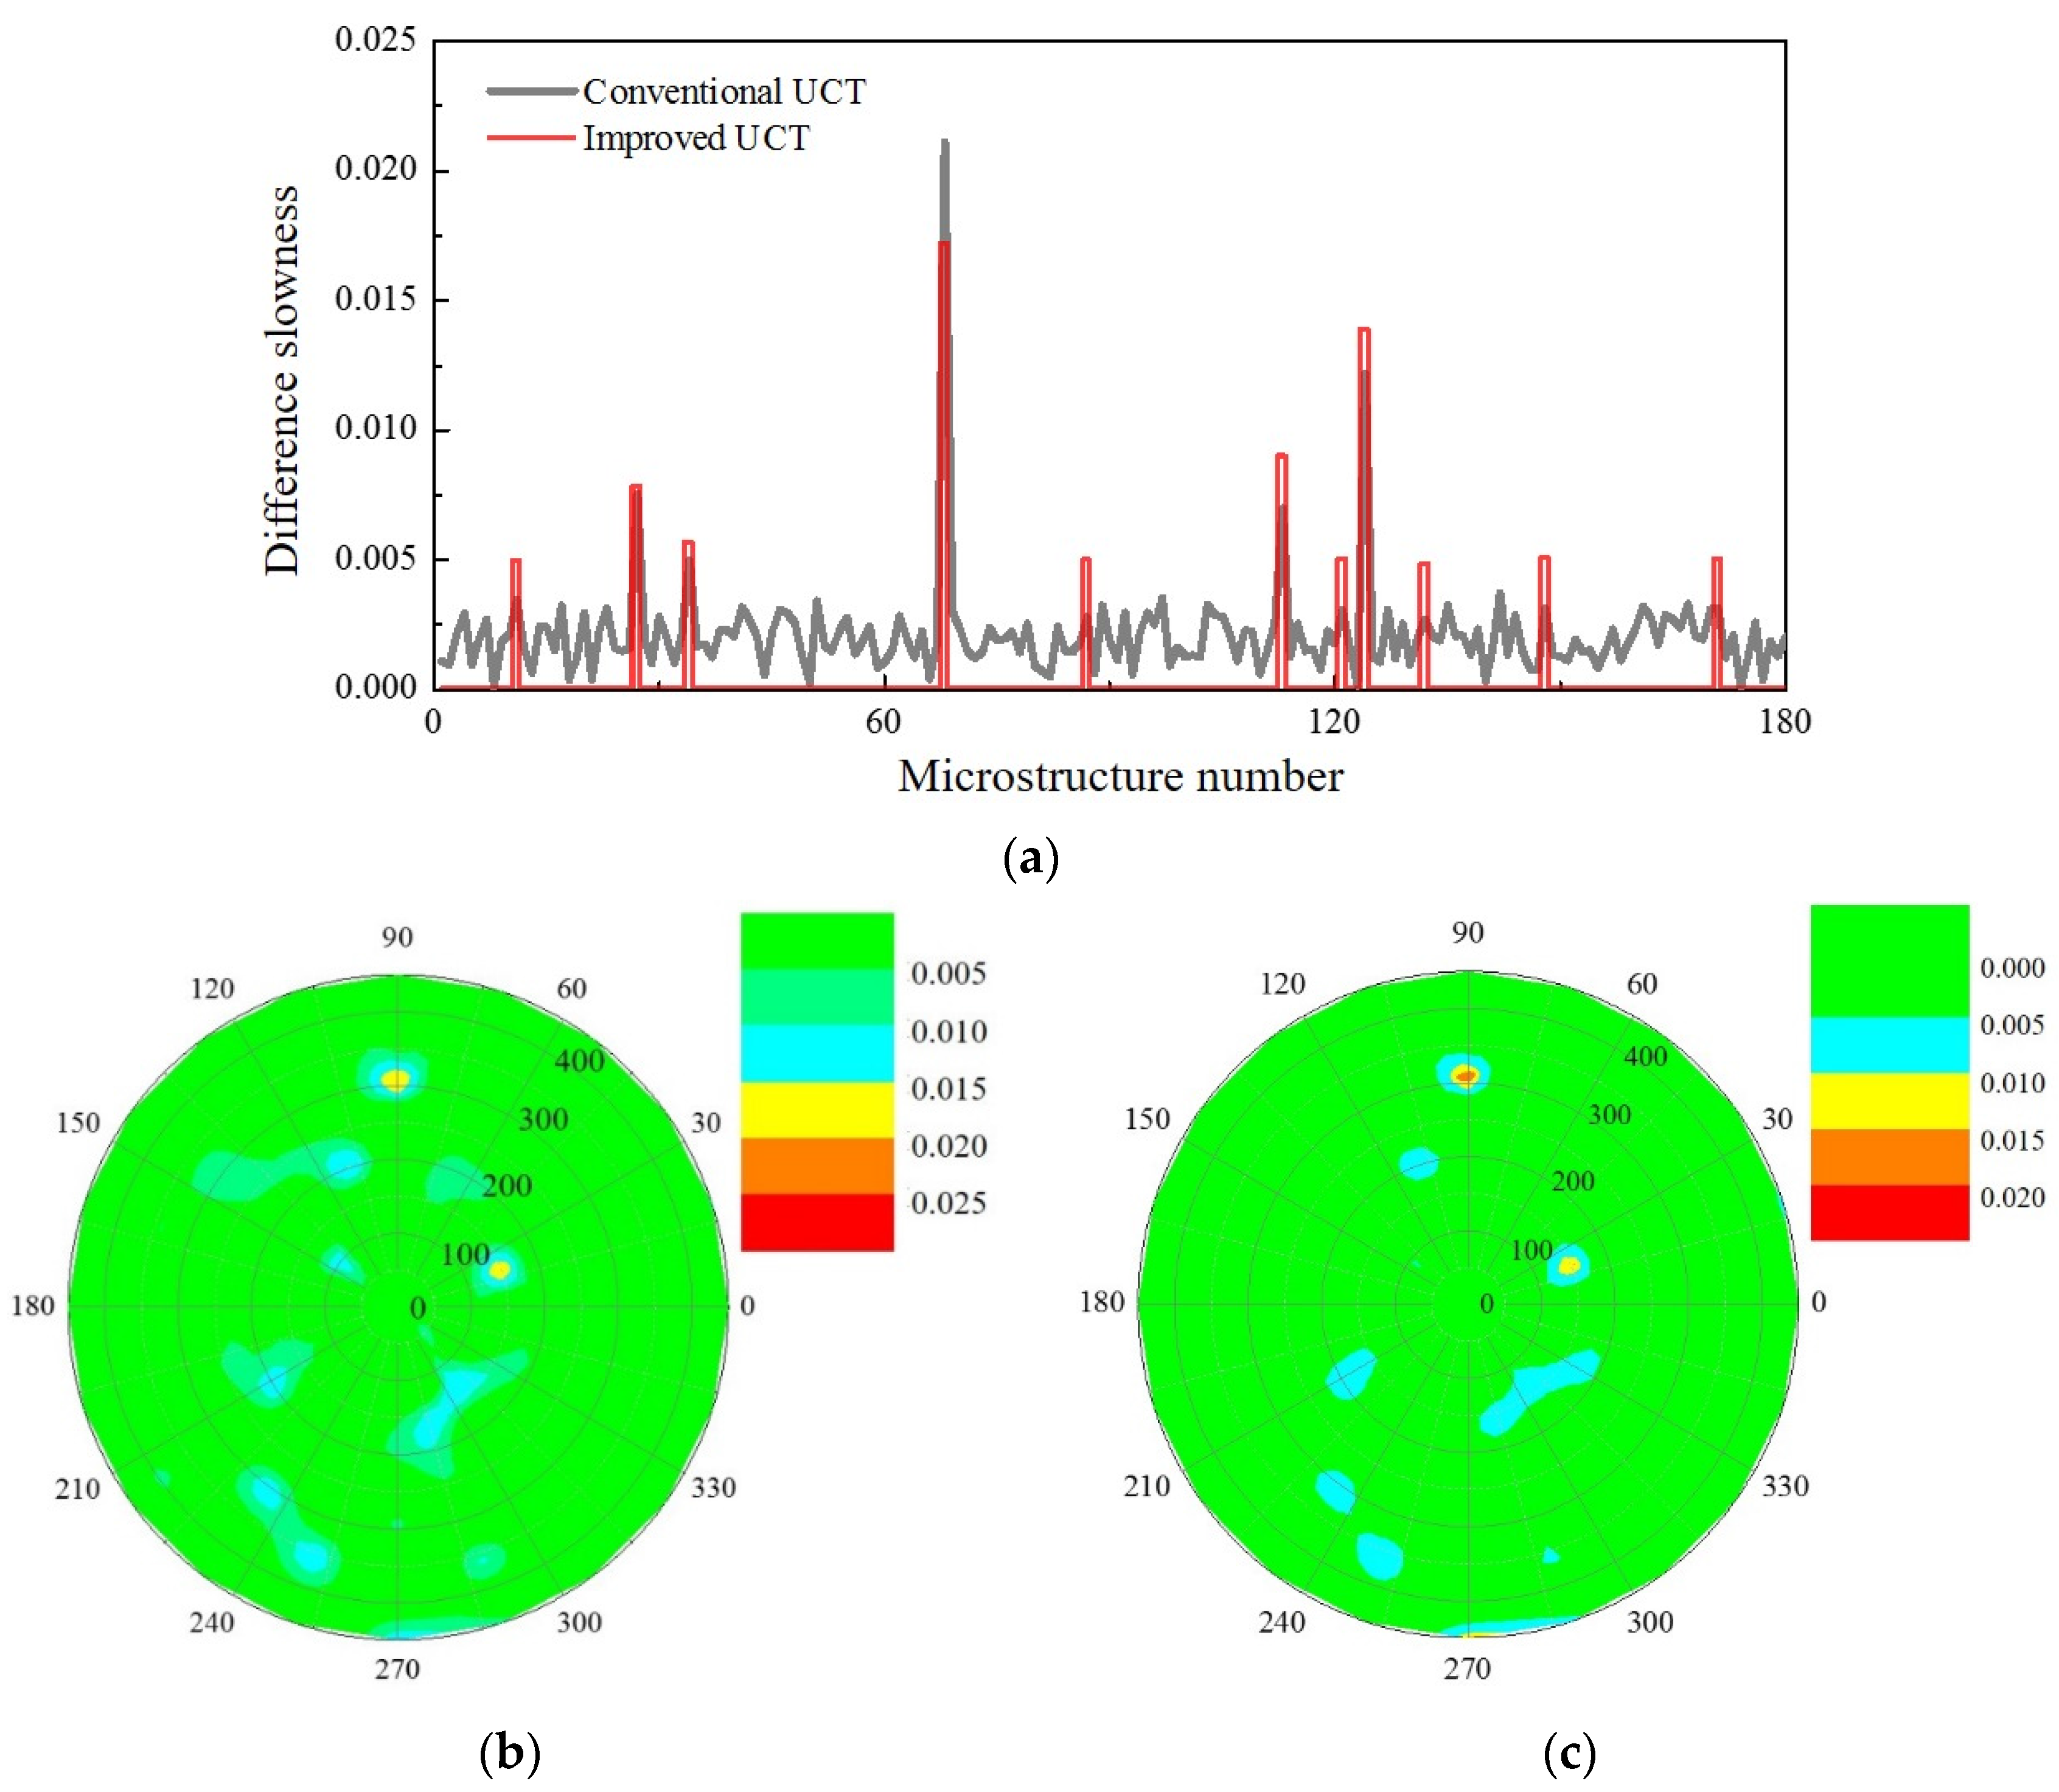
Figure 11.
Reconstructed result of No. 26 concrete-filled steel tube in the STS structure of Shenyang Metro line 9: (a) reconstructed result of the proposed ultrasonic CT reconstructed algorithm based on CS theory; (b) reconstructed result of the conventional ultrasonic CT technique and the ART algorithm.
© 2017 by the authors. Licensee MDPI, Basel, Switzerland. This article is an open access article distributed under the terms and conditions of the Creative Commons Attribution (CC BY) license (http://creativecommons.org/licenses/by/4.0/).
Share and Cite
MDPI and ACS Style
Jiang, B.; Zhao, W.; Wang, W. Improved Ultrasonic Computerized Tomography Method for STS (Steel Tube Slab) Structure Based on Compressive Sampling Algorithm. Appl. Sci. 2017, 7, 432. https://doi.org/10.3390/app7050432
AMA Style
Jiang B, Zhao W, Wang W. Improved Ultrasonic Computerized Tomography Method for STS (Steel Tube Slab) Structure Based on Compressive Sampling Algorithm. Applied Sciences. 2017; 7(5):432. https://doi.org/10.3390/app7050432
Chicago/Turabian StyleJiang, Baofeng, Wen Zhao, and Wentao Wang. 2017. "Improved Ultrasonic Computerized Tomography Method for STS (Steel Tube Slab) Structure Based on Compressive Sampling Algorithm" Applied Sciences 7, no. 5: 432. https://doi.org/10.3390/app7050432
Note that from the first issue of 2016, this journal uses article numbers instead of page numbers. See further details here.