
Using Acoustic Emission Methods to Monitor Cement Composites during Setting and Hardening


Faculty of Civil Engineering, Brno University of Technology, Veveří 331/95, Brno 602 00, Czech Republic
*
Author to whom correspondence should be addressed.
Appl. Sci. 2017, 7(5), 451; https://doi.org/10.3390/app7050451
Submission received: 28 February 2017
/
Revised: 24 April 2017
/
Accepted: 24 April 2017
/
Published: 28 April 2017
(This article belongs to the Special Issue Advances in Acoustic Emission and Health Monitoring of Materials and Structures)
Abstract
:Cement-based composites belong among the basic building materials used in civil engineering. Their properties are given not only by their composition but also by their behaviour after mixing, as well as by the methods of curing. Monitoring the processes and phenomena during the early stages of setting is vital for determining the resulting properties and durability. The acoustic emission method is a unique non-destructive method that can detect structural changes as a cement-based composite is setting. It can also detect the onset and growth of cracks during the service life of a cement-based composite since the moment it has been mixed. The paper discusses the use of the acoustic emission method with a focus on the early stage of the lifespan of a cement-based composite including the measures necessary for its use and description of the parameters of acoustic emission signals.
1. Introduction
Acoustic emission (AE) in non-destructive testing (NDT) is physically similar to an earthquake in seismology [1]. AE is a phenomenon mostly associated with a destruction process. In structural engineering concrete cracking and reinforcement rupture can be detected by analyzing AE events that occur during loading. The AE events can be analyzed either qualitatively or quantitatively. Qualitative AE analysis methods make use of basic parameters of recorded signals and aim at identifying the load history and the stage of degradation of the material. In quantitative AE analysis methods, all characteristics of an AE source are analyzed and, therefore, the wave propagation between the source and sensors needs to be considered. Further progress depends on how wave propagation is modeled in cracking and cracked concrete, and how other elements of structural concrete, such as reinforcement, post-tensioning tendons, or inserts are taken into account [2]. To track the tension changes and/or the crack generation, the acoustic emission method is used. This method allows us to follow up active (dynamic) processes inside the structure. In consequence of local tension accumulation inside the material, there arises foci of tension and, consequently, potential sources of acoustic emission. If the tension reaches, or even exceeds, the critical value at a certain point the accumulated energy will be released resulting in an acoustic event. This event is supposed to be accompanied by the formation of a micro-crack [1]. The tension propagates through the material. The point at which the tension has arisen is called the acoustic emission source. In homogenous and isotropic propagation media a spherical wave propagates from the source, its energy decreases with the distance from the source. Once the wave reaches the specimen surface it can be recorded by means of an acoustic emission sensor. In this way the position of the crack can be determined in the case of homogeneous isotropic materials and appropriate sensor positioning [3]. For the purpose of the measurements evaluation it is necessary to analyze several parameters of an AE waveform, such as its amplitude, duration, and energy. The AE waveform parameters are illustrated in Figure 1. Amplitude is the greatest measured voltage in a waveform which determines the detectability of the signal. Signals with amplitudes below the operator-defined, minimum threshold will not be recorded. Duration is the delay between the first and last threshold crossings and the energy is directly proportional to the area under the acoustic emission waveform [4]:
- i = the recorded voltage transient V(t) of a channel
- t0 = the starting time of the voltage transient record
- t1 = the ending time of the voltage transient record
The modern cementitious materials, such as high-performance concrete (HPC), show advantageous properties compared to conventional concretes, for example, good workability of the fresh concrete and high strength after hardening. Due to low w/c ratios, HPC is generally characterized by low porosity and a finer capillary pore structure [2,5]. On the other hand, due to the restricted moisture transport, a curing by externally-supplied water is not very effective. In deeper regions shrinkage in combination with thermal dilation during cooling of the concrete leads to development of internal stresses if the deformation is restrained. When the internal stresses exceed the tensile strength of the cement paste matrix, micro- or even macro-cracking occurs.
Progress in building material technology and composition require advancements in test procedures for determining the physical and mechanical parameters of new materials. The current testing approach is based on the earliest obtainable identification of disruptions in the internal structure of structural elements, which facilitates early diagnostics of the problem allowing relevant precautions to be taken in order to prevent a later collapse of the structure being designed. The reason this area is being focused on is because many problems with cracking of cement composites arise at early ages [6,7,8]. Controlling the variables that affect the volume change can minimize high stresses and cracking [7,9,10]. Recent measurements suggest the necessity of assessing the magnitude of shrinkage in two consecutive stages of composite aging—at an early age and at later ages [10,11,12,13]. Early-age measurements reveal differences in the development of volume changes, as well as differences in the initiation and propagation of cracks which cannot normally be identified by traditional methods applied after specimens have been removed from moulds (typically after 24 h) [14]. However, these methods mostly determine separate components of early-age shrinkage—e.g., methods for determining plastic or autogenous shrinkage [8,9,12,15,16,17,18,19] and methods for determining shrinkage due to drying (defined mainly in the standards of various countries). Contemporary approaches to shrinkage measurement are based primarily on the determination of relative length changes. In most cases, measurement begins after specimens have been demoulded, which is typically no sooner than at 24 h of age [20].
While drying shrinkage is taking place it is very important to ascertain how microcracks develop when the material is not restrained. These microcracks develop due to aggregate limitation. Non-uniform drying leads to a moisture gradient which results in non-uniform shrinkage. The surface of the cement-based composite shrinks faster than the inside of the material, which causes surface cracking [21,22,23]. Furthermore, the shrinkage might be restrained by the aggregate inside the composite, generally known as a self-restriction, which is caused by the particles inside the composite that shrink more slowly. Stresses due to this type of restriction lead to severe microcracking in the vicinity of the aggregate particles [24,25]. These microcracking greatly affects the transport properties of the cement-based material [26,27,28]. Nevertheless, the evaluation of microcrack formation and their dependence on the size and volume fraction of aggregate is not yet fully understood [20,29]. The measurement of shrinkage and thermal dilation, as well as the resulting stress in the case of restraint, may be performed with so-called temperature-stress testing machines [2]. These tests provide information about potential cracking and failure of the concrete specimen. No information, however, is given concerning the cracking process. Since early-age cracking may lead to severe problems with respect to the durability of the concrete structure it is necessary to detect and quantify the cracks. The AE technique is difficult to use for early-age concrete because AE sensors are mainly designed for hardened concrete. Chotard et al. [30] had to use protruding bars (waveguides), which were used to introduce the signal to the AE sensors. Such waveguides can be preferably used for monitoring the structural changes during whole time of cementitious composite solidification, including the stage of setting and early hardening. This paper describes the hydration process of cementitious composites, which was studied by means of the acoustic emission method and measurement of length changes and temperature development. For this purpose, cement-based mortars were produced with a w/c ratio of 0.46 and 0.35 (with super-plasticizer). The fresh mixture was placed in a mould so that its tendency towards cracking could be monitored while it hardened. A steel waveguide was then inserted into the fresh mixture and a magnetic acoustic emission (AE) sensor was attached to its free end. The acoustic waveguide is a physical aid for guiding sound waves. A sound propagation duct acts as a transmission line as well. The duct contains some medium that supports sound propagation. The measurement results showed close relations between the characteristics being examined. Both the progress of relative length changes and temperature development are reflected in the AE activity.
2. Materials and Methods
The main aim of the performed experiments was to compare the acoustic responses in the early age of setting and hardening of fine-grained cementitious composites which differ considerably in the development of hydration heat and process and development of shrinkage. For this purpose, two fine-grained cement composites (A, B) were made, each with a different w/c ratio and plasticizer content. The fresh composite formula is based on the ČSN EN 196-1 standard for the testing of cement strength characteristics. Composite “A” was made with quartz sand with the fraction of 0–2 mm, CEM I 42.5 R Portland cement (Cement Plant Mokrá, Brno, Czech Republic) and water. The ingredients were mixed at the ratio of 3:1:0.46. The composition of composite “B” was modified by adding a Sika Viscocrete polycarboxylate-based super-plasticizer (Sika Group, Brno, Czech Republic), which, among others, reduced the water coefficient to w/c = 0.35. The other components were the same. To produce both composites, a vertical axle forced concrete mixer with forced circulation and controllable mixing speed was used. Table 1 shows the composition of both composites and fresh mortar properties.
Three test specimens with the length of 1000 mm and cross-section of 100 mm × 60 mm were made from each mixture. They were primarily intended for shrinkage/swelling measurements and monitoring the material acoustic activities in the setting and the early stages of hardening.
The acoustic wave sensors should be placed directly on the object being measured, which, however, is not always possible. The reason may be that the object may not be easily accessible because of its design or because the object’s surface may be so hot that it may damage the sensor, or, as in this particular case, the surface is too unstable. In such cases, acoustic waveguides are used. A major disadvantage of waveguides is the loss of the resulting signal, which is caused by losses generated by the transition across the interface and by the signal being dampened inside the material. If a waveguide is used for scanning, there are two interfaces present. One is between the object’s surface and the waveguide and the other between the waveguide and the sensor [31].
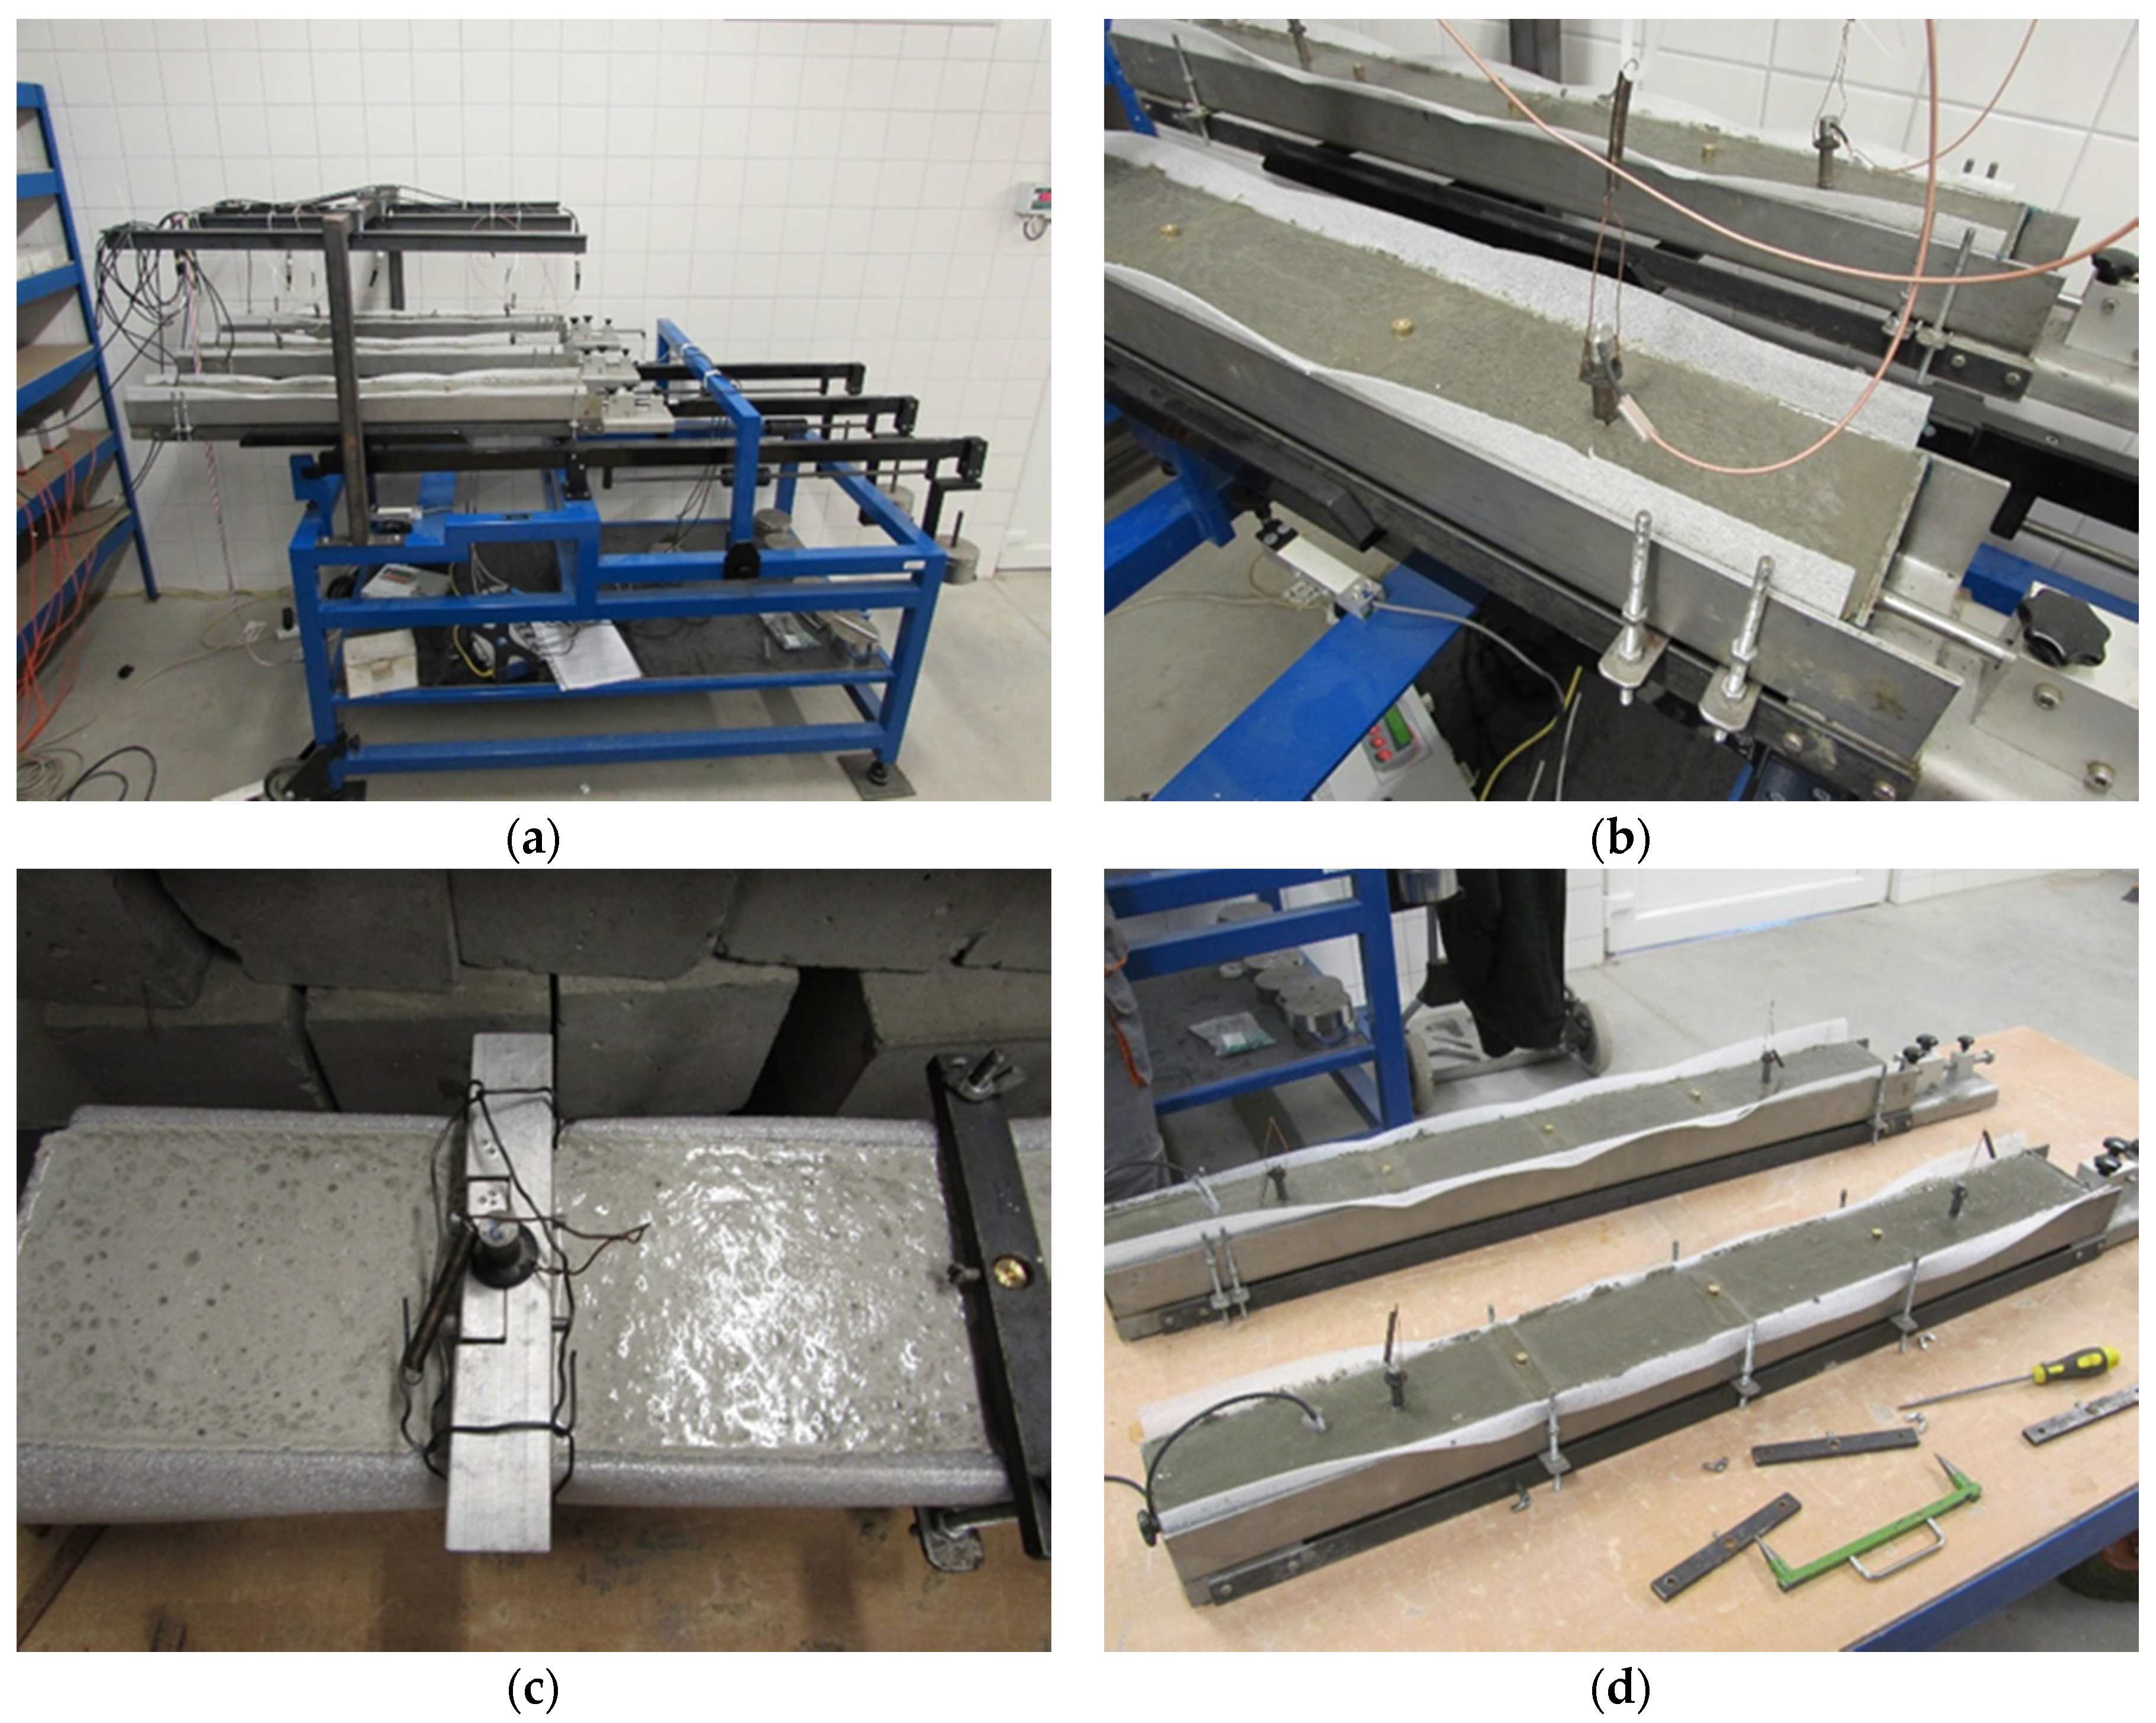
The shrinkage behaviour was studied using a dilatometric shrinkage drain produced by Schleibinger [15], which is primarily designed for measuring relative longitudinal shrinkage of composite materials at early stages of setting and hardening. These testing drains are equipped with a sliding face during measurement supporting an inductive sensor connected to a data exchange, while the other drain face is fixed in place. This is how longitudinal shrinkage is measured along the specimen axis for about 72 h. To allow free deformation of the material during measurement, the inner drain surfaces are coated with a 2 mm thick polyethylene foil (MIRELON). Before the actual pouring, two additional holders were attached to the drain structure to hold the acoustic emission waveguides in place—one near the sliding face and the other at the opposite end of the drain. A thermal sensor to measure the temperature changes inside the specimens was installed near each fixed face. Detailed waveguide positions are shown in Figure 2. Measurements by acoustic emission were carried out using a DAKEL XEDO instrument using suitable magnetic sensors (MDK 13) and waveguides. The acoustic emission sensors were fixed to the waveguide, which was submerged in the fresh mixture.
During the measurement, the drains lay on a special weighing table [32] for continuous recording of mass losses caused by the desiccation of the surface of the test specimens placed in the shrinkage drains. Using the above described device, the measuring process could be started after the tested material has set slightly. In the experiment performed, the measurement started about 1 h after the fresh composite was poured in the dilatometric shrinkage drains. The actual measurement was carried out in an air-conditioned chamber to preserve a temperature in the range of 19 to 23 °C and ambient relative humidity in the range of 50 to 70% for about 72 h. It should be noted that the upper surface of the tested specimens was intentionally exposed to free desiccation for the entire time of measurement. For details on the testing device and measurement procedure, see [33].
3. Results and Discussion
The measurement results presented below show the relations between temperature development and acoustic responses detected during setting and early hardening of investigated materials. In this measurement, more important than monitoring the absolute values of temperatures is to monitor their development trend.
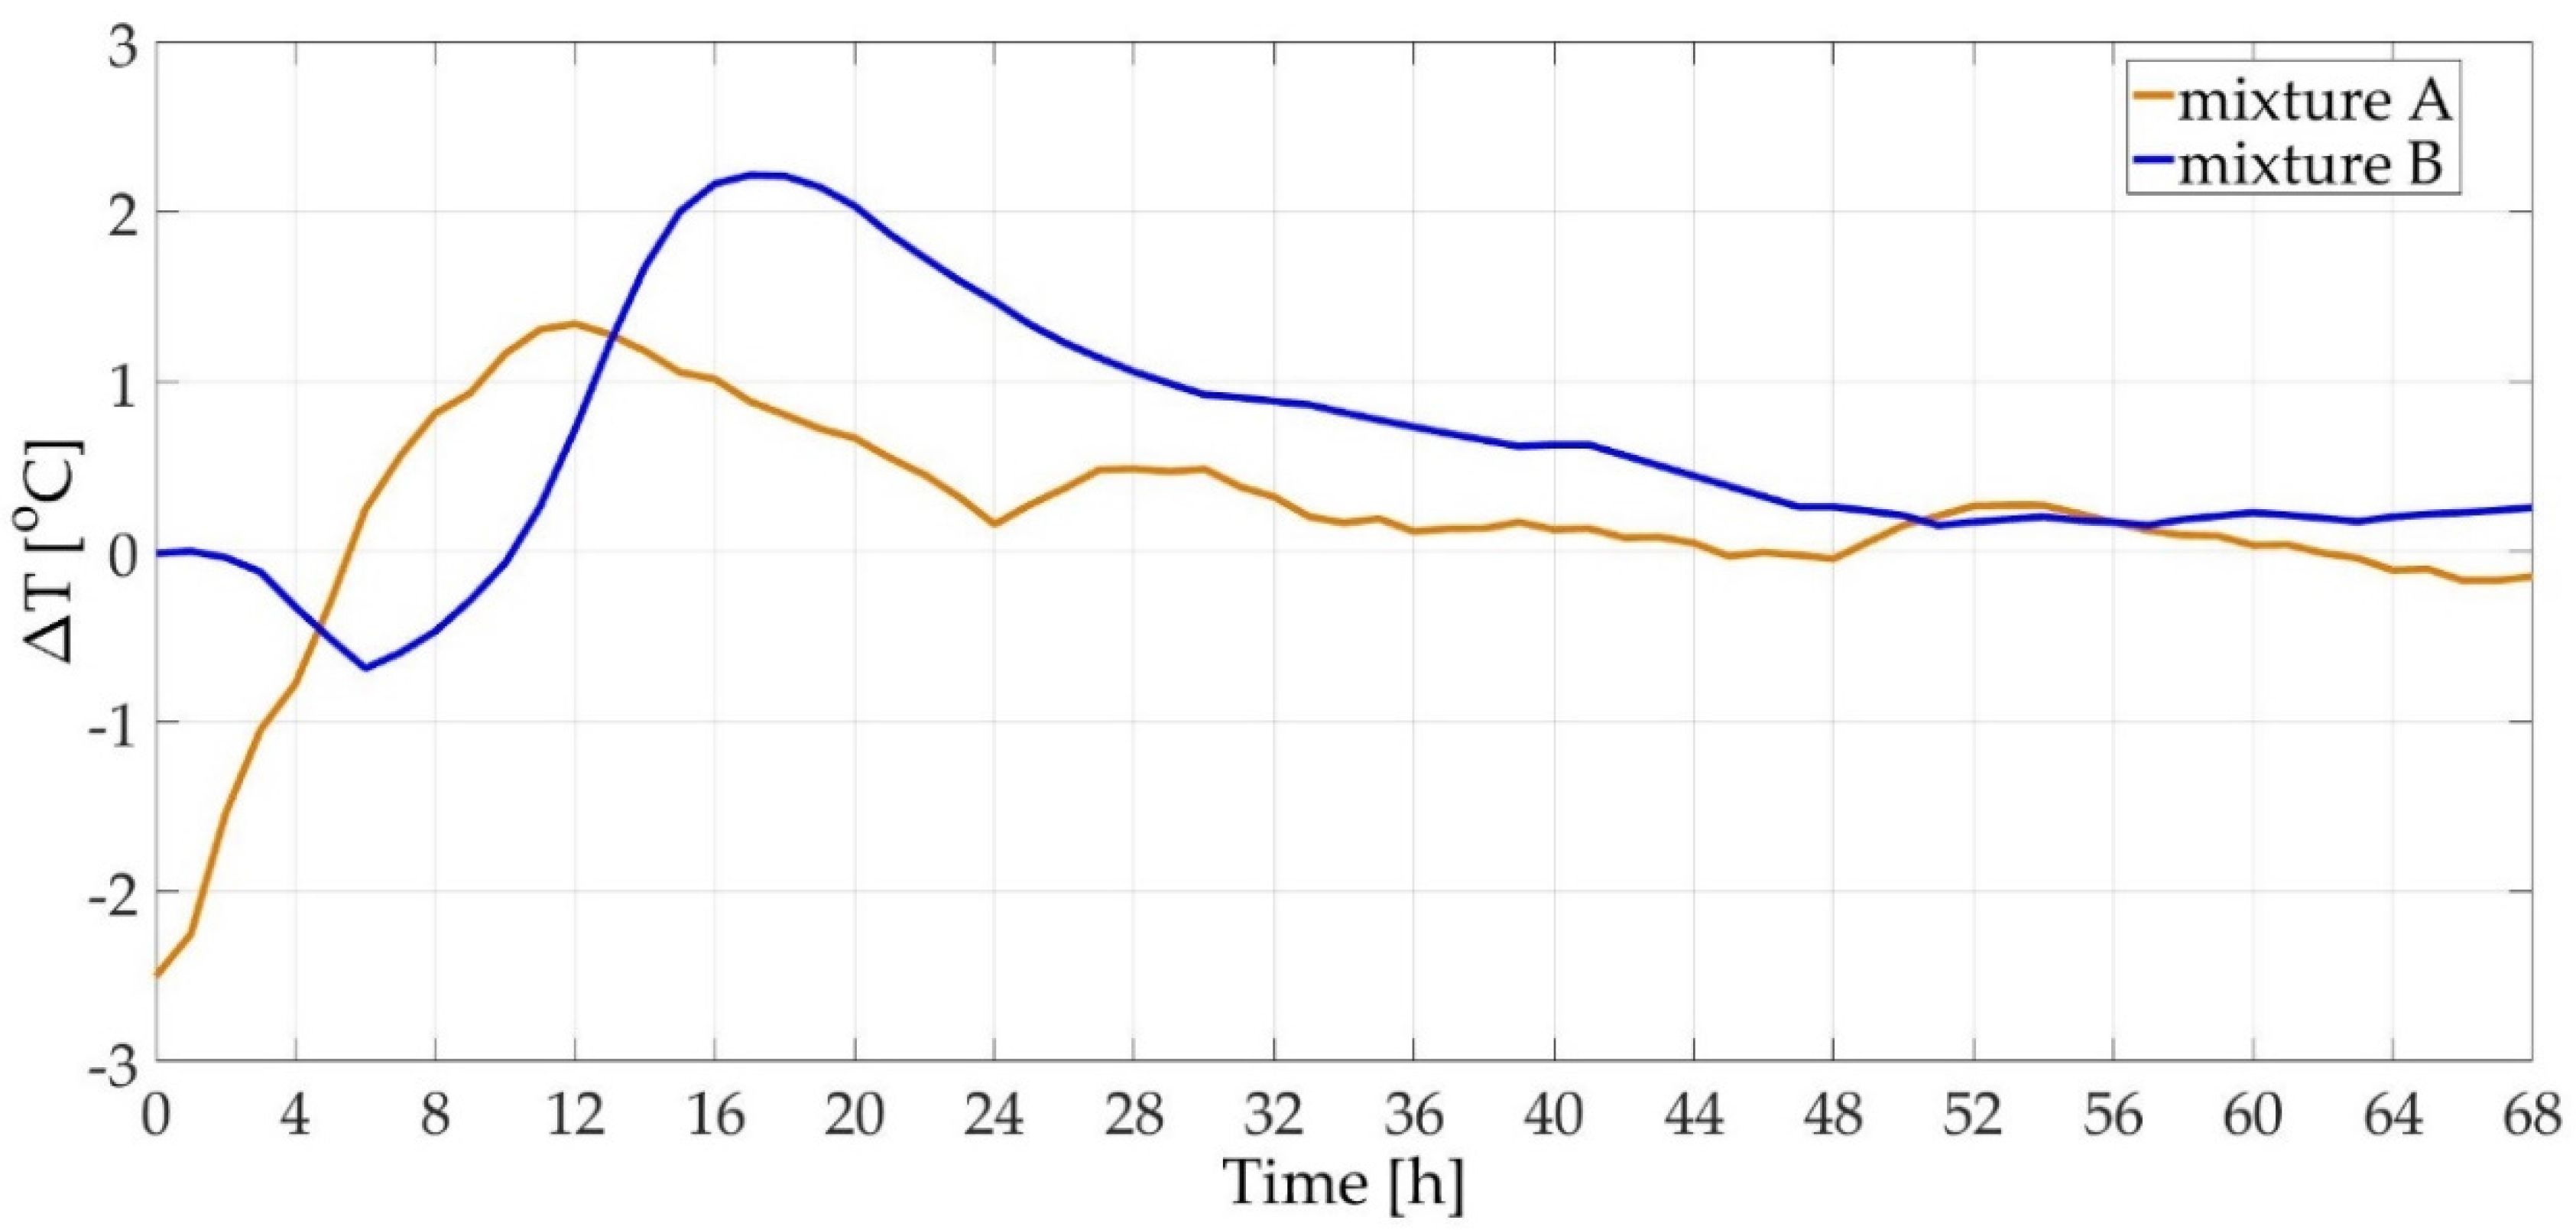
Figure 3 shows the time-dependent differences between temperatures measured inside the specimens and the ambient temperatures for a mixture without (A) and with plasticizer (B). The figure shows that the setting end-time (the peak value of ΔT) is shifted by about 5 h in the mixture with plasticizer. The addition of the super-plasticizer slowed down the hydration and delayed the onset of hydration temperatures.
The progress of temperatures corresponds well with the progress of relative length changes of test specimens (shrinkage measured along the longitudinal axis of test specimens). Looking at the time-dependent changes in specimens' length shown in Figure 4, the influence of a higher w/c ratio is manifested by swelling in the initial stage of setting and hardening. This initial swelling is caused by partial re-absorption of the water appearing on the specimen surface (bleeding) [12]. The literature calls this phenomenon ‘autogenous swelling’ and it is thought to be related to a high w/c ratio [34,35]. This swelling is further intensified by thermal expansion due to hydration heat development. The peak of the hydration heat was reflected in the development of relative length changes. In case of mixture “A” approx. 11 h after the start of measurement a surge of the length increment was recorded. In case of composite “B” a dormant period accompanied by short expansion was observed after the maximum temperature was recorded (approx. 16 h after start of measurement).
Before the results of AE measurements are discussed, it should be noted that all measurements were started approx. 1 h after pouring the fresh mixtures into the moulds. At this time, the fresh mixtures behaved as thixotropic fluid so the movable head of the moulds was not pushed out under the composites’ own weight. Shortly after that, the waveguides were also fixed in the stable positions so that results of AE measurements were not influenced by their movement. To detect AE signals in concrete, a measurement system (DAKEL XEDO) consisting of AE sensor (MDK13 with inbuilt magnetic holder), amplifier (AS3K with 35 dB gain), and filter (100–800 kHz) was used. Total amplification of the pre-amplifier and the main amplifier was set from 60 dB to 72 dB. The measurement system records such parameters as count, hit, event, maximum amplitude, rise time, duration, RMS (root mean square) voltage, and arrival-time difference. The waveform parameters are illustrated in Figure 1. Elimination of the noise is ensured by setting the threshold level (400 mV), or by filtering during a post-analysis of the data.
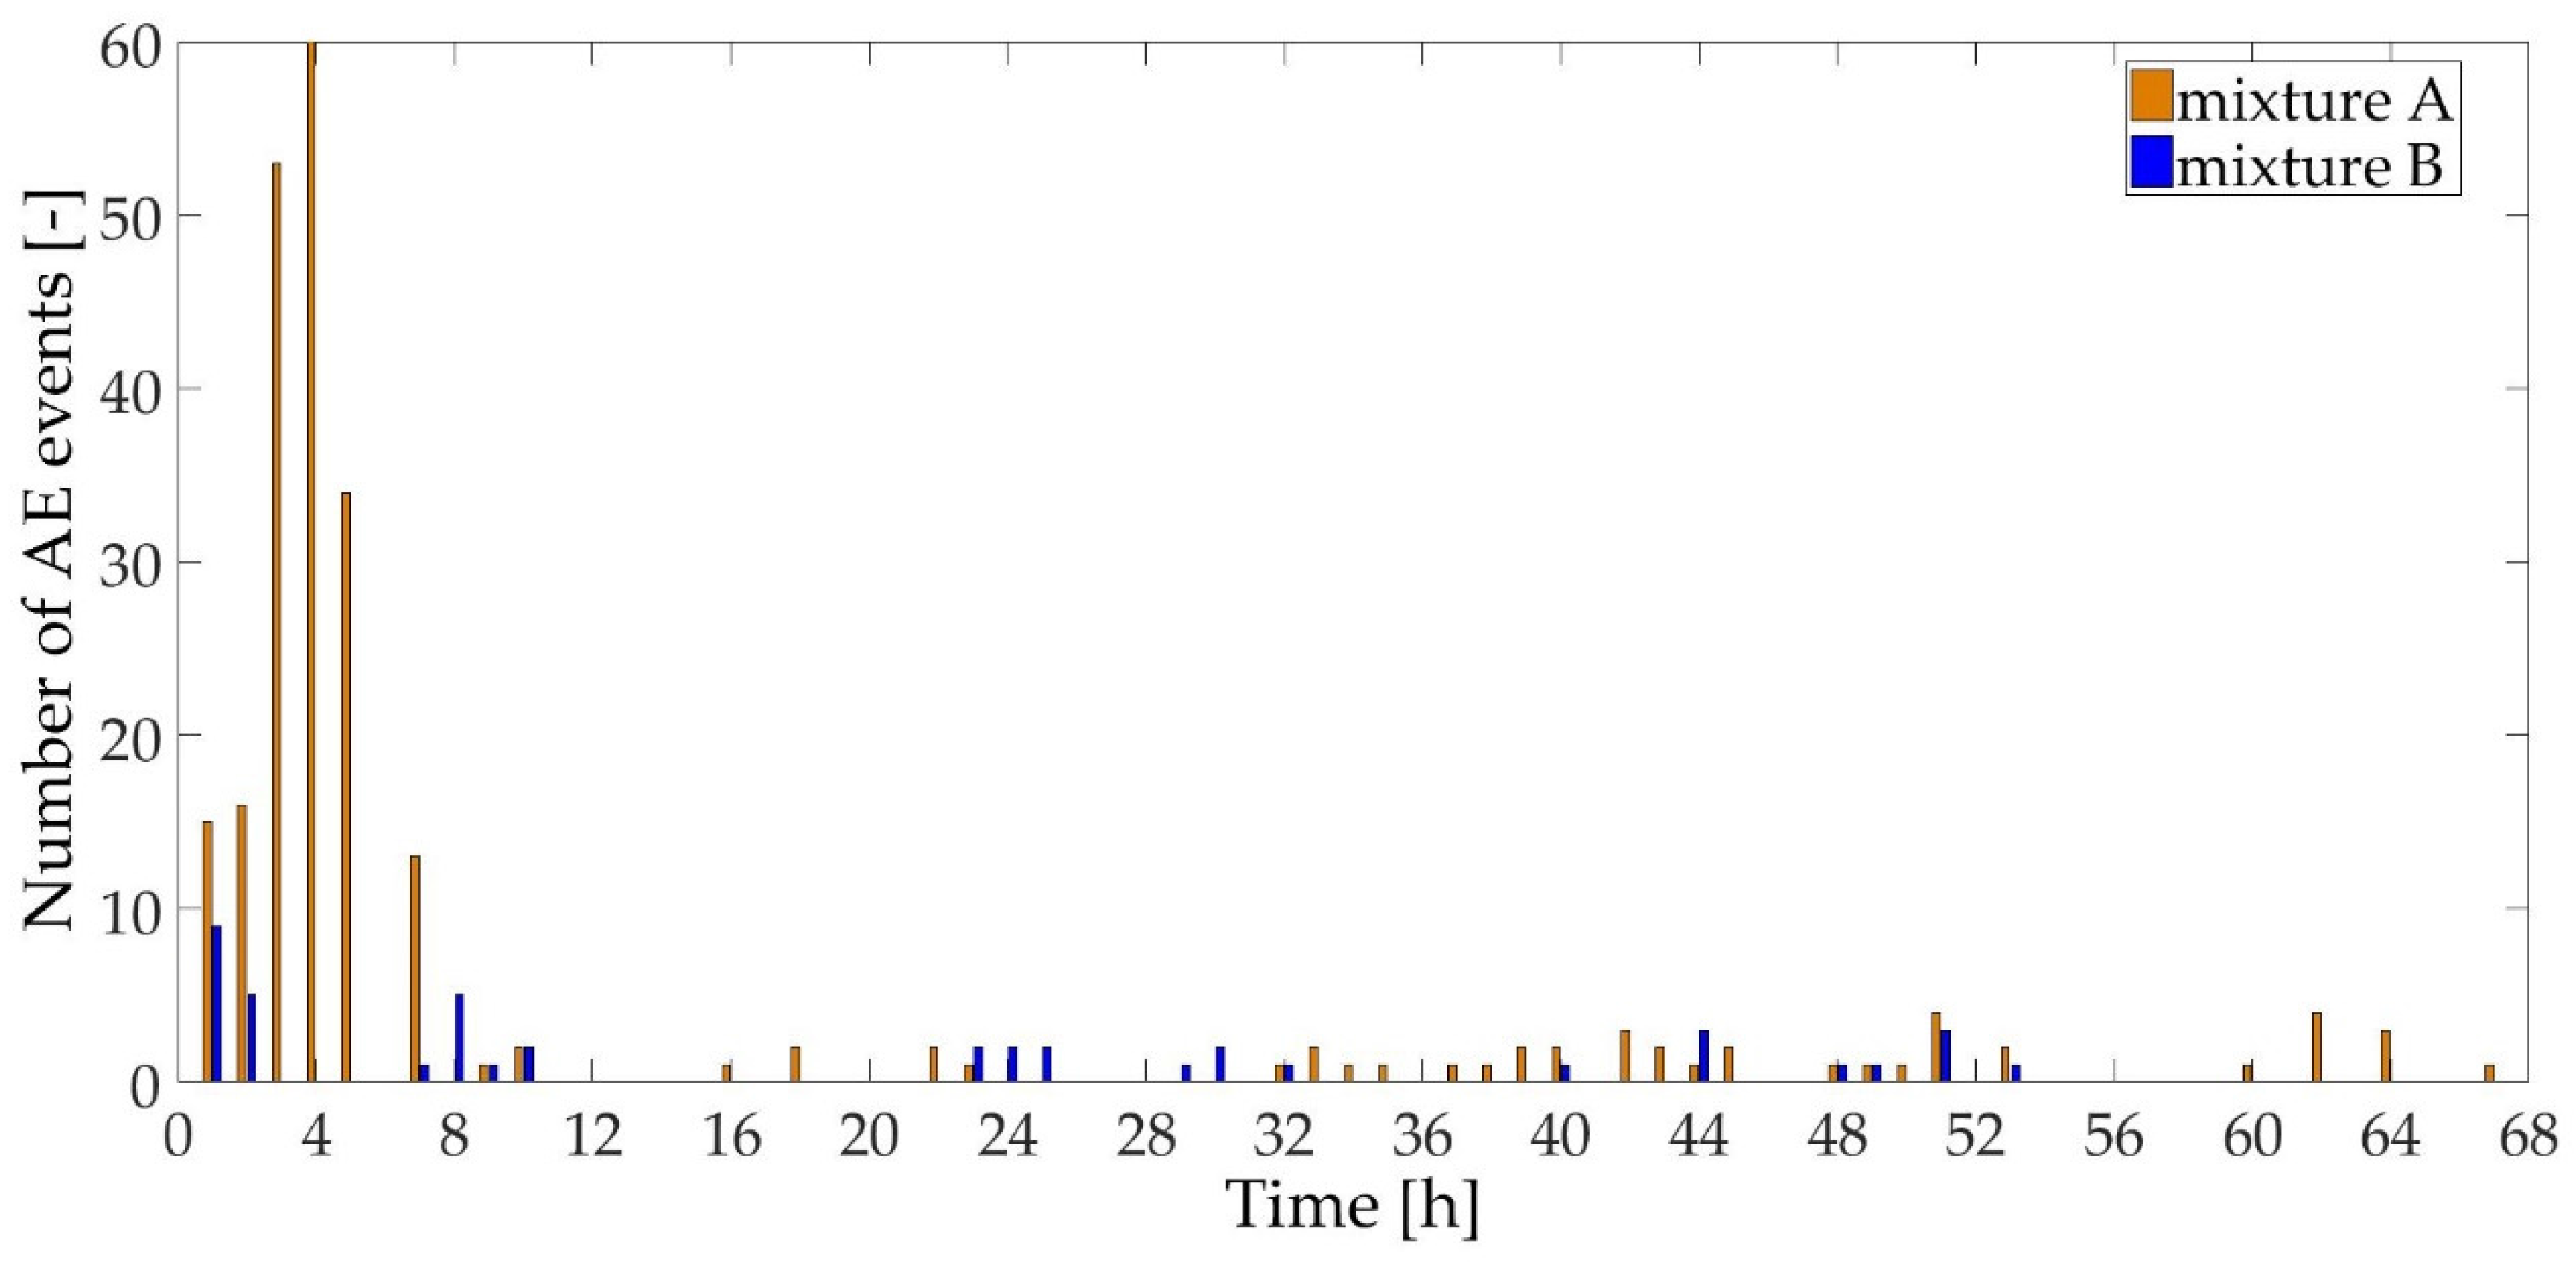
The events recorded for mixture “A” presented in Figure 5 show that most AE events tend to occur in the first six hours of aging. This very early stage sees the beginning of plastic setting, microstructure formation (hydration products) and gradual increase of hydration heat. The increased acoustic activity of the composite without plasticizer is caused also by the initial re-absorption of water from the surface of the test specimens (bleeding was observed, see above). After this stage, there is a dormant period in acoustic effects, which lasts for the whole period of swelling. Once composite “A” starts to shrink, acoustic activity is once again present in the specimens. It can be presumed that this activity is caused by inner tension brought about by gradual temperature equalization between the specimen and the environment [36]. Later acoustic signals may be a consequence of both structure generation and micro-cracking.
The situation is different in composite “B”. The added plasticizer slowed down and delayed setting and hardening, which the records reflect as a drop in the number of the AE events (compared with composite “A”). No bleeding was observed in this mixture, i.e., there was no re-absorption of water from the specimens’ surface. Most events in the mixture were recorded during the first two h of aging, which is related to plastic setting and early microstructure formation. Later, an increase in shrinkage was recorded, the intensity of which rose with age, along with an increase of the specimen’s internal temperature. Again, during this period the specimen exhibited an increased acoustic response. The period of about 10 to 22 h was acoustically dormant. Between 14 and 22 h of aging the shrinkage development reached a steady state. This phenomenon is supposedly connected with the generation of hydration heat, which reached its maximum value during this interval. More activity occurs around the 24th h of aging, when the test specimens started to shrink again.
The observation of the signal lengths during setting and early stage of hardening presented in Figure 6 shows that there are only minor differences between mixtures “A” and “B”. In the first 10 h signals in mixture “B” are more dampened, which is, again, due to the slower hydration of the mixture, which is softer at this stage. The mixture “B” signal lengths are higher in the period between 22–32 h, which is related to the already stronger structure and better bond of the matrix than at the beginning of setting.
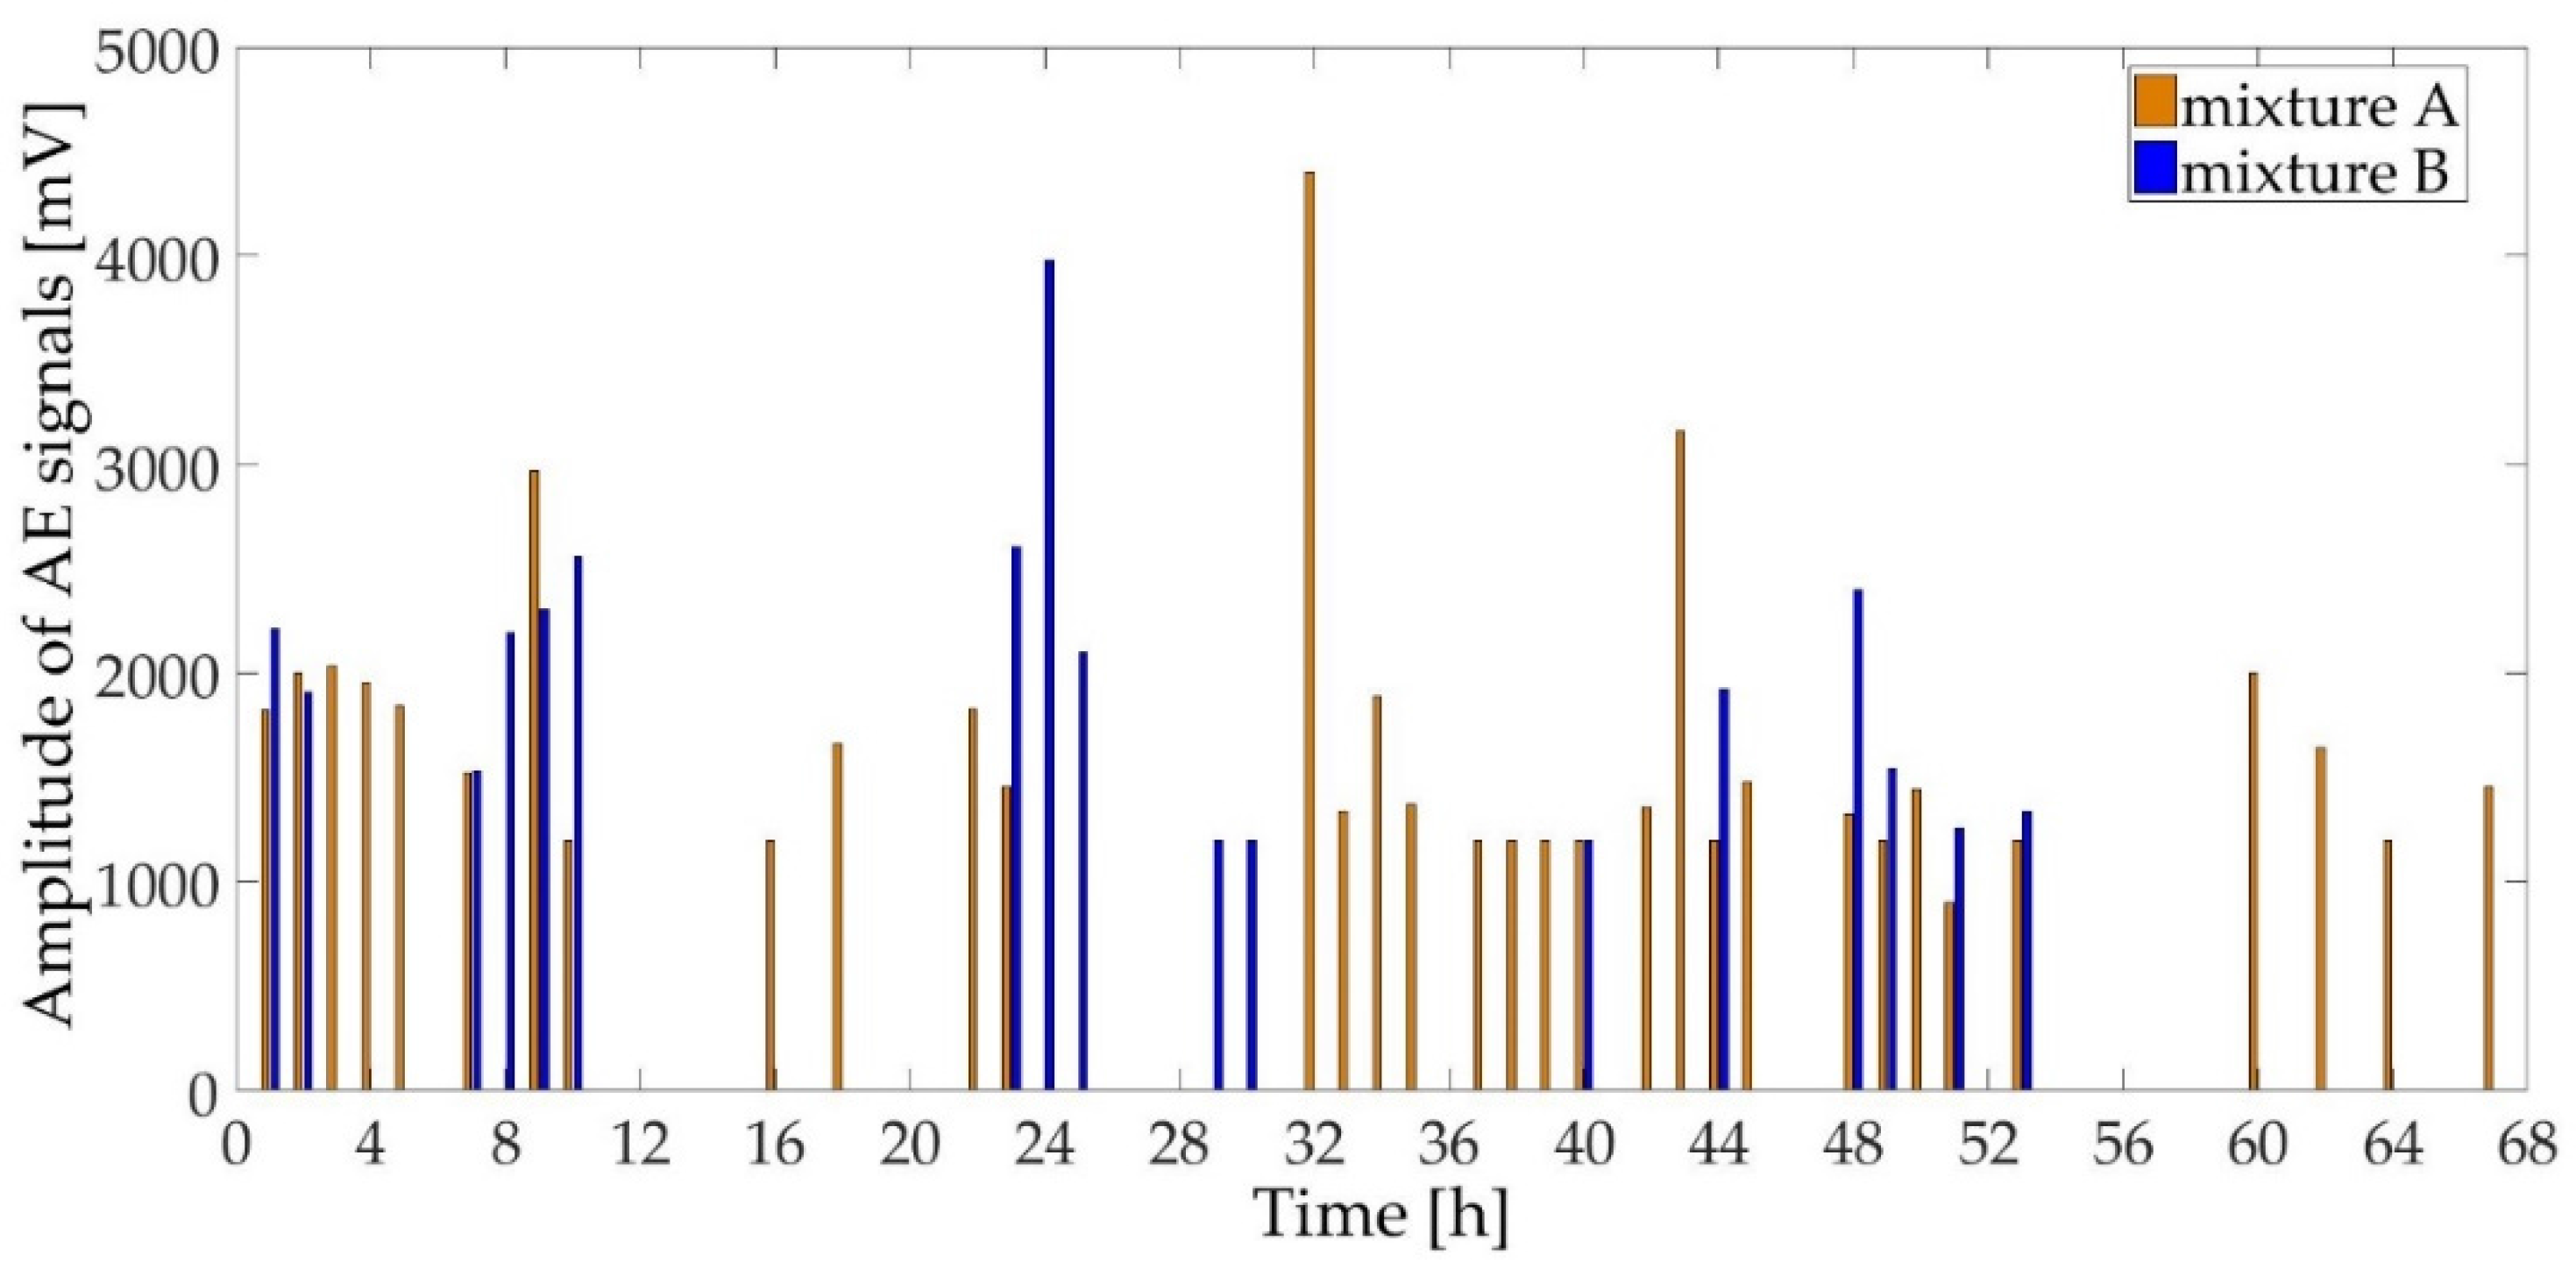
The values of the amplitudes of an acoustic emission signal shown in Figure 7 indicate that after the formation of the solid phase (i.e., at the time when both mixtures reached the end of the setting time) these amplitudes are higher for mixture “B” (compared to mixture A), especially at about the 24th h of aging, when the composite “B” started again to shrink. A similar effect can be observed also for composite “A” at about the 32nd h of aging. Based on the results of the number of AE events (see Figure 5) it can be assumed that, in spite of the fact that the appearance and number of events in mixture “B” is lower than in mixture “A”, a greater damage to the material was caused (average value of AE amplitude is higher for mixture B). The highest AE amplitudes are detected at the time of the cracks’ initiation. During their further opening many events with small amplitudes can usually be recorded [37,38].
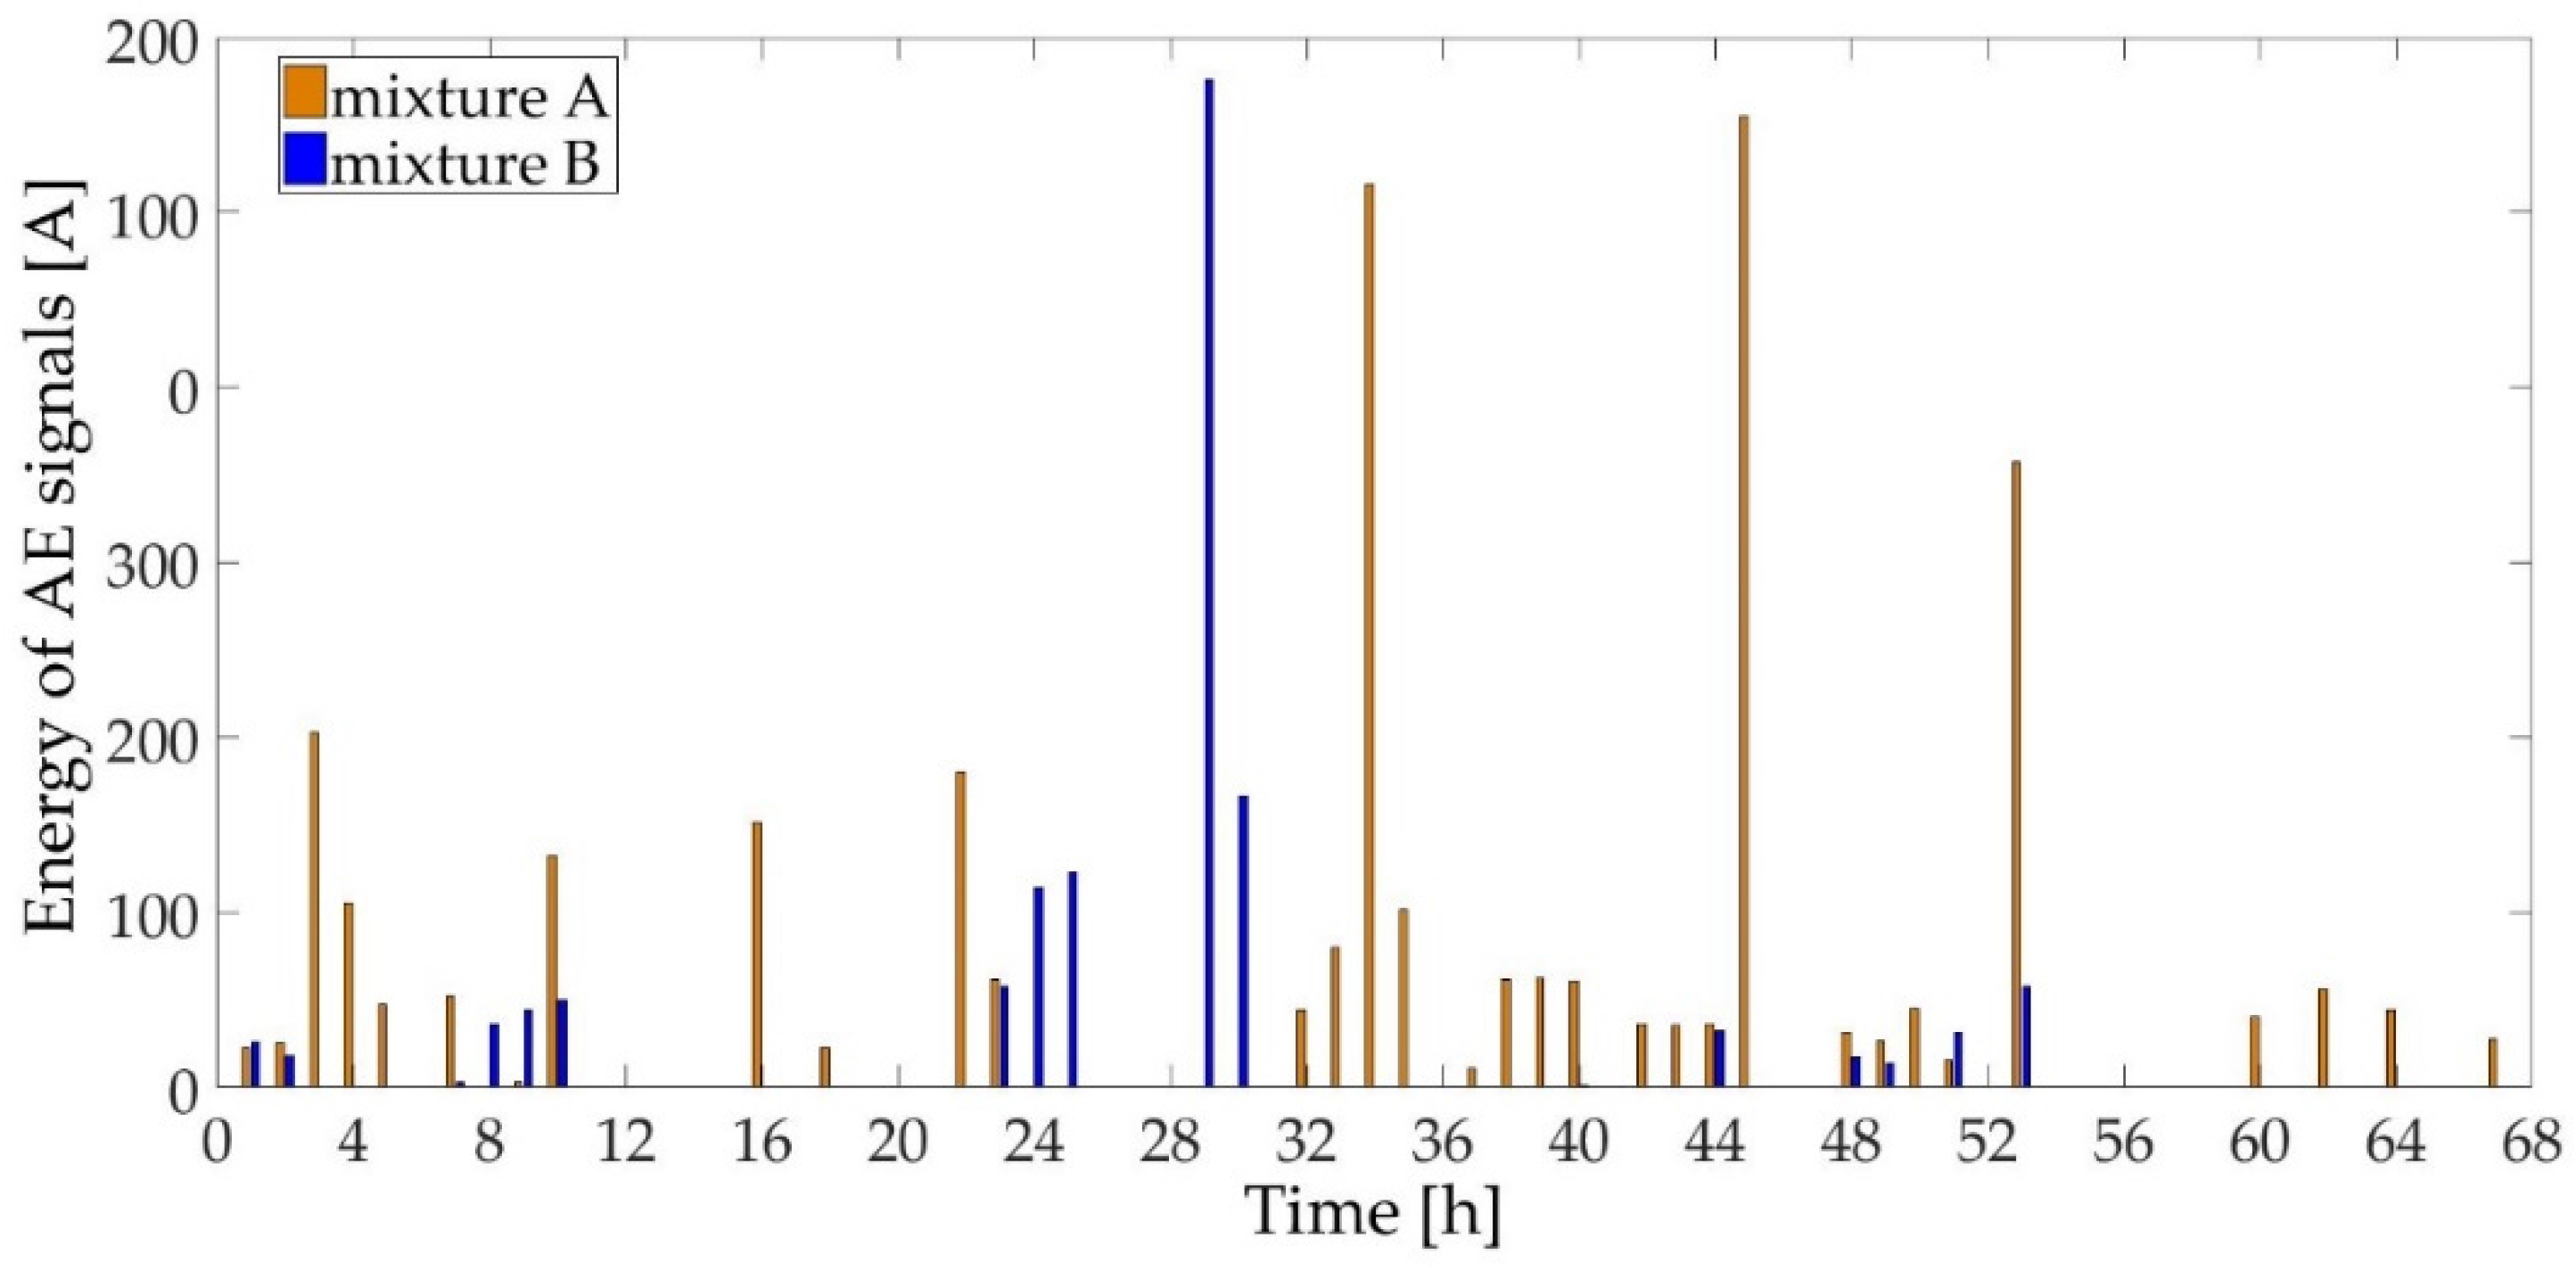
The Figure 8 shows the energy of acoustic emission signals released either by the formation of new hydration products (during setting) or by the formation of bonds, products, and micro-cracks in the already hardened structure. Data for mixture “A” shows that most energy is released after about 3 or 4 h after casting, which may be related to the plastic settling accompanied by re-absorption of water, and an increase of temperature. Another significant amount of energy is released when composite “A” starts to shrink due to the decrease of temperature. After the temperature has been stabilized, the micro-cracks creation is reflected in the increased value of AE energy. In mixture “B”, a significant portion of energy is released at about 29th h of aging as a consequence of the above-mentioned processes. Especially, the transition from swelling to shrinkage causes tension in the material, which may subsequently lead to damage of the already-established bonds. Based on the results presented in Figure 6, Figure 7 and Figure 8 it can be assumed that the most significant structural change in already-rigid composite “B” occurred at about the 24th h of aging. The event which was detected at this time was reflected as a surge in the AE signal (a high amplitude pulse with a short duration and low AE energy was recorded). On the contrary, the event which was recorded at about the 29th h of aging indicated development of the already existing micro-disruption (a low amplitude pulse with a long duration and high AE energy was recorded). Similar differences in structural changes can be found also for composite “A”.
4. Conclusions
The acoustic emission method seems to be a suitable complementary instrument for determining the incidence of new formations and later micro-cracks during the setting and hardening of cement composites. Identifying a particular source of acoustic emissions in cement composites containing aggregate is usually more difficult than in the case of cement pastes, especially during the stage of setting and early hardening [39]. In many cases, there are parallel phenomena which contribute to the overall progress of composites’ internal structure formation. Generally, the higher number of new formations and micro-cracks appear, the more acoustic emission events are generated. It may be stated that the higher the AE signal amplitude values are recorded, or AE signal energy is released, the more significant structural changes occur in the form of new formations or damage in the existing structure [40]. The number and size of micro-cracks in a cement composite significantly affects its final mechanical properties (i.e., strength, elastic modulus, durability, etc.). The application of the AE method to continuous monitoring of cement composites during setting and hardening may be an instrument suitable for timely detection of micro-damage. However, at this stage of technological progress, the application of the AE method may be rather complicated. The sensors cannot be placed on the specimen surface without having them embedded. Therefore, the use of waveguides seems to be better suited for observing the setting of a fresh mixture. Fixing the sensor to the waveguide improves the sensor’s sensitivity so the waves (signals) received become more stable due to the shape and length of the waveguide and are more easily detectable. Based on the characteristics of recorded signals (duration, amplitude, energy) the significance of the recorded AE events may be defined. In the ongoing investigation of materials’ structural changes, the AE measurements will be supplemented with the microscopic analysis, which allows the quantification of these micro-changes.
Acknowledgments
This outcome has been achieved with the financial support of the Czech Science Foundation under project no. 17-14302S “Experimental analysis of the early-age volume changes in cement-based composites” and the project no. LO1408 “AdMaS UP—Advanced Materials, Structures and Technologies”, supported by Ministry of Education, Youth, and Sports under the “National Sustainability Programme I”.
Author Contributions
Libor Topolář and Barbara Kucharczyková conceived, designed, and performed the experiments; Libor Topolář, Barbara Kucharczyková, and Karel Mikulášek analysed the data and wrote the paper; and Luboš Pazdera and Jaroslav Smutný supervised the research and revised the manuscript.
Conflicts of Interest
The authors declare no conflict of interest.
References
- Grosse, C.U.; Ohtsu, M. Acoustic Emission Testing: Basics for Research—Applications in Civil Engineering; Springer: Heidelberg, Germany, 2008. [Google Scholar]
- Grosse, C.U. Advances in Construction Materials 2007; Springer: Heidelberg, Germany, 2007. [Google Scholar]
- Kek, T.; Grum, J. AE Signals as Laser Cutting Quality Indicators. INSIGHT 2004, 51, 124–128. [Google Scholar] [CrossRef]
- Sagar, R.V. An experimental Study on Acoustic Emission Energy and Fracture Energy of Concrete. In Proceedings of the National Seminar & Exhibition on Non-Destructive Evaluation, Bangalore, India, 10–12 December 2009; pp. 225–228. [Google Scholar]
- Neville, A. Properties of Concrete, 5th ed.; Trans-Atlantic Publications: Philadelphia, PA, USA, 2012; ISBN 02-737-5580-3. [Google Scholar]
- Østergaard, L. Early Age Fracture Mechanics and Cracking of Concrete: Experiments and Modelling. Ph.D. Thesis, Department of Structural Engineering and Materials, Technical University of Denmark, Lyngby, Denmark, 2003; pp. 1–299. [Google Scholar]
- Early Age Cracking in Cementitious Systems: Report of RILEM Technical Committee 181-EAS, Early Age Shrinkage Induced Stresses and Cracking in Cementitious Systems; Bentur, A. (Ed.) RILEM: Paris, France, 2003; e-ISBN: 2912143330. [Google Scholar]
- Zhang, J.; Gao, Y.; Han, Y.; Wang, J. Evaluation of Shrinkage induced Cracking in Early Age Concrete: From Ring Test to Circular Column. Int. J. Damage Mech. 2015. [Google Scholar] [CrossRef]
- PCA: The Portland Cement Association. Available online: http://www.cement.org (accessed on 2 February 2017).
- Havlásek, P. Creep and Shrinkage of Concrete subjected to variable Environmental Conditions. Ph.D. Thesis, CTU, Faculty of Civil Engineering, Prague, Czech Republic, 2014. [Google Scholar]
- Topolář, L.; Misák, P.; Kocáb, D.; Matysík, M. Applying Method of Acoustic Emission for Monitoring of Different Concrete Mixture during Setting and Hardening. Solid State Phenom. 2016, 249, 91–95. [Google Scholar] [CrossRef]
- Holt, E.E. Early Age Autogenous Shrinkage of Concrete; Technical Research Centre of Finland: Espoo, Finland, 2001; Volume 446. [Google Scholar]
- Bažant, Z.P.; Wendner, R. RILEM draft recommendation: TC-242-MDC multi-decade creep and shrinkage of concrete. Mater. Struct. 2015, 48, 753–770. [Google Scholar]
- Topolář, L.; Pazdera, L. Acoustic Emission in Protected and Non-Protected Concrete During the First 24 Hours. Appl. Mech. Mater. 2014, 578–579, 1149–1152. [Google Scholar]
- Schleibinger Testing Systems. Available online: http://www.schleibinger.com. (accessed on 2 February 2017).
- Kratochvíl, M.; Kadlec, M.; Terzijski, I.; Zvolánek, L. Autogenous Shrinkage and its Measurement since the Moment of Concrete Casting (Autogenní smršťování a jeho měření od okamžiku uložení betonu). Beton Technol. Konstr. Sanace 2014, 14, 64–67. (In Czech) [Google Scholar]
- Barcelo, L.; Moranville, M.; Clavaud, B. Autogenous shrinkage of concrete: a balance between autogenous swelling and self-desiccation. Cem. Concr. Res. 2005, 35, 177–183. [Google Scholar] [CrossRef]
- Soliman, A.M.; Nehdi, M.L. Effect of drying conditions on autogenous shrinkage in ultra-high performance concrete at early-age. Mater. Struct. 2011, 44, 879–899. [Google Scholar] [CrossRef]
- Mazzoli, A.; Monosi, S.; Plescia, E.S. Evaluation of the early-age-shrinkage of Fiber Reinforced Concrete (FRC) using image analysis methods. Constr. Build. Mater. 2015, 101, 596–601. [Google Scholar] [CrossRef]
- Yatagan, M.S. The Investigation of the Relationship between Drying and Restrained Shrinkage In View of the Development of Micro Cracks. GSTF J. Eng. Technol. (JET) 2014, 3, 1–8. [Google Scholar]
- Čítek, D.; Rydval, M.; Kolísko, J. Volumetric Changes of the UHPC Matrix and its Determination. Appl. Mech. Mater. 2016, 827, 215–218. [Google Scholar] [CrossRef]
- Kong, X.; Zhang, Z.; Lu, Z. Effect of pre-soaked superabsorbent polymer on shrinkage of high-strength concrete. Mater. Struct. 2015, 48, 2741–2758. [Google Scholar] [CrossRef]
- Newman, J.; Choo, B.S. Advanced Concrete Technology: Concrete Properties, 1st ed.; Elsevier: Amsterdam, The Netherland, 2003; ISBN 07-506-5104-0. [Google Scholar]
- Vervuurt, A.; van Mier, J.G.M. Optical microscopy and digital image analysis of bond-cracks in cement-based materials. MRS Online Proc. Libr. (OPL) 1995, 370, 337–342. [Google Scholar] [CrossRef]
- Bisschop, J.; van Mier, J.G.M. How to study drying shrinkage microcracking in cement-based materials using optical and scanning electron microscopy? Cem. Concr. Res. 2002, 32, 279–287. [Google Scholar] [CrossRef]
- Norisham, I.; Omenzetter, P.; Lipscombe, P. Monitoring system for in-situ measurement of creep and shrinkage effects in a prestressed concrete bridge. In Proceedings of the 20th Australasian Conference on the Mechanics of Structures and Materials, Toowoomba, Australia, 2–5 December 2008; pp. 767–771. [Google Scholar]
- Rovnaníková, P.; Žalud, O. Effect of Admixtures and Fine Grain of Aggregate on the Portland Cement Hydration. In Trvanlivost 2015; Faculty of Civil Engineering: Brno, Czech Republic, 2015; pp. 123–133. ISBN 978-80-214-5245-9. (In Czech) [Google Scholar]
- Justnes, H.; Sellevold, E.J.; Van Gemert, A.; Van Gemert, D.; Verboven, F. Influence of Plasticizers and Super-plasticizers on Chemical Shrinkage of Cement. In Proceedings of the Sixth International Conference on Superplasticizers and Other Chemical Admixtures in Concrete, Nice, France, 10–13 October 2000; pp. 601–614. [Google Scholar]
- Kucharczyková, B.; Pospíchal, O.; Misák, P.; Daněk, P.; Vymazal, T. Shrinkage of LWAC—Effect of Aggregate Absorption. In Modern Building Materials, Structures and Techniques, Proceedings of the 10th International Conference on Modern Building Materials, Structures and Techniques, Vilnius, Lithuania, 19–21 May 2010; Vainiunas, P., Zavadskas, E.K., Eds.; Vilnius Gediminas Technical University: Vilnius, Lithuania, 2010. [Google Scholar]
- Chotard, T.; Gimet-Breart, N.; Smith, A.; Fargeot, D.; Bonnet, J.P.; Gault, C. Application of ultrasonic testing to describe the hydration of calcium aluminate cement at the early age. Cem. Concr. Res. 2001, 30, 405–412. [Google Scholar] [CrossRef]
- Černý, M.; Mazal, P.; Filípek, J. Sensing the acoustic signal by waveguides. Acta Univ. Agric. Silvic. Mendel. Brun. 2008, 6, 43–54. (In Czech) [Google Scholar]
- Vymazal, T.; Daněk, P.; Kucharczyková, B.; Misák, P. Continuous Measurement Method of Cement Composite Weight Losses in Early Phase of Setting and Hardening, and Apparatus for Making the Same. CZ 304898 B6 Patent, 7 January 2015. [Google Scholar]
- Kucharczyková, B.; Topolář, L.; Daněk, P.; Kocáb, D.; Misák, P. Comprehensive Testing Techniques for the Measurement of Shrinkage and Structural Changes of Fine-Grained Cement-Based Composites during Aging. Adv. Mater. Sci. Eng. 2017, 3832072. [Google Scholar]
- RILEM TC 181-EAS. Report rep025: Early Age Cracking in Cementitious Systems—Report of RILEM Technical Committee 181-EAS—Early Age Shrinkage Induced Stresses and Cracking in Cementitious Systems; Bentur, A., Ed.; RILEM Publications: Bagneux, France, 2003; p. 350. ISBN 2-912143-33-0. [Google Scholar]
- Marušić, E.; Štirmer, N. Autogenous Shrinkage and Expansion Related to Compressive Strength and Concrete Composition. J. Adv. Concr. Technol. 2016, 14, 489–501. [Google Scholar] [CrossRef]
- Van Den Abeele, K.; Desadeleer, W.; De Schutter, G.; Wevers, M. Active and passive monitoring of the early hydration process in concrete using linear and nonlinear acoustics. Cem. Concr. Res. 2009, 39, 426–432. [Google Scholar] [CrossRef]
- Iwanami, M.; Kamada, T.; Nagataki, S. Application of acoustic emission technique for crack monitoring in RC beams. Cem. Concr. 1997, 51, 192–197. [Google Scholar]
- Li, Z.; Xi, Y. Application of acoustic emission technique to detection of concrete cracking and rebar corrosion. In Proceedings of the International Symposium Non-Destructive Testing in Civil Engineering, Berlin, Germany, 15–17 September 1995; pp. 613–620. [Google Scholar]
- Shiotani, T.; Bisschop, J.; Van Mier, J.G.M. Temporal and spatial development of drying shrinkage cracking in cement-based materials. Eng. Fract. Mech. 2003, 70, 1509–1525. [Google Scholar] [CrossRef]
- Zhou, H.; Liu, Y.; Lu, Y.; Dong, P.; Guo, B.; Ding, W.; Xing, F.; Liu, T.; Dong, B. In-situ crack propagation monitoring in mortar embedded with cement-based piezoelectric ceramic sensors. Constr. Build. Mater. 2016, 126, 361–368. [Google Scholar] [CrossRef]
Figure 1.
Parameters reflected in an AE waveform.
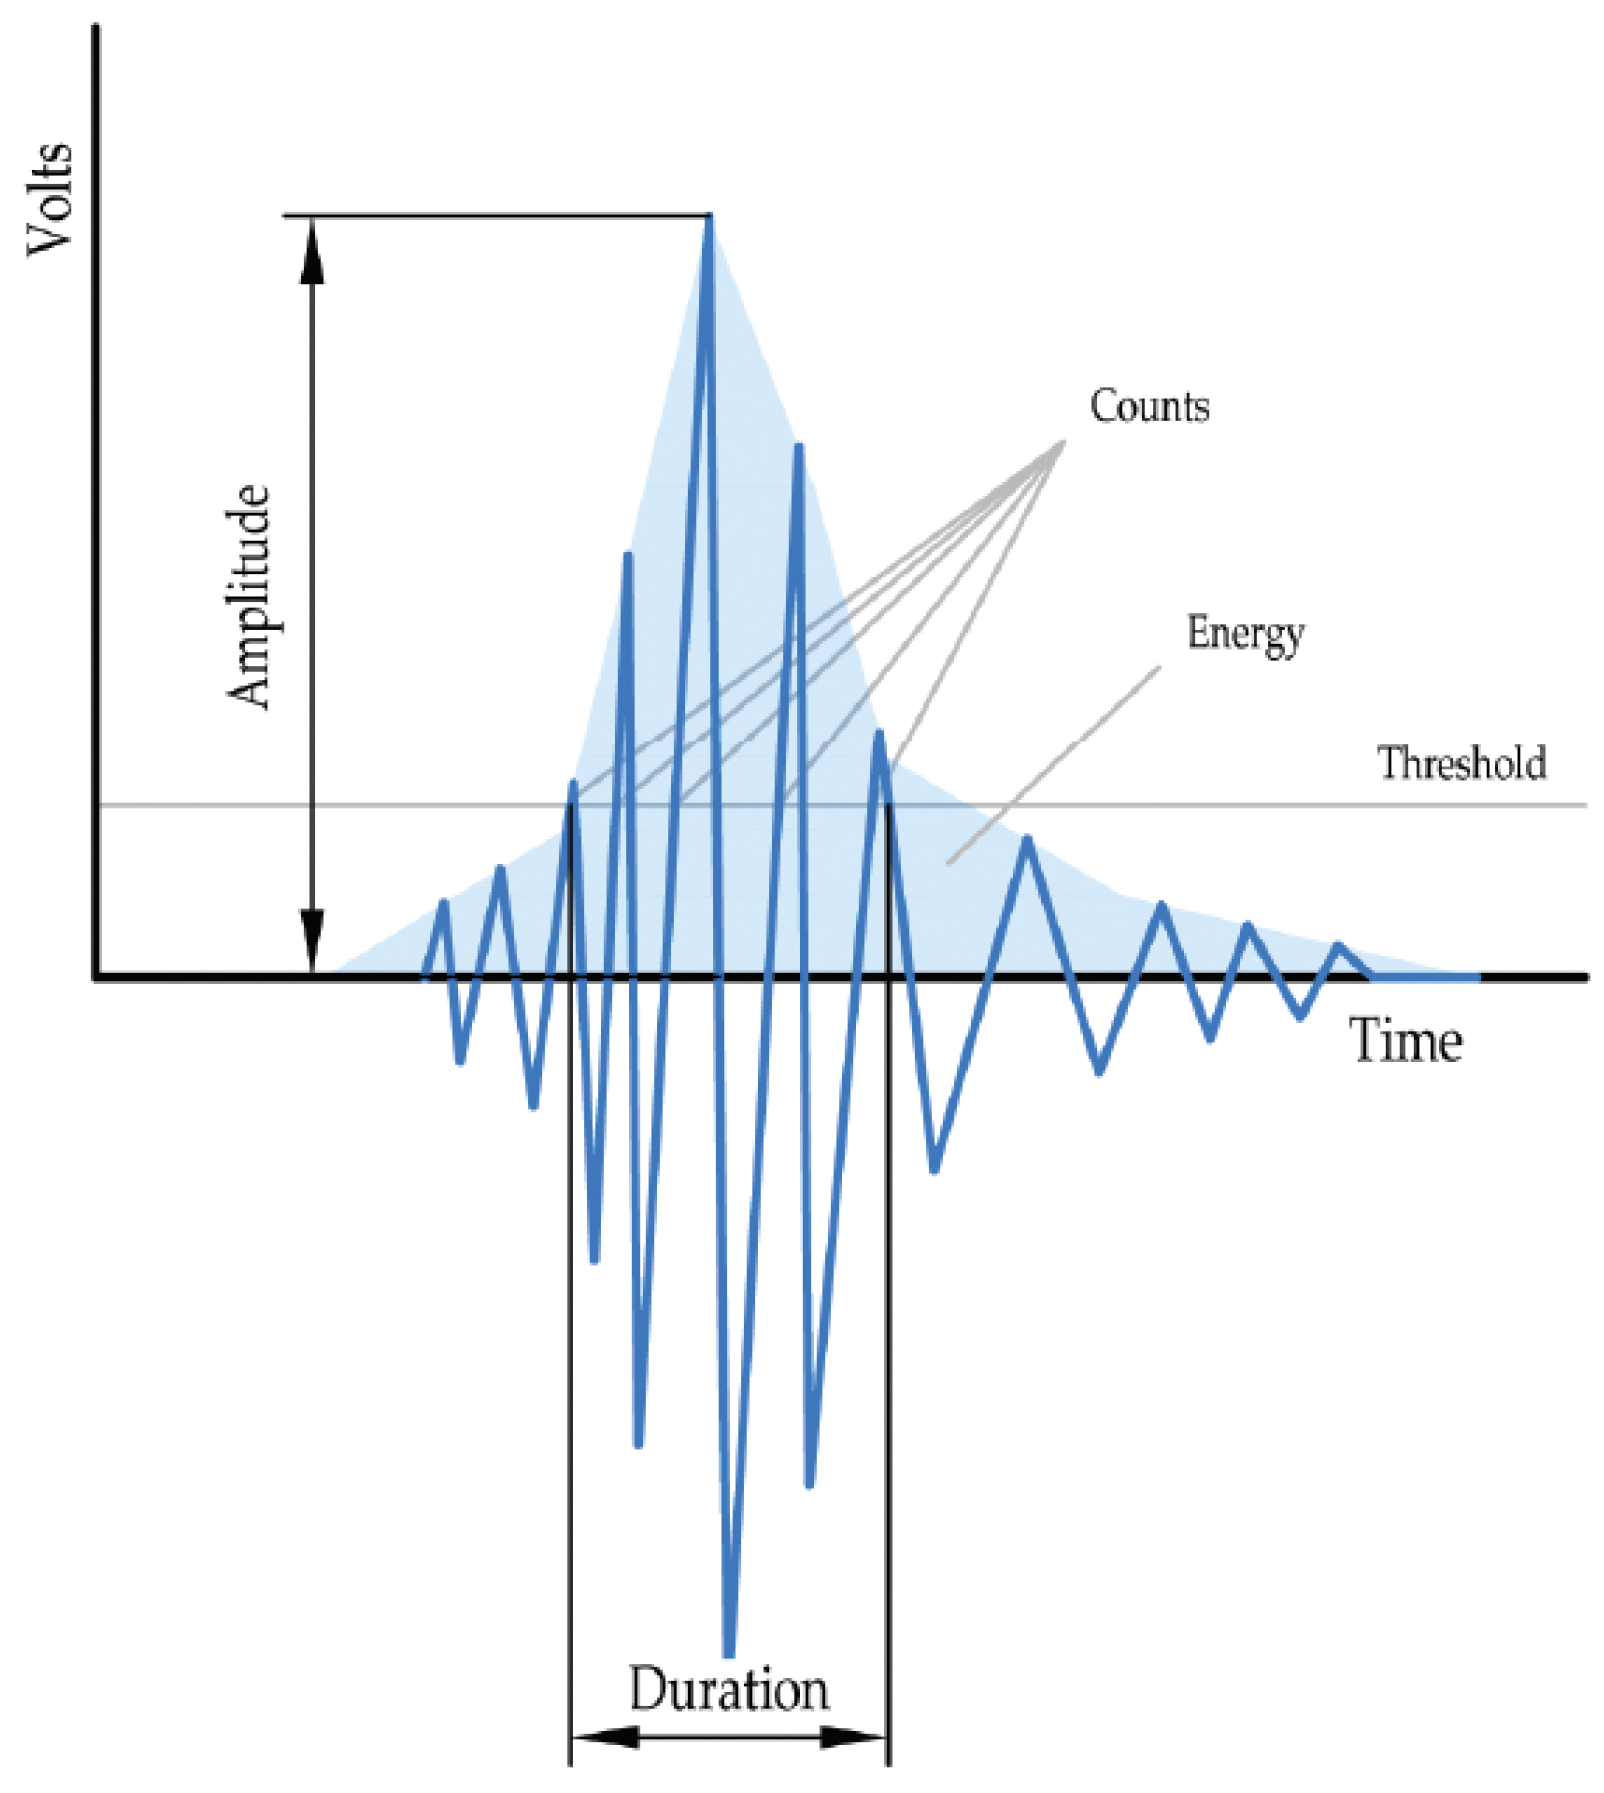
Figure 2.
Measurement arrangement: (a) overall view; (b) acoustic emission measurement; (c) detailed view of waveguide; and (d) specimens after demoulding.
Figure 2.
Measurement arrangement: (a) overall view; (b) acoustic emission measurement; (c) detailed view of waveguide; and (d) specimens after demoulding.

Figure 3.
Time-dependent differences between temperatures measured inside the specimens and the ambient temperatures (during the first 68 h of specimen aging).
Figure 3.
Time-dependent differences between temperatures measured inside the specimens and the ambient temperatures (during the first 68 h of specimen aging).

Figure 4.
Relative deformations measured during the first 68 h of specimen aging.
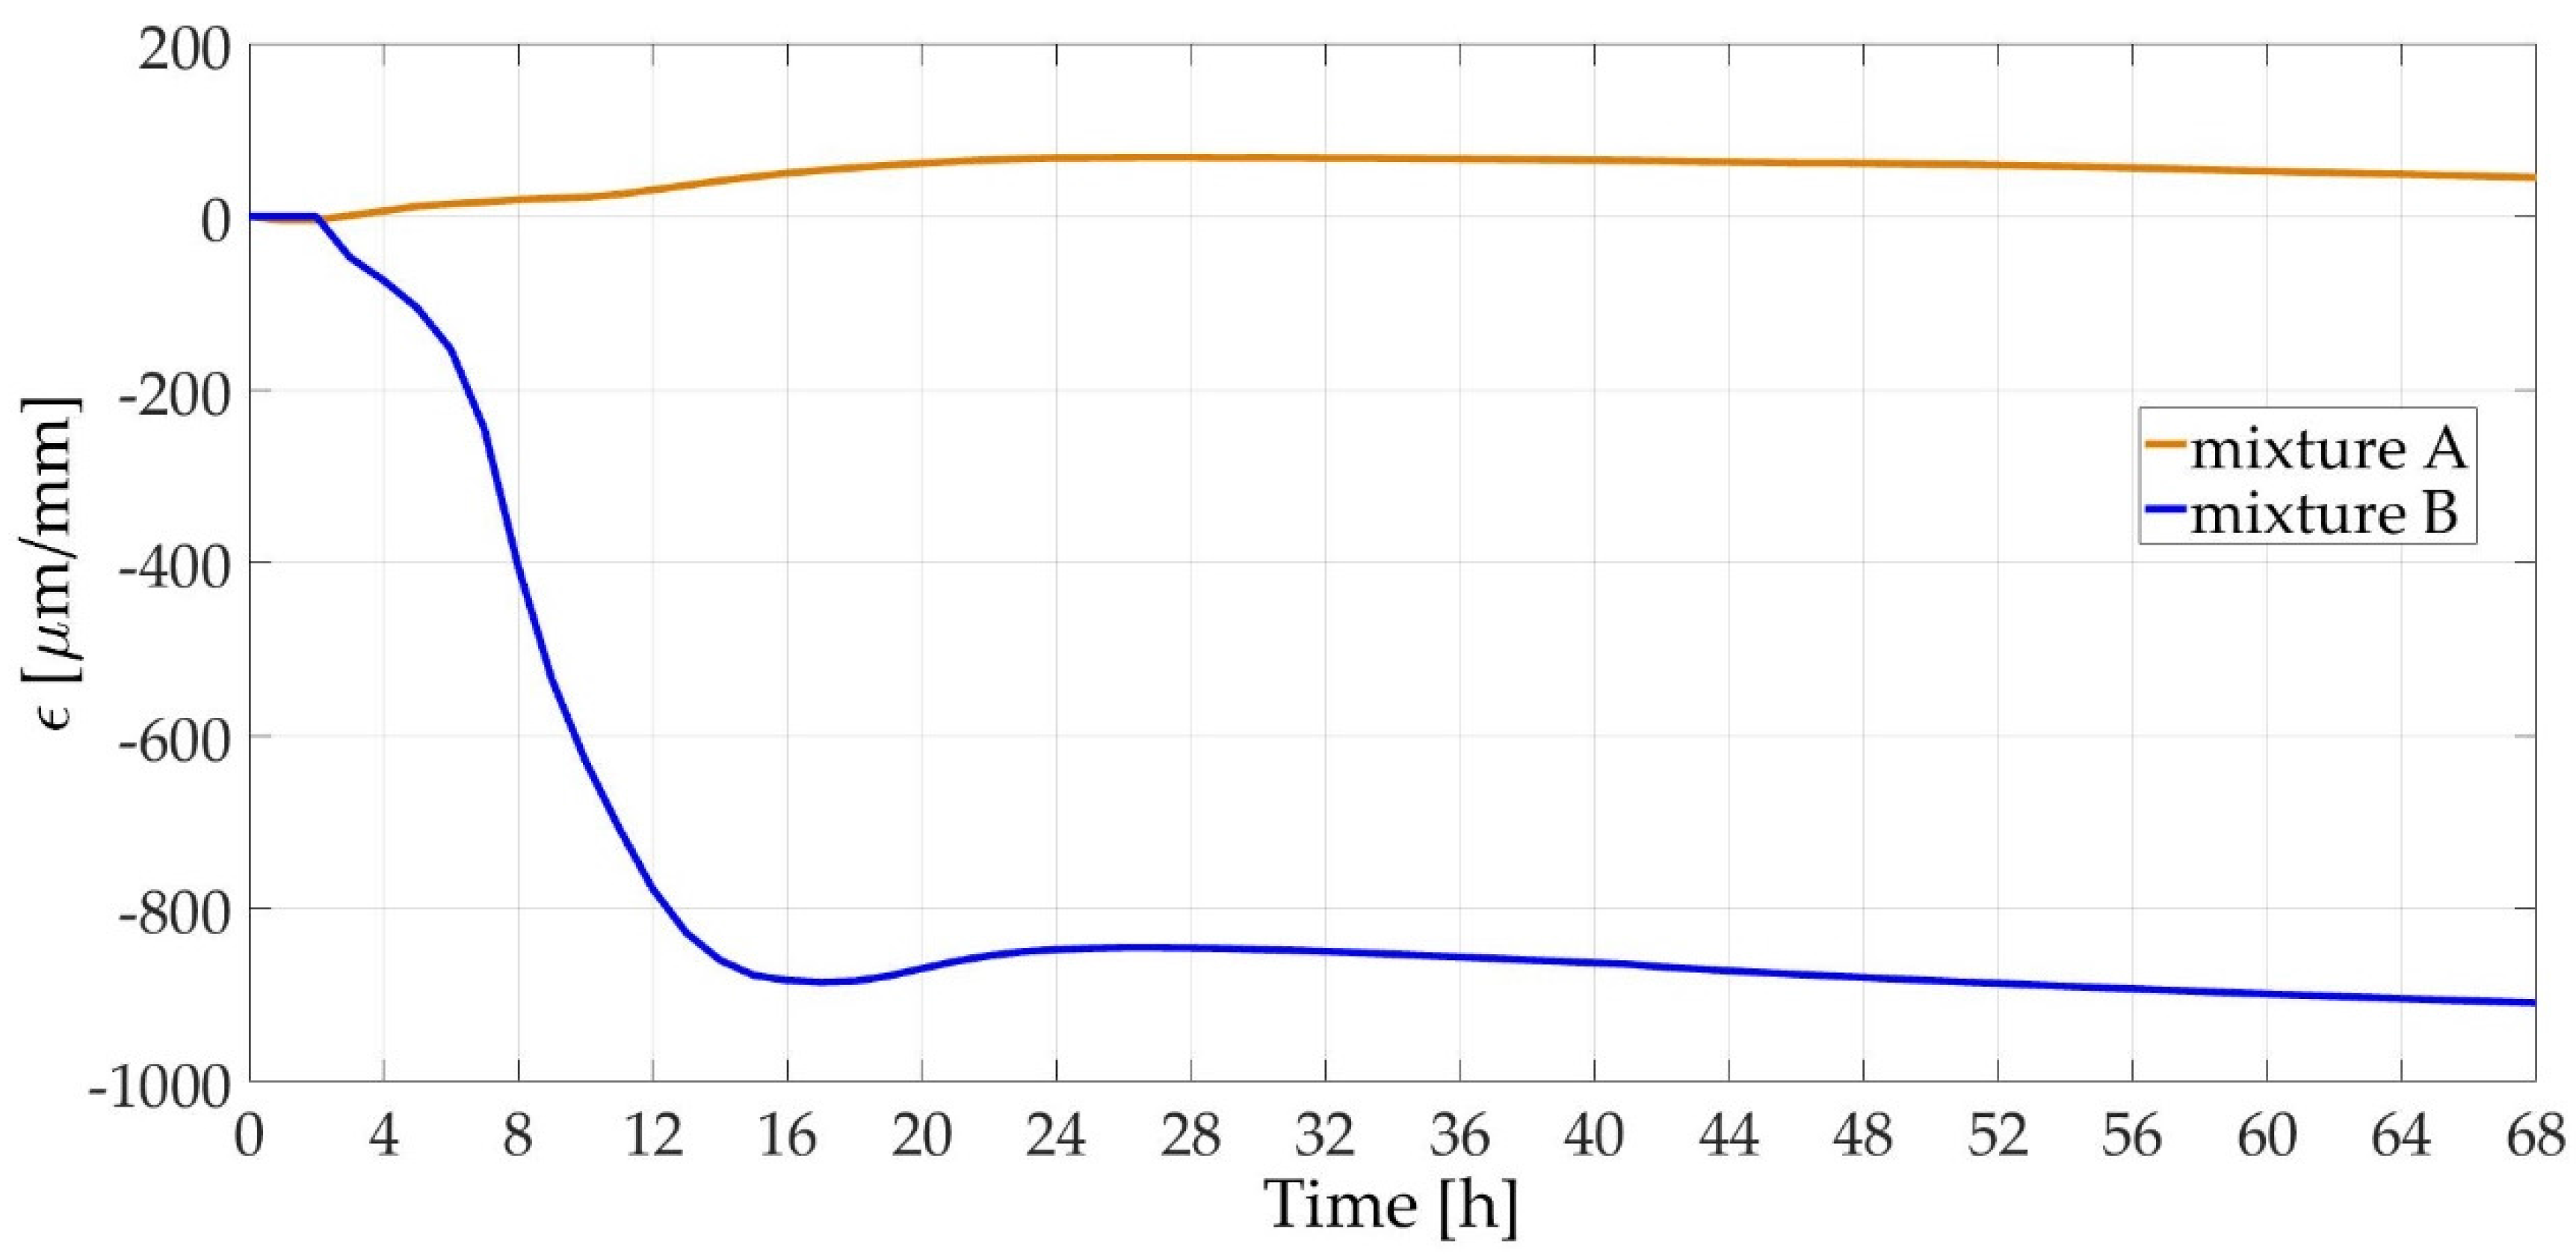
Figure 5.
Number of AE events registered during the first 68 h of specimen aging.

Figure 6.
Duration of AE signals recorded during the first 68 h of specimen aging.
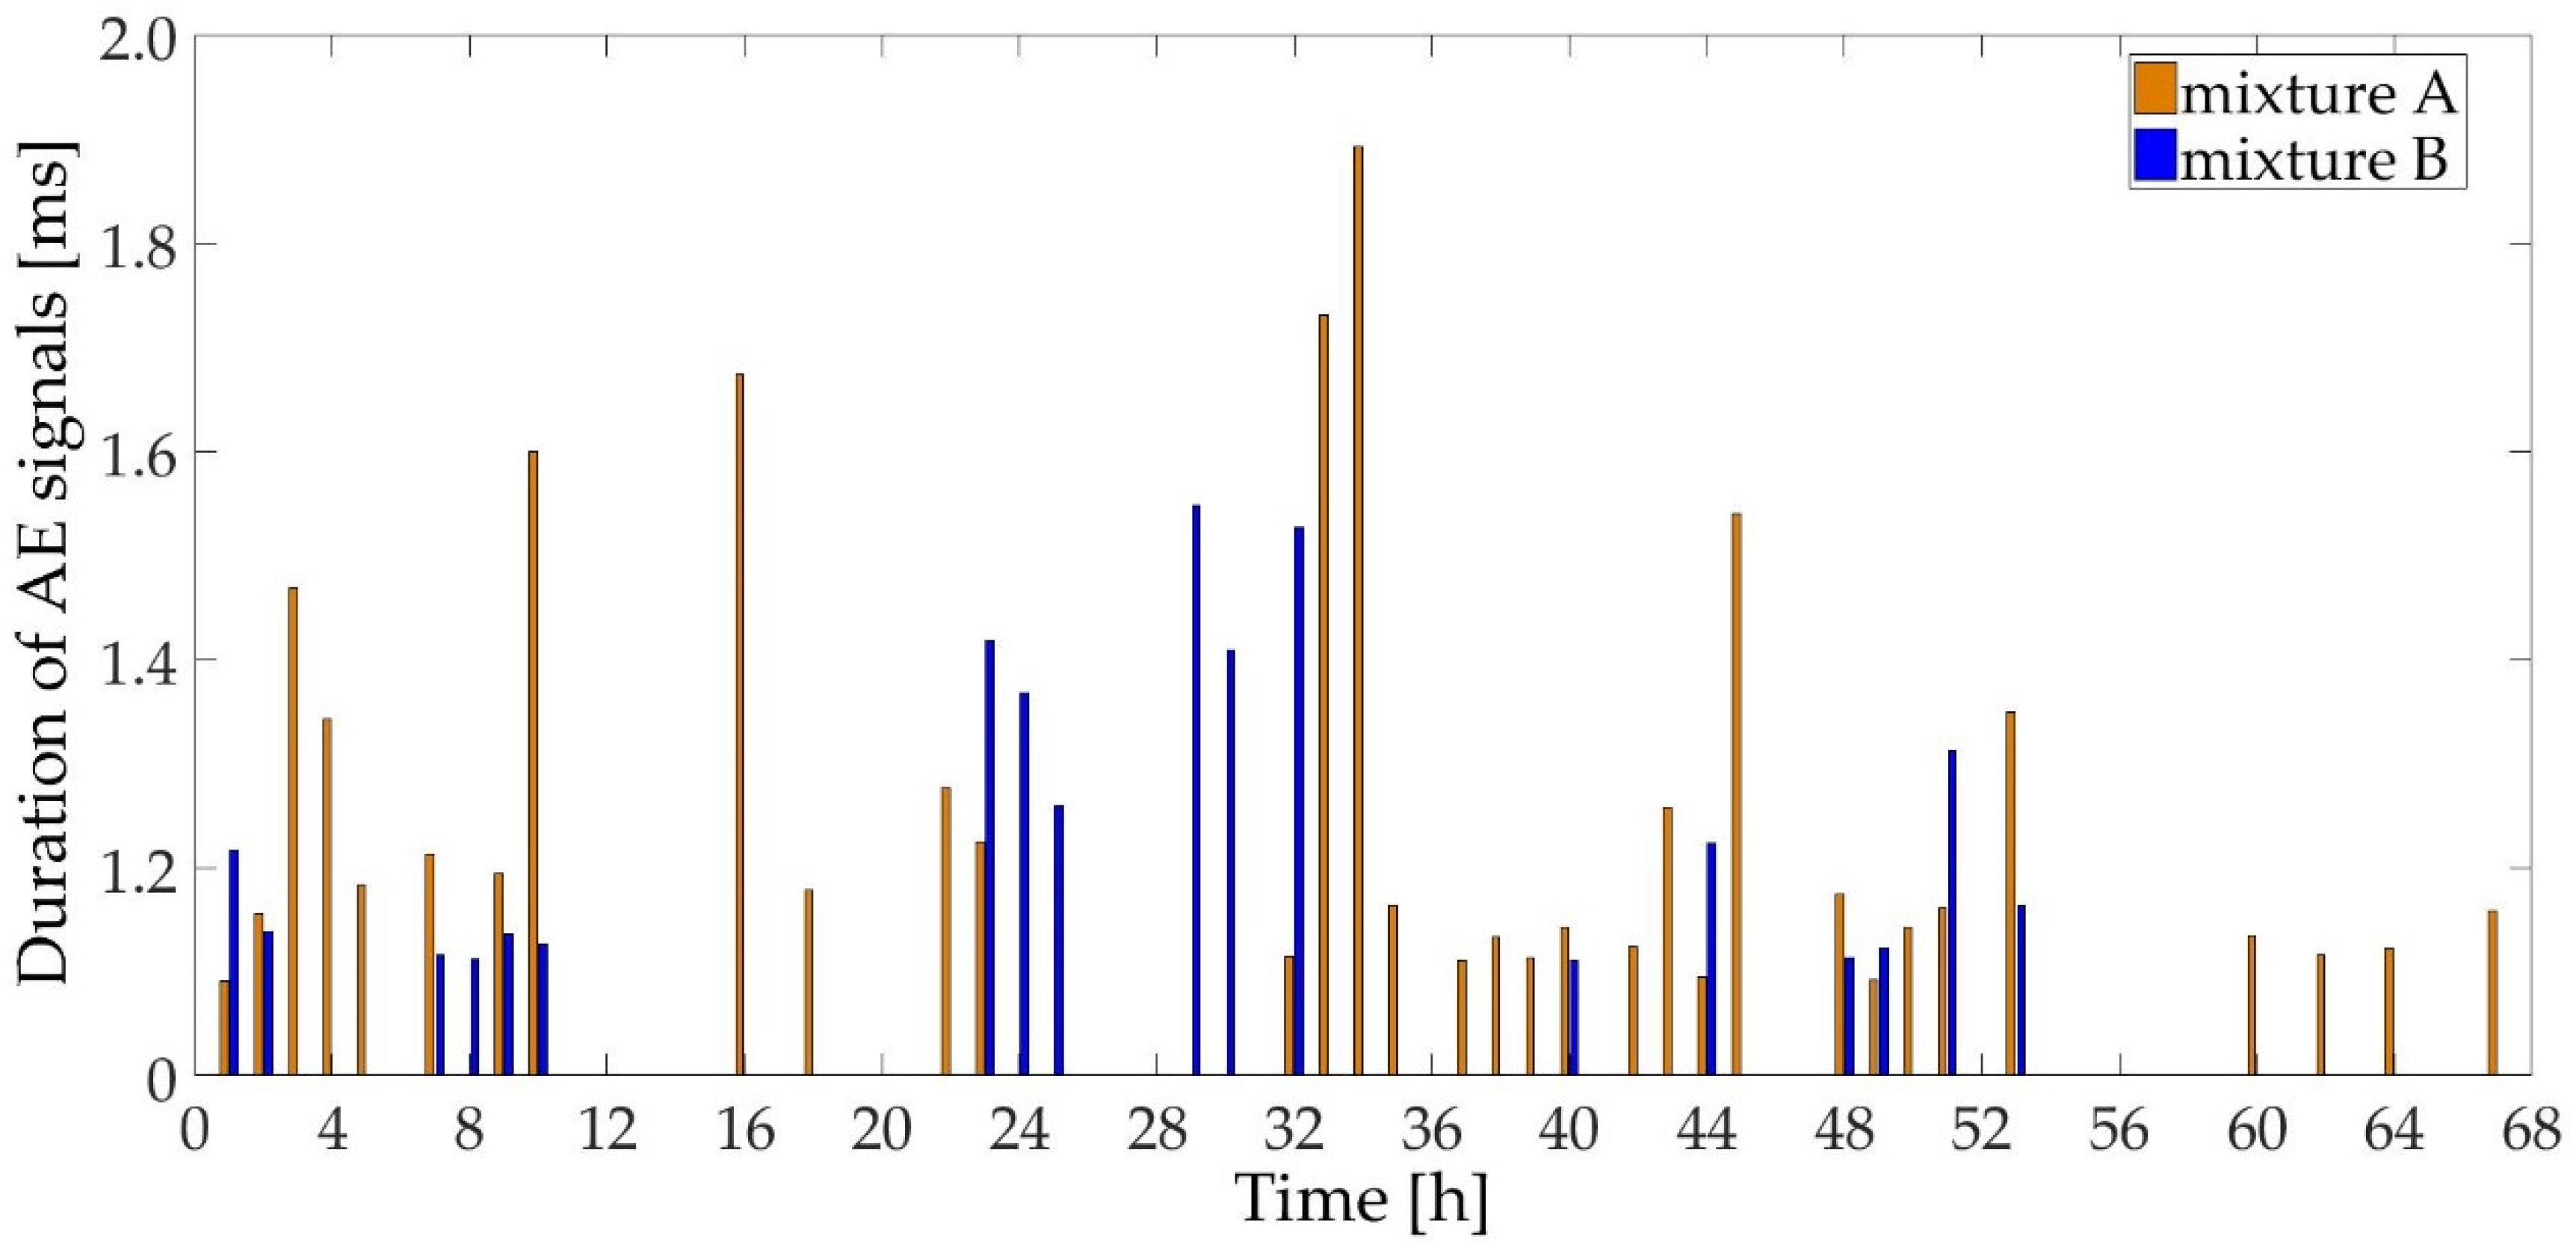
Figure 7.
Amplitude of AE signals measured during the first 68 h of specimen aging.

Figure 8.
Energy of AE signals measured during the first 68 h of specimen aging.

Table 1.
Composition and properties of fresh composites.
| Components | Units | Marked | |
|---|---|---|---|
| Mixture A | Mixture B | ||
| Sand (CEN 196-1) | pcs | 3 | 3 |
| Cement I 42.5R | pcs | 1 | 1 |
| w/c ratio | - | 0.46 | 0.35 |
| Super-plasticizer SVC 4035 | % by cement mass | - | 1.0 |
| Mixing speed | rpm | 30 | 40 |
| Workability | mm | 115 | 135 |
| Bulk density | kg/m3 | 2240 | 2280 |
© 2017 by the authors. Licensee MDPI, Basel, Switzerland. This article is an open access article distributed under the terms and conditions of the Creative Commons Attribution (CC BY) license (http://creativecommons.org/licenses/by/4.0/).
Share and Cite
MDPI and ACS Style
Topolář, L.; Pazdera, L.; Kucharczyková, B.; Smutný, J.; Mikulášek, K. Using Acoustic Emission Methods to Monitor Cement Composites during Setting and Hardening. Appl. Sci. 2017, 7, 451. https://doi.org/10.3390/app7050451
AMA Style
Topolář L, Pazdera L, Kucharczyková B, Smutný J, Mikulášek K. Using Acoustic Emission Methods to Monitor Cement Composites during Setting and Hardening. Applied Sciences. 2017; 7(5):451. https://doi.org/10.3390/app7050451
Chicago/Turabian StyleTopolář, Libor, Luboš Pazdera, Barbara Kucharczyková, Jaroslav Smutný, and Karel Mikulášek. 2017. "Using Acoustic Emission Methods to Monitor Cement Composites during Setting and Hardening" Applied Sciences 7, no. 5: 451. https://doi.org/10.3390/app7050451
Note that from the first issue of 2016, this journal uses article numbers instead of page numbers. See further details here.