
Single Mode Air-Clad Single Crystal Sapphire Optical Fiber


1
Department of Materials Science and Engineering, Virginia Tech, Blacksburg, VA 24061, USA
2
Center for Photonics Technology, Department of Electrical and Computer Engineering, Virginia Tech, Blacksburg, VA 24061, USA
*
Author to whom correspondence should be addressed.
Appl. Sci. 2017, 7(5), 473; https://doi.org/10.3390/app7050473
Submission received: 16 March 2017
/
Revised: 14 April 2017
/
Accepted: 30 April 2017
/
Published: 3 May 2017
(This article belongs to the Special Issue Distributed Optical Fiber Sensors)
Abstract
:The observation of single mode propagation in an air-clad single crystal sapphire optical fiber at wavelengths at and above 783 nm is presented for the first time. A high-temperature wet acid etching method was used to reduce the diameter of a 10 cm length of commercially-sourced sapphire fiber from 125 micrometers to 6.5 micrometers, and far-field imaging provided modal information at intervals as the fiber diameter decreased. Modal volume was shown to decrease with decreasing diameter, and single mode behavior was observed at the minimum diameter achieved. While weakly-guiding approximations are generally inaccurate for low modal volume optical fiber with high core-cladding refractive index disparity, consistency between these approximations and experimental results was observed when the effective numerical aperture was measured and substituted for the theoretical numerical aperture in weakly-guiding approximation calculations. With the demonstration of very low modal volume in sapphire at fiber diameters much larger than anticipated by legacy calculations, the resolution of sapphire fiber distributed sensors may be increased and other sensing schemes requiring very low modal volume, such as fiber Bragg gratings, may be realized in extreme environment applications.
1. Introduction
Single-crystal sapphire optical fiber is frequently used in high temperature and corrosive environments for sensors monitoring properties such as temperature [1,2,3] or gas concentration [4]. While the resilience of sapphire in extreme environments is rivaled by very few optical materials, its large refractive index relative to air results in high modal volume at typical sensing wavelengths. This contributes to higher loss, increased modal dispersion, decreased distributed sensing resolution, and decreased detection sensitivity than can be achieved by silica-based counterparts [5,6] or preclude the application of some sensing schemes altogether [7].
A cladding is employed in most optical fiber applications to regulate the index disparity between the core and its surroundings to reduce modal volume. To date, however, successful claddings have not been demonstrated for sapphire that will survive the extreme conditions in which it is typically utilized. At temperatures approaching or exceeding 2000 °C, many candidate claddings will delaminate due to thermal expansion mismatch or diffuse into the core, altering optical properties (not to mention those materials which would form an excellent sapphire cladding from an optics perspective but cannot survive hot and corrosive environments).
Ordered-array photonic crystal fibers (PCFs) have been demonstrated using sapphire [8,9] with reduced modal volume but still rely on commercially-available sapphire fiber, which are 50–70 µm in diameter at the smallest. Engineered cross-sectional geometries for the reduction of modal volume have also been theoretically proven recently [10,11], but practical fabrication methods for these designs have not yet been developed. Therefore, in lieu of a cladding or fabrication of PCFs and engineered fibers, one remaining method for producing sapphire optical fiber that will support only low order modes is to drastically reduce its diameter well below the minimum diameter commercially available.
We previously demonstrated a wet-acid etching method which was successfully applied to reduce the diameter of a sapphire optical fiber to less than 800 nm while maintaining a smooth, consistent surface [12]. This method, which summarily prescribes the immersion of sapphire fiber into a mixture of sulfuric and phosphoric acids at temperatures exceeding 340 °C, was employed again in the work presented below to produce an air-clad sapphire optical fiber demonstrating support of only the fundamental LP01 mode at wavelengths of 783 nm and greater.
2. Materials and Methods
2.1. Sample Production and Etching
Approximately 15 cm of single crystal sapphire optical fiber (optical c-axis) with an original diameter of 125 µm was cut from a 100 cm segment from Micromaterials, Inc. (Tampa, FL, USA). Early experiments found signal-scattering deposits comprised of aluminum sulfate and aluminum phosphate would form and adhere strongly to the surface of an immersed sapphire fiber during etching, concentrated near the air-acid interface. To prevent adherence of these deposits at this region, a protective borosilicate glass tube with an internal diameter of 140 µm and length of around 5 cm was collapsed over one end of the sapphire fiber using an oxyhydrogen torch, leaving 10 cm of sapphire fiber to be etched. Less than 1 cm of the borosilicate tube was collapsed to reduce any “cladding” effect this region may have; with this seal formed, the acid solution would be prevented from wicking up along the fiber and producing deposits. Accordingly, the shielded 5 cm-length of the sapphire fiber retained its 125 µm diameter throughout, while etching reduced the diameter of the remaining 10 cm exposed length.
A ferrule connector/physical contact (FC/PC) connector was mounted, secured and polished on one end of the sapphire fiber which would remain outside the etching solution; attaching the connector before etching ensured that measurements could be taken between etching sessions without inadvertently altering input conditions.
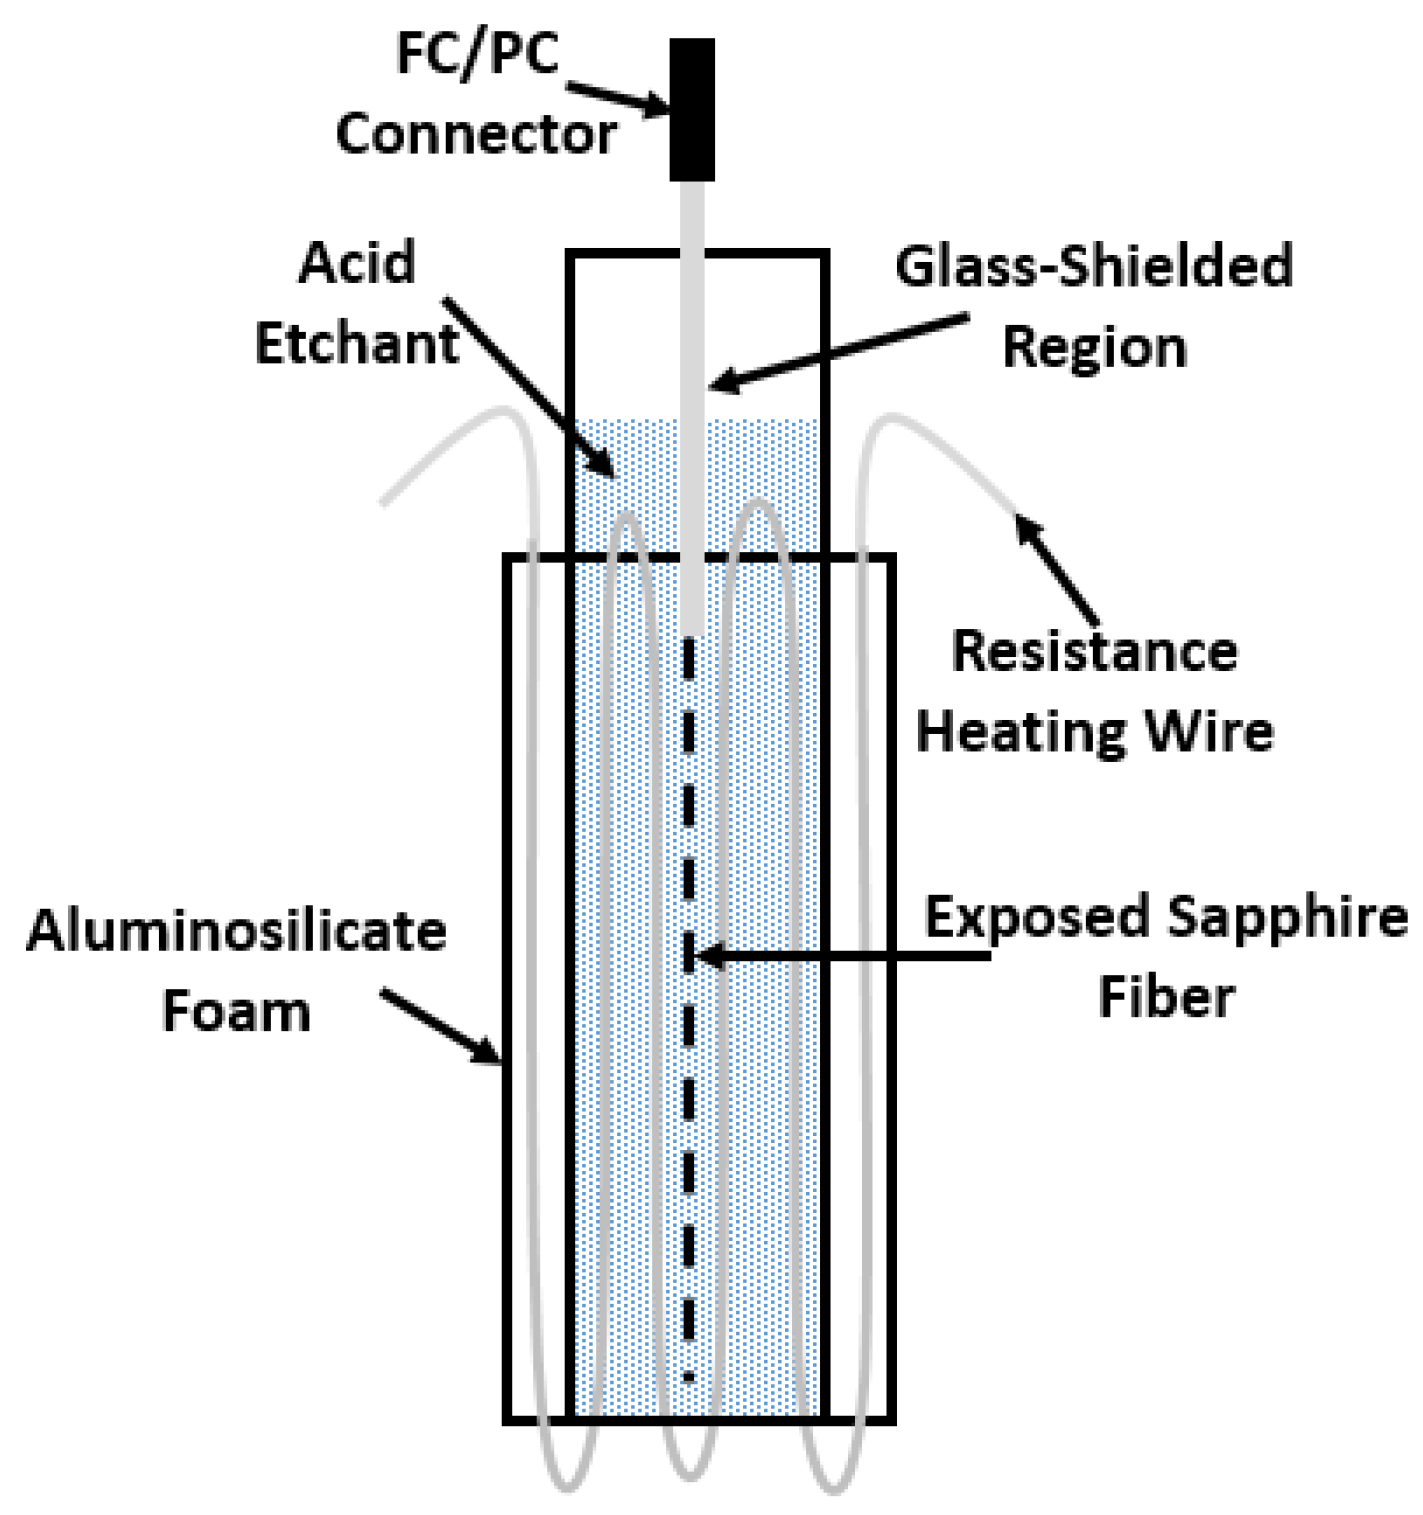
The etching solution was a 3:1 molar ratio mixture of sulfuric acid (98%, Sigma Aldrich, St. Louis, MO, USA) and phosphoric acid (85%, VWR). This solution was contained within a fused quartz tube with an inner diameter of 1.25′′. One end of this 8′′-long tube was collapsed using an oxyhydrogen torch, then placed within custom-made porous aluminosilicate rings to improve thermal distribution during heating. Holes were drilled longitudinally through these rings and resistance heating wire (80% nickel, 20% chromium, 20 gauge, OMEGA Engineering, Norwalk, CT, USA) was wound throughout. This resistance heating wire was connected to a variable transformer (Variac, Cleveland, UK, USA) so that the temperature could be controlled by adjusting to the proper voltage setting. These heating rings were finally enclosed in a polycrystalline alumina tube (Coorstek, Golden, CO, USA) and padded with alumina fiber insulation. Figure 1 illustrates the etching apparatus in simplified form.
To initiate etching, a thermocouple probe (Omega) was inserted into a small sealed fused quartz tube upon which the sapphire components were previously mounted, and this assembly was immersed in the acid solution at room temperature. The opening of the vessel was enclosed with Teflon tape (with a small outlet for pressure relief), and the voltage was increased to a value optimized to quickly heat the solution without causing rapid boiling of the sulfuric acid component. Etching would typically be allowed to occur for 8–10 h at a time before the sapphire sample was removed for analysis and the etching solution was refreshed, during which the temperature was recorded every 15 s using a Digisense datalogging digital thermocouple reader (Davis Instruments, Vernon Hills, IL, USA).
2.2. Far-Field Modal Analysis
After etching, the diameter of the sapphire fiber was measured using an Olympus BX51 (Waltham, MA, USA) optical microscope and StreamMotion software. After polishing the tip of the fiber using 100 nm diamond lapping film (Ultra Tec, Santa Anna, CA, USA) to remove facets caused by preferential etching of the r-plane, the far-field patterns of the reduced-diameter sapphire fiber were captured between etching sessions to collect data at many different diameters. Three 5 mW laser wavelengths were used: 532 nm, 783 nm, and 983 nm (Thorlabs, Newton, NJ, USA) in order to expand the breadth of data collected per measured diameter. The lasers were linearly polarized with a polarization extinction ratio of 4 dB and were mounted at the same angle of rotation for all experiments. These lasers were focused into the fiber using a 40× objective lens, whose numerical aperture (NA) is larger than that of sapphire, ensuring the modal state would be “overfilled” [13]. A BC-106VIS charge coupled device (CCD) beam profiler (Thorlabs) was used to capture the far-field profiles, which were then catalogued using Thorlabs’ Beam 6.0 software. Most components were mounted on 2-or 3-axis stages to aid alignment. A sample under evaluation using the described setup is visible in Figure 2.
2.3. Effective Numerical Aperture Measurement
A common numerical aperture measurement method for single-mode fiber was employed to determine the effective NA of the sapphire fiber at its smallest diameter [14]. The beam width of the fundamental mode was measured (4σ cutoff intensity) at a nominal distance from the beam profiler (within 2 mm of the detector window) and then measured again when moved 1 mm away from the profiler, illustrated by Figure 3. The resulting calculation of divergence angle provided an approximate measurement of the effective numerical aperture.
3. Results
3.1. Etching Behavior
The etching method employed has been described in greater detail previously [12]. In this work, the temperature profile of a typical etching session appeared as illustrated by Figure 4 below, where the solution reached its peak temperature of just over 340 °C over the course of about 2 h, after which etching was allowed to continue at a steady temperature for 8–10 h. As the acid solution was heated, several transformations took place due to heat and dehydration into diacid and polyacid forms, the nuances and impacts of which have been discussed elsewhere [15,16,17,18].
The etch rate was catalogued as a function of temperature, with the etch rate determined with regard to the rate of reduction in fiber diameter, that is, 2× the linear surface etch rate. As may be anticipated, a linear dependence of etch rate upon temperature was observed, with very little etching occurring at and below 270 °C and a maximum diameter reduction rate of around 5.7 µm/h observed at the maximum temperature of 343 °C (Figure 5).
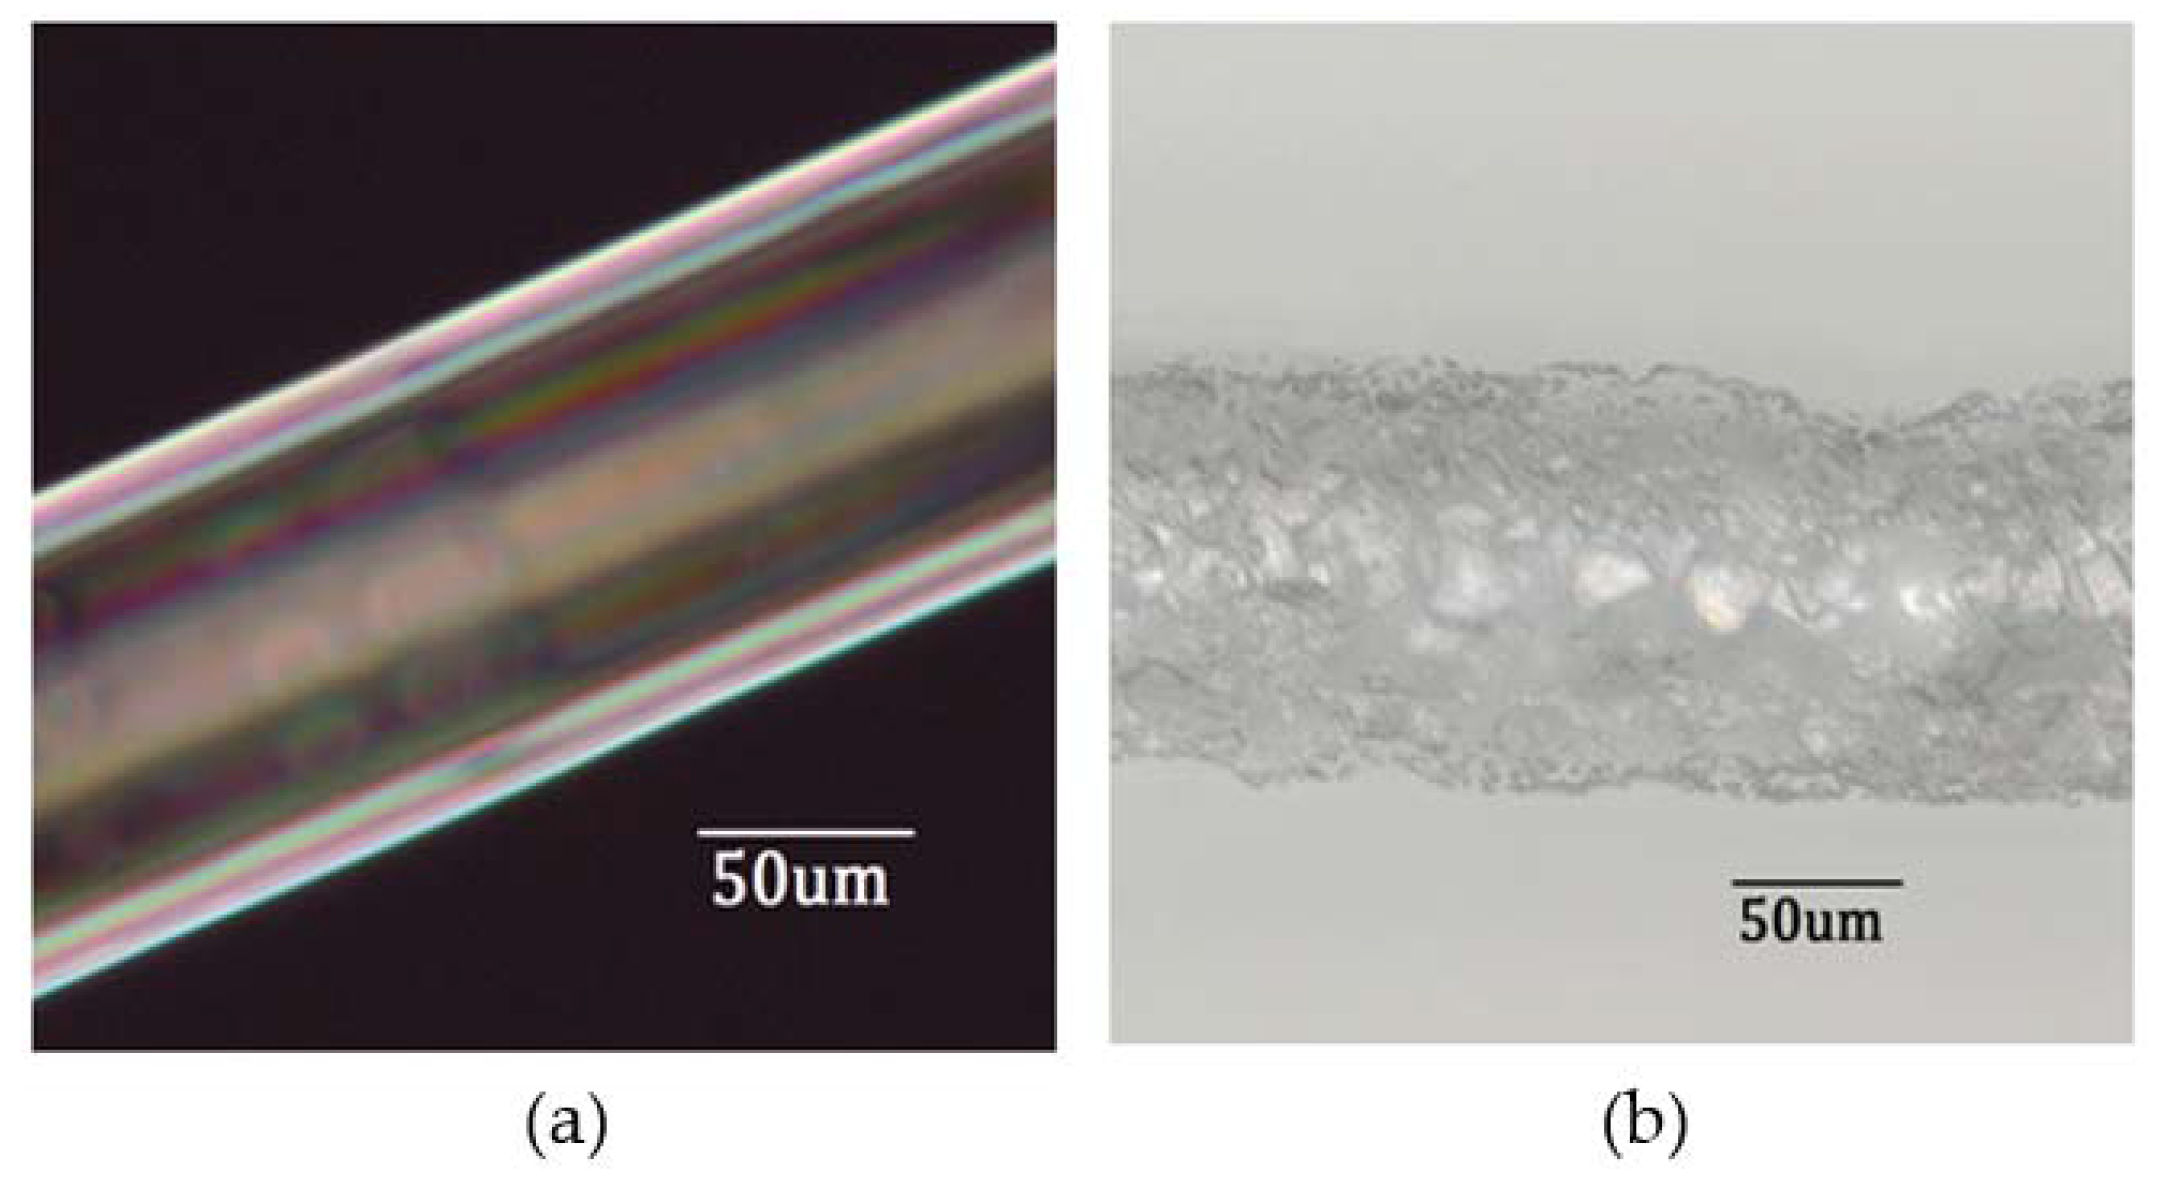
Provided the sapphire fiber was fully immersed in the etching solution, the surface of the fiber would be etched cleanly and consistently using the described method (Figure 6a). At regions where the fiber exited the solution, deposits would form which were difficult to remove and resulted in an optically unfavorable surface (Figure 6b). This observation provided the impetus for the addition of the aforementioned borosilicate shielding tube, which prevented adherence of these deposits on the sapphire fiber surface at this air-acid interface.
3.2. Far-Field Analysis
The far-field speckle patterns of the sapphire fiber were captured at diameter intervals from 125 µm down to a final diameter of 6.5 µm using laser wavelengths of 532 nm, 783 nm, and 983 nm, as seen in Figure 7. At the initial sapphire fiber diameter of 125 µm, where nearly a million modes are theoretically supported at lower wavelengths, the speckle patterns familiar to highly multimodal projections were observed. As the diameter decreased, the number of speckles decreased and individual speckles broadened in diameter, a result of the reduction in supported modes causing the interference peaks and valleys to which the speckles correspond.
Once the sapphire fiber diameter was reduced to 6.5 µm, low order LP11 and LP01 modes became visible at the tested wavelengths. As may be anticipated, the smaller 532 nm wavelength exhibited the higher-order LP11 mode while only the fundamental mode was observed at wavelengths of 783 nm and 983 nm.
Alterations were made to excitation conditions to assess the retention of low order mode dominance. First, the injection angle of the laser into the fiber was altered by 15°; if the observed far-field patterns were truly stable, it could be expected that the patterns would not change significantly. This was shown to be the case, as seen at the bottom of Figure 7; the LP11 mode was once again visible at a wavelength of 532 nm, and the fundamental LP01 mode was observed at 783 nm. Only scattered light could be captured at the 983 nm wavelength, perhaps due to lack of collimation as the light entered outside the acceptance angle of the fiber, or simply due to alignment difficulties for this particular measurement.
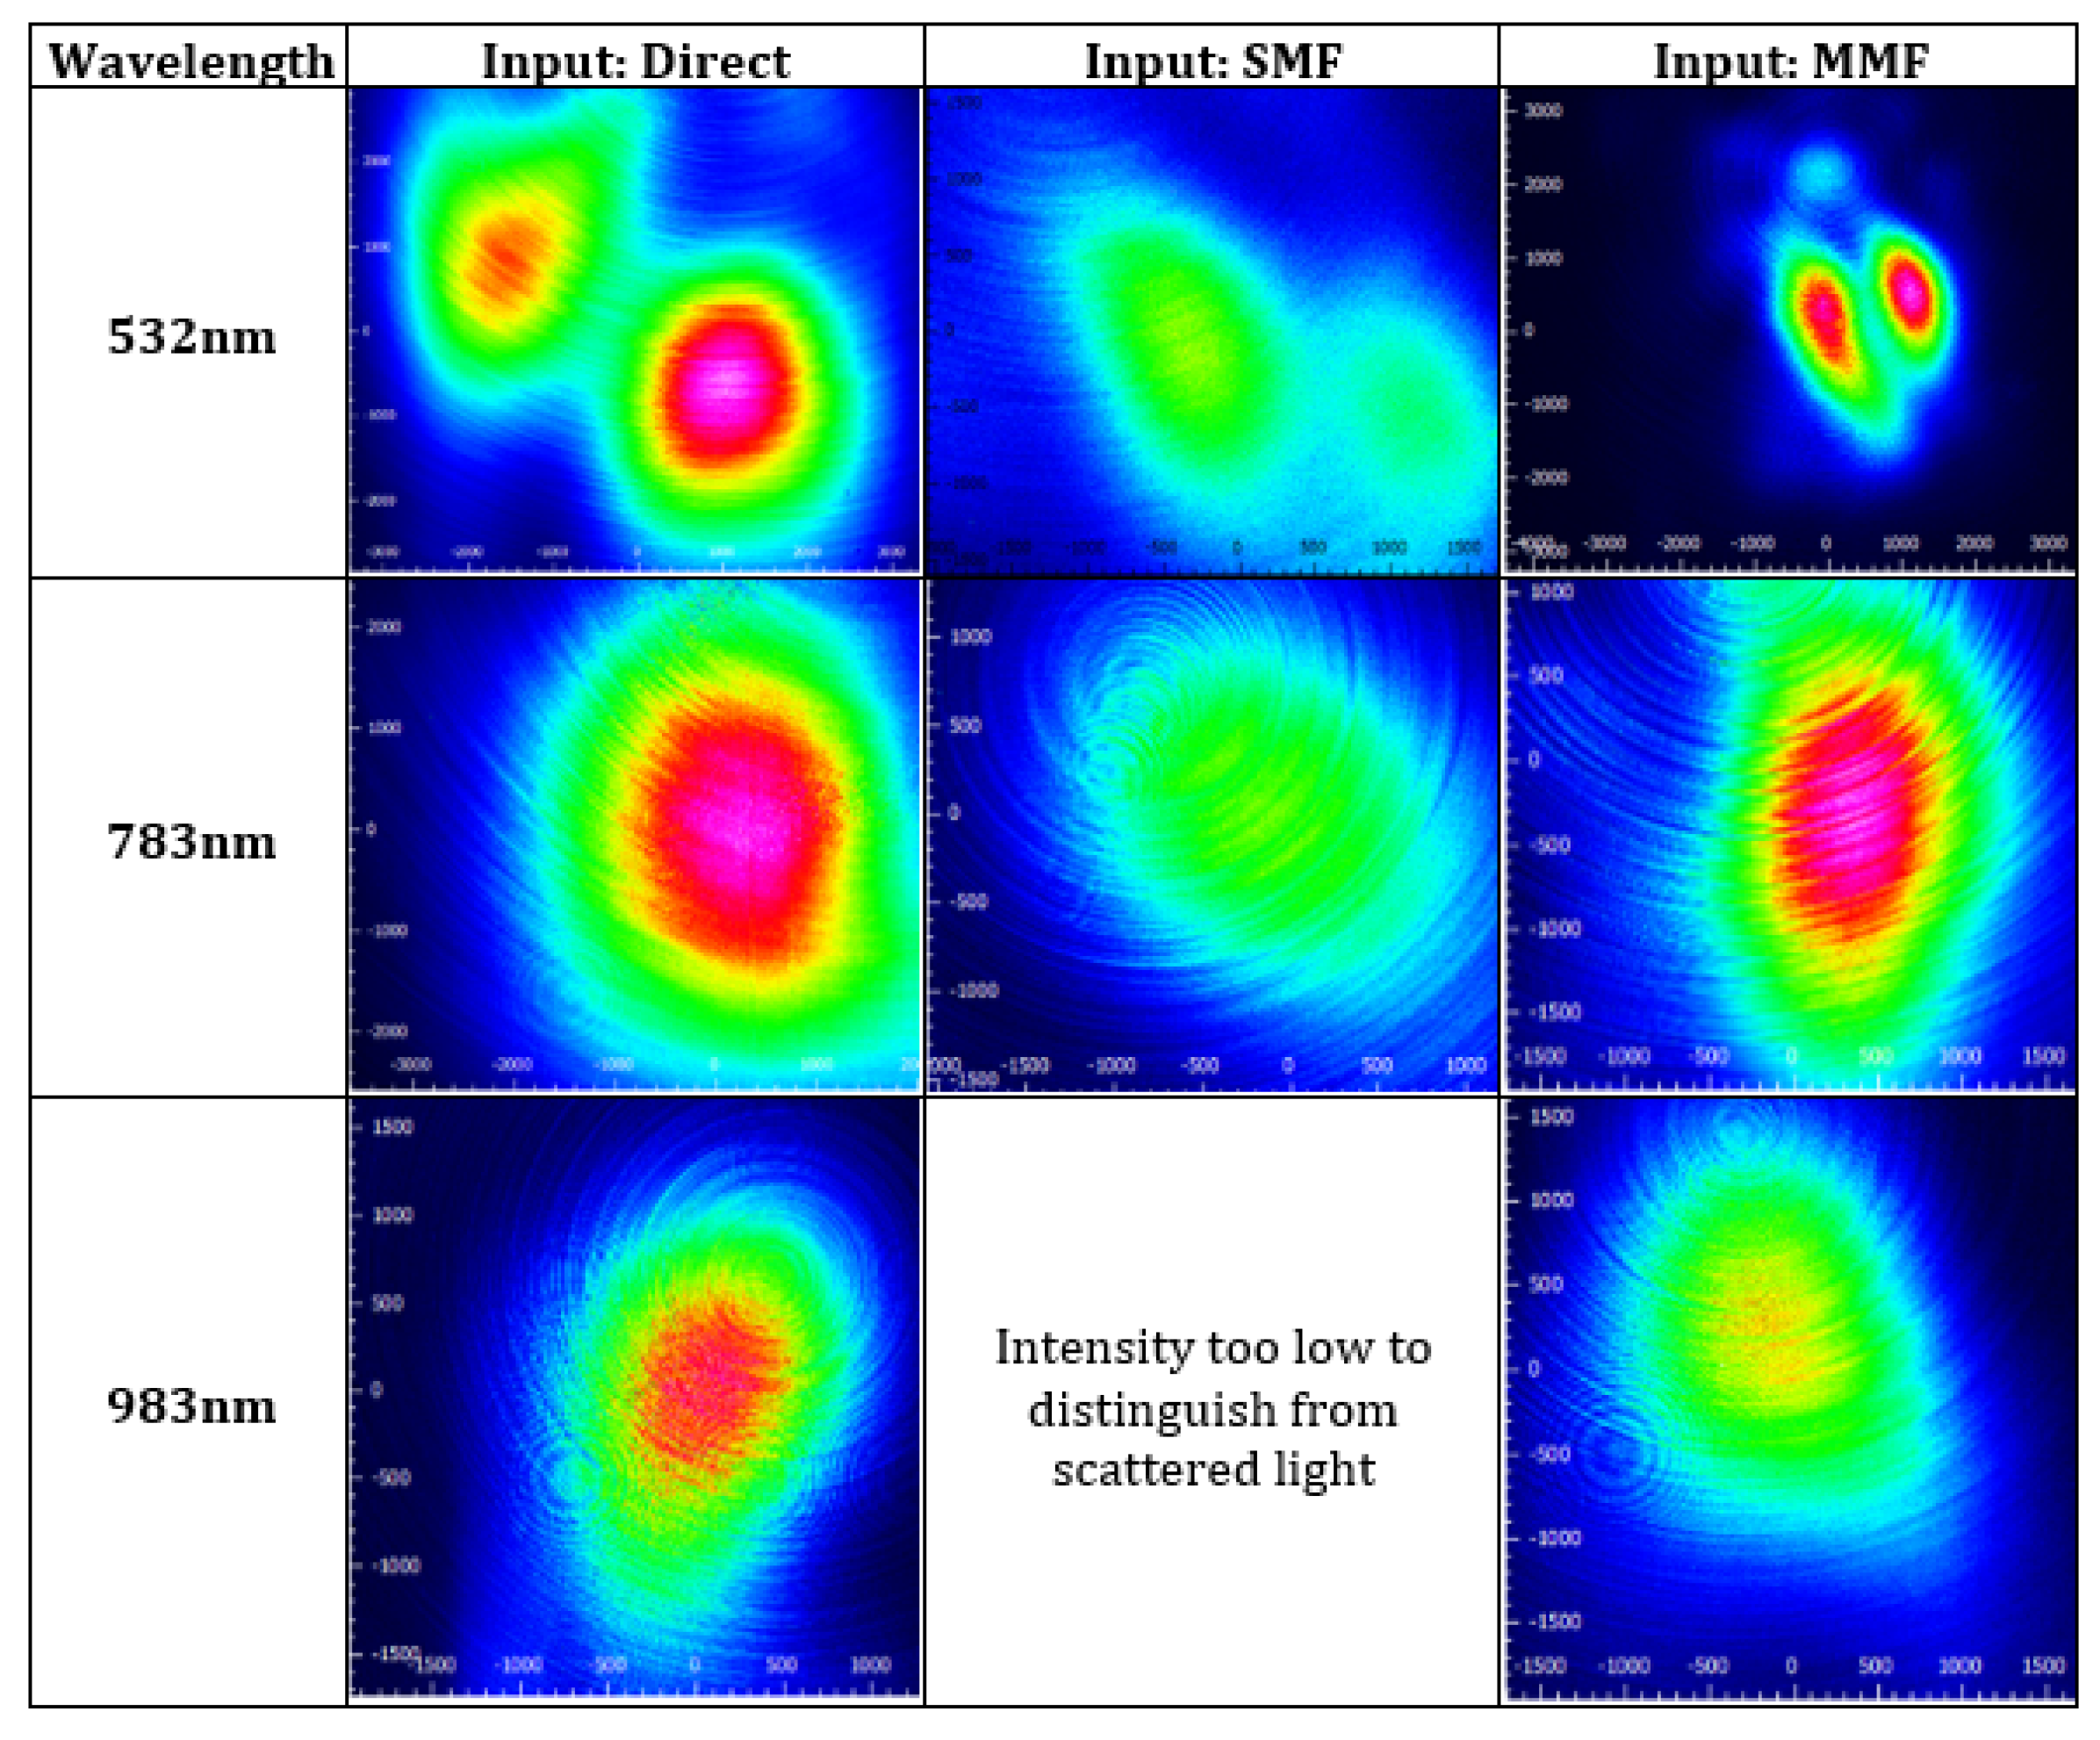
Additional modifications to input conditions further bolstered the conclusion that the observed low-order modes were stable. The previous measurements were taken via direct input of laser light using an objective lens to focus light into the optical fiber. In Figure 8, the far-field projections observed through direct laser input are compared to those observed when 1 m and 2.5 m patch cables (SMF-28e and 50/125 step-index multimode fiber (MMF), respectively) were butt-coupled to the sapphire fiber, with the patch cables receiving the laser light themselves through direct input.
No significant differences were observed in the far-field projections regardless of input method. The LP11 mode was still observed at 532 nm whether direct, SMF, or MMF input was used, and the fundamental LP01 mode was observed at 783 nm and 983 nm. Due to the smaller core of the SMF fiber, the intensity of the SMF-input signal was lower than others (preventing the capture of a far-field projection at 983 nm due either to the reduced intensity of the projection or sensitivity of the detector at this wavelength), but the modal patterns themselves did not change. Based on these results, the following may be stated with confidence: low-order modes, and even a single mode, are dominant in air-clad sapphire optical fiber at wavelengths of 532 nm and greater when the fiber diameter is 6.5 µm or less.
3.3. Effective Numerical Aperture
Effective NA measurements were made using the laser wavelength of 983 nm, where the 6.5 µm air-clad sapphire fiber produced a round LP01 beam profile. Measurements were first taken on a 1 m-long SMF-28e patch cable to provide a control for the measurements. Five measurements were made, yielding a measured effective NA of 0.113 and a standard deviation of 0.029 for the SMF-28e fiber, reported fully in Table 1. The published NA of SMF-28e is 0.14, but that is at λ = 1313 nm, which exceeded the detection window of the beam profiler used in this experimentation. At 983 nm, both the LP11 and LP01 modes were clearly supported by the SMF-28e fiber, producing a noticeably oblong mode field projection and resulting in less precise beam width measurements due to the asymmetry of the hybrid projection. As the sapphire fiber produced a consistent LP01 mode, however, these inaccuracies did not apply in sapphire measurements as exemplified by the 0.008 standard deviation recorded in measurements of the 6.5 µm-diameter sapphire fiber, whose effective NA was measured to be 0.090.
4. Discussion
Theoretical estimations of modal volume for a step-index fiber using standard weakly-guiding approximations [19] would predict the support of 461–1614 modes at wavelengths of 532–983 nm and an air-clad sapphire fiber diameter of 6.5 µm. Furthermore, to achieve single-mode behavior in air-clad sapphire at this wavelength range, fiber diameters would need to be less than 500 nm or so according to weakly-guiding assumptions. However, it is widely considered that the weakly-guiding approximation, which in large part is based on ray-optics assumptions, does not retain accuracy as conditions reach the single-mode cutoff, where wave considerations are dominant. This is especially true when a large refractive index difference exists between core and cladding (i.e., it is not considered to be “weakly guiding”); while these estimations are still useful and reasonably accurate at larger sapphire fiber diameters and correspondingly large modal volumes, they may not be reliable as core diameter and modal volume is reduced. That said, if parameters of the approximations (such as numerical aperture) that are theoretically derived using ray-optic assumptions are experimentally measured rather than calculated, the accuracy of these simple approximations could be improved in the low modal volume regime.
In fact, it is frequently reported that the effective numerical aperture of sapphire fiber in particular varies greatly from its theoretical NA due to non-circular cross section (grown fibers are slightly hexagonal due to sapphire’s crystal structure), attenuation factors, large refractive index between itself and its air cladding, and other parameters, some of which seem to become more impactful as fiber diameter decreases and core-cladding interactions become increasingly important. For instance, while the theoretical NA of air-clad sapphire as calculated by Equation (1) would be around 1.4 at the tested wavelengths, researchers and manufacturers have previously measured effective NAs of ~0.35 at λ = 2.94 µm for unclad sapphire fiber at a diameter of 300 µm [6] and ~0.45 at λ = 633 nm and a diameter of 125 µm [20]. Replacement of the theoretical NA with a measured effective NA may therefore improve accuracy of weakly-guiding approximations predicting modal volume for air-clad sapphire of reduced diameter.
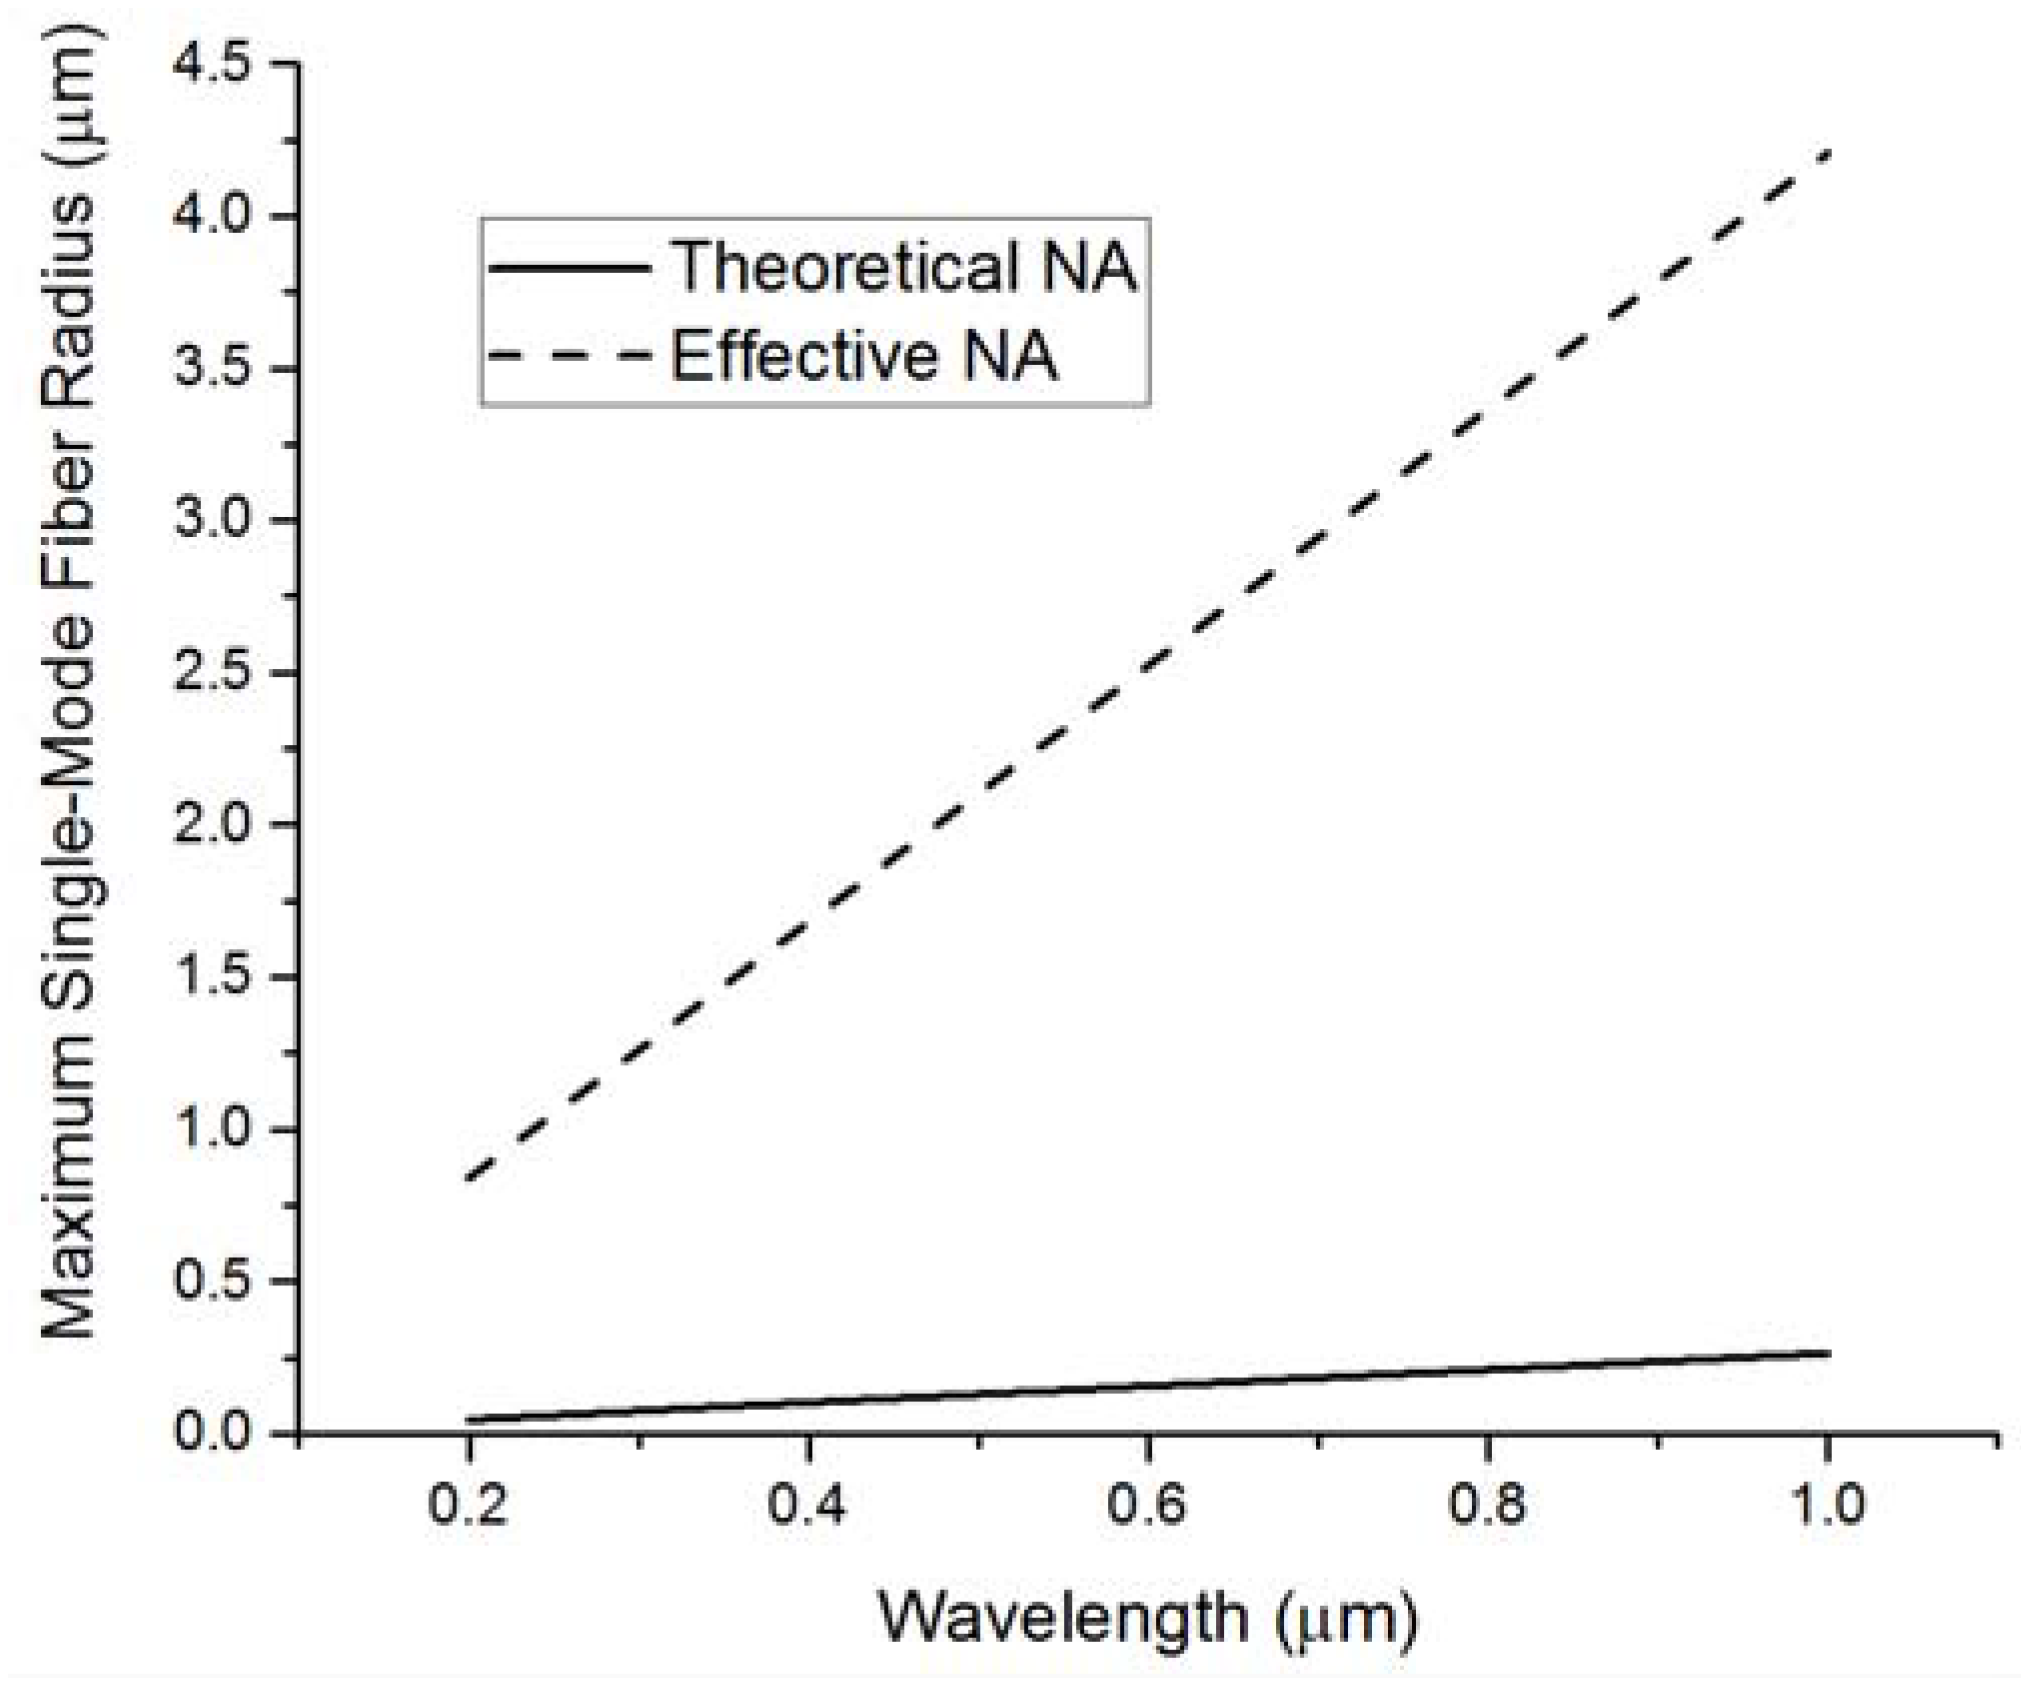
To evaluate this consideration in the context of the reported experimental observations, the measured effective numerical aperture of the 6.5 µm-diameter sapphire fiber (NAeff = 0.090) replaced the theoretical NA (NAth = 1.4) in simple weakly-guiding approximations of modal volume for step-index fibers. The effect of this NA value replacement is contrastingly illustrated in Figure 9, where the calculated maximum radius for air-clad sapphire optical fiber supporting only a single mode is plotted versus input wavelength for both numerical aperture values (theoretical NA versus measured effective NA). This plot was generated by solving the V-parameter equation (Equation (2)) for radius, a, where V = 2.405 is the single-mode cutoff.
Using the effective NA measured for the 6.5 µm-diameter sapphire fiber, this calculation predicts that only the fundamental mode would be supported at wavelengths greater than ~760 nm, which is in fact what was observed experimentally; the higher-order LP11 mode profile was observed at a laser wavelength of 532 nm, while the LP01 mode was observed at laser wavelengths of 783 nm and 983 nm. As it appears the effective numerical aperture of sapphire is highly dependent upon fiber diameter in this low modal volume regime, NAeff measurements would need to be taken at any given fiber diameter to improve the accuracy of predictions at other fiber diameters (i.e., it is not likely that this relationship is linear). Extrapolation using the measured NAeff at a diameter of 6.5 µm for the diameter range of 0–9 µm is certainly within a reasonable window of accuracy for purposes of demonstrating this approximation, however. Greater predictive accuracy may be afforded through continued development of wave-based models for low modal volume sapphire optical fiber, but the reported experimentation suggests that legacy ray-based weakly-guiding approximations may be used with considerable accuracy if the effective numerical aperture is measured and utilized in calculations.
5. Conclusions
In this work, very low modal volume was observed in an air-clad single-crystal sapphire optical fiber, with single-mode behavior observed for the first time at laser wavelengths of 783 nm and 983 nm. The stability of far-field mode profile measurements for the 6.5 µm-diameter sapphire fiber was demonstrated through the alteration of input conditions, bolstering confidence in the observed low modal volume. It is possible that some higher order modes are yet supported by sapphire optical fiber of this diameter but are simply too leaky to propagate for substantial lengths; this consideration will be the subject of continued experimentation. For the practical purposes of distributed sensing applications, however, this work has demonstrated that dominant power in a 6.5 µm-diameter sapphire optical fiber is coupled in the lowest order modes in the wavelength range of 532 nm–983 nm.
It was also demonstrated that modal volume calculations using weakly-guiding approximations are inaccurate at these fiber diameters if the theoretical numerical aperture is input, but accuracy is greatly improved if the effective numerical aperture is measured and substituted for the theoretical NA using weakly-guiding approximations. Finally, the discovery that single-mode behavior is exhibited at sapphire fiber diameters on the microscale rather than the nanoscale predicted using original assumptions is of huge benefit to the extreme-environment sensing community; sapphire microfibers are much more easily manufactured, handled, and deployed than nanofibers, and the power capacity of a microfiber will be exponentially greater than a nanofiber. Additionally, detection resolutions may be increased in distributed sensors and sensing schemes requiring low modal volume or single mode behavior (such as Bragg gratings) are now enabled in sapphire.
Acknowledgments
The authors wish to acknowledge financial support from the National Energy Technology Lab (NETL) at the U.S. Department of Energy (DOE) under contract DE-FE0012274. Publication fees were generously provided by the Virginia Tech Open Access Subvention Fund.
Author Contributions
D. Homa and Z. Yu guided experimental design and provided refining feedback throughout the research. Y. Cheng and B. Liu lended experimental assistance, especially regarding optical analysis setup and execution. A. Wang and G. Pickrell evaluated experimental data and suggested additional validating techniques. C. Hill performed the experiments, sample characterization and analysis, and wrote the paper.
Conflicts of Interest
The authors declare no conflict of interest. Disclaimer: This report was prepared as an account of work sponsored by an agency of the United States Government. Neither the United States Government nor any agency thereof, nor any of their employees, makes any warranty, express or implied, or assumes any legal liability or responsibility for the accuracy, completeness, or usefulness of any information, apparatus, product, or process disclosed, or represents that its use would not infringe privately owned rights. Reference herein to any specific commercial product, process, or service by tradename, trademark, manufacturer, or otherwise does not necessarily constitute or imply its endorsement, recommendation, or favoring by the United States Government or any agency thereof. The views and opinions of authors expressed herein do not necessarily state or reflect those of the United States Government or any agency thereof.
References
- Dils, R.R. High temperature optical fiber thermometer. J. Appl. Phys. 1983, 54, 1198. [Google Scholar] [CrossRef]
- Rensberger, R. High Temperature Optical Fiber Thermometer: New instrument measures temperatures to 2000C. In National Bureau of Standards TN-5387; National Technical Reports Library: Washington, DC, USA, 1983. [Google Scholar]
- Tichenor, D.A.; Hencken, K.R.; Bickes, R.W. Sapphire Fiber Optic Temperature Probe. In Advanced Instrumentation for Aero Engine Components; AGARD: Neuilly sur Seine, France, 1986. [Google Scholar]
- Edl-Mizaikoff, B.; Goetz, R.; Kellner, R.A. IR fiber optic evanescent field sensors for gas monitoring. Proc. SPIE Int. Soc. Opt. Eng. 1995, 2508, 253–264. [Google Scholar]
- Merberg, G.N.; Harrington, J.A. Optical and mechanical properties of single-crystal sapphire optical fibers. Appl. Opt. 1993, 32, 3201–3209. [Google Scholar] [CrossRef] [PubMed]
- Nubling, R.K.; Harrington, J.A. Optical properties of single-crystal sapphire optical fibers. Appl. Opt. 1997, 36, 5934. [Google Scholar] [CrossRef] [PubMed]
- Grobnic, D.; Mihailov, S.J.; Ding, H.; Bilodeau, F.; Smelser, C.W. Single and low order mode interrogation of a multimode sapphire fibre Bragg grating sensor with tapered fibres. Meas. Sci. Technol. 2006, 17, 980–984. [Google Scholar] [CrossRef]
- Pfeiffenberger, N.; Pickrell, G.; Kokal, K.; Wang, A. Sapphire photonic crystal fibers. Opt. Eng. 2010, 49, 090501. [Google Scholar] [CrossRef]
- Pfeiffenberger, N.T.; Pickrell, G.R. Modal reduction in 6-rod bundled single-crystal sapphire photonic crystal fibers. Proc. SPIE 2012, 8370, 837004. [Google Scholar]
- Cheng, Y.; Hill, C.; Liu, B.; Yu, Z.; Xuan, H.; Homa, D.; Wang, A.; Pickrell, G. Modal reduction in single crystal sapphire optical fiber. Opt. Eng. 2015, 54, 107103. [Google Scholar] [CrossRef]
- Cheng, Y.; Hill, C.; Liu, B.; Yu, Z.; Xuan, H.; Homa, D.; Wang, A.; Pickrell, G. Design and analysis of large-core single-mode windmill single crystal sapphire optical fiber. Opt. Eng. 2016, 55, 066101. [Google Scholar] [CrossRef]
- Hill, C.; Homa, D.; Liu, B.; Yu, Z.; Wang, A.; Pickrell, G. Submicron diameter single crystal sapphire optical fiber. Mater. Lett. 2015, 138, 71–73. [Google Scholar] [CrossRef]
- Chamberlain, G.E.; Day, G.W.; Franzen, D.L.; Gallawa, R.L.; Kim, E.M.; Young, M. Optical Fiber Characterization: Attenuation, Frequency Domain Bandwidth, and Radiation Patterns; Electromagnetic Technology Division, Center for Electronics and Electrical Engineering, National Bureau of Standards: Boulder, CO, USA, 1983; Volume 2. [Google Scholar]
- Numerical Aperture Measurement Method MM20; Corning Incorporated: Corning, NY, USA, 2001.
- Alford, W.J.; Stephens, D.L. Chemical Polishing and Etching Techniques for Al2O3 Single Crystals. J. Am. Ceram. Soc. 1963, 46, 193–194. [Google Scholar] [CrossRef]
- Dwikusama, D.S.F.; Kuech, T.F. Study on Sapphire Surface Preparation for III-Nitride Heteroepitaxial Growth by Chemical Treatments. J. Electrochem. Soc. 2002, 149, G603–G608. [Google Scholar] [CrossRef]
- Lee, Y.-J.; Kuo, H.-C.; Lu, T.-C.; Wang, S.-C.; Ng, K.W.; Lau, K.M.; Yang, Z.-P.; Chang, A.S.-P.; Lin, S.-Y. Study of Gan-Based Light-Emitting Diods Grown on Chemical Wet-Etching Patterned Sapphire Substrate with V-shaped Pits Roughening Surfaces. J. Lightwave Technol. 2008, 26, 1455–1463. [Google Scholar] [CrossRef]
- Wang, J.; Guo, L.W.; Jia, H.Q.; Wang, Y.; Xing, Z.G.; Li, W.; Chen, H.; Zhou, J.M. Fabrication of Patterned Sapphire Substrate by Wet Chemical Etching for Maskless Lateral Overgrowth of GaN. J. Electrochem. Soc. 2006, 153, C182–C185. [Google Scholar] [CrossRef]
- Snyder, A.W.; Love, J.D. Optical Waveguide Theory; Chapman and Hall Ltd.: London, UK, 1983; p. 734. [Google Scholar]
- NA of Sapphire Fiber (Micromaterials Inc., 2015). Available online: http://micromaterialsinc.com/NA_sapphireFiber.pdf (accessed on 15 October 2015).
Figure 1.
Simplified schematic of the etching system. For sake of clarity, the enclosing alumina tube and insulation are omitted from the diagram, as is the fused silica thermocouple-shielding tube to which the fiber was attached during etching.
Figure 1.
Simplified schematic of the etching system. For sake of clarity, the enclosing alumina tube and insulation are omitted from the diagram, as is the fused silica thermocouple-shielding tube to which the fiber was attached during etching.

Figure 2.
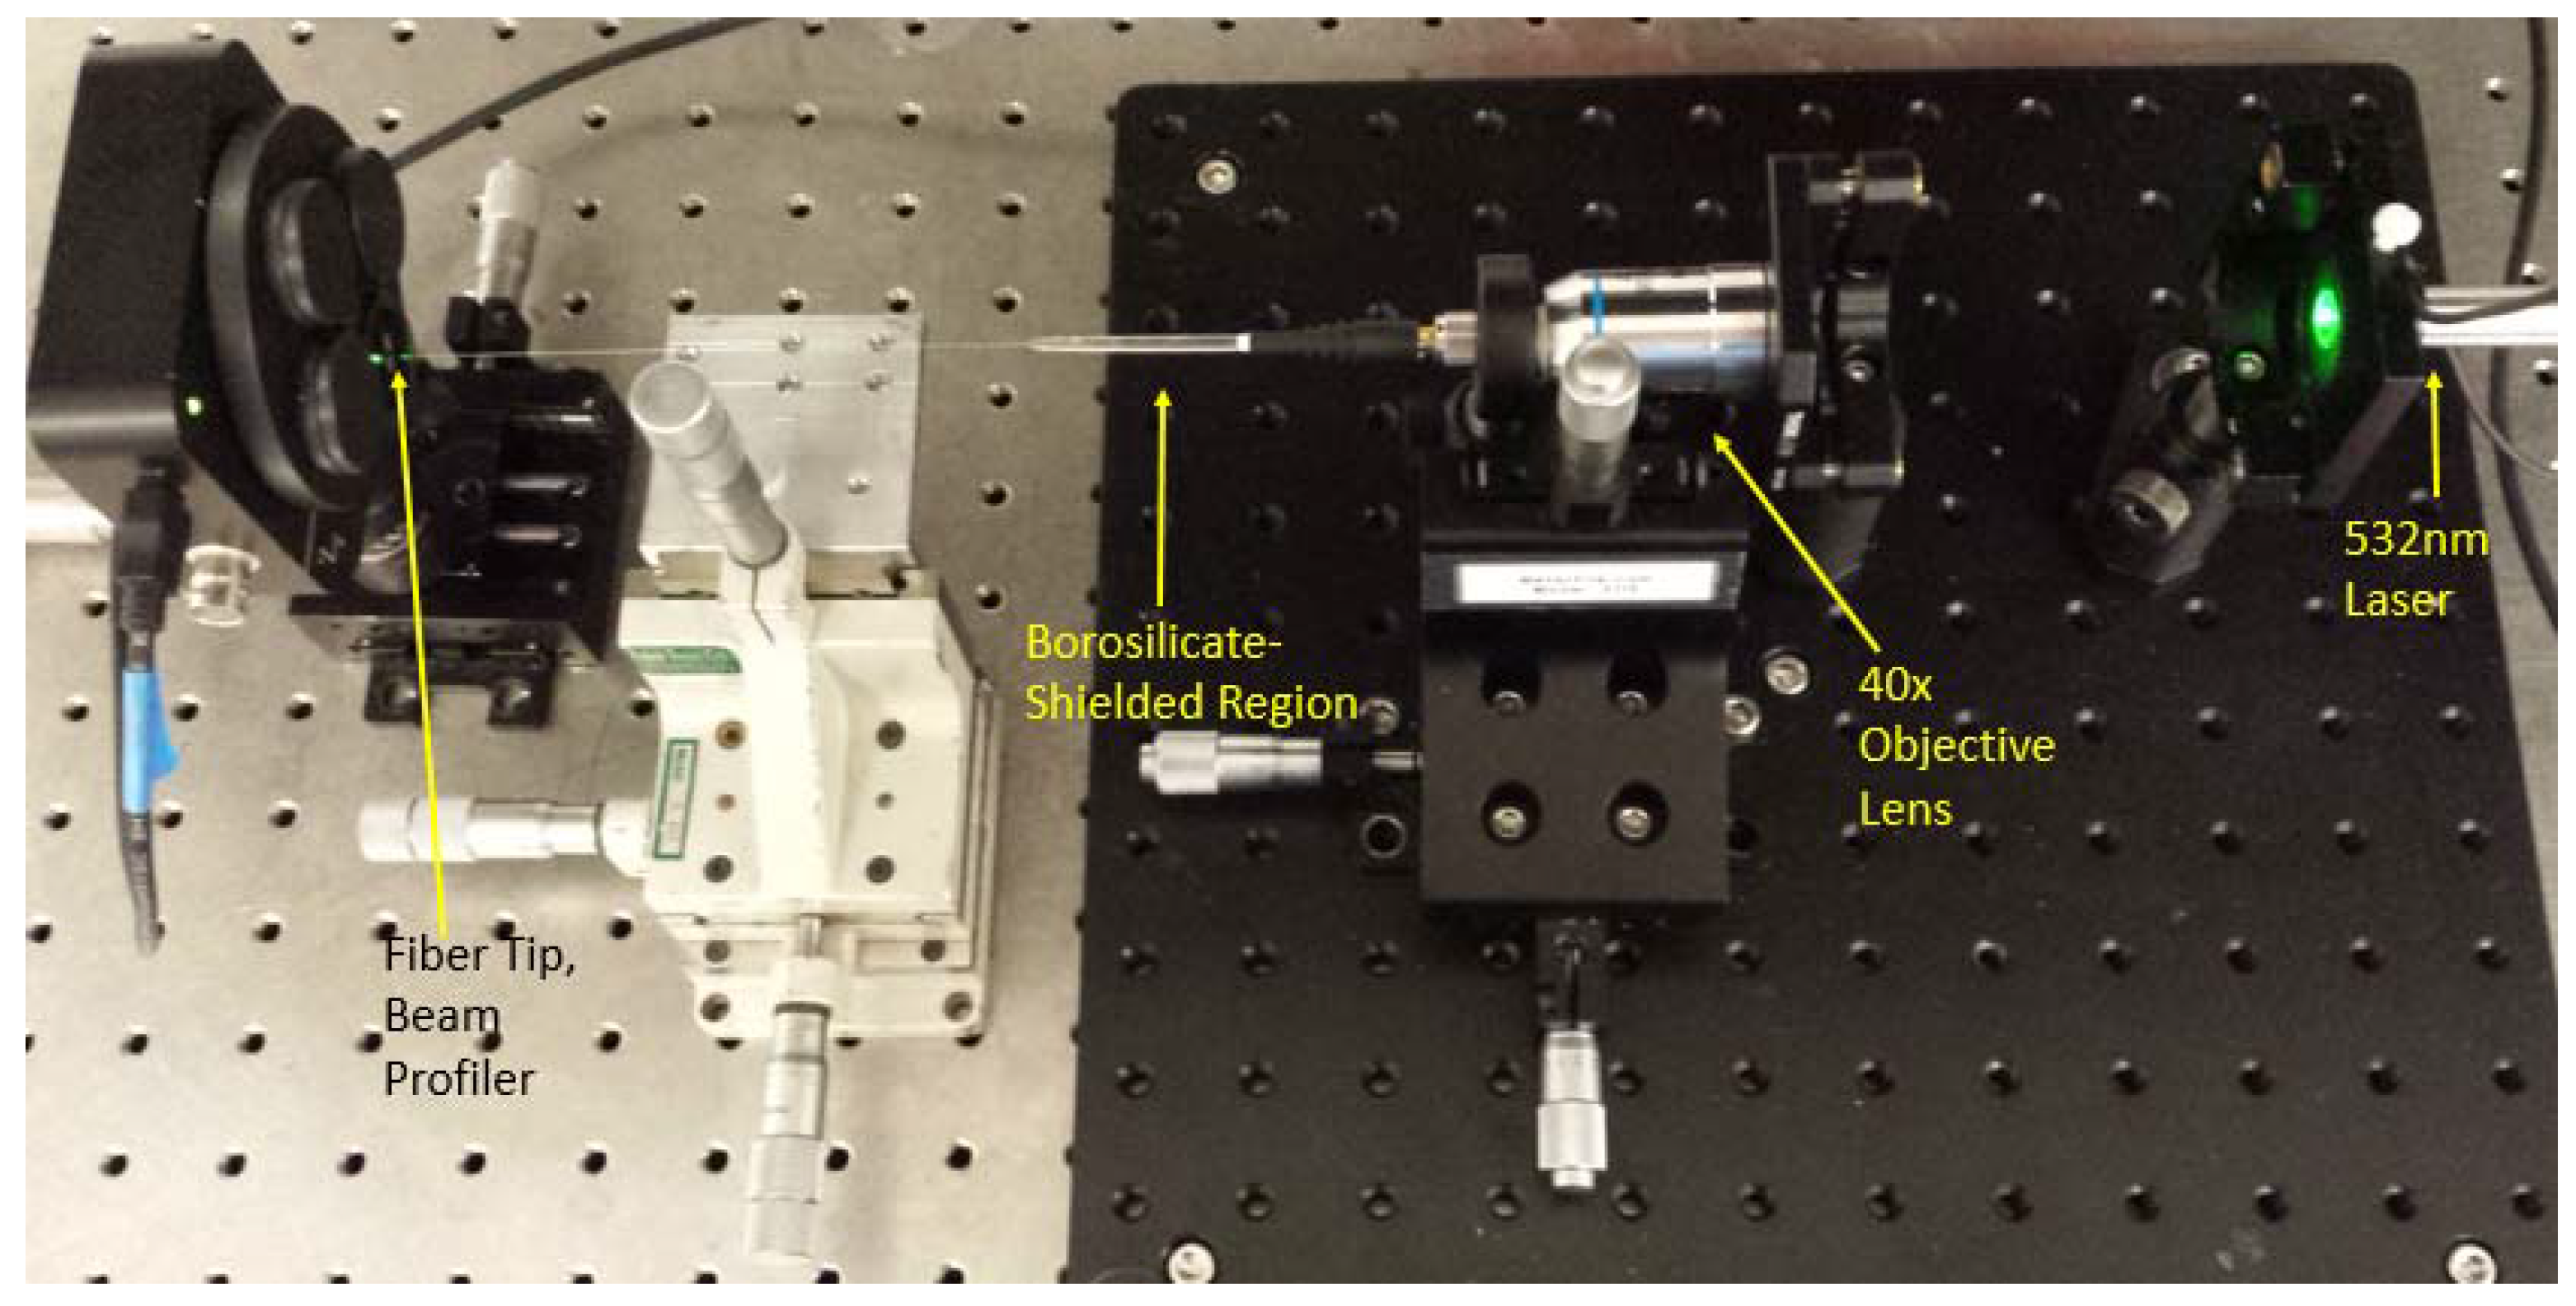
Far-field measurements were taken using a CCD beam profiler and minimal focusing optics. The sapphire fiber with its glass-shielded region, FC/PC connector, and exposed sapphire fiber before etching is seen during analysis using a 5 mW 532 nm laser.
Figure 2.
Far-field measurements were taken using a CCD beam profiler and minimal focusing optics. The sapphire fiber with its glass-shielded region, FC/PC connector, and exposed sapphire fiber before etching is seen during analysis using a 5 mW 532 nm laser.

Figure 3.
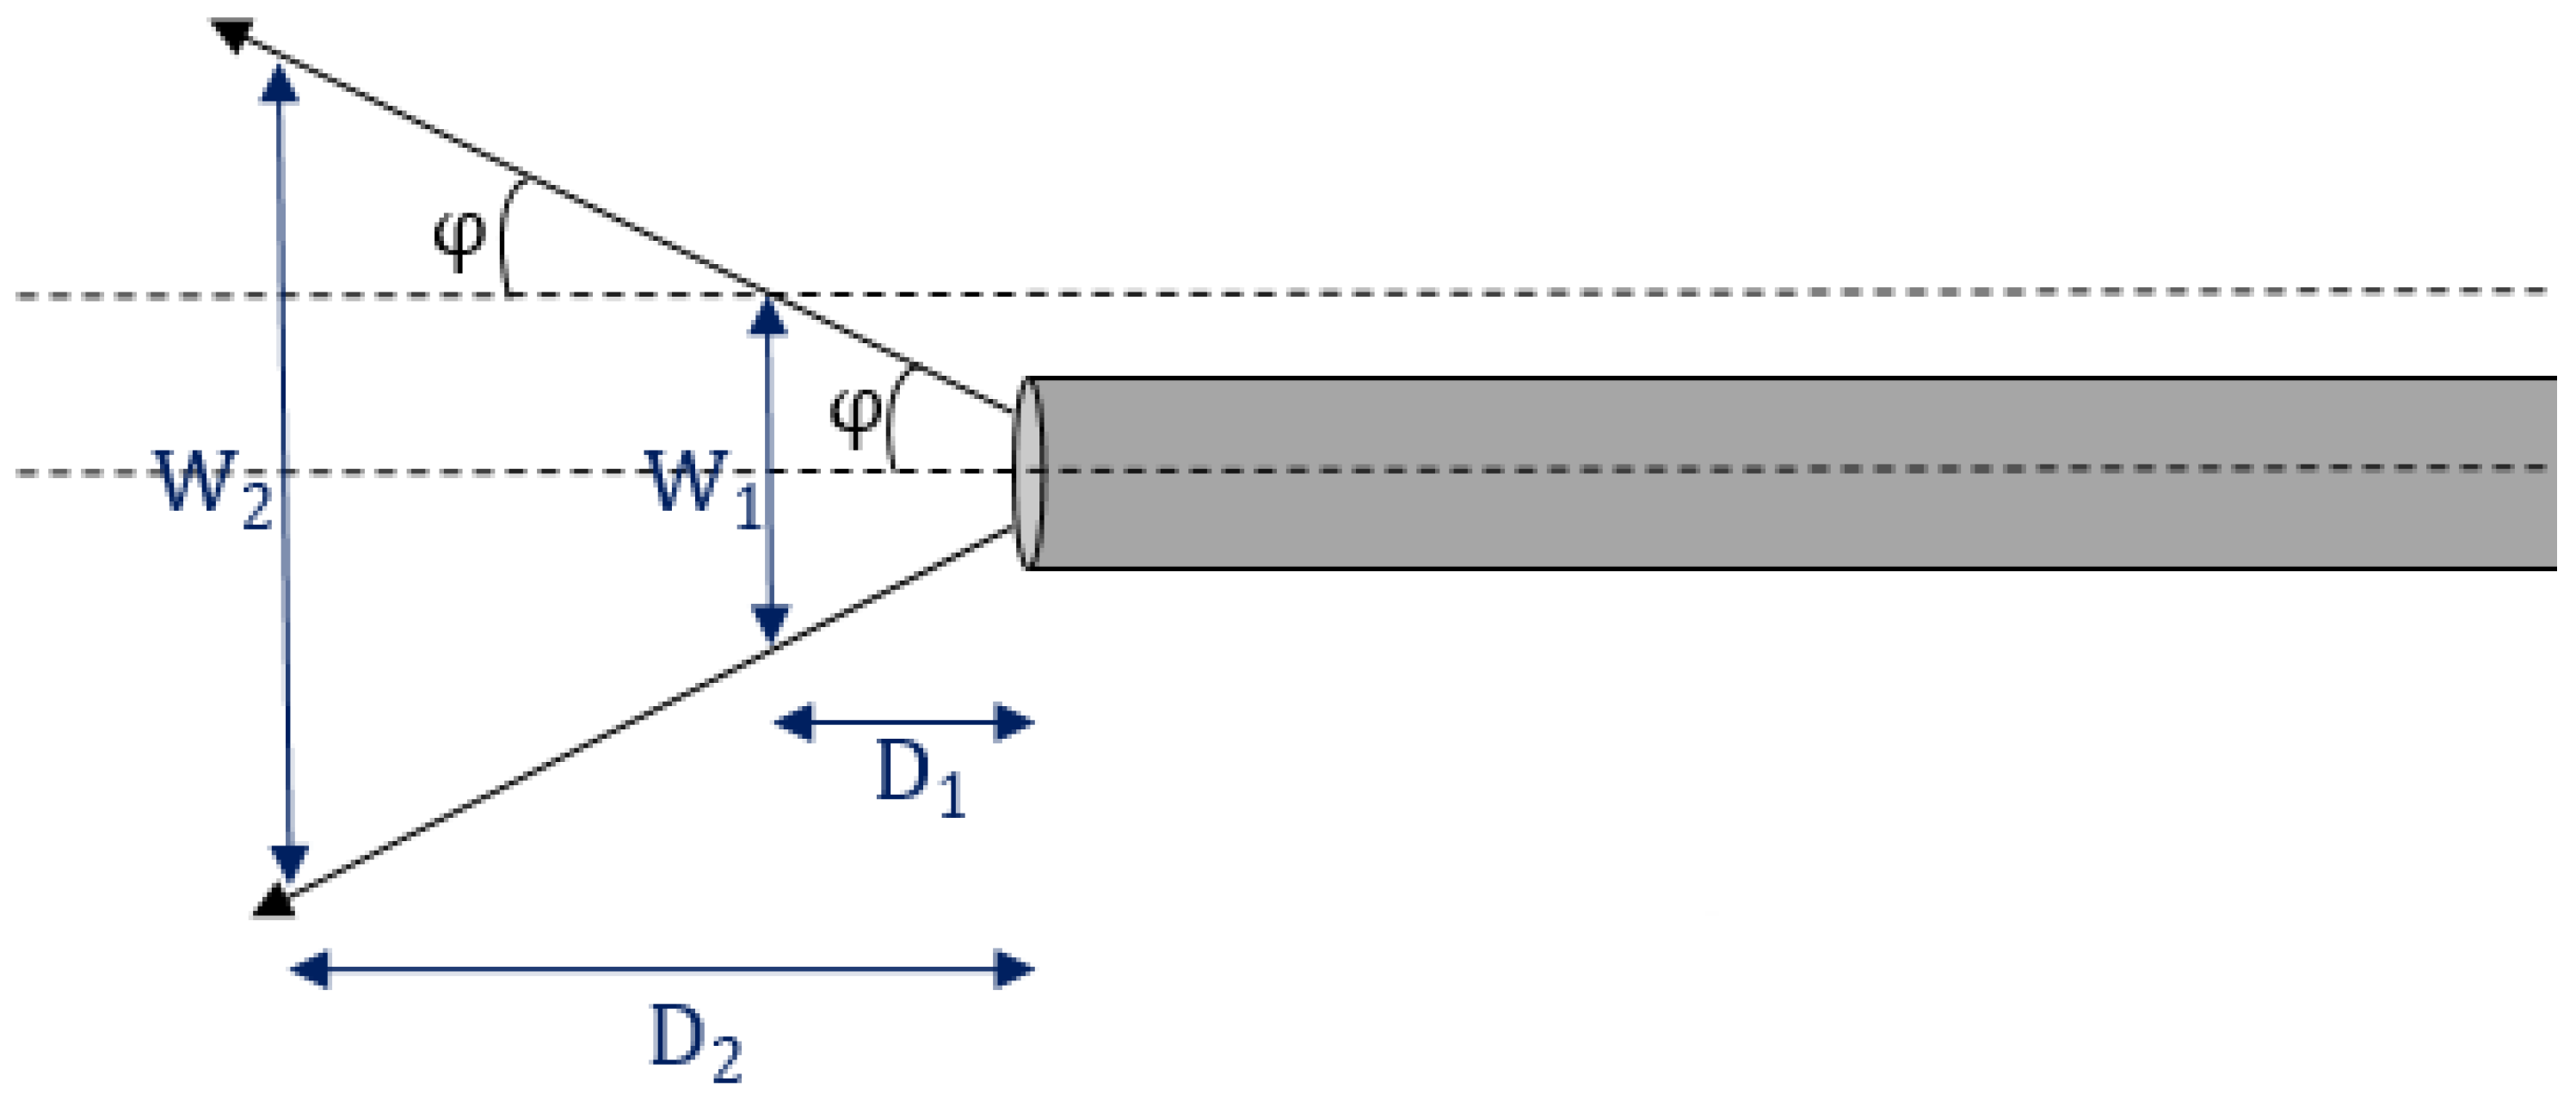
The effective numerical aperture was determined by measuring the beam diameter (4σ cutoff intensity) at a given distance from the tip of the fiber and then again at a further known distance. From this data, the divergence angle and therefore numerical aperture (NA) could then be determined.
Figure 3.
The effective numerical aperture was determined by measuring the beam diameter (4σ cutoff intensity) at a given distance from the tip of the fiber and then again at a further known distance. From this data, the divergence angle and therefore numerical aperture (NA) could then be determined.

Figure 4.
The temperature profile during an etching session was monitored and found to be consistent, plateauing around 343 °C. Under gentle heat and with limited ventilation, this temperature was self-maintained for long periods of time by the evaporation and condensation of the sulfuric acid in the mixture.
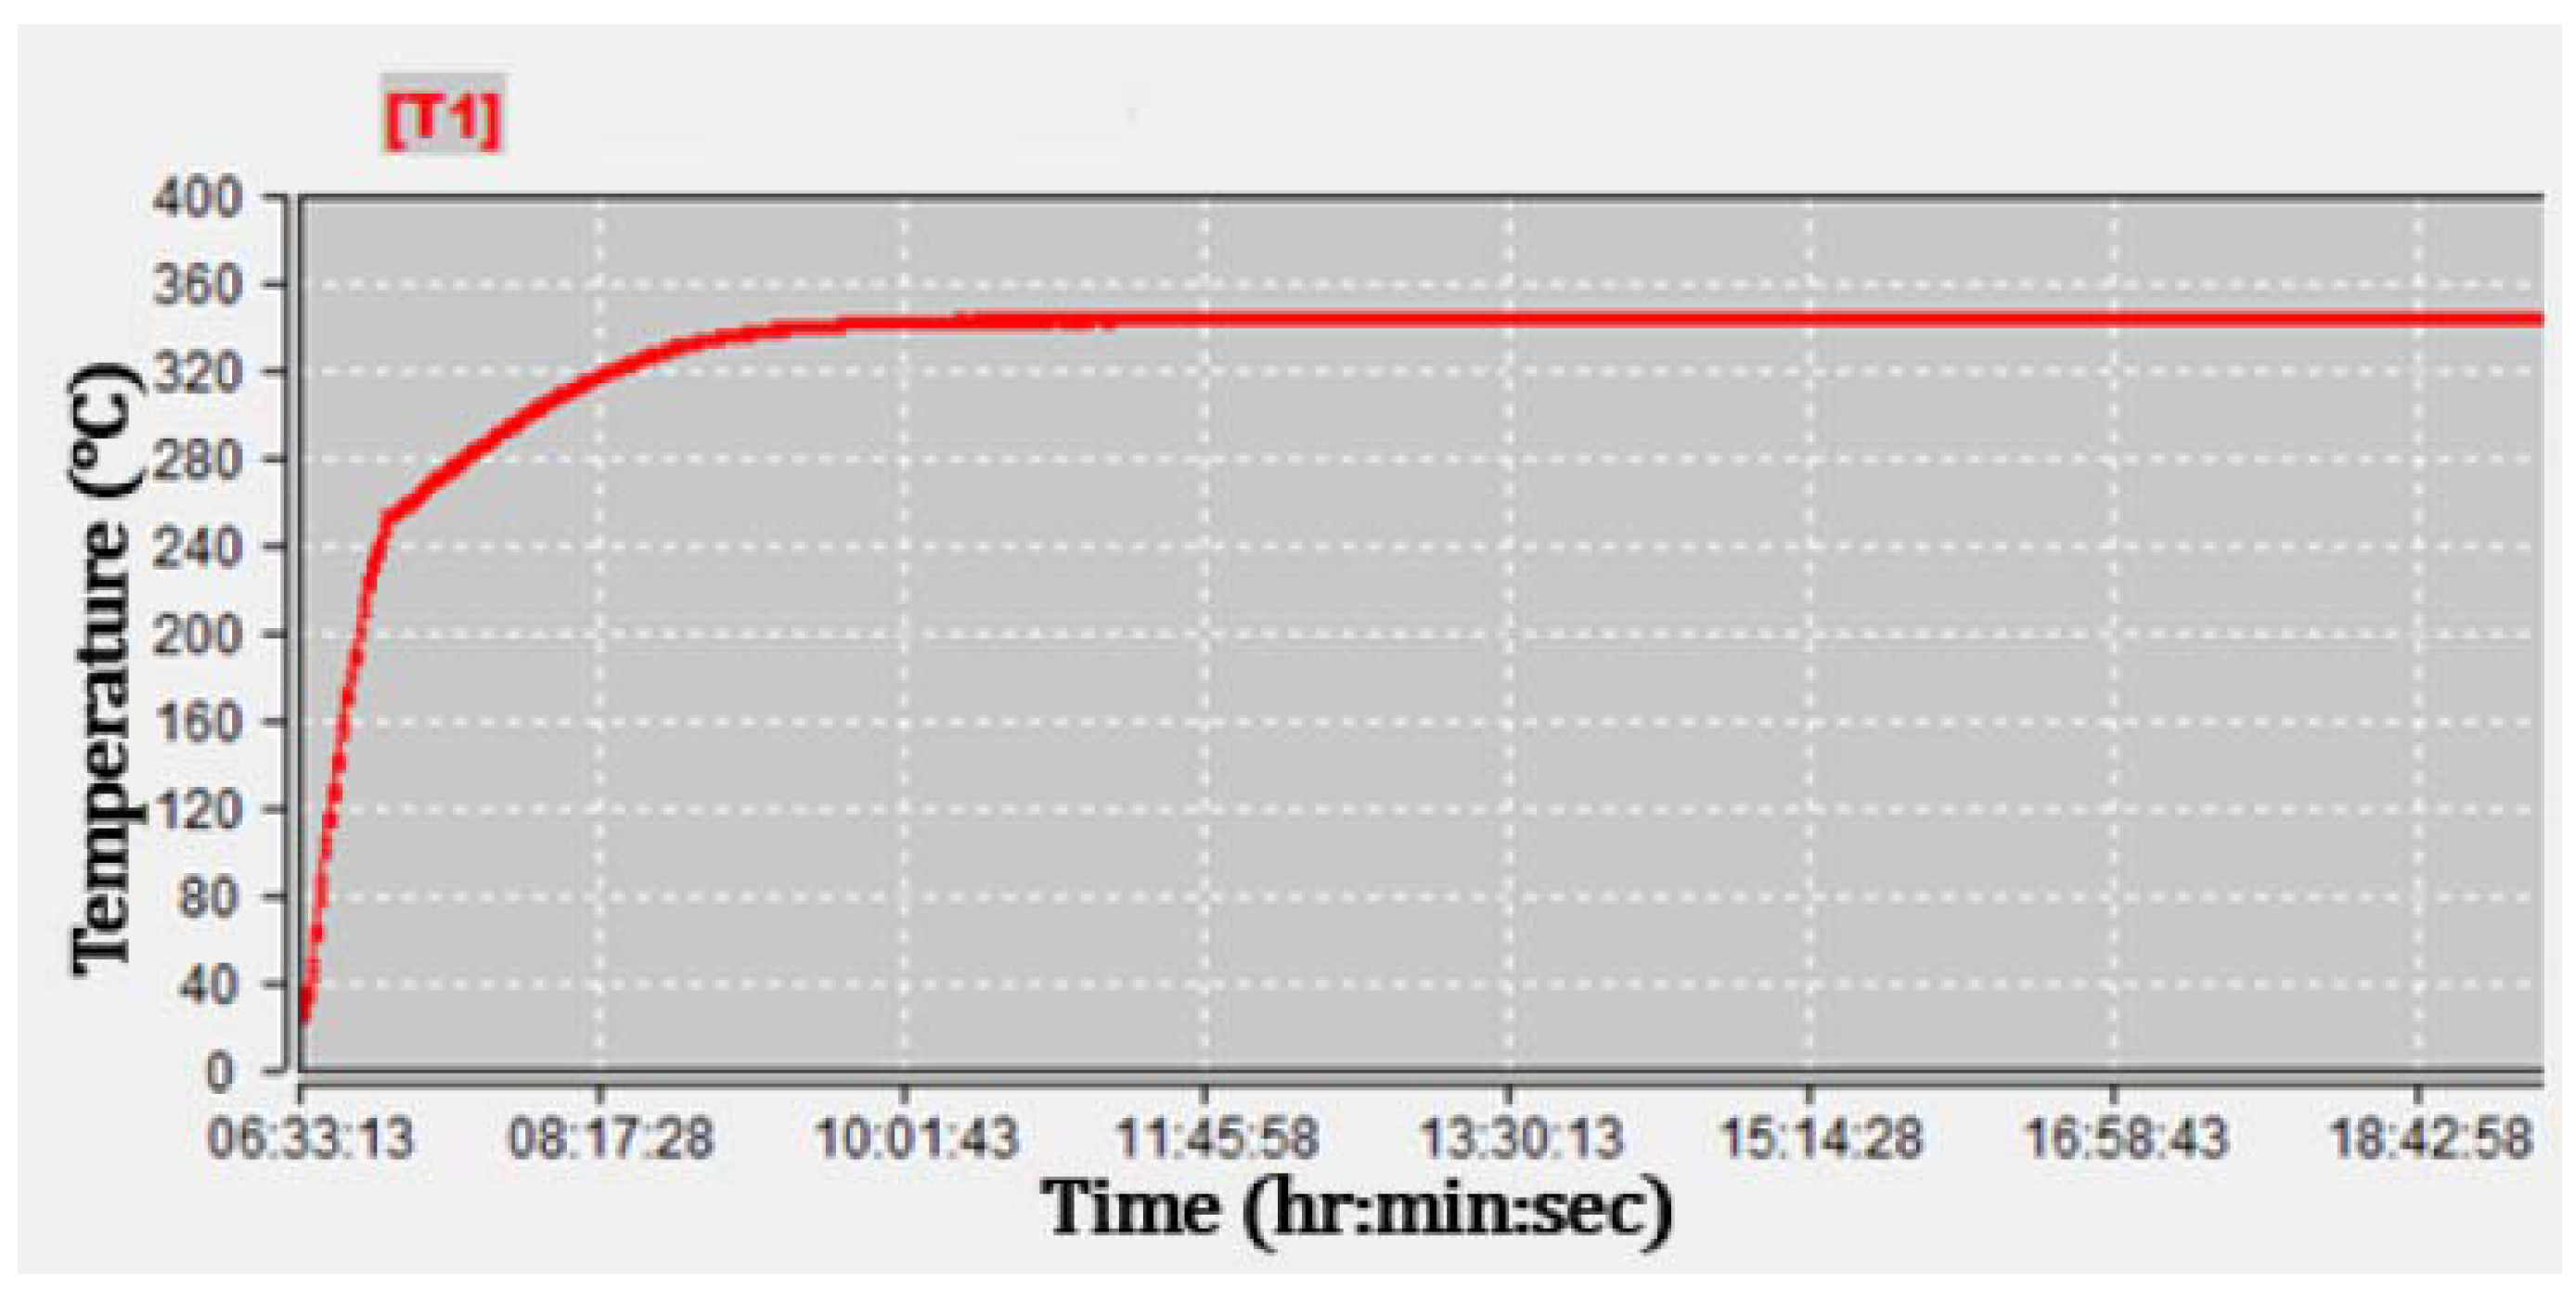
Figure 5.
The etch rate of the sapphire optical fiber (a-plane is the etched plane) exhibited an approximately linear relationship with etch temperature.
Figure 5.
The etch rate of the sapphire optical fiber (a-plane is the etched plane) exhibited an approximately linear relationship with etch temperature.
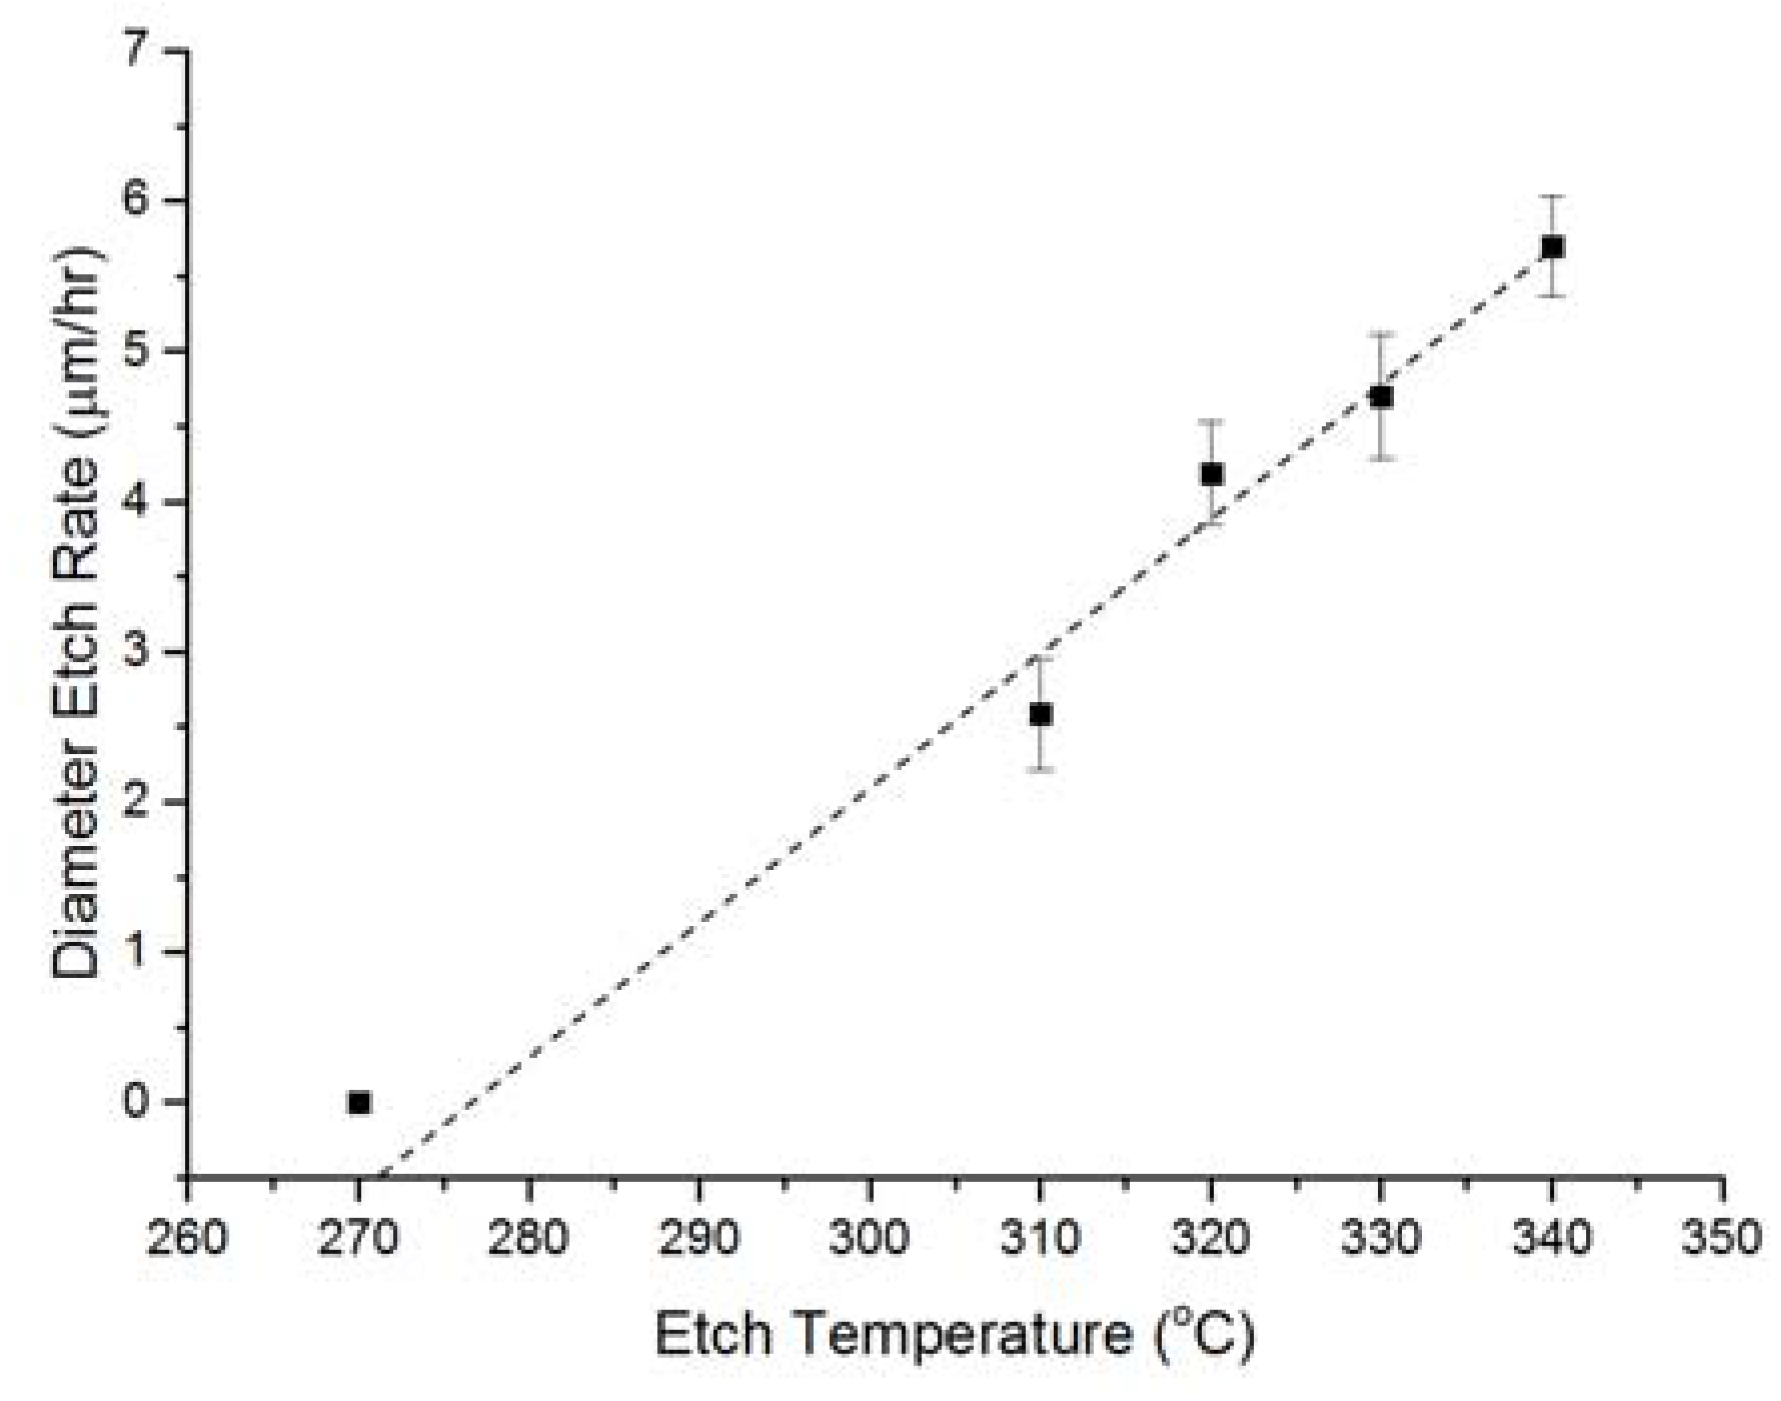
Figure 6.
(a) Etching occurs cleanly and consistently at regions where the sapphire fiber is fully immersed; (b) Deposits could appear near the air-acid interface during the etching process if not properly shielded.
Figure 6.
(a) Etching occurs cleanly and consistently at regions where the sapphire fiber is fully immersed; (b) Deposits could appear near the air-acid interface during the etching process if not properly shielded.

Figure 7.
Far-field measurements were taken at varying diameters using laser wavelengths of 532 nm, 783 nm, and 983 nm. Low-order modes became visible at a sapphire fiber diameter of 6.5 µm, and measurements were consistent when the light injection angle was altered by 15°.
Figure 7.
Far-field measurements were taken at varying diameters using laser wavelengths of 532 nm, 783 nm, and 983 nm. Low-order modes became visible at a sapphire fiber diameter of 6.5 µm, and measurements were consistent when the light injection angle was altered by 15°.
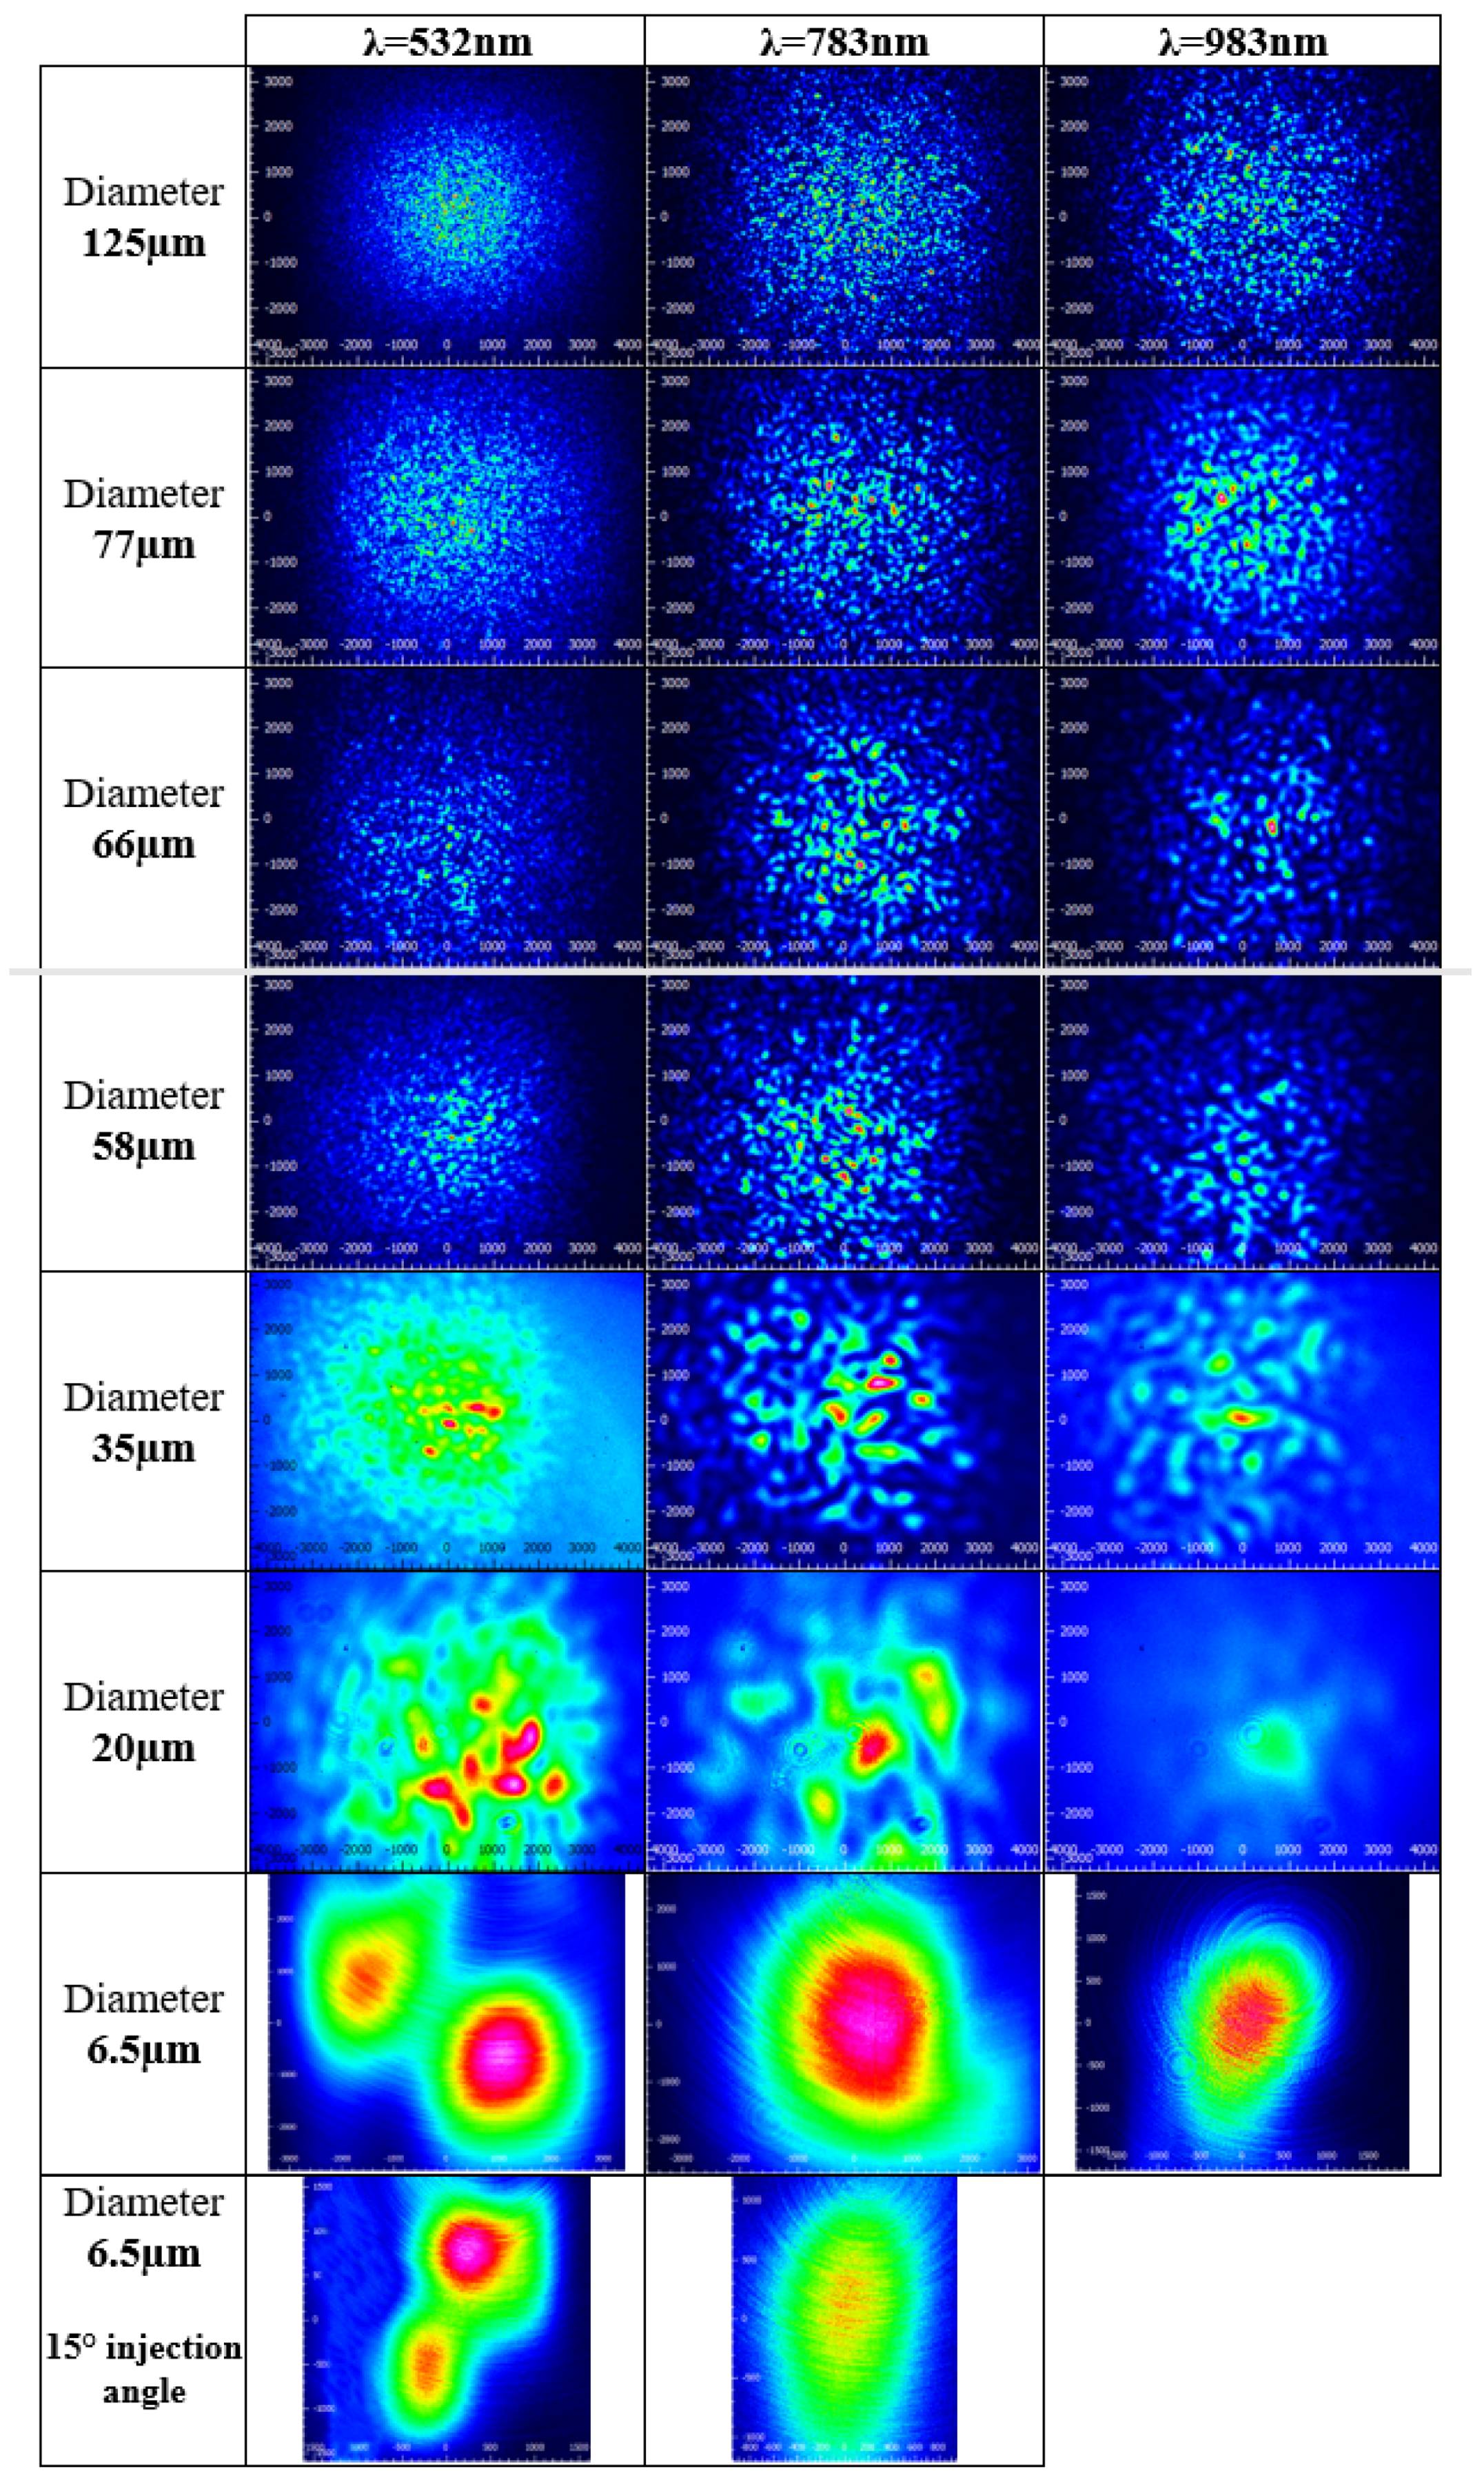
Figure 8.
Altering the input conditions by butt-coupling SMF-28e and 50/125 step-index MMF patch cables did not change the mode properties observed using direct input.
Figure 8.
Altering the input conditions by butt-coupling SMF-28e and 50/125 step-index MMF patch cables did not change the mode properties observed using direct input.

Figure 9.
The predicted maximum air-clad sapphire optical fiber radius that will support only a single mode changes significantly when the measured effective numerical aperture (0.090) is substituted for the theoretical numerical aperture (1.4) in step-index approximations. The predicted single-mode cutoff using the measured NAeff in these approximations agreed with experimental observations.


Table 1.
Five beam width measurements were taken each at two distances from the fiber tip to yield an effective numerical aperture measurement for SMF-28e (control) and the reduced-diameter sapphire optical fiber.
Table 1.
Five beam width measurements were taken each at two distances from the fiber tip to yield an effective numerical aperture measurement for SMF-28e (control) and the reduced-diameter sapphire optical fiber.
| Analyzed Fiber | Avg. 4σ Beam Width at D1 | Avg. 4σ Beam Width (µm) at D2 = D1 + 1 mm | Avg. Vergence Angle | Avg. Effective NA | Std. Dev. |
|---|---|---|---|---|---|
| SMF-28e | 3108.61 µm | 3335.25 µm | 6.49° | 0.113 | 0.029 |
| Sapphire Ø = 6.5 µm | 4513.64 µm | 4697.16 µm | 5.26° | 0.090 | 0.008 |
© 2017 by the authors. Licensee MDPI, Basel, Switzerland. This article is an open access article distributed under the terms and conditions of the Creative Commons Attribution (CC BY) license (http://creativecommons.org/licenses/by/4.0/).
Share and Cite
MDPI and ACS Style
Hill, C.; Homa, D.; Yu, Z.; Cheng, Y.; Liu, B.; Wang, A.; Pickrell, G. Single Mode Air-Clad Single Crystal Sapphire Optical Fiber. Appl. Sci. 2017, 7, 473. https://doi.org/10.3390/app7050473
AMA Style
Hill C, Homa D, Yu Z, Cheng Y, Liu B, Wang A, Pickrell G. Single Mode Air-Clad Single Crystal Sapphire Optical Fiber. Applied Sciences. 2017; 7(5):473. https://doi.org/10.3390/app7050473
Chicago/Turabian StyleHill, Cary, Dan Homa, Zhihao Yu, Yujie Cheng, Bo Liu, Anbo Wang, and Gary Pickrell. 2017. "Single Mode Air-Clad Single Crystal Sapphire Optical Fiber" Applied Sciences 7, no. 5: 473. https://doi.org/10.3390/app7050473
Note that from the first issue of 2016, this journal uses article numbers instead of page numbers. See further details here.