Article

A Fast and Cost-Effective Detection of Melamine by Surface Enhanced Raman Spectroscopy Using a Novel Hydrogen Bonding-Assisted Supramolecular Matrix and Gold-Coated Magnetic Nanoparticles

Department of Food Science and Technology, Zhejiang University of Technology, Hangzhou 310014, China
*
Author to whom correspondence should be addressed.
Appl. Sci. 2017, 7(5), 475; https://doi.org/10.3390/app7050475
Submission received: 8 March 2017 / Revised: 27 April 2017 / Accepted: 27 April 2017 / Published: 3 May 2017
(This article belongs to the Special Issue Biological Applications of Magnetic Nanoparticles)

Abstract

:
A fast and cost-effective melamine detection approach has been developed based on surface enhanced Raman spectroscopy (SERS) using a novel hydrogen bonding-assisted supramolecular matrix. The detection utilizes Fe3O4/Au magnetic nanoparticles coated with 5-aminoorotic acid (AOA) as a SERS active substrate (Fe3O4/Au–AOA), and Rhodamine B (RhB) conjugated AOA as a Raman reporter (AOA–RhB). Upon mixing the reagents with melamine, a supramolecular complex [Fe3O4/Au–AOA•••melamine•••AOA–RhB] was formed due to the strong multiple hydrogen bonding interactions between AOA and melamine. The complex was separated and concentrated to a pellet by an external magnet and used as a supramolecular matrix for the melamine detection. Laser excitation of the complex pellet produced a strong SERS signal diagnostic for RhB. The logarithmic intensity of the characteristic RhB peaks was found to be proportional to the concentration of melamine with a limit of detection of 2.5 µg/mL and a detection linearity range of 2.5~15.0 µg/mL in milk. As Fe3O4 nanoparticles and AOA are thousands of times less expensive than the monoclonal antibody used in a traditional sandwich immunoassay, the current assay drastically cut down the cost of melamine detection. The current approach affords promise as a biosensor platform that cuts down sample pre-treatment steps and measurement expense.

1. Introduction

Melamine is a common industrial chemical and has been widely used to manufacture thermoset plastics, coating materials, flame retardants, wood adhesives, glues, and many other applications. The chemical became a global concern in 2008 because a high amount of melamine had been illegally added to pet food and even infant milk formula in China [1,2]. The long-term ingestion of melamine may cause severe damages like kidney stones [3], bladder stones [4,5], and even bladder cancer [6,7]. Under the effect of gastric juice, part of melamine may transfer into cyanuric acid and react with the remaining melamine to produce insoluble crystals of melamine cyanurate, which induce renal malfunction, metabolic problems of the urinary system [8], or even death in infants. For both health and social reasons, there remains an urgent need for a rapid, on-site, sensitive, and cost-effective analysis of melamine.
The current detection methods for melamine analysis primarily include high performance liquid chromatography (HPLC), liquid chromatography-mass spectrometry (LC-MS), gas chromatography-mass spectrometry (GC-MS), enzyme-linked immunosorbent assay (ELISA), infrared spectrometry (IR), and surface enhanced Raman spectroscopy (SERS) [9,10,11]. Though HPLC is a powerful method of high sensitivity and selectivity to determine melamine, its complicated and time-consuming pretreatment of samples brings much inconvenience for on-site rapid detection [12]. LC-MS or GC-MS requires expensive equipment, complicated operations, professional skills, and high test costs, and thus is suitable for laboratory testing only [13]. IR has a fast detection speed, less sample consumption, and high operability, but it is less sensitive and less accurate in quantitative analysis. ELISA is easy to carry out and its short analysis time makes it possible for mass screening, but ELISA often gives false positive results and thus is difficult to achieve a rapid onsite determination of melamine [14].
The phenomenon of SERS was first observed by Fleischmann and coworkers in 1974 [15]. Van Duyne and Jeanmaire [16] later found that the Raman scattering signal of pyridine on the rough surface of silver electrodes was about 106 times higher than the same amount of pyridine in solution. Under ideal conditions, SERS is able to detect a single molecule of the detected analytes [17]. Rough gold or silver surfaces as well as gold or silver nanoparticles are generally used as Raman active substrates due to their high surface enhanced Raman scattering effect [18]. With the help of a portable spectrometer, SERS can provide simple, rapid, and on-site analysis due to its inherent simplicity and high sensitivity and thus has been developed as a fast detection platform for biothreat investigation [19], DNA and RNA identification [20,21,22], cancer-diagnostics [23], protein immunoassay [24,25,26,27,28], and food safety analysis [29,30,31,32,33,34,35,36,37]. For example, SERS has been explored to detect melamine in milk using hollow gold chips or other SERS active substrates fabricated on glass or silicon wafers [32,33,34] and using melamine-induced aggregation of gold nanoparticles as an enhanced substrate [35]. Printed SERS substrates combined with paper chromatograph have been successfully applied in the direct detection of melamine in proteinaceous samples [38]. Melamine has been directly detected in infant formula with a limit of detection of 100 ppb using commercial gold nanofinger SERS sensor chips [10] and has also been detected in pure water with a limit of detection of 1 ppb using ultrasensitive Ag nanoparticles over Au film coated on PS colloid monolayer as a substrate [39]. However, these direct detections of melamine by SERS may not be applicable to other complex samples in practice such as blood, urine, pet foods, and fertilizers. For example, the serum amino acid (e.g., methionine) [40] and serum vitamins (e.g., folic acid) [41] show Raman characteristic peaks around 690 cm−1, which overlap the signature peak of melamine at 695 cm−1 [38] and thus may cause severe interference in the detection of melamine in blood samples.
Herein, in this work, we propose an indirect detection approach based on a novel, magnetic, supramolecular hydrogen bonding-assisted SERS-active matrix and use it for the rapid onsite detection of melamine. Melamine has been found to form stable complexes with cyanuric acid, orotic acid, and their derivatives via strong supramolecular multiple hydrogen bonds [42,43,44]. Accordingly, gold nanoparticles (Au NPs) were first assembled on the surface of Fe3O4 nanoparticles to form Fe3O4/Au magnetic nanoparticles and then coated with 5-aminoorotic acid (AOA) to produce a magnetic gold nanoparticle substrate (Fe3O4/Au–AOA), while Rhodamine B (RhB) was conjugated with AOA to generate a highly sensitive Raman reporter (AOA–RhB), as illustrated in Figure 1. The substrate combined the high SERS effects of gold nanoparticles and the magnetic properties of Fe3O4 nanoparticles. Upon mixing the reagents with melamine, a magnetic supramolecular complex [Fe3O4/Au–AOA•••melamine•••AOA–RhB] was formed due to the strong multiple hydrogen bonding interaction between AOA and melamine. The complex was subsequently separated and concentrated to a pellet point by an external magnet, followed by a laser excitation of the pellet to provide strong SERS signals of RhB. The concentration of melamine was quantitatively determined by the intensity of RhB signals. The synthesis and characterization of gold magnetic nanoparticles Fe3O4/Au, as well as the RhB-conjugated Raman reporter, the limit of detection of melamine, and the detection linear range, were investigated in this work.

2. Materials and Methods

2.1. Instruments and Reagents

The morphology of prepared Fe3O4/Au nanoparticles was observed on a transmission electron microscope (TEM, Tecnai G2 F30 S-Twin, FEI Company, Hillsboro, OR, USA) equipped with an energy dispersive X-ray (EDX) analyzer (JEOL 4000FX), operating at an acceleration voltage of 300 keV. SERS spectra were recorded on a DeltaNu Advantage 785 Raman spectrometer equipped with a microscope and a stage-sample holder. The spectrometer has a laser power of 120 mW with an excitation wavelength at 785 nm and a spectral range of 200–2000 cm−1. Fourier transform infrared spectroscopy (FTIR) analysis was conducted on a Shimadzu IRaffinity-1S spectrometer equipped with a Specac ATR attachment containing a ZnSe crystal (refractive index n = 2.43). The transmission and reflectance spectra were recorded in the range from 4000 to 600 cm−1 with a resolution of 2 cm−1.
Fe3O4 nanoparticles (97%, 50–100 nm) and Rhodamine B isothiocyanate (mixed isomers, C29H30ClN3O3S) were purchased from Sigma-Aldrich (St. Louis, MO, USA). Gold chloride acid hydrate (HAuCl4·4H2O, 99%) was purchased from Shanghai Siyu Chemical Technology limited Company (Shanghai, China). Melamine (99%), 5-aminoorotic acid (AOA, 98%), γ-mercaptopropyl triethoxysilane (MPTES, 98%) (3-aminopropyl) triethoxysilane (APTES, 99%), tetraethoxysilane (TEOS, 99%), and hydrated sodium citrate (99%) were purchased from Aladdin. Dialysis membrane (Spectra/Por, MWCO = 1000) was bought from Spectrum Laboratories Inc. (Rancho Dominguez, CA, USA). The active ester polyethylene glycolthiol (≥95%, NHS-PEG-SH, MW = 1000) was obtained from Shanghai Tuoyang Biological Technology Limited Company (Shanghai, China). Sodium dihydrogen phosphate (NaH2PO4·2H2O), disodium hydrogen phosphate (Na2HPO4·H2O), and all other chemicals were of analytical grade and purchased from Hangzhou Chemical Reagent limited company (Hangzhou, China).

2.2. Synthesis of Fe3O4/Au Gold Magnetic Nanoparticles

The modification of Fe3O4 nanoparticles was based on a literature method [45]. Briefly, 25.0 mg of Fe3O4 nanoparticles were dispersed in a mixture of 10.0 mL of distilled water, 50 mL of ethanol, and 0.5 mL of ammonia. After the mixture was ultrasonicated for 5 min, 40.0 µL of TEOS was added and the mixture was subjected to ultrasonic oscillation at room temperature for 6 h. Then, the nanoparticles were separated and collected with a magnet, washed with distilled water and ethanol respectively, and redispersed in 50.0 mL of ethanol. Exactly 20 µL of APTES and 20.0 µL of MPTES were added to the ethanol solution, and the solution was treated with ultrasonic oscillation at room temperature for 18 h. Magnetic Fe3O4 nanoparticles coated with –NH2 and –SH groups were collected with a magnet, washed with distilled water and ethanol retrospectively, and finally redispersed in 10.0 mL distilled water for later use.
According to the method of Frens [46], sodium citrate was used as a reducing agent to synthesize gold nanoparticles. Fifty milliliters of distilled water was heated to boiling, and 10.0 mg of chloroauric acid hydrate was added to the water under stirring. Then, 50.0 µL of sodium citrate solution (5%) was added to the water solution, and the solution was kept boiling and stirring for 1 min. After the solution cooled down to room temperature, Au nanoparticles were obtained and stored in a fridge at 4 °C for later use.
Exactly 10.0 mL of the modified Fe3O4 nanoparticle solution above was mixed with 10.0 mL of gold nanoparticle solution, and the mixture was mechanically stirred at room temperature for 4 h. Then, the Fe3O4/Au gold magnetic nanoparticles were separated by a magnet, washed with distilled water, and finally redispersed in 10.0 mL of distilled water.

2.3. Synthesis of AOA-Coated Gold Magnetic Nanoparticles (Fe3O4/Au–AOA)

Exactly 50.0 mg of 5-aminoorotic acid (AOA) was dissolved in 10.0 mL of phosphate buffer solution (PBS, pH = 7.4) and 100.0 mg of NHS-PEG-SH was added to the PBS solution. The solution was stirred at room temperature for 6 h and then dialyzed against fresh PBS solution to remove the excess of AOA, followed by the addition of 10.0 mL of the above-mentioned Fe3O4/Au gold magnetic nanoparticle solution. After the mixture was stirred at room temperature for 24 h, the gold magnetic nanoparticles (Fe3O4/Au–AOA) were separated and concentrated by a magnet, washed with distilled water, and finally redispersed in 10.0 mL of distilled water.

2.4. Synthesis of RhB-Conjugated AOA (AOA–RhB)

Exactly 10.0 mg of Rhodamine B isothiocyanate and 2.9 mg 5-aminoorotic acid were dissolved in 1.0 mL of N,N-dimethylformamide (DMF). The solution was stirred at room temperature for 24 h and then dialyzed against water to remove the excess of Rhodamine B and finally obtain AOA–RhB.

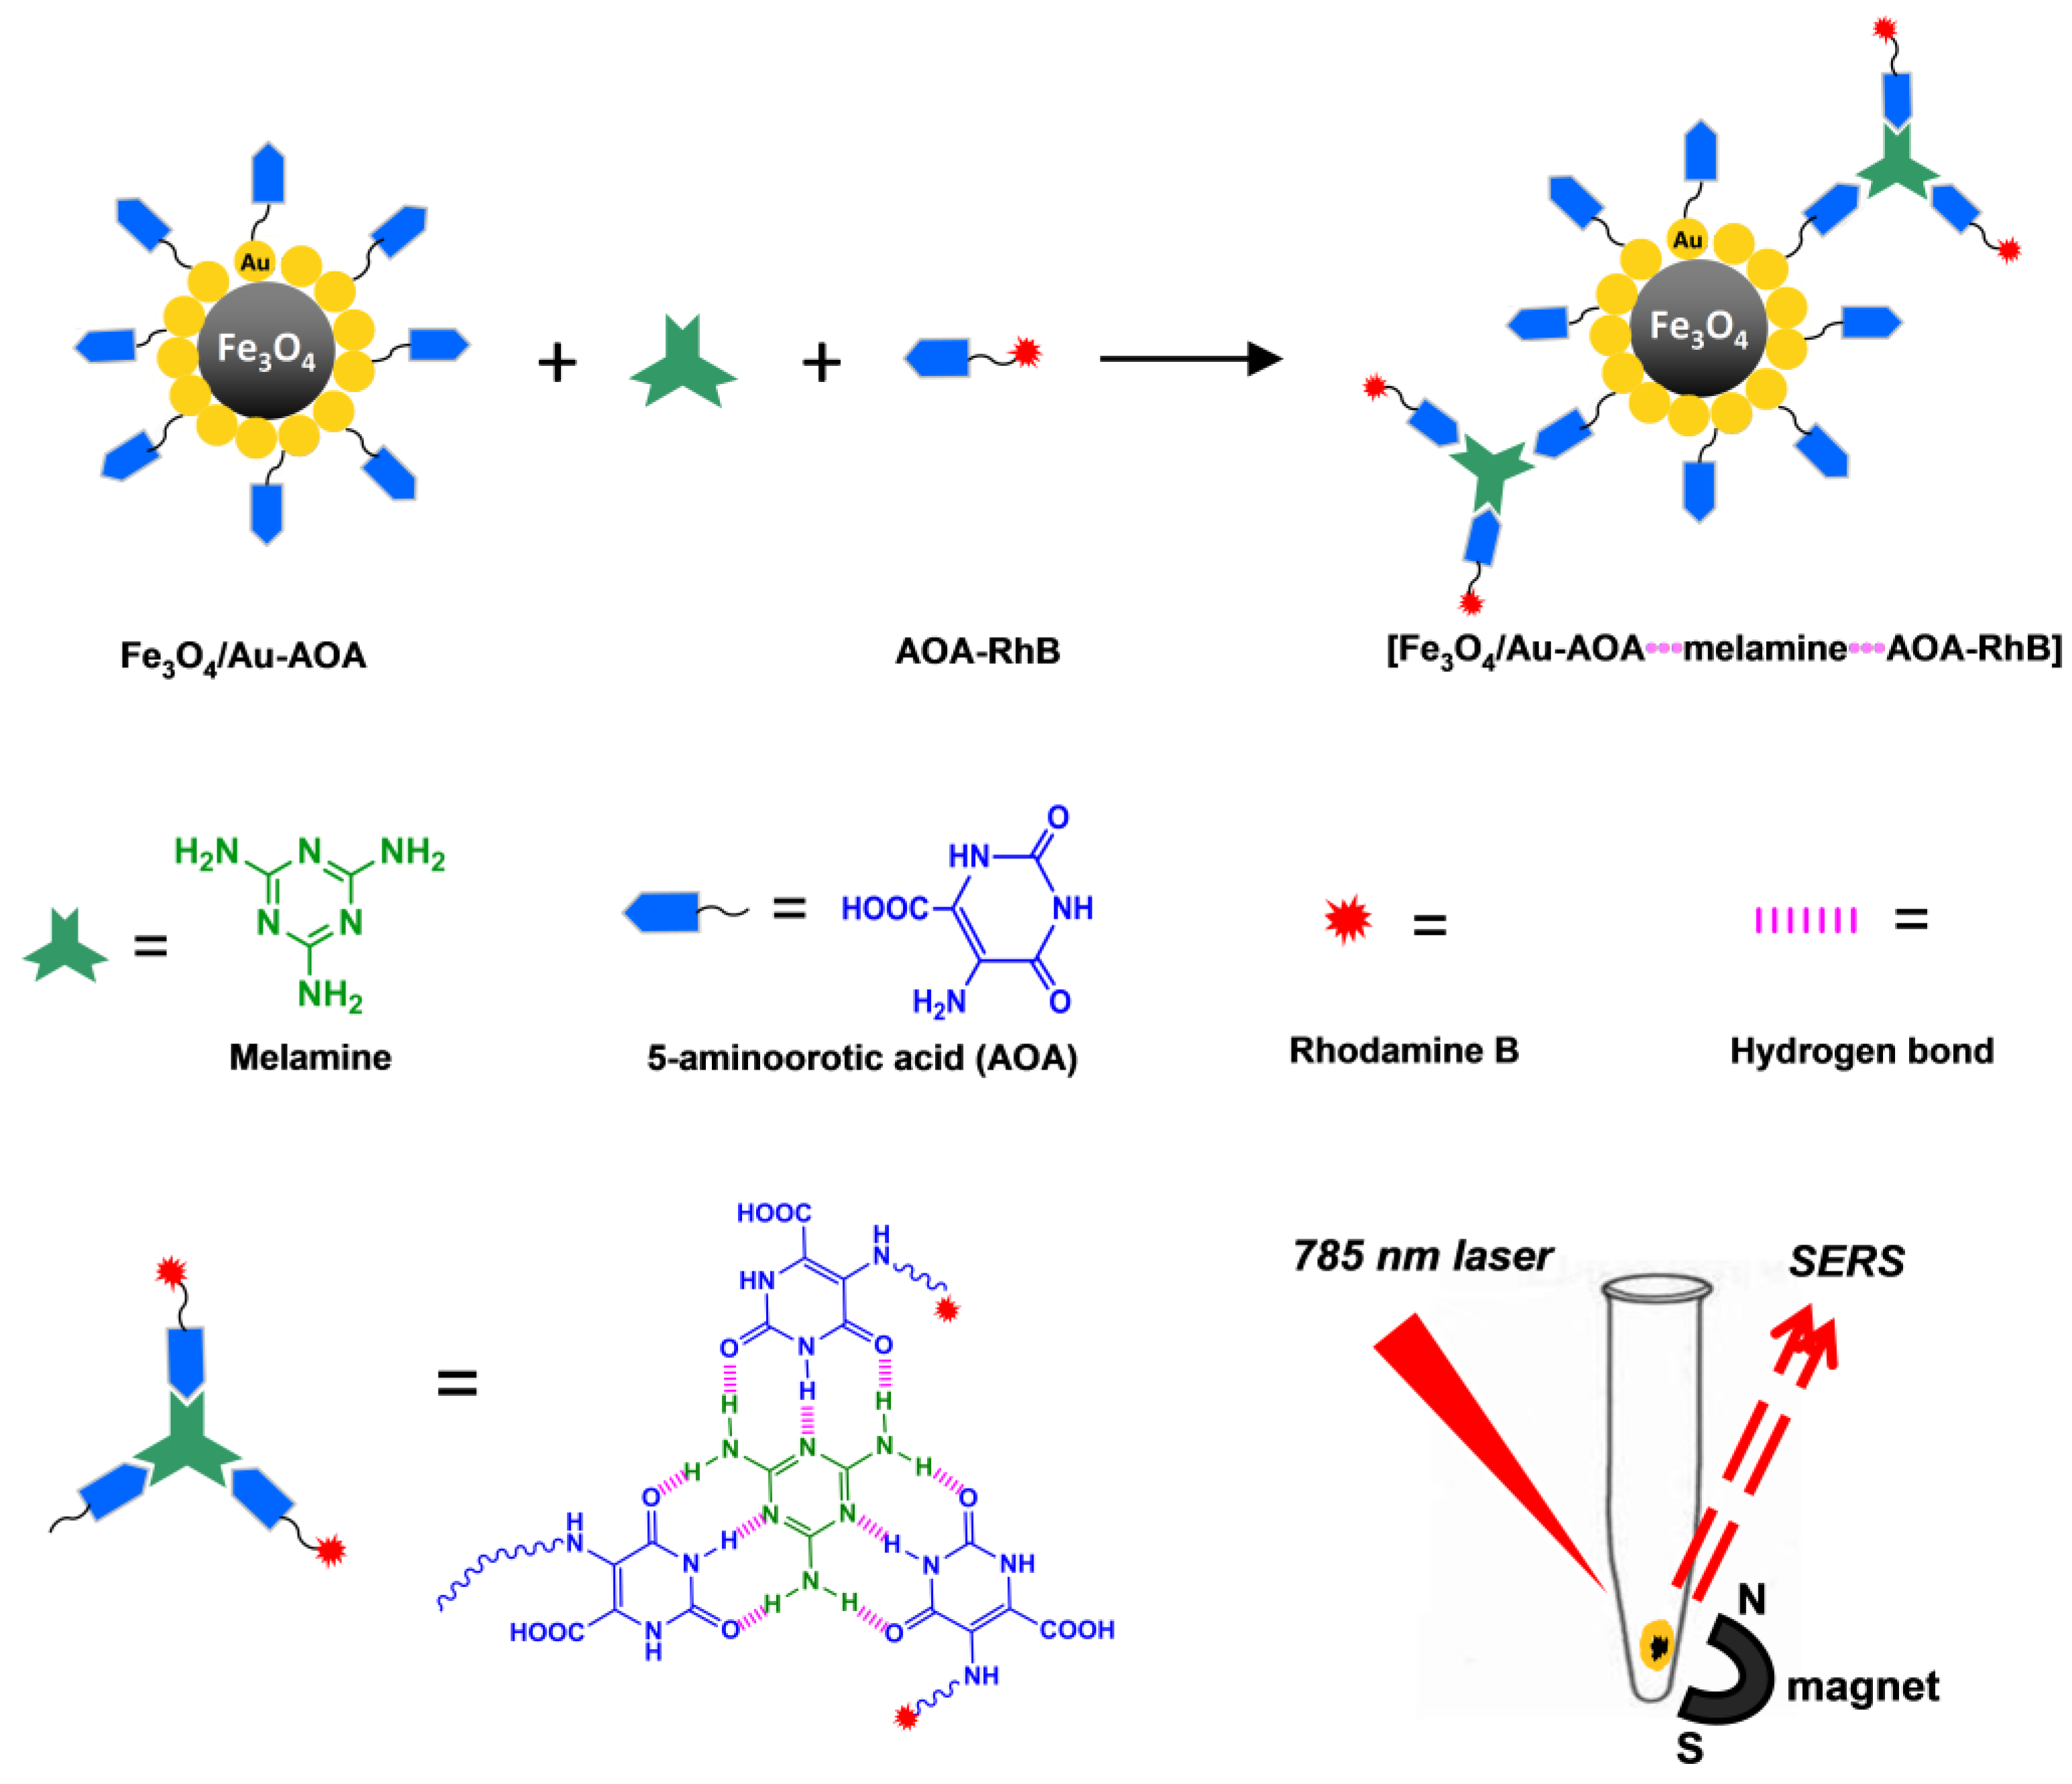
2.5. Detection of Melamine in Water Using [Fe3O4/Au–AOA•••Melamine•••AOA–RhB] as a Matrix

A melamine stock solution was prepared by accurately dissolving 1.0 mg of melamine in 10.0 mL of water. The gold magnetic nanoparticle (Fe3O4/Au–AOA) and the RhB-conjugated AOA (AOA–RhB) solution were prepared at concentrations of 2.5 and 0.1 mg/mL, respectively. Aliquots of the melamine stock solution above were added to the mixture of 0.1 mL of Fe3O4/Au–AOA and 0.1 mL of AOA–RhB solution to make a series of solutions, respectively containing 1.0 µg/mL, 2.5 µg/mL, 5.0 µg/mL, 10.0 µg/mL, and 15.0 µg/mL of melamine. These solutions were oscillated at room temperature for 30 min and then transferred to concave glass slides with pipettes. A strong NdFeB cylinder magnet (10 mm in diameter, 3 mm in thickness, Jiangdong Magnetic Industry of Ningbo Co. Ltd., Ningbo, China) was placed under each slide to separate and concentrate the gold magnetic nanoparticles to a pellet point. The laser irradiation of the pellets produced Raman spectra of RhB and its characteristic peak at 1510 cm−1 was analyzed to build the calibration curve for melamine since the peaks between 1200 and 1400 cm−1 were prone to interference with the glass background of slides [47]. Each recorded spectrum is an average of five independent readings taken at an integration time of 1 s. The total analysis time can be less than 1 h.

2.6. Detection of Melamine in Milk Using [Fe3O4/Au–AOA•••Melamine•••AOA–RhB] as a Matrix

The gold magnetic nanoparticle (Fe3O4/Au–AOA) and the RhB-conjugated AOA (AOA–RhB) solution were prepared at a concentration of 4.0 and 0.5 mg/mL, respectively. A melamine stock solution was prepared by accurately dissolving 10.0 mg of melamine in 10.0 mL of ethanol/H2O 50:50 (v/v). Aliquots of the melamine stock solution above were added into 0.2 mL of milk. Then, the milk solution was mixed with 0.1 mL of Fe3O4/Au–AOA and 0.1 mL of AOA–RhB solution to make a series of solutions, respectively containing 2.0, 2.5, 5.0, 10.0, and 15.0 µg/mL of melamine. These solutions were oscillated at room temperature for 30 min and then transferred to concave glass slides with pipettes. A strong NdFeB cylinder magnet (10 mm in diameter, 3 mm in thickness, Jiangdong Magnetic Industry of Ningbo Co. Ltd, Ningbo, China) was placed under each slide to separate and concentrate the gold magnetic nanoparticles into a pellet point. The supernatant was removed by a filter paper. The laser irradiation of the pellets produced Raman spectra of RhB, and its characteristic peak at 1510 cm−1 was analyzed to build the calibration curve of melamine. Each recorded spectrum is an average of five independent readings taken at an integration time of 1 s. The total analysis time can be less than 1 h.

3. Results and Discussion

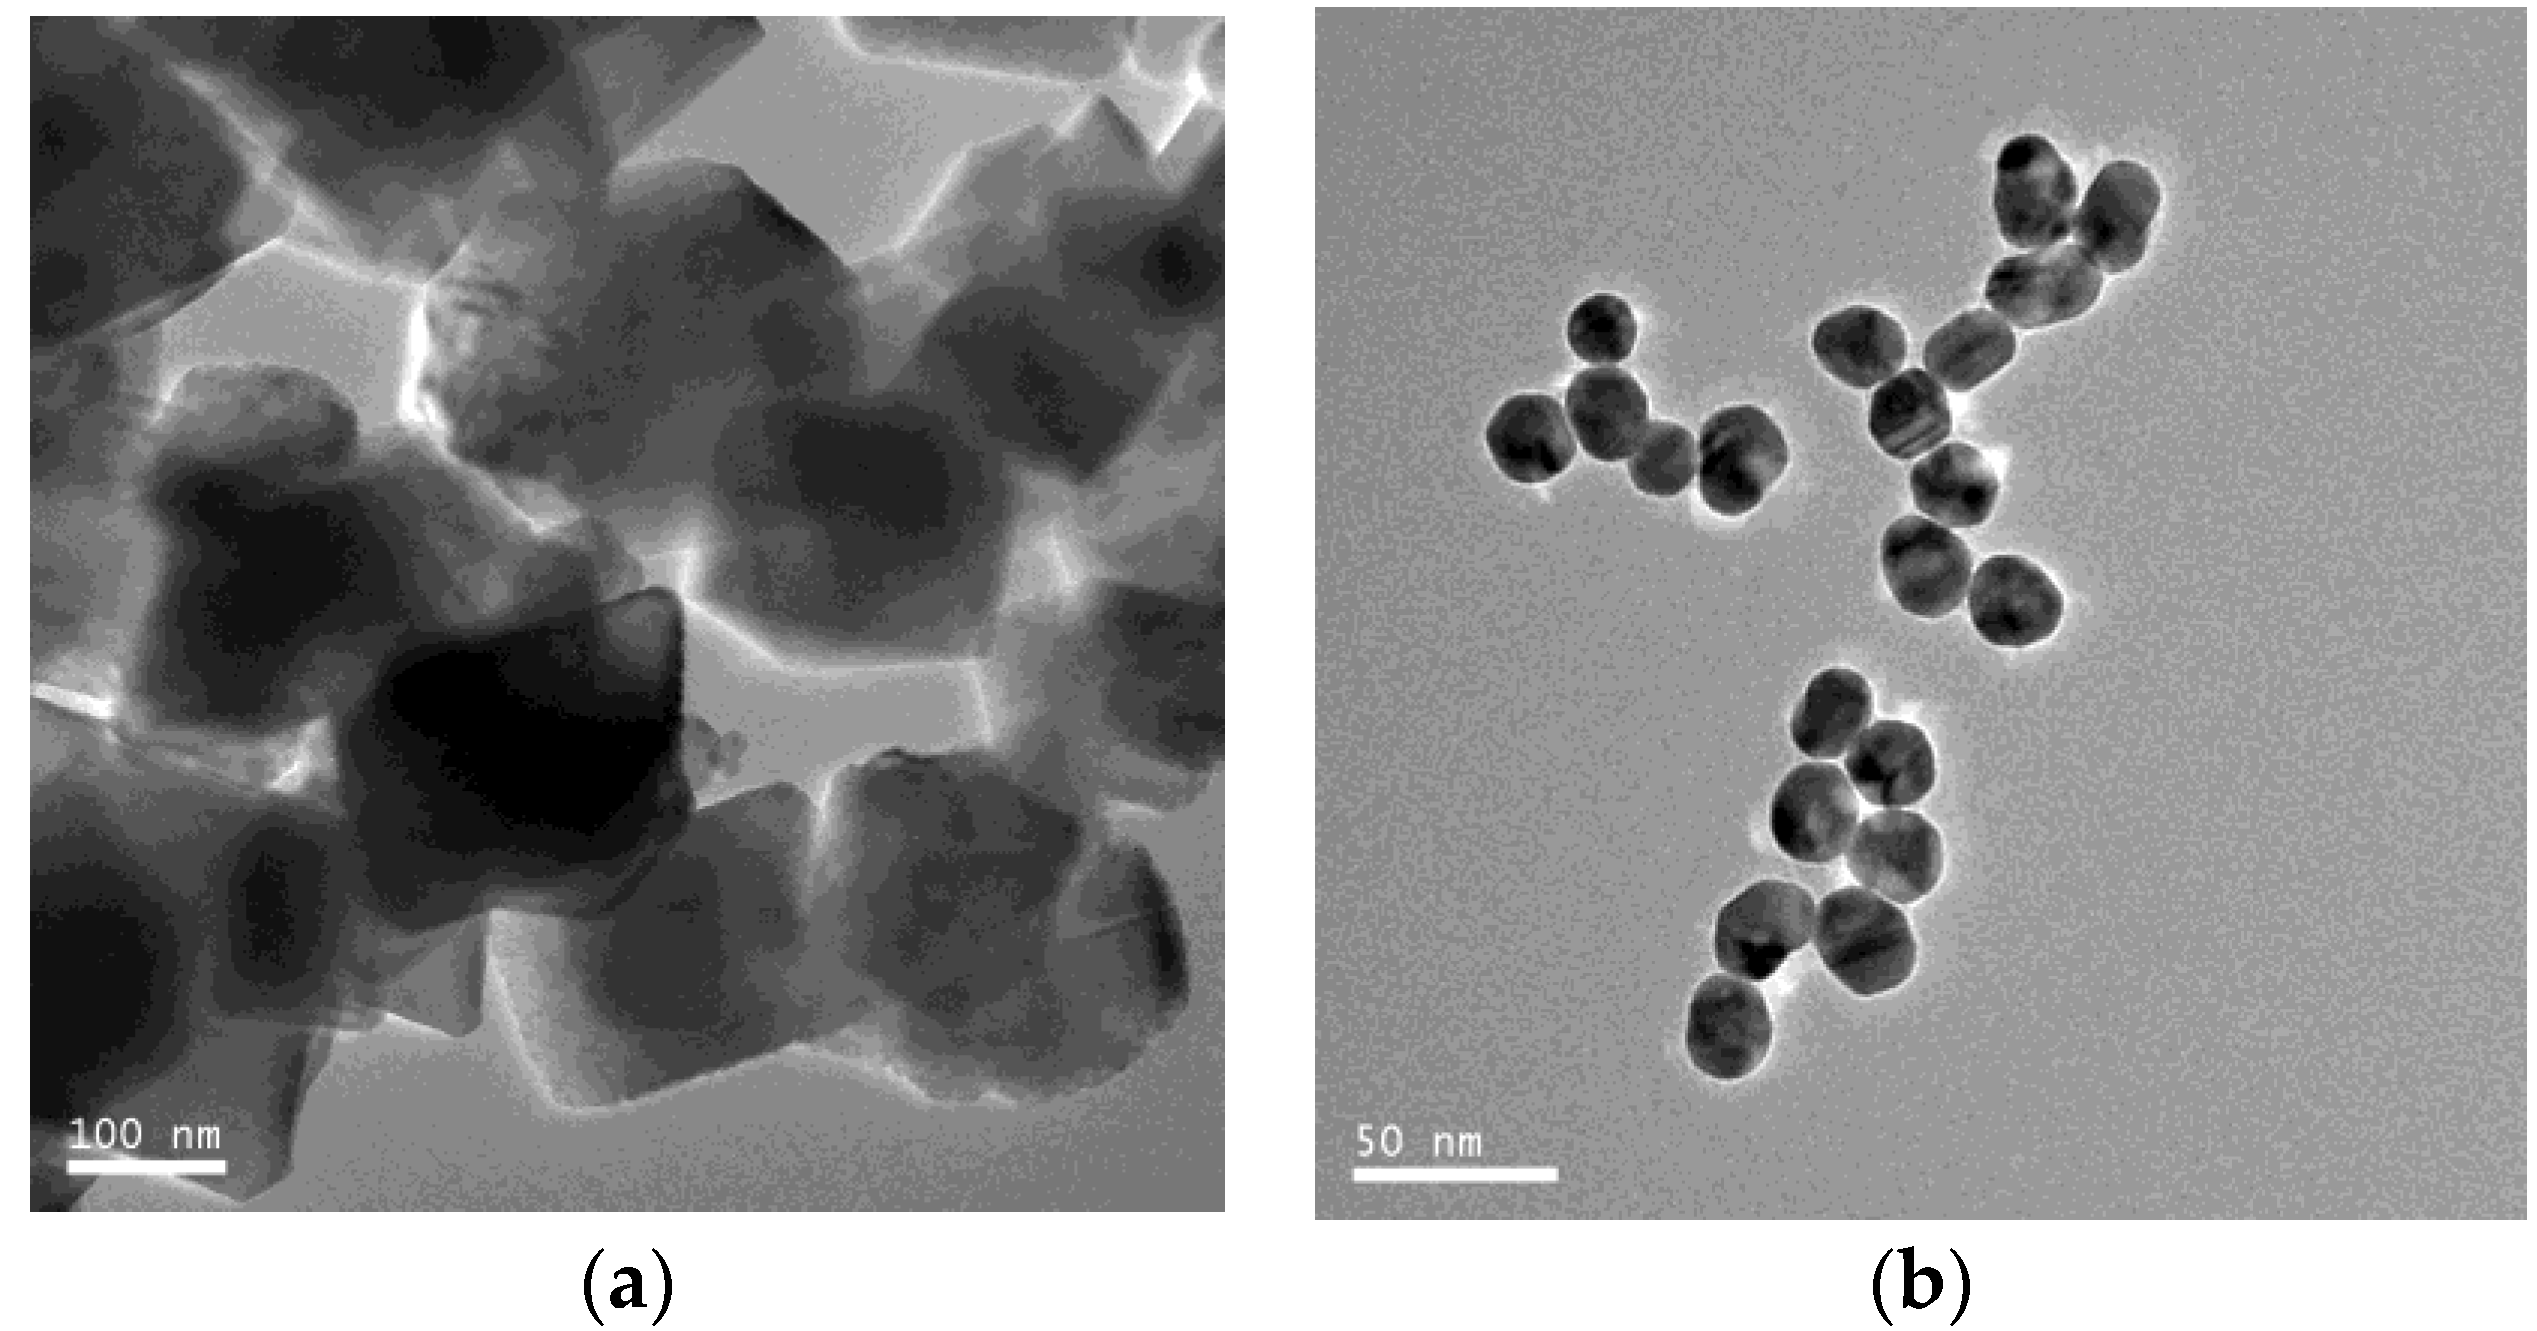
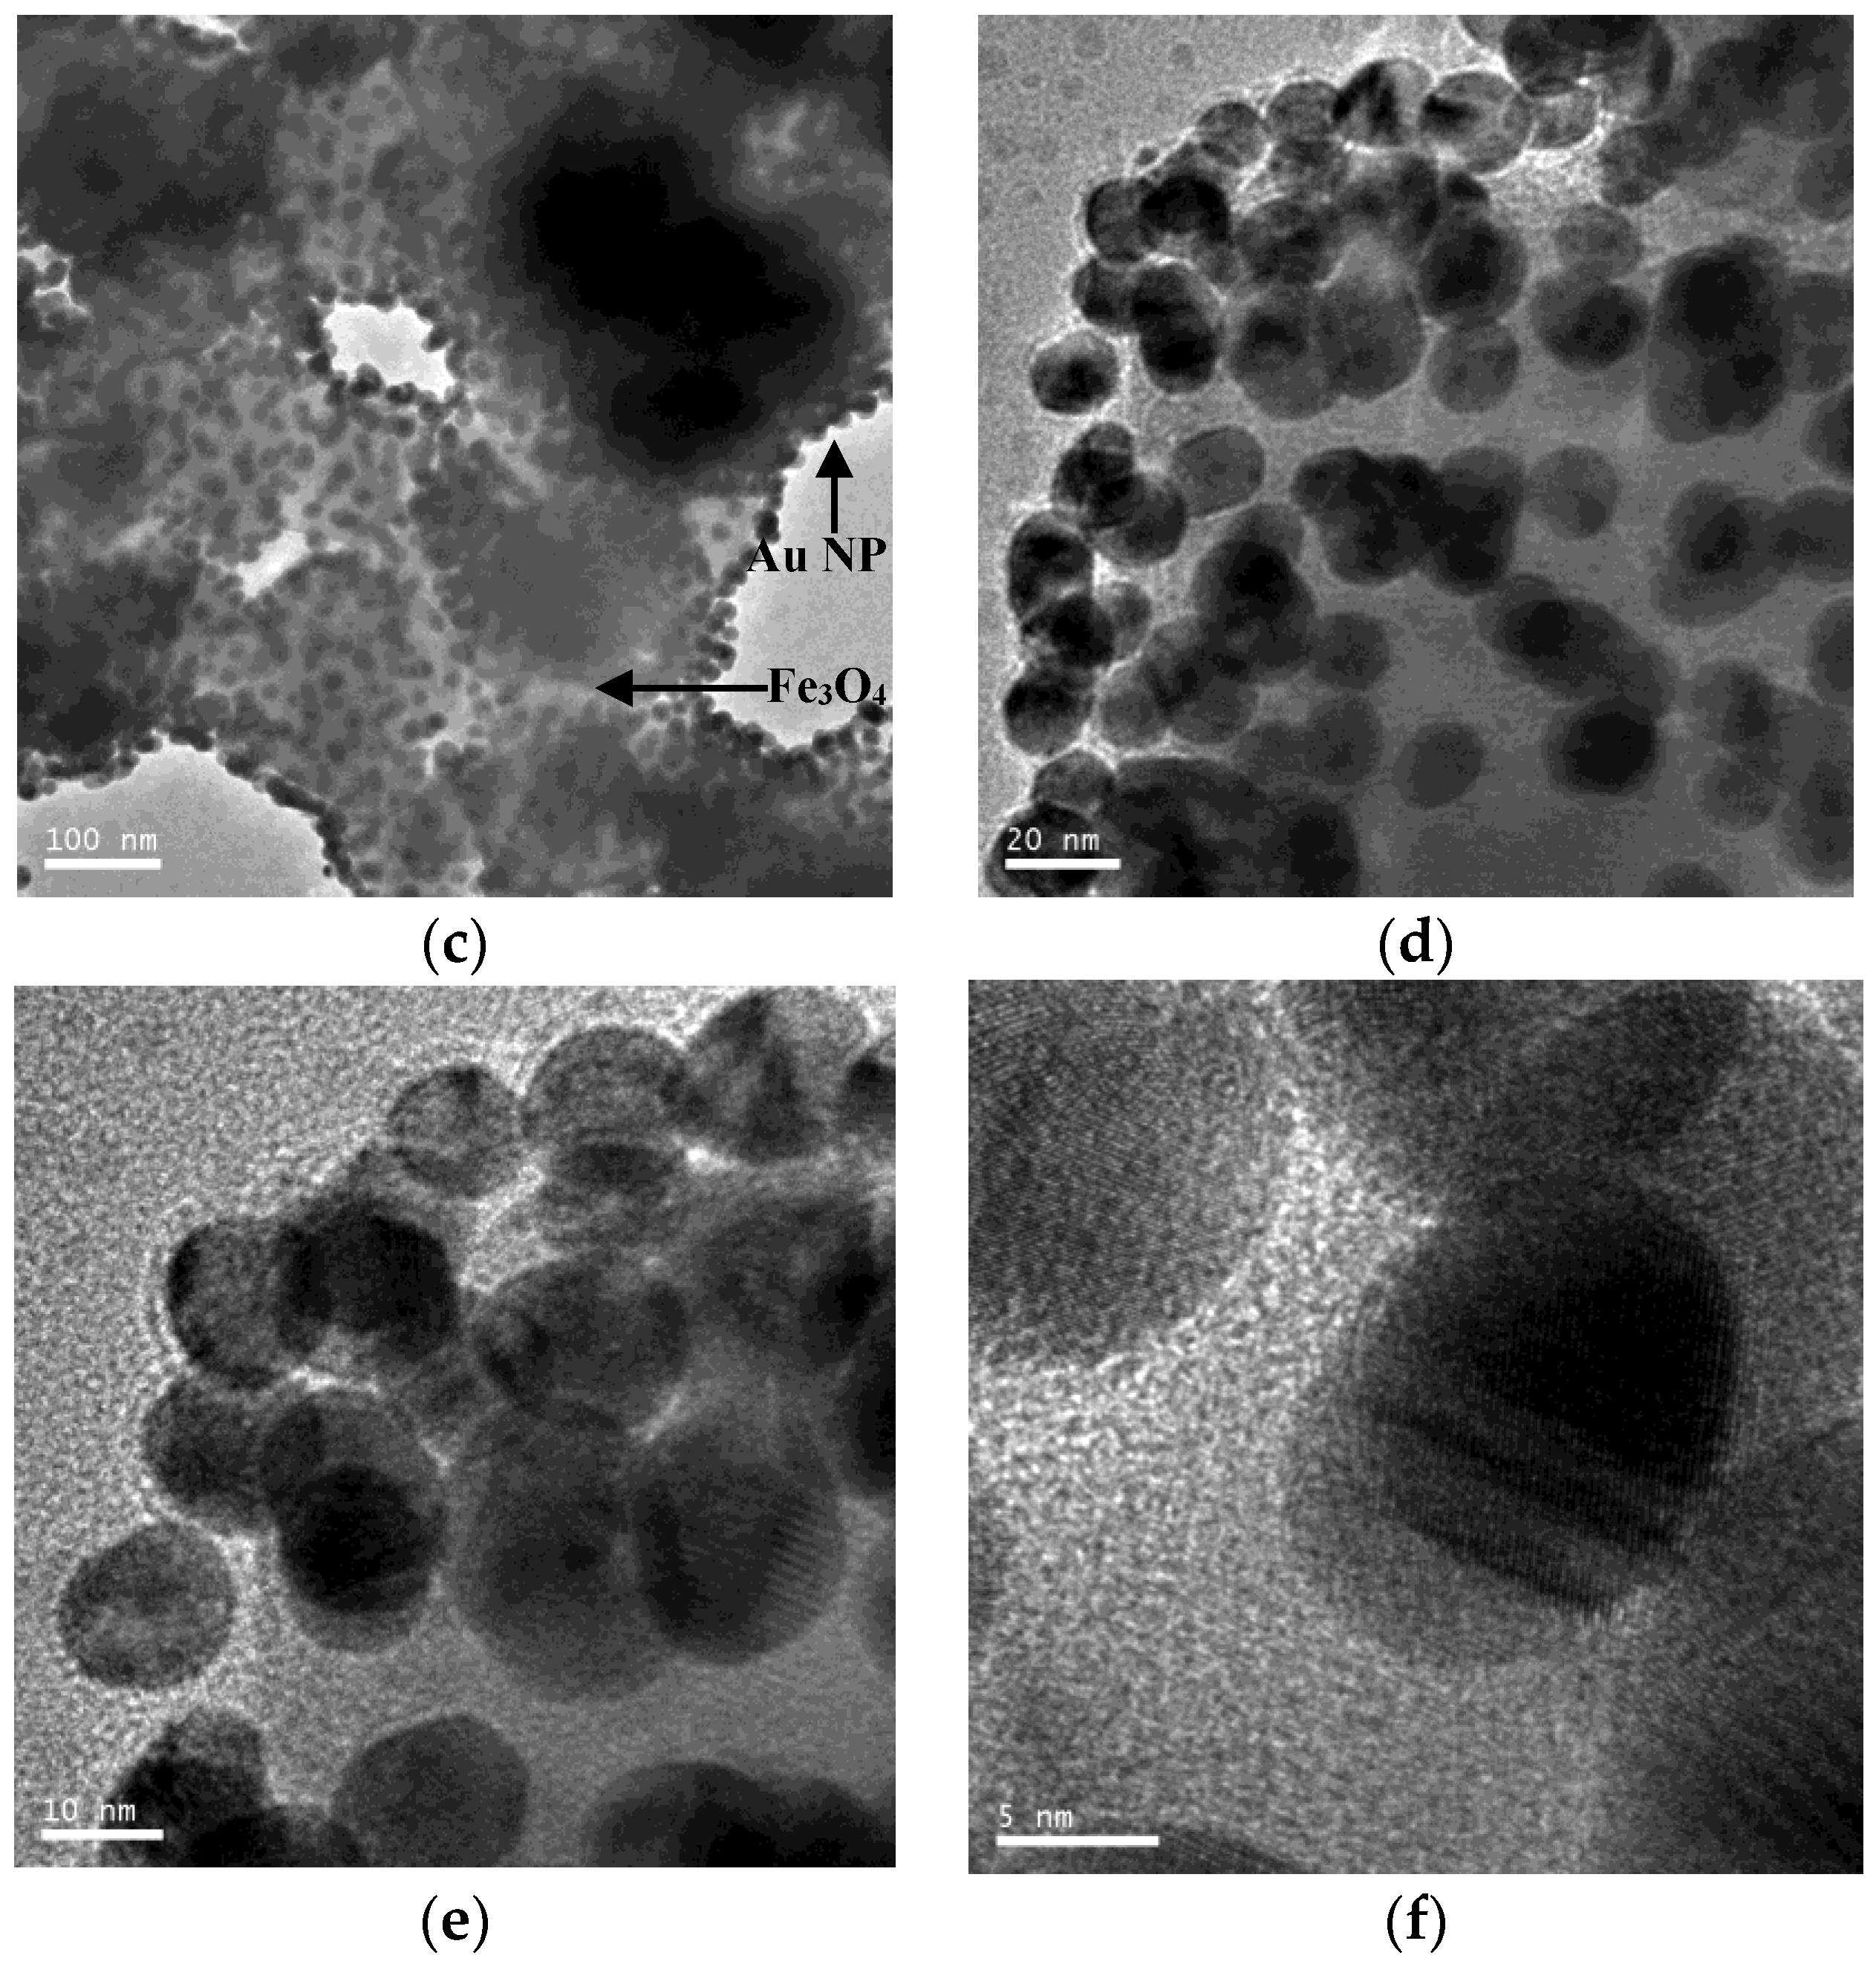
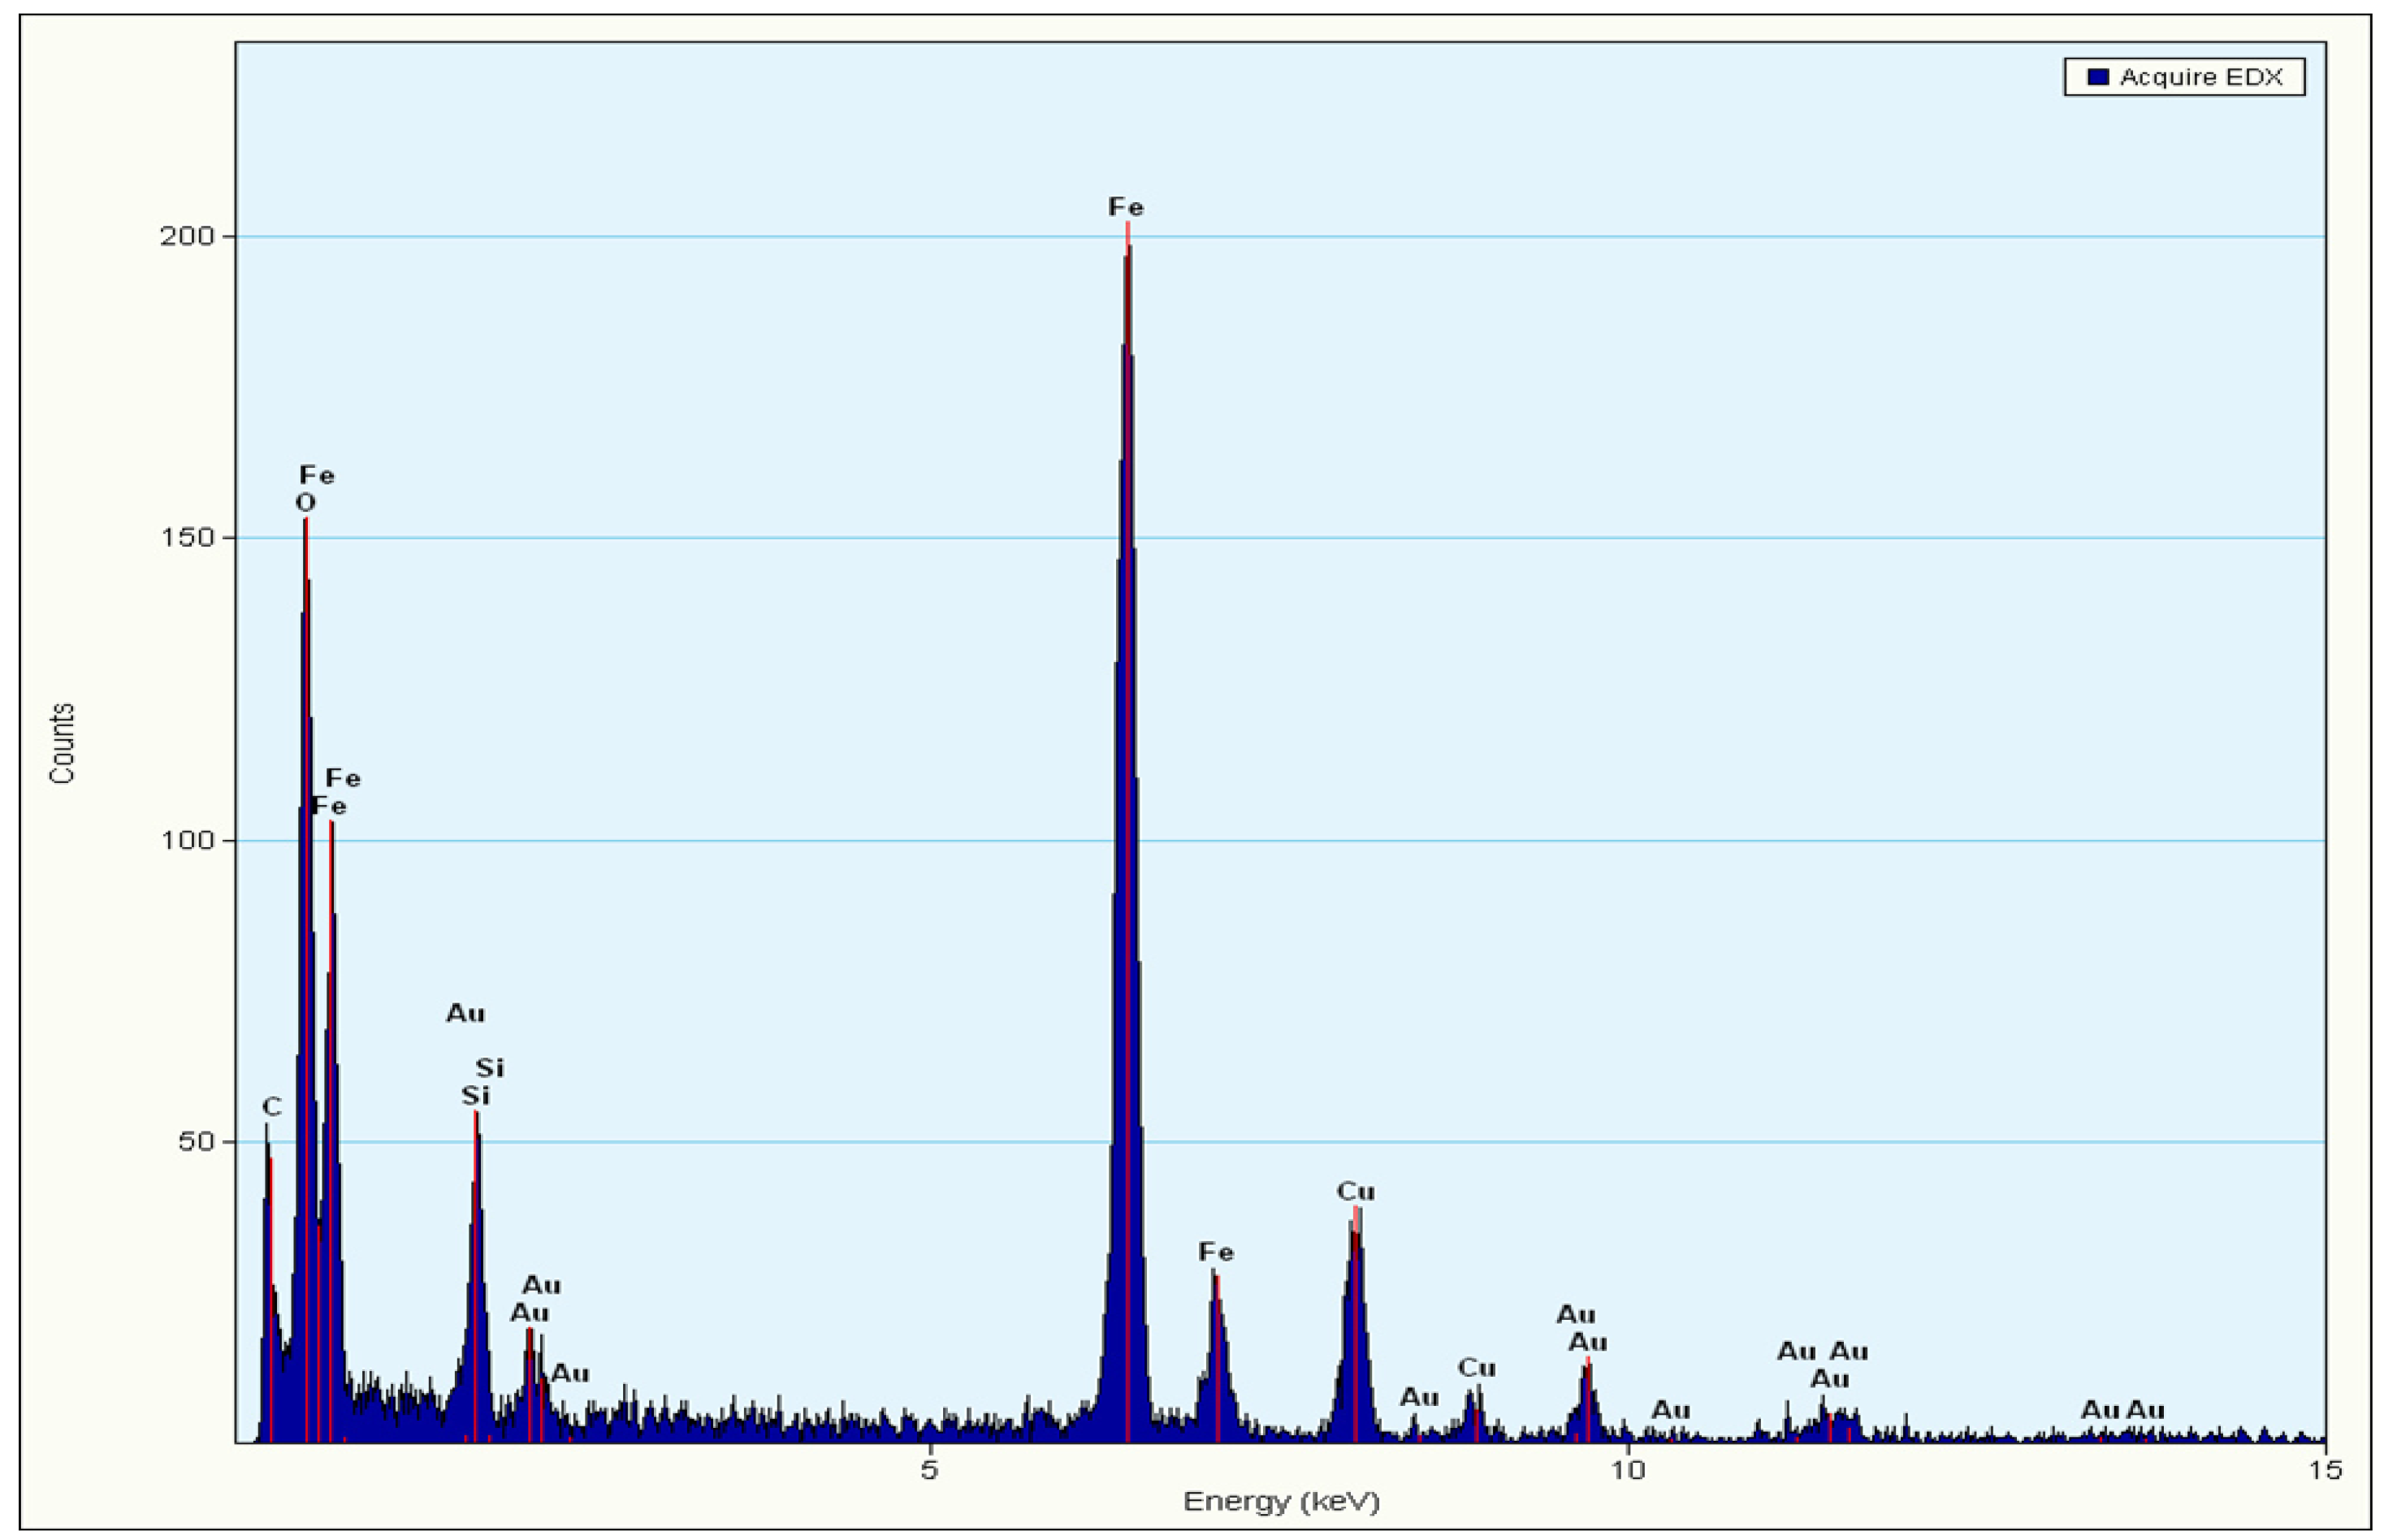
3.1. Characteristics of Fe3O4/Au Gold Magnetic Nanoparticles by TEM and EDX

TEM images of Fe3O4 nanoparticles, Au nanoparticles and Fe3O4/Au gold magnetic nanoparticles at various resolutions are shown in Figure 2 and the corresponding EDX spectrum of Fe3O4/Au is presented in Figure 3. The Fe3O4 nanoparticles were in cubic shape and the particle size was in the range of 100–200 nm (Figure 2a) and the spherical or oval Au nanoparticles had a relatively narrow size distribution with a diameter ranging from 10 to 20 nm (Figure 2b). Figure 2c demonstrates the structure of Fe3O4/Au gold magnetic nanoparticles. Obviously, the cubic Fe3O4 nanoparticles were densely covered by a layer of spherical Au nanoparticles. At higher resolutions, the Au nanoparticles were found to closely attach on the surface of Fe3O4 nanoparticle (Figure 2d,e). Figure 2f clearly shows the crystal lattice fringes of Au nanoparticles and Fe3O4 nanoparticles. The EDX spectrum (Figure 3) of the gold magnetic nanoparticles shows Au signal peaks and Fe signal peaks from Au nanoparticles and Fe3O4 nanoparticles, respectively, as well as C peaks and Cu peaks from the ultrathin carbon-coated copper grids. These results indicated the formation of Fe3O4/Au gold magnetic nanoparticles.

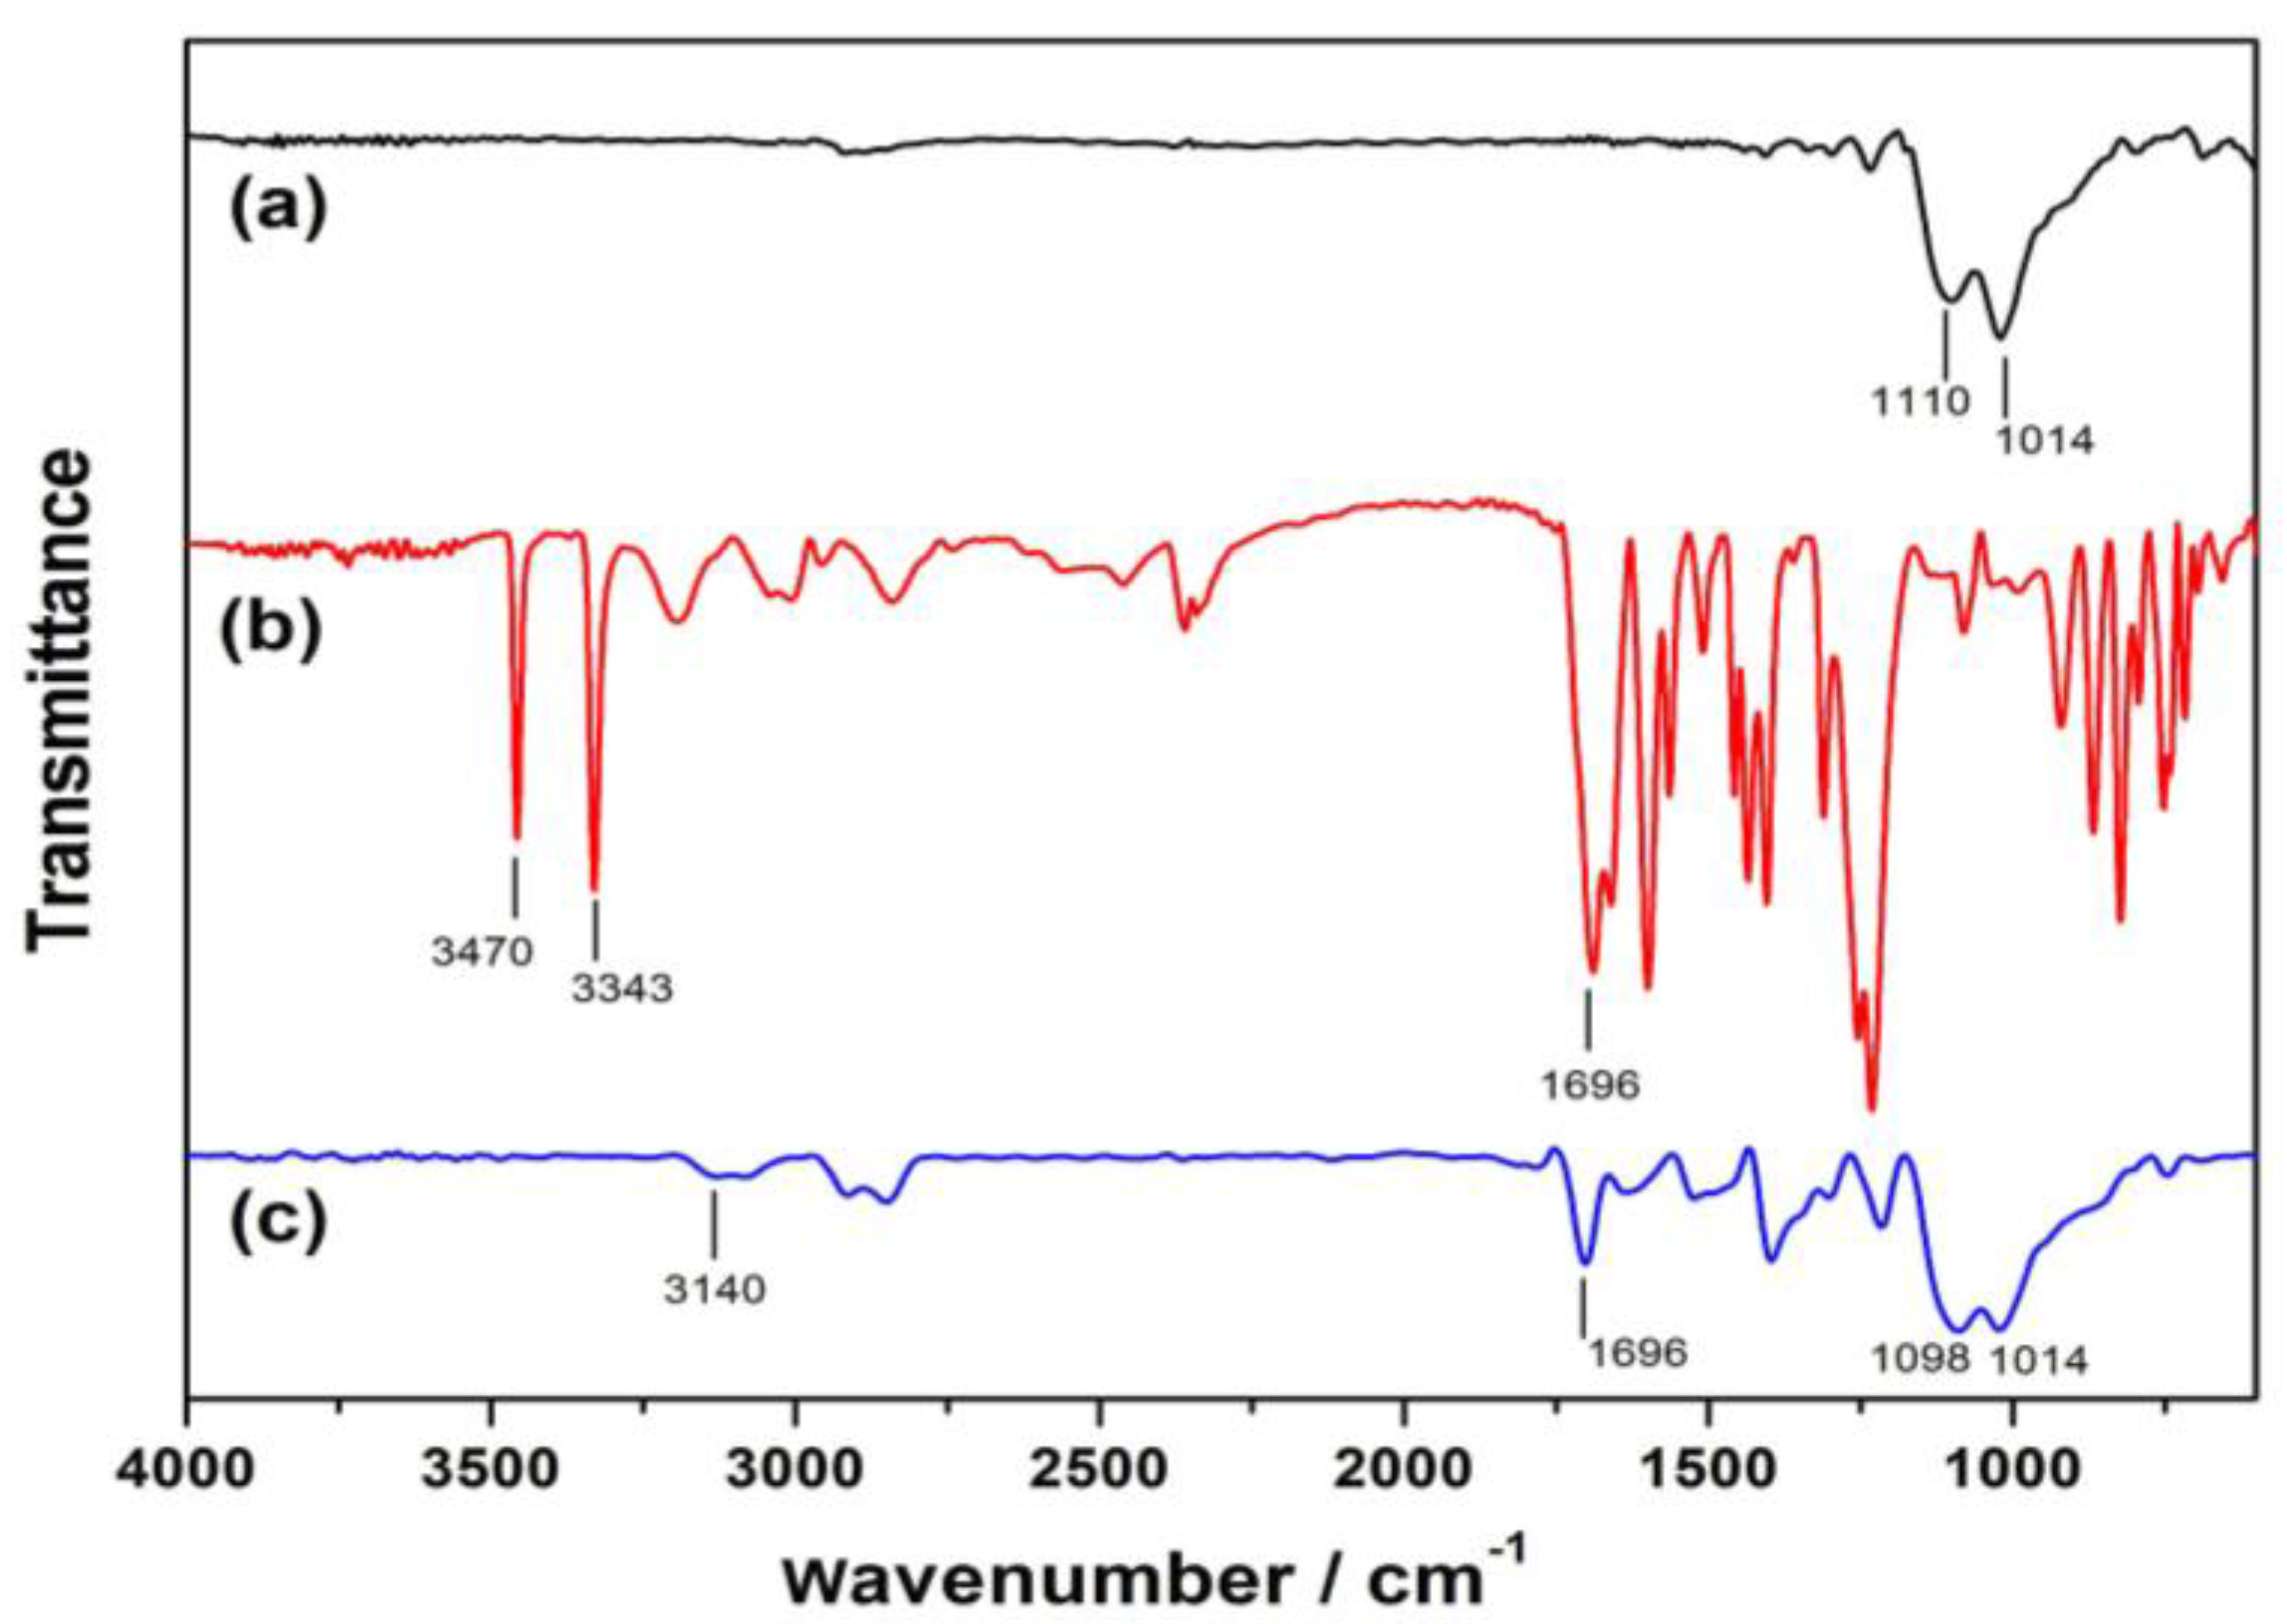
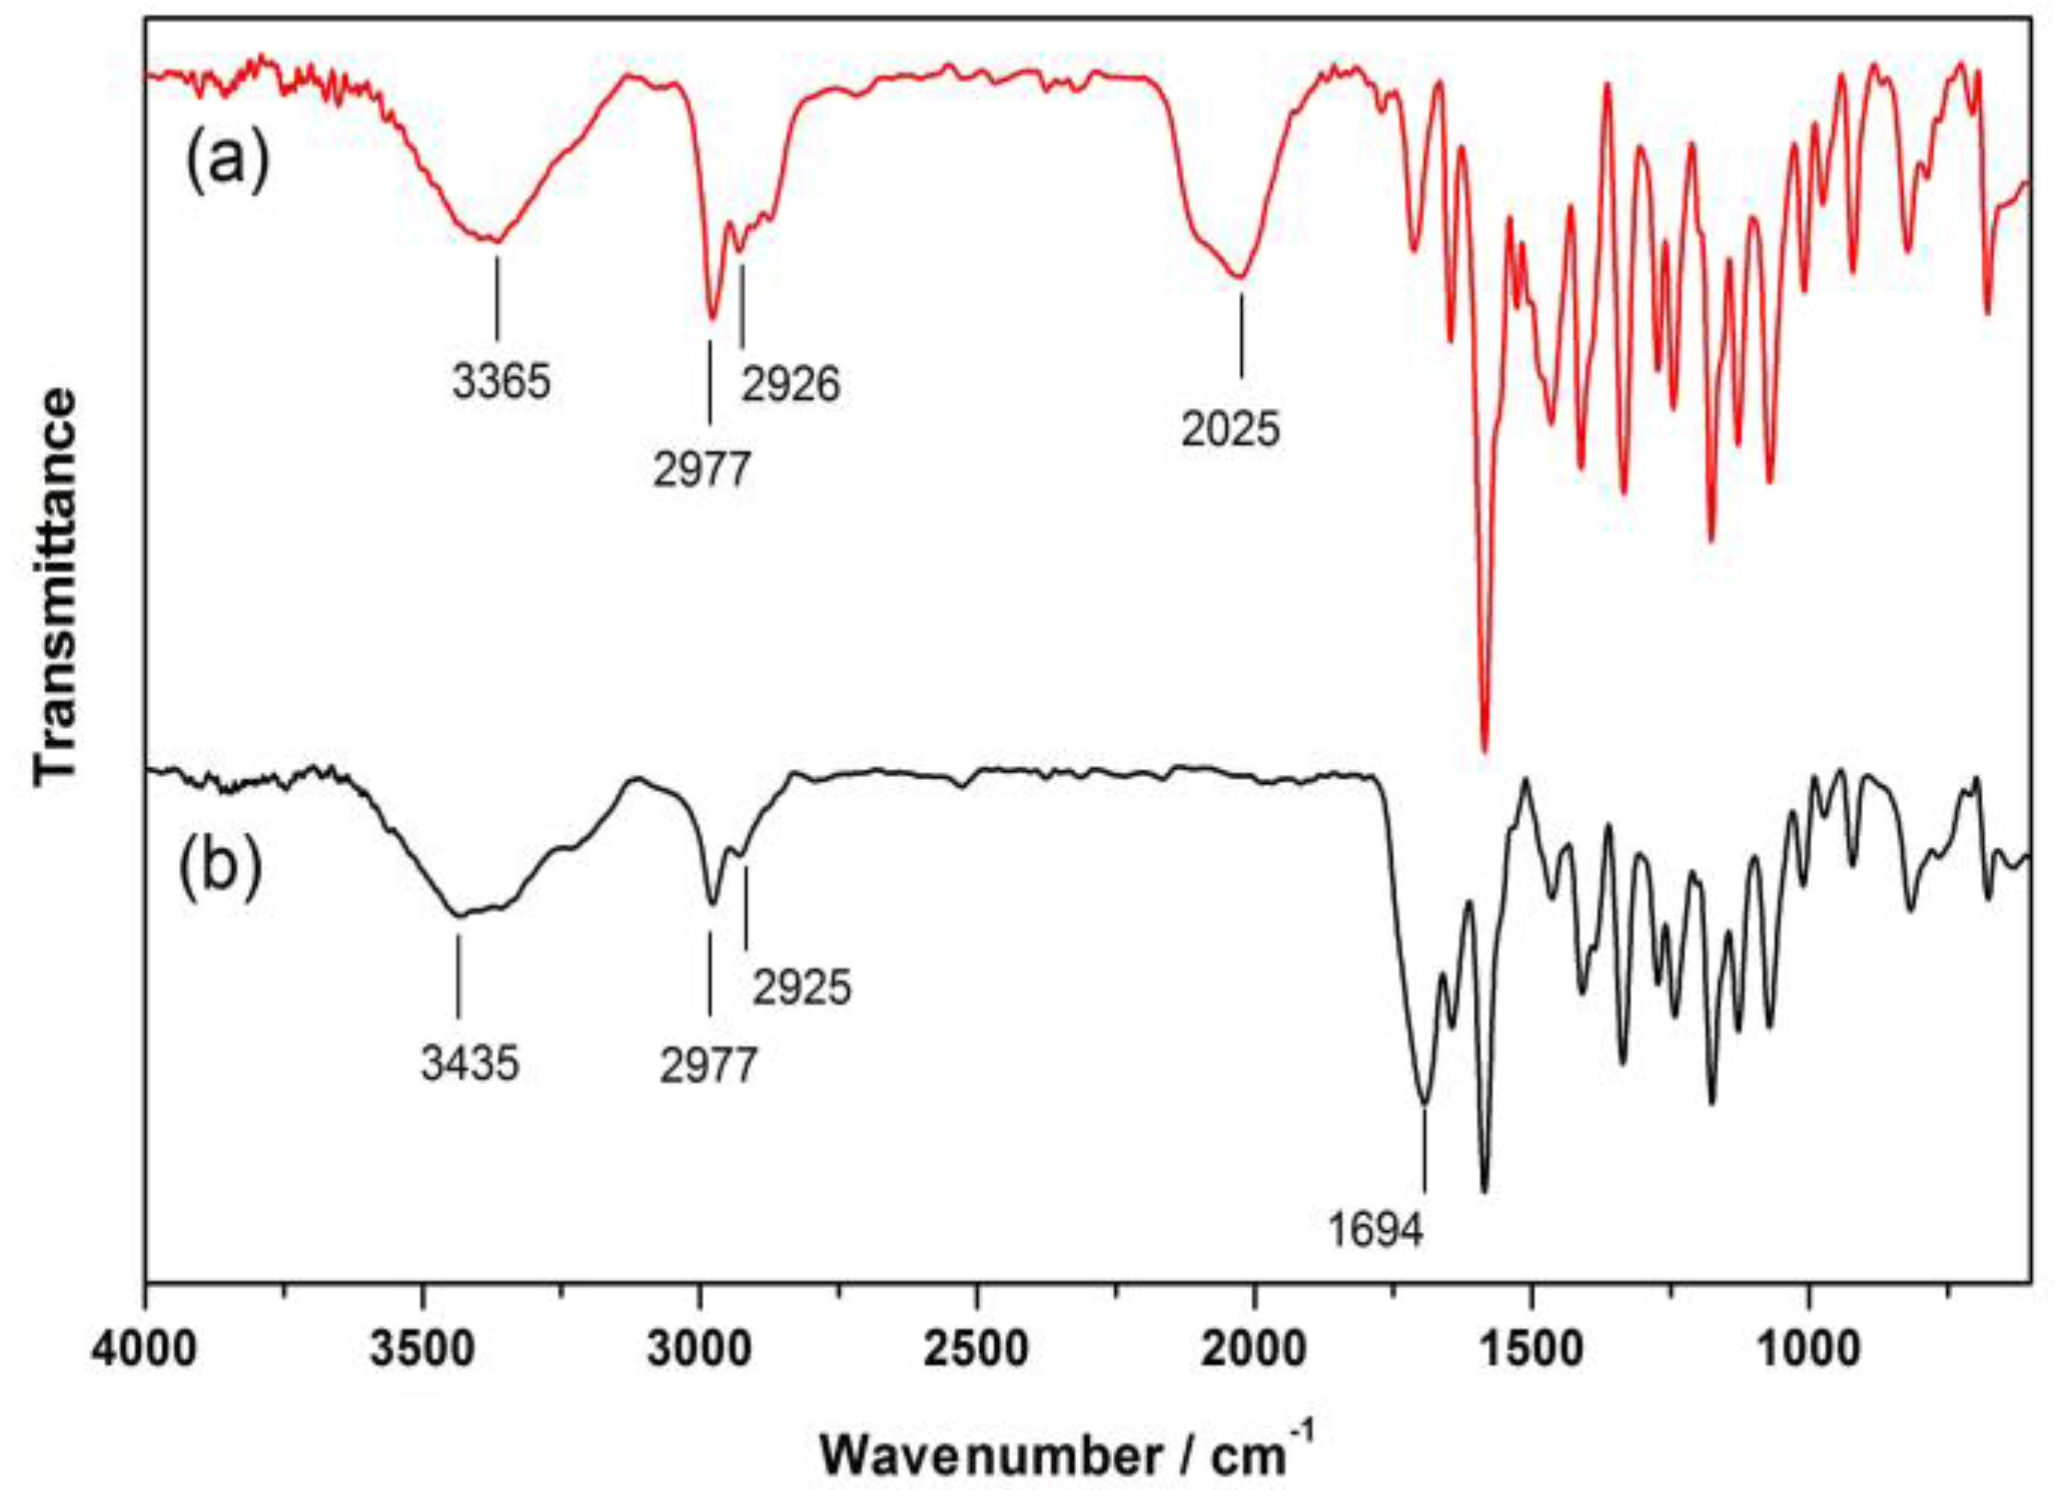
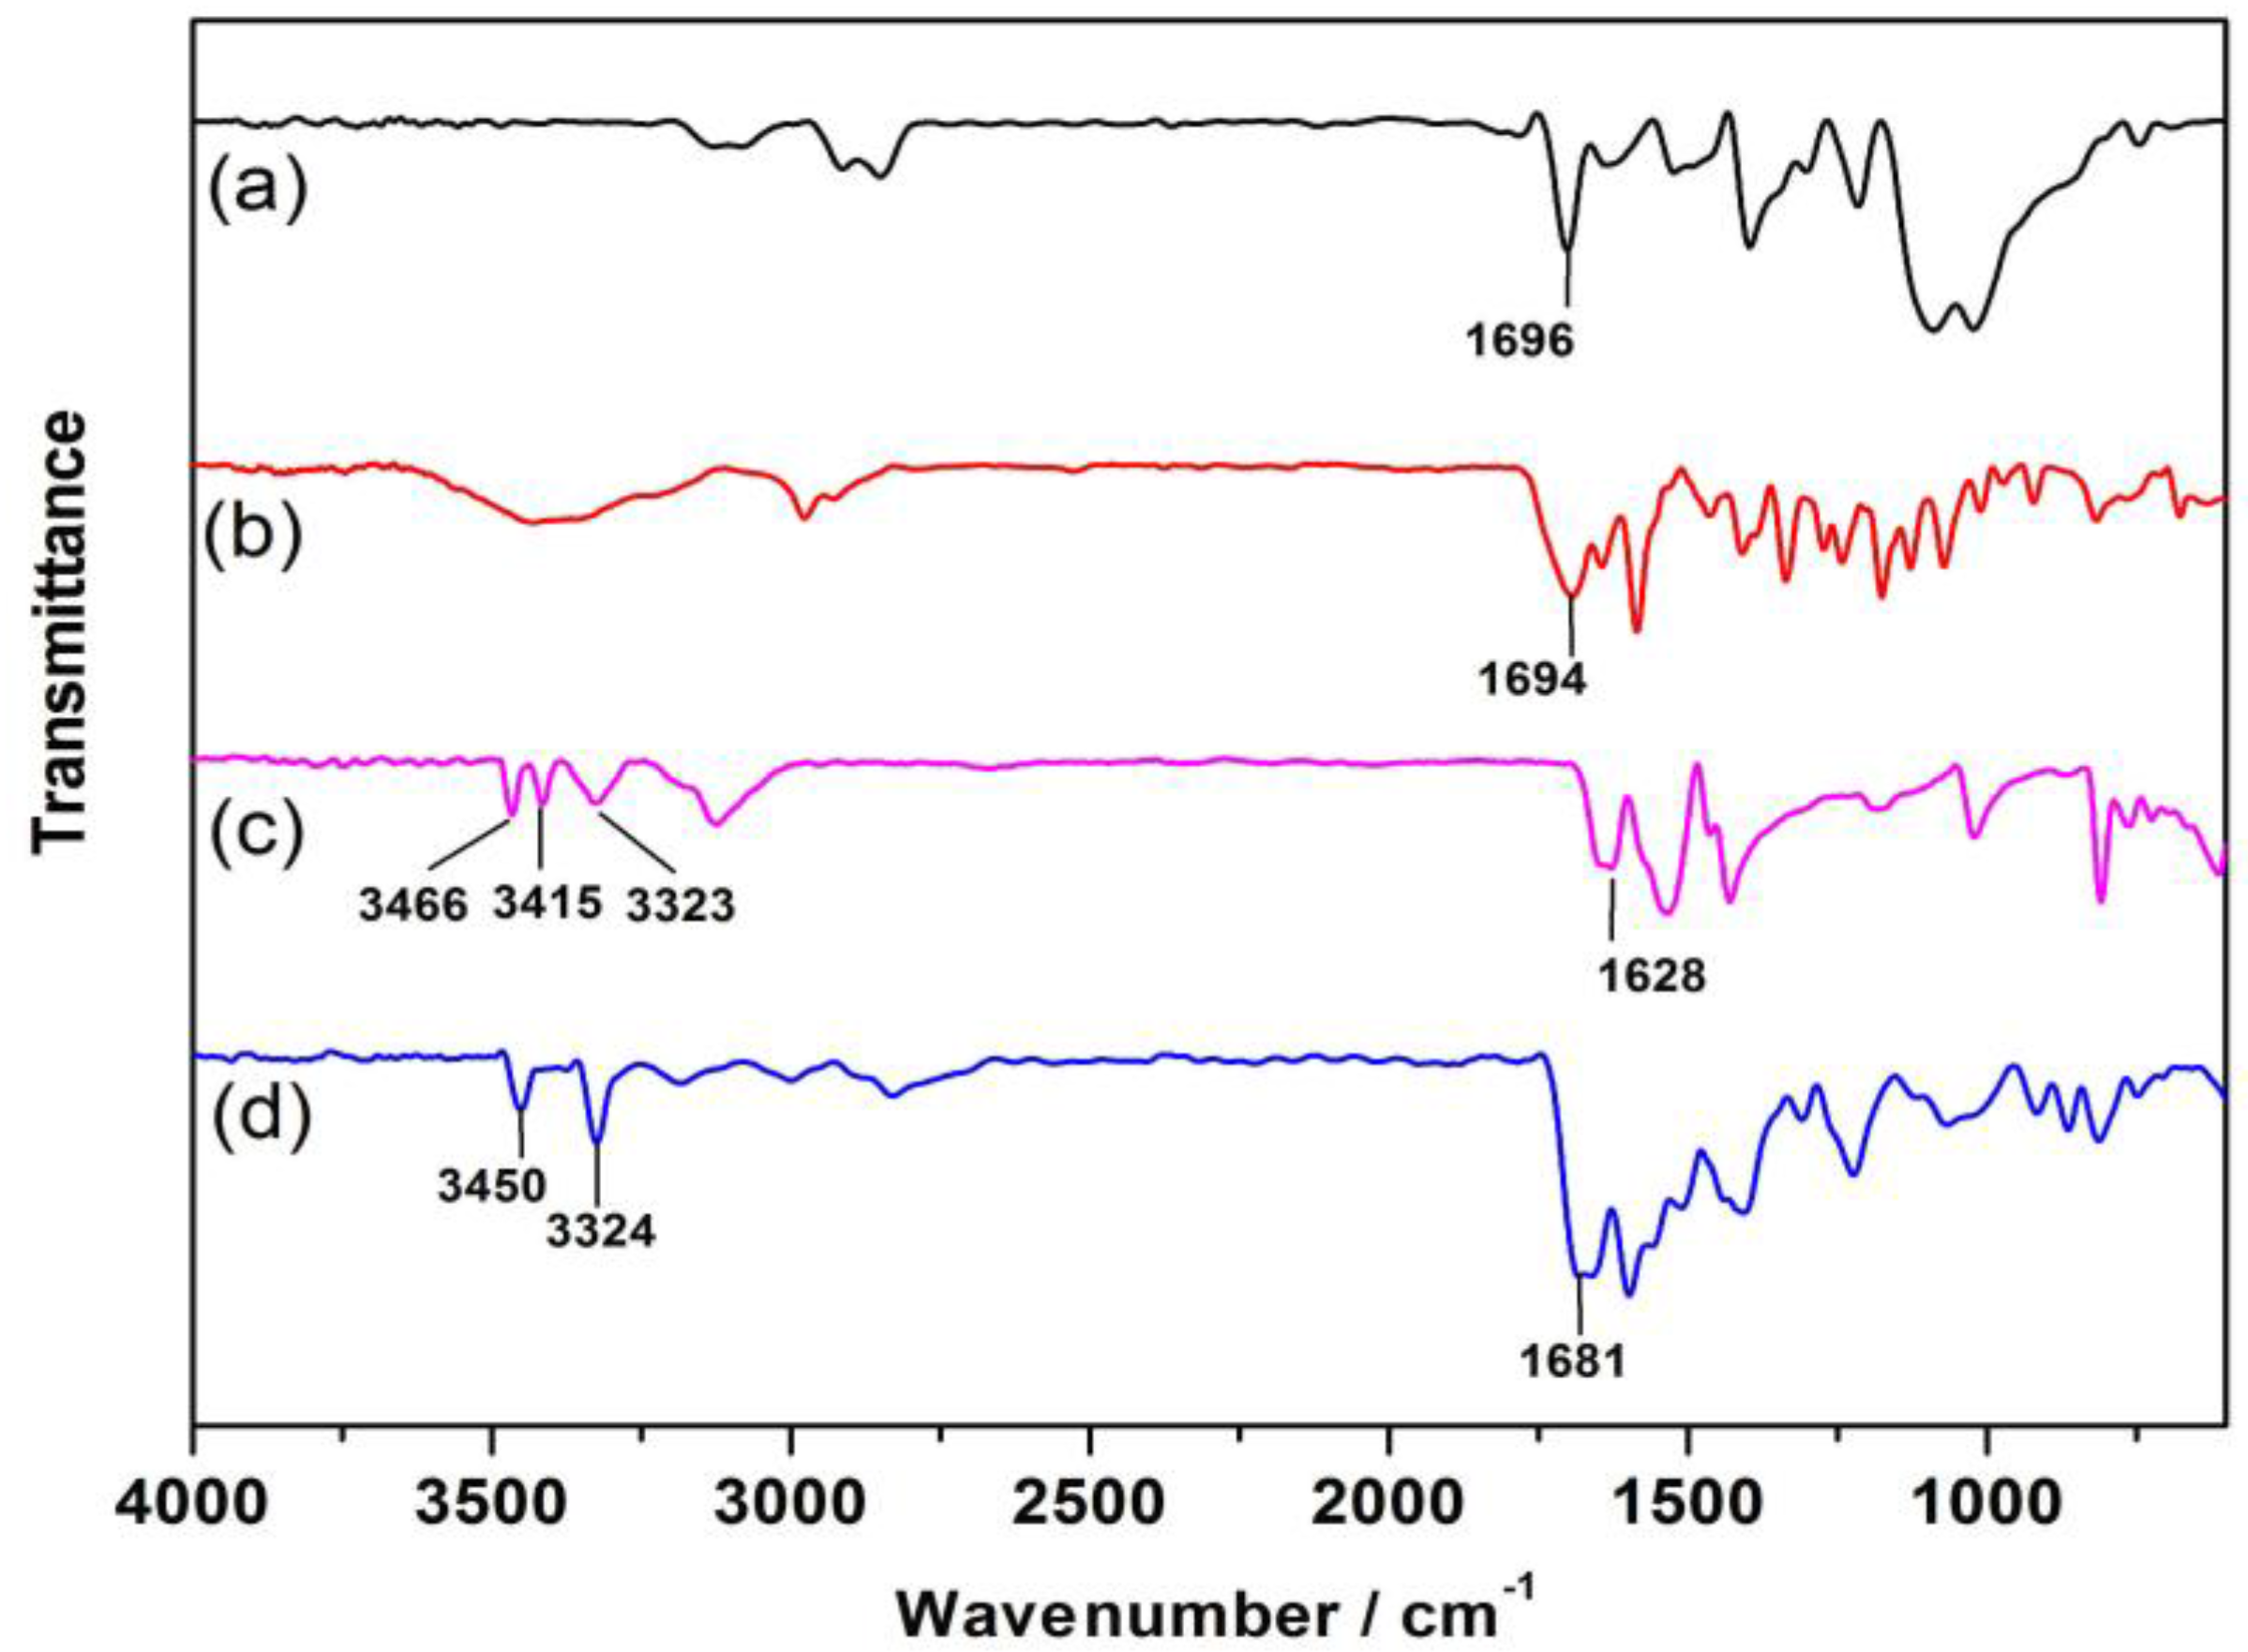
3.2. Characterization of AOA-Coated Gold Magnetic Nanoparticles (Fe3O4/Au–AOA) by FTIR

Figure 4a presents the FTIR spectrum of Fe3O4/Au. The broad double peaks at 1110 cm−1 and 1014 cm−1 are due to the stretching vibration of Si–O–Si. Au, as a simple metal substance, has no obvious absorption peaks. Figure 4b clearly shows characteristic double peaks of the amino group of 5-aminoorotic acid (AOA) at 3470 cm−1 and 3343 cm−1, as well as a strong carbonyl C=O stretching vibration at 1696 cm−1, respectively. Figure 4c indicates the spectrum of AOA-coated gold magnetic nanoparticles synthesized by the connection of AOA to Fe3O4/Au nanoparticles through polyethylene glycolthiol (NHS-PEG-SH). As the –SH group was firmly attached to the surface of Fe3O4/Au via a stable Au–S bond, the –NHS reacted with the amino group of AOA to form an amide bond by amidation reaction. As can be seen from Figure 4c, the disappearance of the amino double peaks and the appearance of a broad amide peaks between 3100 cm−1 and 3200 cm−1 in addition to the carbonyl C=O peak at 1696 cm−1 unambiguously proved that the AOA had been coated on the surface of Fe3O4/Au via the polyethylene glycolthiol linkage.

3.3. Characterization of RhB-Conjugated AOA (AOA–RhB) by FTIR

The infrared spectrum of Rhodamine B isothiocyanate (RhB) is shown in Figure 5a. RhB has a strong and broad IR adsorption of –OH stretching vibration between 3100 cm−1 and 3600 cm−1 and a characteristic adsorption of –N=C=S group at 2025 cm−1. The peaks at 2977 cm−1 and 2926 cm−1 were ascribed to the anti-symmetric and symmetric stretching vibrations of –CH3 of RhB. After the conjugation of RhB to AOA, the –N=C=S characteristic peak at 2025 cm−1 completely disappeared while a strong peak at 1694 cm−1 corresponding to the carboxyl group of AOA appeared (Figure 5b), indicating that the RhB had been connected to AOA through the reaction of –N=C=S with the amino group of AOA.

3.4. Characterization of [Fe3O4/Au–AOA•••Melamine•••AOA–RhB] Complex by FTIR

Figure 6 demonstrates the changes in FTIR spectra of Fe3O4/Au–AOA and AOA–RhB when melamine was added to form the [Fe3O4/Au–AOA•••melamine•••AOA–RhB] complex. Melamine had characteristic double peaks of amino group at 3466 cm−1 and 3415 cm−1 (Figure 6c), while Fe3O4/Au–AOA and AOA–RhB presented characteristic peak of carbonyl groups at 1696 cm−1 and 1694 cm−1, respectively (Figure 6a,b). The FTIR spectrum of the [Fe3O4/Au–AOA•••melamine•••AOA–RhB] complex (Figure 6d) clearly showed that the double peaks of amino group of melamine disappeared, and the carbonyl group stretching vibration of AOA simultaneously shifted from 1696 cm−1 to 1694 cm−1 to a lower wavenumber at 1681 cm−1, indicating the formation of a strong hydrogen bonding between melamine and AOA in the complex, as illustrated in Figure 1.

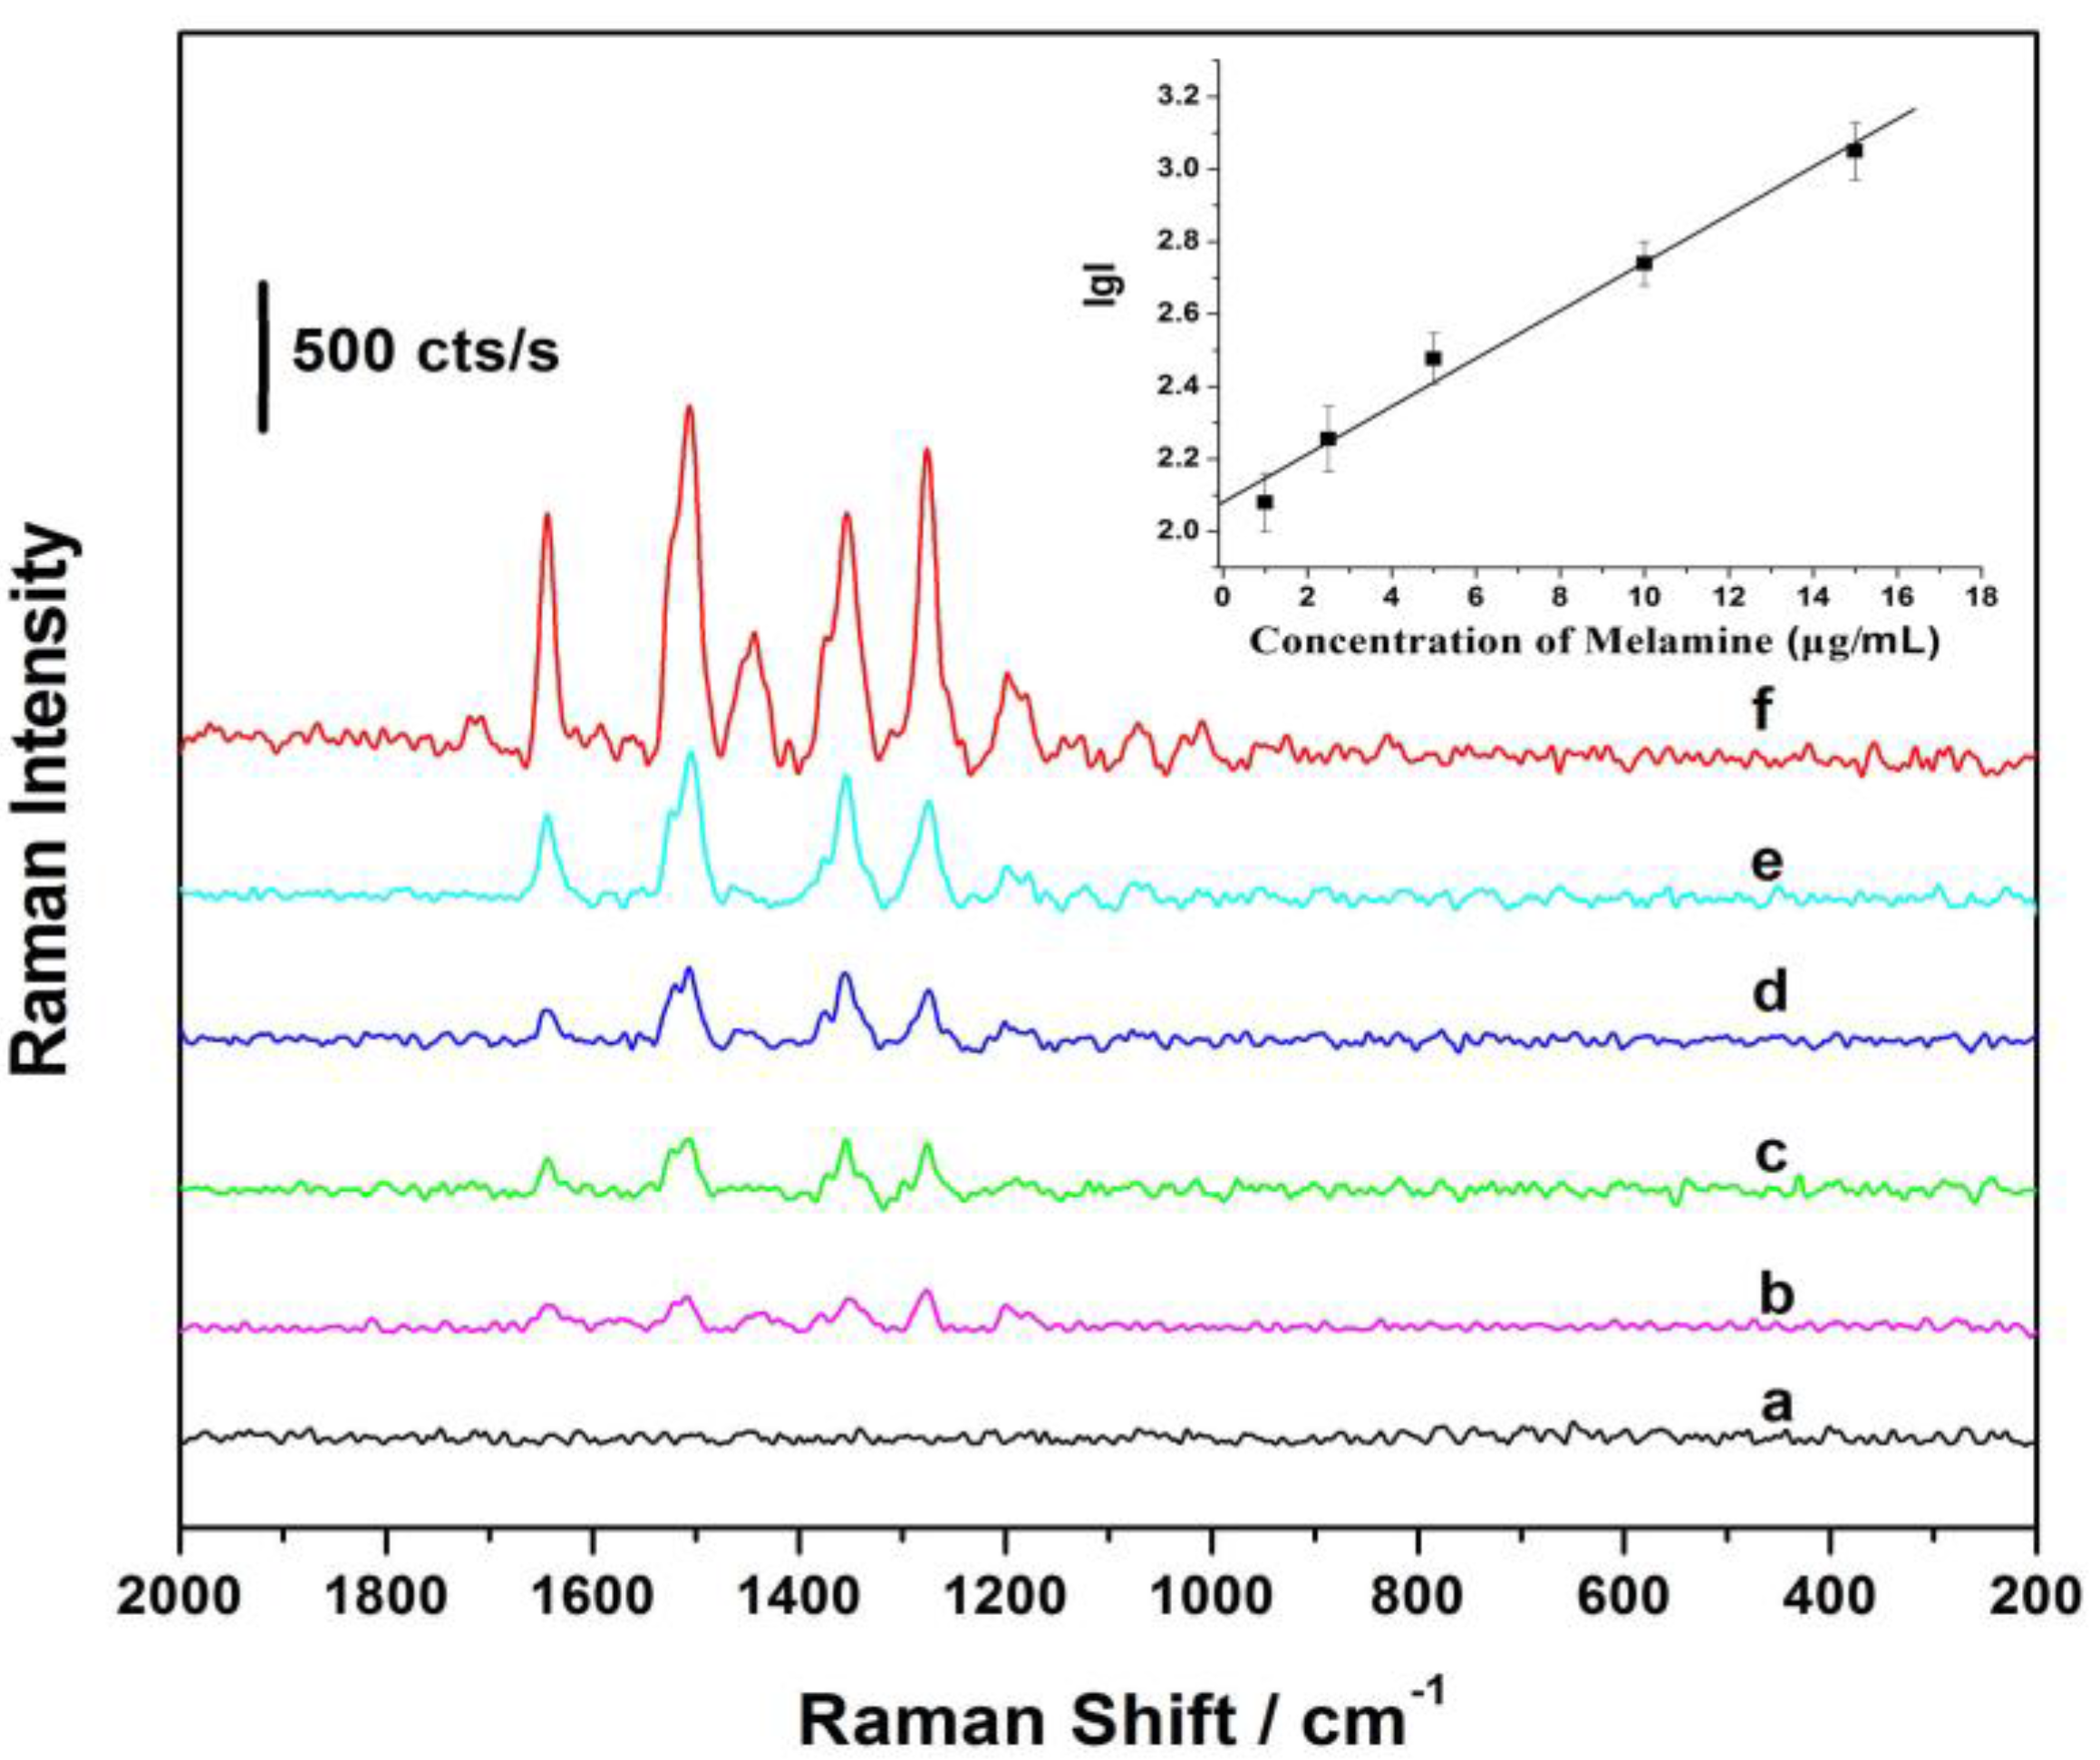
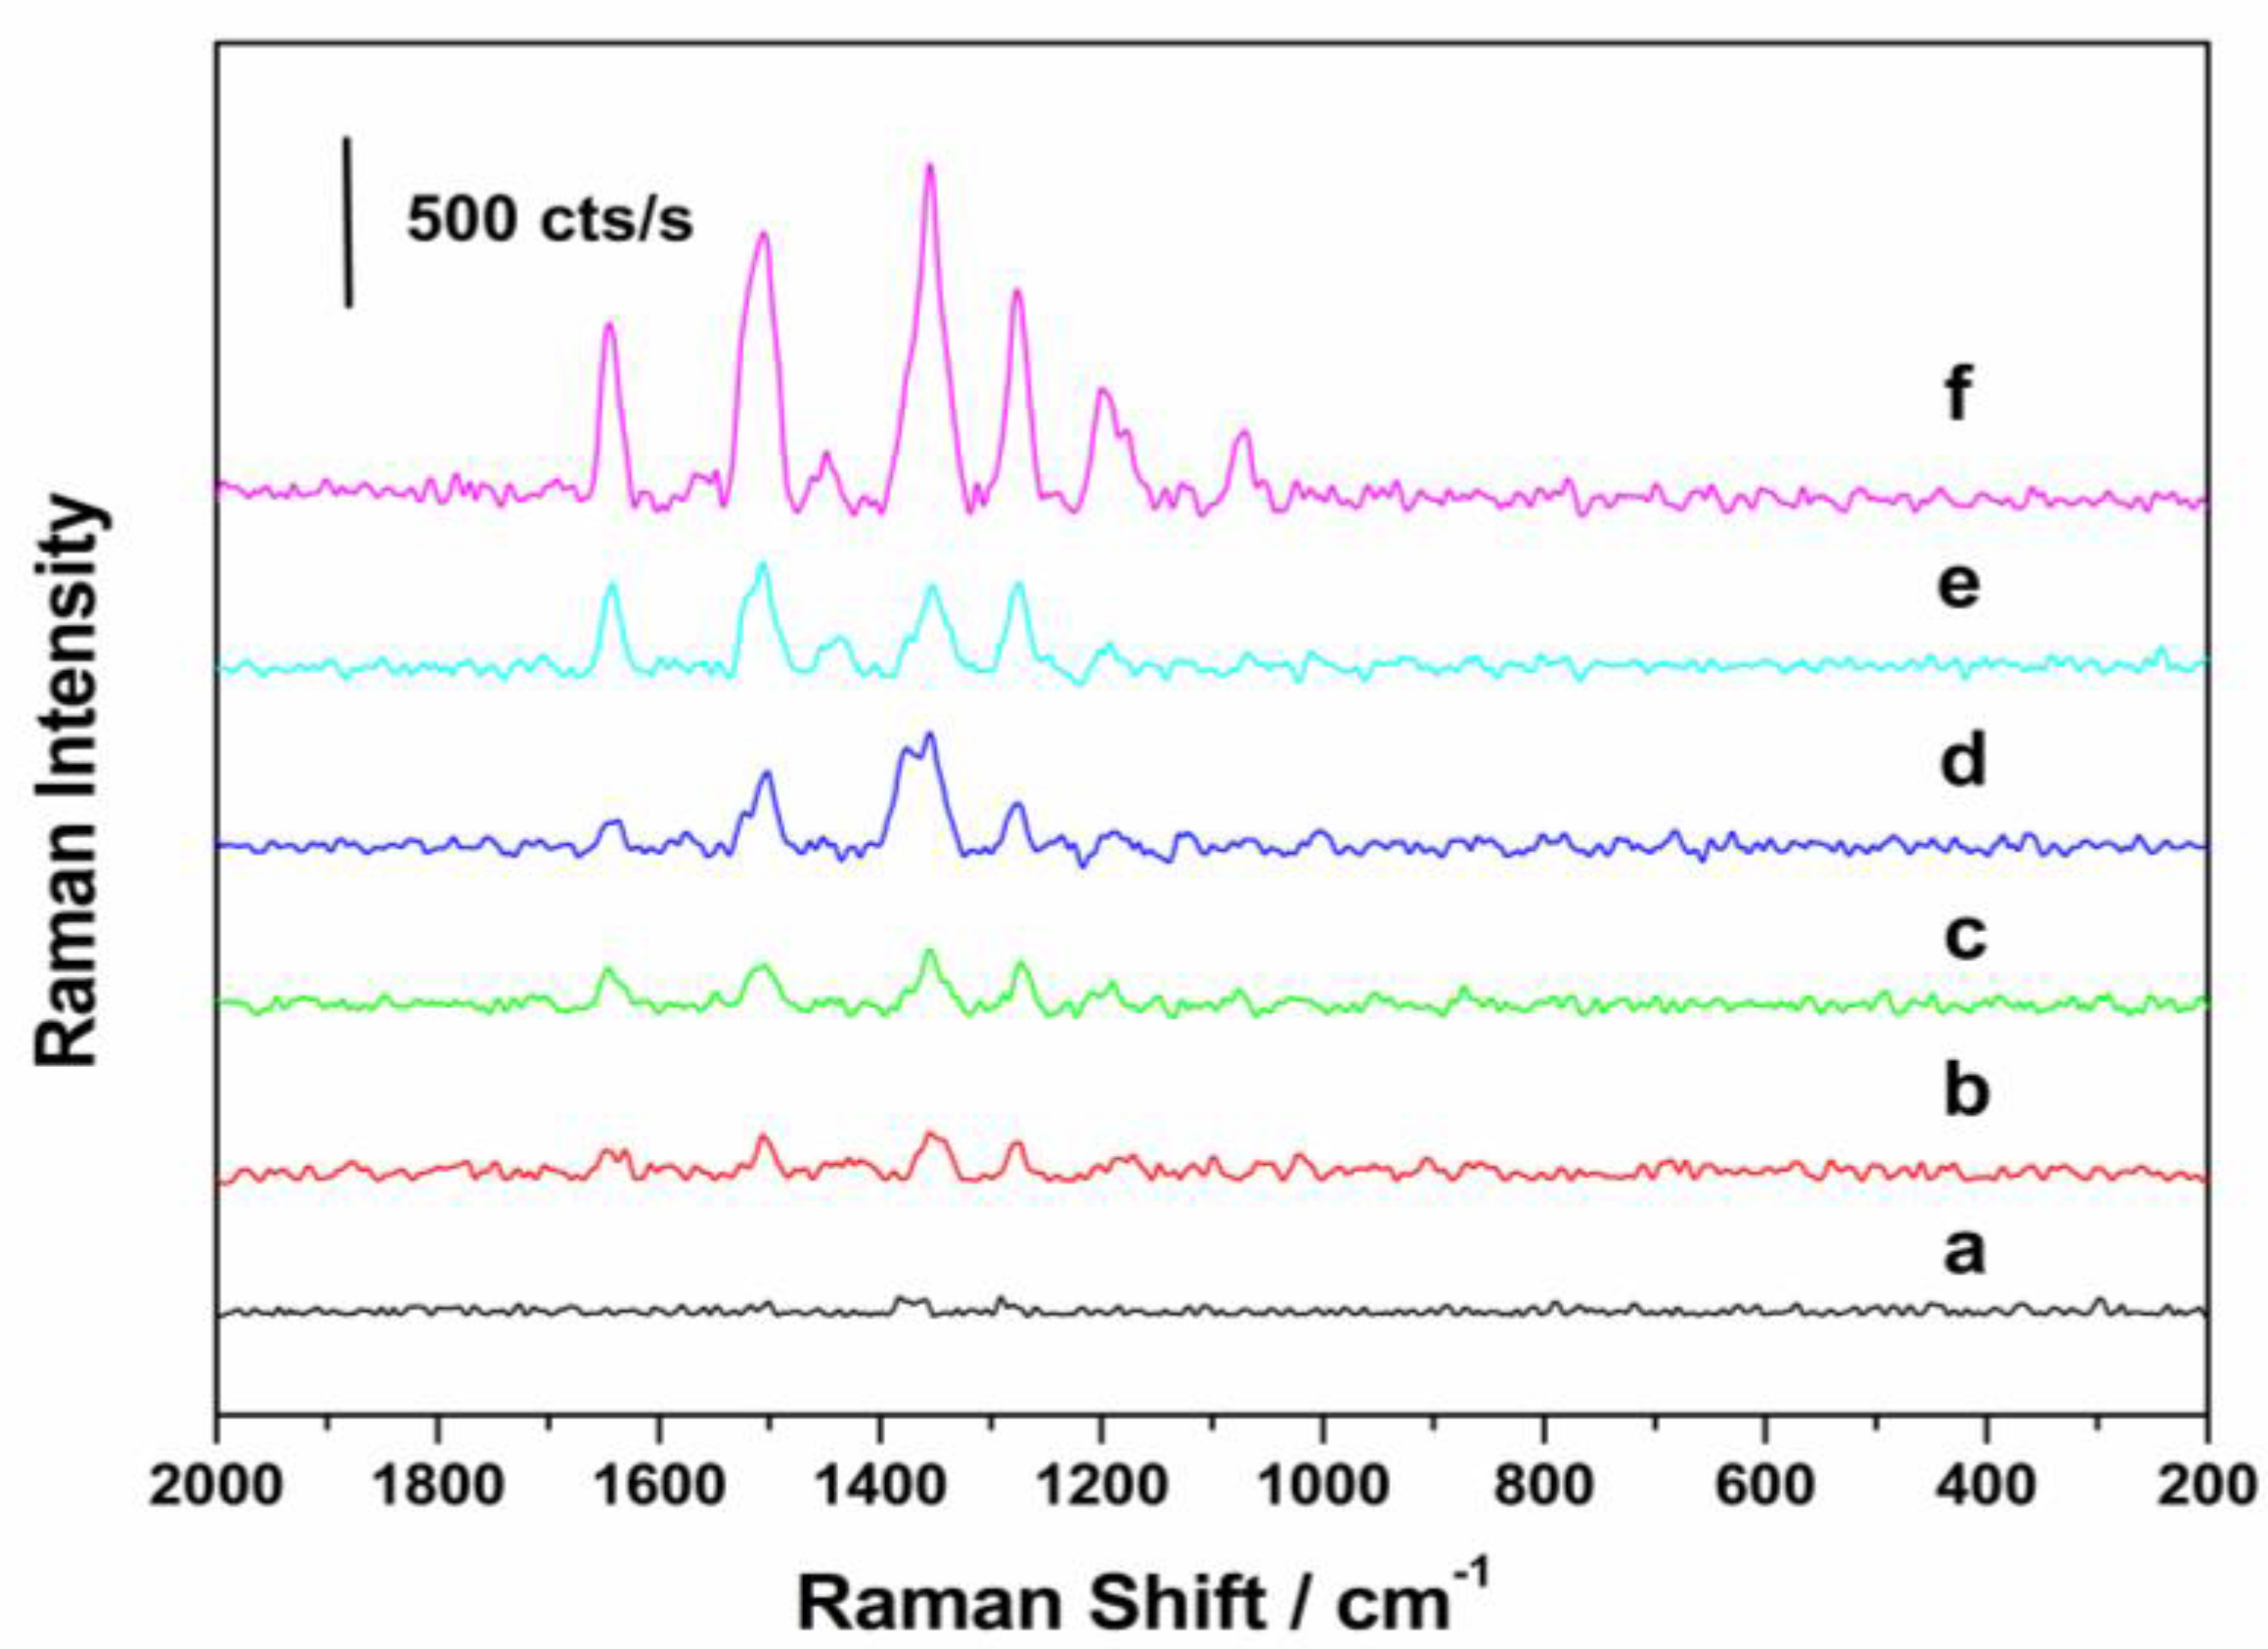
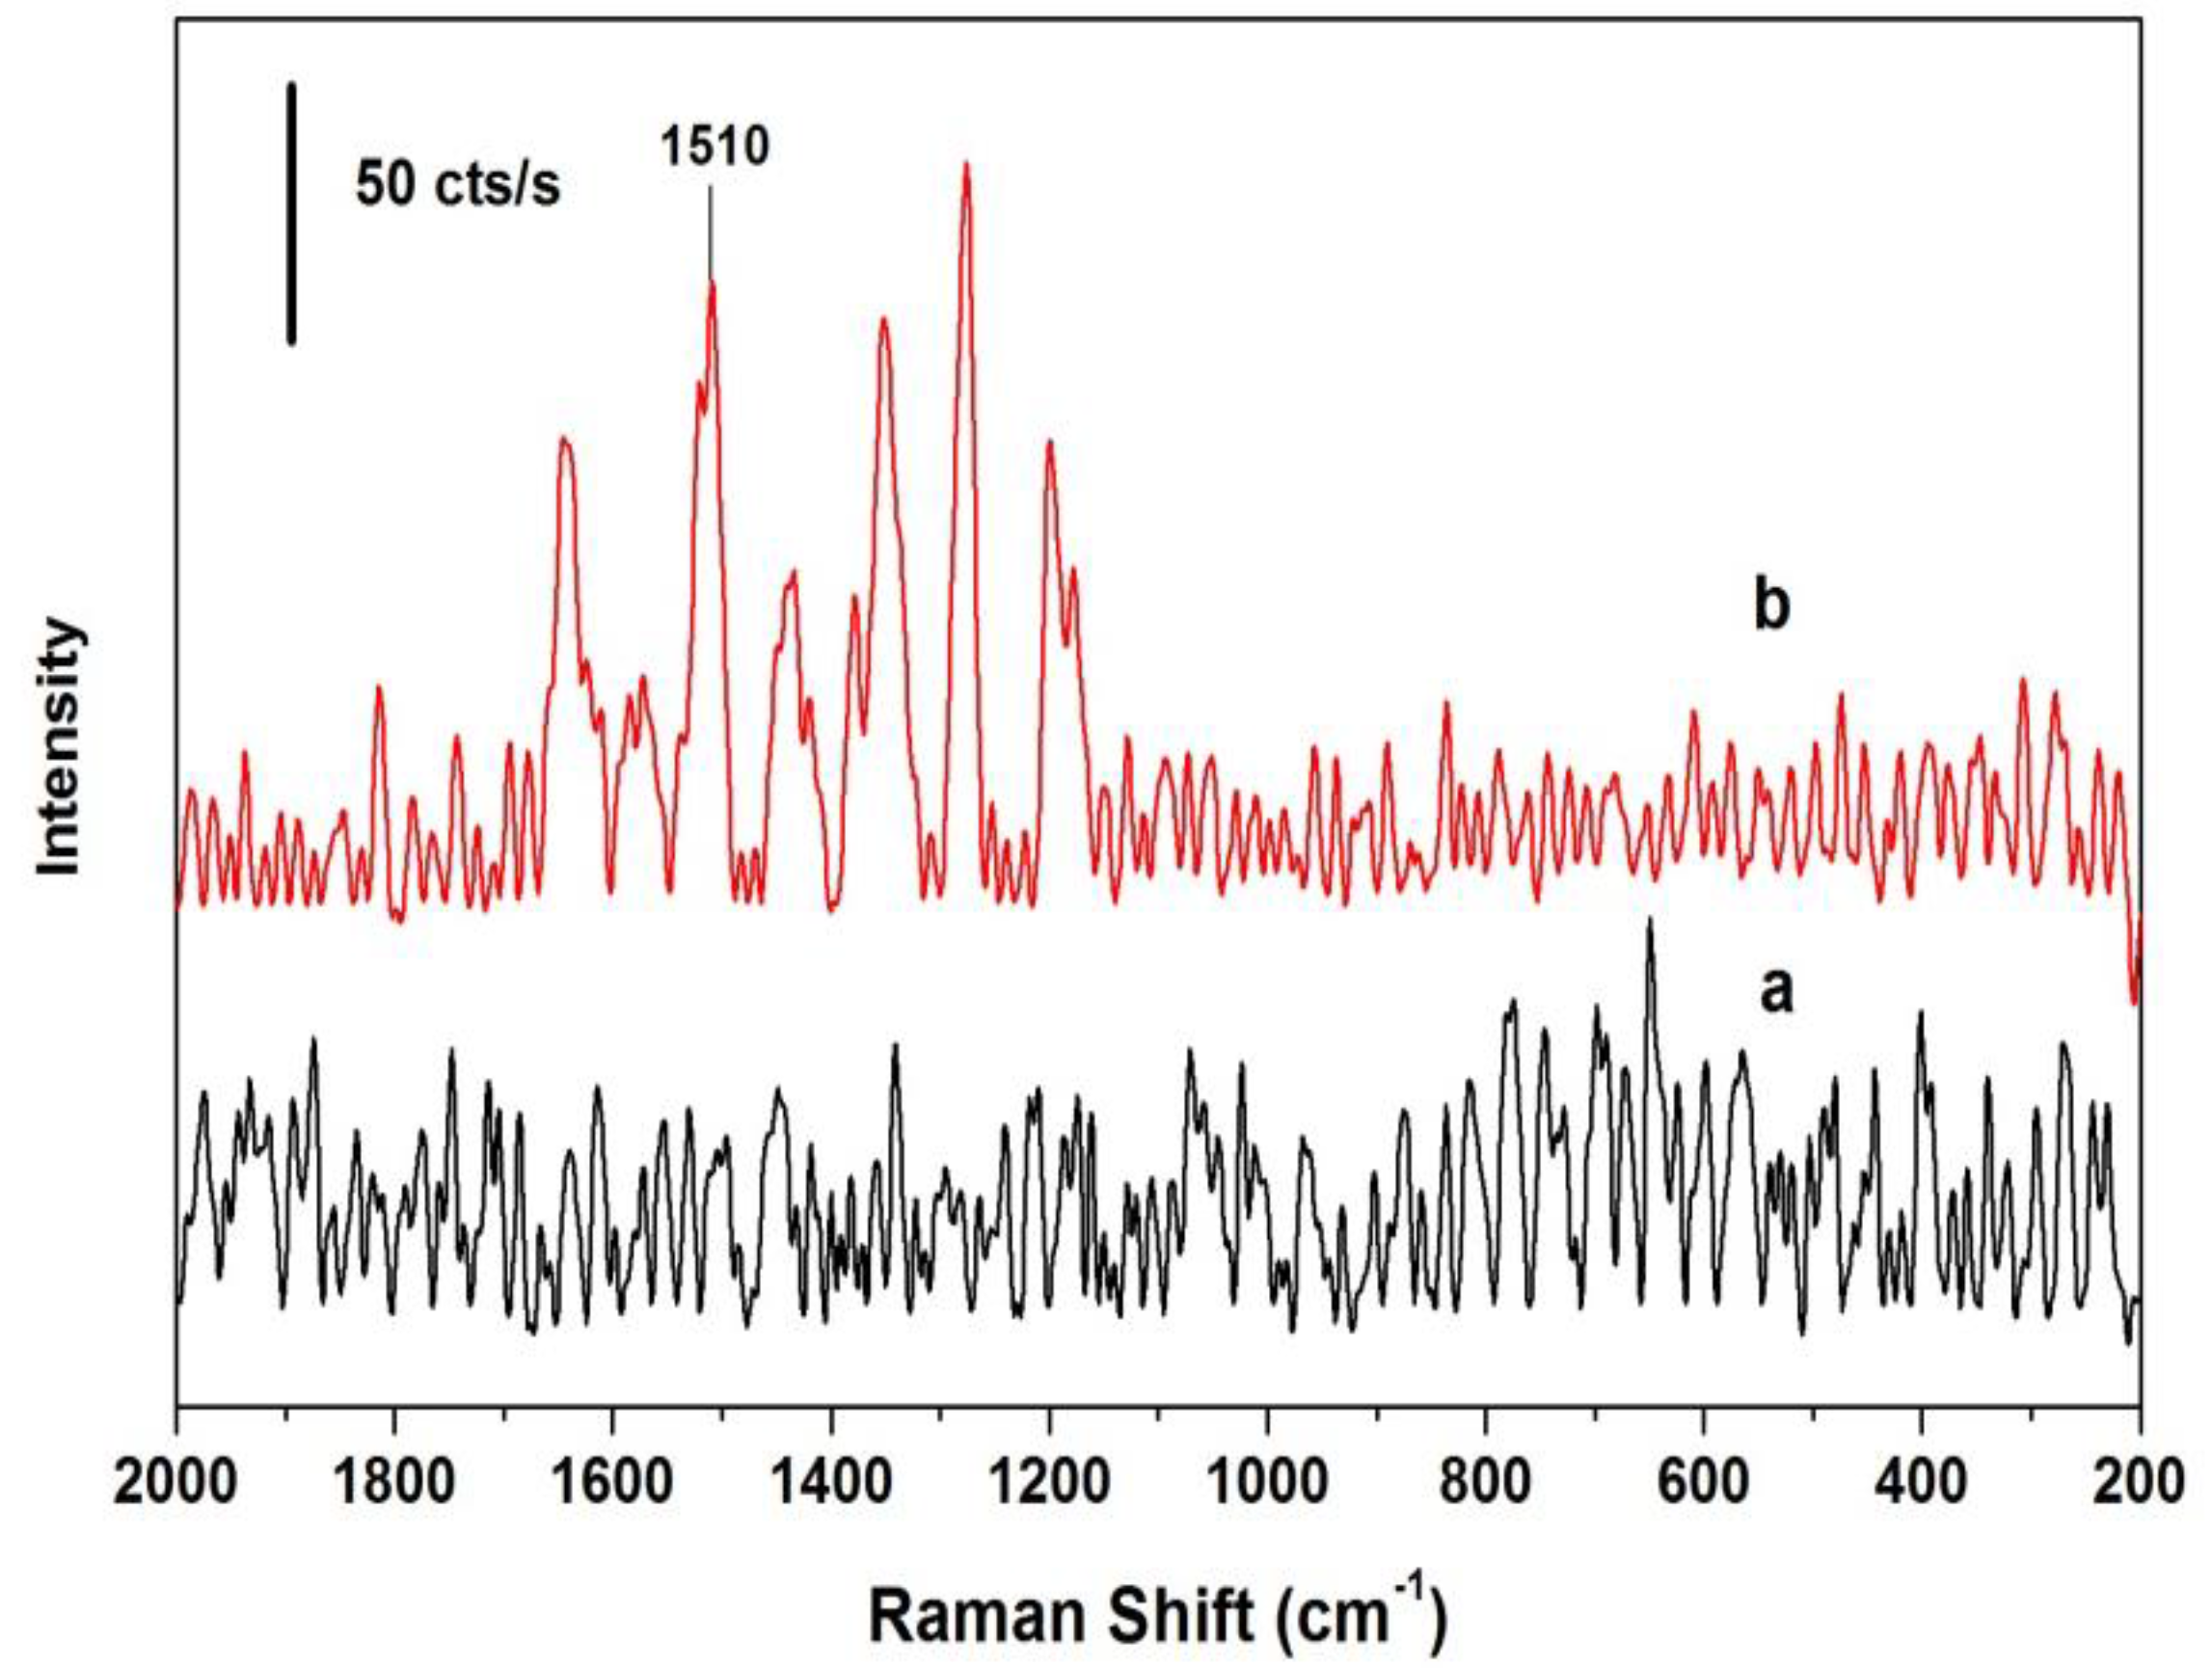
3.5. Detection of Melamine in Water Using [Fe3O4/Au–AOA•••Melamine•••AOA–RhB] as a Matrix

The detection assay of melamine was assembled by the addition of aliquots of melamine solution to the mixture of 0.1 mL of Fe3O4/Au–AOA and 0.1 mL of AOA–RhB solution to make a series of mixture solutions respectively containing 1.0 µg/mL, 2.5 µg/mL, 5.0 µg/mL, 10.0 µg/mL, and 15.0 µg/mL of melamine. Figure 7 shows the difference in Raman spectra for the samples containing no melamine (Spectrum a) and 1.0 µg/mL of melamine (Spectrum b). There are no apparent diagnostic signal peaks for RhB in Spectrum a because the RhB molecules were far from the surface of the gold magnetic nanoparticles due to the lack of strong interactions between Fe3O4/Au–AOA and AOA–RhB in the absence of melamine. In contrast, several characteristic peaks (between 1100 and 1700 cm−1) of RhB appeared in Spectrum b since the addition of melamine caused the formation of the supramolecular complex of [Fe3O4/Au–AOA•••melamine•••AOA–RhB] via strong multiple hydrogen bonding between melamine and AOA, and consequently brought the RhB molecules close enough to the surface of Fe3O4/Au nanoparticles for the generation of SERS signal of RhB.
Figure 8 demonstrates a progressive increment in peak intensity at 1510 cm−1 of RhB when melamine concentration was increased from 0 to 15.0 µg/mL. A linear plot of the logarithm of the peak intensity at 1510 cm−1 versus the melamine concentration indicates that the detection is linear within the concentration between 1.0 and 15.0 µg/mL with the detection limit of melamine at 1.0 µg/mL in water. The linear equation is lgI = 2.07546 + 0.06641 × C (lgI refers to the logarithmic peak intensity at 1510 cm−1, C refers to melamine concentrations) and the linear regression coefficient was determined to be R2 = 0.9840.

3.6. Detection of Melamine in Milk Using [Fe3O4/Au–AOA•••Melamine•••AOA–RhB] as a Matrix

Similar results were found in the detection assay of melamine in milk as shown in Figure 9. Due to the interference of protein, lipid, and other materials in milk, a conservative detection limit of melamine was set at 2.5 µg/mL in milk. The regression of the logarithmic peak intensity at 1510 cm−1 versus the melamine concentration produced a linear plot with linear equation as lgI = 2.02148 + 0.05852 × C (lgI represents the logarithms of the peak intensity at 1510 cm−1, C is the melamine concentrations) and R2 = 0.9852 in the melamine concentration ranging from 2.5 to 15.0 µg/mL.
In a traditional enzyme-linked immunosorbent assay (ELISA) or the immuno-based SERS detection of melamine, monoclonal or polyclonal antibodies are inevitably used to establish the assay [14,27,28]. In comparison with commercial Fe3O4 nanoparticles, 5-aminoorotic acid, and Au nanoparticles, these antibodies are often tens of thousands of times more expensive and require careful handling and disposal because they are sensitive to temperature and pH value. The current assay drastically cut down the cost of detection by replacing monoclonal and polyclonal antibodies with Fe3O4/Au nanoparticles and 5-aminoorotic acid and simplified the detection procedure by employing magnetic separation with external magnets. With the help of a portable spectrometer, the current method provided a simple, rapid, on-site, and low cost analysis of melamine.

4. Conclusions

This work presents a fast and cost-effective detection approach of melamine based on surface enhanced Raman spectroscopy (SERS) using a novel hydrogen bonding-assisted supramolecular matrix and gold-coated magnetic nanoparticles. The detection utilizes Fe3O4/Au magnetic nanoparticles coated with 5-aminoorotic acid (AOA) as a SERS active substrate (Fe3O4/Au–AOA), and Rhodamine B (RhB) conjugated AOA as a Raman reporter (AOA–RhB). The formation of the [Fe3O4/Au–AOA•••melamine•••AOA–RhB] complex due to the strong multiple hydrogen bonding between AOA and melamine, followed by the laser excitation of the complex, produced strong SERS signals diagnostic for RhB. The logarithmic intensity of the characteristic peak at 1510 cm−1 of RhB was found to be proportional to the concentration of melamine with a limit of detection of 1.0 µg/mL and a detection linearity range of 1.0~15.0 µg/mL in water, and a limit of detection of 2.5 µg/mL and a detection linearity range of 2.5~15.0 µg/mL in milk. As Fe3O4 nanoparticle and AOA are tens of thousands of times less expensive than monoclonal antibodies used in traditional sandwich immunoassays, and the total analysis time of the assay was less than 1 h, the current method affords promise as a biosensor platform that can be adapted for portable and cost-effective detection applications.

Acknowledgments

The authors wish to acknowledge the financial support of the National Natural Science Foundation of China (Grant No. 31301483), the Zhejiang Provincial Natural Science Foundation of China (Grant No. LY17C200016), the Scientific Research Fund of Zhejiang Provincial Education Department (Grant No. Y201329221), and the Scientific Research Foundation for the Returned Overseas Chinese Scholars, State Education Ministry. The received funds will cover the costs to publish in open access.

Author Contributions

Jing Neng conceived and designed the experiments; Jiayuan Tan performed the synthesis of gold magnetic nanoparticles; Jing Neng and Kan Jia acquired and analyzed the spectra data; Peilong Sun contributed the project idea, reagents, and materials; Jing Neng wrote the paper.

Conflicts of Interest

The authors declared that they have no conflicts of interest to this work. We declare that we do not have any commercial or associative interest that represents a conflict of interest in connection with the manuscript submitted. The founding sponsors had no role in the design of the study; in the collection, analyses, or interpretation of data; in the writing of the manuscript; or in the decision to publish the results.

References

  1. Brown, C.A.; Jeong, K.S. Outbreaks of renal failure associated with melamine and cyanuric acid in dogs and cats in 2004 and 2007. J. Vet. Diagn. Investig. 2007, 19, 525–531. [Google Scholar] [CrossRef] [PubMed]
  2. Zhou, Q.; Liu, N.; Qie, Z.; Wang, Y.; Ning, B.; Gao, Z. Development of gold nanoparticle-based rapid detection kit for melamine in milk products. J. Agric. Food Chem. 2011, 59, 12006–12011. [Google Scholar] [CrossRef] [PubMed]
  3. Gao, L.H.; Jonsson, J.A. Determination of melamine in fresh milk with hollow fiber liquid phase microextraction based on ion-pair mechanism combined with high performance liquid chromatography. Anal. Lett. 2012, 45, 2310–2323. [Google Scholar] [CrossRef]
  4. Ren, S.T.; Xu, C.F.; Du, Y.X.; Gao, X.L.; Sun, Y.; Jiang, Y.N. The natural outcome of melamine-induced bladder stones with bladder epithelial hyperplasia after the withdrawal of melamine in mice. Food Chem. Toxicol. 2012, 50, 2318–2324. [Google Scholar] [CrossRef] [PubMed]
  5. Liu, J.D.; Liu, J.J.; Yuan, J.H.; Tao, G.H.; Wu, D.S.; Yang, X.F.; Yang, L.Q.; Huang, H.Y.; Zhou, L.; Xu, X.Y.; et al. Proteome of melamine urinary bladder stones and implication for stone formation. Toxicol. Lett. 2012, 212, 307–314. [Google Scholar] [CrossRef] [PubMed]
  6. Liu, C.C.; Wu, C.F.; Shiea, J.; Cho, Y.T.; Hsieh, T.J.; Chou, Y.H.; Chen, B.H.; Huang, S.P.; Wu, W.J.; Shen, J.T.; et al. Detection of melamine in a human renal uric acid stone by matrix-assisted laser desorption/ionization time-of-flight mass spectrometry (MALDI-TOF MS). Clin. Chim. Acta 2012, 413, 1689–1695. [Google Scholar] [CrossRef] [PubMed]
  7. Heck, H.D.; Tyl, R.W. The induction of bladder stones by terephthalic acid, dimethyl terephthalate, and melamine (2,4,6-triamino-s-triazine) and its relevance to risk assessment. Regul. Toxicol. Pharm. 1985, 5, 294–313. [Google Scholar] [CrossRef]
  8. Rovina, K.; Siddiquee, S. A review of recent advances in melamine detection techniques. J. Food Compos. Anal. 2015, 43, 25–38. [Google Scholar] [CrossRef]
  9. Lou, T.; Wang, Y.; Li, J.; Peng, H.; Xiong, H.; Chen, L. Rapid detection of melamine with 4-mercaptopyridine-modified gold nanoparticles by surface-enhanced Raman scattering. Anal. Bioanal. Chem. 2011, 401, 333–338. [Google Scholar] [CrossRef] [PubMed]
  10. Kim, A.; Barcelo, S.J.; Williams, R.S.; Li, Z. Melamine sensing in milk products by using surface enhanced Raman scattering. Anal. Chem. 2012, 84, 9303–9309. [Google Scholar] [CrossRef] [PubMed]
  11. Robinson, A.M.; Harroun, S.G.; Bergman, J.; Brosseau, C.L. Portable Electrochemical Surface-Enhanced Raman Spectroscopy System for Routine Spectroelectrochemical Analysis. Anal. Chem. 2012, 84, 1760–1764. [Google Scholar] [CrossRef] [PubMed]
  12. Ehling, S.; Tefera, S.; Ho, I.P. High-performance liquid chromatographic method for the simultaneous detection of the adulteration of cereal flours with melamine and related triazine by-products ammeline, ammelide, and cyanuric acid. Food Addit. Contam. 2007, 24, 1319–1325. [Google Scholar] [CrossRef] [PubMed]
  13. Squadrone, S.; Ferro, G.L.; Marchis, D.; Mauro, D.; Palmegiano, P.; Amato, G.; Poma Genin, E.; Abete, M.C. Determination of melamine in feed: Validation of a gas chromatography-mass spectrometry method according to 2004/882/CE regulation. Food Control 2010, 21, 714–718. [Google Scholar] [CrossRef]
  14. Zhou, Y.; Li, C.Y.; Li, Y.S.; Ren, H.L.; Lu, S.Y.; Tian, X.L.; Hao, Y.M.; Zhang, Y.Y.; Shen, Q.Y.; Liu, Z.S.; et al. Monoclonal antibody based inhibition ELISA as a new tool for the analysis of melamine in milk and pet food samples. Food Chem. 2012, 135, 2681–2686. [Google Scholar] [CrossRef] [PubMed]
  15. Fleischmann, M.; Hendra, P.J.; Mcquillan, A.J. Raman spectra of pyridine adsorbed at a silver electrode. Chem. Phys. Lett. 1974, 26, 163–166. [Google Scholar] [CrossRef]
  16. Jeanmaire, D.L.; Duyne, R.P.V. Surface Raman spectroelectrochemistry: Part I. Heterocyclic, aromatic, and aliphatic amines adsorbed on the anodized silver electrode. J. Electroanal. Chem. Interfacial Electrochem. 1977, 84, 1–20. [Google Scholar] [CrossRef]
  17. Pieczonka, N.P.; Acora, R.F. Single molecule analysis by surface-enhanced Raman scattering. Chem. Soc. Rev. 2008, 37, 946–954. [Google Scholar] [CrossRef] [PubMed]
  18. Lu, G.; Li, H.; Liusman, C.; Yin, Z.Y.; Wu, S.X.; Zhang, H. Surface enhanced Raman Scattering of Ag or Au nanoparticle-decorated reduced graphene oxide for detection of aromatic molecules. Chem. Sci. 2011, 2, 1817–1821. [Google Scholar] [CrossRef]
  19. Zhang, X.Y.; Zhao, J.; Whitney, A.V.; Elam, J.W.; Van Duyne, R.P. Ultrastable substrates for surface-enhanced Raman spectrosocopy: Al2O3 overlayers fabricated by atomic layer deposition yield improved anthrax biomarker detection. J. Am. Chem. Soc. 2006, 128, 10304–10309. [Google Scholar] [CrossRef] [PubMed]
  20. Cao, Y.C.; Jin, R.; Nam, J.M.; Thaxton, C.S.; Mirkin, C.A. Nanoparticles with Raman spectroscopic fingerprints for DNA and RNA detection. Science 2002, 297, 1536–1540. [Google Scholar] [CrossRef] [PubMed]
  21. Park, T.; Lee, S.; Seong, G.H.; Choo, J.; Lee, E.K.; Kim, Y.S.; Ji, W.H.; Hwang, S.Y.; Gweon, D.G.; Lee, S. Highly sensitive signal detection of duplex dye-labelled DNA oligonucleotides in a PDMS microfluidic chip: Confocal surface-enhanced Raman spectrosocopic study. Lab Chip 2005, 5, 437–442. [Google Scholar] [CrossRef] [PubMed]
  22. Sha, M.Y.; Penn, S.G.; Freeman, R.G.; Doering, W.E. Detection of human viral RNA via a combined fluorescence and SERS molecular beacon assay. Nanobiotechnology 2007, 3, 23–30. [Google Scholar] [CrossRef]
  23. Culha, M.; Stokes, D.; Allain, L.R.; Vo-Dinh, T. Surface-enhanced Raman scattering substrate based on a self-assembled monolayer for use in gene diagnostics. Anal. Chem. 2003, 75, 6196–6201. [Google Scholar] [CrossRef] [PubMed]
  24. Cao, Y.C.; Jin, R.; Nam, J.M.; Thaxton, C.S.; Mirkin, C.A. Raman dye-labeled Nanoparticle probes for proteins. J. Am. Chem. Soc. 2003, 125, 14676–14677. [Google Scholar] [CrossRef] [PubMed]
  25. Driskell, J.D.; Uhlenkamp, J.M.; Lipert, R.J.; Porter, M.D. Surface-enhanced Raman scattering immunoassays using a rotated capture substrate. Anal. Chem. 2007, 79, 4141–4148. [Google Scholar] [CrossRef] [PubMed]
  26. Gong, J.L.; Liang, Y.; Huang, Y.; Chen, J.W.; Jiang, J.H.; Shen, G.L.; Yu, R.Q. Ag/SiO2 core-shell nanoparticle-based surface-enhanced Raman probes for immunoassay of cancer marker using silica-coated magnetic nanoparticles as separation tools. Biosens. Bioelectron. 2007, 22, 1501–1507. [Google Scholar] [CrossRef] [PubMed]
  27. Neng, J.; Harpster, M.H.; Zhang, H.; Mecham, J.O.; Wilson, W.C.; Johnson, P. A versatile SERS-based immunoassay for immunoglobulin detection using antigen-coated gold nanoparticles and malachite green-conjugated protein A/G. Biosens. Bioelectron. 2010, 26, 1009–1015. [Google Scholar] [CrossRef] [PubMed]
  28. Neng, J.; Harpster, M.H.; Wilson, W.C.; Johnson, P. Surface-enhanced Raman scattering (SERS) detection of multiple viral antigens using magnetic capture of SERS-active nanoparticles. Biosens. Bioelectron. 2013, 41, 316–321. [Google Scholar] [CrossRef] [PubMed]
  29. Craig, A.P.; Franca, A.S.; Irudaaraj, J. Surface-enhanced Raman spectroscopy applied to food safety. Ann. Rev. Food Sci. Technol. 2013, 4, 369–380. [Google Scholar] [CrossRef] [PubMed]
  30. Zheng, J.; He, L. Surface-enhanced Raman spectroscopy for the chemical analysis of food. Compr. Rev. Food Sci. Food Saf. 2014, 13, 317–329. [Google Scholar]
  31. Wang, Y.L.; Ravindranath, S.; Irudaaraj, J. Separation and detection of multiple pathogens in a food matrix by magnetic SERS nanoprobes. Anal. Bioanal. Chem. 2011, 399, 1271–1278. [Google Scholar] [CrossRef] [PubMed]
  32. Guo, Z.; Cheng, Z.; Li, R.; Chen, L.; Lv, H.; Zhao, B.; Choo, J. One-step detection of melamine in milk by hollow gold chip based on surface-enhanced Raman scattering. Talanta 2014, 122, 80–84. [Google Scholar] [CrossRef] [PubMed]
  33. He, L.; Liu, Y.; Lin, M.; Awika, J.; Ledoux, D.R.; Li, H.; Mustapha, A. A new approach to measure melamine, cyanuric acid, and melamine cyanurate using surface enhanced Raman spectroscopy coupled with gold nanosubstrates. Sens. Instrum. Food Qual. 2008, 2, 66–71. [Google Scholar] [CrossRef]
  34. Chen, J.; Su, X.O.; Yao, Y.; Han, C.; Wang, S.; Zhao, Y. Highly sensitive detection using a one-step sample combined with a portable array SERS sensor. PLoS ONE 2016, 11, e0154402. [Google Scholar]
  35. Giovannozzi, A.M.; Rolle, F.; Sega, M.; Abete, M.C.; Marchis, D.; Rossi, A.M. Rapid and sensitive detection of melamine in milk with gold nanoparticles by Surface Enhanced Raman Scattering. Food Chem. 2014, 159, 250–256. [Google Scholar] [CrossRef] [PubMed]
  36. Lin, S.; Hasi, W.L.J.; Lin, X.; Han, S.Q.G.W.; Lou, X.T.; Yang, F.; Lin, D.Y.; Lu, Z.W. Rapid and sensitive SERS method for determination of Rhodamine B in chili powder with paper-based substrates. Anal. Methods 2015, 7, 5289–5294. [Google Scholar] [CrossRef]
  37. Lin, M.; He, L.; Awika, J.; Yang, L.; Ledoux, D.R.; Li, H.; Mustapha, A. Detection of melamine in gluten, chicken feed, and processed foods using Surface Enhanced Raman Spectroscopy and HPLC. J. Food Sci. 2008, 73, T129–T134. [Google Scholar] [CrossRef] [PubMed]
  38. Yu, W.W.; White, L.M. Chromatographic separation and detection of target analytes from complex samples using inkjet printed SERS substrates. Analyst 2013, 138, 3679–3686. [Google Scholar] [CrossRef] [PubMed]
  39. Wang, J.F.; Wu, X.Z.; Xiao, R.; Dong, P.T.; Wang, C.G. Performance-enhancing methods for Au film over nanosphere Surface-Enhanced Raman Scattering substrate and melamine detection application. PLoS ONE 2014, 9, 1–6. [Google Scholar] [CrossRef] [PubMed]
  40. Lee, H.; Kim, M.S.; Suh, S.W. Raman spectroscopy of sulphur-containing amino acids and their derivatives adsorbed on silver. J. Raman Spectrosc. 1991, 22, 91–96. [Google Scholar] [CrossRef]
  41. Yang, J.; Tan, X.; Shih, W.C.; Cheng, M.M. A sandwich substrate for ultrasensitive and label-free SERS spectroscopic detection of folic acid/methotrexate. Biomed. Microdevices 2014, 16, 673–679. [Google Scholar] [CrossRef] [PubMed]
  42. Ai, K.; Liu, Y.; Lu, L. Hydrogen-bonding recognition-induced color change of gold nanoparticles for visual detection of melamine in raw milk and infant formula. J. Am. Chem. Soc. 2009, 131, 9496–9497. [Google Scholar] [CrossRef] [PubMed]
  43. Xu, H.-R.; Zhang, Q.-C.; Ren, Y.-P.; Zhao, H.-X.; Long, L.-S.; Huang, R.-B.; Zheng, L.-S. The influence of water on dielectric property in cocrystal compound of [orotic acid] [melamine] H2O. CrystEngComm 2011, 13, 6361–6364. [Google Scholar] [CrossRef]
  44. Chen, Z.-X.; Su, X.-X.; Deng, S.-P. Molecular recognition of melamine by vesicles spontaneously formed from orotic acid derived bolaamphiphiles. J. Phys. Chem. B 2011, 115, 1798–1806. [Google Scholar] [CrossRef] [PubMed]
  45. Mirzabe, G.H.; Keshtkar, A.R. Application of response surface methodology for thorium adsorption on PVA/Fe3O4/SiO2/APTES nanohybrid adsorbent. J. Ind. Eng. Chem. 2015, 26, 277–285. [Google Scholar] [CrossRef]
  46. Frens, G. Controlled nucleation for regulation of particle-size in monodisperse gold suspensions. Nature 1972, 241, 20–22. [Google Scholar] [CrossRef]
  47. Boolchand, P.; Jin, M.; Novita, D.I.; Chakravarty, S. Raman scattering as a probe of intermediate phases in glassy networks. J. Raman Spectrosc. 2007, 38, 660–672. [Google Scholar] [CrossRef]
Figure 1. The hydrogen bonding-assisted [Fe3O4/Au–AOA•••melamine•••AOA–RhB] surface enhanced Raman spectroscopy (SERS) matrix.
Applsci 07 00475 g001
Figure 2. Transmission electron microscope (TEM) images of Fe3O4 nanoparticles (a), Au nanoparticles (b), Fe3O4/Au nanoparticles at normal resolution (ce), and high resolution (f).
Applsci 07 00475 g002aApplsci 07 00475 g002b
Figure 3. Energy dispersive X-ray (EDX) spectrum of Fe3O4/Au gold magnetic nanoparticles.
Applsci 07 00475 g003
Figure 4. Fourier transform infrared spectroscopy (FTIR) spectra of Fe3O4/Au (a), 5-aminoorotic acid (AOA) (b), and Fe3O4/Au–AOA (c).
Applsci 07 00475 g004
Figure 5. FTIR spectra of (a) RhB and (b) RhB-conjugated AOA.
Applsci 07 00475 g005
Figure 6. FTIR spectra of Fe3O4/Au–AOA (a), AOA–RhB (b), melamine (c), and [Fe3O4/Au–AOA•••melamine•••AOA–RhB] (d).
Applsci 07 00475 g006
Figure 7. Raman spectra of the mixture of Fe3O4/Au–AOA and AOA–RhB (a) in the absence of melamine and (b) in the presence of 1.0 µg/mL of melamine.
Applsci 07 00475 g007
Figure 8. Raman spectra of [Fe3O4/Au–AOA•••melamine•••AOA–RhB] in water at melamine concentration of 0 µg/mL (a), 1.0 µg/mL (b), 2.5 µg/mL (c), 5.0 µg/mL (d), 10.0 µg/mL (e), and 15.0 µg/mL (f). (Inset: logarithmic linear correlation of peak intensity at 1510 cm−1 and melamine concentrations).
Applsci 07 00475 g008
Figure 9. Raman spectra of [Fe3O4/Au–AOA•••melamine•••AOA–RhB] in milk at melamine concentration of 0 µg/mL (a), 2.0 µg/mL (b), 2.5 µg/mL (c), 5.0 µg/mL (d), 10.0 µg/Ml (e), and 15.0 µg/mL (f).
Applsci 07 00475 g009

