
Optimization of Hybrid Ultrasonic Frequency Pulsed VP-GTAW Process Parameters on Tensile Properties of AA 5456 Alloy


1
Department of Materials Processing, Beijing University of Aeronautics and Astronautics, Beijing 100191, China
2
MIIT Key Laboratory of Aeronautics Intelligent Manufacturing, Beijing 100191, China
*
Author to whom correspondence should be addressed.
Appl. Sci. 2017, 7(5), 485; https://doi.org/10.3390/app7050485
Submission received: 17 March 2017
/
Revised: 18 April 2017
/
Accepted: 5 May 2017
/
Published: 8 May 2017
(This article belongs to the Special Issue Gas Tungsten Arc Welding)
Abstract
:Tensile properties optimization of AA 5456 aluminum alloy was carried out with hybrid ultrasonic frequency pulsed variable polarity gas tungsten arc wending (HPVP-GTAW). An orthogonal method was employed to conduct the experiments, and the tensile properties of AA 5456 aluminum alloy welded joints were measured and analyzed. Regression models were developed based on the least square estimation by taking tensile strength, yield strength, percent elongation, and ratio of reduction in area as response functions of variable polarity frequency fL, pulse frequency fH and a dimensionless parameter ψ, which were calculated by background current Ib, peak current Ip, and pulse duration δ, respectively. The developed regression equations were checked for validity by coefficient of correlation r2 and confirmatory experiments. Optimum parameters of HPVP-GTAW were achieved through the discussion on response surfaces and contour plots drawn using the regression equations.
1. Introduction
Aluminum-magnesium alloys, which are classified as non-heat treatable and strain hardening alloy series, are extensively used in aeronautics and astronautics industries due to their great corrosion resistance, excellent fatigue properties, and fracture toughness, in addition to the general characteristics of aluminum alloys [1]. Welding fabrication is one of the key manufacturing methods for aluminum alloy parts [2]. In general, the variable polarity gas tungsten arc welding (VP-GTAW) process is popularly employed in the welding of thin aluminum alloy plates, in which the surface oxide film can be effectively cleaned by cathode atomization in the negative polarity stage and the base metal is principally melted in positive polarity stage [3].
The strengthening mechanism of non-heat treatable Al-Mg alloys, typical 5xxx series, is mainly the result of the existence of alloying elements such as magnesium and silicon that play an important role in precipitation strengthening and solid solution strengthening. Al-Mg 5xxx series contain more than 3.0% magnesium, while the vaporization of alloying elements will occur during welding fabrication. This vaporization loss may reduce the mechanical properties of welded joints by affecting the chemical compositions of molten pool [4,5,6]. In order to enhance the weld quality of Al-Mg alloys, metallurgical advantages of welds produced by high-frequency pulsed and magnetic arc oscillation methods are frequently investigated, including stirring effect on molten pool, refinement of grains, reduction of distortion, and control of segregation [7,8,9]. A novel hybrid ultrasonic frequency pulsed VP-GTAW (HPVP-GTAW) technique has been developed in which ultrasonic frequency pulsed current is accurately superimposed in the positive polarity stage during VP-GTAW process. This process has been employed in aluminum alloy welding, and series experimental results have proven that ultrasonic frequency pulsed current is beneficial to the elimination of the weld porosity [10], the reduction of the width of HAZ [11], the increase of the weld penetration [12], the refinement of the microstructure in weld zone [13,14,15], and the improvement of the mechanical properties of welded joints [16,17,18]. However, research work on the optimization of process parameters with HPVP-GTAW has not been done before.
The purpose of the present study was to optimize the HPVP-GTAW process parameters for enhancing the mechanical properties of 5xxx aluminum alloy welded joints. Orthogonal design, a multi-factor and multi-level experimental method, was employed in this study. Using this method, some representative points were selected to design the experiments for the optimization of indicators, thereby reducing the number of experiments [19,20]. Regression analysis method was also employed by regarding tensile strength, yield strength, percent elongation, and ratio reduction in area as indicators, and regression equations were obtained using the least square estimation. The optimum parameters of HPVP-GTAW process for AA 5456 aluminum alloy were obtained by analyzing the response surfaces and contour plots based on the regression equations.
2. Experimental Procedure
2.1. Materials
The base metal used in this study was AA 5456 aluminum alloy plates with a chemical composition of Mg 5.8, Si 0.4, Mn 0.6, Zn 0.2, Cu 0.1, and Al balance (all in wt %). The gauge dimension was 200 mm × 100 mm × 3 mm. The filler material selected was 2.4 mm in diameter ER5356, with a chemical composition of Mg 5.0, Si 0.25, Mn 0.12, Zn 0.1, Cu 0.1, and Al balance (all in wt %). Typical “I” butt joints of 200 mm in length were produced by hybrid ultrasonic frequency pulsed VP-GTAW process.
2.2. Welding Process Parameters
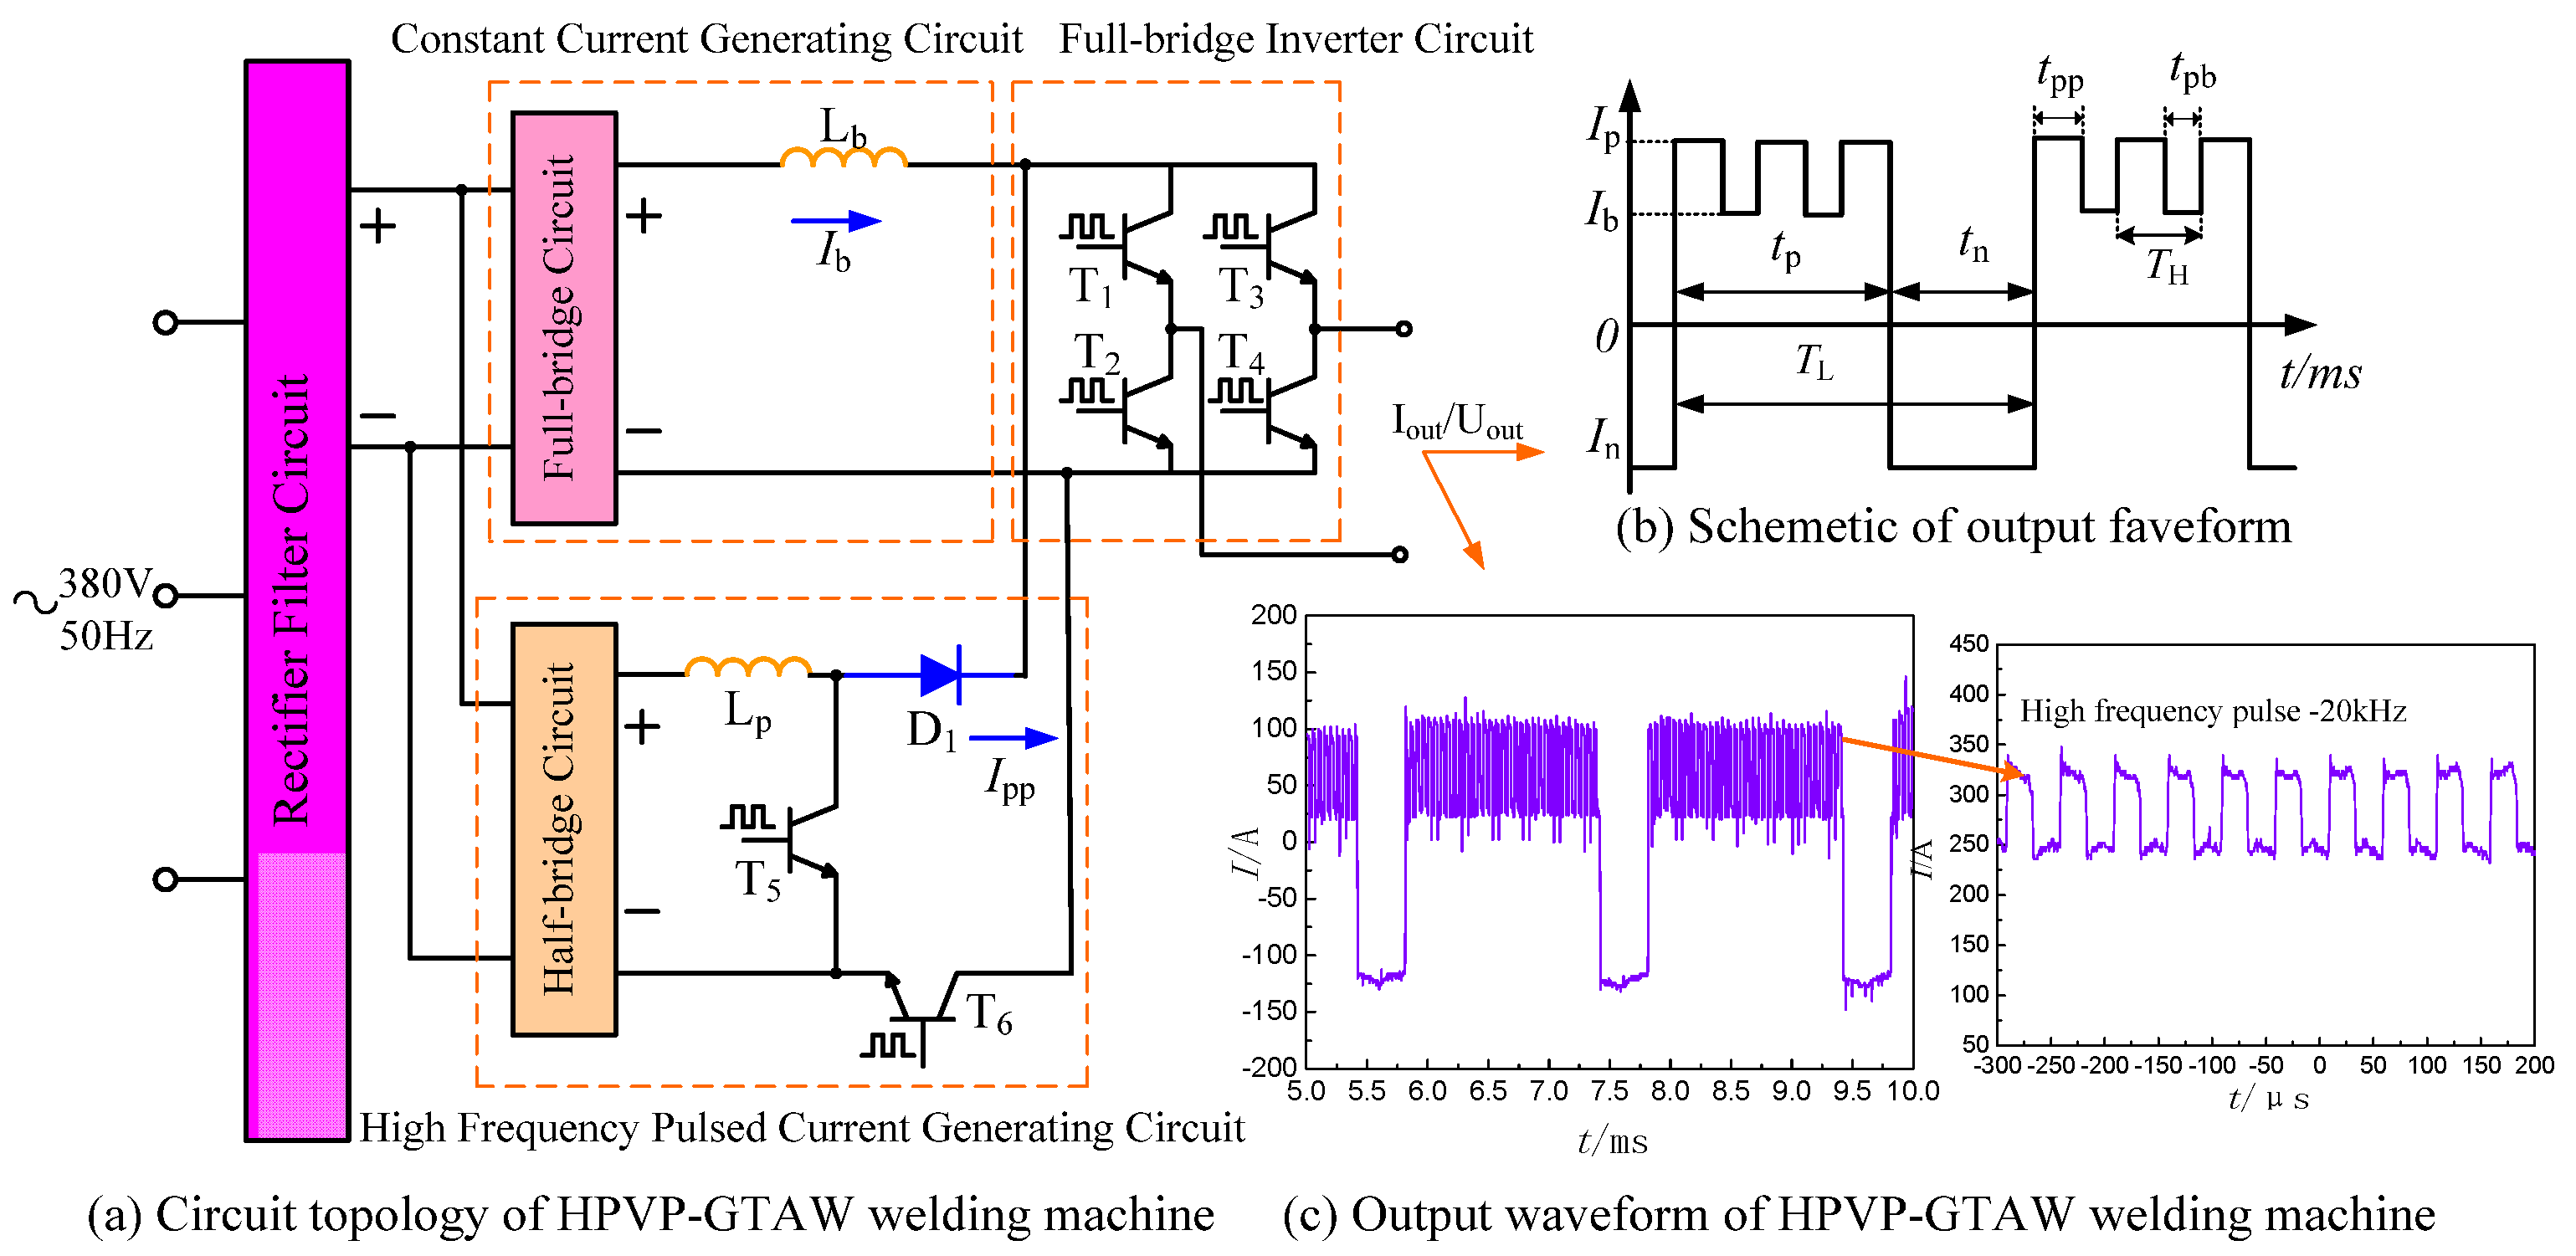
The schematic diagram of circuit topology and the actual welding current waveform of HPVP-GTAW are shown in Figure 1. The HPVP-GTAW power source mainly includes constant current generating circuit, high frequency pulsed current generating circuit (5 KHz–40 kHz high frequency pulsed current) and full-bridge inverter circuit (0.1 KHz–1 kHz variable polarity current).
According to the literature [11,12,13] and previous research work [14,15,16,17,18], among all the parameters, the characteristic parameters, such as variable polarity frequency fL, high-frequency pulsed background current Ib, high-frequency pulsed peak current Ip, pulse duration δ and pulse frequency fH, have a greater influence on the weld penetration and tensile properties of aluminum alloy welded joints. Then, the above-mentioned factors were taken as welding process parameters.
2.3. Variation Range of Welding Process Parameters
In order to ensure the uniformity of the input power, it is necessary to simultaneously adjust Ip, Ib and δ. G.E. Cook [21,22] stated that the average input power by pulsed current is principally determined by Equation (1).
where Pin is the input power; Ieff is the effective current; Iavg is the average current; and A1, A2, A3 are the constant values depending on arc length, dimension of electron, type of base metal material, and shielding gas, etc. In this research, the error range of Ieff and Iavg should be controlled within ±5 A. Meanwhile, a dimensionless parameter ψ was introduced to represent Ip, Ib, and δ synchronously. ψ is calculated as,
2.4. Selection of Orthogonal Array
In this study, there were three welding parameters, and each parameter possessed three levels. Therefore, L9(34) orthogonal experimental array was employed, as shown in Table 3.
2.5. Tensile Property Test
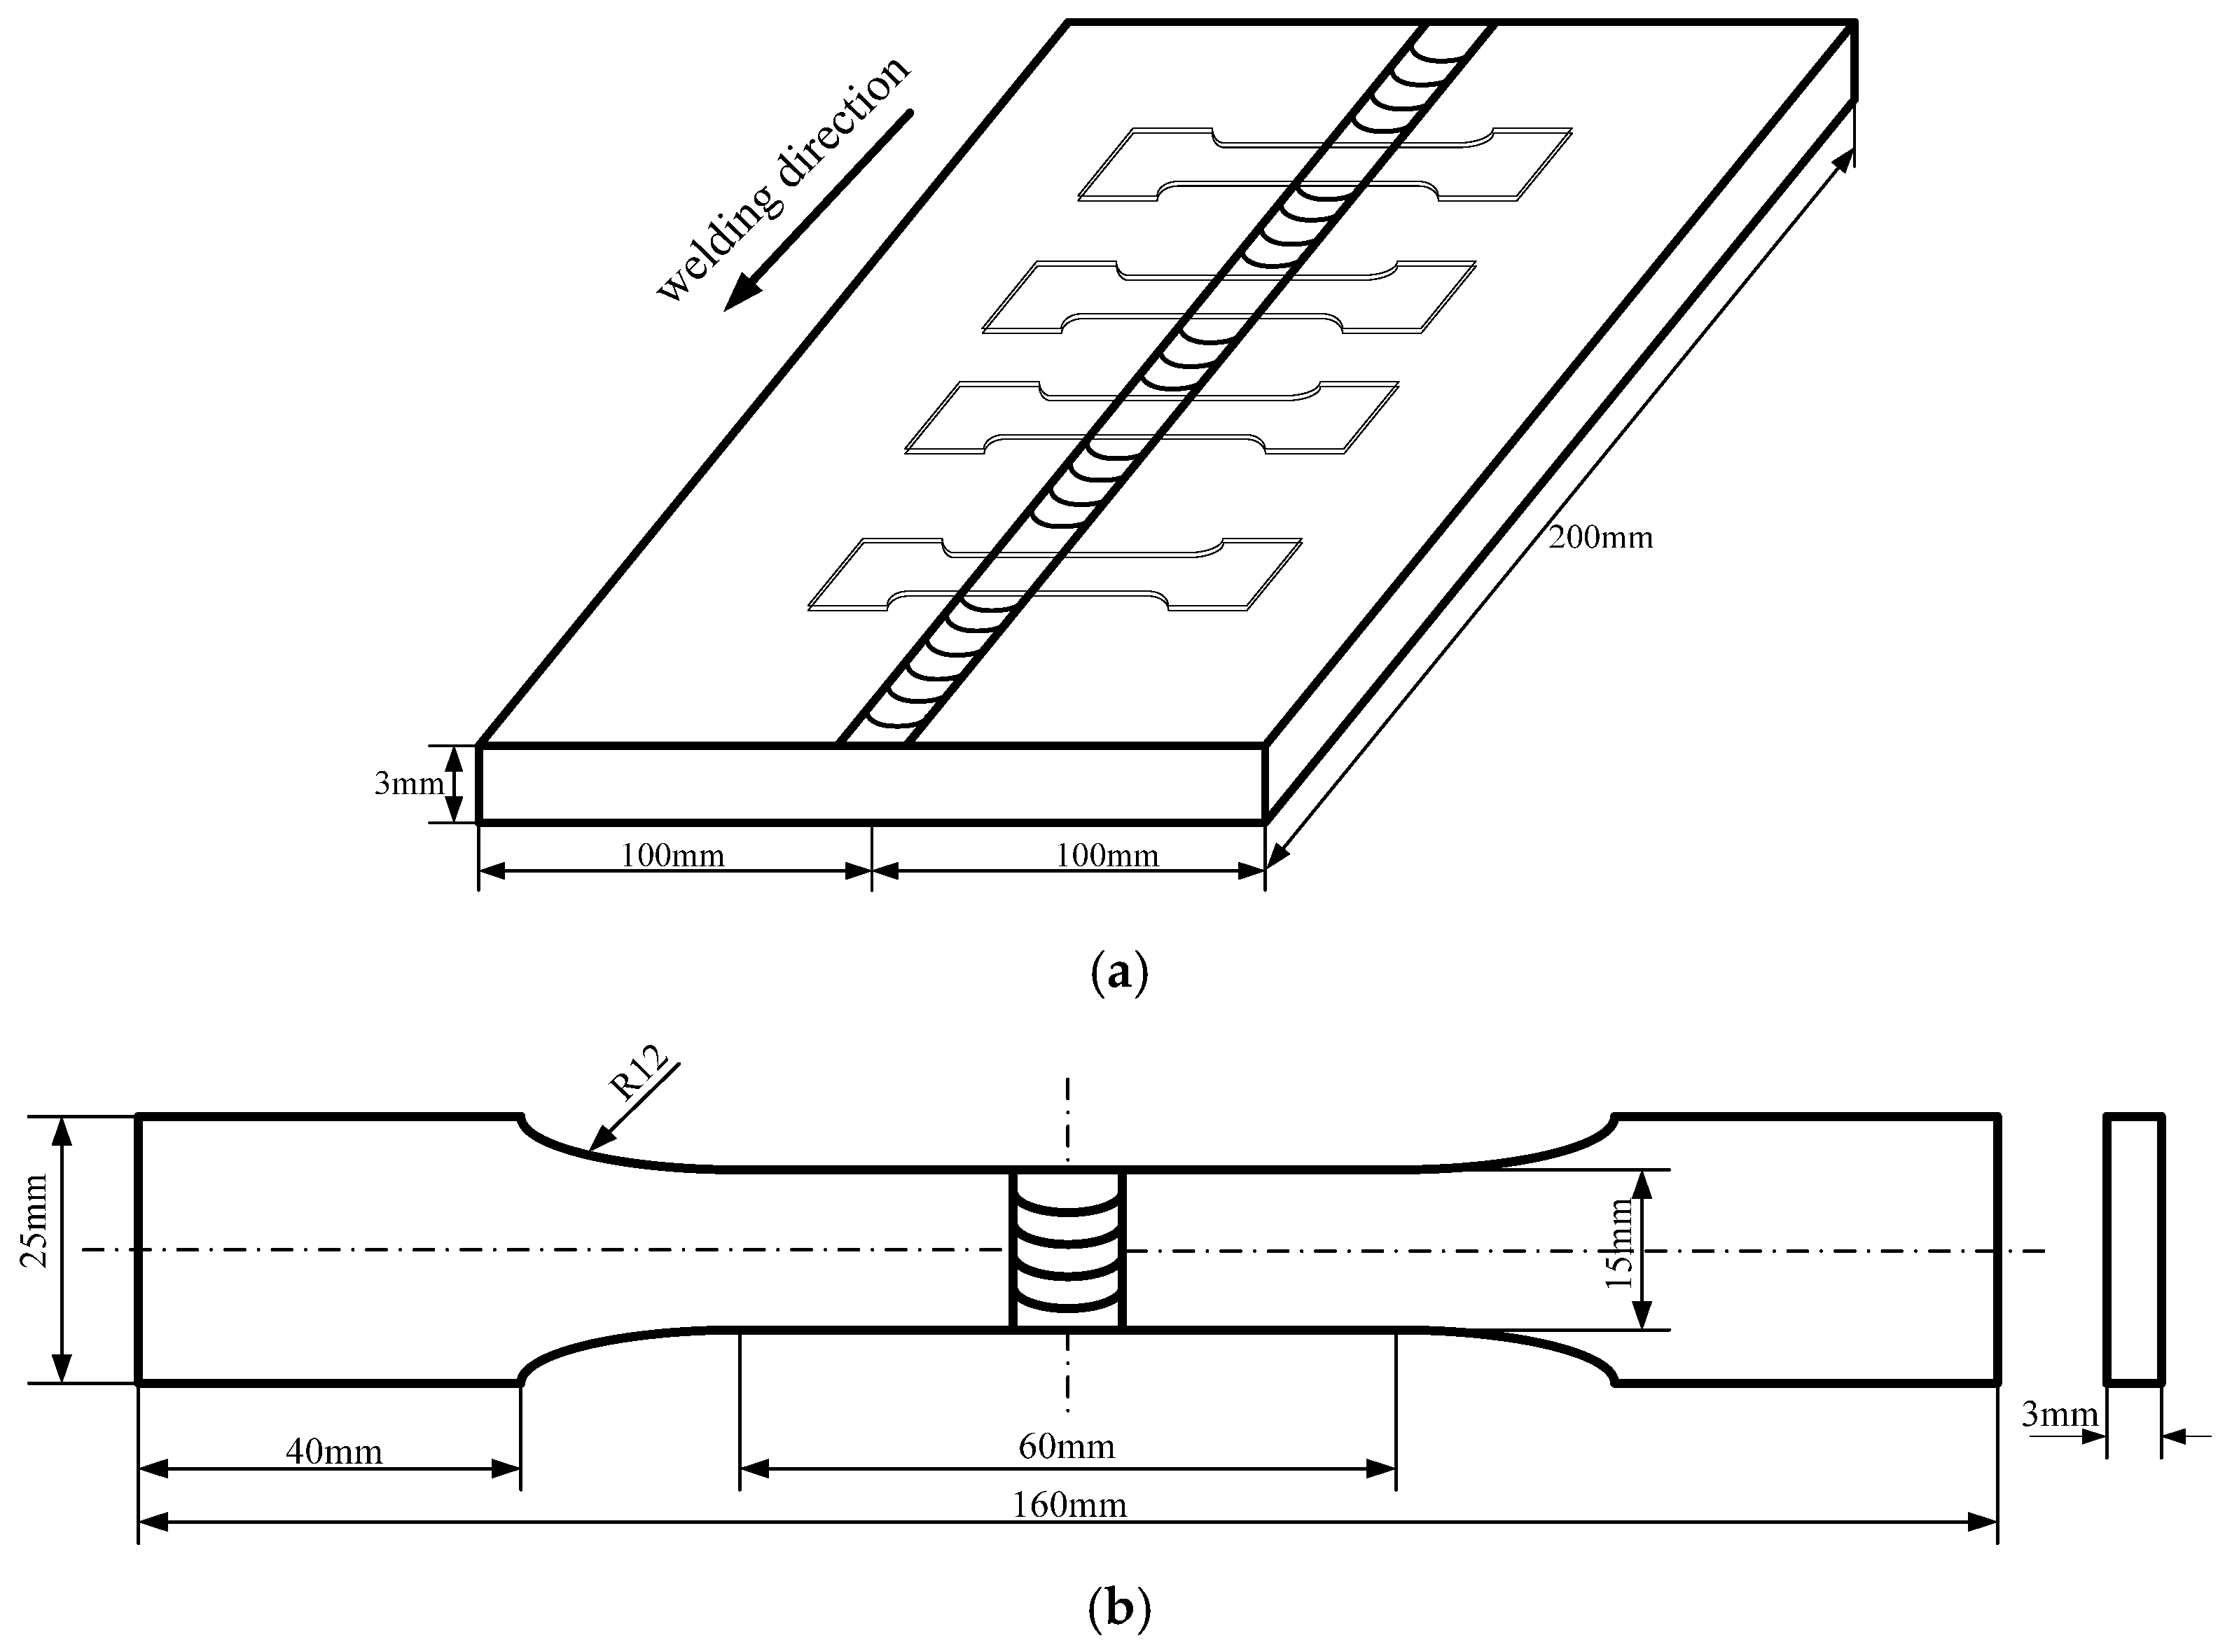
The specimens for tensile testing were cut transverse to the welding direction, and the cutting sections were selected in the middle of the welding bead as seen in Figure 2a. To ensure accuracy and repeatability, four tensile specimens were prepared for each experimental condition to calculate the average value. As shown in Figure 2b, the dimensions of the specimens were processed according to standard metallographic procedures. Tensile testing was conducted using a computer-controlled DWD-50E electronic universal tensile testing machine at a strain rate of 3 mm/min.
The results of nine groups of orthogonal experiments are listed in the Table 4, where TS is the tensile strength, YS is the yield strength, PE is the percent elongation, and RA is the ratio of reduction in area.
3. Regression Analysis
3.1. Development of the Regression Models
Take indicators including tensile strength, yield strength, percent elongation and ratio of reduction in area as response function of fL, fH and ψ. The response function can be expressed as the following:
where fL, fH, ψ are independent variables and y is dependent variable. The function f can be developed through regression analysis. The selected regression model involves the above three factors and the interaction of high frequency parameters fH and ψ. It can be expressed as,
where β0 is the regression constant; β1, β2, ···, β7 are the regression coefficients. β0, β1, β2, ···, β7 are unknown parameters to be determined.
3.2. Determination of the Regression Coefficients
In order to determine the regression coefficients, the least square method is used based on the thought that the regression coefficients can be estimated when the error sum of squares Q is at its minimum, which can be expressed as Equations (5) and (6).
where are the estimated values of the regression coefficients; n is the number of the experiments; p is the number of independent variables. The regression coefficients can be acquired when the partial differential of Q to β equals to zero, as given by Equation (7).
The regression coefficients are obtained through the computer-aided calculation software, and the developed regression equations are given by Equations (8)–(11).
3.3. Checking the Adequacy of the Regression Equations
It is necessary to examine the fitting degree between the regression equations and experimental values since the regression equations can be developed by least square method even though the experimental values are of unordered points. The adequacy of regression equation is evaluated by coefficient of correlation r2, which reflects the fitting degree of the regression equation and can be calculated using the following expression [4].
where Yp is the predicted value; Yavg is the average value of experimental value; Ye is the experimental value. The value of r2 ranges from 0 to 1. When r2 tends to 0, it means that the fitting degree of regression model is the lowest, and the fitting degree increases with the increase of r2. The experimental values fall on the curve drawn by regression model when r2 approaches to 1, revealing that the regression equation perfectly fit the actual values. The coefficients of correlation corresponding to each regression equation are 0.87, 0.88, 0.84 and 0.86, respectively. It is evident that, all the coefficients of correlation r2 of the developed models tend to 1, so that the developed regression equations are significant.
3.4. Identification of the Validity of the Regression Equations
Confirmatory experiments have been conducted to identify the validity of the developed regression equations by comparing the experimental results with the predicted values. The results are listed in Table 5, where percent deviation is calculated by,
where EV is the experimental value; PV is the predicted value. From the results, it can be found that the predicted values by regression equations fit the experimental results within a reasonable error. Therefore, the regression equations can be used to predict the response of tensile properties to fL, fH, and ψ.
4. Results and Discussion
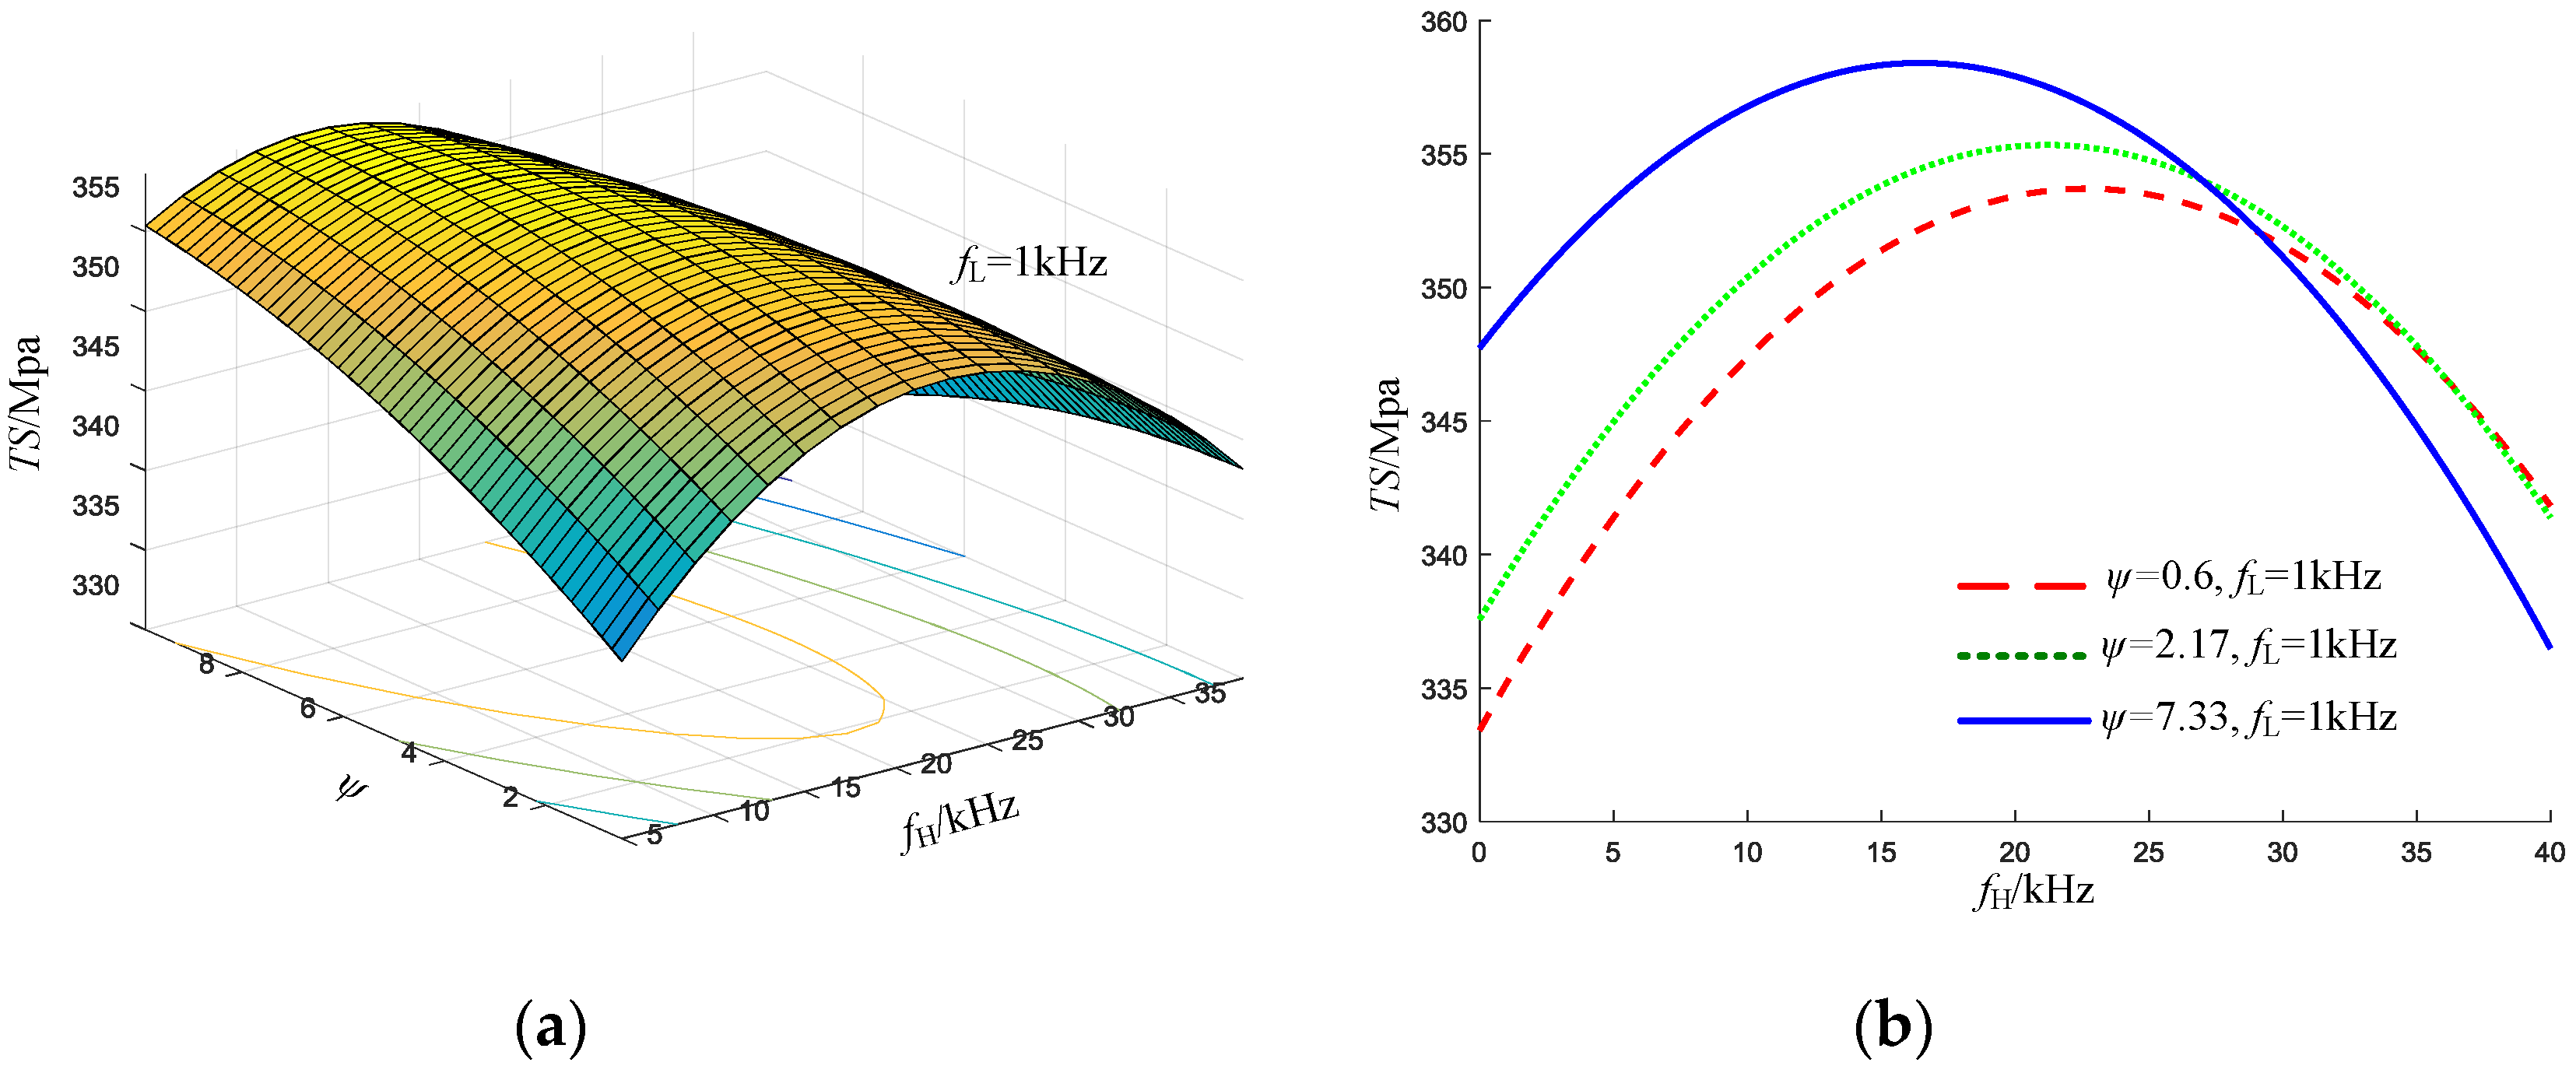
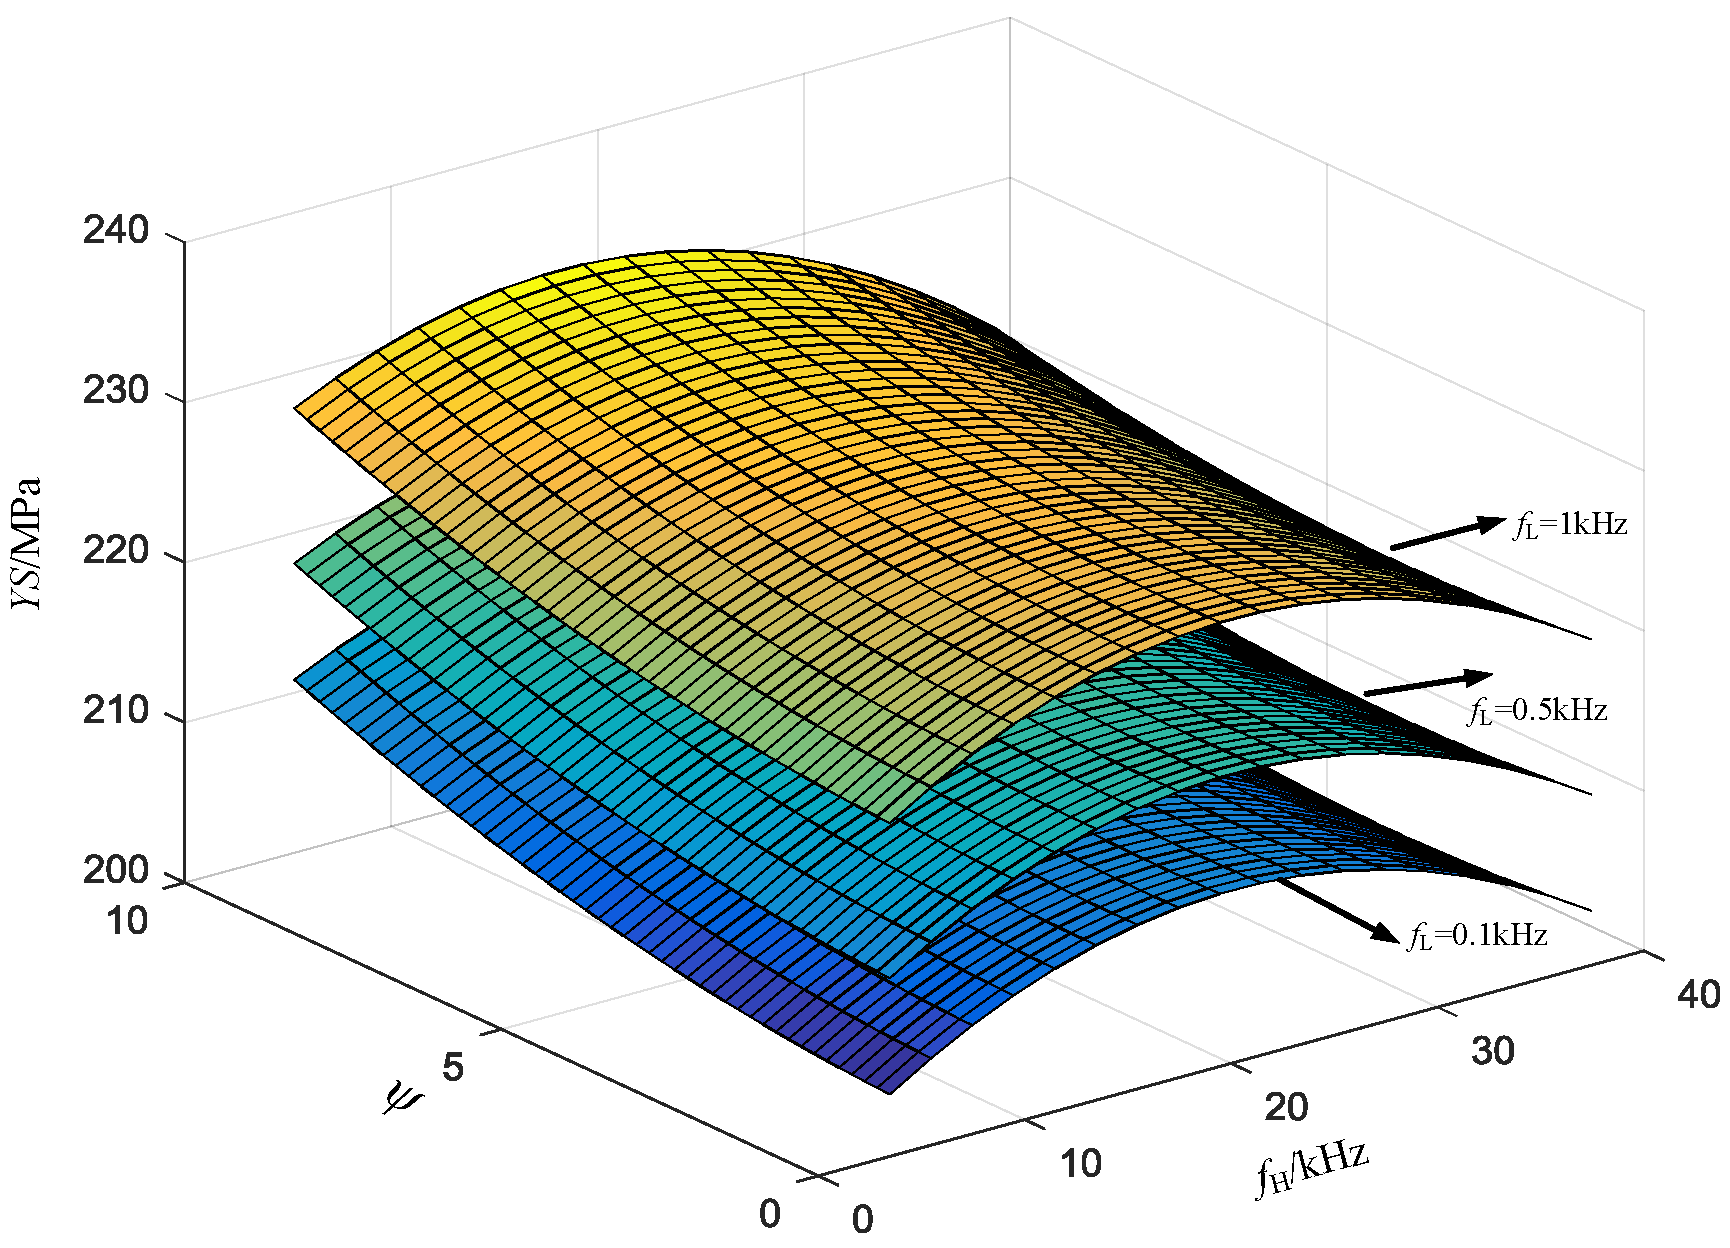
The response surfaces of tensile strength versus fL, fH, and ψ obtained by Equation (8) are shown in Figure 3. Tensile strength increases significantly as fL changes from 0.1 kHz to 1 kHz in all conditions of fH and ψ. It reaches the maximum level when fL is 1 kHz. Therefore, 1 kHz is the optimum parameter of fL in terms of the tensile strength. In order to determine the optimum parameters of fH and ψ, contour plot and interaction of fH and ψ when fL is 1 kHz are illustrated in Figure 4. It can be found that the tensile strength monotonically rises when fH is less than 20 kHz, where it comes to the maximum level. The tensile strength declines as fH varies from the range of 20 kHz to 40 kHz. Therefore, 20 kHz is the optimum parameter of fH. In the point of ψ, tensile strength increases with an increasing ψ in the condition that fH is constant at 20 kHz. Thus, 7.33 is the optimum parameter of ψ. As shown in Figure 5 and Figure 6, the changing tendency of yield strength is almost the same as that of tensile strength, so that they share the same optimum parameters. In summary, the optimum parameters on both tensile strength and yield strength are fL = 1 kHz, fH = 20 kHz and ψ = 7.33 (i.e., Ib is 60 A, Ip is 110 A and δ is 0.8).
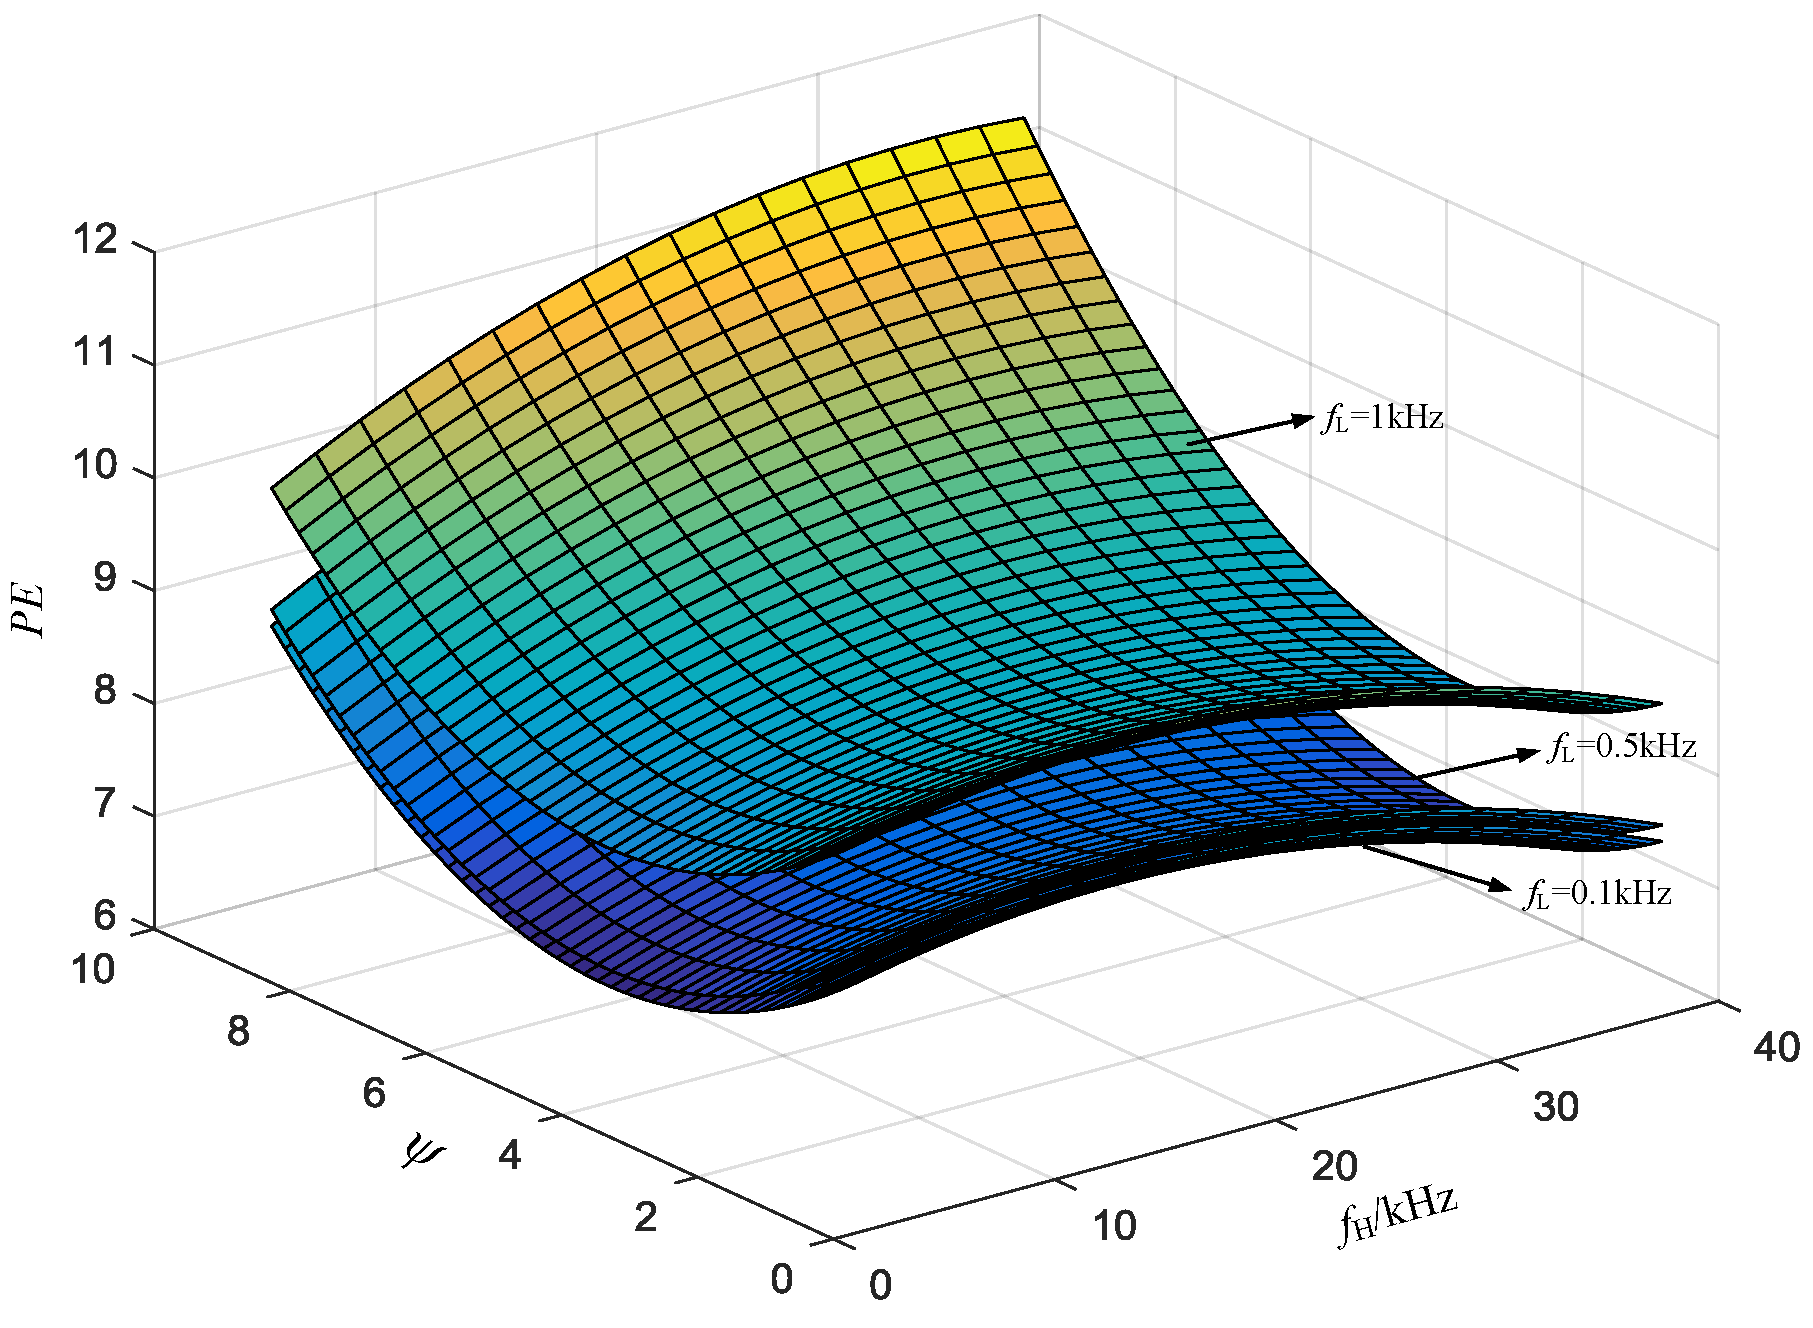
The response surfaces and contour plots of percent elongation and ratio of reduction in area are presented in Figure 7, Figure 8, Figure 9 and Figure 10, respectively. It is observed that fL and fH regarding to both the percent elongation and the ratio of reduction in area own the same changing tendency as tensile strength. As a consequence, 1 kHz and 20 kHz are the optimum parameters of fL and fH, respectively. However, as shown in Figure 8 and Figure 10, the response of percent elongation and the ratio of reduction in area versus ψ show completely different changing tendency. The response values are at the maximum when ψ is 0.6 under the condition that fL is 1 kHz and fH is 20 kHz. As a result, the optimum parameter of ψ is 0.6. In general, the optimum parameters on both percent elongation and the ratio reduction in area are fL = 1 kHz, fH = 20 kHz and ψ = 0.6 (i.e., Ib is 75 A, Ip is 180 A and δ is 0.2).
The optimum parameter of ψ to tensile strength and yield strength is 7.33, while that to percent elongation and ratio of reduction in area is 0.6. With every factor considered comprehensively, it can be concluded that plastic properties, including percent elongation and ratio of reduction in area, play a more important role in tensile properties than tensile strength because all the values of tensile strength in these experiments are more than 300 MPa, which is high enough in most applications. Plastic properties restrict the further improvement of mechanical properties of AA 5456 aluminum alloy [4]. Therefore, take 0.6 as the optimal parameter of ψ when plastic properties are at maximum. In conclusion, the optimum parameters, which take tensile properties into comprehensive consideration, are fL = 1 kHz, fH = 20 kHz and ψ = 0.6 (i.e., Ib is 75 A, Ip is 180 A and δ is 0.2).
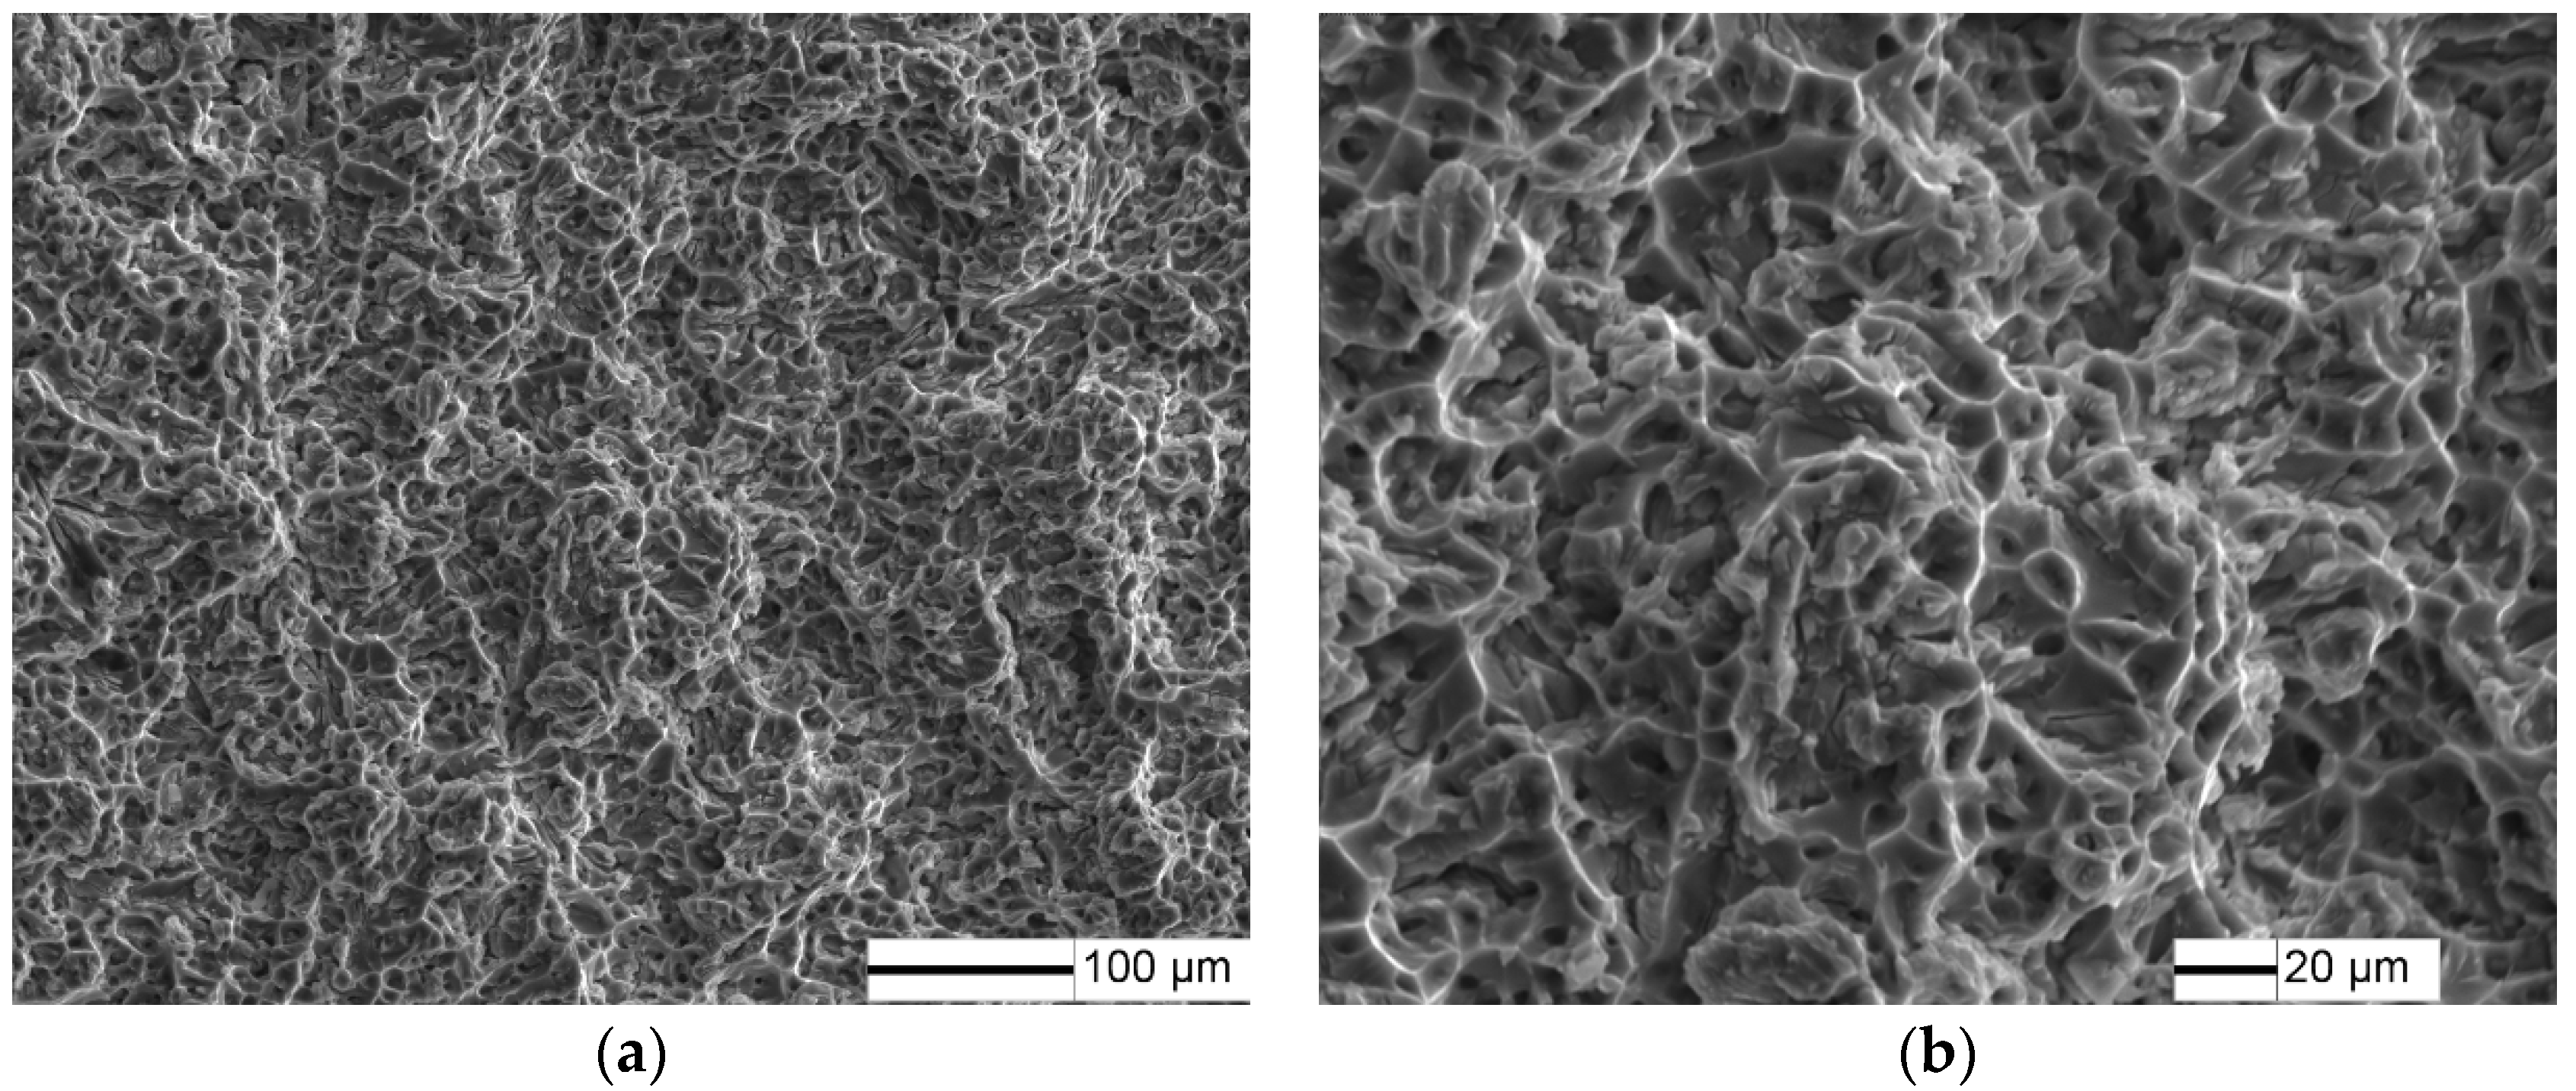
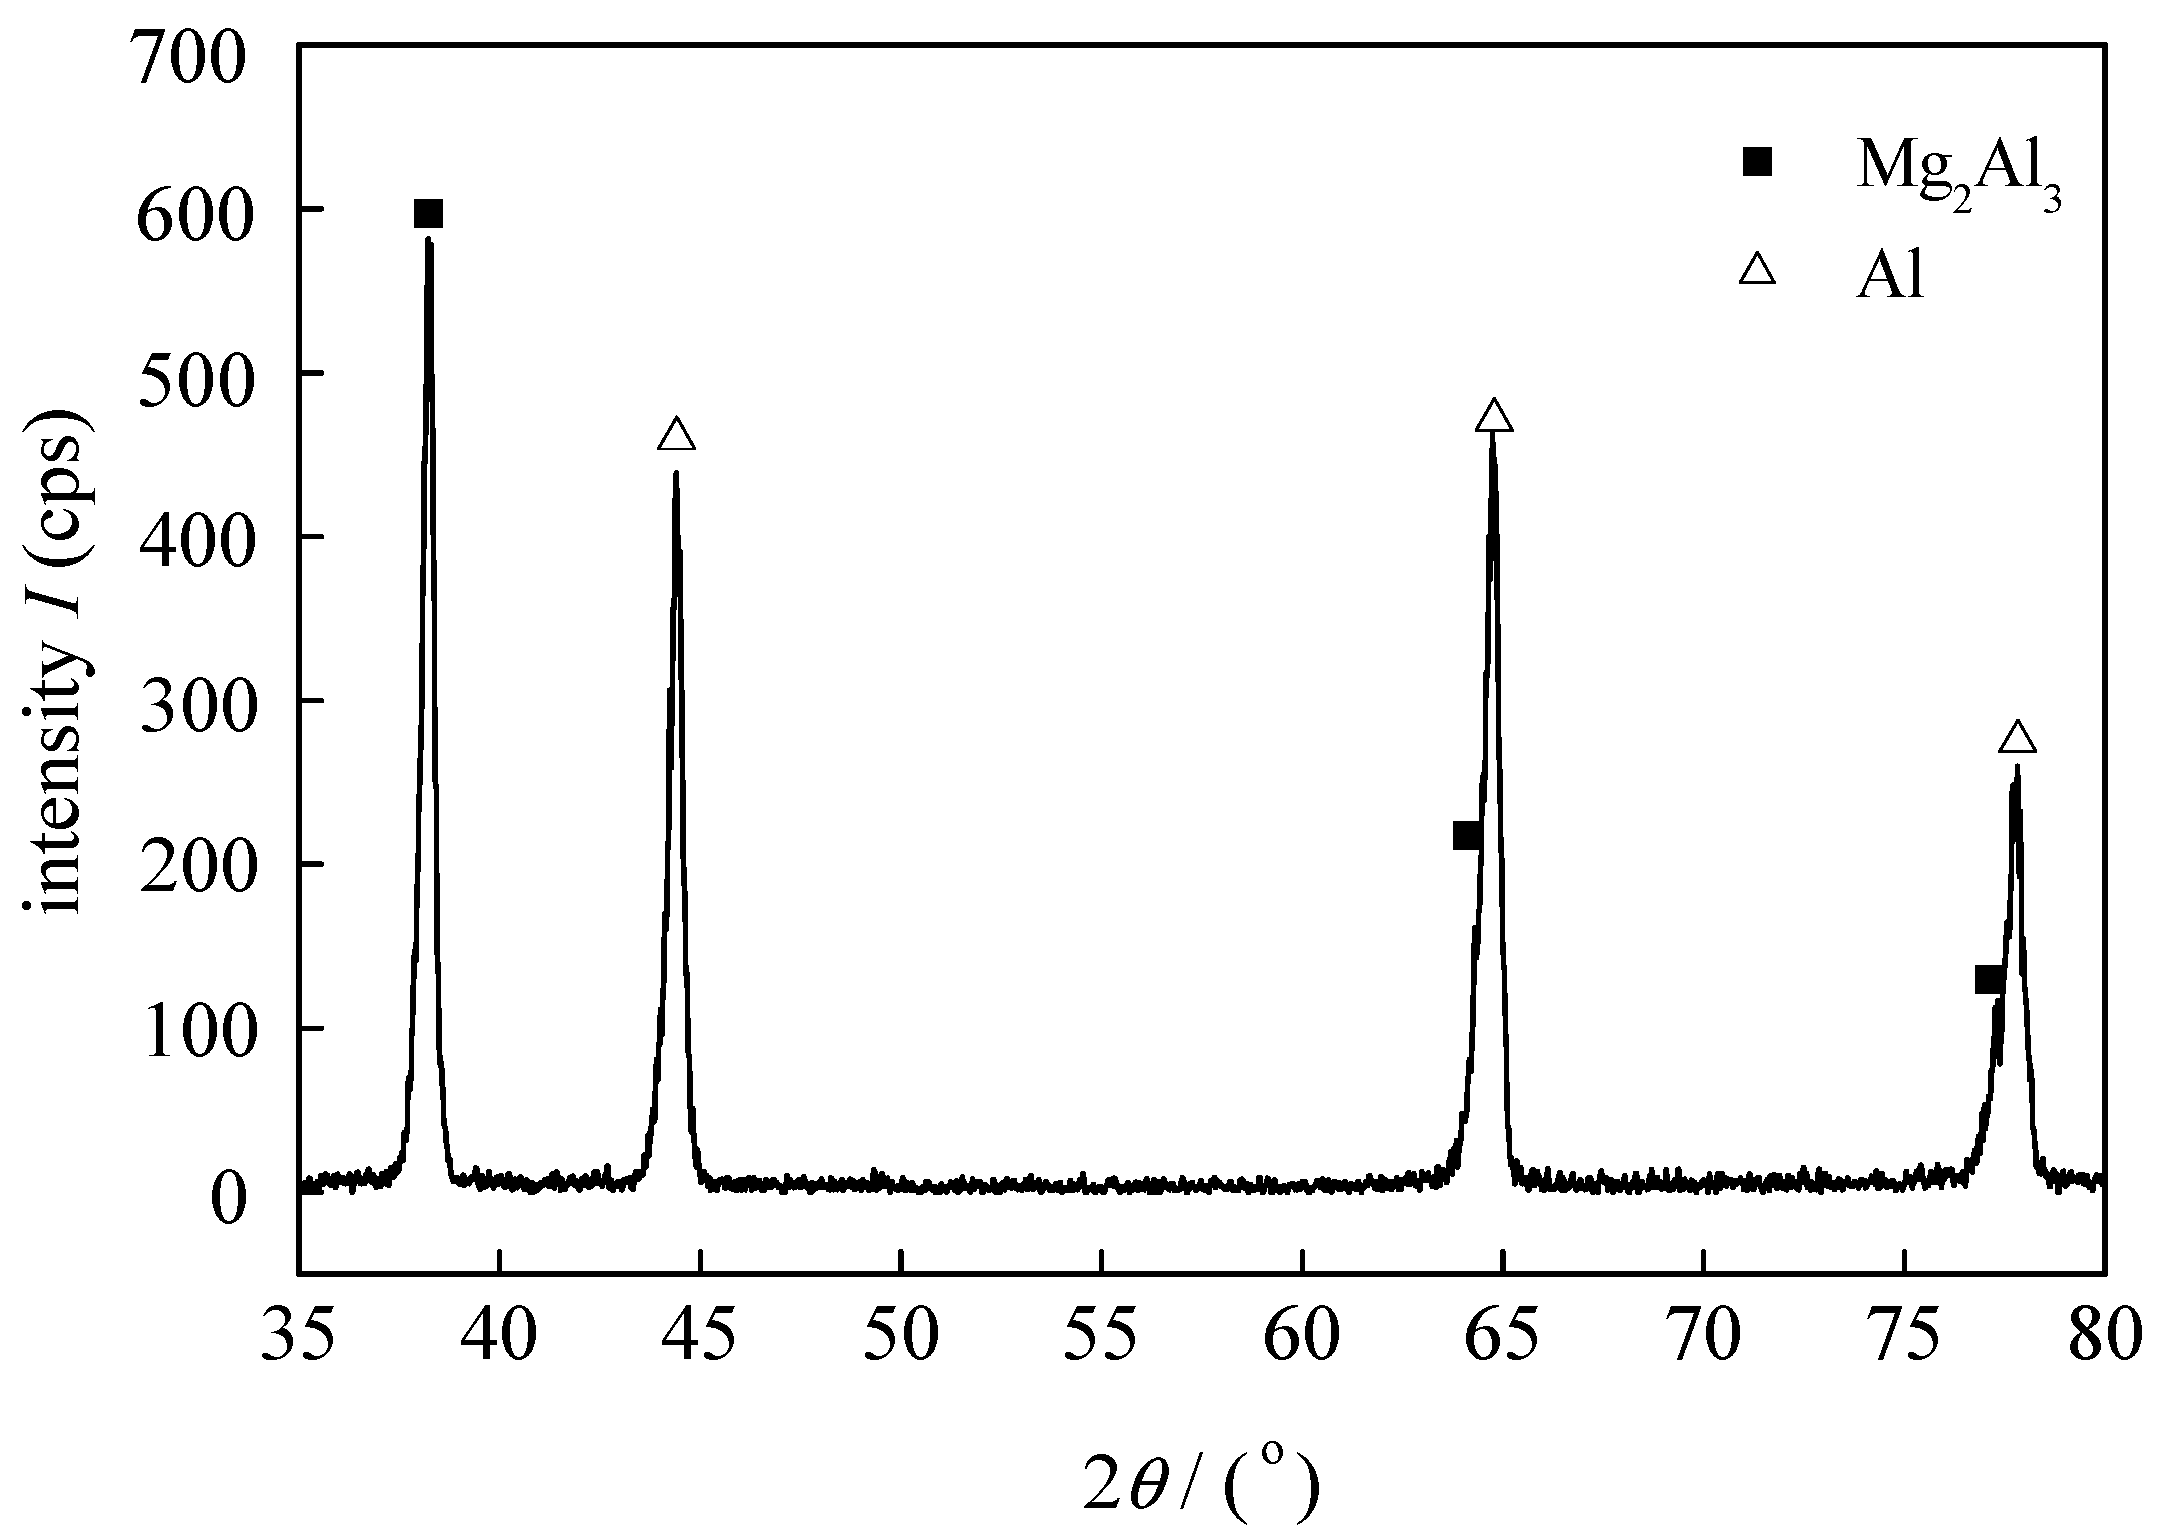
The optimum parameters obtained above happen to be Group 8 in the orthogonal experiment, in which the tensile strength is 358 MPa, the yield strength is 229 MPa, the percent elongation is 9.7%, and the ratio of reduction in area is 12.8%. Compared with the results of other experiments, the tensile properties of Group 8 are all at the maximum. The microstructure of weld zone with energy dispersive spectrometer (EDS) analysis and X ray diffraction (XRD) analysis are shown in Figure 11 and Figure 12, respectively. The results of XRD analysis and EDS analysis show that the second-phase particles are identified as intermetallic compound Mg2Al3. Weld zone of AA 5456 alloy is mainly composed of α (Al) solid solution, around which are uniformly dispersed by β (Mg2Al3) second-phase particles. The β (Mg2Al3) phase can improve the mechanical properties of AA 5456 alloy through distorting the crystal lattice around α (Al), and then prevent the dislocation motion [23]. Figure 13 reveals that the tensile fracture is characteristic of typical ductile feature due to the fact that there are obvious dimple structures densely distributed in the fracture.
5. Conclusions
Optimization of HPVP-GTAW process parameters, such as variable polarity frequency fL, pulse frequency fH, and a dimensionless factor ψ calculated by background current Ib, peak current Ip and pulse duration δ for AA 5456 aluminum alloy welded joints, have been systematically investigated. The following conclusions are drawn from the results of this study:
- (1)
- Regression models, which took tensile strength, yield strength, percent elongation, and ratio of reduction in area as the response functions of process parameters fL, fH, and ψ, were developed through least square estimation. The regression equations were proved to be effective by checking the coefficient of correlation r2 and confirmatory experiments.
- (2)
- The optimum parameters of HPVP-GTAW for AA 5456 aluminum alloy were obtained by analyzing the response surfaces and the contour plots of tensile properties based on regression equations. The optimum parameters were fL 1 kHz, fH 20 kHz and ψ 0.6 (i.e., Ib 75 A, Ip 180 A, and δ 0.2).
- (3)
- The maximum tensile properties were obtained with the above optimum parameters, and the microstructural observation illustrated that there was a great deal of second-phase β (Mg2Al3) uniformly distributed in the weld zone, which was beneficial to the improvement of the mechanical properties of AA 5456 aluminum alloy welded joints.
Acknowledgments
The authors would like to thank all the members in Welding Manufacturing Research Group in Beihang University. The work was supported by the National Natural Science Foundation of China under Grants No. 51675031, 50975015, and 51005011.
Author Contributions
Yipeng Wang and Baoqiang Cong conceived and designed the experiments; Bojin Qi and Yipeng Wang performed the experiments; Bojin Qi and Yipeng Wang analyzed the data; Mingxuan Yang contributed analysis tools; Yipeng Wang wrote the paper.
Conflicts of Interest
The authors declare no conflict of interest.
References
- Manti, R.; Dwivedi, D.K.; Agarwal, A. Microstructure and hardness of Al-Mg-Si weldments produced by pulse GTA welding. Int. J. Adv. Manuf. Technol. 2008, 39, 851–865. [Google Scholar] [CrossRef]
- Elisan, D.S.M.; Ana, L.F.L.S.; Sandro, M.M.L.S. A GTA Welding Cooling Rate Analysis on Stainless Steel and Aluminum Using Inverse Problems. Appl. Sci. 2017, 7, 122. [Google Scholar] [CrossRef]
- Pan, J.; Hu, S.; Yang, L. Investigation of molten pool behavior and weld bead formation in VP-GTAW by numerical modelling. Mater. Des. 2016, 111, 600–607. [Google Scholar] [CrossRef]
- Kummar, A.; Sundarrajan, S. Optimization of pulsed TIG welding process parameters on mechanical properties of AA 5456 Aluminum alloy weldments. Mater. Des. 2009, 30, 1288–1297. [Google Scholar] [CrossRef]
- Karunakaran, N.; Balasubramanian, V. Effect of pulsed current on temperature distribution, weld bead profiles and characteristics of gas tungsten arc welded aluminum alloy joints. Trans. Nonferrous Metal. Soc. China 2011, 21, 278–286. [Google Scholar] [CrossRef]
- Giridharan, P.K.; Murugan, N. Optimization of pulsed GTA welding process parameters for the welding of AISI 304L stainless steel sheets. Inter. J. Adv. Manuf. Technol. 2009, 40, 478–489. [Google Scholar] [CrossRef]
- Yang, M.X.; Zheng, H.; Li, L. Arc Shapes Characteristics with Ultra High Frequency Pulsed Arc Welding. Appl. Sci. 2017, 7, 45. [Google Scholar] [CrossRef]
- Moreira, P.M.G.P.; Santos, T.; Tavares, S.M.O. Mechanical and metallurgical characterization of friction stir welding joints of AA 6061-T6 with AA6082-T6. J. Mater. Des. 2009, 30, 180–187. [Google Scholar] [CrossRef]
- Elangovan, K.; Balasubramanian, V.; Babu, S. Predicting tensile strength of friction stir welded AA 6061 aluminium alloy joints by a mathematical model. Mater. Des. 2009, 30, 188–193. [Google Scholar] [CrossRef]
- Yang, M.X.; Yang, Z.; Cong, B.Q. How ultrahigh frequency of pulsed gas tungsten arc welding affects weld porosity of Ti-6Al-4V alloy. Inter. J. Adv. Manuf. Technol. 2015, 76, 955–960. [Google Scholar] [CrossRef]
- Stoeckinger, G.R.; Pulsed, D.C. High frequency GTA welding of aluminum plate. Weld. J. 1973, 53, 558–567. [Google Scholar]
- Sun, Q.J.; Lin, S.B.; Yang, C.L.; Zhao, G.Q. Penetration increase of AISI 304 using ultrasonic assisted tungsten inert gas welding. Sci. Technol. Weld. J. 2013, 14, 765–767. [Google Scholar] [CrossRef]
- Liao, X.L.; Zhai, Q.J. Refining mechanism of the electric current pulse on the solidification structure of pure aluminum. Acta Meter. 2007, 55, 3103–3109. [Google Scholar] [CrossRef]
- Cong, B.Q.; Qi, B.J.; Zhou, X.G. Influence of ultrasonic pulse square-wave current parameters on microstructures and mechanical properties of 2219 aluminum alloy weld joints. Acta Metall. Sin. 2009, 45, 1057–1062. [Google Scholar]
- Cong, B.Q.; Qi, B.J.; Zhou, X.G. Microstructure and mechanical properties of hybrid pulse VPTIG arc welding of high strength aluminum alloy. Trans. China Weld. Inst. 2010, 36, 1–5. [Google Scholar]
- Qiu, L.; Yang, C.L.; Lin, S.B. Effect of pulse current on microstructure and mechanical properties of variable polarity arc weld bead of 2219-T6 aluminum alloy. Mater. Sci. Technol. 2009, 25, 739–742. [Google Scholar] [CrossRef]
- Zhao, J.R.; Li, Y.D. Control over arc of pulsed high frequency TIG welding and High frequency effect. J. Tianjin Univ. 1989, 3, 25–32. [Google Scholar]
- Cook, G.E.; Eassa, E.H. The effect of high-frequency pulsing of a welding arc. IEEE Trans. Ind. Appl. 1985, 1A-21, 1294–1299. [Google Scholar] [CrossRef]
- Ross, P.J. Taguchi Techniques for Quality Engineering; John Wiley & Sons: New York, NY, USA, 1997; pp. 395–476. [Google Scholar]
- Kumar, A.; Sundarrajan, S. Selection of welding process parameters for the optimum butt joint strength of an aluminum alloy. J. Mater. Manuf. Process. 2006, 21, 779–782. [Google Scholar] [CrossRef]
- Bingul, Z.; Cook, G.E.; Strauss, A.M. Dynamic model for electrode melting rate in gas metal arc welding process. Sci. Technol. Weld. Join. 2001, 6, 41–50. [Google Scholar] [CrossRef]
- Nakada, M.; Shiohara, Y.; Flemings, M.C. Modification of solidification structures by pulse electric discharging. ISIJ Int. 1990, 30, 27–33. [Google Scholar] [CrossRef]
- Yang, Z.; Qi, B.J.; Cong, B.Q. Microstructure, tensile properties of Ti-6Al-4V by ultrahigh frequency pulse GTAW with low duty cycle. J. Mater. Proc. Technol. 2015, 216, 37–47. [Google Scholar] [CrossRef]
Figure 1.
Schematic diagram of circuit topology and output waveform of hybrid ultrasonic frequency pulsed variable polarity gas tungsten arc wending (HPVP-GTAW). TL—period of variable polarity current; fL = 1/TL—variable polarity frequency; In—negative current; Ib—high-frequency pulsed background current; Ip—high-frequency pulsed peak current; TH—period of pulsed current; δ = tpp/TH—pulse duration; fH = 1/TH—pulse frequency.

Figure 2.
Dimensions of tensile specimens: (a) Schematic diagram of welding regarding to rolling direction and extraction of tensile specimens; (b) Dimensions of flat smooth tensile specimen.
Figure 2.
Dimensions of tensile specimens: (a) Schematic diagram of welding regarding to rolling direction and extraction of tensile specimens; (b) Dimensions of flat smooth tensile specimen.

Figure 3.
Response surface on tensile strength (TS).
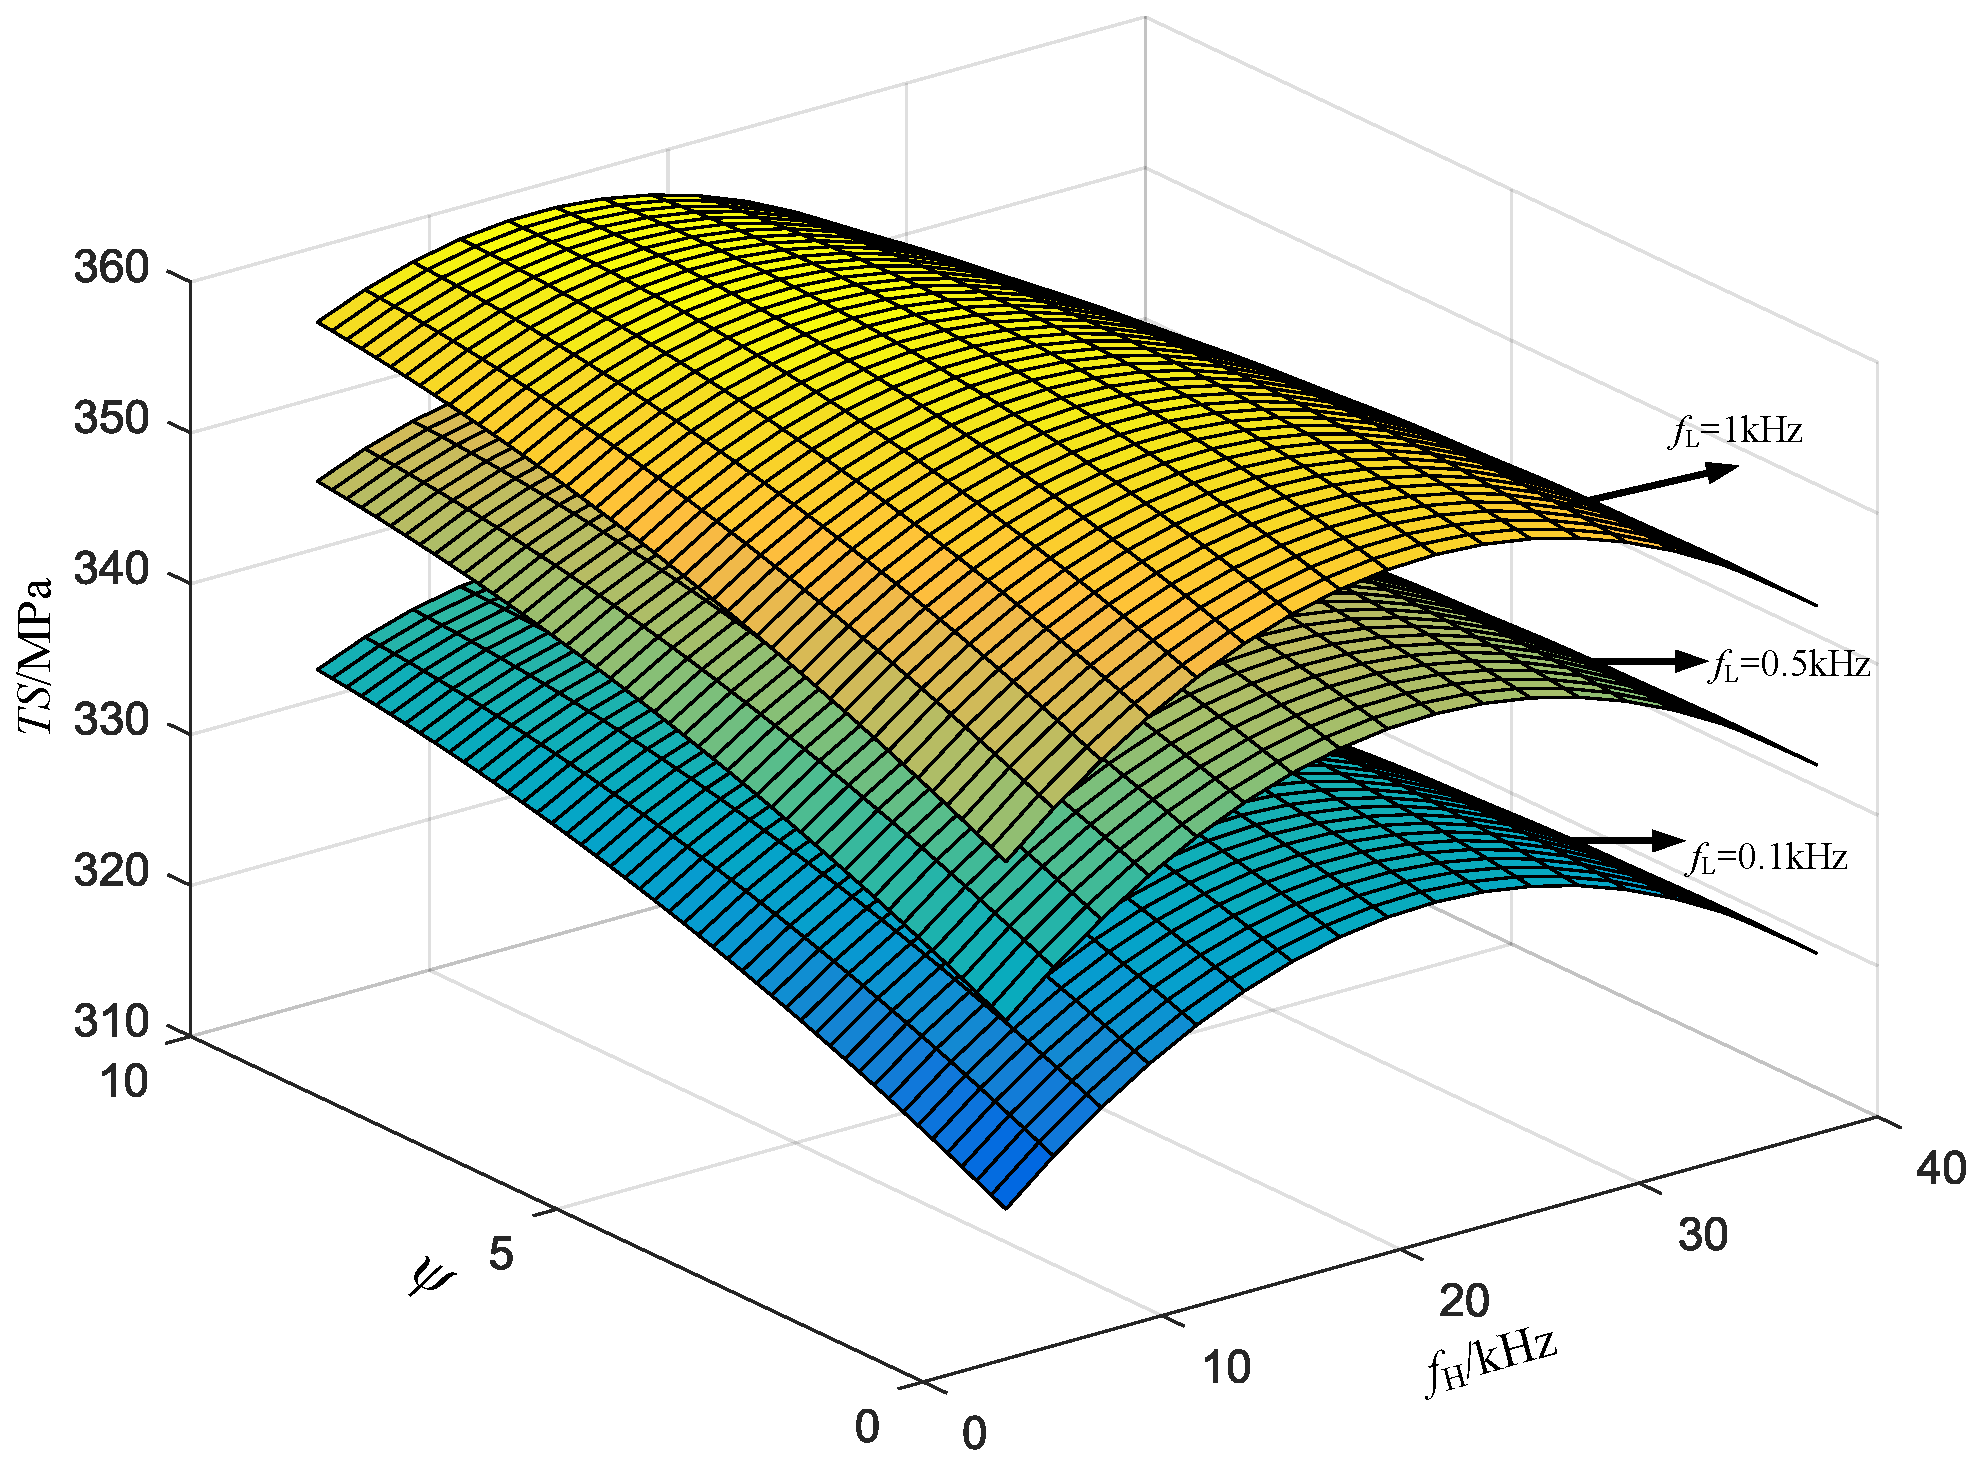
Figure 4.
Contour plot of surface on tensile strength (TS): (a) contour plot of surface that fL is 1 kHz; (b) interaction of fH and ψ.
Figure 4.
Contour plot of surface on tensile strength (TS): (a) contour plot of surface that fL is 1 kHz; (b) interaction of fH and ψ.

Figure 5.
Response surface on yield strength (TS).

Figure 6.
Contour plot of surface on yield strength (YS): (a) contour plot of surface that fL is 1 kHz; (b) interaction of fH and ψ.
Figure 6.
Contour plot of surface on yield strength (YS): (a) contour plot of surface that fL is 1 kHz; (b) interaction of fH and ψ.
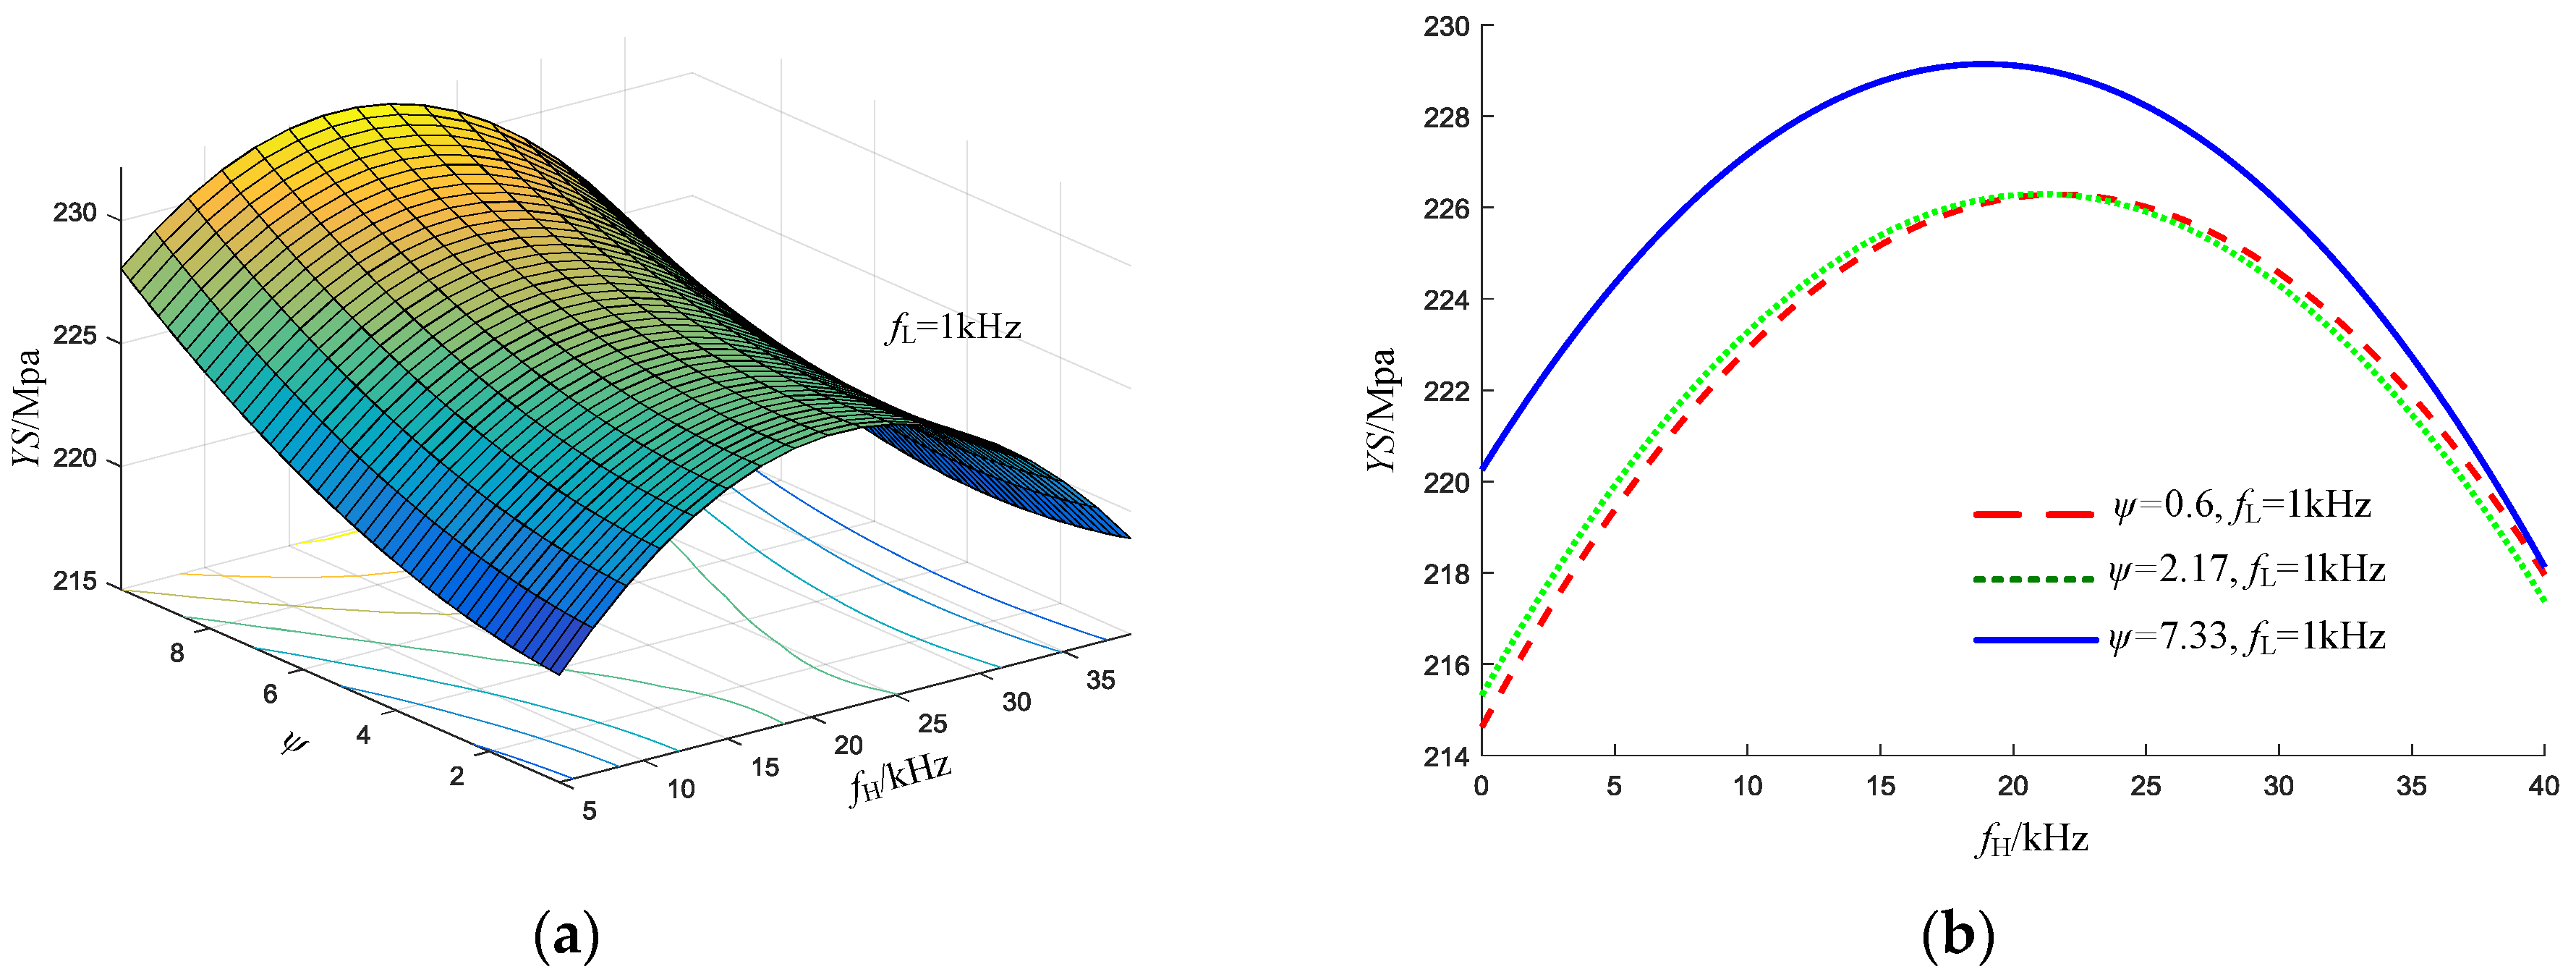
Figure 7.
Response surface on percent elongation (PE).

Figure 8.
Contour plot of surface on percent elongation (PE): (a) contour plot of surface that fL is 1 kHz; (b) interaction of fH and ψ.
Figure 8.
Contour plot of surface on percent elongation (PE): (a) contour plot of surface that fL is 1 kHz; (b) interaction of fH and ψ.

Figure 9.
Response surface on ratio of reduction in area (RA).
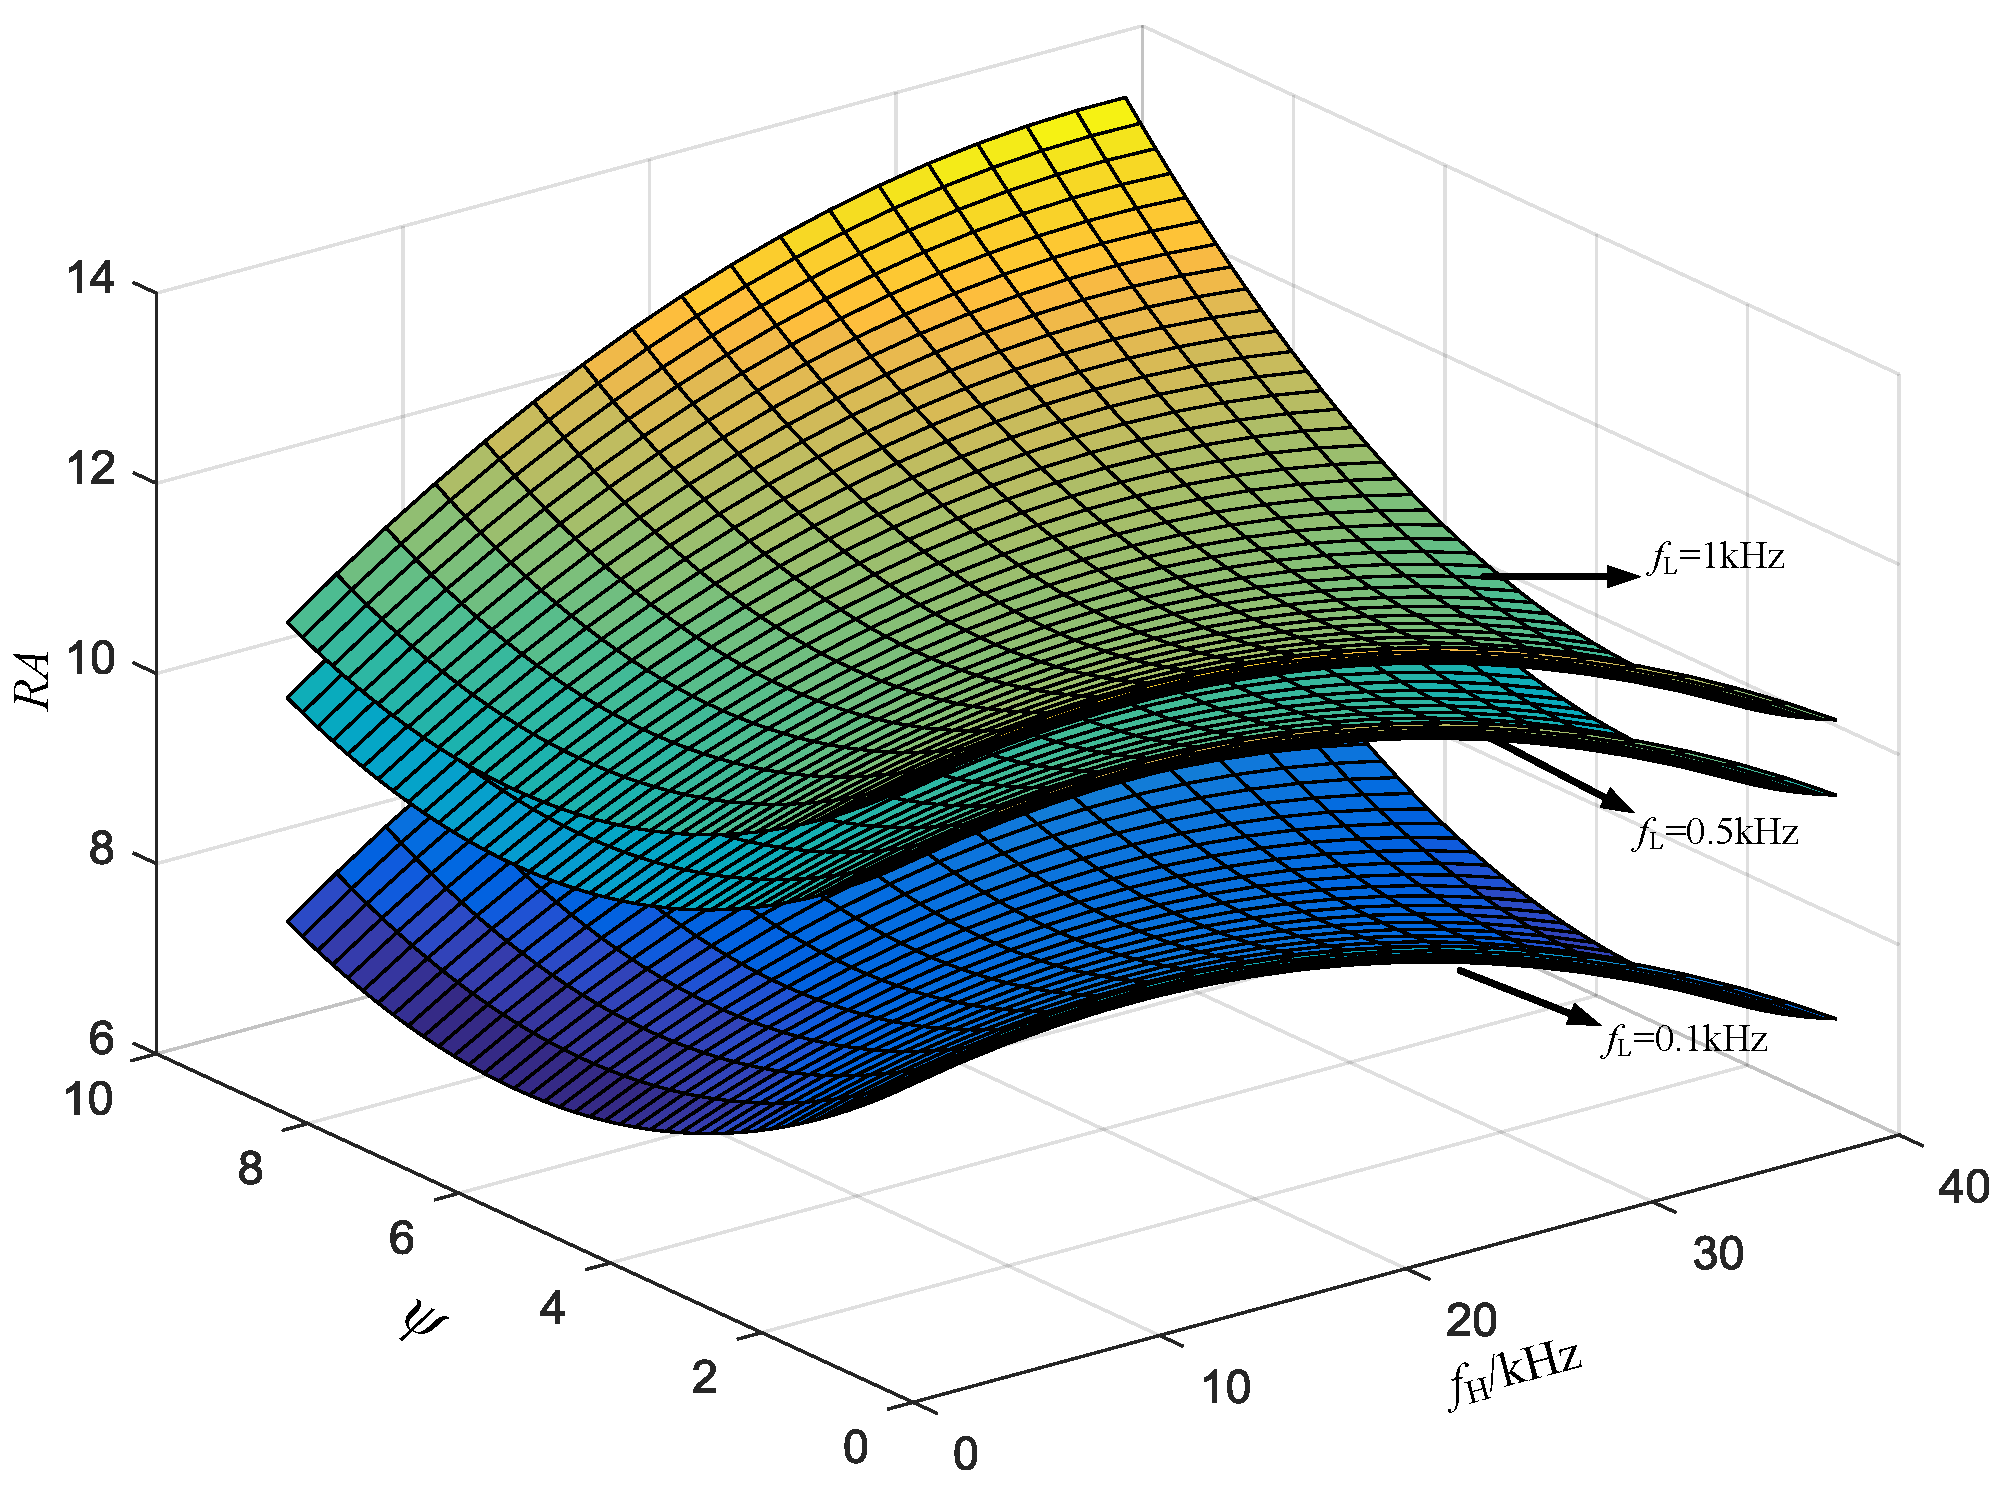
Figure 10.
Contour plot of surface on ratio of reduction in area (RA): (a) contour plot of surface that fL is 1 kHz; (b) interaction of fH and ψ.
Figure 10.
Contour plot of surface on ratio of reduction in area (RA): (a) contour plot of surface that fL is 1 kHz; (b) interaction of fH and ψ.
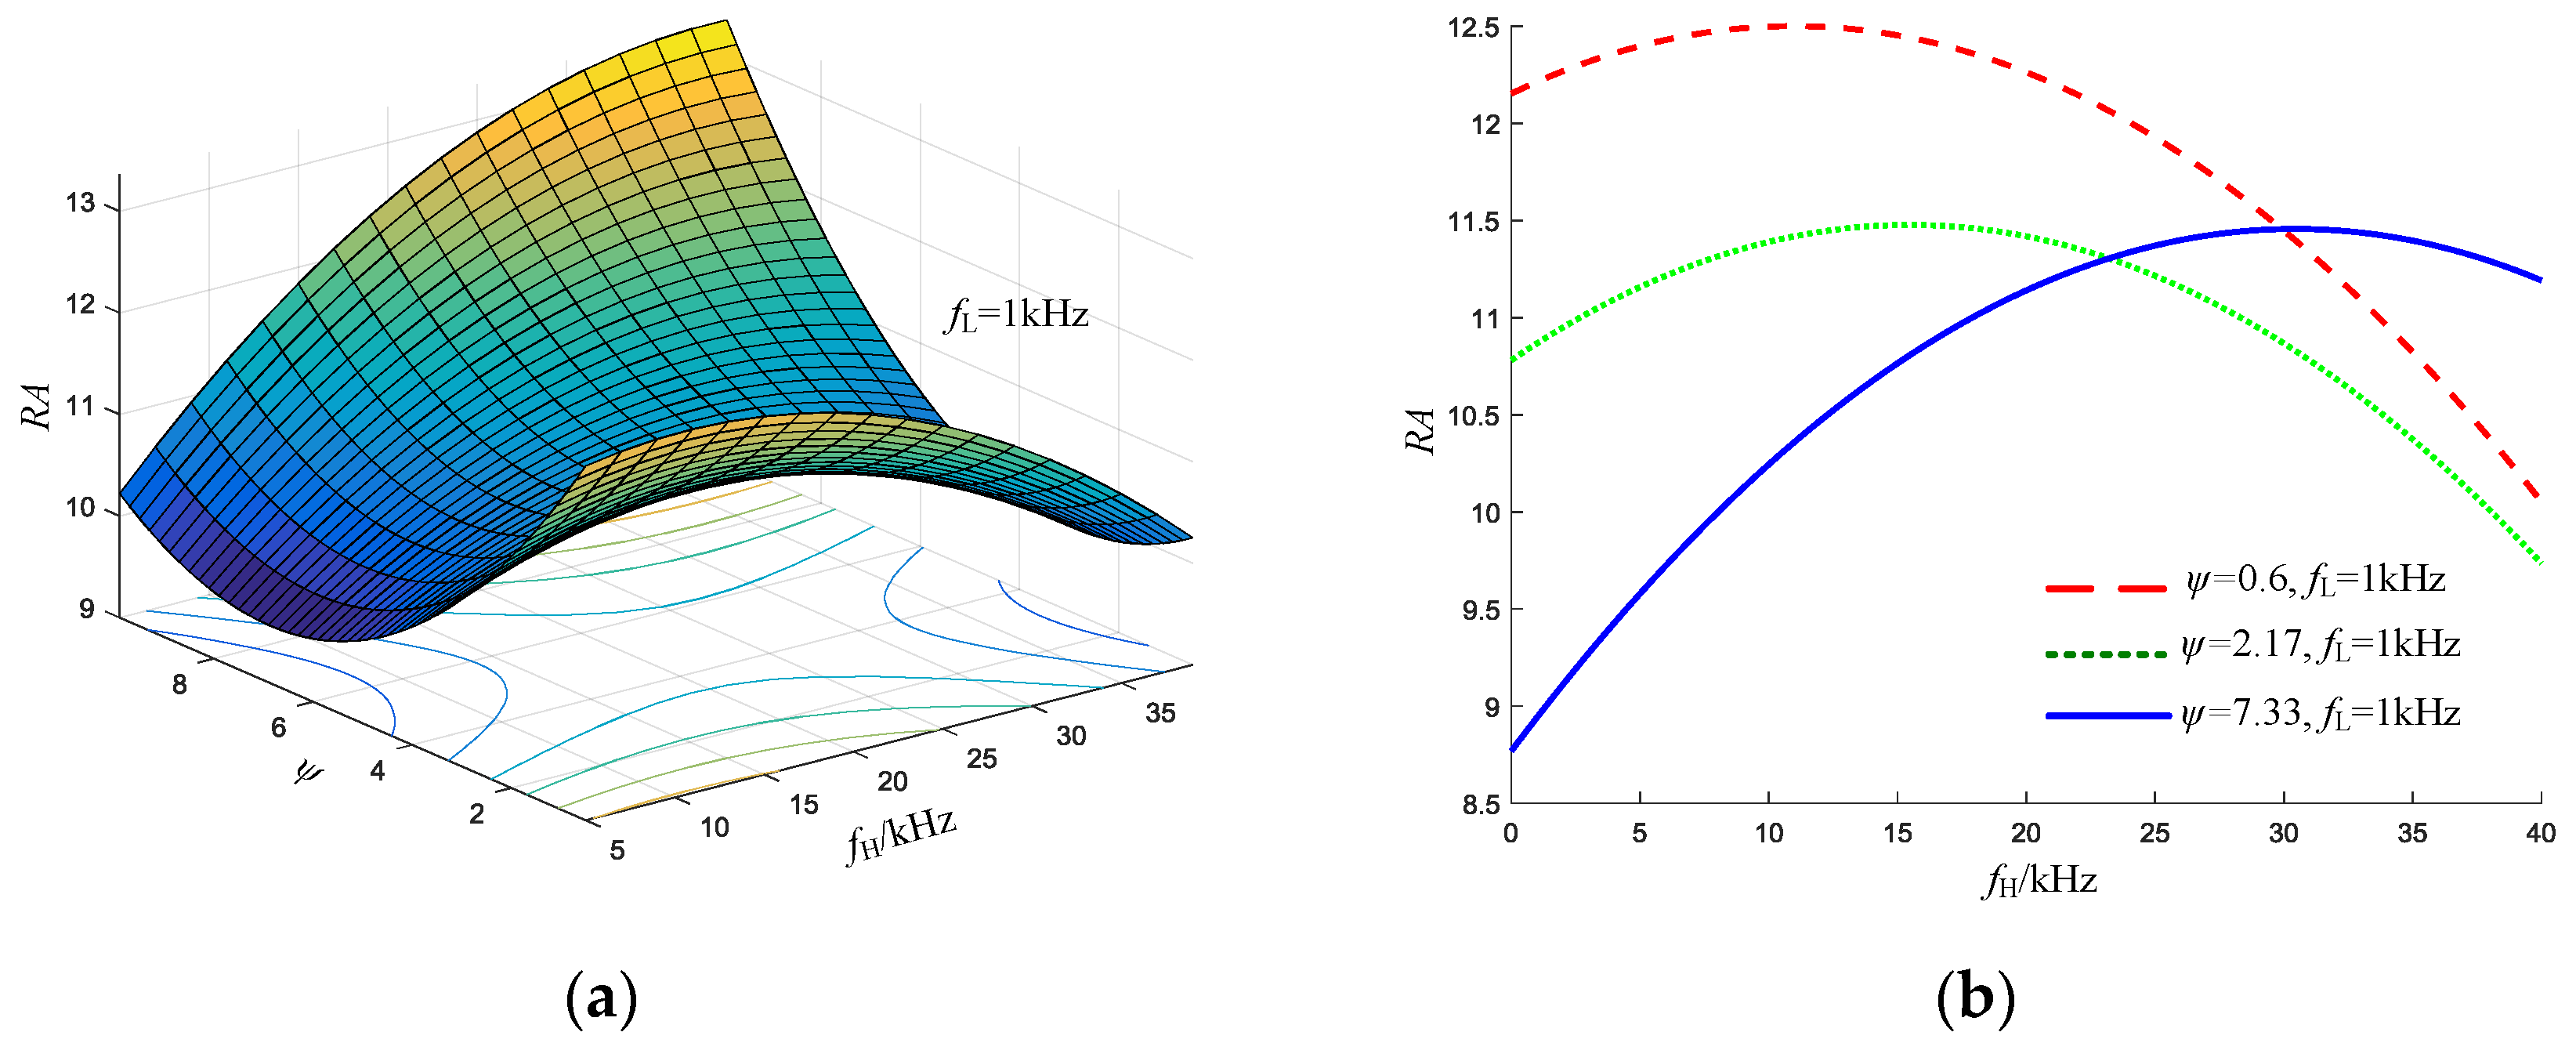
Figure 11.
Microstructure of weld zone with energy dispersive spectrometer (EDS) analysis.
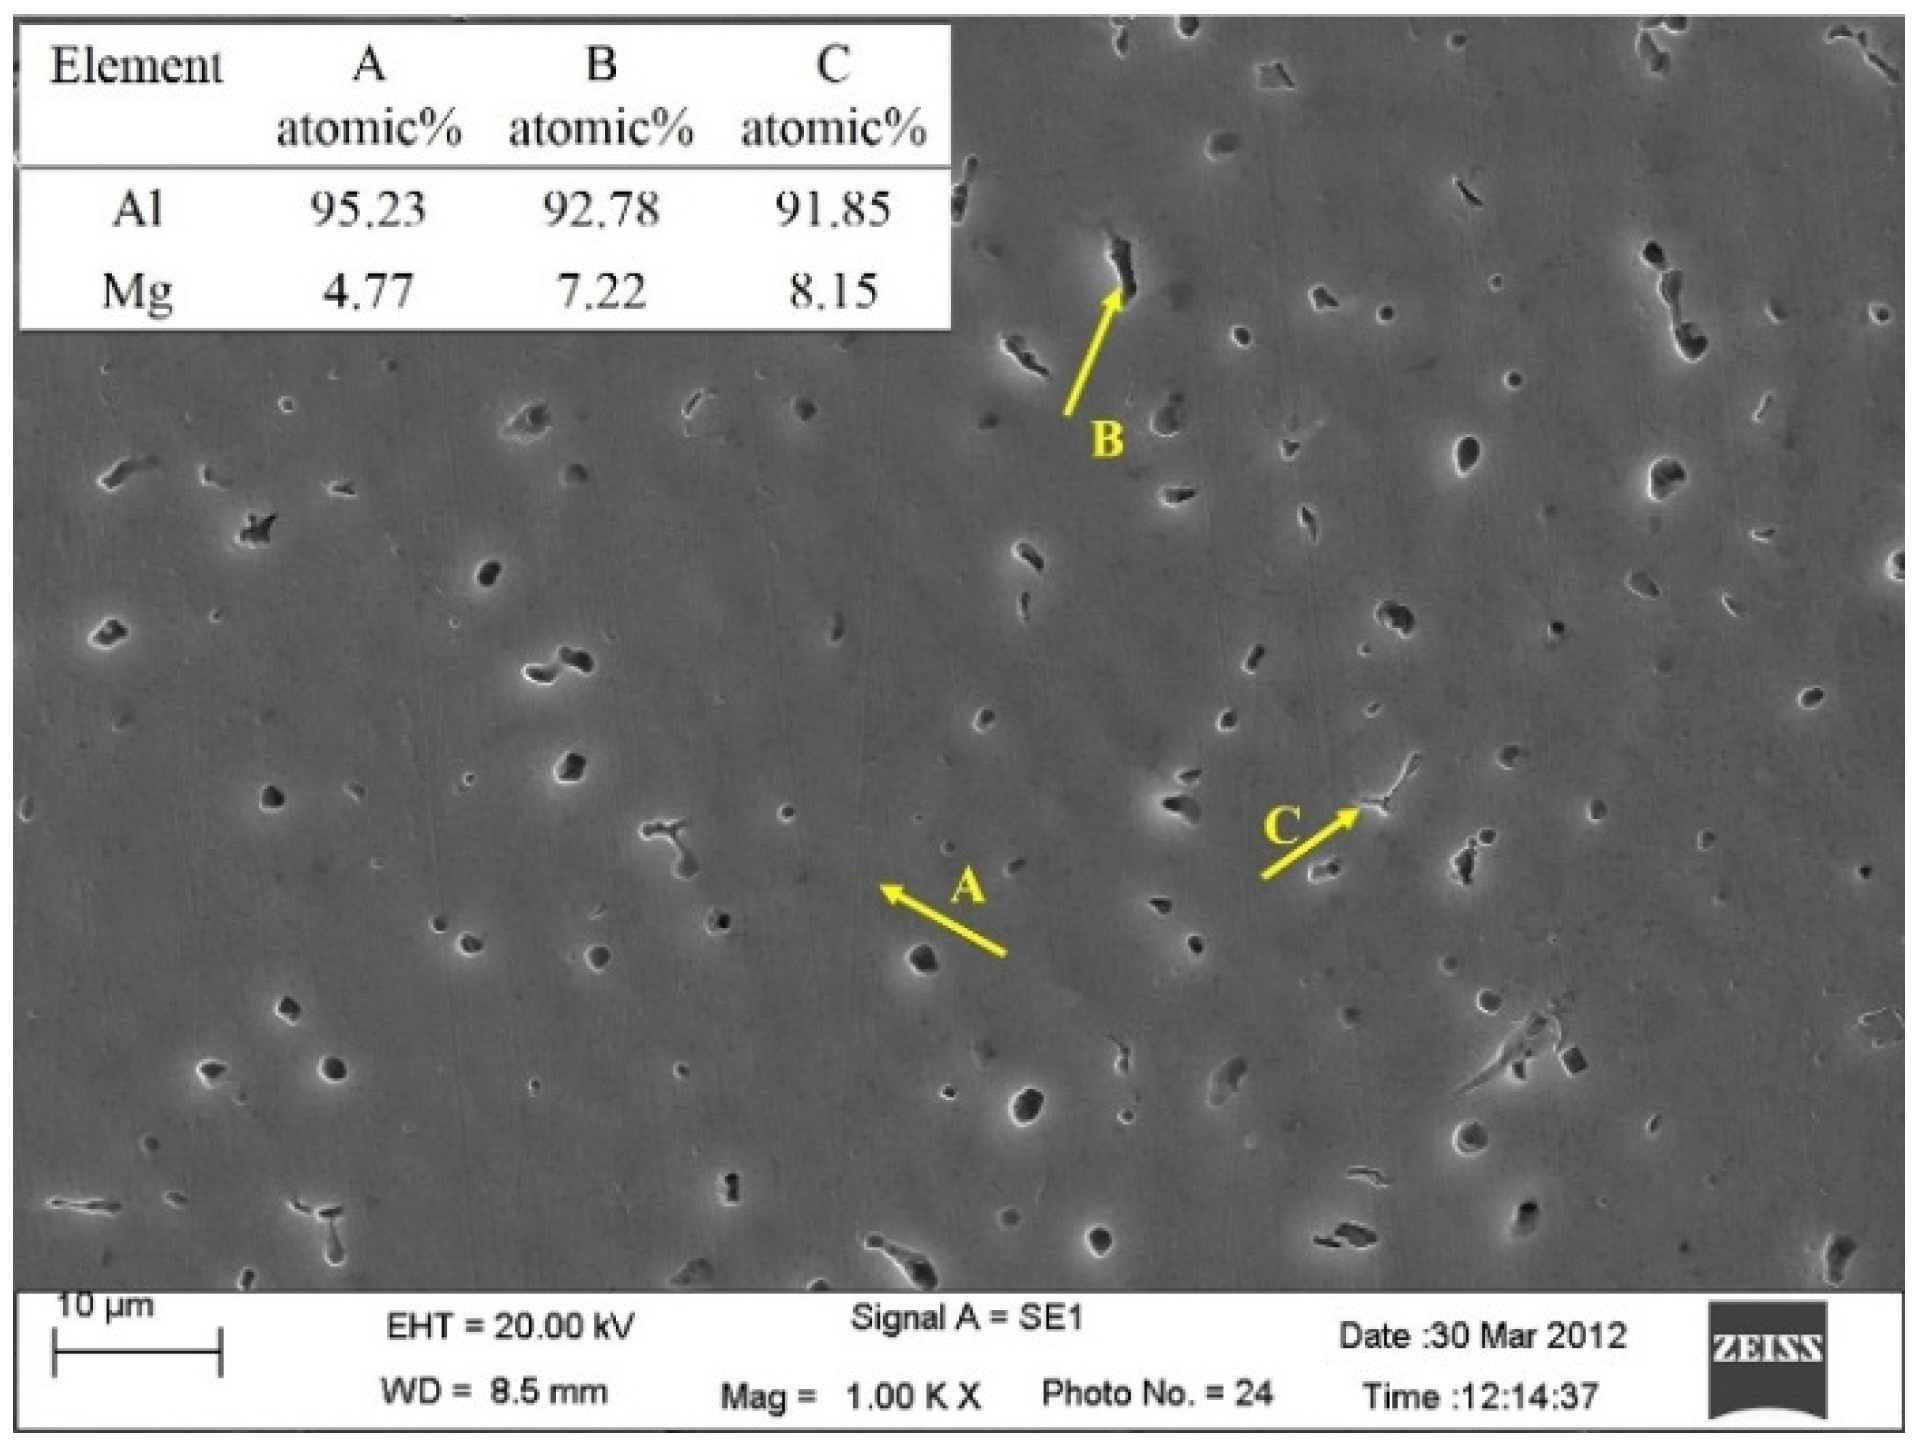
Figure 12.
XRD analysis of weld zone.

Figure 13.
Tensile fracture graph (SEM) with optimum parameters: (a) ×200; (b) ×500.

Table 1.
Levels of welding process parameters.
| Factor | A: fL/kHz | B: fH/kHz | C: ψ | |
|---|---|---|---|---|
| Level | ||||
| 1 | 0.1 | 5 | 0.60 (Ib = 75 A, Ip = 180 A, δ = 0.2) | |
| 2 | 0.5 | 20 | 2.17 (Ib = 60 A, Ip = 130 A, δ = 0.5) | |
| 3 | 1 | 40 | 7.33 (Ib = 60 A, Ip = 110 A, δ = 0.8) | |
Table 2.
Constant welding process parameters.
| Parameter | Symbol | Value | Unit |
|---|---|---|---|
| Filter wire | - | ER5356 φ2.4 mm | - |
| Electrode | - | WC20 φ3.0 mm | - |
| Argon flow rate | vg | 15 | L·min−1 |
| Welding velocity | vw | 150 | mm·min−1 |
| Feeding velocity | vf | 150 | mm·min−1 |
| Arc length | h | 3 | mm |
| Duration ratio | tp:tn | 8:2 | - |
| Negative polarity current | In | 120 | A |
Table 3.
L9(34) orthogonal experimental array.
| Factor | A: fL/kHz | B: fH/kHz | C: ψ | Null | |
|---|---|---|---|---|---|
| No. | |||||
| 1 | 1 (0.1) | 1 (5) | 1 (0.6) | 1 | |
| 2 | 1 (0.1) | 2 (20) | 2 (2.17) | 2 | |
| 3 | 1 (0.1) | 3 (40) | 3 (7.33) | 3 | |
| 4 | 2 (0.5) | 1 (5) | 2 (2.17) | 3 | |
| 5 | 2 (0.5) | 2 (20) | 3 (7.33) | 1 | |
| 6 | 2 (0.5) | 3 (40) | 1 (0.6) | 2 | |
| 7 | 3 (1) | 1 (5) | 3 (7.33) | 2 | |
| 8 | 3 (1) | 2 (20) | 1 (0.6) | 3 | |
| 9 | 3 (1) | 3 (40) | 2 (2.17) | 1 | |
Table 4.
Tensile properties of AA 5456 Al alloy welded joints by orthogonal experiment.
| Factor | A: fL/kHz | B: fH/kHz | C: ψ | TS/MPa | YS/MPa | PE/% | RA/% | |
|---|---|---|---|---|---|---|---|---|
| No. | ||||||||
| 1 | 1 (0.1) | 1 (5) | 1 (0.6) | 311 | 198 | 7.7 | 8.4 | |
| 2 | 1 (0.1) | 2 (20) | 2 (2.17) | 335 | 211 | 7.7 | 8.6 | |
| 3 | 1 (0.1) | 3 (40) | 3 (7.33) | 318 | 204 | 8.1 | 8.6 | |
| 4 | 2 (0.5) | 1 (5) | 2 (2.17) | 339 | 213 | 7.6 | 10.9 | |
| 5 | 2 (0.5) | 2 (20) | 3 (7.33) | 340 | 215 | 7.7 | 9.5 | |
| 6 | 2 (0.5) | 3 (40) | 1 (0.6) | 334 | 210 | 7.5 | 9.6 | |
| 7 | 3 (1) | 1 (5) | 3 (7.33) | 356 | 226 | 8.4 | 9.9 | |
| 8 | 3 (1) | 2 (20) | 1 (0.6) | 358 | 229 | 9.7 | 12.8 | |
| 9 | 3 (1) | 3 (40) | 2 (2.17) | 334 | 213 | 7.6 | 8.9 | |
Table 5.
Validation of regression models by HPVP-GTAW for AA 5456 aluminum alloy.
| Num. | fL/kHz | fH/kHz | ψ | EV | PV | Percent Deviation |
|---|---|---|---|---|---|---|
| Tensile strength | ||||||
| 1 | 0.2 | 10 | 0.98 | 324 | 327.7 | 1.2 |
| 2 | 0.2 | 30 | 0.98 | 343 | 331.4 | 3.3 |
| 3 | 0.7 | 10 | 4.2 | 330 | 332 | 0.6 |
| 4 | 0.7 | 30 | 4.2 | 341 | 331 | 2.9 |
| Yield strength | ||||||
| 1 | 0.2 | 10 | 0.98 | 213 | 215.6 | 1.3 |
| 2 | 0.2 | 30 | 0.98 | 223 | 232.7 | 4.2 |
| 3 | 0.7 | 10 | 4.2 | 219 | 226.3 | 3.2 |
| 4 | 0.7 | 30 | 4.2 | 240 | 242.1 | 0.9 |
| Percent elongation | ||||||
| 1 | 0.2 | 10 | 0.98 | 7.7 | 8.0 | 3.9 |
| 2 | 0.2 | 30 | 0.98 | 7.9 | 7.7 | 2.5 |
| 3 | 0.7 | 10 | 4.2 | 7.6 | 7.4 | 2.6 |
| 4 | 0.7 | 30 | 4.2 | 8.0 | 7.6 | 5.0 |
| Ratio of reduction in area | ||||||
| 1 | 0.2 | 10 | 0.98 | 9.6 | 9.8 | 2.0 |
| 2 | 0.2 | 30 | 0.98 | 9.4 | 8.9 | 5.3 |
| 3 | 0.7 | 10 | 4.2 | 10.4 | 10.3 | 0.9 |
| 4 | 0.7 | 30 | 4.2 | 10.8 | 10.5 | 2.7 |
© 2017 by the authors. Licensee MDPI, Basel, Switzerland. This article is an open access article distributed under the terms and conditions of the Creative Commons Attribution (CC BY) license (http://creativecommons.org/licenses/by/4.0/).
Share and Cite
MDPI and ACS Style
Wang, Y.; Qi, B.; Cong, B.; Yang, M. Optimization of Hybrid Ultrasonic Frequency Pulsed VP-GTAW Process Parameters on Tensile Properties of AA 5456 Alloy. Appl. Sci. 2017, 7, 485. https://doi.org/10.3390/app7050485
AMA Style
Wang Y, Qi B, Cong B, Yang M. Optimization of Hybrid Ultrasonic Frequency Pulsed VP-GTAW Process Parameters on Tensile Properties of AA 5456 Alloy. Applied Sciences. 2017; 7(5):485. https://doi.org/10.3390/app7050485
Chicago/Turabian StyleWang, Yipeng, Bojin Qi, Baoqiang Cong, and Mingxuan Yang. 2017. "Optimization of Hybrid Ultrasonic Frequency Pulsed VP-GTAW Process Parameters on Tensile Properties of AA 5456 Alloy" Applied Sciences 7, no. 5: 485. https://doi.org/10.3390/app7050485
Note that from the first issue of 2016, this journal uses article numbers instead of page numbers. See further details here.