1. Introduction
Many scientific results have shown that the surface structure of materials, such as the fine features of the surface, shape, and morphology, can affect physical, chemical, and electrochemical properties to some extent [
1,
2,
3]. An understanding of the controlling factors for the fabrication of materials with the desired crystal structure, shape, and morphology is important for many applications, such as electrocatalysts, electrode materials for energy storage, and drug delivery.
Manganese oxide (MnO
2) can be widely applied in many areas—particularly as electrode materials for batteries and electrochemical supercapacitors [
4,
5,
6,
7,
8], in water treatment [
9], and in the demetallization of petroleum residues [
10]. The liberated tunable physical and chemical properties come from different structure forms, such as α-MnO
2 (Hollandite), β-MnO
2 (Pyrolusite), γ-MnO
2 (Nsutite), as well as δ-MnO
2 (Birnessite). Each structure form favours more specific properties than the others. For example, as an electrode material, α-MnO
2 displays a better electrochemical activity than do other forms [
11,
12,
13,
14,
15,
16]. It is generally accepted that the morphology and crystal structure of MnO
2 play an important role in improving the performance of many activities, including electrochemical activities [
17,
18,
19,
20]. Besides the interesting aspects of its crystal structure, the development of nanotechnologies makes it possible to design MnO
2 with different shapes, such as nano-belts, wires, fibres, and rods [
21,
22,
23,
24]. Such nanomaterials can act as nano-building blocks that construct microstructures with sophisticated shapes, such as those of flowers, cubes, bird’s nests, and sea urchins, which influence physical and chemical properties [
25,
26]. Nevertheless, the variety of crystal forms and requirements for the well-defined surface morphology and crystallographic geometry demand a high-level controlling synthetic process for fabricating MnO
2 substances. Accordingly, many chemistry routes have been validated in producing the nanostructured manganese oxide with the desired shapes, morphologies, and crystal structures [
27,
28]. For example, Fei et al. [
9] reported the synthesis of MnO
2 hollow nanostructures with either a spherical or cubic shape via a template-assistant route and claimed better efficiency in removing organic waste from water. Xiao et al. [
10] reported a morphology-controlled synthesis of doped MnO
2 via the reflux method. A so-called bird’s nest structure has been produced on BET surface areas in a range of 90–280 m
2/g, varying in introduced metals, such as Co, Cu, and Fe, and in concentrations of the metals involved in the synthesis. In efforts to produce different crystal structures of MnO
2, Hashemzadeh et al. [
29] demonstrated that synthesis using a hydrothermal method might be favourable for producing α-, β-, and δ-MnO
2, while γ-MnO
2 was fabricated through a sol–gel method. With an acidic aqueous solution, Fu et al. [
30] synthesized hollow-structured γ-MnO
2 assembled by nanorods. The formation of such a structure has been attributed to the presence of Mn
2+ ions in solution that promote the crystallization of γ-MnO
2. This process also involved a solid-state reaction, performed by grinding the starting materials before the wet chemistry process.
Considering mass production, a simple and inexpensive synthetic route is the most desirable process and can be easily adopted for industrial applications [
31]. In this regard, the materials produced via a solid-state reaction are easy to scale up at low cost. Many inorganic oxides can be obtained via the solid-state reaction. The resulting materials, however, need further treatments at high temperatures to produce a well-defined crystal structure with smooth surfaces. Nevertheless, these materials usually lack fine structural features on their surfaces. Obtaining fine features on the surface of the resulting materials requires a controlling process that is both thermodynamic and kinetic. To obtain such fine structures, the wet chemistry process seems to be the best method. In the wet chemical process, besides a temperature that can promote the formation of crystal structures, certain mediators presented in the synthesis solution, such as the trace amounts of metal ions, gases, and ions such as O
2, CO, H
+, and OH
−, can also affect the crystal structure, shape, and morphology of the formed materials by influencing the surface energy of growing unites as well as the growth rate [
3,
32]. Therefore, the crystal structures and morphologies can be tuned by varying process parameters such as temperature, reaction time, and species presented during wet chemistry synthesis.
Here, we report a facile, low-cost, synthetic method of producing nanostructured MnO2 with a stable α-MnO2 crystal structure through a combination of solid-state and wet chemistry processes. The materials appear as a micro-structured building assembled by nano-particles or rods. Each individual nano-sized building block is decorated with numerous spike features on the surface, making the micro-building similar in shape to a Staghorn coral creature. This type of microstructure results in a large accessible surface area in electrochemical environments. The effect of such morphology on electrochemical capacitances is evaluated. The gradual development of different shapes and morphologies is related to the reaction duration and temperature.
2. Experimental
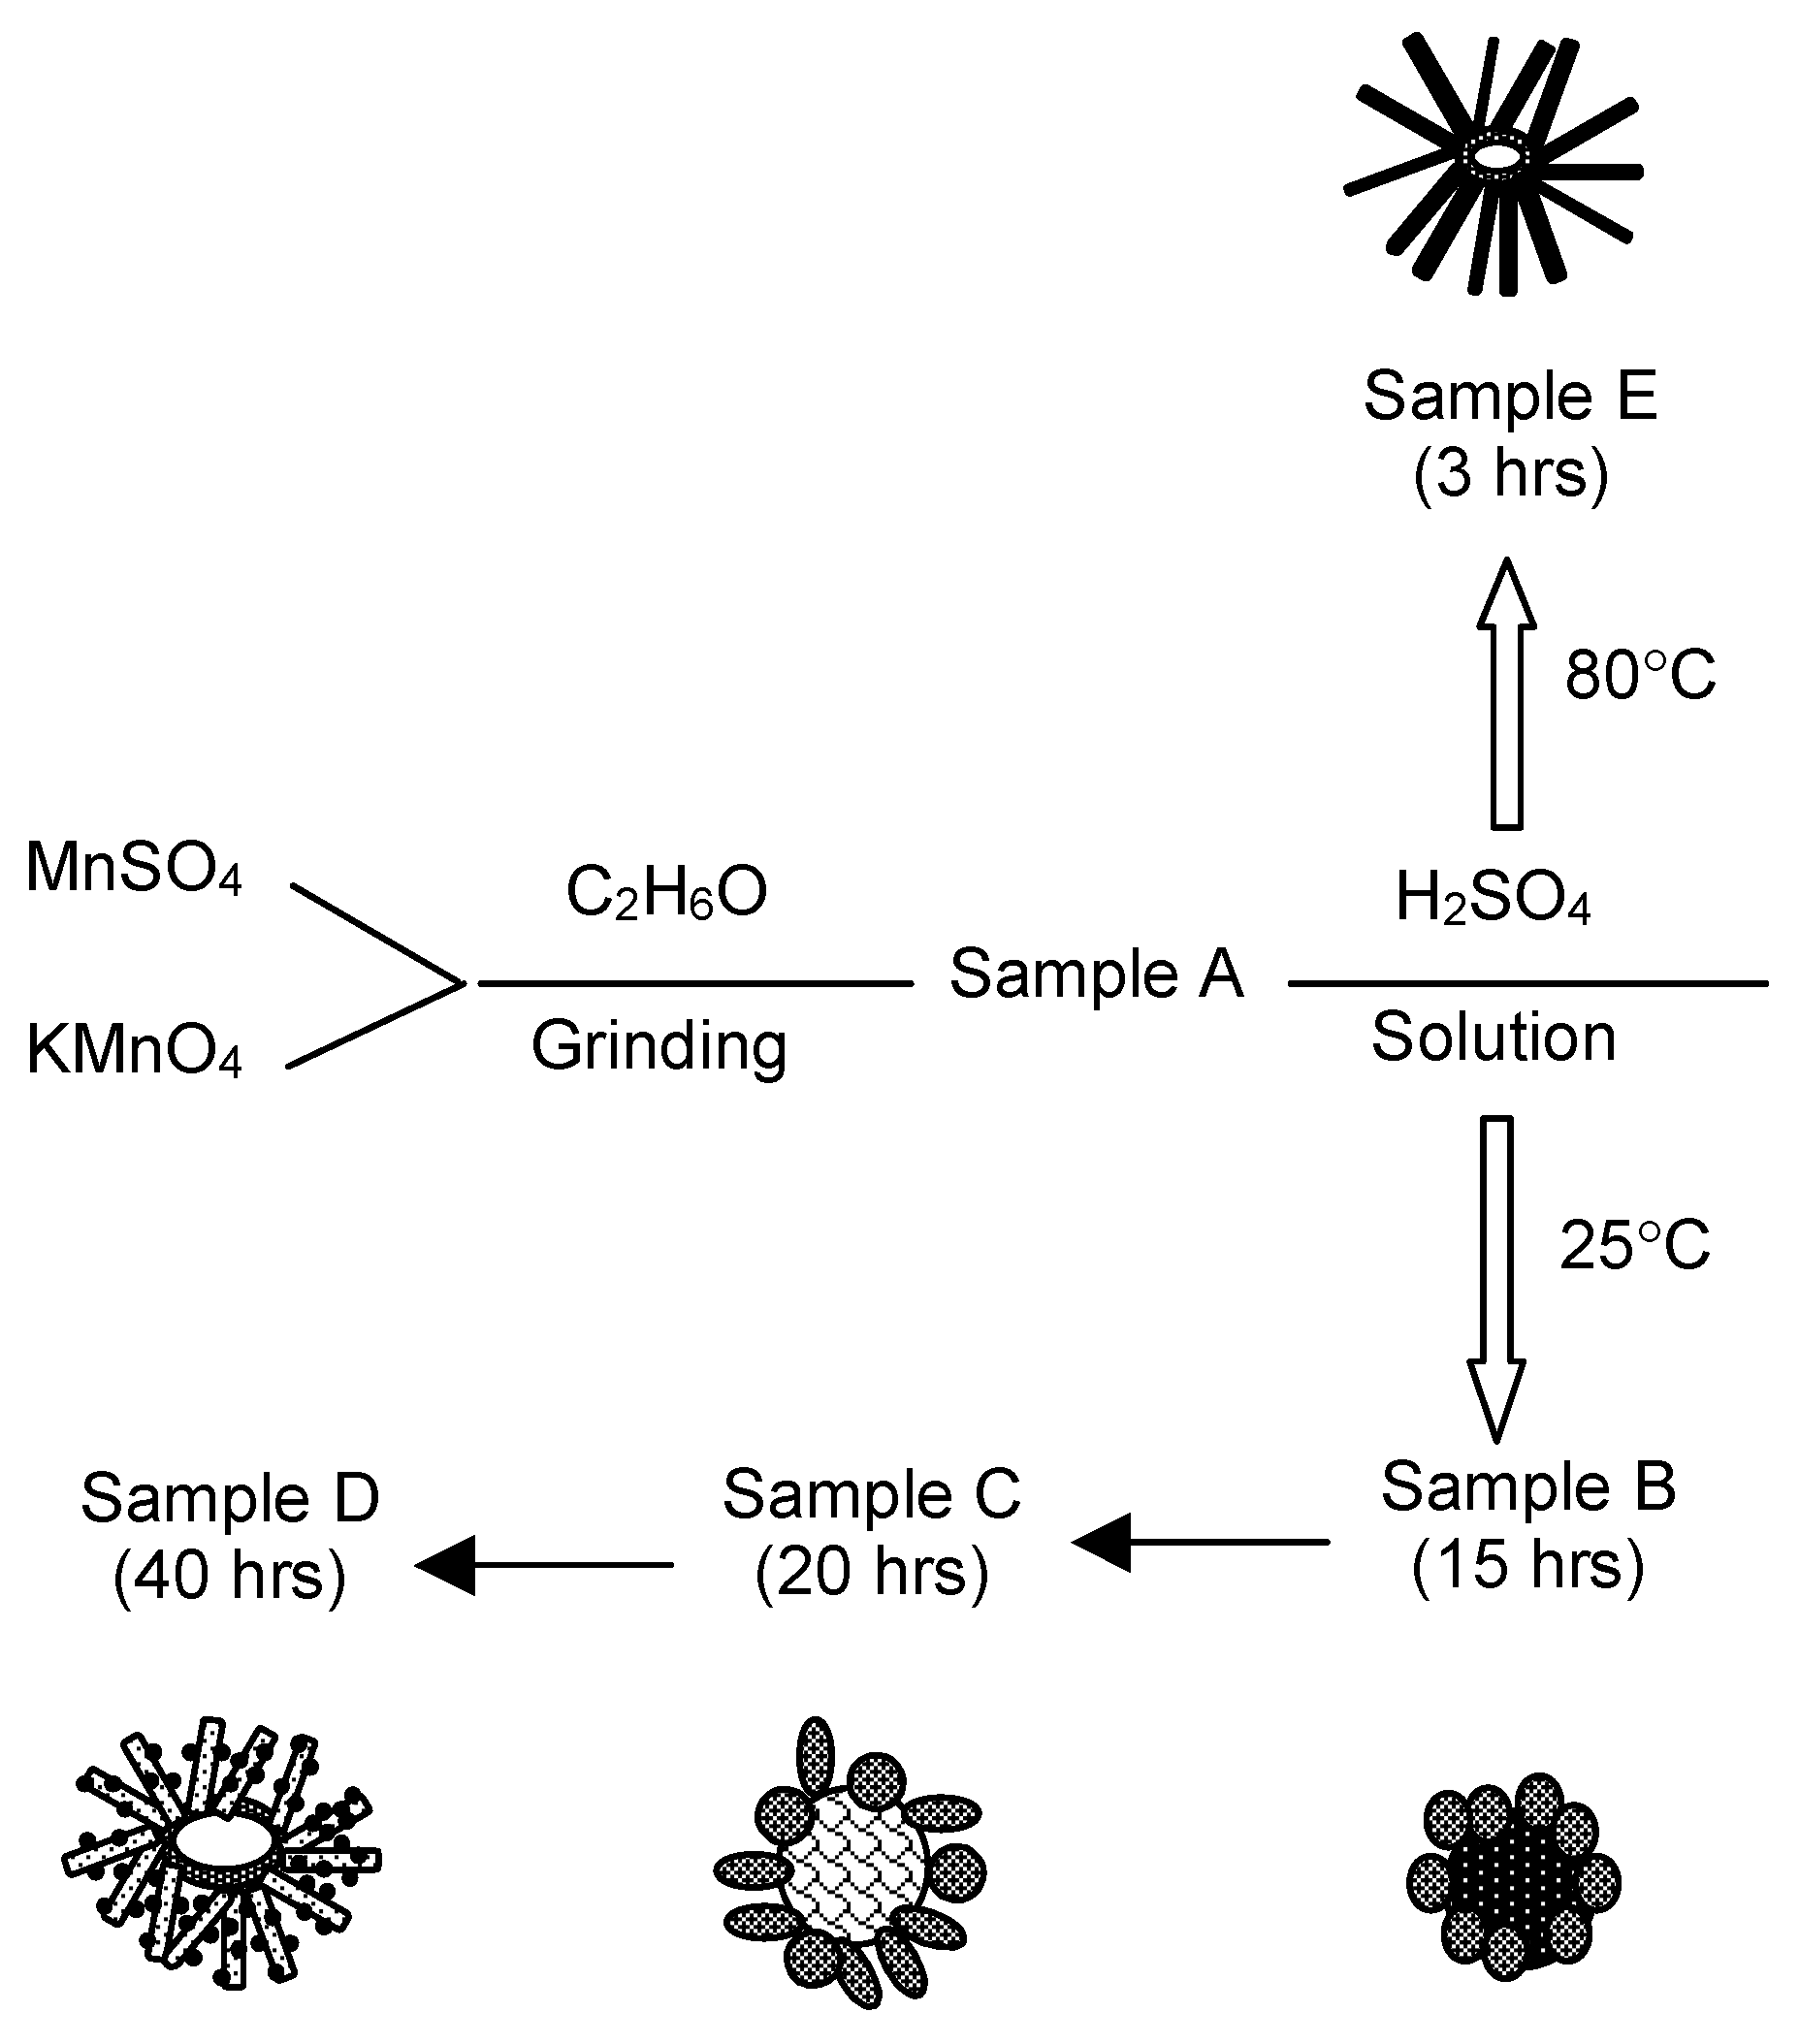
Manganese oxides were synthesized via a combination of solid-state and wet chemical processing. MnSO
4·H
2O (Laboratory grade, Alfa Aesar, Tewksbury MA, USA) and KMnO
4 (crystal, Fisher Scientific, Ottawa, Ontario, Canada) were mixed with a small amount of ethanol to make the thick slurry, and then ground for an hour in a mortar until the slurry was dried. Dried substance was then ground for additional half-hour to get the fine powders. Resulting products by this step were stored and designated as Sample A and aged at least for 24 h before further process. Samples B, C, and D were prepared by adding the Sample A into 0.5 M H
2SO
4 (Fisher Scientific, Ottawa, Ontario, Canada) aqueous solution; the mixture was reacted at 25 °C for 15 h to form Sample B, for 20 h to form Sample C, and 40 h to form Sample D, respectively. When preparing Sample E, Sample A was added into the 0.5 M H
2SO
4 and reacted at 80 °C for 3 h.
Figure 1 illustrates the mechanism for sample labelling and the conditions for producing each sample. All products were washed with D.I. water until pH = 7 and then dried at 80 °C in air.
For material characterization, X-ray diffraction (XRD) (Bruker D-8 diffractometer, Madison, WI, USA) was used for the determination of crystal structure of synthesized products. The measurements were carried out using Cu Kα wavelength (λ = 1.5406 Å) with a step size of 0.02 and exposure time of 0.1 s for each step. Hitachi S-4700 Field Emission Scanning Electron Microscope (FESEM) (Waterloo, Canada) was employed to study the morphology of samples. The Brunauer–Emmett–Teller (BET) surface area of particles and pore surface area were measured by the nitrogen gas adsorption–desorption method using a Beckman Coulter SA 3100 surface area analyzer. The pore size distribution was calculated using the Barret–Joyner–Halenda (BJH) method.
For electrochemical capacitance measurements, cyclic voltammogram (CV) curves were recorded on a glassy carbon electrode on which the studied α-MnO2 sample was deposited with a loading of 0.4 mg/cm2. A conventional three-electrode cell (Pine Instrument) containing N2-saturated 0.1 M Na2SO4 was used with Pt mesh as the counter electrode, and Hg/Hg2SO4 as the reference electrode. The 1480 Solartron multi-potentiostat was employed for recording all cyclic voltammogram curves at the potential between −0.6 and 0.56 V vs. Hg/Hg2SO4 using various potential scan rates at 25 °C.
3. Results and Discussion
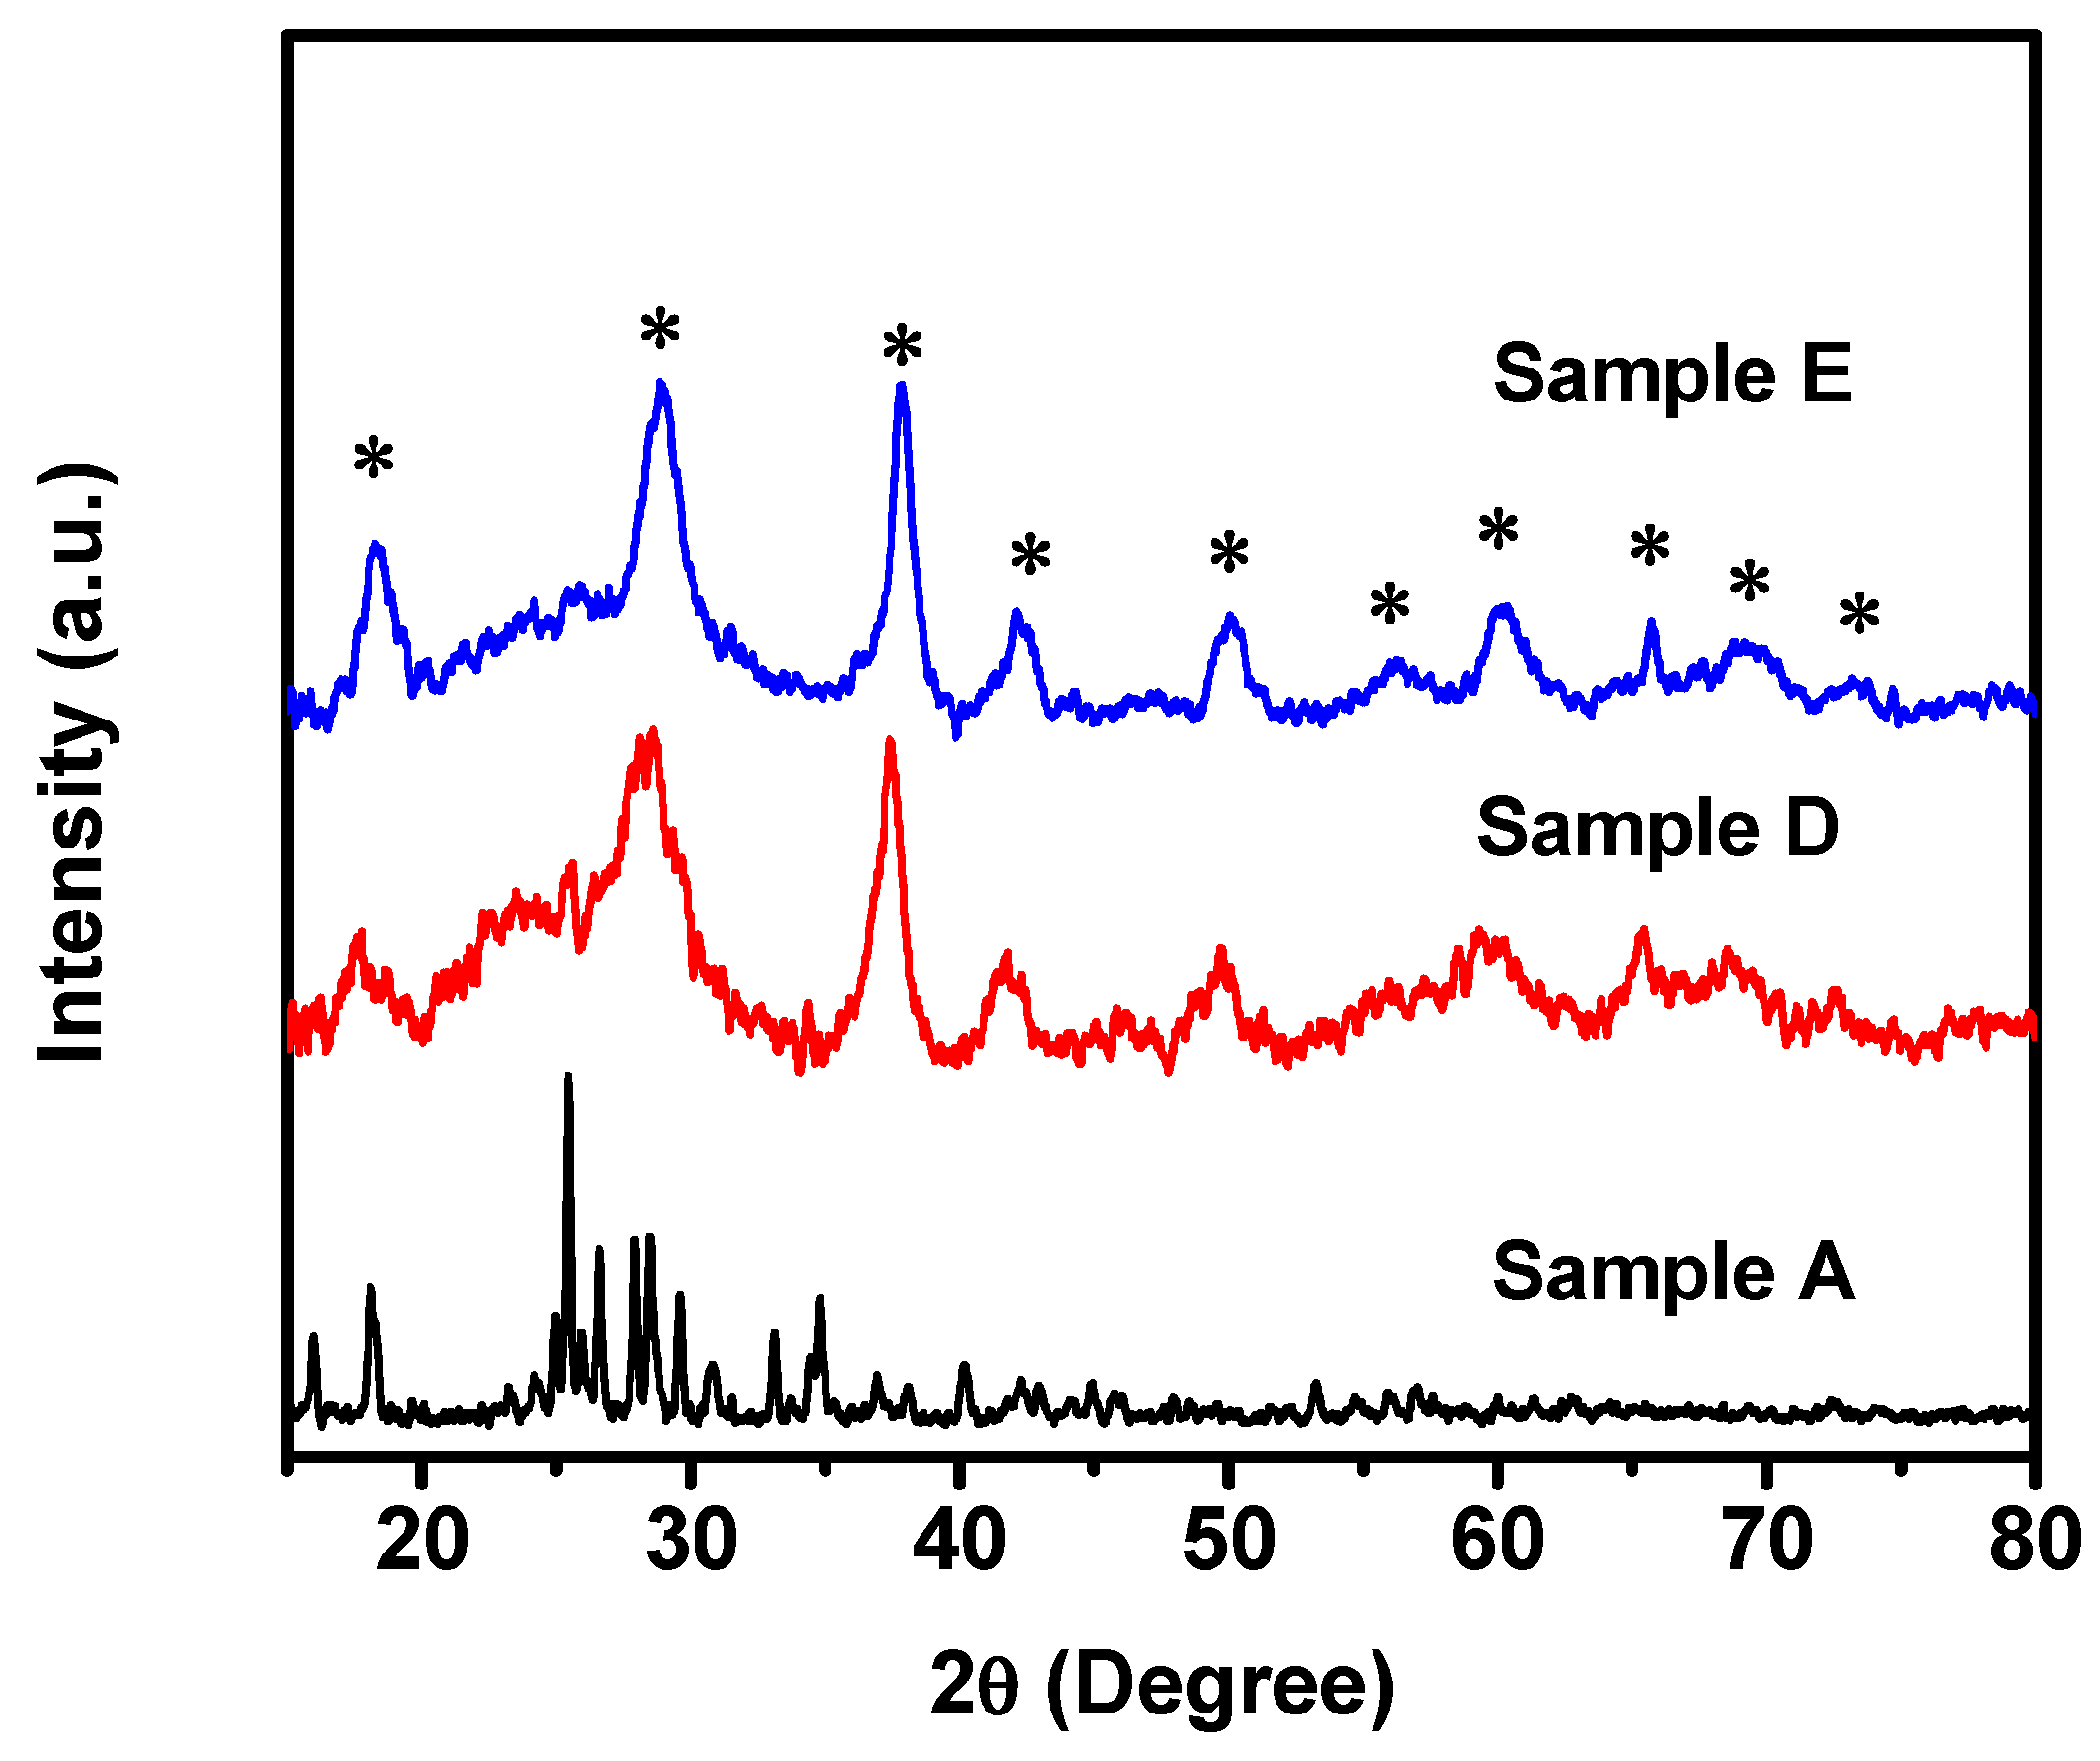
The crystal structures of Samples A, B, C, D, and E were analyzed using powder X-ray diffraction methods. The XRD pattern of Sample A, which was processed only by grinding in ethanol, displays the clear crystalline peaks, as shown in
Figure 2. However, the spectrum cannot be indexed into any manganese oxide structure. When compared with either KMnO
4 or MnSO
4 spectrum, it can be found that the XRD spectrum of Sample A is not the simple mixture of two starting materials. This result indicates that, after the grinding process, the material is formed with an intermediate phase. A further process is required to form the MnO
2 structures. It was proved that, if the material is processed in an alcohol-based environment, a fine growth unit for formation of metal oxide is likely to form [
33,
34]. To avoid a process at high temperatures that can result in a reduction of the surface area, further treatments were conducted in an H
2SO
4 acid solution at 25 °C or 80 °C for comparative studies. It is believed that the acid, such as H
2SO
4, would be able to accelerate the oxidation process of MnSO
4 [
30], probably due to the presence of H
+. For preparing other samples, Sample A as a starting material was then added to the H
2SO
4 solution. Sample B, C, and D were then extracted during the process at a duration of 15 h to obtain Sample B, 20 h to obtain Sample C, and 40 h to obtain Sample D. The XRD analysis of these three samples (B, C, and D) (only XRD pattern of Sample D is shown in
Figure 2 since the XRD patterns for both Sample B and C are similar to Sample D) indicates that all the samples show a well-defined α-MnO
2 crystal structure without any other phase presented. It implies that the clean α-MnO
2 structure can be formed in less than 15 h, and the structure was stabilized as time went on. In other words, only α-MnO
2 could be produced at this synthetic condition. The γ-MnO
2 phase described in [
30] was not observed in this process. As we will discuss later, even though the duration of the treatments in acid solution does not impact the crystal structure of MnO
2, the process does affect the development of the morphology and the shape of formed materials.
To evaluate the temperature effect on crystal structures of MnO
2 and its morphology, Sample A as a starting material was treated in acid solution for 3 h at 80 °C to produce Sample E. As shown in
Figure 2, Sample E displays a crystal structure similar to Samples B, C, and D, indicating that a stable α-MnO
2 crystal structure can be formed in such a process at a slightly-high-temperature conditions. We will see later that such a process changes the morphology of developed materials dramatically via an accelerated crystal growth rate.
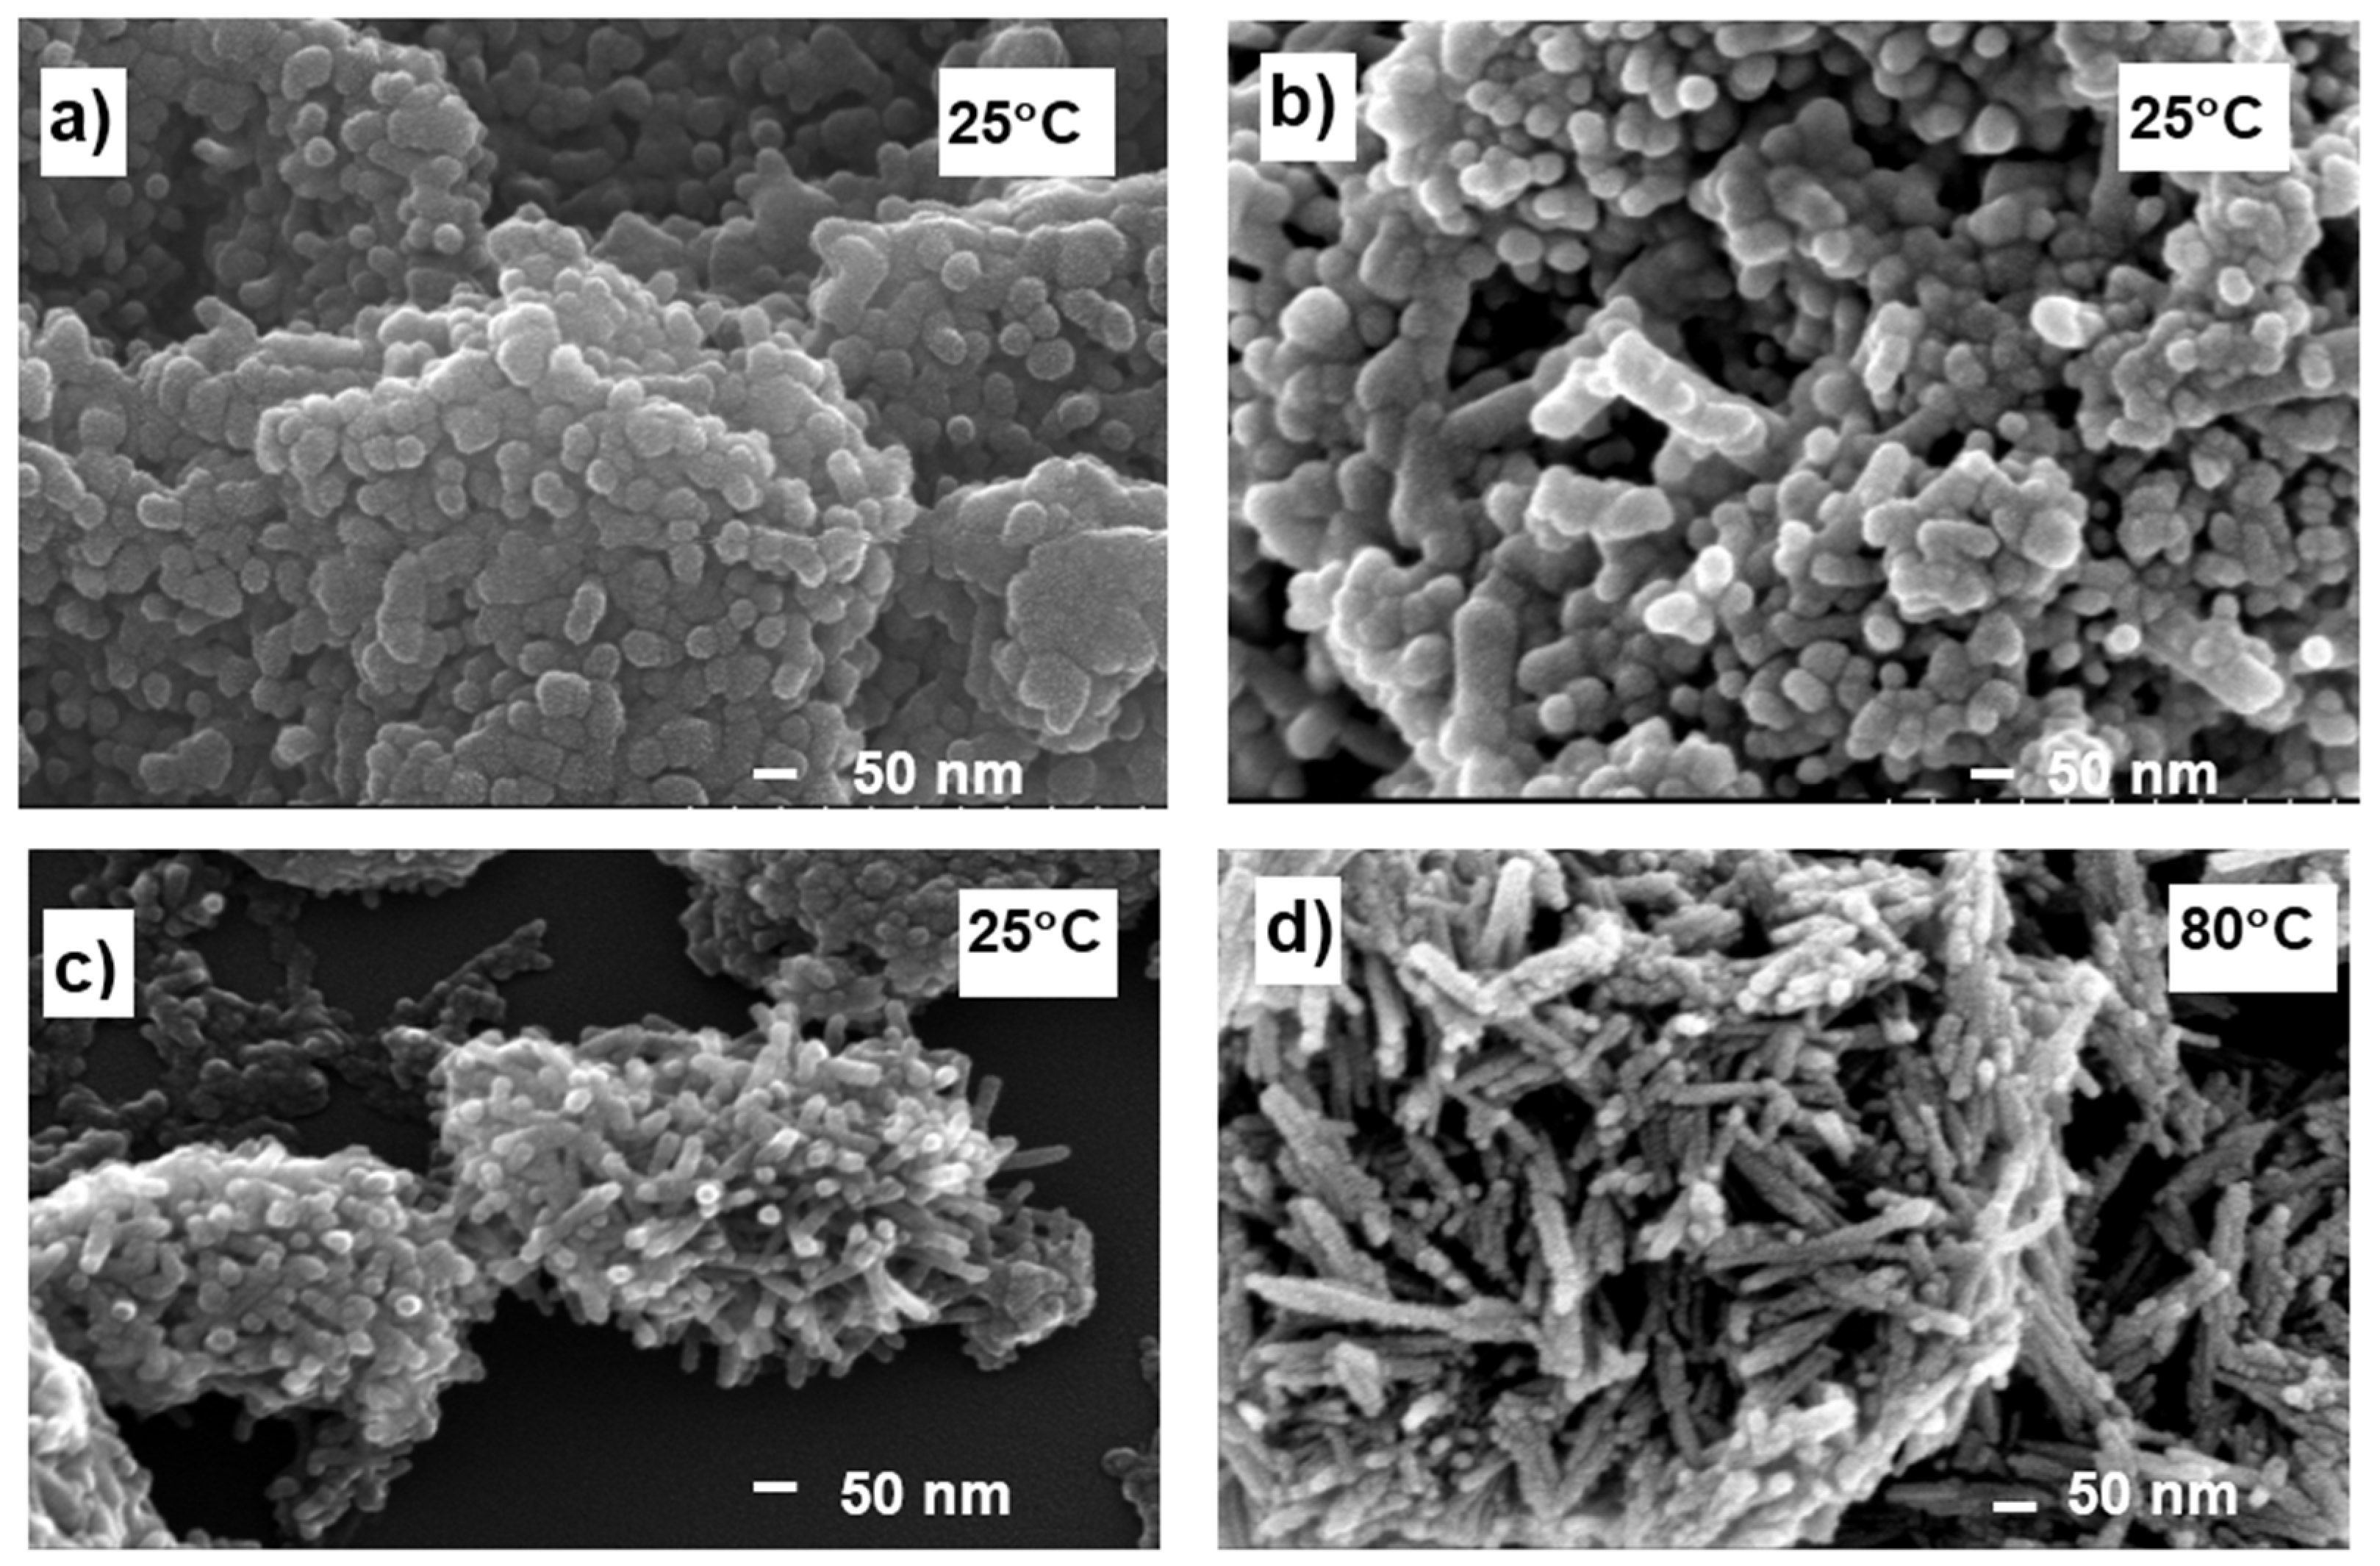
The morphologies of Samples B, C, D, and E that correspond to the illustration in
Figure 1 were also examined by the Scanning Electron Microscope (SEM) technique, and
Figure 3 shows the SEM images of four samples. For Samples B, C, and D, treated at only 25 °C at different durations, the Staghorn coral-shaped aggregates can be observed as in
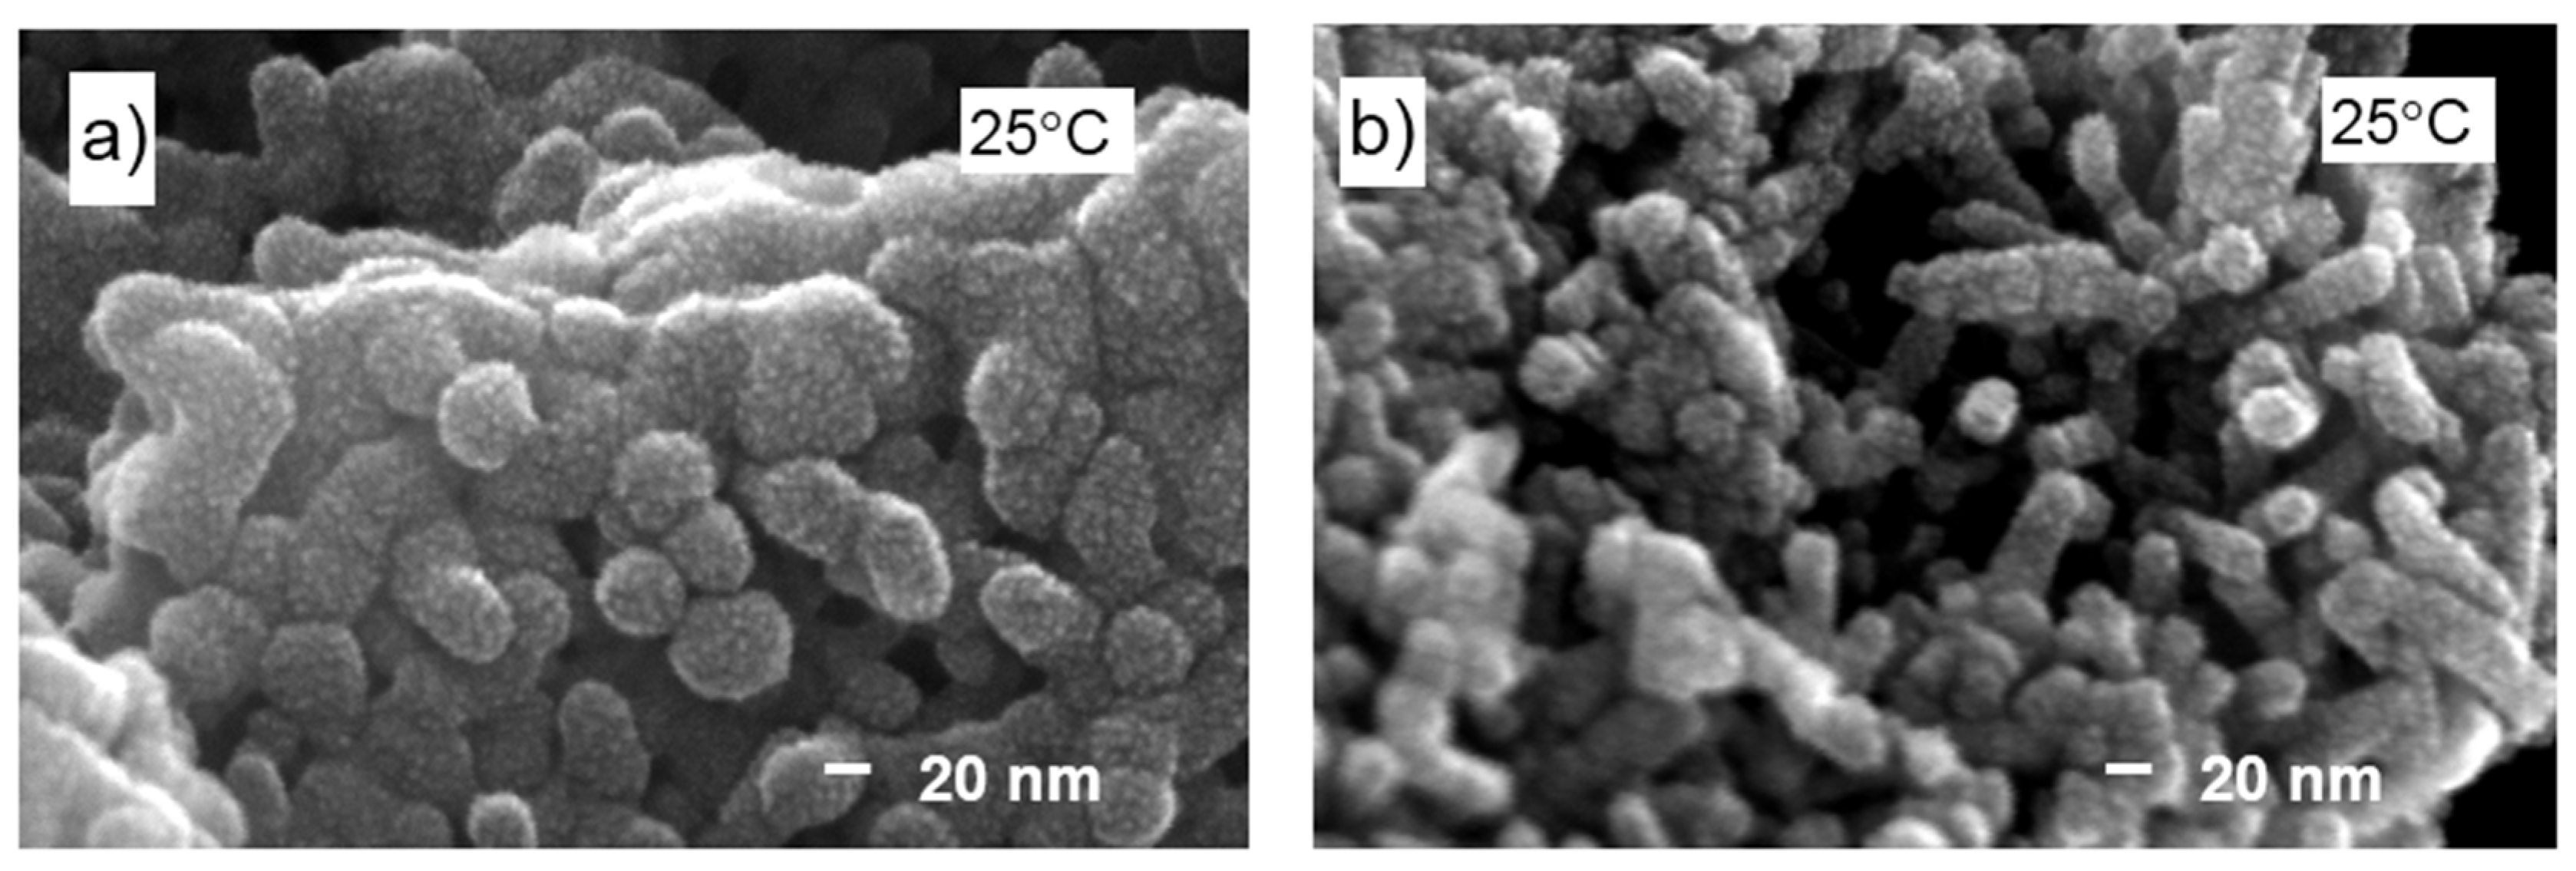
Figure 3a–c, respectively. A gradual development of the morphology and shape on each sample at subsequent growth stages can be seen. Sample B shows the rather dense aggregates packed by nanometer spherical particles. The high magnification image in
Figure 4a shows the fine features on the surface of each particle, which looks like the skin of a Staghorn coral. Such a feature on the surface increases the roughness of the particles, yielding a large surface area.
Table 1 lists the BET surface area for Samples B, C, and D. Sample B shows a 220 m
2/g BET surface area, which is the largest among all the samples. From
Figure 4a, we can see that the size of nano-particles is not uniform and the Staghorn coral-like structure appears quite dense. A dense structure such as that of Sample B might limit the access of electrolyte molecules if the materials are used as an electrode in electrochemical supercapacitors.
Further development of these microstructures was realized by treating Sample A in acid at 25 °C for a slightly longer time, i.e., 20 h, to form Sample C. The packed nano-particles elongated in one direction and the Staghorn coral-shaped microstructure developed a hollow structure, as shown in
Figure 3b. For Sample D, the reaction time was increased to 40 h, and its morphology is present in
Figure 3c. Nano-rods of uniform size are packed together to form a hollow Staghorn coral-shaped microstructure. As we can see in the high magnification image in
Figure 4b for Sample D, the rod-like particles are expanded in one direction at the expense of other directions compared to Sample B and C. From
Table 1, we can infer that Sample D has a reduced BET surface area, compared to Sample B, possibly due to the elongation of one dimension to form nanorods. Nevertheless, by comparing
Figure 4a,b, we can see that Sample D preserves the same surface features on nano-sized building blocks as Sample B. We believe that such a surface feature and the hollow microstructure of Sample D provide more active sites to the electrochemical system, benefiting electrochemical reactions.
The temperature effect on the shape and morphology of the synthesized materials was examined by SEM for Sample E (refer to
Figure 1 for sample notation), as shown in
Figure 3d. Instead of a Staghorn coral shape, a bird’s nest-shaped microstructure was developed in this process. The nano-sized building block turns to nanofibres rather than nanorods that are seen in Sample D. This implies that Sample E is under an accelerated growth process compared with the samples produced at 25 °C. The BET surface area of Sample E is the smallest among all the samples, as we can see in
Table 1. The reduction of BET surface areas could be attributed to the further elongation of nano-sized building blocks to form the nanofibres when Sample E is generated.
Figure 1 illustrates the morphologies of α-MnO
2 developed at different synthetic conditions for Samples B, C, D, and E. It demonstrates that, at 25 °C, Sample A gradually developed into different shapes as the reaction time proceeded. The process in the solution phase provides the mechanism by which the growth rate is controlled; consequently, the nanostructured substance, such as nanorods, can be developed with detailed surface features. Such a nanostructure can be further assembled into sophisticated micro-buildings, such as the Staghorn coral-like microstructure, while the fine features on the surface are kept. The longer process time is needed for stabilizing the micro-sized architecture with a hollow α-MnO
2 structure. The featured microstructure is believed to provide large surface areas and more active sites that are accessible for electrochemical reactions, which will be proven in the following electrochemical experiments.
The variation of shapes and morphologies of produced samples were correlated to the change in BET surface areas, average pore sizes at maximum volume distribution, and the total pore volumes. The BET results for each sample are summarized in
Table 1. Samples B, C, and D show a decreased trend in terms of BET surface area as a result of the elongation of nanoparticles from the spherical shape to the nanorod. Sample E, formed with long nanofibres, shows the lowest BET surface area and pore volume. These results indicate that both the surface features and the shape of particles determine BET surface area.
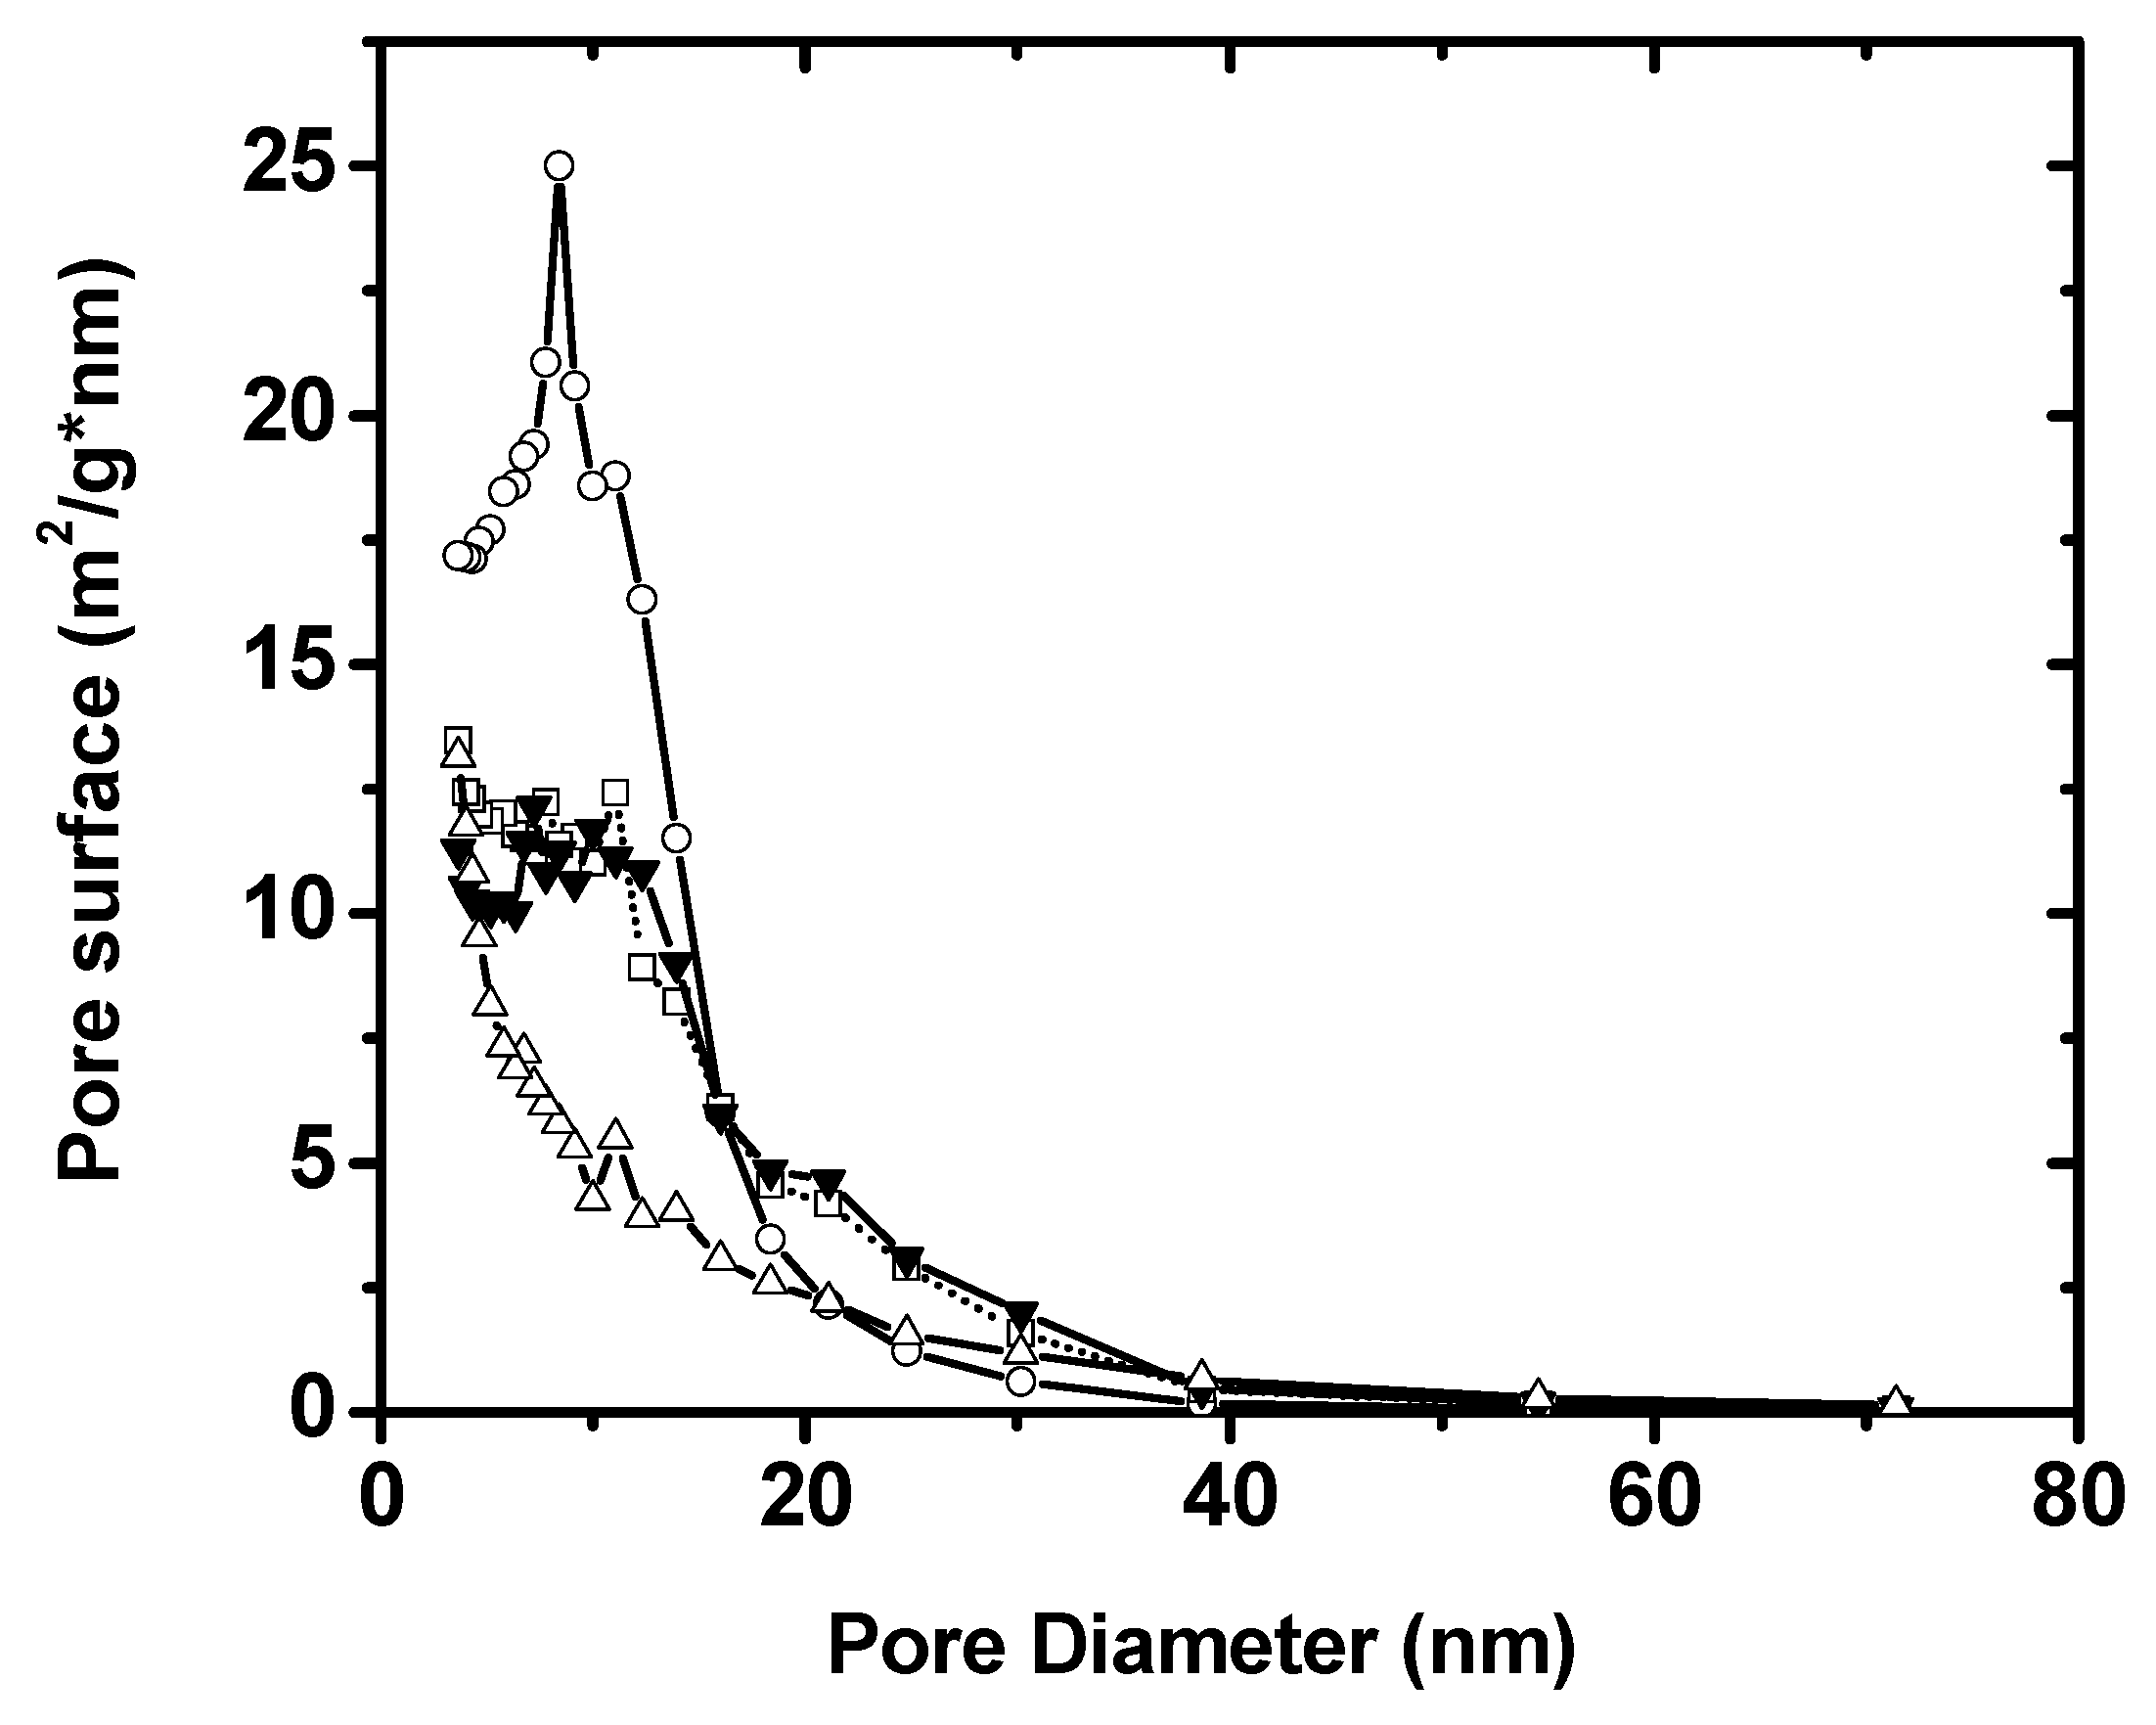
Figure 5 displays the plots of pore surface distribution versus pore diameters. It can be seen that Sample B presents a sharp pore size distribution with respect to the pore surface area, while Samples C and D show a wide distribution of surface areas of various pore sizes. This indicates that the hollow microstructures displayed by Samples C and D provide different pore structures with different sizes. Moreover, Sample E discloses a steady decrease in pore surface area as pore size increases, implying an absence of a nano-sized pore distribution in such a structure. As we will see later, all those differences can affect the electrochemical capacitive performance.
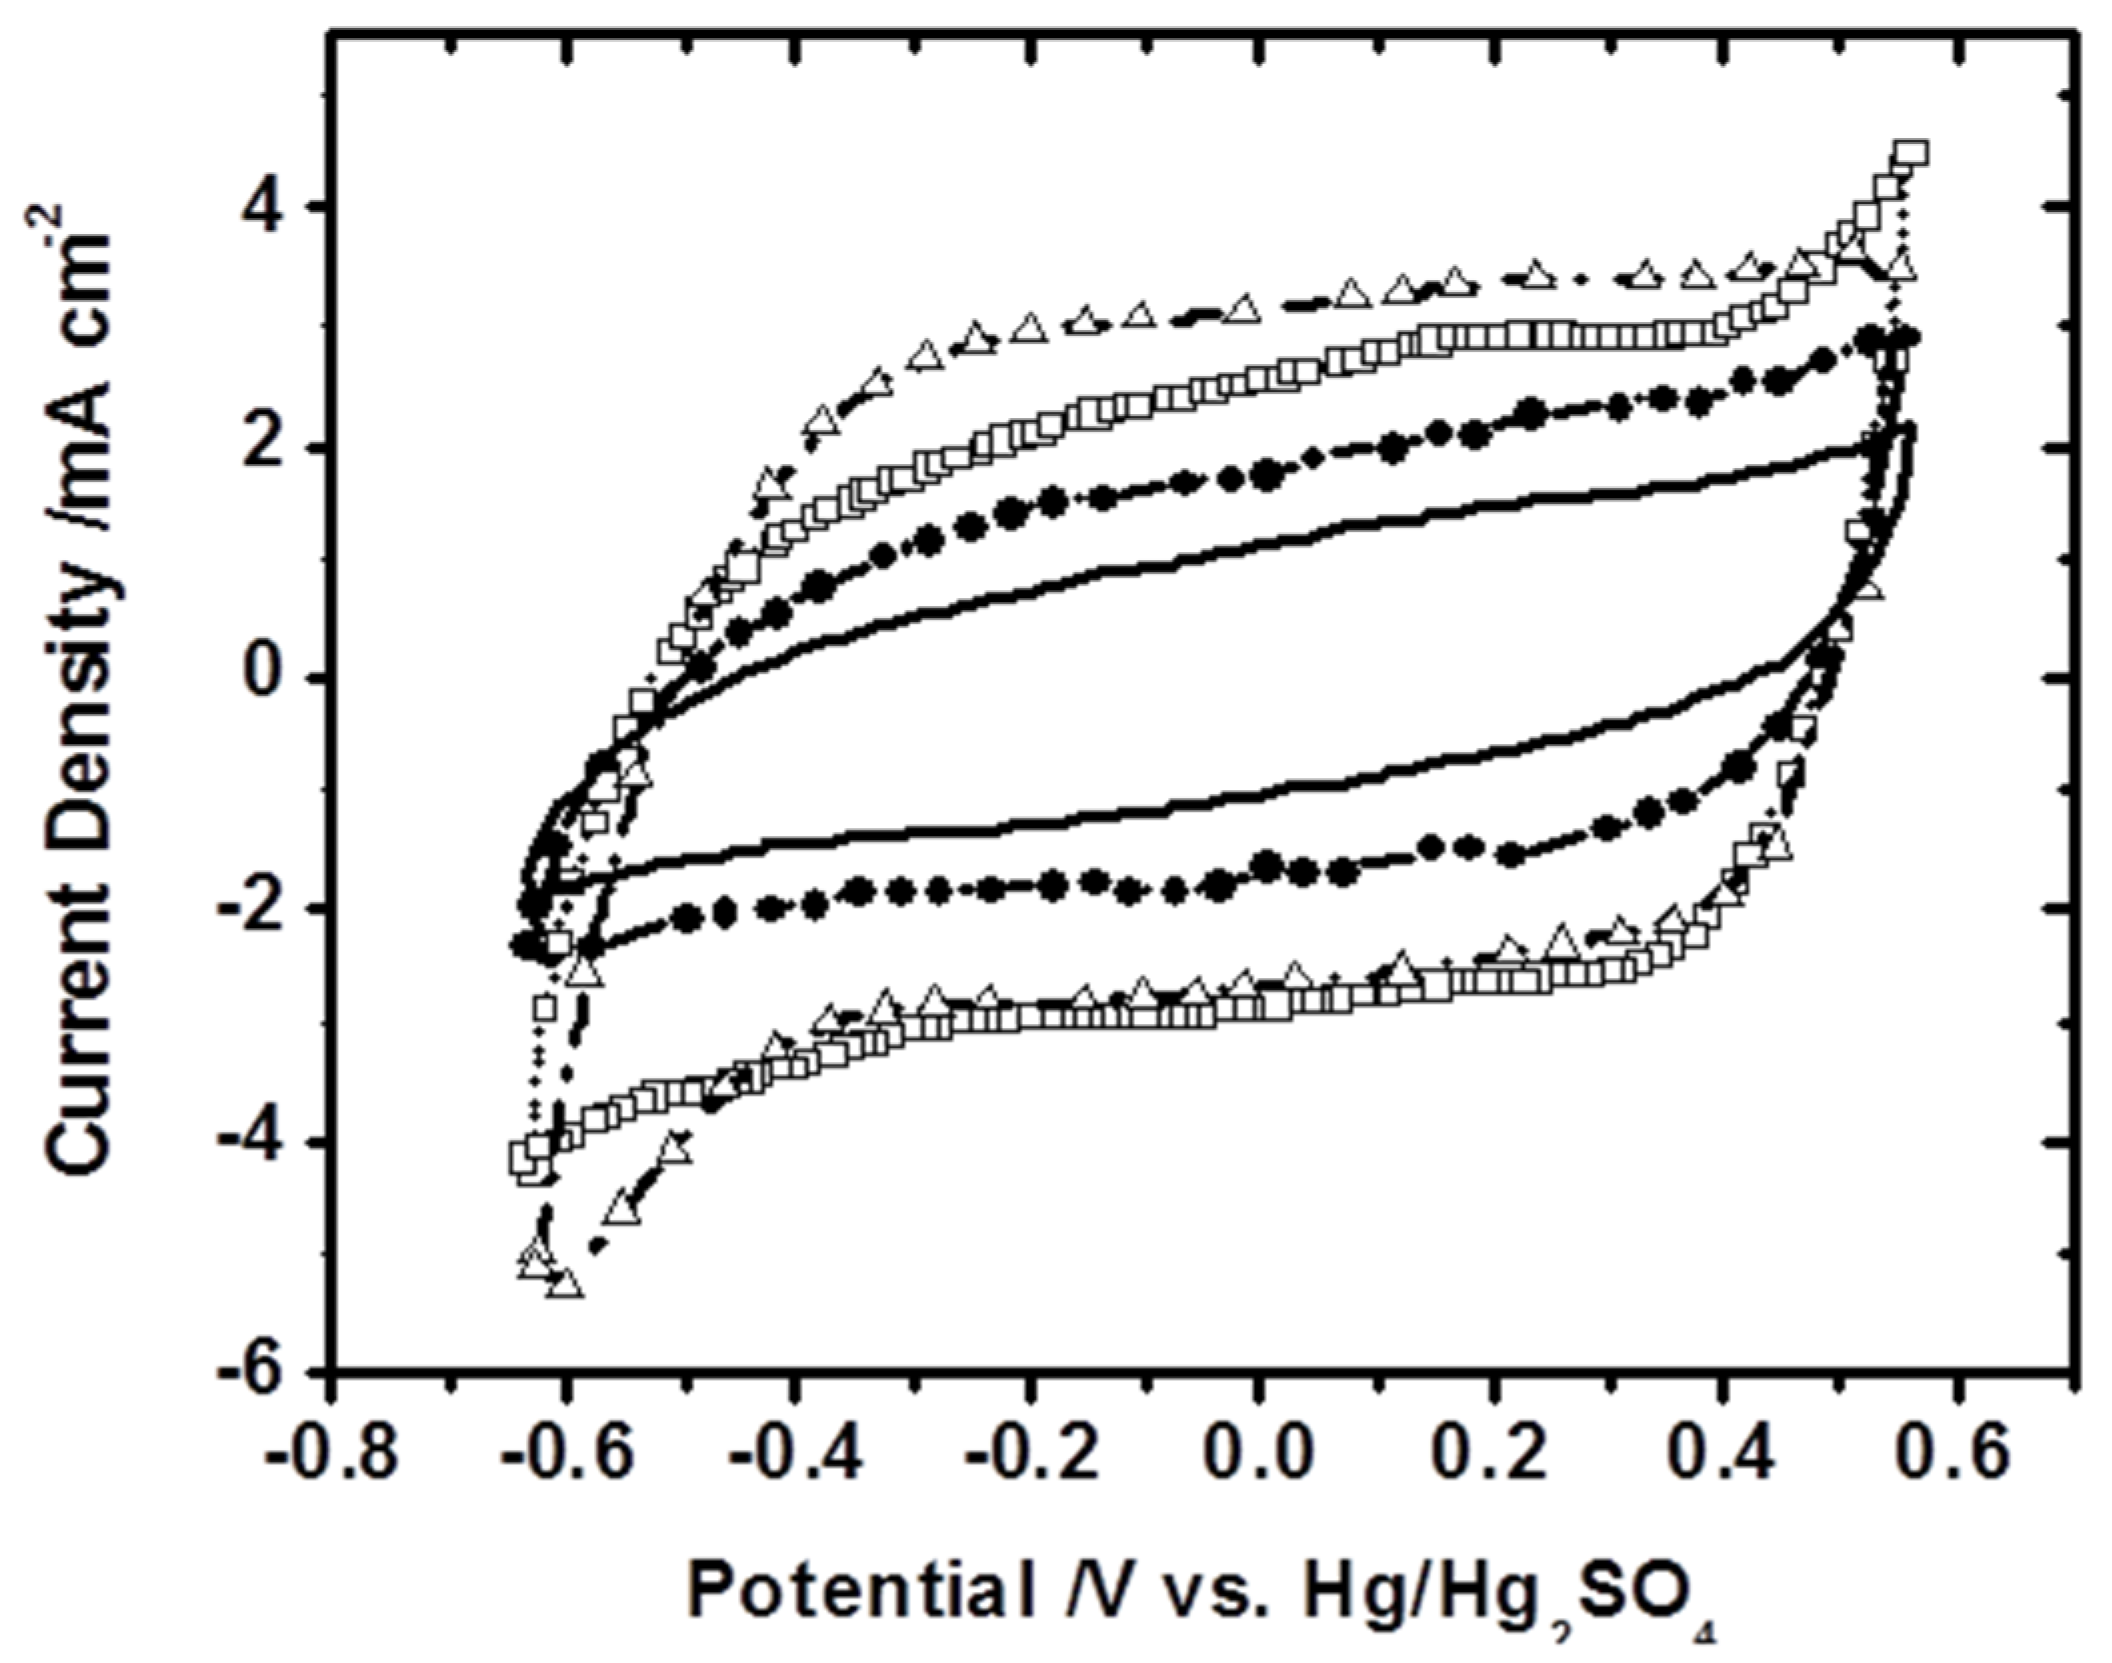
For investigating the material’s capacitance in looking at the supercapacitor applications, the cyclic voltammograms (CVs) of Samples B, C, D, and E, were recorded at a potential scan rate of 0.1 V/s in a 0.1 M Na
2SO
4 aqueous solution and are shown in
Figure 6, respectively. The loading of α-MnO
2 on the working electrode was 0.4 mg/cm
2. The CVs of Samples B, C, and D display a well-defined rectangular shape, indicating a typical capacitive behaviour. A steady increase in current densities as the synthesis reaction duration increases can be observed. The highest current density is obtained for Sample D, probably due to the uniform distribution of hollow nanorods decorated with fine nano-features on the surface. The current density of Sample E is lower than that of Samples B, C, and D, which is due to the potentially reduced active sites in Sample E. Since the capacitance of electrode materials is proportional to the current density, Sample E thus has a lower electrochemical performance compared to the other samples. The electrochemical capacitance of α-MnO
2 samples is decreased in the following order: Sample D > Sample C > Sample B > Sample E. As we stated earlier, even though Sample D shows a slightly lower BET surface area than Sample B, its hollow microstructure assembled with an array of nanorods provides some intensive active sites that are easy to access electrochemically. Since Sample B has a relatively dense microstructure, the exposure of active sites is limited, resulting in a lower capacitance. The decline in capacitance that occurs as synthesis reaction time decreases indicates that the well-developed morphology and shape are key factors for determining capacitive performance.
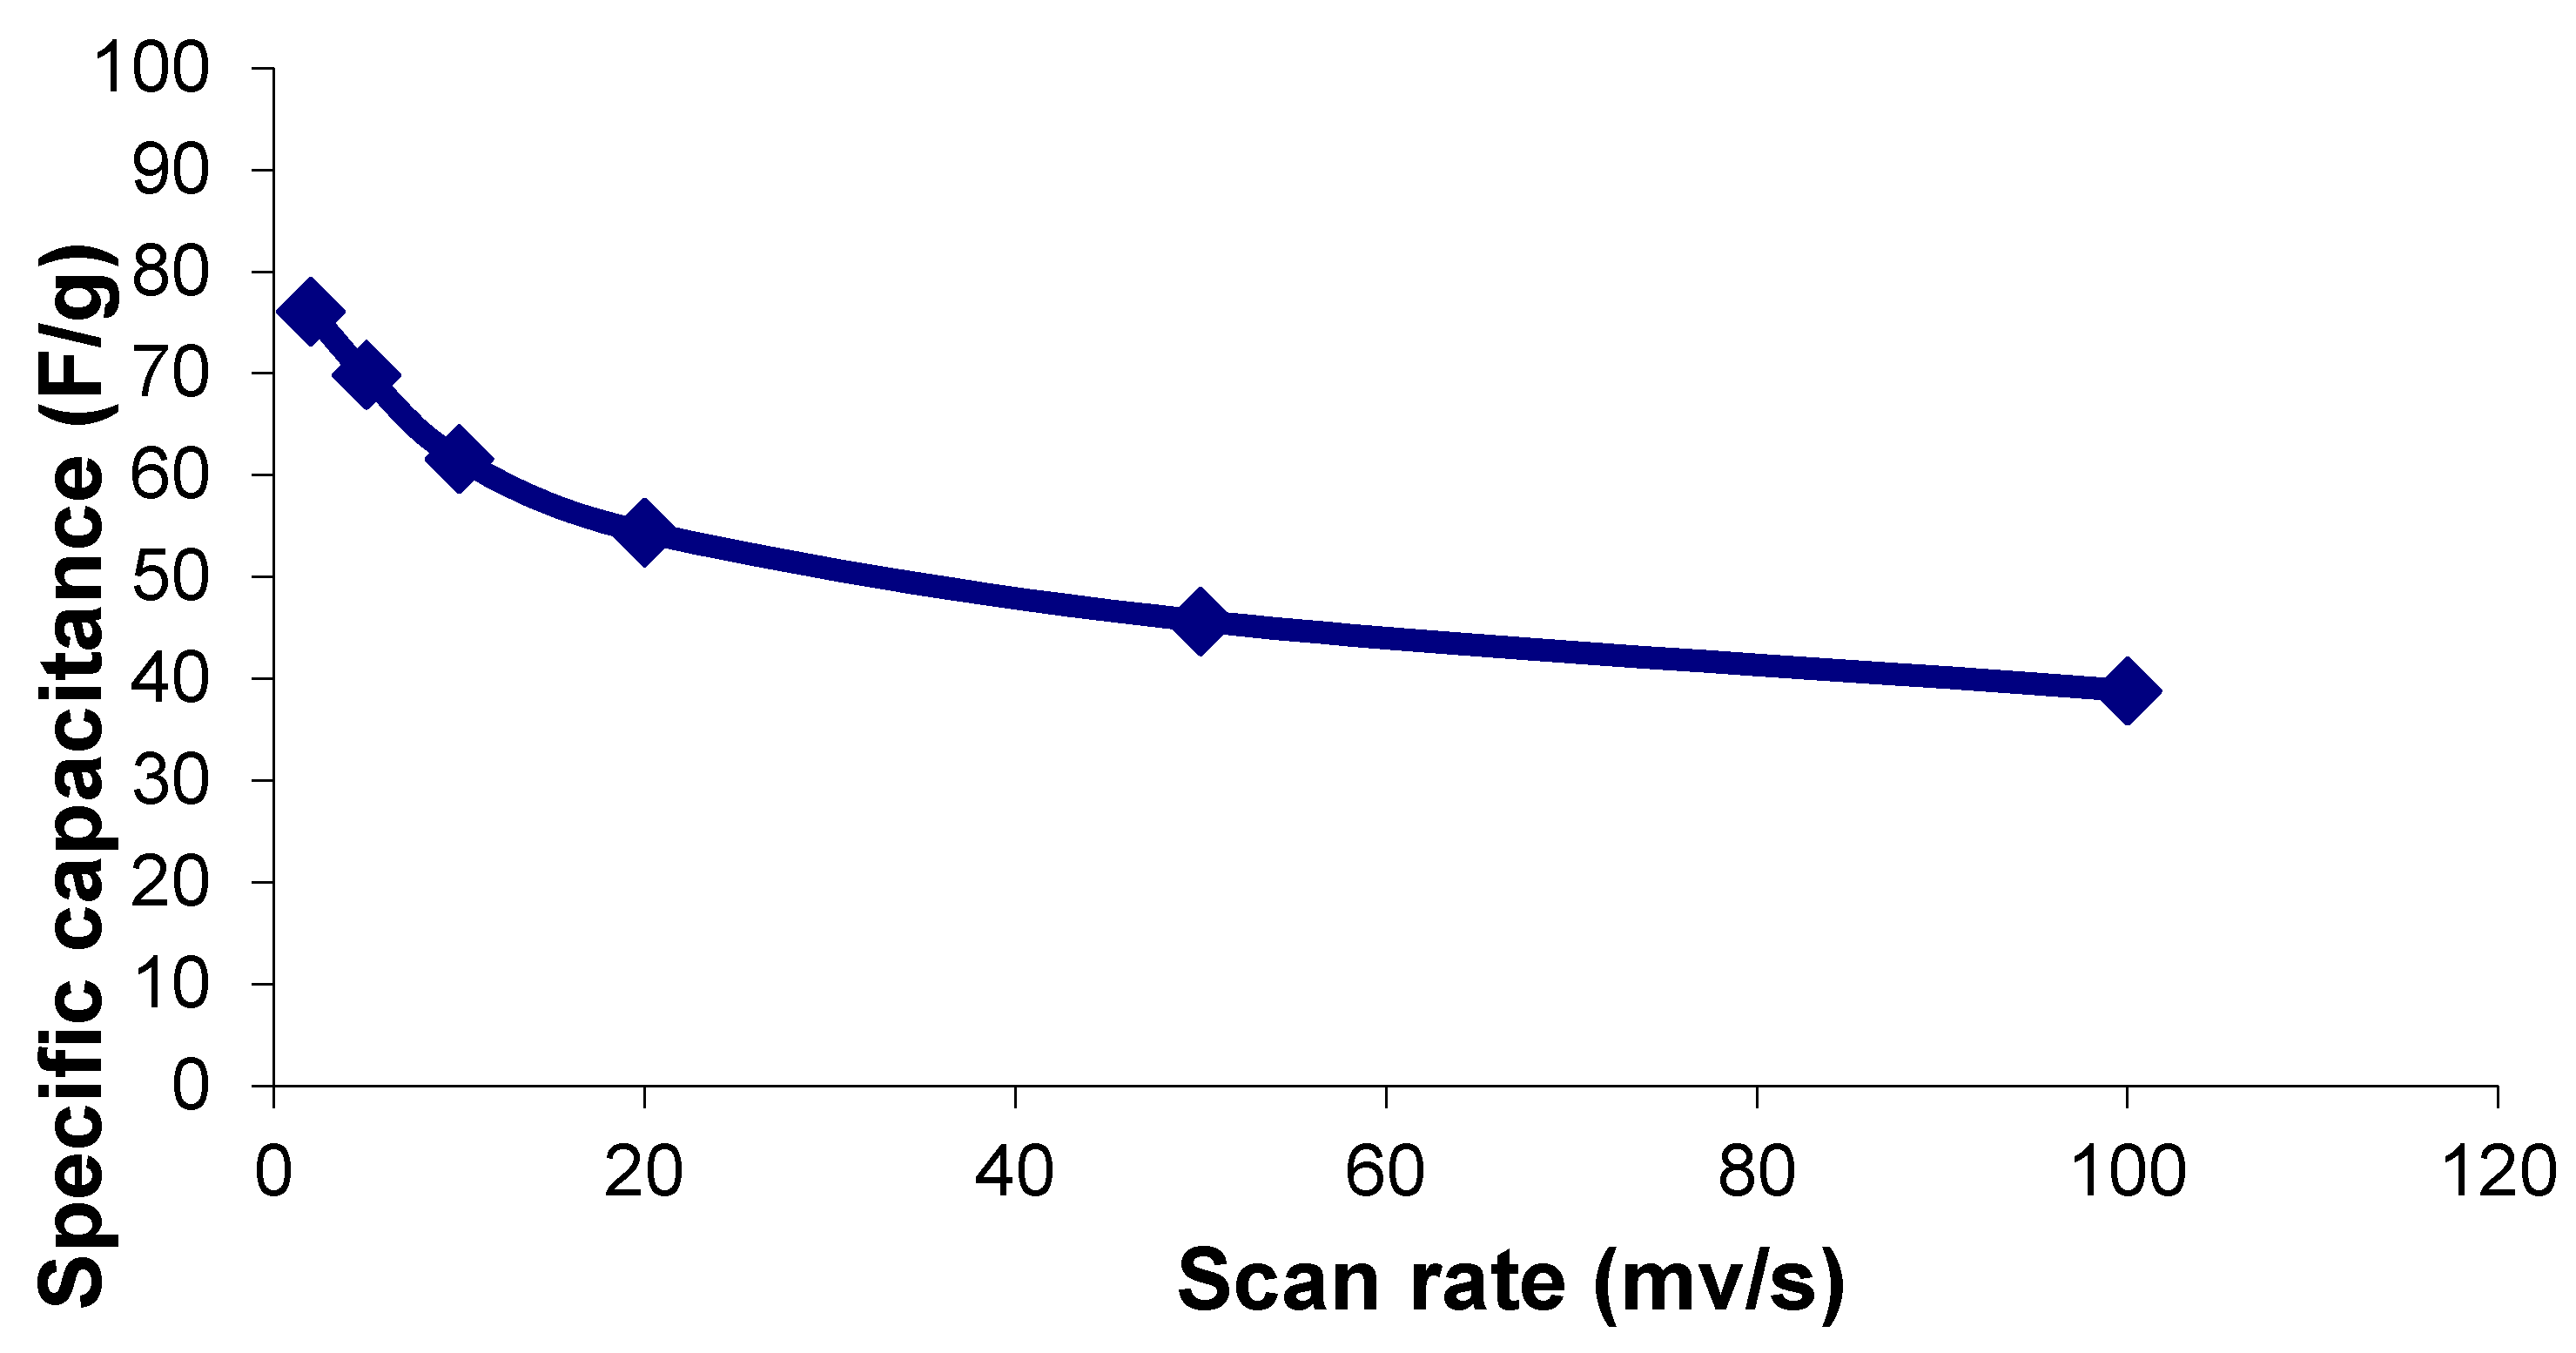
For investigating the effect of potential scan rates on material’s capacitance, the specific capacitance vs. the scan rate for the best performing sample (Sample D) was plotted and shown in
Figure 7. It can be observed that the specific capacitance is progressively lost when cycling at higher rates, indicating a limitation of power capability. On the other hand, their specific capacitance decreases at higher rates, meaning that the kinetics is slow. However, we expect that the results in this paper will provide practical information and methods for shape- and morphology-controlled synthesis for nanostructured functional materials in supercapacitor applications. Further optimization on the controlled synthesis and a fundamental understanding on internal resistance reduction of the electrode material and the resistance between electrode and electrolyte are definitely needed and will be explored through diagnosis tools such as electrochemical impedance spectroscopy (EIS) et al. in our future work. As a result, the performance obtained from such improved materials is worth further investigation in our future work. Areas of interest include a Nyquist plot, charge–discharge analysis, and the cyclic stability of electrode materials.


