Article

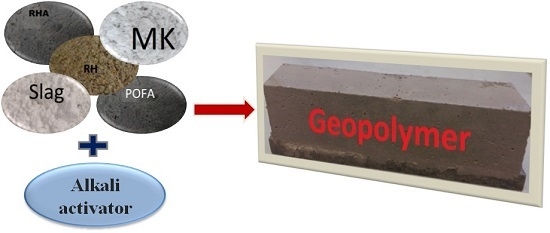
Development of Green Geopolymer Using Agricultural and Industrial Waste Materials with High Water Absorbency

1
Solar Energy Research Institute, Universiti Kebangsaan Malaysia, Bangi 43600, Selangor, Malaysia
2
Centre for Advanced Materials & Industrial Chemistry, School of Applied Science RMIT University, Melbourne, VIC 3001, Australia
3
Department of Chemistry, Faculty of Science and Technology, Universiti Kebangsaan Malaysia, Bangi 43600, Selangor, Malaysia
4
Catalysts and Organic Synthesis Research Laboratory, Department of Chemistry, Iran University of Science and Technology, P.O. Box 1684613114, Tehran, Iran
5
Department of Chemistry, K.N. Toosi University of Technology, P.O. Box 15875-4416, Tehran, Iran
*
Authors to whom correspondence should be addressed.
Appl. Sci. 2017, 7(5), 514; https://doi.org/10.3390/app7050514
Submission received: 21 February 2017 / Revised: 17 April 2017 / Accepted: 18 April 2017 / Published: 16 May 2017

Abstract

:
Geopolymer is a promising porous material that can be used for evaporative cooling applications. Developing a greener geopolymer using agricultural and industrial wastes is a promising research area. In this study, we utilize rice husk (RH), rice husk ash (RHA), metakaolin (MK), ground granulated blast furnace slag (GGBS), and palm oil fuel ash (POFA) to prepare geopolymer pastes, with alkali liquid as an activator. Many geopolymer samples have been prepared as per the Design of Experimental software (DOE), and its corresponding response surface mode and central composite design and later they were characterized. The samples were cured in an oven for 2 h at 80 °C, and thereafter stored at room temperature (~25–30 °C) prior to being tested for its water absorption and compressive strength. The effect of the different composition of precursors on water absorption, density, porosity, and the compressive strength of the prepared geopolymers have been investigated. The results showed that the compressive strength of geopolymers is directly proportional to the ratio of the alkali liquid. Post-optimization, the best geopolymer paste mixture was confirmed to contain 10% of RH, 15% RHA, 35% MK, 10% POFA and 30% of GGBS, with 72% desirability for maximum water absorption (~38%) and compressive strength (4.9 MPa). The results confirmed its applicability for evaporative cooling.

Graphical Abstract

1. Introduction

Employing passive evaporative cooling technology as an energy-efficient approach to partially decreasing energy consumption in buildings is becoming popular due to improvements in materials and designs [1].
Geopolymers, or inorganic polymers, have been touted as unique engineering materials that have the potential to form elements that are environmentally sustainable for the construction industry due to their respectable mechanical properties, low shrinkage, fire resistance, and low energy consumption [2,3,4]. Geopolymers are regarded as an environmentally friendly material, owing to their low manufacturing temperature (<100 °C) and low emission, which is six times less than CO2 compared with standard cement [5]. Although the investigations of geopolymers are mainly focused on concrete applications, they are regarded as attractive replacement materials for evaporative cooling applications [1].
The high water retention and excellent cooling effects due to the capillary lift of water and high surface area are regarded as crucial factors for evaporative cooling materials [6]. The compressive strength of geopolymers needs to be accounted for within the context of evaporative cooling. Geopolymer matrix materials, or binders, are an inorganic family of alkali-activated aluminosilicates. Geopolymerization is an alkaline activation of silica and alumina containing materials that produce an amorphous to semi-crystalline polymeric structure [7,8].
Another promising feature of the geopolymer is the fact that it can be prepared using waste materials [1].
Researchers reported three important factors that greatly influence the performance of geopolymers, which are: ratio of alkali liquid to solid; the ratio of sodium silicate to sodium hydroxide (Na2SiO3/NaOH); and the concentration of sodium hydroxide [9,10,11]. Researchers pointed out that the concentration of NaOH significantly influences the mechanical strength of kaolin-based geopolymers [12].
This study investigates the use of agricultural and industrial wastes and byproducts, such as rice husk, rice husk ash, palm oil fuel ash, and ground granulated blast furnace slag as resource materials to prepare green geopolymer pastes for the evaporative cooling application. The compositions of precursors on water absorption, apparent porosity, and compressive strength of the prepared geopolymer have been determined. Despite studies on porous geopolymers for evaporative cooling applications, investigation on the development of green geopolymers requires more work. This research developed new green binders of geopolymer using different agricultural and industrial wastes in an evaporative passive cooling system as a greener alternative. Moreover, the capillary rise properties of selected samples have been determined to confirm their viability as green geopolymer materials for evaporative cooling application.

2. Experimental

2.1. Materials

Rice husk (RH) was sourced from a local rice mill during the milling season in Malaysia. Rice husk ash (RHA) was prepared in the concrete and structure laboratory in University Kebangsaan Malaysia (UKM) using a specialized furnace [13]. Metakaolin was purchased from Burgess, Greenville, SC, USA. Palm oil fuel ash (POFA), which includes fibers, nut shells, and empty fruit bunches, were gathered from a local plant called Seri Ulu Langat Palm Oil Mill Sdn. Bhd., Dengkil, Selangor, Malaysia. It was then dried in an oven for 24 h at 100 °C to remove any remaining moisture and then sieved using a 300-µm sieve. The ground granulated blast-furnace slag (GGBS), which is a byproduct of steel plants, was collected from Slag Cement Sdn. Bhd., Pulau Indah, Selangor, Malaysia. Afterwards, RH, RHA, and POFA were grounded using a ball mill until the mass of the fine particles were retained on a sieve size No. 325 (an aperture of 75 μm) at 1–3%. The MK and slag were used as is. Sodium silicate solutions (Na2SiO3) (10.6% Na2O, 26.5% SiO2, and 62.9% H2O) were purchased from Sigma-Aldrich (St. Louis, MO, USA), while sodium hydroxide and pellet with analytical reagents were purchased from ACS and used as alkali activators. Sodium silicate solution or water glass (WG) and sodium hydroxide were used in the form of a solution to make a part of the mixture. WG was used as received, while different concentrations of NaOH were prepared to study its effect on the prepared geopolymer samples. The chemical compositions of RH, RHA, MK, POFA, slag, WG, and the specified geopolymer sample before/after casting (dry mix before and after activation) were determined using X-ray fluorescence (XRF) (S8 Tiger, Bruker, Billerica, MA, USA) (Table 1). Loss on ignition (LOI), which is an indicator for carbon content, was measured according to ASTM C 114-04 [14]. The XRD patterns for raw materials and geopolymer were determined using Bruker DB-Advance X-ray Diffractometer (Bruker), while the functional groups of the samples were determined using FTIR spectrophotometer (Perkin Elmer-400, PerkinElmer, Waltham, MA, USA). The specific surface area, pore size, pore volume, and pore diameter of the samples were determined via the Brunauer–Emmet–Teller (BET) method using a nitrogen adsorption instrument (Micrometics ASAP 2010, Micrometrics instrument, Norcross, GA, USA). The samples were degassed at 150 °C for 6 h prior to the analyses. Pore size distribution was calculated from the adsorption–desorption of the isotherms using the Barret–Joyner–Halenda (BJH) model.

2.2. Geopolymer Preparation and Characterization

Taking into account the ratio of alkali liquid to solid, the ratio of sodium silicate to sodium hydroxide (Na2SiO3/NaOH), and the concentrations of sodium hydroxide on geopolymers performance, in the first step, the effects of these factors on a selected sample (10% RH, 15% RHA, 35% MK, 10% POFA and 30% Slag) based on literature review and trial-and-error was investigated. In this step, the Design of Experimental software (DOE) version 7 (Stat-Ease cooperation, Minneapolis, MN, USA, 2015), response surface mode, and central composite design software were employed for studying these factors and determining water absorption, density, and compressive strength for the purpose of obtaining the optimal molar ratio and preparing the geopolymer paste. As per the literature, the ratios of alkali liquid to solid were set at 0.3, 0.4, 0.5; the ratios of sodium silicate to sodium hydroxide (Na2SiO3/NaOH) were set at 1, 1.5, and 2.5; the concentrations of sodium hydroxide (NaOH) were set at 8, 10, 14 M; all of which were within range of the DOE. The results are presented in Table 2, while the analysis of variance (ANOVA) table is tabulated in Table 3 (Figures S1–S3).
ANOVA values confirmed that all main factors significantly influence the three responses. The model’s F-value of 5.38 implies that it is significant. There is only a 0.13% chance that a “Model F-Value” this large could occur due to noise. The “Lack of Fit F-value” of 2.261 implies that the Lack of Fit is not significant relative to pure error (Table 3).
The determination of the optimum value for control variables (factors) is one of the main objectives of RSM, which can have maximum (or a minimum) response over a specific region of interest. Having a “good”-fitting model is necessary to adequately represent the mean response because such a model can be utilized to determine the optimum value [15].
In the second step, a total of 30 mixtures were prepared at different percentages of RH, RHA, MK, POFA, and GGBS using NaOH (alkali activation) based on Design of Experimental software (DOE) version 7, response surface mode, and central composite design, by introducing each component’s limitations and factors (Table 4). The samples were manually mixed, and the pastes were poured into a 20 × 20 × 20 mm3 molds to set, forming the specimens that will be characterized. For each geopolymer paste mixture, eighteen specimens were cast in a 20 mm3 cube to determine its compressive strength, density, porosity, and water absorption capabilities. The samples in the molds were tightly wrapped in plastic films to prevent any loss of moisture. All of the samples were heated in an electric oven at 80 °C for 2 h after casting. Later, the prepared samples were kept at an ambient temperature of 30 ± 2 °C prior to being characterized.
The water absorption and porosity of the specimens were calculated based on ASTM D 570-98 and ASTM C 642-06, respectively. The density of the samples was measured using an Electronic Densimeter (model MD-300S, Alfa Mirage, Miyakojima-ku, Osaka, Japan). The capillary rise of the samples was measured by immersing one side of the prepared cube in water at room temperature at various times, as per ASTM 1585. The compressive strength of mortar is one of the principal parameters that represent the quality of the binder, where its used to gauge the potential success of geopolymerization. The test is regarded as being cost effective and simple to administer, and the development of strength is used as a primary measure of its utility for application in the construction industry [16]. It was determined using a 20 mm3 cube sample, as per ASTM C 109 (2009) testing standards, with a PC base automatic SSM-AJ-10KN compression testing machine. An average was taken from three values for samples after 3, 7, and 28 days post-curing.
To investigate the effect of the concentration of NaOH on compressive strength in the prepared geopolymers, two samples were randomly selected and prepared at different concentrations of NaOH (8, 10, and 14 M). The compressive strength of the samples has been tested after curing at room temperature for 28 days.
The samples’ components and their water absorption, porosity, density, and compressive strengths are tabulated in Table 3.
As per Table 4, the residual compressive strength of the specimens is inversely proportional to both water absorption and porosity. Sample 27 had a residual strength of 4.99 MPa, corresponding to the lowest water absorption (30.11%). Contrarily, sample 14, at 48.4% water absorption, reported the lowest residual compressive strength of 2.43 MPa.

3. Result and Discussion

3.1. NaOH Concentration Effect

The results from Table 2 (validated with ANOVA) showed that the best ratio was 0.5 for alkali liquid to solid, and 2.5 for sodium silicate to sodium hydroxide. The concentration 10 M for NaOH agrees with [9,11,17,18,19,20].
According to the results, the compressive strength is maximum when NaOH concentration is at 10 M. This could be due to the higher dissolution of initial solid materials at high concentrations of NaOH, which accelerates the geopolymerization reaction, leading to the higher compressive strength of geopolymers [21]. The solubility of aluminosilicate is directly proportional to the concentration of NaOH [12,22]. Increased additions of NaOH accelerated the chemical dissolution but suppressed the formation of ettringite and CH in the course of binder hydration [23]. Reduction in the CH content resulted in superior strength and durability [24]. However, compressive strength is inversely proportional to the concentration of NaOH at 10–14 M. This could be due to the presence of excess hydroxide ion concentration [25] and excess Na+ ions in the framework [22,26], which precipitates aluminosilicate gel during the early stages of the reaction, thus preventing geopolymerization, culminating in lower compressive strengths. The higher the alkalinity of the hydration water, the slower the rate of the hydration [27].

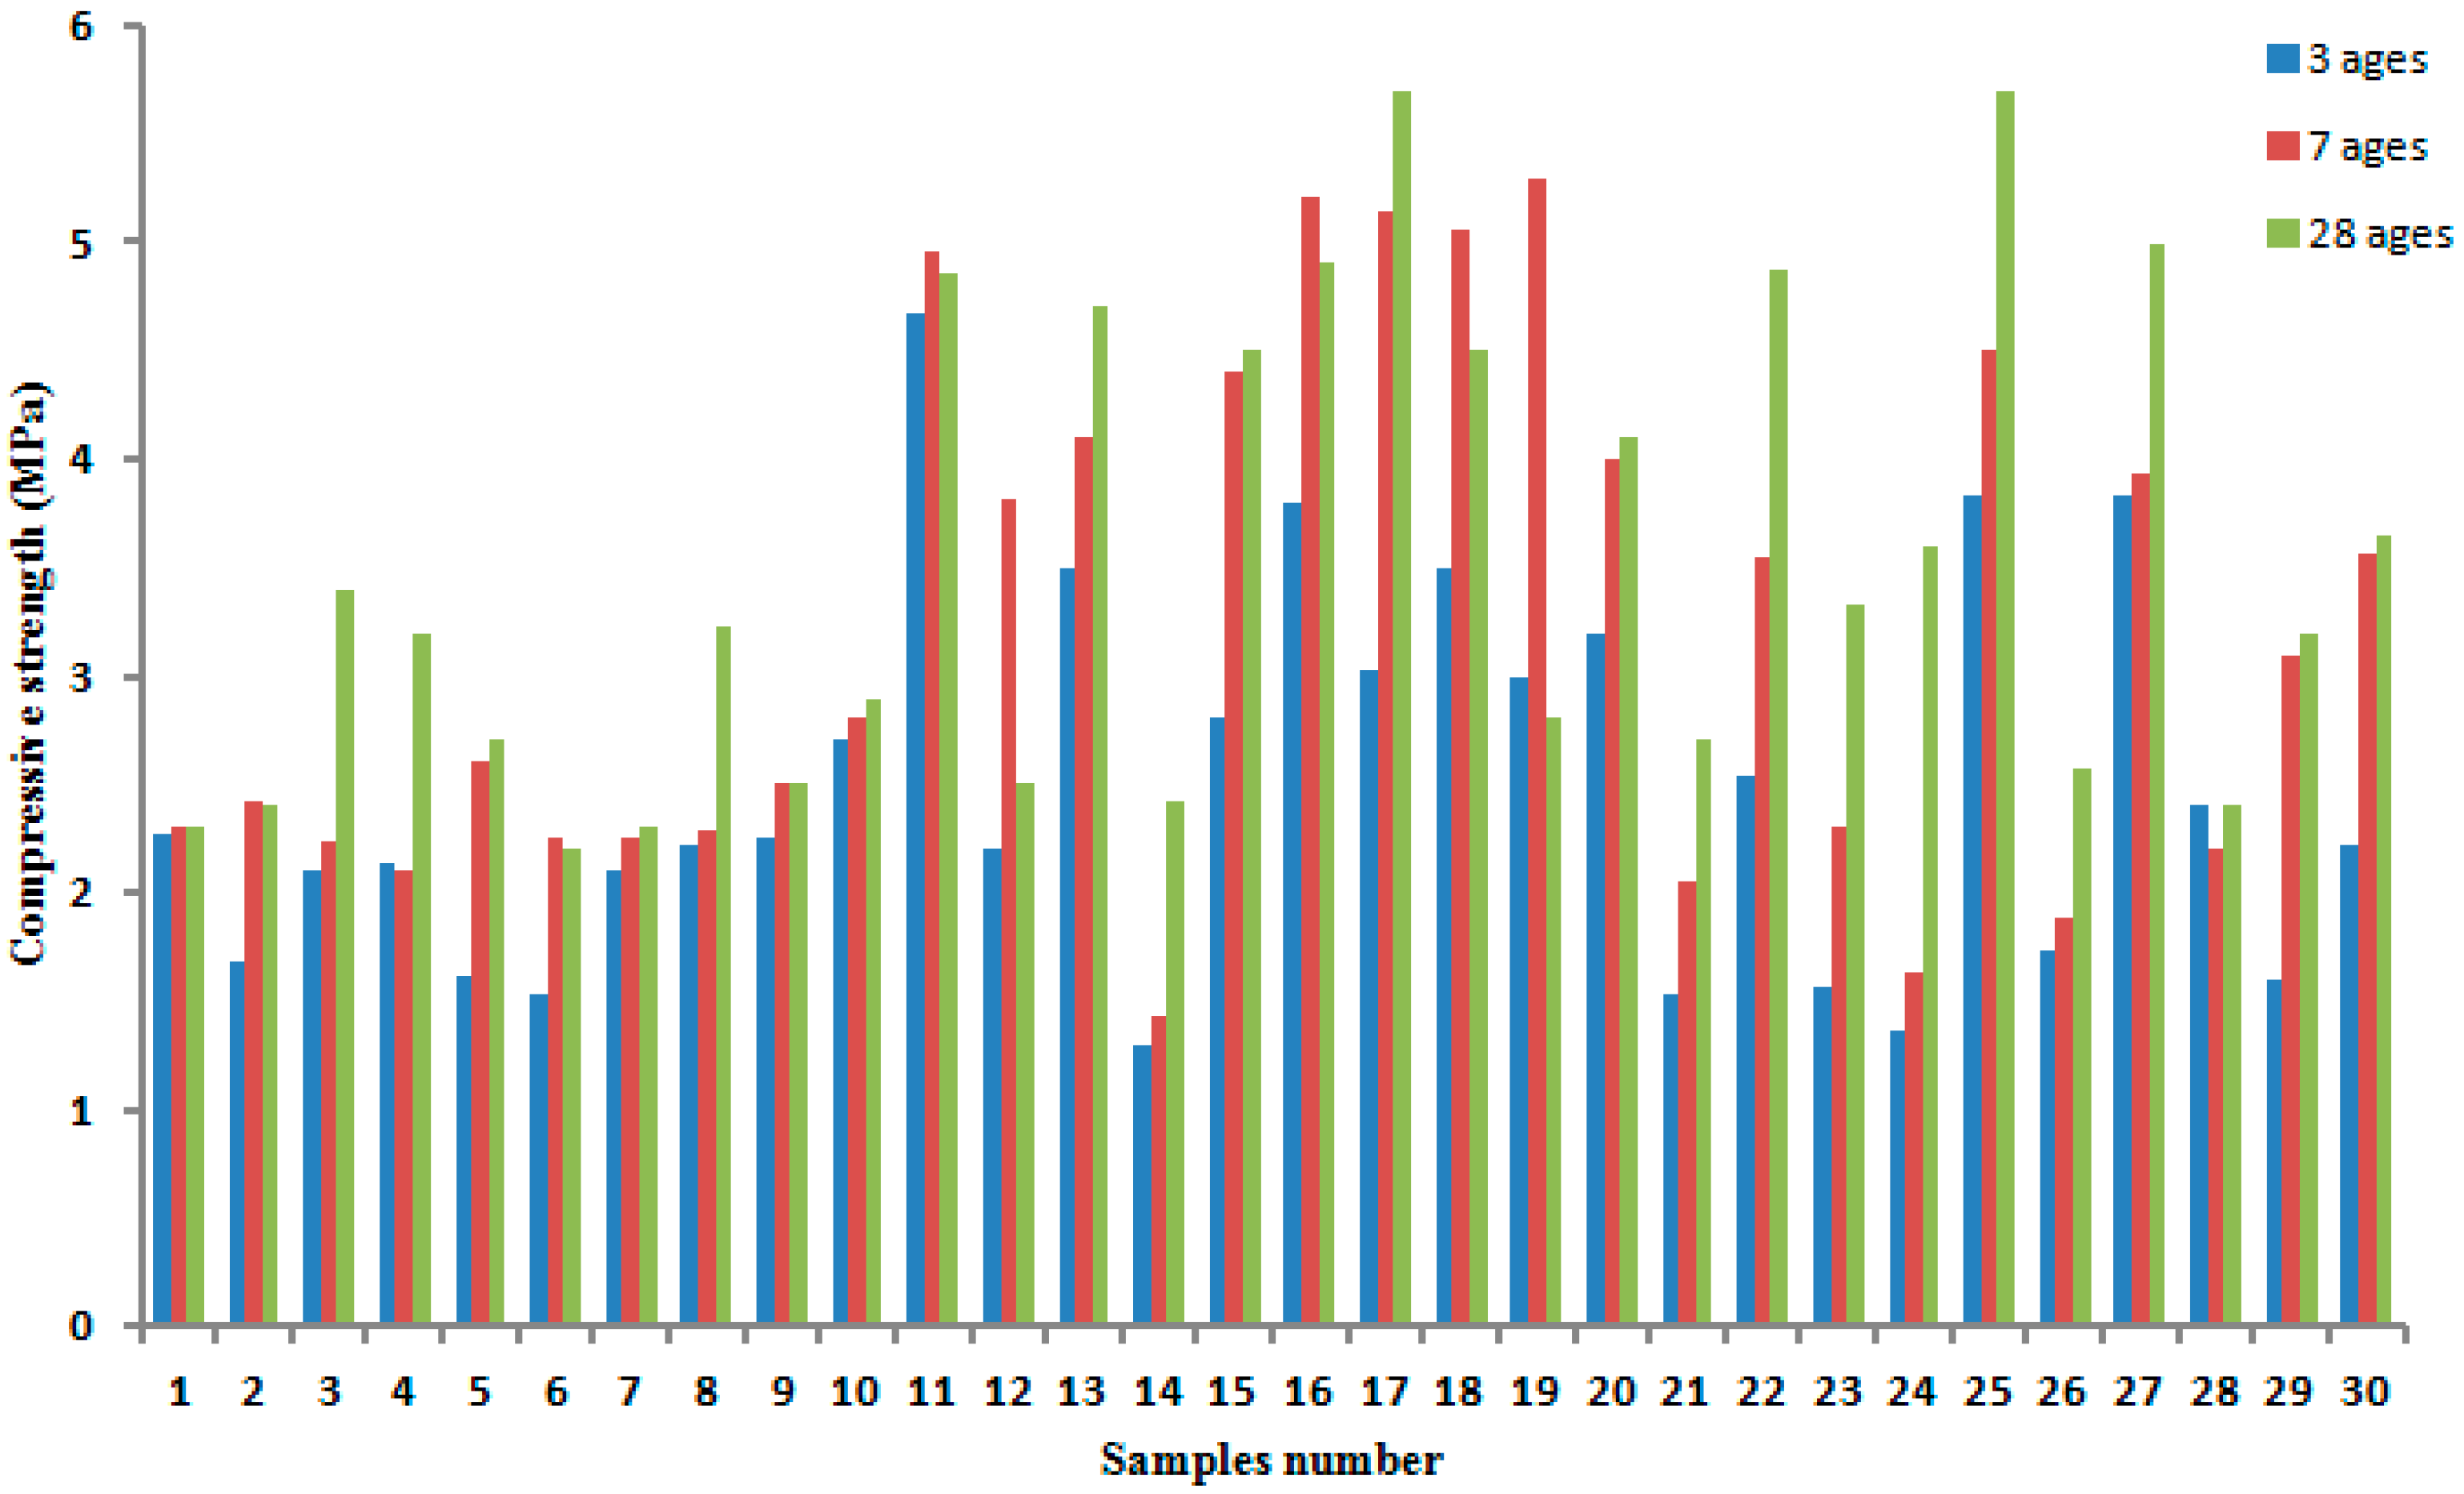
3.2. Curing Time Effect

The effect of curing time on the compressive strength of the prepared geopolymers samples (using 10 M NaOH) has been studied.
The compressive strength for geopolymer samples that were cured at room temperature for 3, 7, and 28 days are depicted in Figure 1. As can be seen, increasing the curing time from 3 to 28 days increased the compressive strength. The results agree with [22,28]. It is believed that the increment in compressive strength alongside curing time is related to the improvement of the geopolymerization process.
Samples 17 and 25 reported the highest compressive strength (5.7 MPa).
The compressive strengths of geopolymer are dependent upon the source of the aluminosilicate and reaction conditions (the type and concentration of the alkali used, curing time, and temperature). Rice husk (RH), Rice husk ash (RHA), and Palm oil fuel ash (POFA) contain a high percentage of silicon dioxide or alumino-silica in amorphous form and can be used as pozzolanic material [29] to prepare geopolymers. The compressive strength could be tuned by controlling the strength of the gel phase, the ratio of the gel phase to undissolved Al-Si particles, the nature of the amorphous phase, the degree of crystallinity, and surface reactions between the gel phase and undissolved particles [30,31]. The OH in the activators plays a catalytic role for reactivity, while the metal cation helps form a structural element, and balance the negative framework of tetrahedral aluminum [32] to accelerate the precipitation and crystallization of the siliceous and aluminous species. In order to develop a more enhanced version of geopolymer, we took into account the influence of the aforementioned parameters on geopolymer’s compressive strength, while the organic materials utilized as precursors should be studied in greater detail.
The sample contains RHA 20%, POFA 10%, MK 35%, while slag 35% without raw rice husk was investigated for comparison purpose, which reported a compressive strength of 5.48 MPa (28 days curing) and water absorption of 30.8% (24 h soaking). It was confirmed that although the addition of raw rice husk decreases compressive strength, it increases the percentage of water absorption percentage.

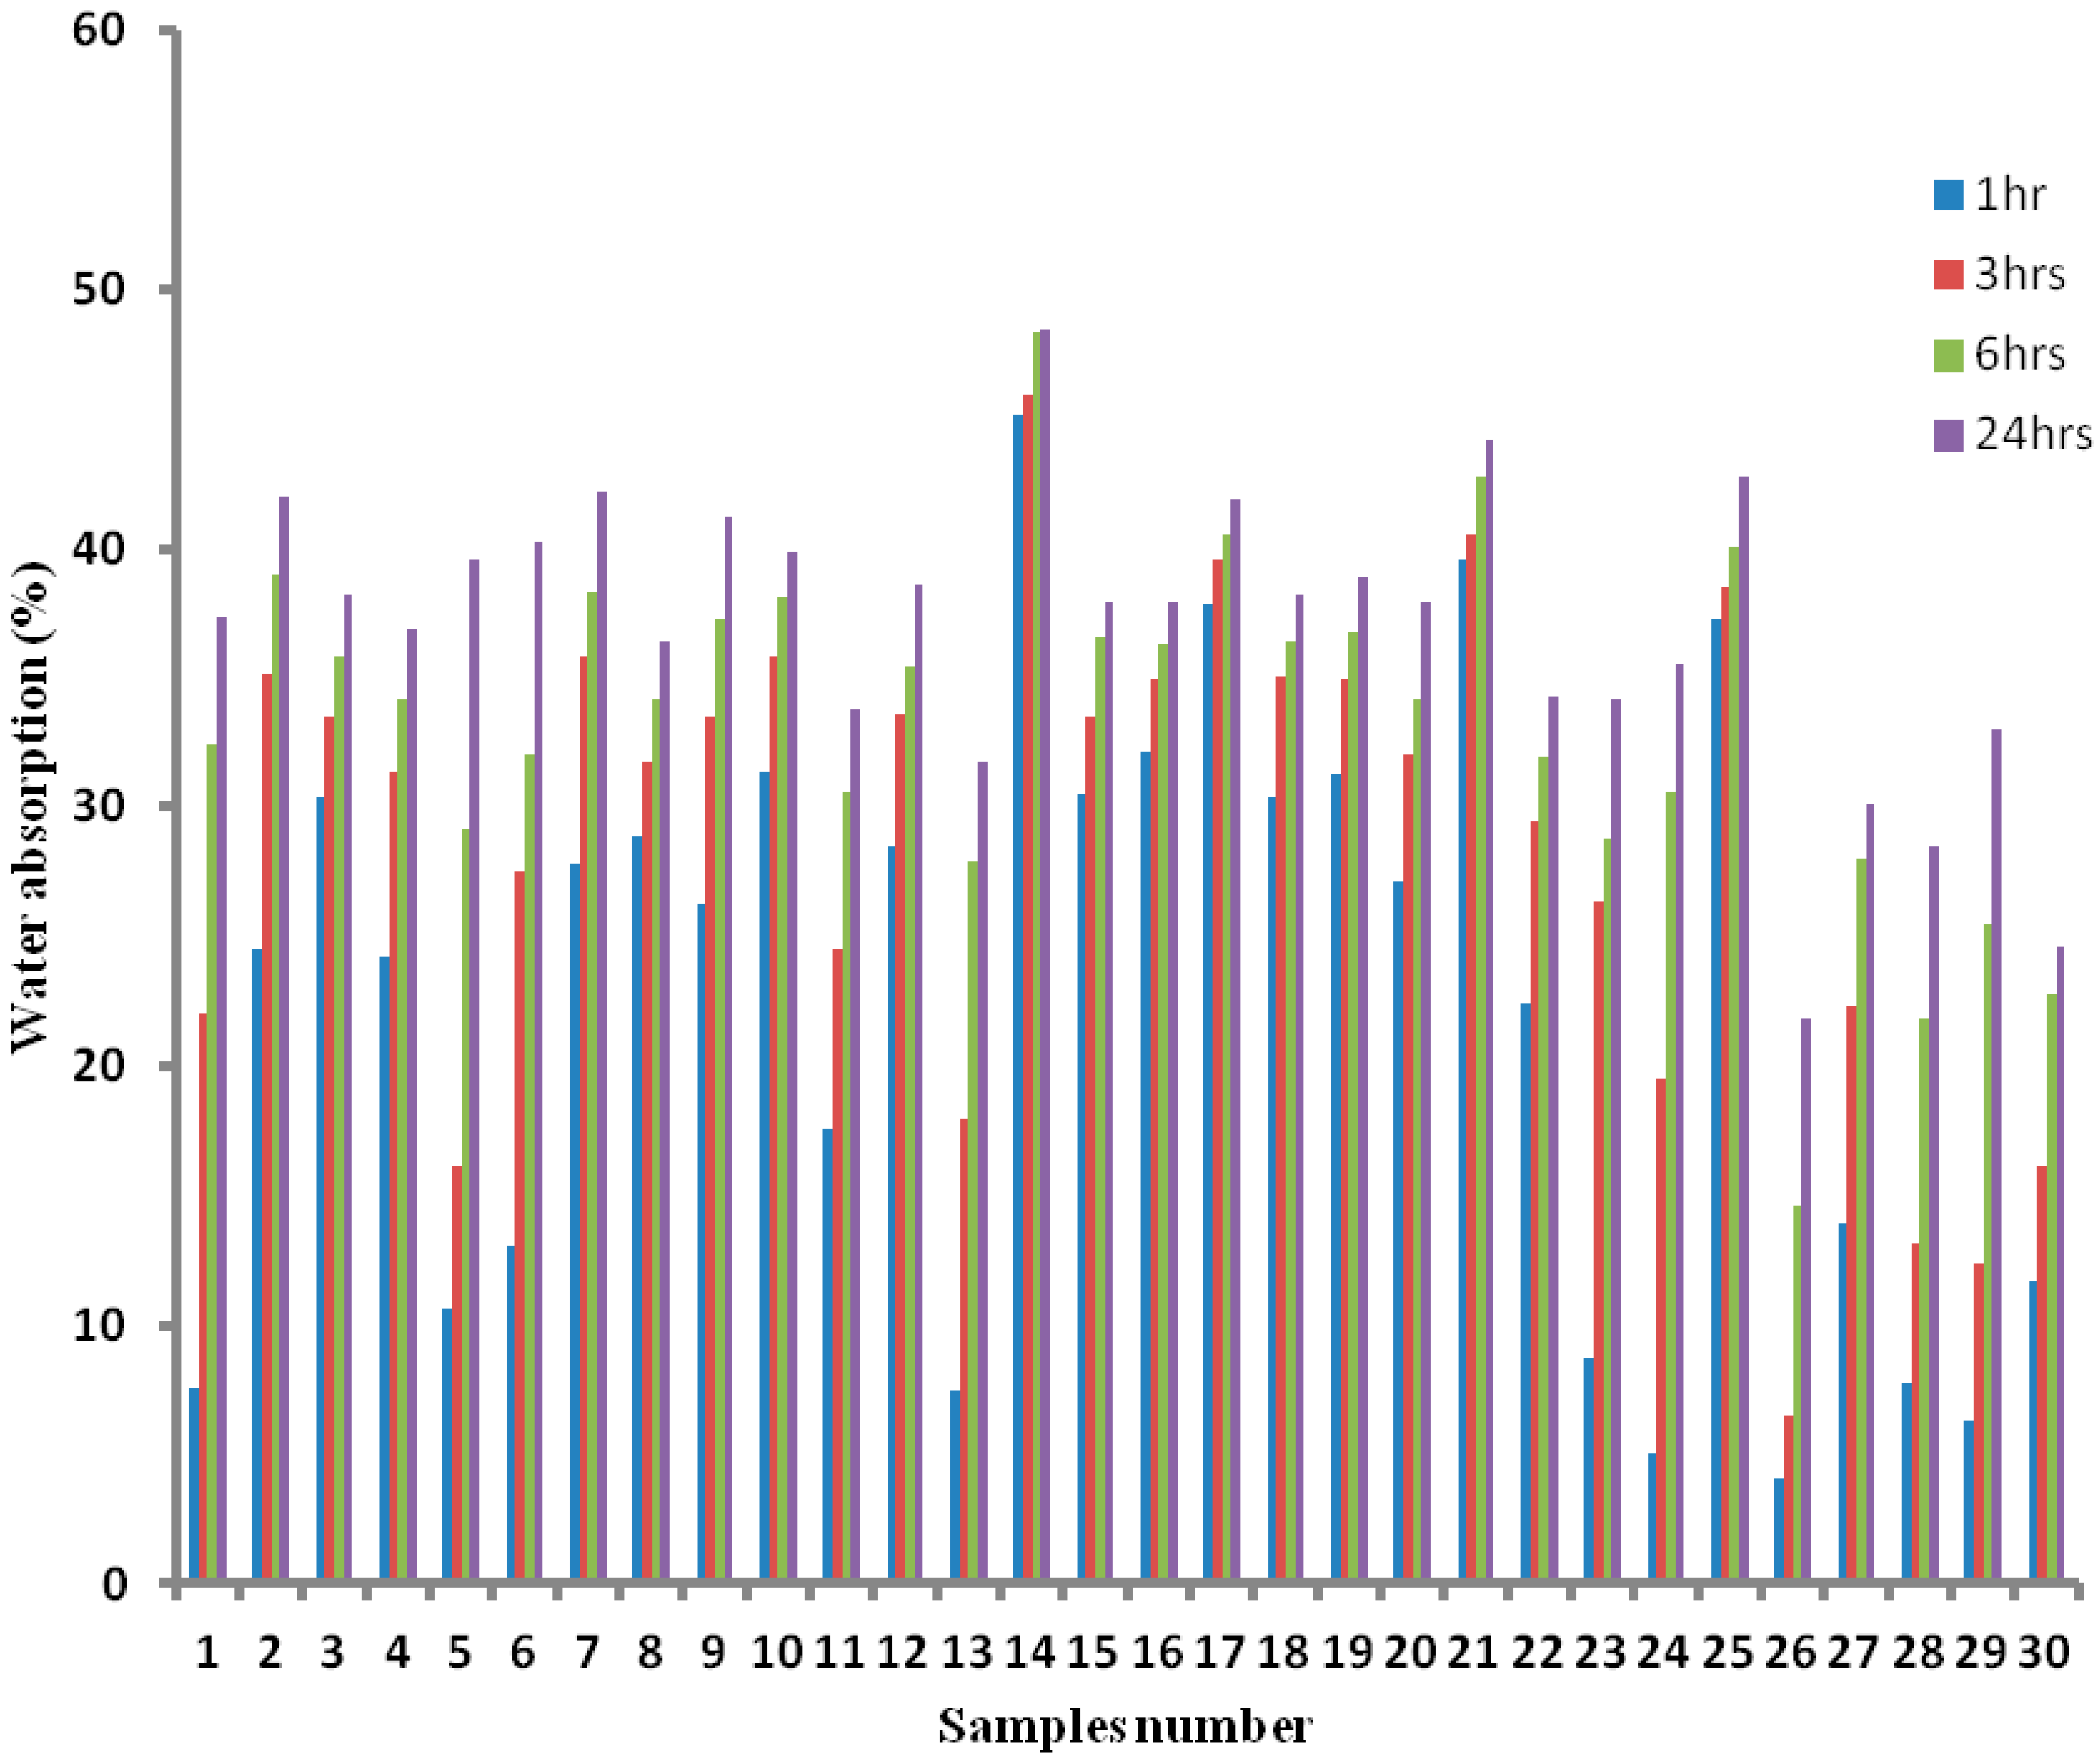
3.3. Water Absorption

The effect of soaking time on water absorption of the prepared samples has been investigated. The results showed that water absorption of the specimens increases from 1 to 24 h of being soaked (Figure 2). The reported results are the average of three samples.
Meanwhile, the relation between porosity, water absorption, and compressive strength showed that increment in porosity increases water absorption, while the residual compressive strength of the specimens is inversely proportional to both water absorption and porosity (Table 4).
Taking into account the necessity of having high water absorption and compressive strength in the prepared geopolymers for evaporative cooling application, the DOE software selected sample 16, which reported a ~38% of water absorption and ~5 MPa compressive strength.
Despite the fact that porous material such as porous ceramic and geopolymer was previously fabricated as evaporative cooling materials by [33,34,35], this research developed a greener geopolymer by utilizing a significant amount of industrial and agricultural waste as secondary raw materials, resulting in excellent waste management and sustainable production (Table 5).
The development of geopolymer materials is in accordance with the requirements of sustainable development; it not only require lower processing temperatures, but can also utilize significant amounts of industrial and agricultural waste materials as a secondary raw material, and convert them to a new product. The creation of a new material from different industrial and agricultural waste and by-products might result in reduced energy consumption, reduction of waste production, reduction of global CO2 emissions, as well as the reduction of exploitation of natural resources. Geopolymers can be customized to a wide variety of properties and characteristics, depending on its constituents or processing methods. Some of these properties include compressive strength, shrinkage, setting, acid resistance, fire resistance, and thermal conductivity. However, these properties are not inherent in all of the geopolymetric formulations. In this case, inorganic polymers should be regarded as the solution to problems associated with the material selection, but as a solution that can be tailored by a correct mix and processing design that will optimize properties and/or deduct the costs for a given application.

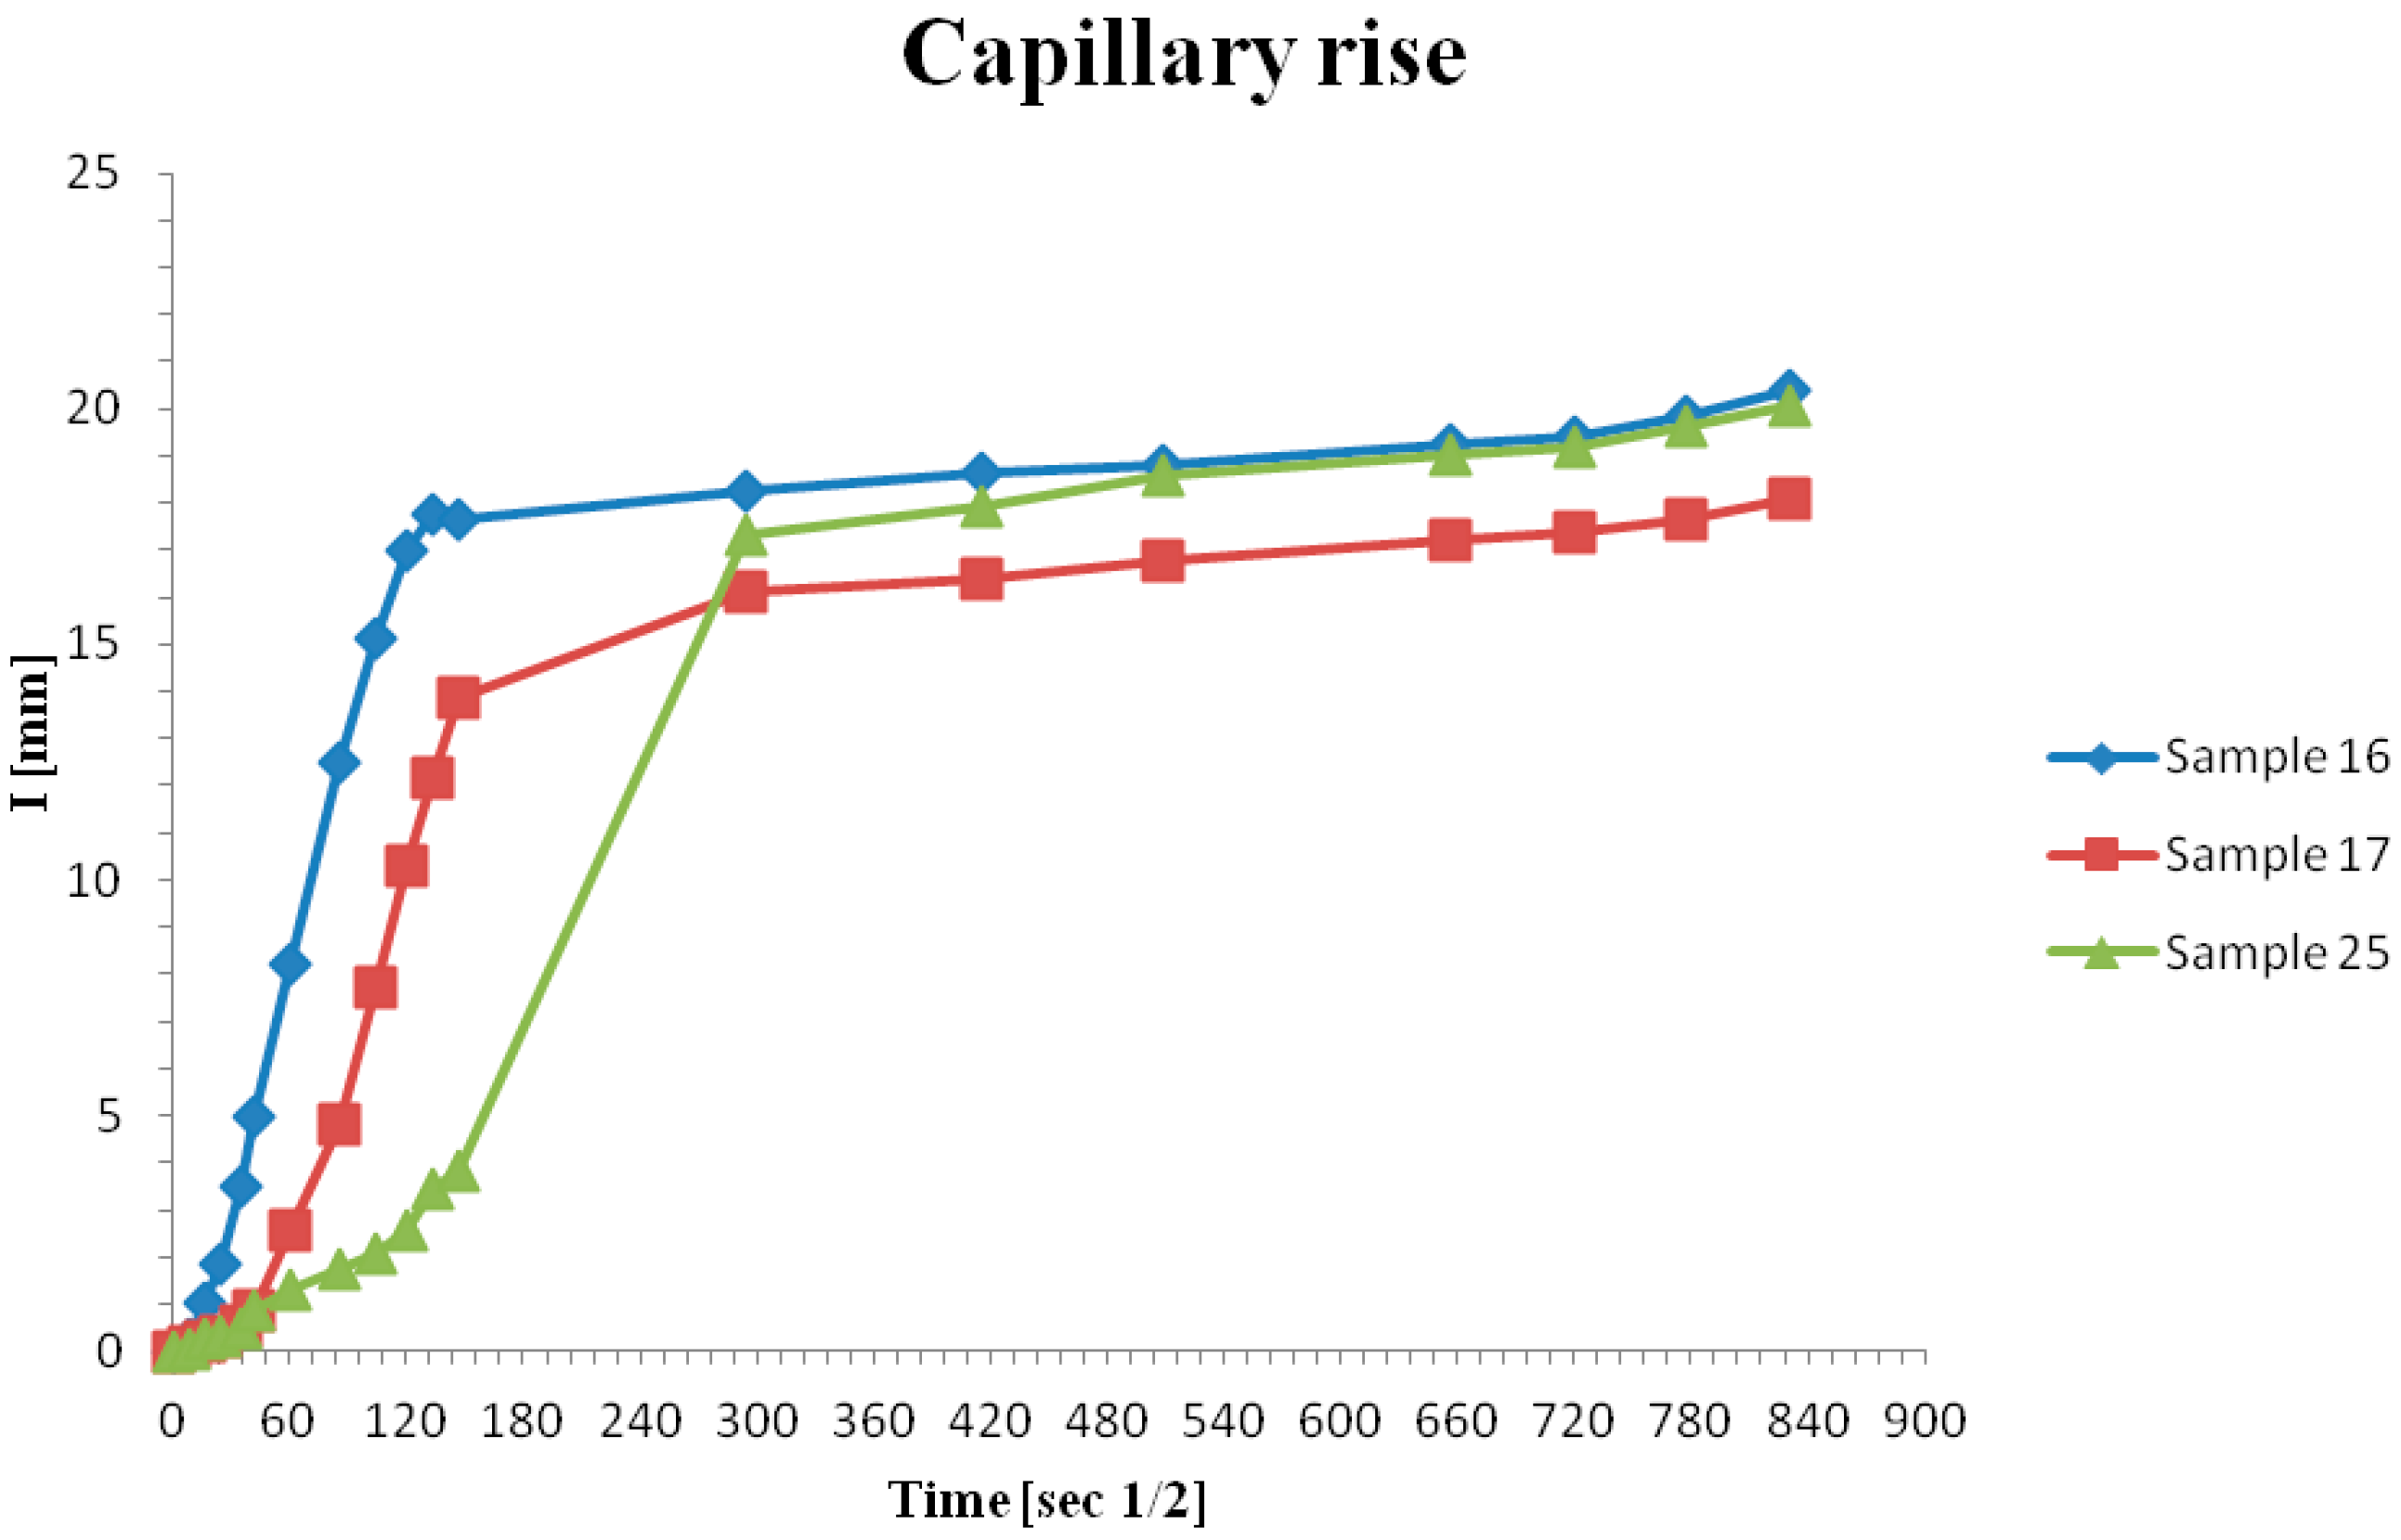
3.4. Capillary Rise Properties

The capillary rise results of the geopolymer paste samples are shown in Figure 3. Equation (1) has been employed.
I = mt/(ad)
where I = the absorption, mt = the change in specimen mass in grams at the time t, a = the exposed area of the specimen, in mm2, and d = the density of the water in g/mm3.
As seen in Figure 3, the capillary rise increases in tandem with time. Despite the tremendous increase taking place from the initial immersion time up till 300 s, there is only a slight increase recorded in that span of time. However, our results are not the highest [36,42] but are promising, due to its high water absorption and reasonable mechanical properties.

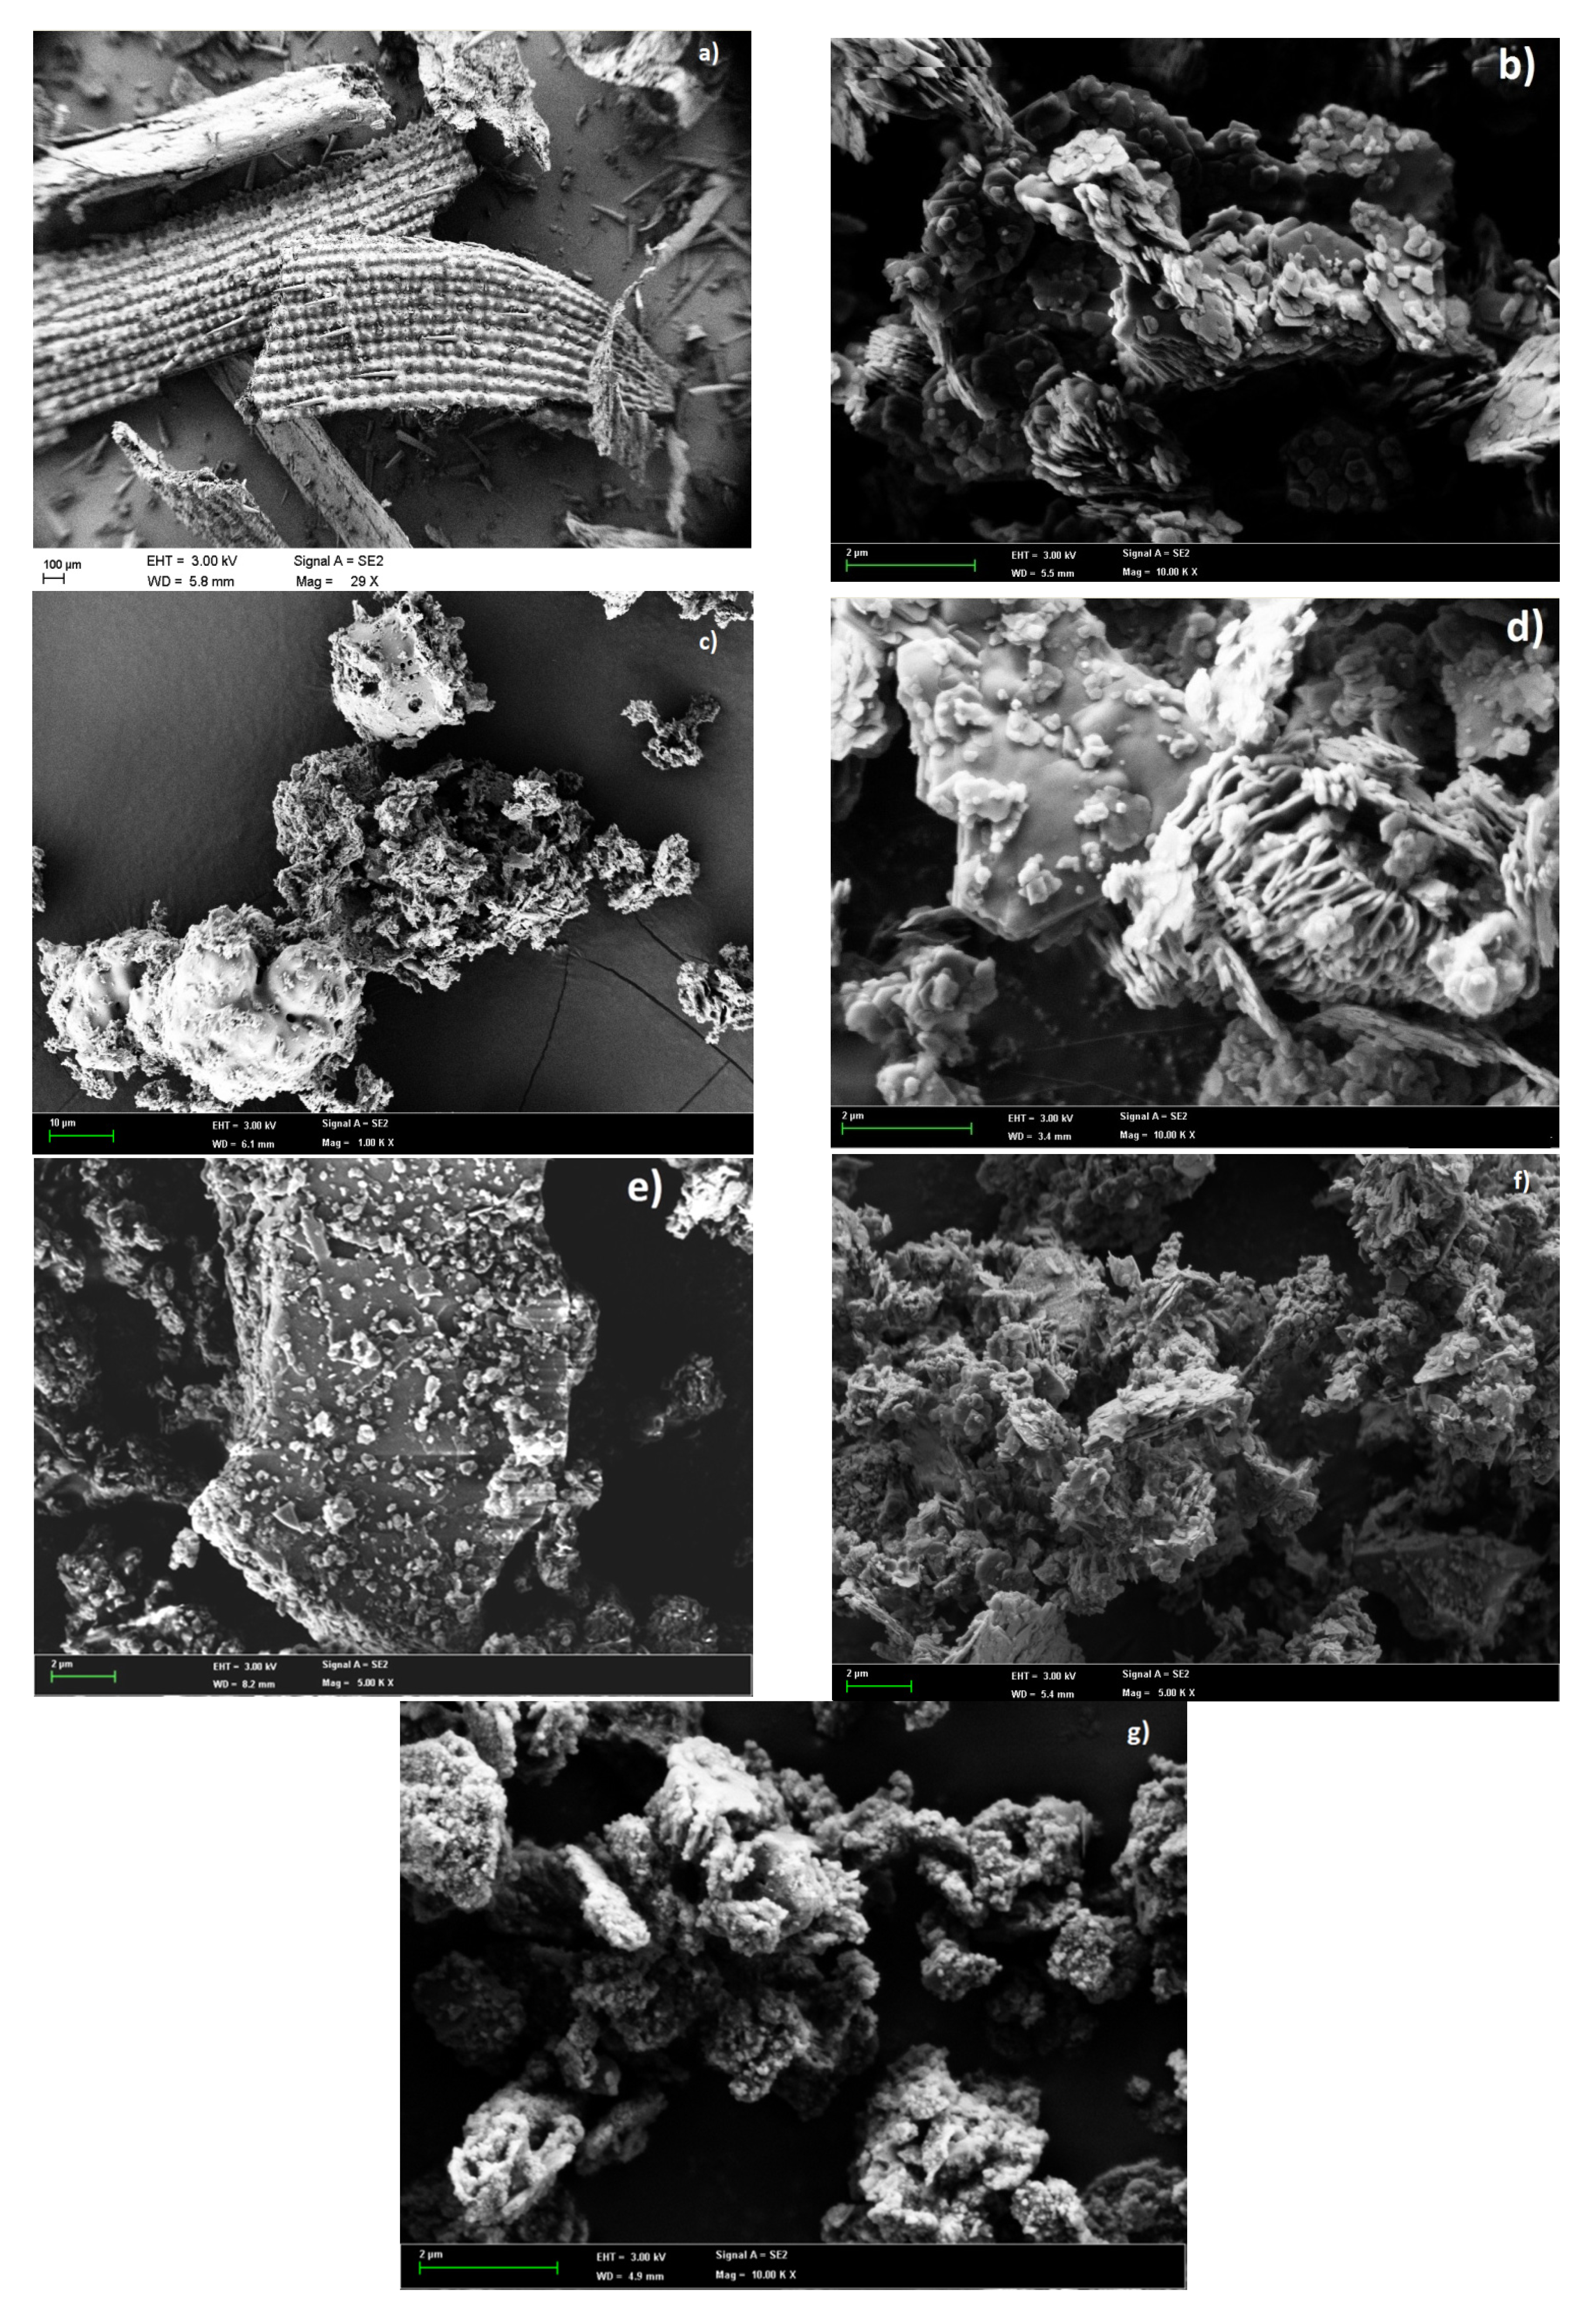
3.5. Microstructure and Morphology of Materials

The morphological features of the particles of the materials were examined using the SEM Carl Zeiss-Merlin compact (A Carl Zeiss SMT AG, Oberkochen, Germany) (Figure 4). Differences in microstructures could be seen in the raw and product material. As seen in the images, the outer epidermis of rice husk is organized in structures that resemble rolling hills (Figure 4a), while RHA was in the form of crushed shaped particles and cellular grains (Figure 4d). However, metakaolin exhibited layered structure, while POFA exhibited irregular-shaped particles that are porous. The slag particles are squared diamonds. The SEM images of sample 16 before and after casting (dry mix before and after activation) shows that the geopolymer became more uniform after casting.

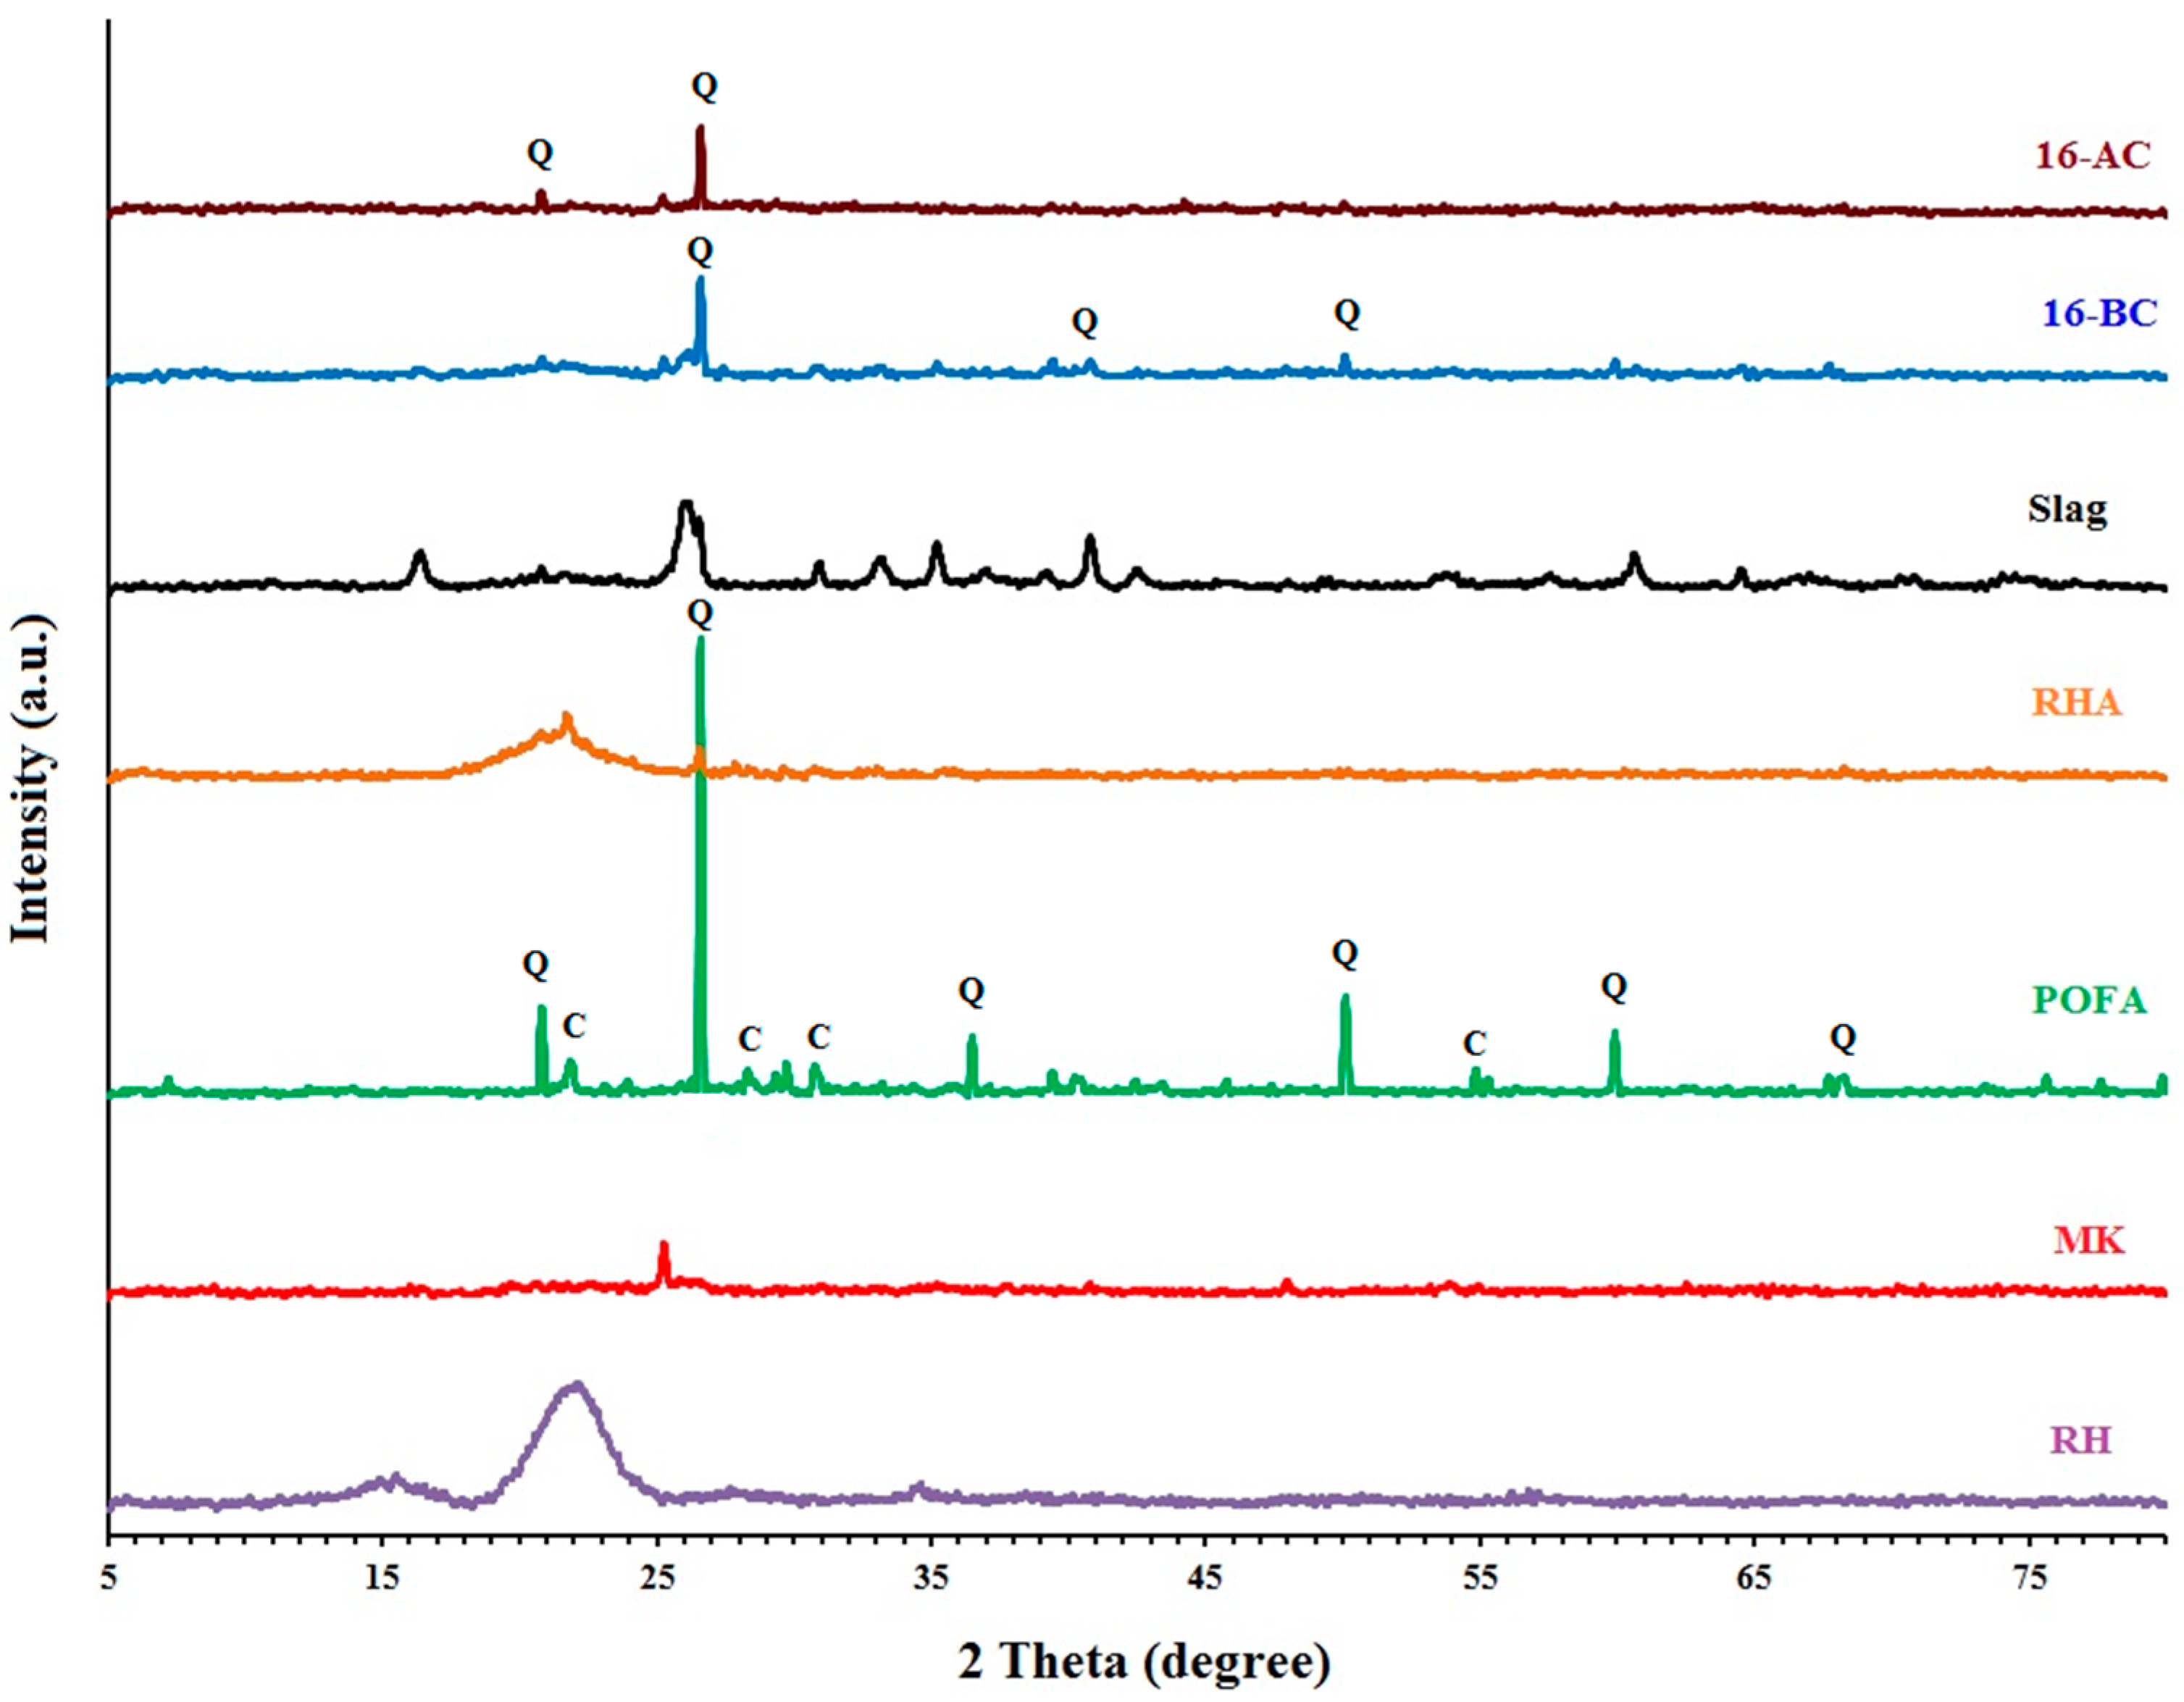
3.6. X-ray Diffraction (XRD)

Inorganic polymers, including geopolymers, are often described as X-ray amorphous [2], since the main characteristic of their XRD spectra is a featureless bump centered at ~2θ of 20–30° (Figure 5).
Rice husk, which contains cellulose, hemicellulose, and lignin, only exhibits the crystalline structure of cellulose. The peaks ~16°, 22°, and 35° are attributed to cellulose [43,44], which exhibits the crystalline structure due to hydrogen bonding interactions and Van der Waals forces between adjacent molecules [45,46]. The RHA shows a broad peak ~22° (2θ) for amorphous silica and cellulose [44,47,48]. The major crystalline phase in slag corresponds to CaCO3 [49].
The POFA peaks are related to SiO2 (Q—Quartz; C—Cristobalite) [50]. The XRD pattern of the metakaolin used in this study shows a product of low crystallinity due to the presence of an amount of quartz (SiO2), which is identified by a peak at ~25° (2θ) [51,52]. The XRD pattern for sample 16 before and after casting belongs to the crystalline SiO2 phase, which proves that traces of quartz are already present in MK precursor in MK-based geopolymers [53,54]. The reason for the small shift from 26.84° (2θ) to 26.62° (2θ) could be due to the reaction of SiO2 during the casting and forming of another silica phase (Folder S1).

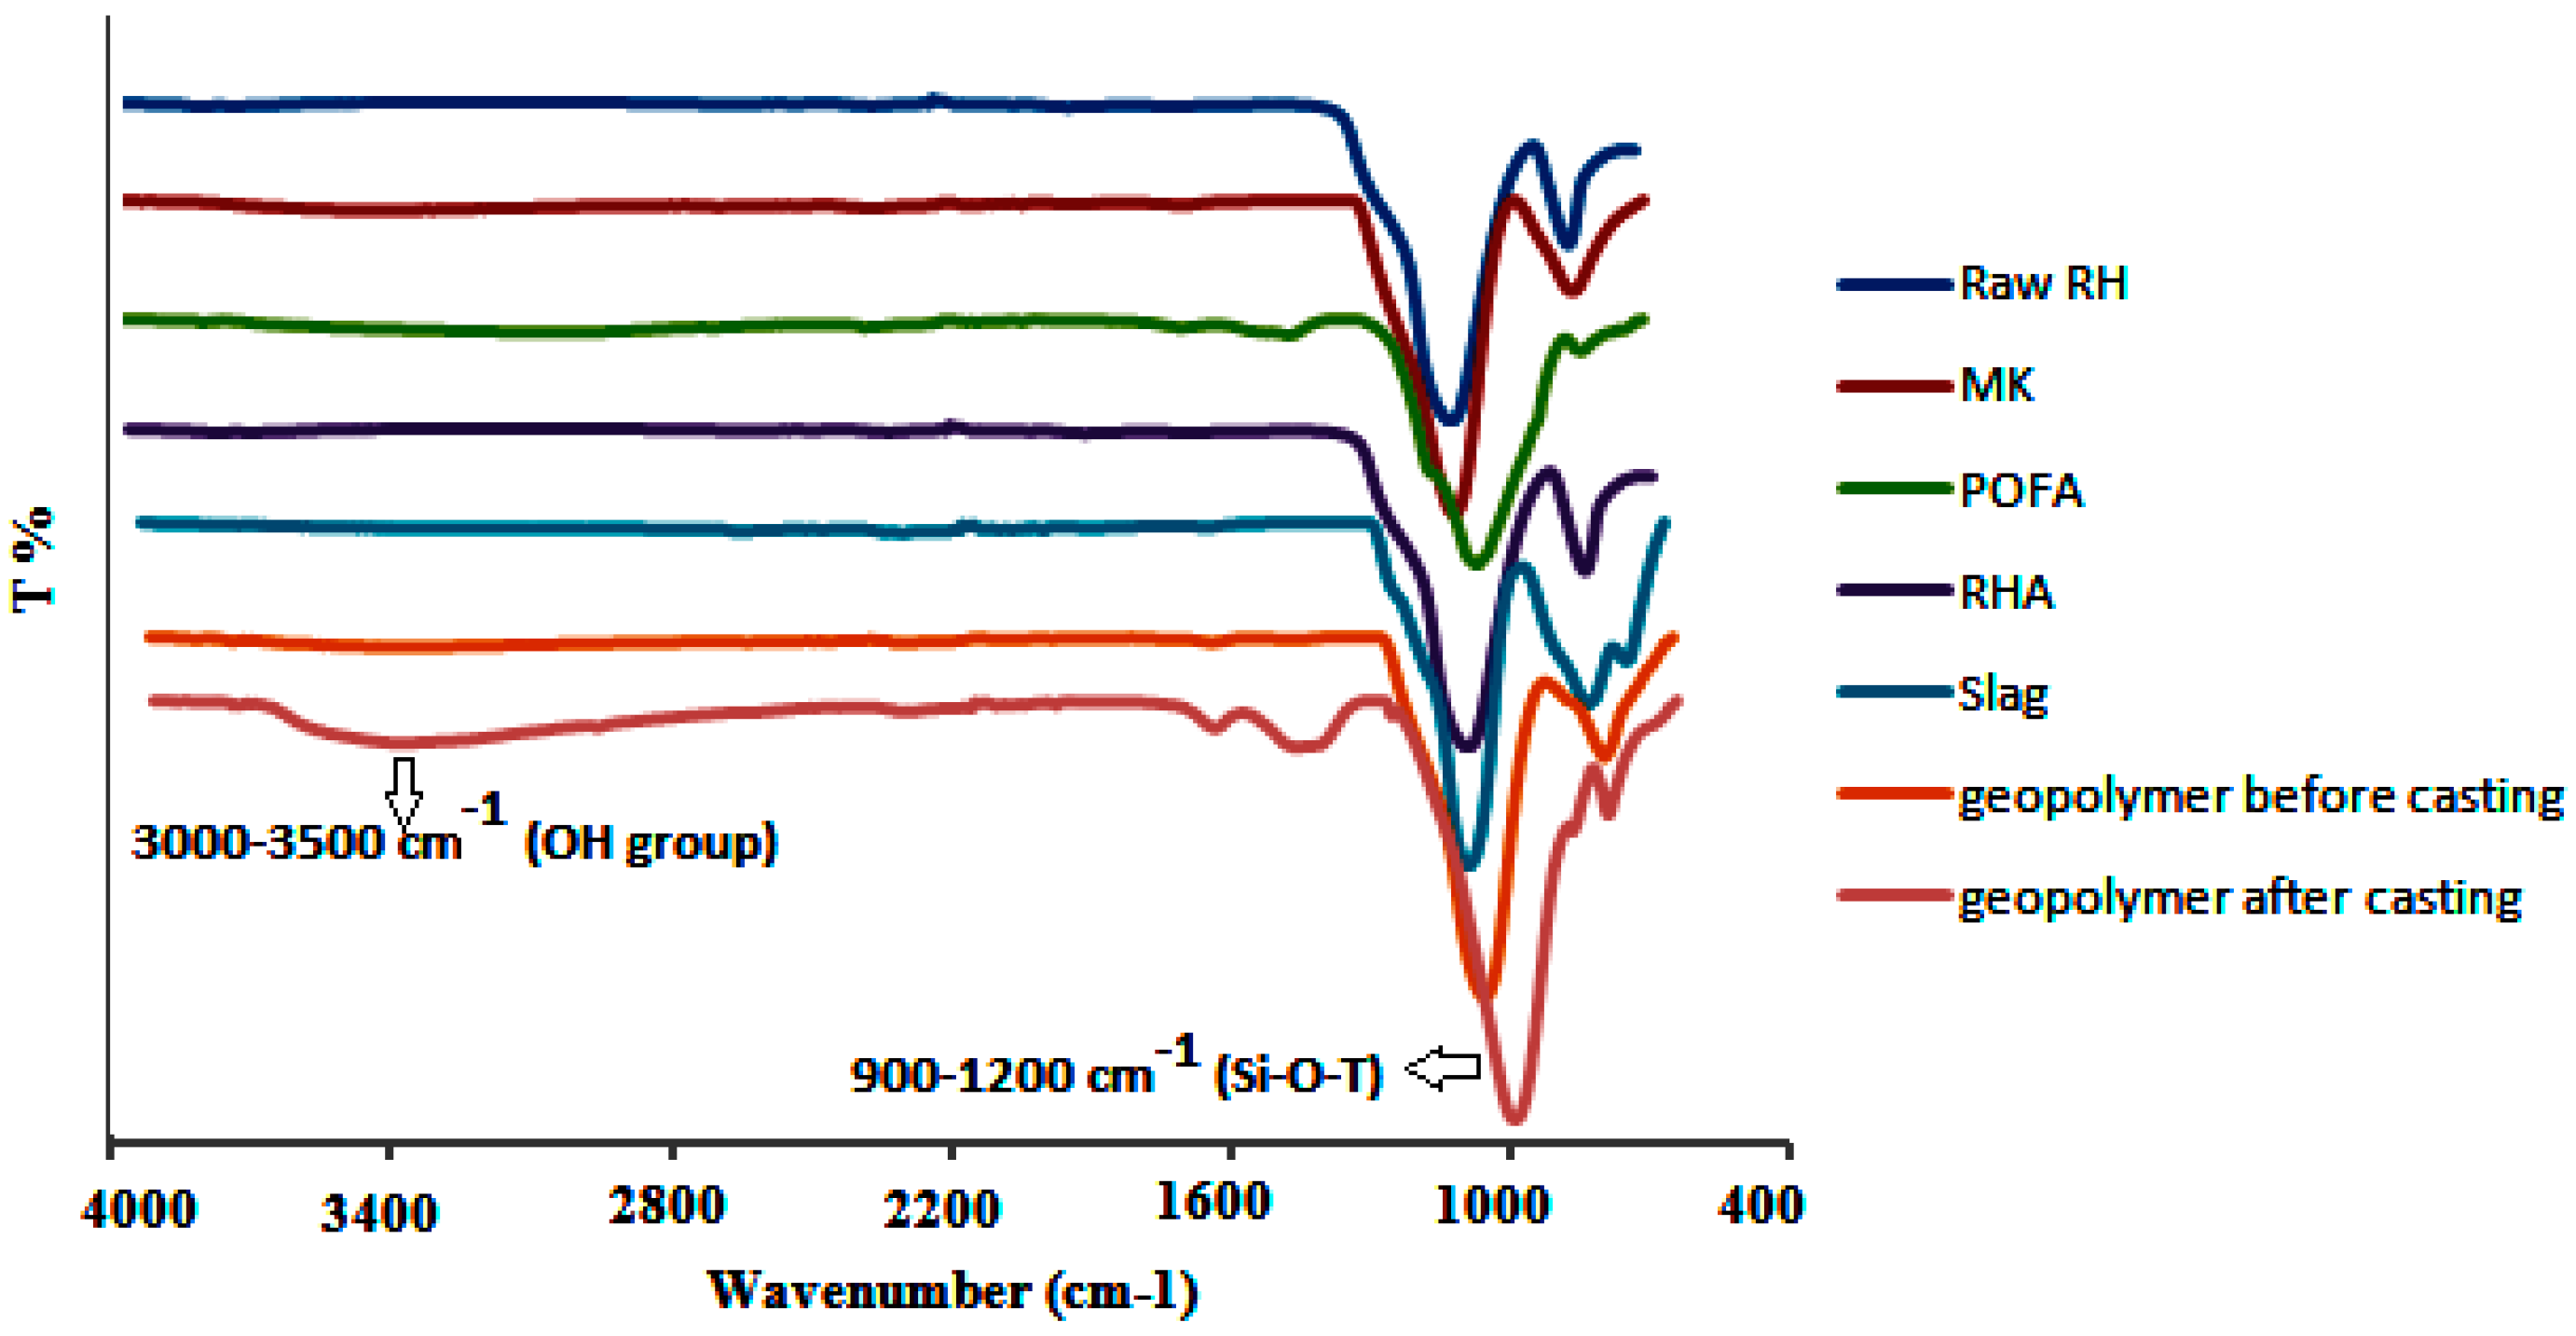
3.7. Fourier Transform Infrared Spectroscopy (FTIR)

Figure 6 shows the IR spectra of the raw materials and geopolymer sample 16 before and after casting. According to Davidovits [55], networks of silico-aluminate-based geopolymers consist of SiO4 and AlO4 tetrahedral linked alternately via oxygen sharing. The main band of geopolymer falls within the region of 900–1200 cm−1, corresponding to the Si-O-T (where T is Al or Si) linkages. The absorptions at 996 and 797 cm−1 are assigned to Al (IV)-OH (6 fold coordinated) and Al (IV)-O (6-fold coordinated), respectively. As seen in Figure 6, the IR peaks of geopolymer before casting appeared in 1052 cm−1 instead of 996 cm−1. This means that the asymmetric bending of the bonds O-Si-O and O-Al-O are within lower frequencies, which is in agreement with Alonso et al. [56]. The broad bands at 3000–3500 cm−1 and 1650–1655 cm−1, which can be clearly seen in the geopolymer sample after casting, are attributed to the stretching and deforming vibrations of OH and H-O-H groups of water molecules. Bands at ~1400 cm−1 are assigned to the Si-O-Si stretching, while the bands around 1000–1070 cm−1 and 750–790 cm−1 in the raw materials are attributed to O-Si-O stretching vibrations.

3.8. Texture Properties

Table 6 shows the textural properties of raw materials and geopolymer sample 16 before and after casting (the dry mix before and after activation). The pore size distribution was calculated from the adsorption–desorption of the isotherms using the Barret–Joyner–Halenda (BJH) model [57]. The decrease in the surface area of the geopolymer after casting could be due to the completion of geopolymerization reaction and particle growth after casting.

4. Conclusions

This study investigated the use of certain agricultural, and industrial wastes byproduct to prepare environmentally friendly geopolymers for evaporative cooling system applications. The results showed that the concentration of alkali activator influenced the compressive strength of geopolymeric specimens. The ratio of sodium silicate solution-to-sodium hydroxide solution ratio in terms of mass was directly proportional to the compressive strength of the geopolymer paste. This correlation was also evident for the compressive strength, water absorption, and apparent porosity of the geopolymer paste specimens; with specimens exhibiting lower water absorption and porosity resulting in higher residual compressive strength. The percentage of water absorption and pore volume of the specimens increased via the usage of RH, MK, and RHA. In this study, a green geopolymer employing a sustainable approach was prepared with excellent comprehensive strength, water absorption, and capillary rise using different industrial and agriculture waste and byproducts. To the best of our knowledge, there is no work that utilizes Rice husk (RH), rice husk ash (RHA), metakaolin (MK), ground granulated blast furnace slag (GGBS) and palm oil fuel ash (POFA) in geopolymer binder for evaporative cooling applications. However, the compressive strength of prepared geopolymers is not as high when compared to the other geopolymers; it is within the accepted range for use as evaporative cooling materials.

Supplementary Materials

The following are available online at https://www.mdpi.com/2076-3417/7/5/514/s1, Figure S1: ANOVA, Figure S2: Desirability of DOE, Figure S3: Fit summary of DOE, Folder S1: XRD references.

Acknowledgments

The authors would like to thank the DIP-2015-028 and DLP-2013-015 Research Funds for providing financial support for this study.

Author Contributions

Nilofar Asim: conception and design of study; Zeynab Emdadi: acquisition and analysis of data; Mohamad Hassan Amin, Mohd Ambar Yarmo, Ali Maleki, Mojtaba Azizi and Kamaruzzaman Sopian: interpretation of data, revising the manuscript and contributed analysis tools.

Conflicts of Interest

The authors declare no conflict of interest.

References

  1. Zeynab, E.; Asim, N.; Ambar Yarmo, M.; Shamsudin, R.; Mohammad, M.; Sopian, K. Green material prospects for passive evaporative cooling systems: Geopolymers. Energies 2016, 9, 586. [Google Scholar]
  2. Duxson, P.; Fernández-Jiménez, A.; Provis, J.L.; Lukey, G.C.; Palomo, A.; Van Deventer, J.S.J. Geopolymer technology: The current state of the art. J. Mater. Sci. 2007, 42, 2917–2933. [Google Scholar] [CrossRef]
  3. Provis, J.L.; Lukey, G.C.; Van Deventer, J.S.J. Do geopolymers actually contain nanocrystalline zeolites? A reexamination of existing results. Chem. Mater. 2005, 17, 3075–3085. [Google Scholar] [CrossRef]
  4. Verdolotti, L.; Iannace, S.; Lavorgna, M.; Lamanna, R. Geopolymerization reaction to consolidate incoherent pozzolanic soil. J. Mater. Sci. 2008, 43, 865–873. [Google Scholar] [CrossRef]
  5. Duxson, P.; Provis, J.L.; Lukey, G.C.; Van Deventer, J.S. The role of inorganic polymer technology in the development of ‘green concrete’. Cem. Concr. Res. 2007, 37, 1590–1597. [Google Scholar] [CrossRef]
  6. Liberty, J.T.; Ugwuishiwu, B.O.; Pukuma, S.A.; Odo, C.E. Principles and application of evaporative cooling systems for fruits and vegetables preservation. Int. J. Curr. Eng. Technol. 2013, 3, 1000–1006. [Google Scholar]
  7. Memon, F.A.; Nuruddin, M.F.; Demie, S.; Shafiq, N. Effect of curing conditions on strength of fly ash-based self-compacting geopolymer concrete. World Acad. Sci. Eng. Technol. 2011, 80, 860–863. [Google Scholar]
  8. Wallah, S.; Rangan, B.V. Low-Calcium Fly Ash-Based Geopolymer Concrete: Long-Term Properties; Research Report-GC2; Curtin University: Bentley, Australia, 2006; pp. 76–80. [Google Scholar]
  9. Nazari, A.; Bagheri, A.; Riahi, S. Properties of geopolymer with seeded fly ash and rice husk bark ash. Mater. Sci. Eng. A 2011, 528, 7395–7401. [Google Scholar] [CrossRef]
  10. Mishra, A.; Choudhary, D.; Jain, N.; Kumar, M.; Sharda, N.; Dutt, D. Effect of concentration of alkaline liquid and curing time on strength and water absorption of geopolymer concrete. ARPN J. Eng. Appl. Sci. 2008, 3, 14–18. [Google Scholar]
  11. Yusuf, M.O.; Johari, M.A.M.; Ahmad, Z.A.; Maslehuddin, M. Shrinkage and strength of alkaline activated ground steel slag/ultrafine palm oil fuel ash pastes and mortars. Mater. Des. 2014, 63, 710–718. [Google Scholar] [CrossRef]
  12. Guo, X.; Shi, H.; Dick, W.A. Compressive strength and microstructural characteristics of class C fly ash geopolymer. Cem. Concr. Compos. 2010, 32, 142–147. [Google Scholar] [CrossRef]
  13. Zain, M.; Islam, M.N.; Mahmud, F.; Jamil, M. Production of rice husk ash for use in concrete as a supplementary cementitious material. Constr. Build. Mater. 2011, 25, 798–805. [Google Scholar] [CrossRef]
  14. ASTM, C. Standard Test Methods for Chemical Analysis of Hydraulic Cement; American Society for Testing of Materials: Philadelphia, PA, USA, 2004. [Google Scholar]
  15. Khuri, A.I.; Mukhopadhyay, S. Response surface methodology. Wiley Interdiscip. Rev. Comput. Stat. 2010, 2, 128–149. [Google Scholar] [CrossRef]
  16. Xu, H.; Van Deventer, J.S. Microstructural characterisation of geopolymers synthesised from kaolinite/stilbite mixtures using XRD, MAS-NMR, SEM/EDX, TEM/EDX, and HREM. Cem. Concr. Res. 2002, 32, 1705–1716. [Google Scholar] [CrossRef]
  17. Yusuf, M.O.; Johari, M.A.M.; Ahmad, Z.A.; Maslehuddin, M. Evolution of alkaline activated ground blast furnace slag–ultrafine palm oil fuel ash based concrete. Mater. Des. 2014, 55, 387–393. [Google Scholar] [CrossRef]
  18. Emdadi, Z.; Asim, N.; Yarmo, M.A.; Shamsudin, R. The effect of mix composition on the water absorption, density and compressive strength of rice husk based geopolymers. In Proceedings of the 2015 5th International Conference on Environment Science and Engineering, Istanbul, Turkey, 24–25 April 2015; Volume 83. [Google Scholar]
  19. Pacheco-Torgal, F.; Castro-Gomes, J.; Jalali, S. Investigations about the effect of aggregates on strength and microstructure of geopolymeric mine waste mud binders. Cem. Concr. Res. 2007, 37, 933–941. [Google Scholar] [CrossRef]
  20. Pacheco-Torgal, F.; Castro-Gomes, J.; Jalali, S. Studies about mix composition of alkali-activated mortars using waste mud from Panasqueira. In Proceedings of the Engineering Conference, University of Beira Interior, Covilha, Portugal, 11–13 September 2005. [Google Scholar]
  21. Temuujin, J.; Williams, R.; van Riessen, A. Effect of mechanical activation of fly ash on the properties of geopolymer cured at ambient temperature. J. Mater. Process. Technol. 2009, 209, 5276–5280. [Google Scholar] [CrossRef]
  22. Khale, D.; Chaudhary, R. Mechanism of geopolymerization and factors influencing its development: A review. J. Mater. Sci. 2007, 42, 729–746. [Google Scholar] [CrossRef]
  23. Wang, K.; Shah, S.; Mishulovich, A. Effects of curing temperature and NaOH addition on hydration and strength development of clinker-free CKD-fly ash binders. Cem. Concr. Res. 2004, 34, 299–309. [Google Scholar] [CrossRef]
  24. Poon, C.-S.; Azhar, S.; Anson, M.; Wong, Y.L. Performance of metakaolin concrete at elevated temperatures. Cem. Concr. Compos. 2003, 25, 83–89. [Google Scholar] [CrossRef]
  25. Lee, W.; Van Deventer, J. The effects of inorganic salt contamination on the strength and durability of geopolymers. Colloids Surf. A 2002, 211, 115–126. [Google Scholar] [CrossRef]
  26. Cheng, T.; Chiu, J. Fire-resistant geopolymer produced by granulated blast furnace slag. Miner. Eng. 2003, 16, 205–210. [Google Scholar] [CrossRef]
  27. Martinez-Ramirez, S.; Palomo, A. Microstructure studies on Portland cement pastes obtained in highly alkaline environments. Cem. Concr. Res. 2001, 31, 1581–1585. [Google Scholar] [CrossRef]
  28. Álvarez-Ayuso, E.; Querol, X.; Plana, F.; Alastuey, A.; Moreno, N.; Izquierdo, M.; Font, O.; Moreno, T.; Diez, S.; Vázquez, E.; et al. Environmental, physical and structural characterisation of geopolymer matrixes synthesised from coal (co-) combustion fly ashes. J. Hazard. Mater. 2008, 154, 175–183. [Google Scholar] [CrossRef] [PubMed]
  29. Sata, V.; Jaturapitakkul, C.; Rattanashotinunt, C. Compressive strength and heat evolution of concretes containing palm oil fuel ash. J. Mater. Civ. Eng. 2010, 22, 1033–1038. [Google Scholar] [CrossRef]
  30. Van Jaarsveld, J.G.S.; Van Deventer, J.S.J.; Lukey, G.C. The characterisation of source materials in fly ash-based geopolymers. Mater. Lett. 2003, 57, 1272–1280. [Google Scholar] [CrossRef]
  31. Komnitsas, K.; Zaharaki, D. Geopolymerisation: A review and prospects for the minerals industry. Miner. Eng. 2007, 20, 1261–1277. [Google Scholar] [CrossRef]
  32. Rangan, B.V. Fly Ash-Based Geopolymer Concrete; Curtin University of Technology: Bentley, Australia, 2008. [Google Scholar]
  33. Isobe, T.; Kameshima, Y.; Nakajima, A.; Okada, K.; Hotta, Y. Extrusion method using nylon 66 fibers for the preparation of porous alumina ceramics with oriented pores. J. Eur. Ceram. Soc. 2006, 26, 2213–2217. [Google Scholar] [CrossRef]
  34. Isobe, T.; Kameshima, Y.; Nakajima, A.; Okada, K. Preparation and properties of porous alumina ceramics with uni-directionally oriented pores by extrusion method using a plastic substance as a pore former. J. Eur. Ceram. Soc. 2007, 27, 61–66. [Google Scholar] [CrossRef]
  35. Isobe, T.; Kameshima, Y.; Nakajima, A.; Okada, K.; Hotta, Y. Gas permeability and mechanical properties of porous alumina ceramics with unidirectionally aligned pores. J. Eur. Ceram. Soc. 2007, 27, 53–59. [Google Scholar] [CrossRef]
  36. Okada, K.; Imase, A.; Isobe, T.; Nakajima, A. Capillary rise properties of porous geopolymers prepared by an extrusion method using polylactic acid (PLA) fibers as the pore formers. J. Eur. Ceram. Soc. 2011, 31, 461–467. [Google Scholar] [CrossRef]
  37. Okada, K.; Ooyama, A.; Isobe, T.; Kameshima, Y.; Nakajima, A.; MacKenzie, K.J. Water retention properties of porous geopolymers for use in cooling applications. J. Eur. Ceram. Soc. 2009, 29, 1917–1923. [Google Scholar] [CrossRef]
  38. Onutai, S.; Jiemsirilers, S.; Thavorniti, P.; Kobayashi, T. Fast microwave syntheses of fly ash based porous geopolymers in the presence of high alkali concentration. Ceram. Int. 2016, 42, 9866–9874. [Google Scholar] [CrossRef]
  39. Novais, R.M.; Buruberri, L.H.; Ascensão, G.; Seabra, M.P.; Labrincha, J.A. Porous biomass fly ash-based geopolymers with tailored thermal conductivity. J. Clean. Prod. 2016, 119, 99–107. [Google Scholar] [CrossRef]
  40. Ducman, V.; Korat, L. Characterization of geopolymer fly-ash based foams obtained with the addition of Al powder or H2O2 as foaming agents. Mater. Charact. 2016, 113, 207–213. [Google Scholar] [CrossRef]
  41. He, P.; Jia, D.; Lin, T.; Wang, M.; Zhou, Y. Effects of high-temperature heat treatment on the mechanical properties of unidirectional carbon fiber reinforced geopolymer composites. Ceram. Int. 2010, 36, 1447–1453. [Google Scholar] [CrossRef]
  42. Okada, K.; Uchiyama, S.; Isobe, T.; Kameshima, Y.; Nakajima, A.; Kurata, T. Capillary rise properties of porous mullite ceramics prepared by an extrusion method using organic fibers as the pore former. J. Eur. Ceram. Soc. 2009, 29, 2491–2497. [Google Scholar] [CrossRef]
  43. Klemm, D.; Heublein, B.; Fink, H.P.; Bohn, A. Cellulose: Fascinating biopolymer and sustainable raw material. Angew. Chem. Int. Ed. 2005, 44, 3358–3393. [Google Scholar] [CrossRef] [PubMed]
  44. Park, S.; Baker, J.O.; Himmel, M.E.; Parilla, P.A.; Johnson, D.K. Cellulose crystallinity index: Measurement techniques and their impact on interpreting cellulase performance. Biotechnol. Biofuels 2010, 3, 10. [Google Scholar] [CrossRef] [PubMed]
  45. Johar, N.; Ahmad, I.; Dufresne, A. Extraction, preparation and characterization of cellulose fibres and nanocrystals from rice husk. Ind. Crops Prod. 2012, 37, 93–99. [Google Scholar] [CrossRef]
  46. Zhang, Y.H.; Lynd, L.R. Toward an aggregated understanding of enzymatic hydrolysis of cellulose: Noncomplexed cellulase systems. Biotechnol. Bioeng. 2004, 88, 797–824. [Google Scholar] [CrossRef] [PubMed]
  47. Della, V.P.; Kühn, I.; Hotza, D. Rice husk ash as an alternate source for active silica production. Mater. Lett. 2002, 57, 818–821. [Google Scholar] [CrossRef]
  48. Ferreira, C.S.; Santos, P.L.; Bonacin, J.A.; Passos, R.R.; Pocrifka, L.A. Rice husk reuse in the preparation of SnO2/SiO2 nanocomposite. Mater. Res. 2015, 18, 639–643. [Google Scholar] [CrossRef]
  49. Mohamed Nacer, G.; Abdesselam, Z.; Samia, H. Investigating the local granulated blast furnace slag. Open J. Civ. Eng. 2012, 2, 17807. [Google Scholar]
  50. Nurdeen, M.; Johari, M.A.M.; Hashim, S.F.S. Strength activity index and microstructural characteristics of treated palm oil fuel ash. Int. J. Civ. Environ. Eng. 2011, 11, 5. [Google Scholar]
  51. Inoubli, A.; Kahlaoui, M.; Sobrados, I.; Chefi, S.; Madani, A.; Sanz, J.; Ben Haj Amara, A. Influence of anionic vacancies on the conductivity of La9.33Si6−xAlxO26−x/2 oxide conductors with an oxyapatite structure. J. Power Sources 2014, 271, 203–212. [Google Scholar] [CrossRef]
  52. Madani, A.; Aznar, A.; Sanz, J.; Serratosa, J.M. 29Si and 27Al NMR study of zeolite formation from alkali-leached kaolinites. Influence of thermal preactivation. J. Phys. Chem. 1990, 94, 760–765. [Google Scholar] [CrossRef]
  53. Rovnaník, P. Effect of curing temperature on the development of hard structure of metakaolin-based geopolymer. Constr. Build. Mater. 2010, 24, 1176–1183. [Google Scholar] [CrossRef]
  54. Granizo, M.L.; Blanco-Varela, M.T.; Martínez-Ramírez, S. Alkali activation of metakaolins: Parameters affecting mechanical, structural and microstructural properties. J. Mater. Sci. 2007, 42, 2934–2943. [Google Scholar] [CrossRef]
  55. Davdovits, J. Geopolymer Chemistry and Applications; Institute Geopolymere: Saint Quentin, France, 2008. [Google Scholar]
  56. Alonso, S.; Palomo, A. Calorimetric study of alkaline activation of calcium hydroxide–metakaolin solid mixtures. Cem. Concr. Res. 2001, 31, 25–30. [Google Scholar] [CrossRef]
  57. Barrett, E.P.; Joyner, L.G.; Halenda, P. The determination of pore volume and area distributions in porous substances. I. Computations from nitrogen isotherms. J. Am. Chem. Soc. 1951, 73, 373–380. [Google Scholar] [CrossRef]
Figure 1. The comparison of compressive strength for prepared samples using 10 M NaOH in 3, 7, and 28 days curing time.
Applsci 07 00514 g001
Figure 2. The trend of water absorption for different geopolymers after 1, 3, 6, and 24 h, respectively.
Applsci 07 00514 g002
Figure 3. The relationship between capillary rise and immersion time for the selected geopolymer paste specimens.
Applsci 07 00514 g003
Figure 4. SEM micrograph of (a) raw rice husk; (b) metakaolin; (c) Palm oil fuel ash (POFA); (d) rice husk ash (RHA); (e) slag; (f) sample 16 before casting; (g) sample 16 after casting.
Applsci 07 00514 g004
Figure 5. The XRD patterns of the raw materials and sample 16 before (16-BC) and after casting (16-AC), Q: quartz and C: Cristobalite.
Applsci 07 00514 g005
Figure 6. FT-IR spectra of raw materials and geopolymer sample 16 before and after casting.
Applsci 07 00514 g006
Table 1. Chemical composition of rice husk (RH), rice husk ash (RHA), metakaolin (MK), palm oil fuel ash (POFA), Slag, water glass (WG), and selected geopolymer sample before and after casting (dry mix before and after activation) using XRF (mass %).
Chemical Composition (wt %)RHRHAMKPOFASlagWGSample 16 before CastingSample 16 after Casting
SiO223.7791.0450.294829.2426.554.4651.97
Al2O30.060.3345.752.3011.71-30.9519.88
Fe2O30.131.890.382.700.34-0.861.32
CaO0.250.54-4.9542.43-0.867.58
MgO0.080.58-4.645.06-0.641.13
K2O1.082.40.1710.990.27-2.001.65
SO30.270.530.082.474.67-0.420.89
TiO2-0.021.560.150.46-0.820.67
Na2O-0.050.270.120.210.60.178.46
Others0.812.620.35.470.1462.9 (water)1.160.7
Loss on ignition (LOI)782.861.278.730.6-5.365.81
Table 2. The result of DOE software considering three factors (ratios of alkali liquid to solid; the ratio of sodium silicate to sodium hydroxide and the concentrations of sodium hydroxide) on selected sample for water absorption, density, and the compressive strength.
SampleNaOH Concentration (Molar)Sodium Silicate/NaOHLiquid/Solid% Water Absorption after 24 hDensity g/cm3Compressive Strength (MPa)
28 Days
182.50.540.91.1663.3
2101.750.446.21.1811.4
31410.5-1.2771.9
4142.50.345.41.2022.3
5810.349.91.1622.2
6810.545.91.2162.2
71410.349.01.2132.2
8142.50.540.81.1732.3
982.50.348.21.1111.4
10141.750.445.01.2162.3
1181.50.443.21.1812.4
121010.448.01.2401.4
13101.750.542.71.2932.8
14102.50.537.91.14.9
15102.50.444.31.2071.9
16101.750.346.21.1711.3
17141.50.542.51.3102.0
181410.447.01.1202.0
19142.50.442.31.1212.4
20141.50.344.111.091.7
211010.543.91.1281.7
22101.50.530.91.2781.8
23101.50.426.61.2872.2
241010.334.71.1861.4
25101.50.332.21.2861.6
26102.50.329.31.3160.8
2781.50.525.81.3802.0
28810.431.01.3681.8
2981.50.429.21.3431.9
3082.50.4-1.3872.0
Table 3. Software sequential model sum of squares for compressive strength and the lack of fit tests for flavonoid yield.
SourceSum of SquaresdfMean SquareF Valuep-Value Prob > FYield
Model8.9061.485.380.0013significant
NaOH Concentration (Molar)0.02910.0290.110.7469-
Sodium Silicate/NaOH1.2511.254.540.0439-
Liquid/Solid3.6913.6913.390.0013-
Lack of Fit6.21220.282.260.4873not significant
Table 4. The prepared samples proportions by DOE software and their water absorption, density, porosity and compressive strength.
Number% Contents% Water Absorption % Porosity Calculated by ASTM) Density g/cm3Compressive Strength (MPa)
RHRHAMKPOFASlag24 h28 Days
Sample 1102040102037.3135.31.062.3
Sample 2102535102041.9931.71.082.4
Sample 3103030102038.2129.11.0883.4
Sample 4103525102036.8329.51.1063.2
Sample 5104020102039.633.80.952.7
Sample 6101540152040.2032.30.992.2
Sample 7102035152042.2235.20.982.3
Sample 8102530152036.4028.81.113.22
Sample 9103025152041.2328.150.952.5
Sample 10103520152039.8528.631.032.9
Sample 11104015152033.7828.41.114.86
Sample 12101530153038.633.81.052.5
Sample 13102025153031.827.11.164.7
Sample 14102520153048.4037.31.222.43
Sample 15103015153037.931.11.064.5
Sample 16101535103037.932.81.14.9
Sample 17102030103041.933.31.075.7
Sample 18102525103038.229.81.074.5
Sample 19103020103038.930.91.062.8
Sample 20103515103037.928.51.14.1
Sample 2153020153044.2133.71.262.7
Sample 22102525152534.2528.31.1474.87
Sample 2353035102034.2128.91.123.32
Sample 2453530102035.5127.51.13.6
Sample 2552530103042.7128.91.265.7
Sample 2654015103021.8321.11.12.57
Sample 27103015153030.1126.51.164.99
Sample 2854025102028.526.81.022.4
Sample 2954020102533.027.11.043.2
Sample 3054015103024.6317.41.123.65
Table 5. The comparison of different investigated geopolymers for evaporative cooling applications.
MaterialsProperties & PerformanceReference
Mechanical StrengthWater AbsorptionPorosityApplication
Porous geopolymer:
Metakaolin + sodium silicate solution + polyacetic acid (PLA)
Bending strength:
36 MPa
Capillary rise: 1125 mm-Passive cooling[36]
Porous geopolymer:
Metakaolin + sodium silicate solution + NaOH
Compressive strength: 14.2 MPa (H2O/AL2O3↓) to <5 MPa (H2O/AL2O3↑)27% (H2O/AL2O3↓)–51.1% (H2O/AL2O3↑)ImprovingPassive cooling[37]
Porous geopolymer:
fly ash + sodium silicate solution + NaOH
--Improving-[38]
Porous geopolymer:
fly ash + metakaolin sodium silicate solution + NaOH + hydrogen peroxide (H2O2)
-50.44%72.5%Building[39]
Porous geopolymer:
fly ash + metakaolin sodium silicate solution + NaOH + hydrogen peroxide (H2O2) + Al powder
Compressive strength: 3.3–4.3 MPa (Al powder additional) Compressive strength: 2.9–9.3 MPa (H2O2 additional)-AL additional: 59% H2O2 additional: 48%Thermal insulation[40]
Geopolymer resin + metakaolin + carbon fiber + potassium silicate solutionFlexural strength: 234.2 ± 22.6 MPa (with heat treated 110 °C)
12.3 ± 1.2 MPa (Without fiber and heat treatment)
-Improving-[41]
Geopolymer paste:
rice husk + rice husk ash + metakaolin + palm oil fuel ash + slag + NaOH + sodium silicate solution
Compressive strength: ~5 MPa~38%~33%-Current study
Table 6. Texture properties of raw materials and sample 16.
Physical PropertiesRaw RHMKPOFARaw RH AshSlagGeopolymer Sample 16 before CastingGeopolymer Sample 16 after Casting
Surface area (m2/g)1.1112.263.4516.554.2213.225.78
Pore size (nm)16.37.06.48.810.36.37.6
Total pore volume of pores (cm3/g)0.0040.0530.0110.0380.0220.0430.025

